Automated Meter Reading System for Heat Costs Allocation
10
Automated Meter Reading System for Heat Costs Allocation IOAN LIE, VIRGIL TIPONUŢ, IVAN BOGDANOV, SABIN IONEL, CĂTĂLIN DANIEL CĂLEANU Applied Electronics Department, Faculty of Electronics and Telecomunications “Politehnica” University of Timisoara V. Parvan Av, no.2, 300223 Timisoara ROMANIA [email protected] http://www.etc.upt.ro Abstract: - The paper presents the design and the implementation of an automated meter reading system for heat costs allocation. The system was developed on three levels: the data acquisition level – where data are recorded from field with costs allocators installed on the radiators; a data concentration level – were data registered by allocators are read at a predetermined time interval with data concentration units and a data processing level – for uploading information in a PC hosted data base for various works afterwards. For each level was defined the hardware requirements and the software specifications including the communications modules, the meter and the user interfaces. A PWM data encoding was proposed as an alternative encoding for wireless communication through RF between data acquisition and concentration levels. The system uses RF for data transmission but also includes a pair of RFID modules facilitating remote programming and diagnostic procedures. In order to fulfill the low power requirements the dedicated modules costs allocator and data collection unit were implemented around MSP430 low power microcontrollers. Key-Words: - Costs allocator, Sensor network, Temperature measuring, Data concentrator, Radio communication, Automatic meter reading, RFID, Low power 1 Introduction Organizations which provide electric, gas, water and heating service to users are commonly referred to as “utilities”. Utilities determine charges and hence billings to their costumers by applying rates to quantities of the service that the customer uses during a predetermined time period, generally a month. This monthly usage is determined by reading the consumption meter located at the service point (usually located at the point where the utility service line enters the costumer’s house store or plant) at the beginning and ending of the usage month. The numerical difference between these meter readings reveals the kilowatts of electricity, cubic feet of natural gas or water used during the month. Utilities correctly perceive these meters as their “cash registers” and they spend a lot of time and money obtaining meter reading information. An accepted method for obtaining these monthly readings entails using a person (meter reader) in the field which who is equipped with a hand held computer, who visually reads the dial of the meter and enters the meter reading into the hand held. This method, which is often referred to as “electronic meter reading” or EMR, is still used extensively today. While EMR products today are reliable and cost efficient compared to other methods where the meter reader records the meter readings on paper forms, they still necessitate a significant force of meter readers walking from meter to meter in the field and physically reading the dial of each meter. The objective of reducing the meter reading field force or eliminating it all together has give rise to the development of “automated meter reading” or AMR products. The technologies currently employed by numerous companies to obtain meter information are: Radio frequency (RF), Telephone, Coaxial cable, Power line carrier (PLC). All AMR technologies employ a device attached to the meter, retrofitted inside the meter or built into/onto the meter. In the meter reading industry this device is commonly referred as Meter Interface Unit or MIU. Many of the MIU’s of these products are transceivers which receive a “wake up” polling signal or a request from their meter information from a transceiver mounted in a passing vehicle or carried by the meter reading, known as mobile data collection unit (MDCU). The MIU then responsively broadcasts the meter number, the meter reading and other information to the MDCU. After obtaining all the meter information required, the meter reader attaches the MDCU to a modem line or directly connects it to the utility’s computer system to convey the meter information to a central WSEAS TRANSACTIONS on CIRCUITS and SYSTEMS Ioan Lie, Virgil Tiponut, Ivan Bogdanov, Sabin Ionel, Catalin Daniel Caleanu ISSN: 1109-2734 177 Issue 2, Volume 8, February 2009
Transcript of Automated Meter Reading System for Heat Costs Allocation
Automated Meter Reading System for Heat Costs Allocation
IOAN LIE, VIRGIL TIPONUŢ, IVAN BOGDANOV, SABIN IONEL,
CĂTĂLIN DANIEL CĂLEANU
Applied Electronics Department, Faculty of Electronics and Telecomunications
“Politehnica” University of Timisoara
V. Parvan Av, no.2, 300223 Timisoara
ROMANIA
[email protected] http://www.etc.upt.ro
Abstract: - The paper presents the design and the implementation of an automated meter reading system for
heat costs allocation. The system was developed on three levels: the data acquisition level – where data are
recorded from field with costs allocators installed on the radiators; a data concentration level – were data
registered by allocators are read at a predetermined time interval with data concentration units and a data
processing level – for uploading information in a PC hosted data base for various works afterwards. For each
level was defined the hardware requirements and the software specifications including the communications
modules, the meter and the user interfaces. A PWM data encoding was proposed as an alternative encoding for
wireless communication through RF between data acquisition and concentration levels. The system uses RF
for data transmission but also includes a pair of RFID modules facilitating remote programming and diagnostic
procedures. In order to fulfill the low power requirements the dedicated modules costs allocator and data
collection unit were implemented around MSP430 low power microcontrollers.
Key-Words: - Costs allocator, Sensor network, Temperature measuring, Data concentrator, Radio
communication, Automatic meter reading, RFID, Low power
1 Introduction Organizations which provide electric, gas, water
and heating service to users are commonly referred
to as “utilities”. Utilities determine charges and
hence billings to their costumers by applying rates
to quantities of the service that the customer uses
during a predetermined time period, generally a
month. This monthly usage is determined by
reading the consumption meter located at the
service point (usually located at the point where the
utility service line enters the costumer’s house store
or plant) at the beginning and ending of the usage
month. The numerical difference between these
meter readings reveals the kilowatts of electricity,
cubic feet of natural gas or water used during the
month. Utilities correctly perceive these meters as
their “cash registers” and they spend a lot of time
and money obtaining meter reading information.
An accepted method for obtaining these monthly
readings entails using a person (meter reader) in the
field which who is equipped with a hand held
computer, who visually reads the dial of the meter
and enters the meter reading into the hand held. This
method, which is often referred to as “electronic
meter reading” or EMR, is still used extensively
today. While EMR products today are reliable and
cost efficient compared to other methods where the
meter reader records the meter readings on paper
forms, they still necessitate a significant force of
meter readers walking from meter to meter in the
field and physically reading the dial of each meter.
The objective of reducing the meter reading field
force or eliminating it all together has give rise to
the development of “automated meter reading” or
AMR products. The technologies currently
employed by numerous companies to obtain meter
information are: Radio frequency (RF), Telephone,
Coaxial cable, Power line carrier (PLC).
All AMR technologies employ a device attached
to the meter, retrofitted inside the meter or built
into/onto the meter. In the meter reading industry
this device is commonly referred as Meter Interface
Unit or MIU. Many of the MIU’s of these products
are transceivers which receive a “wake up” polling
signal or a request from their meter information
from a transceiver mounted in a passing vehicle or
carried by the meter reading, known as mobile data
collection unit (MDCU). The MIU then
responsively broadcasts the meter number, the
meter reading and other information to the MDCU.
After obtaining all the meter information required,
the meter reader attaches the MDCU to a modem
line or directly connects it to the utility’s computer
system to convey the meter information to a central
WSEAS TRANSACTIONS on CIRCUITS and SYSTEMSIoan Lie, Virgil Tiponut, Ivan Bogdanov, Sabin Ionel, Catalin Daniel Caleanu
ISSN: 1109-2734 177 Issue 2, Volume 8, February 2009

billing location. While these types of AMR systems
do not eliminate the field force of meter readers,
they do increase the efficiency of their data
collection effort and, consequentially, fewer meter
readers are required to collect the data.
Somme AMR systems which use RF eliminate the
field force entirely by using a network of RF
devices that function in a cellular or fixed point
fashion. That is, these fixed point systems uses
communication concentrators to collect, store and
forward data to utilities central processing facility.
While the communication link between MIU and
the concentrator is almost always RF, the
communication link between the concentrator and
the central processing facility can be telephone line,
licensed RF, cable fiber optic, public carrier RF.
There is desired an improved meter reading system
(including device and methodology) which
improves upon the available AMR products through
simplification and ease to use.
Nowadays, without doubt, heating systems are
in continuous changing, modernization. Heating and
water supply services have been constantly
improved by raising the efficiency of the thermal
stations and networks which has been reflected in
increasing the peoples comfort and decreasing the
costs. An important step in normalization of the
producer-distributor-consumer relation is the
countering of these utilities in their transfer
locations. An equitable distribution of the costs can’t
be assured and a real consumption invoice can’t be
obtained if the thermal energy is not properly
measured [1]. For measuring heating and hot waters
consumption thermal counting meters are used. The
thermal counting meters are designed to compute the
heat consumption in the consumption location and to
provide quantitative and qualitative information
about thermal agent parameters. The technical word
used for those devices is heat cost allocators. The
electronic heat costs allocator uses one sensor to
measures the radiator temperature and a second one
to measures the room’s temperature [2].
Beside those main functions, costs allocators
began to incorporate a MIU in order to implement
the functions related to the transmission of the
measured results and other useful information. By
adding radio transmitters can be implemented the
automatic download of measured data to a data
concentrator device located out of client’s private
space. Therefore, is not necessary the periodical
access of an operator into a private space. The data
collected by special Data Collection Units (DCU)
can be uploaded into a data base on a PC, therefore
being possible any processing of the recorded data
base.
2 System’s Requirements Data acquisition and management systems can
be successfully implemented for a large domain of
applications, being the first technological step to the
automatic control of a process. The purpose of this
paperwork is to design a system for heating costs
allocation and also to present a solution. The data
acquisition and management system was developed
on three levels:
- Data acquisition level – data are recorded with
modules spread on the field, respective costs
allocators installed on the radiators.
- Data concentration – data recorded by allocators
are periodically read with data concentrators.
- Data processing – data are stored in a PC’s data
base with a program which allows works afterwards.
Using the enumeration above, system’s architecture
looks like the figure 1: The communication between
the modules belonged to the three system’s levels
are bidirectional. By implementing this, it will be a
more efficient control over the modules’ function.
Therefore, the concentrator module needs to be
able to actualize the time reference of the costs
allocator module. In a similar way has to be
implemented an actualization of the time reference
between the PC and the data concentrator.
Figure 1 – The system’s architecture
Costs concentrator will receive once in 24 hours
the data recorded at the allocator’s level. Those data
can be read at any time by using a command emitted
from the data concentrator’s level. Data stored in the
data concentrator can be discharged in a data base in
PC
CABLE SERIAL
COMMUNICATION
RADIO SERIAL
COMMUNICATION
DATA
CONCENTRATOR
LCD display
KEYS
COST’S
ALLOCATOR
LCD
display
RADIATOR
TRANSPONDER
COMMUNICATION
CONCENTRATOR MODULE
COST’S
ALLOCATOR
LCD
display
RADIATOR
WSEAS TRANSACTIONS on CIRCUITS and SYSTEMSIoan Lie, Virgil Tiponut, Ivan Bogdanov, Sabin Ionel, Catalin Daniel Caleanu
ISSN: 1109-2734 178 Issue 2, Volume 8, February 2009

the PC by using a command within the program
which works at the PC’s level.
Data concentrator and the data discharging
program will be able to test the communications and
the functionality of the user interfaces by displaying
various values on the allocator’s and data
concentrator’s LCD.
To provide a highly efficiency of the system is
impose that the communication between acquisition
and data concentrator to be realized wireless.
Therefore, is excluded the periodical access of a
human operator in the private space. The individual
energetic consumption determination will be made
by measuring the environment and the radiator’s
instantaneous temperature with a pre-established
frequency and tacking into account the radiator’s
characteristics.
3 Hardware architecture The system is made from three subsystems which
communicate between them in three different ways.
The Costs allocator and the Data concentrator are
dedicated systems, made around two
microcontrollers from MSP430 family and the third
component of the system is a PC.
Costs allocator has the role to take the data from
the process, the air and radiator’s temperature, to
calculate based on those data the energy
consumption and to transmit the information to data
concentrator. Is made around MSP430F417
microcontroller and it has two temperature sensors, a
LCD display and dedicated interfaces for
communication through radio and RFID.
Data concentrator has the role to centralize the
data received from the allocators and to configurate
and synchronize the allocators in the field.
PC is for discharging the data stored in data
concentrator’s memory and adding them into a data
base. It has a XP operating system which is running
a program developed in Microsoft Visual Studio 6.0.
3.1. Allocator’s structure The costs allocator’s structure is presented in
figure 2. MSP430 incorporates a RISC central unit
(CPU) 16 bits, specialized peripherals, ROM and
RAM, all of them internally interconnected through
a data buss, using Von-Newman architecture.
The peripheral includes resources usual for any
microcontroller: digital input/output, serial and I2C
interfaces, timers/counters. There are variants that
have a LCD controller which allows driving until
160 LCD segments. On some variants are available
peripherals oriented on analogical interface like
ADC converters and a comparator integrated and
flexible with delay and counting system
By its flexibility, the clock system represents an
exclusive characteristic of this microcontroller and it
was specially designated for low consumption
applications. The timers, the comparator and the
LCD controller are among the components involved
in the realization of the allocator’s functions.
Figure 2 – The structure of an allocator
3.2 Measuring method description The MSP430 Comparator can be optimized to
precisely measure resistive elements using single
slope analog-to-digital conversion. For temperature
measurement, this can be converted into digital data
by comparing the discharge time of a capacitor
through a temperature sensor, Rmeas, to that through
a reference resistor, RREF, as shown in Fig. 3. This
procedure is successively performed for each one of
the temperature sensors, one for the radiator
temperature, RHOT and one for environment
temperature, RAIR. The reference resistor value
(RREF) is compared to the one of the sensor (RHOT,
RAIR) and so it is obtained the sensor resistor and
finally the temperature value from the sensor
transfer characteristic.
Figure 3 –Temperature measurement setup
The MSP430 resources used to calculate the
temperature sensed by Rmeas are:
- Digital I/O pins to charge and discharge the
capacitor, the comparator and a timer operating in
Display
Temperature
sensors
Communication
interface
Programming interface
JTAG
Central unit
(MSP430F417)
WSEAS TRANSACTIONS on CIRCUITS and SYSTEMSIoan Lie, Virgil Tiponut, Ivan Bogdanov, Sabin Ionel, Catalin Daniel Caleanu
ISSN: 1109-2734 179 Issue 2, Volume 8, February 2009
Capture Mode activated by the comparator’s edge.
Each I/O is set to output high to charge capacitor, is
reset to discharge and is switched to high-impedance
input when is not in use.
- The outputs charges and discharges the capacitor
via Rref, RHOT, RAIR.
- The comparator’s + terminal is connected to the
positive terminal of the capacitor and the – terminal
is connected to a reference level, 0.25 x VCC.
- The comparator output is used to gate Timer,
which capture the capacitor discharge time.
The sensor measurement is based on a ratio
metric conversion principle. The ratio of two
capacitor discharge times is calculated as in (1).
CC
refref
CC
refmeas
ref
meas
V
VlnCR
V
VlnCR
N
N
∗∗−
∗∗−
=
ref
measrefmeas
N
NRR ∗= (1)
The VCC voltage and the capacitor value should
remain constant during the conversion, but are not
critical since they cancel in the ratio. The
temperature sensors used, PT500, is linear and they
have a 1.996 Ω/ºC resolution. For this application
was used a 47 µF capacitor that assures a
discharging time of tens of milliseconds for the
sensors that varies round 500 Ω value. We intended
to obtain an optimal result between the
determination error of the discharging time and the
consumed time for the measurement.
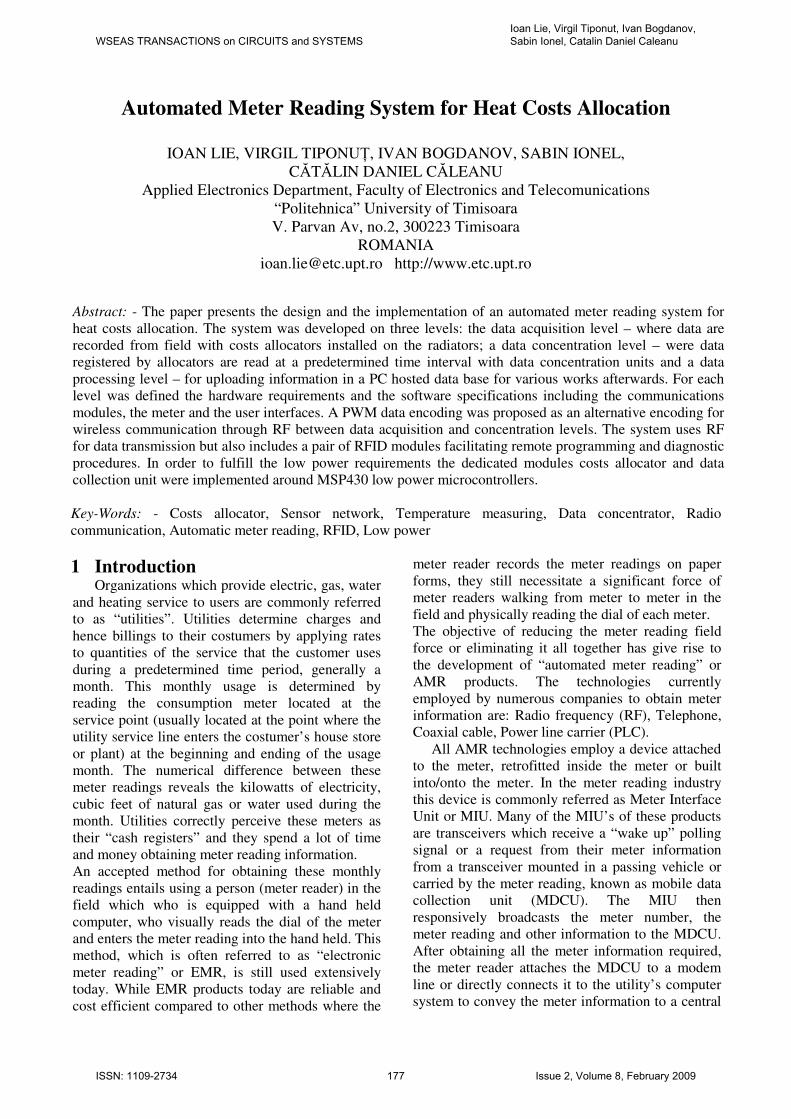
3.3. Data concentrator’s structure
The data concentrator unit was bulit around a
MSP430F449 microcontroller and also contains the
following blocks – see figure 4:
Figure 4 – The structure of data concentrator unit
- LCD display and four keys for user interface
- The EEPROM memory module for storing
downloaded data
- the communications modules including:
- RF receiver, realized with TH71111
FM/FSK/ASK integrated circuit, for collecting data
transmitted from allocators at predetermined time
interval;
- Rx/Tx RFID module for configuring and
checking the allocation units;
- serial RS232 interface for downloading
information into the PC hosted data base and
synchronizing the data concentrator with the central
processing unit
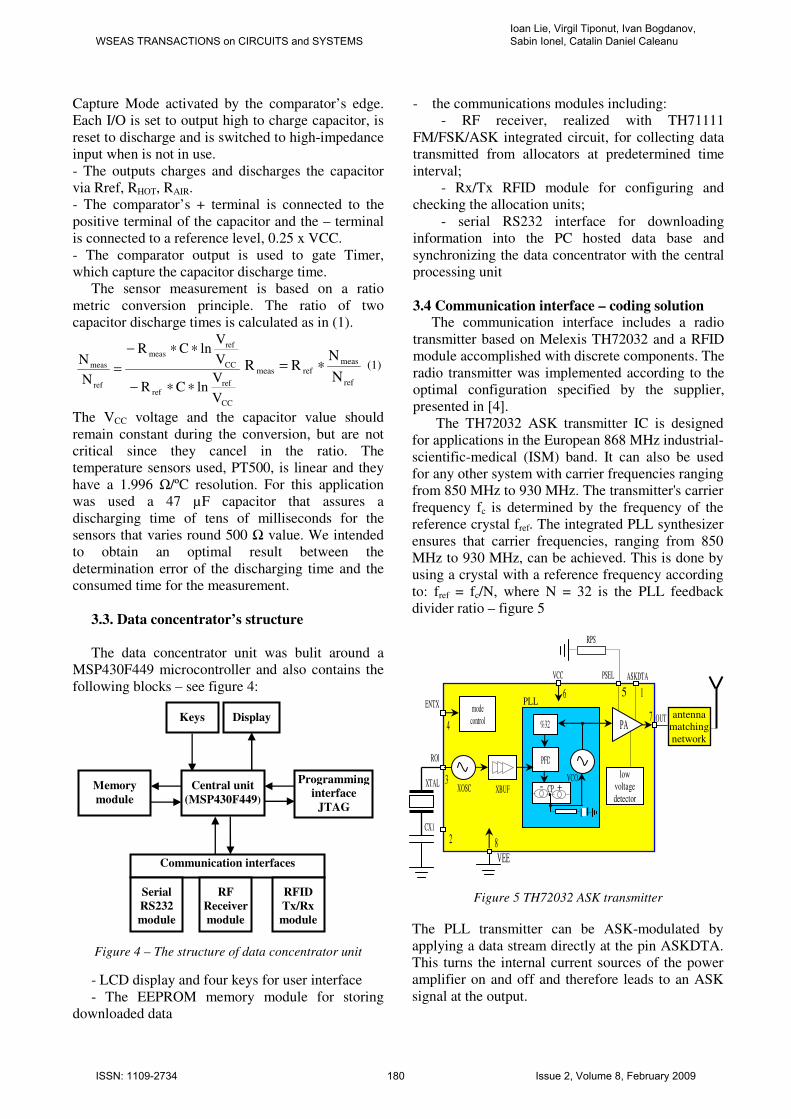
3.4 Communication interface – coding solution The communication interface includes a radio
transmitter based on Melexis TH72032 and a RFID
module accomplished with discrete components. The
radio transmitter was implemented according to the
optimal configuration specified by the supplier,
presented in [4].
The TH72032 ASK transmitter IC is designed
for applications in the European 868 MHz industrial-
scientific-medical (ISM) band. It can also be used
for any other system with carrier frequencies ranging
from 850 MHz to 930 MHz. The transmitter's carrier
frequency fc is determined by the frequency of the
reference crystal fref. The integrated PLL synthesizer
ensures that carrier frequencies, ranging from 850
MHz to 930 MHz, can be achieved. This is done by
using a crystal with a reference frequency according
to: fref = fc/N, where N = 32 is the PLL feedback
divider ratio – figure 5
Figure 5 TH72032 ASK transmitter
The PLL transmitter can be ASK-modulated by
applying a data stream directly at the pin ASKDTA.
This turns the internal current sources of the power
amplifier on and off and therefore leads to an ASK
signal at the output.
Keys
Memory
module
Programming
interface
JTAG
Communication interfaces
Central unit
(MSP430F449)
Display
Serial
RS232
module
RF
Receiver
module
RFID
Tx/Rx
module
antenna
matching
network
XTAL
CX1
3
mode
control 4
ENTX
ROI
8
XOSC XBUF
%32
PFD
- + CP VCO
PLL
VCC
6
PA OUT
low
voltage
detector
1
ASKDTA
5
PSEL
RPS
7
VEE
2
WSEAS TRANSACTIONS on CIRCUITS and SYSTEMSIoan Lie, Virgil Tiponut, Ivan Bogdanov, Sabin Ionel, Catalin Daniel Caleanu
ISSN: 1109-2734 180 Issue 2, Volume 8, February 2009

The RFID communication is based on two
modules that communicate on the master-slave
principle: the master module is installed on the data
concentrator and the slave module operates on the
costs allocator.
The sequence of information exchange is:
- The data concentrator transmits a command to the
costs allocator
- At the end of the command the carrier remains
active, un-modulated, expecting the allocator’s reply
- The answer of the allocator, reflected in a
transistor’s switching, is detected by the master’s
through a modification of the carrier voltage level
- The voltage evaluation is made differential and
finally the useful information is re-established.
The slave module is built using a minimal number of
discrete components for lower power consumption –
see figure 6.
Figure 6 – The RFID – slave module
The “PCB coil” component was made on the
printed circuit board. This coil with C3 and C4
capacitors represents a resonant circuit on the 13.56
MHz frequency having the role of an emission-
reception antenna. The radio-frequency signal
induced in the circuit is applied to the detector
circuit formed with D1 and Q1. Q1 transistor has the
role of a common base amplifier. C2 condenser with
D1 diode and Q1 transistor realize a detecting circuit
with voltage duplication.
The capacitor C1 is charged with a voltage
proportional to average value of the radio-frequency
signal. C1’s voltage is used to supply the circuit and
also as the reference voltage for the comparator. The
hysteresis comparator, formed by transistors Q2 and
Q3, has the role to reconstruct the modulation signal.
The transistor Q3 also realizes the level adaptation
for the microcontroller’s input. When no voltage is
induced in the antenna, the transistor Q3 is blocked
and the consumption from the allocator’s battery is
null.
When a message is transmitted from the allocator
to the concentrator module, the transistor Q4 is
turned on depending of the sent bits and determines
the periodical deterioration of the circuit’s quality
factor. This fact will be felt in the concentrator like
an amplitude modulation of a very low grade
(mV/tens of V).
The two types of communication that exist
between the allocator and the concentrator are based
on the same protocol. At binary level, when a
transmission is realized, the synchronization
problem of the communicating modules appears.
This problem can be solved by using an efficient
coding.
UART communication is not appropriate because
is performed an on/off amplitude modulation that
makes the low active bits not be represented of the
carrier signal. This represents the disadvantage that
at large sequences of low active bits, the receptor
stays too long without carrier. So, is necessary a
carrier codification also for low active bits.
The usable solution was a PWM signal that has a
positive front at the beginning of each bit and a 25%
space factor for the low active bits, a 75% space
factor for the high active bits, [3]. This codification
allows a bit level synchronization that makes this
communication protocol very robust. The receiving
bit’s effective value is read at 50% from that bit
period, fact that assures sufficient time for the signal
stabilization.
In figure 7 is presented the codification that is
used in radio communication and in transponder.
The transmitted signal (Tx) is represented by the
exemplification of the bit sequence “010”. te
represents the period that is allocated for a bit and th
is the tine duration for which the signal is on high
state. For the “0” bit, the duty cycle is 25% and for
the “1” bit, the duty cycle is 75%.
Figure 7 – PWM encoding
At the reception (Rx) the synchronization is made at
the each bit period beginning, the operation being
supported by the fact that every bit begins with an
increasing front. The moment of the synchronization
was represented by the Syn block. At the half of
te
th
Syn S
Tx
Rx
te
th
Syn Syn S S
WSEAS TRANSACTIONS on CIRCUITS and SYSTEMSIoan Lie, Virgil Tiponut, Ivan Bogdanov, Sabin Ionel, Catalin Daniel Caleanu
ISSN: 1109-2734 181 Issue 2, Volume 8, February 2009

each bit allocated period is figured in the S block the
moment in which is made the bit value registration.
Bit packet transmission always begins with a
preamble that is a synchronization key that brings
the receptor in the operation mode. For this
preamble was selected the 0xCCCCH value that
offers safety because this bit sequent can’t accidental
appear because of the noise.
4 Software application specifications The software application must accomplish the
following system’s functions:
1. The individual consumption determination for a
time unit through instantaneous temperature
measurement with a pre-established frequency.
2. The reading of the data collected by the cost’s
allocators without the physical access in a private
area by the implementation of a unidirectional radio
communication between cost’s allocator’s modules
and the concentrator.
3. The allocator’s configuration and synchronization
with the data concentrator through the bidirectional
implementation of a RFID communication.
4. Data concentrator’s synchronization with the
afferent PC through the serial line.
5. Information storage in the data base on the PC.
4.1. User interface At the cost’s allocator level the user interface is
minimal and is implemented by a LCD display. The
7 available segments are used for the alternative
display for the next information:
- Accumulated energy consumption
- Hour and date
- Radiator’s instantaneous temperature
- Air’s instantaneous temperature
- Possible functional errors
Displayed information on the available LCD display
from the data concentrator’s level are more
elaborated because of the presence of four buttons
that permit the options selection from the menu.
Navigation buttons are:
- OK – selected command confirmation;
- ESC – cancel;
- ↑ ↓ – scroll up/down;
The user interface at the PC level designated for
downloading the data from concentrator module to
the database program is shown in fig. 8
- The buttons Kopplen, Stop, Konfiguration refer to
the serial communication between the PC program
and the concentrator module. By pressing the
“Konfiguration” button a dialogue window appears
for the communication parameters initialization at
the start of the work session:
- “Test Handheld” offers the possibility of sending
various commands to the concentrator module for
testing a proper operation. By testing we assume to
command the concentrator’s display to show a
number which is taken from the user by a text box.
- The concentrator synchronization is done with a
“Set Time” command which opens a dialog window
- The “UpDate Time” button performs the
information initialization by reading the system date
and current hour and by displaying them. For
actually sending this information to the data
concentrator module it is necessary to press the
“Set” button to send a message which contains the
displayed hour and date.
Figure 8 – The user interface at the PC level
For taking the information from the concentrator
module EEPROM memory it is necessary to press
the “Lesen” button. Messages and data are displayed
in the two interface text windows. Further the
information can be saved in the data base. The data
base can be accessed during a work session without
previous discharging data from the concentrator
module, in which case the information correspond to
some previous module memory readings. For data
base visualization a window which contains all the
stored records and fields is displayed - fig.9.
The information can be viewed in a tabular
format with the option “View Table from Database”
which displays a data base table. The data base
entries can be removed by using the “Clear
Database” option.
The data base necessary for storing the taken
WSEAS TRANSACTIONS on CIRCUITS and SYSTEMSIoan Lie, Virgil Tiponut, Ivan Bogdanov, Sabin Ionel, Catalin Daniel Caleanu
ISSN: 1109-2734 182 Issue 2, Volume 8, February 2009

information from the concentrator module may
contain all the entries from all modules or, optional,
may have one table for each concentrator.
Figure 9 – The Database viewer
Regardless at the number of the necessary
tables the structure of one table it is shown in the
table 1. Table 1
Field name Type Description
NR AutoNumber Entry number
ID Text Module ID
Hour and date Text The hour and date of the
data storing
Current
consumption
Numeric Registered energy
consumption
Radiator
temperature
Numeric Measured element
instantaneous
temperature
Air
temperature
Numeric Air instantaneous
temperature
T_max_radiat
or
Numeric Radiator maximum
temperature registered
during the considered
time interval
Data_max_
radiator
Text The date when this maxim
was registered
T_max_air Numeric Air maximum temperature
registered during the
considered time interval
Data_max_air Text The date when this maxim
was registered
T_min_
radiator
Numeric Radiator minimum
temperature registered
during the considered
time interval
Data_min_ Text The date when this
radiator minimum was registered
T_min_aer Numeric Air minimum temperature
registered during the
considered time interval
Data_min_aer Text The date when this
minimum was registered
Date_error1 Text The date when this error
was registered
Date_error2 Text The date when this error
was registered
Other
information
Memo Field available for other
information
4.2. System intercommunication
Radio communication is unidirectional,
initiated by the allocator module depending on a
preset program temporization. The cost allocator
sends a message for a preset number of times to
avoid the eventual reception errors or data collision.
The concentrator module has to be during the data
transmission period in his “listening” state.
The allocator always transmits all data package
which begins whit a synchronization key. In his
“listening” state the concentrator is testing each
received bit until the received bit sequence matches
the synchronization key. After the synchronization
key data bytes are sent followed by check sum and
the package end character. After receiving all data
we are testing their validity by the check sum
evaluation.
In the current work module it is decided a 30 sec
period of a 24 hour interval, period in which the
concentrator enters in the “listening” state. The 30
sec are sufficient for the allocator to initiate 3 data
transmissions, so increasing the possibility that one
of the 3 messages is received by the data
concentrator.
Transponder communication is bidirectional and
is always initiated by the data concentrator. By this
type of communication the concentrator can send to
the allocator 3 different commands by selecting the
menu option:
- reading all the available data from the allocator;
- testing allocator LCD display (all segments on);
- synchronizing the allocator to the concentrator;
The allocator answer to those 3 commands is:
- a data package with a preset number of bytes;
- a confirmation package for display testing;
- a time updating confirmation message.
After sending one command the concentrator is
waiting (1.8 sec) for the reply. If an answer is not
received (or if the answer has errors) the
concentrator sends one more time that command. If
the answer is wrong after 3 consecutive commands
the concentrator displays an error message and the
process is stopped. To resume the communication it
is necessary to resend the command.
WSEAS TRANSACTIONS on CIRCUITS and SYSTEMSIoan Lie, Virgil Tiponut, Ivan Bogdanov, Sabin Ionel, Catalin Daniel Caleanu
ISSN: 1109-2734 183 Issue 2, Volume 8, February 2009

Serial communication is bidirectional, and takes
place between the PC and the concentrator and is the
only one which requires a direct cable connection
between the two modules. Before any other
operation it is necessary to start the communication
by port allocation and by setting the proper
parameters.
The communication is always initiated by the
PC level, from which 3 commands can be initiated:
- concentrator time updating;
- concentrator LCD display testing;
- data reading from the concentrator memory.
The data concentrator reply at those commands is
similar with the one in transponder communication.
4.3. Communication protocol
For all the sent messages in all 3 communication
types it will be used the same internal structure. The
messages will have o set length for a preset
command known by the both communication
partners. The length of a message modifies from one
command to another depending on the command
characteristics. In bidirectional communications the
reply messages include in the command field the
same command that they represent. A message
structure is shown below:
START COM DATA SUM STOP
1B 1B 4B/261B 1B/2B 1B
The table 2 presents the characteristics of the
message fields:
Table 2
Byte Field
name
Values
(hex/char)
Mnemonic Observations
#1 Start
character
A0 START Start Data
package.
#2 Command a,b,c COM Transmitted
command
#3
...
#n
Data 0..000
–
F..FFF
DATA Transmitted
data, in a
BCD format.
#n+1 Check
sum
0000 -
FFFF
SUM Checking the
validity.
#n+2 Stop
character
0A STOP Data
package end.
The command within the message depends of
communication context. The possible values of this
field are in the table 3 below:
Table 3
Comm Values
(char/hex)
Context Observations
LCD
test
‘a’ / 61h Conc -> Alloc
PC -> Conc
LCD display
functioning test.
Data
request
‘b’ / 62h Concentrator ->
Allocator
PC -> Conc
Requesting for
an available
data message.
Time
update
‘c’ / 63h Concentrator ->
Allocator
PC -> Conc
The receiver is
synchronized
with the source.
Data included in the message depends on the
command that makes the message object. Data field
particularization is made depending on the previous
commented command types.
LCD display testing – the request message,
represented in the next figure, has 8B and it is :
0xA0h ‘a’/ 61h 0x08h 0xFFh
0xFFh 0xFFh
SUM 0x0Ah
1B 1B 4B 1B 1B
The first data field byte has the 0x08h, value which
must be displayed by each LCD digit. The rest of the
bytes are high (0xFFh) so that whole message has an
8 bytes length. The protocol can be extended by
using the 3 high bytes. In this case the request
message has the same structure and represents the
confirmation that the request has been received.
Data request – has a structure similar with the LCD
display testing message :
0xA0h ‘a’/ 62h 0xFFh 0xFFh
0xFFh 0xFFh
SUM 0x0Ah
1B 1B 4B 1B 1B
The answer to this message represents the
current available data set of the message receiver
module level. It is mentioned that in a radio
unidirectional communication the message sent by
the allocator is identical with a data request answer.
0xA0h ‘a’/ 62h DATA SUM 0x0Ah
1B 1B 4B 1B 1B
Data field information are indicated in the table and
are in a packed BCD format for not mixing them
whit other message fields.
Time updating – current date and hour is sent in
the message data field :
0xA0
h
‘a’/
62h
year month day
hour minute
SUM 0x0A
h
1B 1B 5B 1B 1B
The request answer is a confirmation of the time
updating:
0xA0h ‘a’/ 63h 0xFFh 0xFFh
0xFFh 0xFFh
SUM 0x0Ah
1B 1B 4B 1B 1B
5 Experimental verifications In our experiments we used a MSP430F417
based allocators with a radio transmitter – Fig. 10,
and a concentrator module build around a
MSP430449 device – Fig. 11.
There were three experiments. The first
experiment was set out to check the communication
between Allocator and Data concentrator through
WSEAS TRANSACTIONS on CIRCUITS and SYSTEMSIoan Lie, Virgil Tiponut, Ivan Bogdanov, Sabin Ionel, Catalin Daniel Caleanu
ISSN: 1109-2734 184 Issue 2, Volume 8, February 2009

transponder and the user interface functionality. All
the imposed requirements were found working
proper.
Figure 10 –Allocator with radio transmitter and RFID
Figure 11 – Data concentrator module
In the second experiment we tried to find out the
effective range of the radio connection, using the
PWM encoding on our RF radio hardware. In the
first experiment we set the transmitter to use the
PWM encoding and to regularly send a data package
containing 6 bytes of effective data plus the extra
data required by our communication protocol. We
started out with the transmitter close to the receiver
and incremented the distance between the
transmitter and the receiver by one meter once a data
package was sent. On the receiver side we checked
to see if the receiver got the data with no errors.
Once the receiver started presenting systematic
errors we stopped moving the transmitter and
measured the distance between the two. Our
experiment was done inside the building and we
came up with a range of around 25 meters in this
configuration using the Melexis RF modules and the
PWM encoding.
A third experiment was set to verify the correct
operation of data download procedure and the
synchronization of the system’s modules through
RFID interface and serial line. All the imposed
requirements were found working proper. A sample
from the visualization table downloaded is shown in
figure 12. The data corresponding to each allocator
can be extracted for editing in a desired format
and/or for other processing operations.
Figure 12 – A sample from data base visualization table
WSEAS TRANSACTIONS on CIRCUITS and SYSTEMSIoan Lie, Virgil Tiponut, Ivan Bogdanov, Sabin Ionel, Catalin Daniel Caleanu
ISSN: 1109-2734 185 Issue 2, Volume 8, February 2009

6 Conclusion An acquisition and management data system,
designated for energy costs allocation was
designated and tested. For each level of the system
was defined the requirements and the
hardware/software implementation solutions.
The main aim was to verify the performances of the
in system communication solutions, the proper
operation of the user interfaces and the data
download procedure to the PC hosted data base.
A PWM data encoding was proposed as an
alternative encoding for wireless communication to
be used in low cost and low power sensors. The
main advantage of this encoding is the ability to
implement the transmitter and the receiver without
much hardware support and of being less sensitive
to timing errors. The system has a RFID module
facilitating remote programming and diagnostic
procedures. The system can be adapted for water
meters, gas meters and electric meters. In the case of
water and gas meters, an internal lithium battery
provides an operational life of up to ten years. In the
case of the electric meter, power is tapped directly
from the electric service.
References:
[1] Heat Cost Allocators for the Detection of the
Consumption of Radiators. Appliances with
Electrical Energy Supply, EN 834.
[2] I. Csoknyai, Methods of Heat Cost Allocation,
Periodica Polytechnica Ser. Mech. Eng. Vol. 44,
No. 2, 2000, pp. 227–236.
[3] nAN400-07, “nRFTM
Radio protocol
guidelines”, Nordic VLSI ASA application note,
December 2002.
[4] Melexis GmbH, TH72032 868/915MHz ASK
Transmitter, Datasheet rev. 08, June 2007,
www.melexis.com
[5] Melexis GmbH, TH71111 868/915MHz
FSK/FM/ASK Receiver, Datasheet rev. 013,
June 2007, www.melexis.com
[6] A. Mainwaring, J. Polastre, “Wireless Sensor
Networks for Habitat Monitoring”, ACM
International Workshop on Wireless Sensor
Networks and Applications - WSNA’02,
September 28, 2002, Atlanta, Georgia, USA.
[7] P. Oksa, M. Soini, J. Nummela, L. Sydänheimo,
M. Kivikoski, “Making AMR Systems More
Reliable”, WSEAS Transactions on
Communications, ISSN 1109-2742, Issue 2,
volume 5, February 2006, pp. 161-167.
[8] S. Srinivasan, A. Aggarwal, A. Kuma, “RFID
Security and Privacy Concerns”, WSEAS
Transactions on Communications, ISSN 1109-
2742, Issue 2, volume 5, February 2006, pp 296-
301.
[9] T. Tammet, J. Vain, A. Kuusik, “Using RFID
Tags for Robot Swarm Cooperation”, WSEAS
Transactions on Systems, ISSN 1109-2777, Issue
5, volume 5, May 2006, pp. 1121-1128.
[10] M.-S. Jina, K. Shiuh Y. and C.-L. Lee,
“Modular RFID Parking Management System
based on Existed Gate System Integration”,
WSEAS Transactions on Systems, ISSN 1109-
2777, Issue 6, volume 7, June 2008, pp. 706-716.
[11] W. Stallings, Data and Computer
Communications (7th ed.). Prentice Hall, pp.
137-138. ISBN 0-13-100681-9, 2004.
[12] S. K. An; S. I. Park; S. B. Jun; C. J. Lee; K. M.
Byun; J. H. Sung, “Design for a Simplified
Cochlear Implant System”, IEEE Transactions
on Biomedical Engineering, Volume 54, Issue 6,
June 2007 Page(s): 973 – 982.
[13] M. Varchola, M. Drutarovský, “Zigbee Based
Home Automation Wireless Sensor Network”
Acta Electrotechnica et Informatica, No. 4, Vol.
7, 2007, ISSN 1335-8243, Technical University
of Košice, Slovak Republic
[14] L. Youbok, Microchip Technology Inc."CRC
Algorithm for MCRF45X Read/Write Device"
http://ww1.microchip.com/downloads/en/AppNo
tes/00752a.pdf
[15] J. L. Hill, “System Architecture for Wireless
Sensor Networks” PhD Disertation, Univerisy
of California, Berkeley, 2003.
[16] K. Whitehouse, “The design of calamari: an ad-
hoc localization system for sensor networks.”
Masters Report, University of California at
Berkeley, 2003.
[17] A. Cerpa et al., “Habitat monitoring:
Application driver for wireless communications
technology”. ACM SIGCOMM Workshop on
Data Communications in Latin America and the
Caribbean, 2001.
[18] A. Woo, D. Culler, “Evaluation of Efficient
Link Reliability Estimators for Low-Power
Wireless Networks.”, Technical Report, UC
Berkeley, 2002.
[19] Y. Xu, , J. Heidemann, and D. Estrin,
“Geography-informed energy conservation for
Ad Hoc routing.” 2001, ACM Press:
SIGMOBILE: ACM Special Interest Group on
Mobility of Systems, Users, Data and
Computing. pp. 70 - 84.
[20] Texas Instruments, MSP 430 Family, User’s
Guide, slau056c, 2003
WSEAS TRANSACTIONS on CIRCUITS and SYSTEMSIoan Lie, Virgil Tiponut, Ivan Bogdanov, Sabin Ionel, Catalin Daniel Caleanu
ISSN: 1109-2734 186 Issue 2, Volume 8, February 2009