Automated Detection and Identification of N- and O ... · glycopeptide fractions are visible: Two...
20
Automated Detection and Identification of N- and O-glycopeptides Peter Hufnagel * , Anja Resemann, Wolfgang Jabs, Kristina Marx, and Ulrike Schweiger-Hufnagel Bruker Daltonik GmbH, Fahrenheitstraße 4, 28359 Bremen, Germany E-Mail: *[email protected] Received: 30 th September 2013 / Published: 22 nd December 2014 Abstract Because it can provide detailed information about aglycons, glyco- sylation sites, and the composition and structure of glycans, mass spectrometry is highly suited for the analysis of glycopeptides and released N- and O-glycans. Here we present the bioinformatics platform ProteinScape, which can process entire LC-MS/MS runs, localise spectra that contain glycan-related information, and perform searches against glycan structure databases. An intuitive user interface facilitates interactive validation of results. If glycans are not released and glycopeptides are analysed, the heterogeneity of glycosylation at the various protein glycosylation sites can be assessed. The integration of protein- and glycan-related functionality in a single software platform is particularly useful not only in glycoproteomics research, but also in biopharmaceutical development and QC. We provide several examples illustrating the efficiency of glycopeptide analysis using mass spectrometry. However, a comprehensive analysis requires information on the glycoprotein’s mass profile. Therefore, the interpretation of mass spectra from intact glycoproteins is also discussed. 85 This article is part of the Proceedings of the Beilstein Glyco-Bioinformatics Symposium 2013. www.proceedings.beilstein-symposia.org Discovering the Subtleties of Sugars June 10 th – 14 th , 2013, Potsdam, Germany
Transcript of Automated Detection and Identification of N- and O ... · glycopeptide fractions are visible: Two...

Automated Detection and Identification
of N- and O-glycopeptides
Peter Hufnagel*, Anja Resemann, Wolfgang Jabs,
Kristina Marx, and Ulrike Schweiger-Hufnagel
Bruker Daltonik GmbH, Fahrenheitstraße 4, 28359 Bremen, Germany
E-Mail: *[email protected]
Received: 30th September 2013 / Published: 22nd December 2014
Abstract
Because it can provide detailed information about aglycons, glyco-
sylation sites, and the composition and structure of glycans, mass
spectrometry is highly suited for the analysis of glycopeptides and
released N- and O-glycans. Here we present the bioinformatics
platform ProteinScape, which can process entire LC-MS/MS runs,
localise spectra that contain glycan-related information, and perform
searches against glycan structure databases. An intuitive user interface
facilitates interactive validation of results. If glycans are not released
and glycopeptides are analysed, the heterogeneity of glycosylation at
the various protein glycosylation sites can be assessed.
The integration of protein- and glycan-related functionality in a single
software platform is particularly useful not only in glycoproteomics
research, but also in biopharmaceutical development and QC. We
provide several examples illustrating the efficiency of glycopeptide
analysis using mass spectrometry. However, a comprehensive analysis
requires information on the glycoprotein’s mass profile. Therefore, the
interpretation of mass spectra from intact glycoproteins is also
discussed.
85
This article is part of the Proceedings of the Beilstein Glyco-Bioinformatics Symposium 2013.www.proceedings.beilstein-symposia.org
Discovering the Subtleties of Sugars
June 10th – 14th, 2013, Potsdam, Germany

Introduction
Glycosylation is one of the most common and important post-translational protein
modifications. Glycoproteins have diverse functions and are involved in numerous
biological processes. Their glycan moieties are either directly involved in regulatory
processes or influence physicochemical properties of the glycoprotein. In eukaryotes, the
vast majority of secreted and plasma membrane proteins are known to be glycosylated and
glycosylation has been shown to be important for various protein functions [1]. The
significance of glycoproteins is further demonstrated by the fact that more than 90% of
proteins produced for therapeutic purposes – such as antibodies or hormones – are glyco-
proteins. In such biologics, glycosylation has been demonstrated to control parameters such
as serum half-life or receptor interaction kinetics (e. g., [2]).
As a consequence, protein analysis projects – from large-scale proteomics down to focused
protein characterisation studies – often require a detailed study of glycosylation. This is
particularly true for the characterisation and quality control of recombinant biopharma-
ceutical proteins. However, due to a lack of dedicated and easy-to-use software, glyco-
sylation is often neglected in the proteomics community. To address this issue, we have
extended the scope of our bioinformatics software to the analysis of glycosylation.
ProteinScape is Bruker Daltonics’ central bioinformatics platform for storage and processing
of MS data. It supports various gel- and LC-based workflows. The underlying database
organises all relevant data for all types of proteomics projects – including LC-data, gel data,
mass spectra, process parameters and search results. ProteinScape acts as a central control
unit and data evaluation tool for mass spectrometry-based identification, characterisation,
and quantitation. The data hierarchy of the software is an accurate reflection of laboratory
workflows – with projects, samples, separations, fractions; MS data and search results
forming the main hierarchy levels. Information is accessible in tables and viewers and
through extensive query functionalities. Dedicated viewers enable fast and interactive
evaluation and validation of data and results (Figure 1). Real-time updating of the linked
displays speeds up browsing and information management. As ProteinScape is able to
handle data from different mass spectrometers, it is the ideal tool to study protein glyco-
sylation.
86
Hufnagel, P. et al.
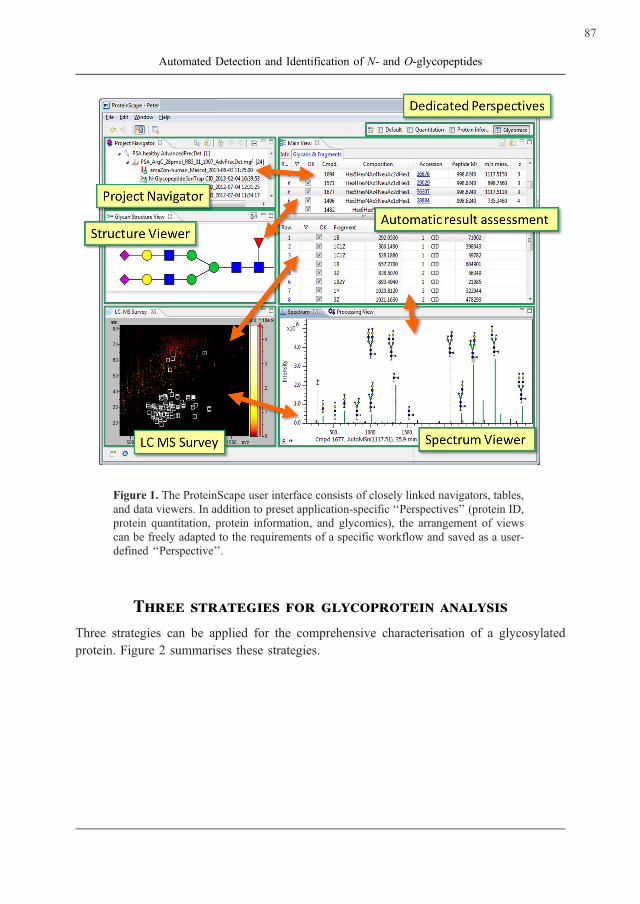
Figure 1. The ProteinScape user interface consists of closely linked navigators, tables,
and data viewers. In addition to preset application-specific ‘‘Perspectives’’ (protein ID,
protein quantitation, protein information, and glycomics), the arrangement of views
can be freely adapted to the requirements of a specific workflow and saved as a user-
defined ‘‘Perspective’’.
Three strategies for glycoprotein analysis
Three strategies can be applied for the comprehensive characterisation of a glycosylated
protein. Figure 2 summarises these strategies.
87
Automated Detection and Identification of N- and O-glycopeptides

Figure 2. Glycoproteins can be analysed either as intact molecules, or after proteolytic
digestion. Glycans can be analysed either as part of the respective glycopeptide, or as
enzymatically- or chemically-released glycans that can be labelled using a fluorophore
for optical detection in LC separations.
Strategy 1 is the separation of glycans from the protein or peptides. This common workflow
generates a peptide fraction – that can be used for protein identification and the evaluation of
other modifications – and a glycan fraction – that can be used for the identification of all
glycans originally attached to the protein.
Compared to a proteolytic digest of a glycoprotein, the glycan fraction has a lower
complexity and can be further separated and analysed by glycan-specific methods. The
glycans can either be submitted to mass spectrometry without further modification, or a
label (e. g., a fluorophore for visual detection) can be introduced to the reducing end of the
glycans, which are then analysed by LC and/or mass spectrometry.
Strategy 2 is the proteolytic digestion of intact glycoproteins. If glycans are released, the
information about the initial attachment of the respective glycans to the glycosylation sites of
the individual proteins is lost. Proteolytic digestion of glycoproteins yields glycopeptides
that can provide important information about the actual state of the various glycosylation
sites.
Strategy 3 is the analysis of intact glycoproteins. Here, the heterogeneity of glycosylation is
retained with the highest fidelity.
88
Hufnagel, P. et al.

Strategy 1: Analysis of released glycans
ProteinScape’s integrated processing pipeline contains several powerful algorithms: The
GlycoQuest search engine is particularly useful for automated glycan analysis. Glycans
released from the protein by a peptide-N-glycosidase (N-glycans) or by reductive
beta-elimination (O-glycans) are automatically detected, identified, and reported.
As with protein database searches, glycan search parameters are defined and stored in a
search method (Figure 3). Data are then searched against a user-defined glycan database or
the meta-database GlycomeDB (http://www.glycome-db.org), which was developed at the
German Cancer Research Center in Heidelberg and currently contains around 39,000 glycan
structures. GlycomeDB is regularly updated with structures from various primary databases
and automatically synchronised with GlycoQuest. Searches can be restricted to a primary
database. A glycan structure editor enables manual editing of glycan structures that can be
saved to a user-defined database for GlycoQuest searches. Figures 4 and 5 show two
exemplary search results.
Figure 3. The GlycoQuest method editor. Parameters include one of GlycomeDB’s
primary databases (e. g. CarbBank), the glycan type (e.g. N-glycan), allowed compo-
sitions, and mass tolerances. Searches can be started for an individual spectrum, for an
LC-MS/MS run, or for batches of spectra or LC-MS/MS runs.
89
Automated Detection and Identification of N- and O-glycopeptides

Figure 4. GlycoQuest result: a MALDI spectrum of a 2-aminobenzoic acid
(AA)-labelled N-glycan, acquired on an ultrafleXtreme MALDI-TOF instrument.
Figure 5. GlycoQuest result: an ESI spectrum of a reduced O-glycan, acquired on a
maXis impact ESI-TOF instrument.
It should be noted here that a complete confirmation of a glycan’s structure – which is highly
dependent on the availability of all diagnostic fragment signals in the MS/MS spectrum – is
a difficult task. GlycoQuest is an algorithm that compares spectra with theoretical fragment
patterns. Some isomeric structures cannot be distinguished using this method. The situation
becomes even more complicated if different glycans are not separated, and isobaric
structures yield a mixture of fragments in the MS/MS spectrum. A satisfactory analysis of
isomeric structures can be achieved by a variety of dedicated methods, such as
permethylation of the sample, followed by the acquisition of MSn spectra in an ion trap [3].
90
Hufnagel, P. et al.

An alternative approach is the separation of reduced glycans by porous graphitised carbon
chromatography. This technique is able to separate glycans that differ in structure but have
the same composition and, therefore, the same mass. This allows differentiation of glycans
with subtle linkage differences. For example, neuraminic acid [a2,3 or a2,6], galactose[b1,4 or a1,3] and the two G1 isomers that are frequently found on IgG N-glycans can be
separated. In many cases the MS/MS spectra from such structures, although yielding
identical theoretical fragments, have fundamental differences [4 – 7].
Strategy 2: Glycopeptide analysis
Glycopeptide analysis is a challenging task [8]. Due to high glycan heterogeneity and ion
suppression effects, abundance of glycopeptide signals from proteolytic digests is usually
low, and specific enrichment and separation techniques might be required. In addition,
interpretation of MS/MS spectra is difficult as classical database search approaches cannot
be used if the peptide’s and the glycan’s molecular weights are unknown. The correct
determination of the peptide mass is a crucial feature for automated glycopeptide
identification.
The glycopeptide classifier
The task of finding glycopeptide spectra in an LC-MS/MS dataset of a digested glycoprotein
sample is demanding. ProteinScape searches for characteristic patterns in the MS/MS spectra
and submits only relevant spectra to the database. Because both Mascot (Matrix Science)
and GlycoQuest perform precursor-based searches, the exact masses of the glycan and
peptide moieties of each glycopeptide must be known beforehand. The glycopeptide
classifier algorithm of ProteinScape uses characteristic mass patterns (MALDI) or fragment
ion series (ESI CID) to determine the glycan and peptide moiety masses. In this way, the
glycopeptide classifier is mandatory for a successful identification of glycopeptides.
Examples for N-glycopeptides are given in Figures 6 and 7. However, the glycopeptide
classifier is not limited to N-glycopeptides. For example, core-fucosylated N-glycopeptides
and also several kinds of O-glycopeptides in MALDI and ESI spectra can also be handled.
91
Automated Detection and Identification of N- and O-glycopeptides

Figure 6. Deconvoluted ESI-CID spectra of N-glycopeptides usually contain
diagnostic mass signals in the low molecular weight range, plus a characteristic tree
of fragment ions that can be followed down to the mass of the peptide plus one
N-acetylglucosamine.
Figure 7. MALDI-TOF/TOF spectra of N-glycosylated peptides contain a specific
fragment pattern. A cleavage between the glycan and peptide part produces the MH+
of the peptide. The N-acetylglucosamine attached to the asparagine undergoes Y and0,2X cross-ring fragmentation providing strong fragment ions that are 83 and 203 Da
heavier. A loss of ammonia from the asparagine completes the pattern ([8]).
92
Hufnagel, P. et al.
Example: EPO
An example of the characterisation of a glycoprotein by the identification of glycopeptides is
our study [9] on Erythropoietin (EPO). EPO is a glycoprotein with hormone activity that
controls the production of red blood cells in bone marrow. Recombinant human EPO is
produced on a large scale in cell culture as a therapeutic agent for treating anaemia related to
different diseases. It is also abused as a blood doping agent in endurance sports. Human
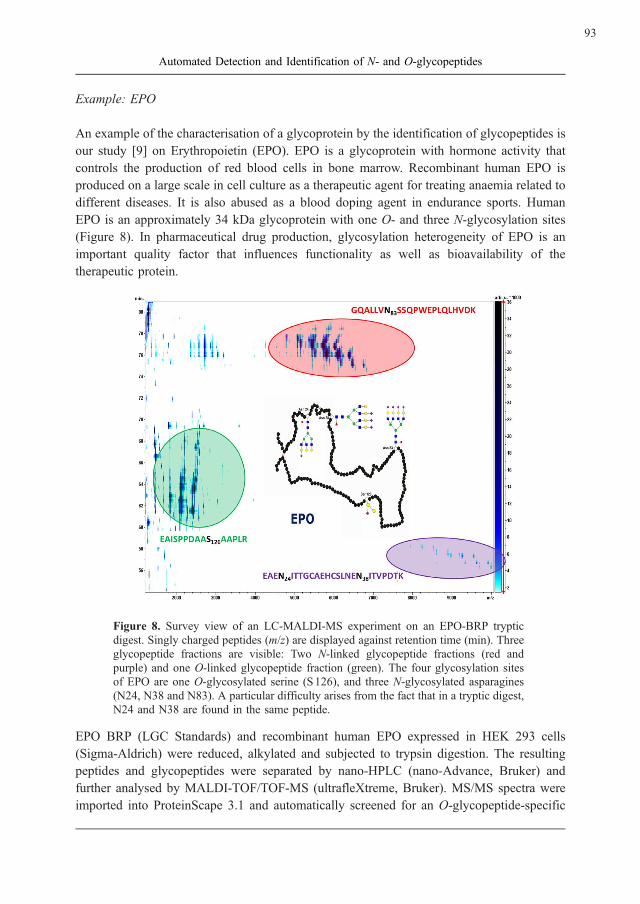
EPO is an approximately 34 kDa glycoprotein with one O- and three N-glycosylation sites
(Figure 8). In pharmaceutical drug production, glycosylation heterogeneity of EPO is an
important quality factor that influences functionality as well as bioavailability of the
therapeutic protein.
Figure 8. Survey view of an LC-MALDI-MS experiment on an EPO-BRP tryptic
digest. Singly charged peptides (m/z) are displayed against retention time (min). Three
glycopeptide fractions are visible: Two N-linked glycopeptide fractions (red and
purple) and one O-linked glycopeptide fraction (green). The four glycosylation sites
of EPO are one O-glycosylated serine (S126), and three N-glycosylated asparagines
(N24, N38 and N83). A particular difficulty arises from the fact that in a tryptic digest,
N24 and N38 are found in the same peptide.
EPO BRP (LGC Standards) and recombinant human EPO expressed in HEK 293 cells
(Sigma-Aldrich) were reduced, alkylated and subjected to trypsin digestion. The resulting
peptides and glycopeptides were separated by nano-HPLC (nano-Advance, Bruker) and
further analysed by MALDI-TOF/TOF-MS (ultrafleXtreme, Bruker). MS/MS spectra were
imported into ProteinScape 3.1 and automatically screened for an O-glycopeptide-specific
93
Automated Detection and Identification of N- and O-glycopeptides
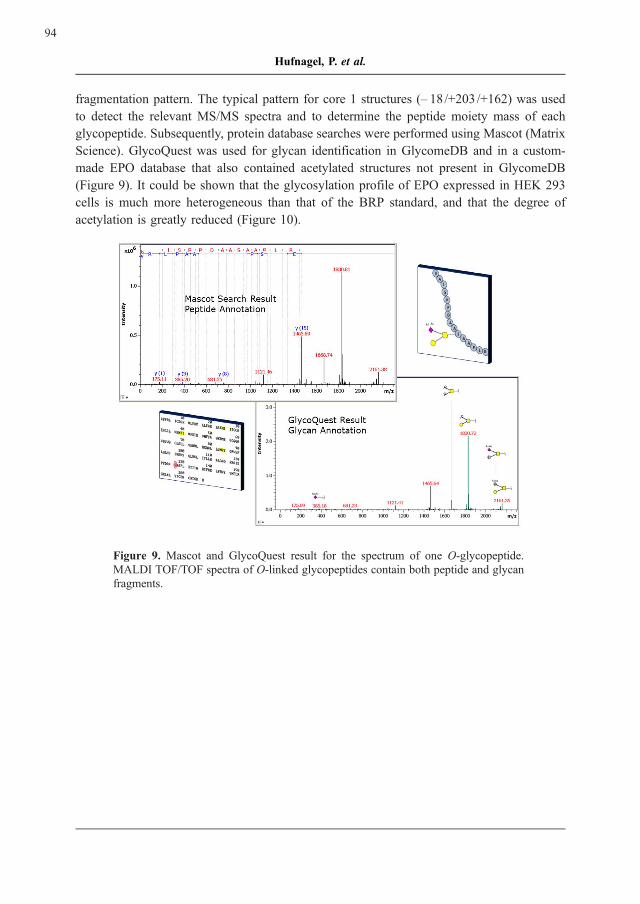
fragmentation pattern. The typical pattern for core 1 structures (– 18/+203/+162) was used
to detect the relevant MS/MS spectra and to determine the peptide moiety mass of each
glycopeptide. Subsequently, protein database searches were performed using Mascot (Matrix
Science). GlycoQuest was used for glycan identification in GlycomeDB and in a custom-
made EPO database that also contained acetylated structures not present in GlycomeDB
(Figure 9). It could be shown that the glycosylation profile of EPO expressed in HEK 293
cells is much more heterogeneous than that of the BRP standard, and that the degree of
acetylation is greatly reduced (Figure 10).
Figure 9. Mascot and GlycoQuest result for the spectrum of one O-glycopeptide.
MALDI TOF/TOF spectra of O-linked glycopeptides contain both peptide and glycan
fragments.
94
Hufnagel, P. et al.

Figure 10. The Survey Viewer zoomed into the O-linked glycopeptide range of EPO
BRP-Standard (A) and EPO HEK 293 cells (B) enables an at-a-glance comparison.
Main differences were found in terms of glycan forms and acetylation grade.
Strategy 3: Glycoprotein analysis
Example 1: Cetuximab, a recombinant antibody
Because they play a central role in the immune response of vertebrates, antibodies represent
one of the most important classes of glycoproteins. There is a growing interest in
recombinant antibodies as biotherapeutic agents. Such so-called biologics are manufactured
in biological systems, and usually employ recombinant technology. These systems can be
very sensitive to minor changes in the manufacturing process, which may significantly alter
the final biologic product. They can introduce modifications that may adversely affect the
safety and efficacy of the drug. Therefore, strict quality control of each biopharmaceutical
batch and comparison with reference standards is essential to ensure reproducibility between
batches and to achieve regulatory approval.
95
Automated Detection and Identification of N- and O-glycopeptides

Cetuximab is a chimeric mouse-human IgG1 that targets the epidermal growth factor
receptor (EGFR). It is approved for use in the EU and US as a treatment for colorectal
cancer and squamous cell carcinoma of the head and neck. The amino acid sequences for
both the light and heavy chains of cetuximab (Figure 11) are reported in the IMGT database
(http://www.imgt.org) and the drug bank (www.drugbank.ca). A high prevalence of hyper-
sensitivity reactions to cetuximab were reported in some areas of the US. Different
glycoforms were shown to be responsible for these hypersensitivity reactions and
anaphylaxis. This example demonstrates the importance of a precise analysis of glyco-
sylation in biopharmaceutical proteins.
Figure 11. Schematic structure and sequence of cetuximab. Colours indicate protein
QC ‘‘hot spots’’. Of particular importance are the two heavy-chain glycosylation sites,
which can be separated from each other by proteolytic cleavage in the hinge region.
In the study of Ayoub et al. [10], detailed sequence information of the antibody’s subunits
was obtained using MALDI N- and C-terminal top-down sequencing (TDS) analysis.
LC-MS/MS peptide mapping experiments on tryptic and GluC digests enabled post-
translational modifications and sequence variants to be further localised.
For intact-mass analysis, the two heavy-chain N-glycosylation sites were separated by
enzymatic cleavage (Figure 12). The LC-ESI mass spectra of the cetuximab subunits
(middle-up approach) yielded glycosylation site-specific accurate masses of the various
antibody glycoforms. Using GlycoQuest, glycopeptide and glycan identifications and
96
Hufnagel, P. et al.
profiles were automatically generated. Finally, the results from middle-up data were
combined with the results from the bottom-up glycopeptide identification to generate a
complete picture of the antibody’s glycosylation (Figures 13 – 15).
Figure 12. Middle-up approach: a dedicated proteolytic enzyme (FabRICATOR,
Genovis) cleaves the heavy chain at the conserved Gly–Gly motif in the hinge region,
thereby separating the two glycosylation sites [11], (Figure adapted from
www.genovis.com).
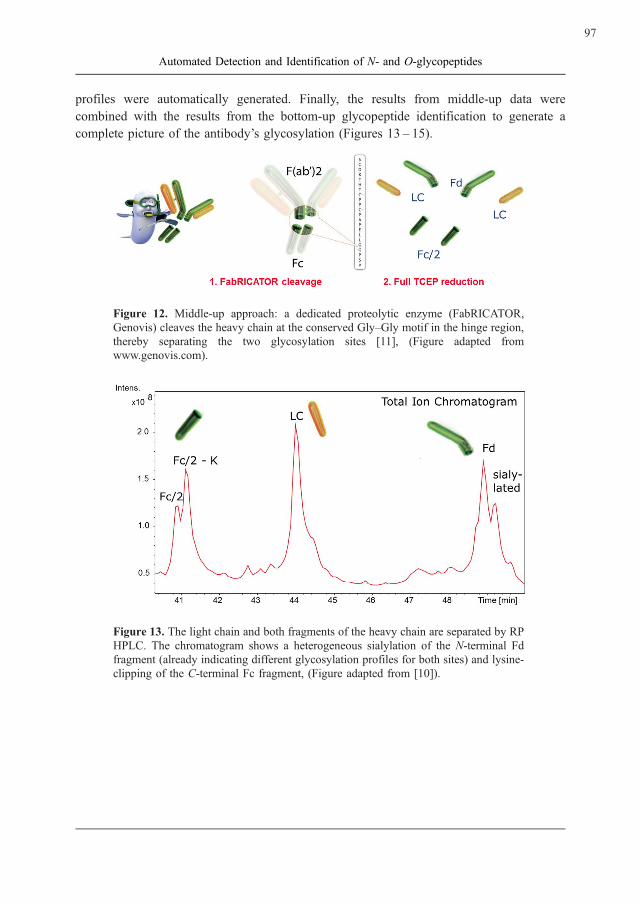
Figure 13. The light chain and both fragments of the heavy chain are separated by RP
HPLC. The chromatogram shows a heterogeneous sialylation of the N-terminal Fd
fragment (already indicating different glycosylation profiles for both sites) and lysine-
clipping of the C-terminal Fc fragment, (Figure adapted from [10]).
97
Automated Detection and Identification of N- and O-glycopeptides

Figure 14. Glycosylation profile of the Fd fragment: Mass spectrum acquired during
LC separation of the FabRICATOR fragments. Based on the ‘‘middle-up’’ data,
GlycoQuest could assign the glycan compositions. Information about the glycan
structures could be obtained in a separate analysis on the glycopeptide level
(‘‘bottom-up’’), (Figure adapted from [10]).
Figure 15. The different glycan profiles of Fc and Fd as determined by a two-way
approach: Identification on the glycopeptide level (‘‘bottom-up’’) plus quantitation on
the FabRICATOR fragments (‘‘middle-up’’), (Figure adapted from [10]).
As pointed out in [11], the routine analysis of intact proteins or FabRICATOR-cleaved
antibody subunits is a particularly useful technique for biopharmaceutical QC. Bruker’s
BioPharmaCompass software is designed for this task: After automated LC and data
acquisition, detailed reports are automatically generated that show annotated total ion
chromatograms and the annotated spectra of all key compounds. A simple traffic-light
overview indicates which samples have passed the QC analysis, and which samples require
re-investigation (Figure 16).
98
Hufnagel, P. et al.

Figure 16. Automated report of BioPharmaCompass containing essential QC
information such as TIC, deconvoluted protein mass and qualitative and quantitative
comparison with a reference standard. Incorrect products and impurities are indicated
using traffic-light colors for at-a-glance QC.
Example 2: PSA
The following results were generated during the 2013 gPRG study of the Glycoprotein
Research Group (gPRG) of the Association of Biomolecular Resource Facilities (ABRF).
The main objective of the study was the quantitation of the glycosylation heterogeneity
present in two different preparations of human prostate-specific antigen (PSA), which is a
biological biomarker for prostate cancer. A poster presented at the 2013 meeting of the
ASMS focused on the identification of a new N-glycosylation site in the PSA study sample
[12]. In brief, the glycosylation profiles of two PSA samples were analysed in a two-way
approach: analysis of a tryptic digest by RP HPLC coupled to an amaZon Speed ion trap
(Bruker) with CID and ETD capability (‘‘bottom-up’’), and analysis of the intact
glycoprotein by RP HPLC coupled to a maXis 4G ESI-UHR-TOF (Bruker).
Because ion trap CID spectra of N-glycopeptides mainly contain peaks from glycan
fragments (B- and Y-type ions) and peptide fragment peaks are rarely seen, little information
about the peptide backbone is obtained. Therefore, both CID and ETD spectra were
acquired. In contrast to CID, ETD cleaves the N-Ca bond of the peptide backbone, resulting
in c- and z-ion series. Post-translational modifications – for example glycans – remain
attached to the respective amino acid residues. An example is shown in Figure 17. More
information on ETD of glycopeptides can be found in 13]. As a result, 50 glycan
compositions could be assigned to the glycan profile with quantitative information. From
44 glycans, the structure could be deduced from ‘‘bottom-up’’ CID spectra (Figure 18).
99
Automated Detection and Identification of N- and O-glycopeptides

Figure 17. CID and ETD spectrum of a single glycopeptide derived from PSA. The
composition of the glycan moiety can be identified by submission of the CID
spectrum to GlycoQuest. The peptide moiety can be identified by submission of the
ETD spectrum to Mascot once the glycan composition is determined.
Figure 18. Intact mass spectra of the two PSA samples, annotated with the glycan
structures identified from the ‘‘bottom-up’’ approach.
100
Hufnagel, P. et al.

MS of intact glycoproteins is highly suited to the quantitative assessment of glycoprofiles.
Because the glycans carry a huge protein residue, suppression effects familiar from complex
glycan or glycopeptide spectra, are eliminated [14]. In addition, this approach avoids
artefacts that can arise from differences in charge-state distributions or incomplete or
unspecific proteolytic digestion. However, only glycoproteins with a single glycosylation
site can be quantified without further fragmentation of the protein.
Conclusion
The characterisation of glycoproteins is a complex task. In addition to the complete
assignment of the amino-acid sequence and the analysis of other post-translational
modifications (e. g., phosphorylation) and laboratory artefacts (e. g., oxidation), the
investigation of glycosylation and its protein-specific heterogeneity adds further analytical
challenges. Because many proteins contain several potential glycosylation sites, and due to a
high degree of glycan heterogeneity at a given amino acid, glycosylation patterns are often
very complex. Three strategies for the analysis of glycoproteins have been described here:
1. Analysis of released glycans: Reduced complexity, lower mass range, but only very
limited information about the glycosylation site(s). Porous graphitised carbon
chromatography can separate isobaric glycans.
2. Analysis of glycopeptides in a proteolytic digest: The link to the glycosylation site is
retained. However, glycoprotein digests are complex mixtures, and in many cases a
specific glycopeptide enrichment step is necessary.
3. Analysis of the intact glycoprotein: Yields the exact quantitative glycosylation profile.
Not suitable for proteins with several glycosylation sites.
In many cases a complete overview of the protein’s actual state of glycosylation can be
produced only by the combination of two or even all three strategies. We have introduced
dedicated bioinformatics software that supports each single strategy and significantly
facilitates a combined approach.
101
Automated Detection and Identification of N- and O-glycopeptides

References
[1] Kolarich, D., Lepenies, B., Seeberger, P.H. (2012) Glycomics, glycoproteomics and
the immune system. Current Opinion in Chemical Biology 16:214 – 220.
doi: http://dx.doi.org/10.1016/j.cbpa.2011.12.006
[2] Sinclair, A.M., Elliott, S. (2005) Glycoengineering: the effect of glycosylation on the
properties of therapeutic proteins. Journal of Pharmaceutical Sciences 94:
1626 – 1635.
doi: http://dx.doi.org/10.1002/jps.20319
[3] Hailong Zhang, David J. Ashline and Vernon N. Reinhold (2014) Tools to MSn
Sequence and Document the Structures of Glycan Epitopes. In: Proceedings of the
3rd Beilstein Glyco-Bioinformatics Symposium 2013 (Eds. Hicks, M.G. and
Kettner, C.). Logos-Verlag Berlin, pp 117 – 131.
[4] Everest-Dass, A.V., Abrahams, J.L., Kolarich, D., Packer, N.H., Campbell, M.P.
(2013) Structural feature ions for distinguishing N- and O-linked glycan isomers by
LC-ESI-IT MS/MS. Journal of The American Society for Mass Spectrometry
24:895 – 906.
doi: http://dx.doi.org/10.1007/s13361-013-0610-4
[5] Jensen, P.H., Karlsson, N.G., Kolarich, D., Packer, N.H. (2012) Structural analysis of
N- and O-glycans released from glycoproteins. Natural Protocols 7:1299 – 1310.
doi: http://dx.doi.org/10.1038/nprot.2012.063
[6] Stadlmann, J., Pabst, M., Kolarich, D., Kunert, R., Altmann, F. (2008) Analysis of
immunoglobulin glycosylation by LC-ESI-MS of glycopeptides and
oligosaccharides. Proteomics 8:2858 – 2871.
doi: http://dx.doi.org/10.1002/pmic.200700968
[7] Kolarich, D. (2014) In: Proceedings of the 3rd Beilstein Glyco-Bioinformatics
Symposium 2013 (Eds. Hicks, M.G. and Kettner, C.). Logos-Verlag Berlin.
[8] Wuhrer, M., Catalina, M.I., Deelder, A.M., Hokke, C.H. (2007) Glycoproteomics
based on tandem mass spectrometry of glycopeptides. Journal of Chromatography B
849:115 – 128.
doi: http://dx.doi.org/10.1016/j.jchromb.2006.09.041
[9] Resemann, A., Tao, N., Schweiger-Hufnagel, U., Marx, K., Kaspar, S. (2013)
Comprehensive Study of O-Linked Glycans of Erythropoietin. ASMS 2013. ThP19
356, available at http://www.bruker.com/products/mass-spectrometry-and-separa-
tions/literature/literature-room-mass-spec.html (section search: ‘‘Erythropoietin’’).
102
Hufnagel, P. et al.

[10] Ayoub, D., Jabs, W., Resemann, A., Evers, W., Evans, C., Main, L., Baessmann, C.,
Wagner-Rousset, E., Suckau, D., Beck, A. (2013) Correct primary structure
assessment and extensive glyco-profiling of cetuximab by a combination of intact,
middle-up, middle-down and bottom-up ESI and MALDI mass spectrometry
techniques. mAbs 5:699 – 710.
doi: http://dx.doi.org/10.4161/mabs.25423
[11] Olsson, F., Andersson, L., Willetts, M., Jabs, W., Resemann, A., Evers, W.,
Baessmann, C., Suckau, D. (2013) Optimizing the Enzymatic Subunit Generation
with IdeS for High Throughput Structure Verification of Therapeutic Antibodies by
Middle-Down Mass Spectrometry. ASMS, WP24 – 434, available at http://www.
bruker.com/products/mass-spectrometry-and-separations/literature/literature-room-
mass-spec.html (section search: ‘‘wp24 – 434’’).
[12] Schweiger-Hufnagel, U., Marx, K., Jabs, W., Resemann, A. (2013) Qualitative and
quantitative investigation of glycans attached to Prostate-specific antigen (PSA)
glycoprotein of healthy and cancer samples. ASMS 2013, ThP 19 – 339, available
at http://www.bruker.com/products/mass-spectrometry-and-separations/literature/
literature-room-mass-spec.html (section search: ‘‘glycoprotein’’) and
http://www.abrf.org/Other/ABRFMeetings/ABRF2013/RGpresentations/RG14_
gPRG_Leymarie.pdf.
[13] Marx, K., Kiehne, A., Meyer, M. (2013) amaZon speed ETD: Exploring glyco-
peptides in protein mixtures using Fragment Triggered ETD and CaptiveSpray nano-
Booster, Bruker Application Note LCMS-93, available at http://www.bruker.com/
products/mass-spectrometry-and-separations/literature/literature-room-mass-
spec.html (section search: ‘‘glycopeptide’’).
[14] Stavenhagen, K., Hinneburg, H., Thaysen-Andersen, M., Hartmann, L., Varon
Silva, D., Fuchser, J., Kaspar, S., Rapp, E., Seeberger, P.H., Kolarich, D. (2013)
Quantitative mapping of glycoprotein micro- and macro-heterogeneity: An evaluation
of mass spectrometry signal strengths using synthetic peptides and glycopeptides.
Journal of Mass Spectrometry 48:627 – 639.
doi: http://dx.doi.org/10.1002/jms.3210
103
Automated Detection and Identification of N- and O-glycopeptides