Can Fear Extinction Be Enhanced - A Review of Pharmacological and Behavioral Findings
Upload
insidescientificCategory
view
211download
0
Automated Analysis of Behavioral Data –Examples From Fear Conditioning Studies
Sponsored by:

InsideScientific is an online educational environment designed for life science researchers. Our goal is to aid in
the sharing and distribution of scientific information regarding innovative technologies, protocols, research tools
and laboratory services.

Automated Analysis of Behavioral Data
Gerry Herrera, PhD
Catamount Research & Development Inc.,
MED Associates Inc.
Copyright 2015 InsideScientific & MED Associates Inc. All Rights Reserved.

VideoFreeze® NIR Video Fear Conditioning Systems for Rodents
Thank you to our event sponsor

What will we cover today…
1. Basic concepts in fear conditioning and the components of a video-based fear conditioning (“freeze”) system
2. The principles behind automated motion analysis and proper detection of freezing
• Importance of validating settings
3. Applied examples of fear conditioning experimental design

Training Context –Naïve Exploratory Behavior
Fear Conditioning –Tone-Shock Pairing (CS-US)
Training Context –Freezing Behavior
Concepts Behind Fear Conditioning

Novel Context –Naïve Exploratory Behavior
Novel Context –Presentation of the CS -> Freezing Behavior
Concepts Behind Fear Conditioning

• Animals exhibit high activity in a novel environment –exploratory behavior
• Contextual cues are important (odor, illumination, geometry, etc)
• A neutral stimulus (Conditioned Stimulus, CS) is paired with an aversive Unconditioned Stimulus (US)
Concepts Behind Fear Conditioning
Training:

• Animals exhibit high activity in a novel environment –exploratory behavior
• Contextual cues are important (odor, illumination, geometry, etc)
• A neutral stimulus (Conditioned Stimulus, CS) is paired with an aversive Unconditioned Stimulus (US)
Training:
Concepts Behind Fear Conditioning

• Some time after training (e.g. 1 Day), the animal is returned to the training context.
• Animals usually exhibit freezing behavior right away when placed in the training context. This is interpreted as fear to the contextual cues in the training environment.
Context Test:
Concepts Behind Fear Conditioning

Concepts Behind Fear Conditioning
• Some time after training (e.g. 1 Day), the animal is returned to the training context.
• Animals usually exhibit freezing behavior right away when placed in the training context. This is interpreted as fear to the contextual cues in the training environment.
Context Test:
• Some time after training (e.g. 1 or 2 days), the animal is placed in a new environmental context.
• Initially, the animal exhibits normal exploratory behavior (high activity, low freezing).
• Subsequent presentation of the CS elicits the freezing response.
Tone Test:
Concepts Behind Fear Conditioning

Concepts Behind Fear Conditioning
• Some time after training (e.g. 1 or 2 days), the animal is placed in a new environmental context.
• Initially, the animal exhibits normal exploratory behavior (high activity, low freezing).
• Subsequent presentation of the CS elicits the freezing response.
Tone Test:

Components of a Video-based Fear Conditioning (Freeze) System
• Sound attenuating cubicle
• Low-noise digital video camera
• Near-infrared illumination system
• Conditioning chamber
• Aversive stimulation

Why Acoustic Foam Lining?
• Improved sound attenuation properties
• Minimizes vocalizations and noises from one chamber interfering with adjacent chambers

Camera and Illumination System – Minimize Video Noise
• Since an automated fear conditioning system must measure animal movement, a low noise camera is essential.
• Visual cues are often used in fear conditioning paradigms, so the automated system should not be impacted by these manipulations. This is achieved by use of near infrared (NIR) illumination.
Variable Intensity White Light
INTENSITYWhite Light NIR Light
POWER
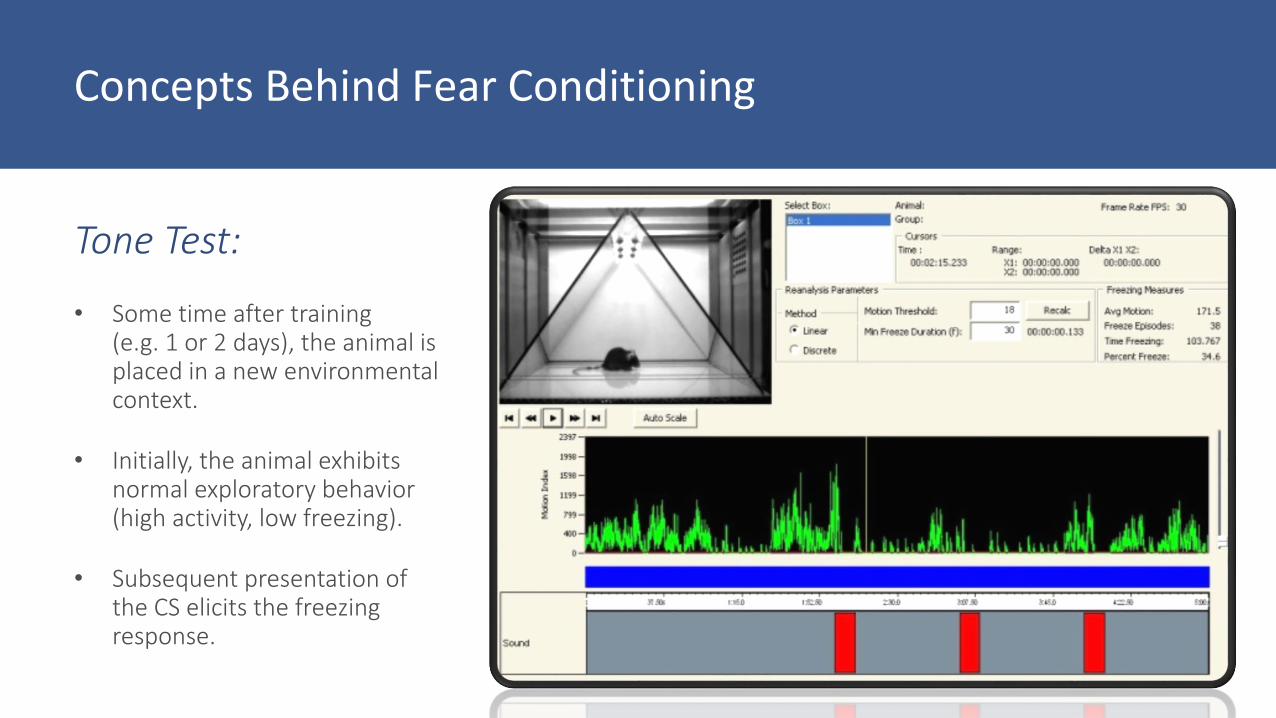
Contextual Inserts
• In fear conditioning studies, it is necessary to alter the context of the testing environment.
• An automated system should be able to score behavior similarly in multiple contexts.

A-Frame and Floor Cover Inserts for Contextual Changes
• Cage geometry can be altered significantly, even without impacting illumination levels.
• This results in high quality video signal regardless of the contextual configuration of the test chamber.

How do we measure freezing?

• A video-based system that measures freezing behavior must have some way of detecting when an animal is moving or not.
• When the animal is not moving, or when there is no animal present at all, the system should score 100% freezing.
• Subtle movements (grooming, sniffing, etc) should be differentiated from freezing.

• Animal movement can be tracked in many different ways(photobeams, video, load cell)
• Tracking of animal movement should not be highly influenced by experimental variables
• The Motion Index score in VideoFreeze captures animal movement to distinguish slight movements from freezing…Regardless of coat color, animal size, environmental context and visual cues

PARAMETERS
1. Motion Threshold:Arbitrary limit above which the subject is considered moving
2. Minimum Freeze Duration:Duration of time that a subject’s motion must be below the Motion Thresholdfor a Freeze Episode to be counted
“Linear” Analysis: every data point is examined
How Can a System Measure Freezing?

“Linear” Analysis: every data point is examined
DEPENDENT MEASURES
1. Percent Freeze:Time immobile/total session time
2. Freeze Episodes:Number of freezing events
3. Freeze Duration:Total amount of time spent immobile
How Can a System Measure Freezing?

1. Validating any automated behavioral analysis system is a key step in data collection.
2. Validation ensures that the system is analyzing the behavior in question in a reliable manner that is consistent with traditional/accepted methods.
Validating Analysis Settings:Computer-Scoring versus Hand-Scoring

Tally observations:
% Freezing = #YES Obs./#Total Obs. x 100%
Alternatively, some people watch video continuously and start/stop a stopwatch every time the animals starts/stops freezing.
%Freezing=Time Freezing/Total Time x 100%
Validating Analysis Settings:Computer-Scoring versus Hand-Scoring
Anagnostaras et al., 2010
Freezing is often defined as suppression of all movement except that required for respiration
• Look up at video every few seconds (e.g. 8 sec)
• Make instantaneous judgment (Freezing: YES or NO)
Suggested Resources: Curti, 1935, 1942;
Grossen and Kelley, 1972; Fanselow and Bolles, 1979;
Fanselow, 1984

Validation – Frontiers in Behavioral Neuroscience
• This paper describes the principles involved with validating Video Freeze® software by comparing software scores with human observer scores.
• This approach can be used as a reference for general validation of automated behavioral analysis systems.

Anagnostaras et al, Front Behav Neurosci 2010
1. Since freezing is defined as absence of movement, the system should measure movement in some way. Then near-zero movement can be equated with freezing.
2. System should detect small movements, such as grooming, and not count them as freezing. If there is no animal present, the system should score 100 % freezing (reject video noise).
Requirements of an Automated Detection System

3. Signals from small movements, such as grooming, should be well-above video noise.
4. Detection should be fast.
5. Scores generated by the computer should correlate “very well” with scores obtained from multiple trained human observers.
Correlation coefficient should be near 1, fit should have a near zero y-intercept, and a slope of ~1.
Requirements of an Automated Detection System
Anagnostaras et al, Front Behav Neurosci 2010

Compare various computer scores of a data set to the same data that has been hand-scored by a few observers.
Anagnostaras et al., 2010
Validating Your Analysis Settings

Validating Your Analysis Settings
Computer-Scoring VS Hand-Scoring:
Anagnostaras et al., 2010
Correlation:
The linear correlation between VideoFreeze-scored and human-scored freezing is compared with number of frames (minimum freeze duration) for various motion index thresholds. A larger number of frames yielded higher correlations.

Validating Your Analysis Settings
Computer-Scoring VS Hand-Scoring:
Anagnostaras et al., 2010
Intercept:
The linear fit between VideoFreeze-socred and human-scored freezing is compared for the y-intercept. The y-intercept is important because it reflects how much the system overestimates or underestimates freezing. A threshold of 18 yielded the lowest non-negative intercept.

Validating Your Analysis Settings
Computer-Scoring VS Hand-Scoring:
Anagnostaras et al., 2010
Slope:
The slope term from the linear fit is depicted compared with frames and motion threshold. Larger frame numbers yielded a slope closer to 1. A motion threshold of 18 and number of frames of 30 was chosen for having the best combination of high correlation, intercept close to 0, and slope close to 1.
*Au = arbitrary units

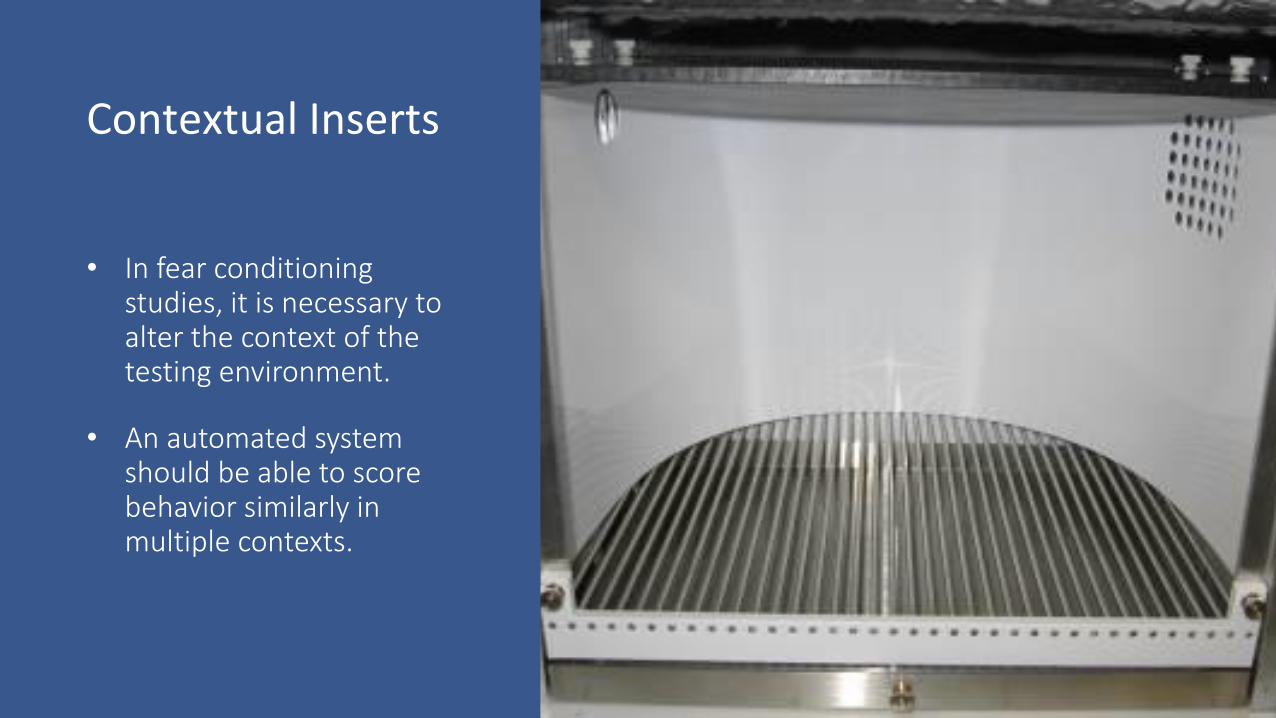
Possible Scoring Outcomes
1. Automated system over-estimates freezing at low levels of movement
Possible Scoring Outcomes
Linear Fit Results:
• Slope may or may not be near 1
• Relatively low correlation coefficient
• Y-intercept > 0
1. Automated system over-estimates freezing at low levels of movement

Possible Scoring Outcomes
Possible Causes:
• Motion Index Threshold too HIGH
• Minimum Freeze Duration too SHORT
1. Automated system over-estimates freezing at low levels of movement

Possible Scoring Outcomes
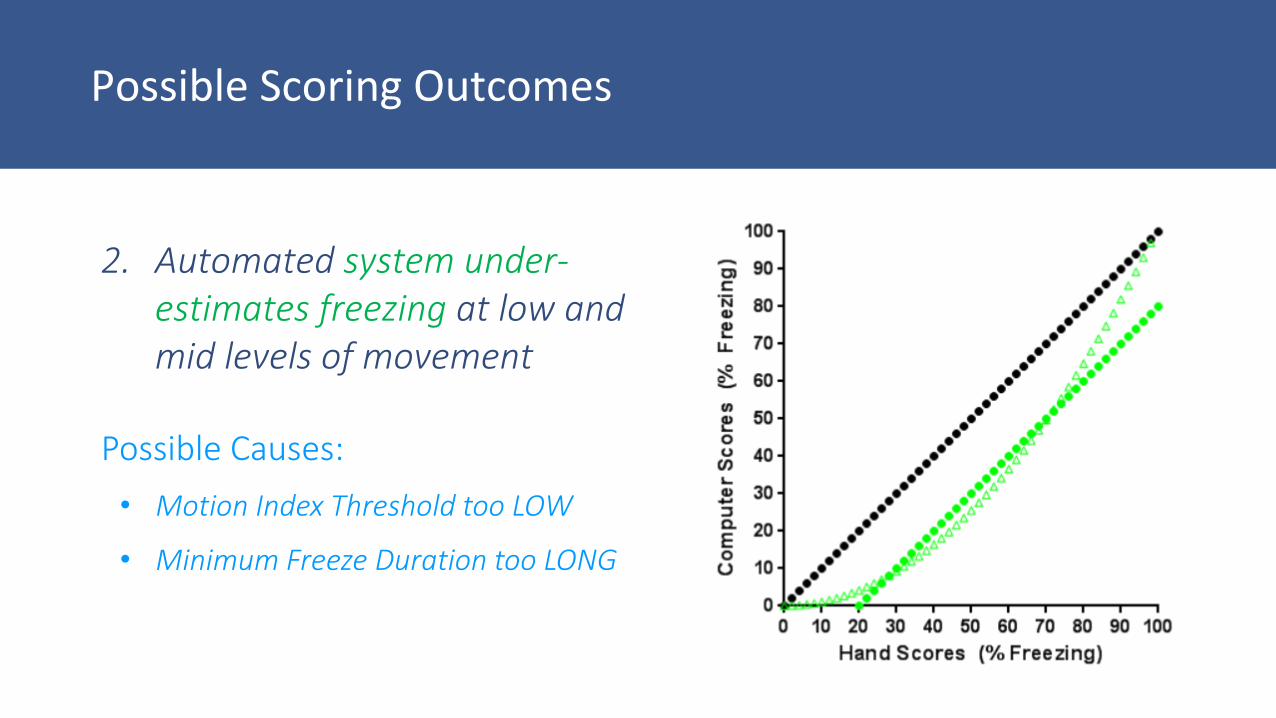
2. Automated system under-estimates freezing at low and mid levels of movement

Possible Scoring Outcomes
2. Automated system under-estimates freezing at low and mid levels of movement
Linear Fit Results:
• Slope may or may not be near 1
• Relatively low correlation coefficient
• Y-intercept < 0
Possible Scoring Outcomes
2. Automated system under-estimates freezing at low and mid levels of movement
Possible Causes:
• Motion Index Threshold too LOW
• Minimum Freeze Duration too LONG

Example Scoring Challenge: Measuring Subtle and Brief Movements


• With appropriate Motion Index Threshold and Minimum Freeze Duration, it is possible to distinguish subtle, brief movements from freezing.
• This is the most significant challenge for any automated system that scores freezing behavior.
Scoring Challenge: Subtle, Brief Movements


• With appropriate Motion Index Threshold and Minimum Freeze Duration, it is possible to distinguish subtle, brief movements from freezing.
• This is the most significant challenge for any automated system that scores freezing behavior.
Scoring Challenge: Subtle, Brief Movements
Risk of over-estimating freezing if Minimum Freeze Duration is too short.

Applied Examples:Context Discrimination and Shock Reactivity

Context A(Training Context) Context B Context C
Example Experiment: Context Discrimination in Rats

Example Experiment: Context Discrimination in Rats
Cued Freezing

Example Experiment: Context Discrimination in Mice
Day 1: Train Context A
5 CS-US pairings
Sound
Shocker
Day 2: Test Context A
Day 3: Test Context B

Day 1: Train Context A5 CS-US pairings
• Very low, basically 0, freezing prior to fear conditioning
• Freezing behavior (learning) is evident with successive CS-US parings.
n=3 C57Bl6 male mice
Training: Context A

Day 2: Test Context A
• Mice show significant freezing in response to training context (non-zero baseline freezing; compare to baseline during training).
• Also high freezing in response to CS presentation.
n=3 C57Bl6 male mice
Tone Test: Context A
Training data
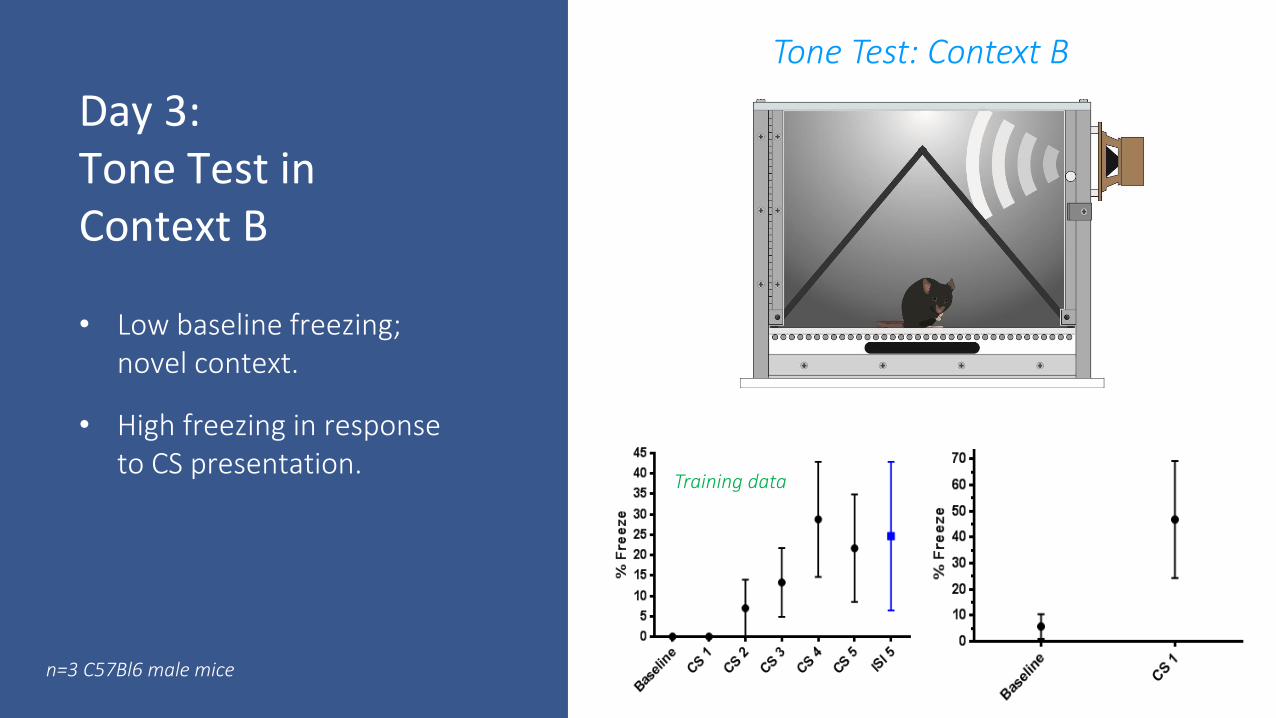
Day 3: Tone Test in Context B
• Low baseline freezing; novel context.
• High freezing in response to CS presentation.
Tone Test: Context B
n=3 C57Bl6 male mice
Training data
CS
US
n=2 CD-1 mice per group
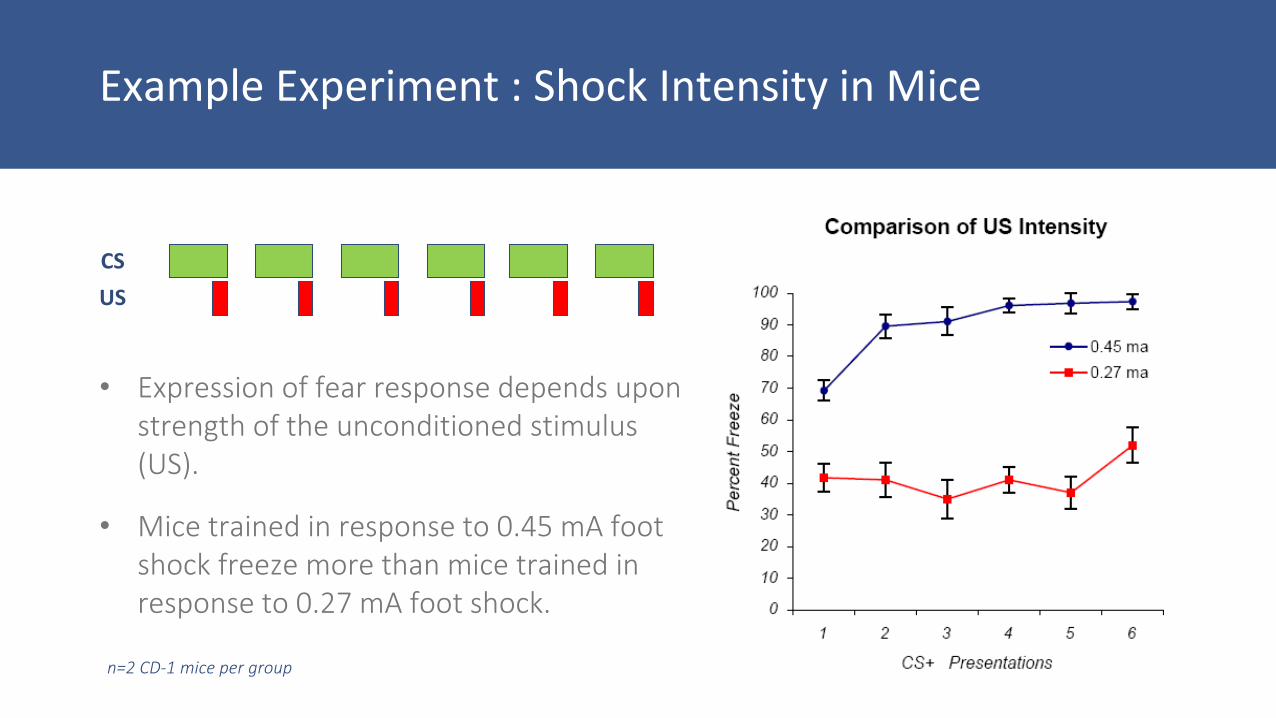
Example Experiment : Shock Intensity in Mice
• Expression of fear response depends upon strength of the unconditioned stimulus (US).
• Mice trained in response to 0.45 mA foot shock freeze more than mice trained in response to 0.27 mA foot shock.

Summary
• Care should be taken to setup your behavioral assay in a way that limits interference from other lab activities (sound attenuation, enclosed cubicles, dedicated space, etc.).
• When relying on automated systems for scoring complex behaviors, special attention should be paid to validating the settings used in data analysis. Make sure that the automated system measures behavior in a manner analogous to trained human observers.

Acknowledgements
• Mary Beth Klinger-Lawrence, PhDLab Director
• Mahalia McGill, Research Assistant
• Sierra Bruno, Research Assistant
• Nakia Wighton, Summer Student
Lab team at Catamount R&D and MED Associates

Gerry Herrera, PhD
(802) 527-2343
Thank You!For additional information on fear conditioning technologies, in particular NIR video response systems please visit:
www.med-associates.com

Follow us on
Join our group
InsideScientific is an online educational environment designed
for life science researchers.
Our goal is to aid in the sharing and distribution of scientific information regarding innovative technologies,
protocols, research tools and laboratory services.