Autocracy as a Safety Valve for Democracy’s Elites ...
33
Autocracy as a Safety Valve for Democracy’s Elites: Evidence from British Colonies * Christian Dippel † June 25, 2014 Abstract Democracies frequently turn into autocracies, with detrimental effects on socio- economic development. The coups behind these regime changes are usually viewed as originating outside the democratic process. This paper explores the contrasting possibility that they may be initiated by elected elites, if these elites prefer being ruled by an autocrat over being marginalized in the democratic process. Identification of this channel is difficult because coups are illegal, so that support for them tends to be unobservable. Instead, I study legal autocratic regime-change in 19th-century British colonies, where the constitutional rules allowed locally elected parliaments to abol- ish themselves and invite the colonial governor to rule autocratically in their stead. I identify 11 such regime changes and find (i) that in their lead-up, increasing polit- ical competition from freed slaves was tilting policies away from elites’ preferences, (ii) that variation in political competition explains the incidence and timing of regime changes, (iii) that regime changes subsequently tilted policies toward elites’ prefer- ences, and (iv) that they maintained elites’ insider access to government, thus keeping the affected colonies on paths of low public-good provision and oligarchic rule. Keywords: Democracy, Autocracy, Regime Change, Elite Persistence, Oligarchy, Institutions, Franchise Extension. * I thank Scott Ashworth, Leah Boustan, Ann Carlos, Melissa Dell, Stan Engerman, Fred Finan, Price Fishback, Mor- gan Kousser, Gary Libecap, Suresh Naidu, Ken Shotts, Guido Tabellini, Francesco Trebbi, Dan Trefler, Stephane Wolton, and Alex Whalley, as well as seminar participants at Caltech, Stanford, UBC, UCI, Yale, Chicago Harris, the Boulder IBS workshop, LACEA Political Economy meetings, and NBER POL and DAE meetings for valuable discussions and insightful comments. I also thank the UCLA Burkle Center and the UCLA Center for Economic History for financial support. † UCLA Anderson School of Management (email: [email protected])
Transcript of Autocracy as a Safety Valve for Democracy’s Elites ...

Autocracy as a Safety Valve for Democracy’s Elites:Evidence from British Colonies∗
Christian Dippel†
June 25, 2014
Abstract
Democracies frequently turn into autocracies, with detrimental effects on socio-economic development. The coups behind these regime changes are usually viewedas originating outside the democratic process. This paper explores the contrastingpossibility that they may be initiated by elected elites, if these elites prefer being ruledby an autocrat over being marginalized in the democratic process. Identification ofthis channel is difficult because coups are illegal, so that support for them tends to beunobservable. Instead, I study legal autocratic regime-change in 19th-century Britishcolonies, where the constitutional rules allowed locally elected parliaments to abol-ish themselves and invite the colonial governor to rule autocratically in their stead.I identify 11 such regime changes and find (i) that in their lead-up, increasing polit-ical competition from freed slaves was tilting policies away from elites’ preferences,(ii) that variation in political competition explains the incidence and timing of regimechanges, (iii) that regime changes subsequently tilted policies toward elites’ prefer-ences, and (iv) that they maintained elites’ insider access to government, thus keepingthe affected colonies on paths of low public-good provision and oligarchic rule.
Keywords: Democracy, Autocracy, Regime Change, Elite Persistence, Oligarchy, Institutions,Franchise Extension.
∗I thank Scott Ashworth, Leah Boustan, Ann Carlos, Melissa Dell, Stan Engerman, Fred Finan, Price Fishback, Mor-gan Kousser, Gary Libecap, Suresh Naidu, Ken Shotts, Guido Tabellini, Francesco Trebbi, Dan Trefler, Stephane Wolton,and Alex Whalley, as well as seminar participants at Caltech, Stanford, UBC, UCI, Yale, Chicago Harris, the BoulderIBS workshop, LACEA Political Economy meetings, and NBER POL and DAE meetings for valuable discussions andinsightful comments. I also thank the UCLA Burkle Center and the UCLA Center for Economic History for financialsupport.†UCLA Anderson School of Management (email: [email protected])
“If we want things to stay as they are, they will have to change.”
— Giuseppe di Lampedusa, The Leopard
1 Introduction
A rich political economy literature has provided explanations for how autocracies may (gradually
or suddenly) become more democratic (Lipset [1959], Acemoglu and Robinson [2000], Acemoglu
and Robinson [2001], Lizzeri and Persico [2004], Bruckner and Ciccone [2011], Besley et al. [2012]).
However, there is also frequent movement in the opposite direction, with coups turning democ-
racies into autocracies. Not only are these regime changes not uncommon, they also have signifi-
cant detrimental effects on subsequent economic development (Meyersson [2014]).1 Why then, do
democracies turn back into autocracies? Most answers have focused on cross-sectional or slow-
moving characteristics like the length of countries’ democratic experience and the stability of their
institutions (Przeworski et al. [2000], Haggard and Kaufman [2012]) or economic inequality (Boix
[2003], Acemoglu and Robinson [2006], Dutt and Mitra [2008]). While these answers highlight
fundamental factors that explain the probability that a democracy fails, they have left the actual
causes of the coups that turn democracies into autocracies relatively unexplored.
This paper asks whether autocratic regime change may be initiated by incumbent democratic
elites inside parliament, when they are threatened by increasing political competition. There is ev-
idence that this mechanism was important in many real-world autocratic regime changes. In the
1967 coup d’etat in Greece, for example, politicians of the incumbent Conservative Party openly
invited a military coup, fearing that the left-leaning Center Union Party would gain a parliamen-
tary majority in the upcoming election (Kassimeris [2006]). Similarly, the 1971 military coup in
Turkey was apparently supported by conservative parliamentary elements fearing increasing in-
fluence of both left- and right-wing parties and trade unions (Feroz [2002]). In Sierra Leone, when
the incumbent prime minister, Albert Margai, narrowly lost the 1967 election to Siaka Stevens,
he had planned ahead for this contingency and had the latter deposed by a military coup within
hours after taking office (Cartwright [1970]). Recently, the New York Times reported that Thai-
land’s military coup in May 2014 was “the culmination of months of maneuvering by the Bangkok
1Meyersson [2014], who estimates the economic effects of coups, reports that globally, out of 232 coups in 94 statesfrom 1950 to 2000, around one quarter overthrew democratically elected governments.
1
establishment to sideline the populist movement that has won every national election since 2001,”
and that the establishment was “seeking to suspend democracy, at least in the short term, as it
struggled to unseat a ruling party it has been unable to defeat at the polls” (Fuller [2014]). This is
exactly the mechanism that this paper seeks to identify empirically, the only difference being that
in the Caribbean the regime switches happened preemptively, i.e., before elites were defeated at the
polls, and legally, by a vote in the elected legislature.
A theoretical framework that fits this argument well is the one in Acemoglu and Robinson
[2001], who extend the model of redistributive taxation in Meltzer and Richard [1981] to study
democratic regime change, with elites trading off the cost of having a non-elite median voter
against the threat of a costly revolt by the non-elite.2 A natural extension of this framework is to
allow elites to defer power to an autocrat who can eliminate the threat of revolt. This would be
more attractive when the increase in political competition was more permanent, where the non-
elite’s objectives were more acrimonious to the elite and where the autocrat had objectives that
were more closely aligned with the elite.3
Because coups are by definition illegal, finding out whether they were supported or initiated
by an incumbent democratic elite is difficult, even ex post. As an alternative, this paper focuses
on a unique institutional rule in British colonies, where local parliaments could legally abolish
themselves and invite the Crown to run the government autocratically with unconstrained ex-
ecutive power. Specifically, I focus on the 19th century Caribbean, because this is where all of
these events actually occurred. Like the original American colonies and unlike any of the African
colonies, 12 of the 15 Caribbean plantation colonies began the 19th-century with strong locally
elected assemblies. By century’s end, parliaments in 11 of the 12 had voluntarily abolished all
elected elements from their government. This paper tests the hypothesis that these internally
driven switches from democracy to autocracy were elites’ response to increasing political com-
petition from former slaves, who had been freed by Britain’s Empire-wide abolition of slavery in
1836.4 Using data from the Colonial Blue Books — annual statistical accounts that were sent to Lon-
2In the Meltzer and Richard [1981] framework, political competition is the threat of having a non-elite median voterset policies. The more unequal a society is, the further apart are the elite’s and non-elite’s policy bliss points.
3In Acemoglu and Robinson [2006], elite rule is largely synonymous with non-democracy, but one can easily imaginemaking a three-way distinction between an elite-dominated democracy based on a narrow franchise, a broad democ-racy, and an autocracy. This distinction is implicit in the related literature on the extension of the franchise (Acemogluand Robinson [2000], Lizzeri and Persico [2004]).
4This political pressure varied within the Caribbean, depending on how easily freedmen could claim ownership of
2
don from each individual colony to report on local conditions — the paper presents four findings,
organized chronologically around the event of a regime switch to autocracy.
First, I show that freedmen had gained real political influence in the lead-up to the regime
switches. Under the democratic regime, there was a clear electoral cycle in public spending fa-
voring the rural poor. In election years, parliaments voted systematically more expenditure on
education and on a basket of other public goods that freedmen favored but elites did not, relative
to other years in the same electoral cycle.5
Second, I show that the instance and timing of the switches to autocracy can be explained
through increases in political competition, as measured by local electoral turnover.6 Because there
is considerable variation in electoral turnover both across colonies and within colonies over time,
I estimate the effect of electoral turnover on regime change both in a pooled cross section spec-
ification and in panel specifications. Remarkably, the estimated effect is practically identical in
both specifications. A 10 % increase in electoral turnover raises the probability that a parliament
voted to abolish itself by 2 % in a given year. To address the possibility that omitted factors that
correlate with electoral turnover are driving the differential timing of regime switches, I control
directly for a number of potential confounding drivers of regime change. I first control for the
possibility that colonies learned from each others’ actions by including the stock of colonies that
had already abolished their parliaments. I then control for increased attractiveness of the regime
change after the the colonial administration put down the Indian Mutiny in 1857, which signalled
a willingness to put down local peasant uprisings. Finally, I control flexibly for linear trends and
year fixed effects. The results are robust to all these specifications.
Because I hypothesize a causal link from electoral turnover to the probability of regime change,
land, which gave the right both to vote and to run for office.5Educational expenditure was the expenditure category that was most consistently available. The basket of other
public goods contains all public goods associated with public health. On both dimensions, the interests of freedmenand planter elites diverged strongly.
6Electoral turnover is not the ideal measure of political competition, but it is the only one available here. Reassur-ingly, electoral turnover strongly correlates with two other, preferable, measures of political competition, which areonly available for subsamples. The first is the franchise (the number of voters per capita). Franchise-data was reportedonly after 1854, which leaves too little data to be useful for estimation at the colony level. But at the sub-colony parishlevel, where the cross-sectional sample size is increased to over 100, I find that increases in the franchise significantlyincreased electoral turnover, both in specifications with parish fixed effects (identifying within parishes over time) andwith electoral-cycle fixed effects (identifying across parishes within a colony). Second, for Jamaica only, I can calculatethe rate of entry of new families into parliament from Jamaica’s full parliamentary history in Roby [1831]. (To assess theflow of new entrants, one needs to accurately measure the stock of old political families from a reasonably long priorhistory, which the Blue Books do not provide.) For the 14 elections that took place in Jamaica from 1800 to 1865, there isa strong correlation between electoral turnover and political entry.
3

I also explore sources of exogenous variation underlying the panel-variation in electoral turnover.
The historical record suggests that the exogenous introduction of the Caribbean Incumbered Es-
tate Act (IEA), which facilitated the sale of bankrupt plantation land, strongly increased political
competition by increasing land transactions, and that it did so differentially depending on local
conditions that determined plantations’ profitability. Consistent with this, I find that the intro-
duction of the IEA raised both electoral turnover and the probability of regime change, but that it
did so significantly less where local conditions meant plantations were more profitable. Pushing
the identifying assumptions a bit further by assuming that the introduction of the IEA, interacted
with local conditions, influenced regime change only through its effect on electoral turnover, I also
present instrumental variable (IV) estimates of the effect of electoral turnover on regime change.
The IV estimates broadly confirm the baseline results, although they are larger, suggesting that
when electoral turnover exogenously increased by 10 %, the probability that parliament voted to
abolish itself was between 4 and 15 % larger in a given year.
Third, I study the effects of switching from democracy to autocracy by comparing public ex-
penditures before and after the regime switch. Across specifications, spending on education and
on other public goods declined with the dismantling of elected parliaments, both in specifications
with only common time-trends (where the control is colonies that had not yet switched), and in
specifications with colony-specific time trends (where the control is also each colony’s own coun-
terfactual trend had it not switched to autocracy). I also investigate more closely the time-path
of public expenditure, specifically around the years of regime change. There is some evidence
that public-good provision actually increased from one year before to one year after the switch to
autocracy, perhaps because elites wanted to secure a smooth transition.
Fourth, I check directly whether elites were able to maintain insider access to the colonial auto-
crat after the regime switch. Two facts are consistent with this insider-access hypothesis: One, old
political families continued to hold about 80 % of appointed legislative positions as late as 20 years
after the regime switch, and two, within each colony, these old families came disproportionately
from the plantation parishes.
One issue that panels with few cross-sectional units need to address is proper clustering. Stan-
dard clustering relies on asymptotic theory that is unlikely to apply in a panel with only 12 colony-
clusters. I therefore also report p-values for wild bootstrapped standard errors for all the main
4
results, as suggested in Cameron and Miller [2013].
This paper speaks to a well-established literature on the consolidation and stability of demo-
cratic regimes (Haggard and Kaufman [1997], Przeworski et al. [2000], Boix [2003], Acemoglu
and Robinson [2006], Haggard and Kaufman [2012]). In that literature, political competition often
leads to a strengthening of democracy: In Acemoglu and Robinson [2001], elites make political con-
cessions such as extending the franchise in order to preserve their economic rents, a mechanism
for which Bruckner and Ciccone [2011] provide compelling empirical support in African data. In
Besley et al. [2012], elites strengthen checks and balances in response to a higher likelihood of a
non-elite future government. By contrast, this paper shows that political competition may lead
elites to abolish democracy altogether and initiate a regime switch to autocracy if the cost of a
non-elite democratic government is high relative to that of an autocratic regime.7,8
This paper also speaks to a broader literature on the nexus of endogenous institutional change,
elite persistence, and economic growth (North and Weingast [1989]). The evidence presented here
fits best into the theory of the “simultaneous change and persistence in institutions,” in which
changes in de jure institutions have no consequences because they are offset by changes in elites’
de facto collective action (Acemoglu and Robinson [2008]).9 Most closely related are studies of
the politics of the post-Reconstruction U.S. South, where literacy tests, discriminatory schooling,
the Ku Klux Clan, and Jim Crow laws were successfully used to reestablish the planter elites’
dominance over the democratic process after the Union Army pulled out in 1877 (Kousser [1974],
Margo [1990], Naidu [2009]). Several noteworthy differences, which I explore in Section 5.1, exist
between the U.S. South and the Caribbean. These differences meant that a Southern equilibrium
7Because this will be the case only when the autocrat’s actions are reasonably constrained, the Caribbean experiencein the 19th century is more akin to the history of military coups in Greece, Turkey, and parts of Latin America than it isto those in post-colonial Africa.
8There is also a strand of this literature where economic growth means that elites benefit more from broader rep-resentation than they lose from giving up their dominance of the democratic process, a central tenet of modernizationtheory (Lipset [1959]). In Acemoglu and Robinson [2000], revolts by the poor become costlier as economic prosperityincreases. In Lizzeri and Persico [2004], the interests of wealthy capitalists and workers are aligned against the landedgentry, and capitalist elites therefore seek to strengthen the workers. These mechanisms help explain the widespreadexpansion of the franchise to the poor in many parts of the world in the 19th century (Engerman and Sokoloff [2005]),but none of these mechanisms were at play in the Caribbean.
9Meyersson [2014] studies the effects of coups on development outcomes and shows that their negative effect isbigger when the replaced regime was more democratic. In this context, the Caribbean may be an intermediate case,where a very unequal democracy was replaced by a relatively stable and technocratic autocracy.
5
was not feasible for Caribbean planter elites.10,11
This paper also speaks to an influential line of research that has advocated historical colo-
nialism as a natural experiment to identify the causal effect of institutions on long-run develop-
ment (Acemoglu et al. [2001, 2002], Engerman and Sokoloff [2002], Feyrer and Sacerdote [2009]).
However, empirical measures of concrete colonial institutions and their change over time have
remained elusive.12 To my knowledge, this is the first paper that studies panel-variation of con-
crete colonial institutions. Section 5.4 presents and discusses some additional evidence on this
data variation in a wider set of British colonies.
Finally, this paper contributes to a large body of economic history on colonialism and the
Caribbean. See, respectively, Lange [2004] and Iyer [2010], as well as Engerman [1982], Engerman
[1984], Holt [1991], and Henry and Miller [2009] for references.
This paper is organized as follows: Section 2 provides background, Section 3 discusses the
data, Section 4 presents the four key results, Section 5 discusses the results, and Section 6 con-
cludes.
2 Background: The Political Consequences of the Abolition of Slavery
This study focuses on the Caribbean because this is where the events of interest occurred. But there
is a deeper appeal in this focus on the Caribbean, because its colonies were highly comparable in
their histories and economic structures, and were arguably exposed to the same shocks over time.
Most importantly, there was a single, well-identified driving force behind all regime changes in
the data, which can be explored for empirical analysis.
The Caribbean colonies were settled in the 17th century by British smallhold farmers, much
like in the Chesapeake Bay. These smallhold farmers sought to control taxes and spending through
local assemblies (Taylor [2002, p. 246]), which “seriously curtailed the powers of the governors in
10Nonetheless, Caribbean elites’ response of abandoning democratic institutions was not without equivalent in theU.S. South: The county government of Dallas County in Alabama asked the governor to dissolve it when a blackmajority was looming in 1880, and the county government was not reestablished until 1900 (Kousser [1999]).
11Major changes in democratic institutions did occur in the U.S. South after the 1965 Civil Rights Act, when municipalgovernments’ electoral rules changed in black-dominated U.S. cities to entrench white votes (Trebbi et al. [2008]). Unlikein the 19th-century Caribbean, these institutional changes were not enough to prevent major concessions in publicspending to the newly enfranchised (Husted and Kenny [1997]).
12Some recent exceptions that study concrete colonial institutions are Banerjee and Iyer [2005] and Dell [2010]. How-ever, they study the persistent effects of initial institutions.
6

the colonies” (Morrell and Parker [1969, p. 435].
This assembly system remained even after large-scale sugar plantations had completely dis-
placed the smaller tobacco plantations in the early 18th century. The franchise was everywhere
highly concentrated13, but this reflected merely the small number of whites everywhere (Dunn
and Parker [1972]). Indeed, the legacy of the Caribbean’s smallhold origins meant that typically
all whites were enfranchised, because the property holdings required to vote continued to be low.
They had typically stayed at their original 10-acre threshold (Wrong [1923]).14 After slavery was
abolished by an Act of English Parliament in 1834, many freedmen left the plantations and began
to purchase smallholds.15,16 Black leaders quickly recognized that smallhold expansion meant
franchise expansion.17 In Jamaica for example, “Baptist ministers tried to mobilize the dormant
black electorate. They encouraged their members to purchase freeholds and register to vote” (Holt
[1991]). This gradual enfranchisement of the freedmen led to an increase in political competition:
“The planters steadily lost their political dominance as disputatious assemblies were infiltrated by
men of color independent of the plantation economy” (Burroughs [1999]).18
Finally, from 1854 to 1877, 11 of the Caribbean parliaments simply abolished themselves. Par-
liament would vote on a bill to abolish parliament and invite the Crown to write a new constitution
for the colony. In all cases, this new constitution followed the standard template of Crown Colony
rule: All functions of government were controlled by the colonial administration, with the gover-
nor appointing the local legislature and judiciary. Locally elected parliament was replaced with a
legislature that consisted partly of colonial officials and partly of local appointees. Historians have
argued that this voluntary dismantling of Caribbean parliaments was planter elites’ response to
the political competition of freedmen: While they had traditionally “jealously guarded [the as-
13Wrong [1923, p. 69] states that throughout the pre-abolition Caribbean, “it was distinctly the exception for a memberof the legislature to be returned by more than 10 votes.”
14The franchise in the Caribbean, as elsewhere in the British colonies, was obtained primarily through land owner-ship. The franchise rules reported in the Blue Books show that there is very little variation in the 10-acre threshold acrosscolonies.
15Slavery ended in 1836, but abolition only really became effective in 1838, after a two-year transitional period ofquasi-indenture called Apprenticeship.
16This happened through purchases of marginal plantation lands or Crown lands. Squatting, pervasive throughoutthe Caribbean, also gave legal title after 12 years on private land and 60 years on Crown lands (Craton [1997, p. 390]).
17Contrary to the situation in Europe, the franchise in the Caribbean was therefore expanding without any change tothe de jure rules that regulated the right to vote.
18The main conflict of interest between the planters and freedmen was on the issue of taxation and public-goodprovision. Freedmen’s primary concerns were land redistribution and public-good provision. Planters were naturallyaverse to land redistribution and were also disinterested in the expansion of education and health services (Sewell[1861, p. 39], Dookhan [1977], Brizan [1984, p. 163]).
7
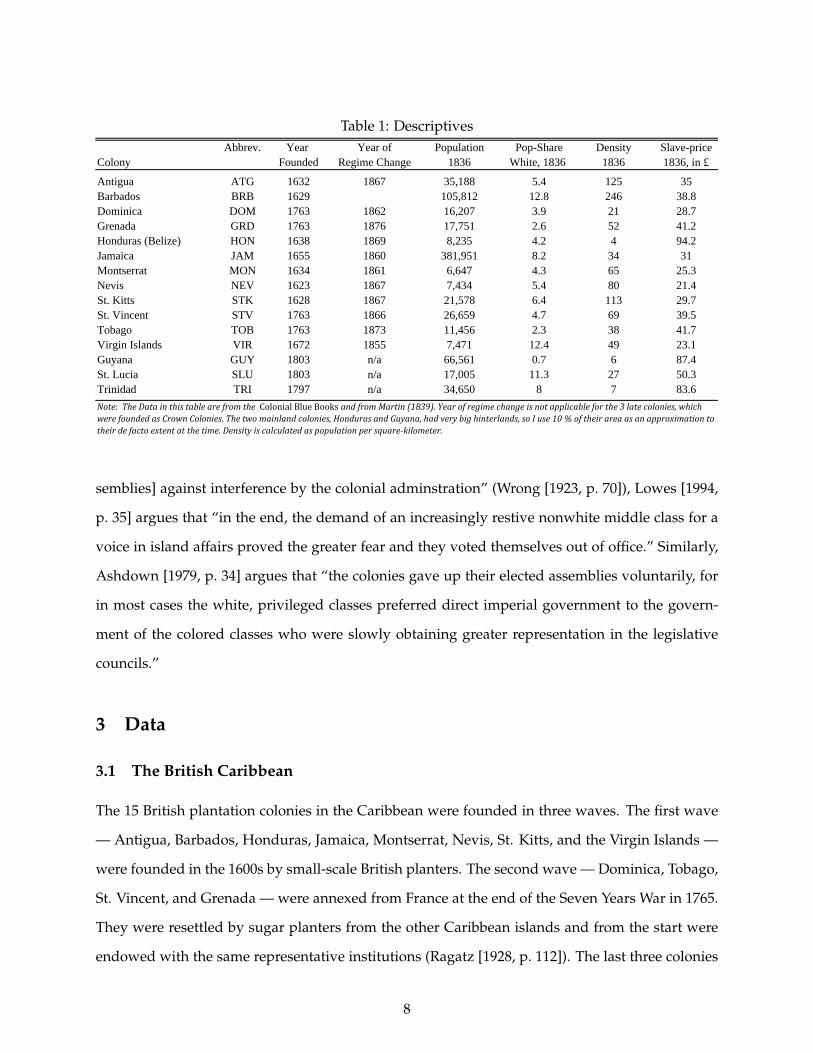
Table 1: Descriptives& Abbrev. & Year & Year of & Population & Pop-Share & Density & Slave-price
Colony & & Founded & Regime Change & 1836 & White, 1836 & 1836 & 1836, in £
Antigua & ATG & 1632 & 1867 & 35,188 & 5.4 & 125 & 35Barbados & BRB & 1629 & & 105,812 & 12.8 & 246 & 38.8Dominica & DOM & 1763 & 1862 & 16,207 & 3.9 & 21 & 28.7Grenada & GRD & 1763 & 1876 & 17,751 & 2.6 & 52 & 41.2Honduras (Belize) & HON & 1638 & 1869 & 8,235 & 4.2 & 4 & 94.2Jamaica & JAM & 1655 & 1860 & 381,951 & 8.2 & 34 & 31Montserrat & MON & 1634 & 1861 & 6,647 & 4.3 & 65 & 25.3Nevis & NEV & 1623 & 1867 & 7,434 & 5.4 & 80 & 21.4St. Kitts & STK & 1628 & 1867 & 21,578 & 6.4 & 113 & 29.7St. Vincent & STV & 1763 & 1866 & 26,659 & 4.7 & 69 & 39.5Tobago & TOB & 1763 & 1873 & 11,456 & 2.3 & 38 & 41.7Virgin Islands & VIR & 1672 & 1855 & 7,471 & 12.4 & 49 & 23.1Guyana & GUY & 1803 & n/a & 66,561 & 0.7 & 6 & 87.4St. Lucia & SLU & 1803 & n/a & 17,005 & 11.3 & 27 & 50.3Trinidad & TRI & 1797 & n/a & 34,650 & 8 & 7 & 83.6Note:TheDatainthistablearefromthe ColonialBlueBooksandfromMartin(1839).Yearofregimechangeisnotapplicableforthe3latecolonies,whichwerefoundedasCrownColonies.Thetwomainlandcolonies,HondurasandGuyana,hadverybighinterlands,soIuse10%oftheirareaasanapproximationtotheirdefactoextentatthetime.Densityiscalculatedaspopulationpersquare‐kilometer.
semblies] against interference by the colonial adminstration” (Wrong [1923, p. 70]), Lowes [1994,
p. 35] argues that “in the end, the demand of an increasingly restive nonwhite middle class for a
voice in island affairs proved the greater fear and they voted themselves out of office.” Similarly,
Ashdown [1979, p. 34] argues that “the colonies gave up their elected assemblies voluntarily, for
in most cases the white, privileged classes preferred direct imperial government to the govern-
ment of the colored classes who were slowly obtaining greater representation in the legislative
councils.”
3 Data
3.1 The British Caribbean
The 15 British plantation colonies in the Caribbean were founded in three waves. The first wave
— Antigua, Barbados, Honduras, Jamaica, Montserrat, Nevis, St. Kitts, and the Virgin Islands —
were founded in the 1600s by small-scale British planters. The second wave — Dominica, Tobago,
St. Vincent, and Grenada — were annexed from France at the end of the Seven Years War in 1765.
They were resettled by sugar planters from the other Caribbean islands and from the start were
endowed with the same representative institutions (Ragatz [1928, p. 112]). The last three colonies
8
— Trinidad, St. Lucia, and Guyana — were ceded to Britain between 1797 and 1803. By then, the
Crown had started to assert more authority over its colonies, so that these three late colonies were
already founded under Crown Colony rule (Will [1970]). Table 1 lists the colonies with their foun-
dation dates, their characteristics at the time of abolition, and the dates they transitioned toward
Crown Rule.19,20 Table 1 includes the three late colonies for completeness, but these are naturally
not included in the empirics, so that the effective sample consists of the 12 highly comparable
plantation colonies that started out under the Assembly system.
Figure 1 plots the raw electoral turnover data leading up to constitutional changes for the
12 colonies. Noteworthy variation exists both in the cross-section and in the time-series. In the
cross-section, consider the contrast between the Virgin Islands, the first switcher, and Barbados,
the only colony that never switched. In Barbados, turnover was below 40 percent in every one
of its elections. By contrast, in the Virgin Islands, turnover was above 40 percent in every one of
its elections. In the time-series, electoral turnover was generally trending up before the regime
switches. There are some instances, such as in Dominica and Grenada, where the regime switch
followed a rapid increase, and some, such as in Dominica and Grenada, where the increase was
more gradual.
3.2 Data Sources
The main data source for this paper are the British Colonial Blue Books, annual statistical accounts
that were sent to London from each individual colony to report on local conditions.21 From 1836,
the books’ Councils and Assemblies section reported the names of all local politicians, with elec-
19While all 11 colonies eventually switched to full Crown rule, ten of them first changed their constitution to a tran-sitional semi-representative system with an elected minority. Historians agree that this was a transitional mechanismwith the clear end-goal of securing a majority for the full switch toward Crown Colony rule (Craig-James [2000, p. 256],Brizan [1984, p. 204]). The Colonial Office List’s description of Grenada’s constitutional history reads, “The constitutionwas remodeled by an Act on October 7th 1875 and a single legislative chamber was established, [which] consisted of 8members elected by the people and 9 nominated by the Crown. This Assembly at its first meeting on February 9th 1976addressed the Queen that it had passed a bill for its own extinction” (Britain [1879, p. 188]). Since colonies only stayedin the transitional state for six years on average, there is little informational content in that period; I focus on the firstconstitutional change.
20For two colonies, I report an even earlier date: Jamaica and Montserrat actually changed the rules governing theirfranchise to limit political competition. In both cases, this led to active resistance, which still culminated in the abolitionof their parliaments. Since limiting the franchise had the same objective as dismantling parliament, I use the dates ofthe change in franchise rules in those two cases, which preceded the regime switch by a few years. Jamaica switched toCrown rule in 1865 and Montserrat in 1863.
21For years before the 1890s, at most two copies exist of each Blue Book, one in the issuing colony’s archives and onein the British National Archives, in London, where this data was hand-collected.
9
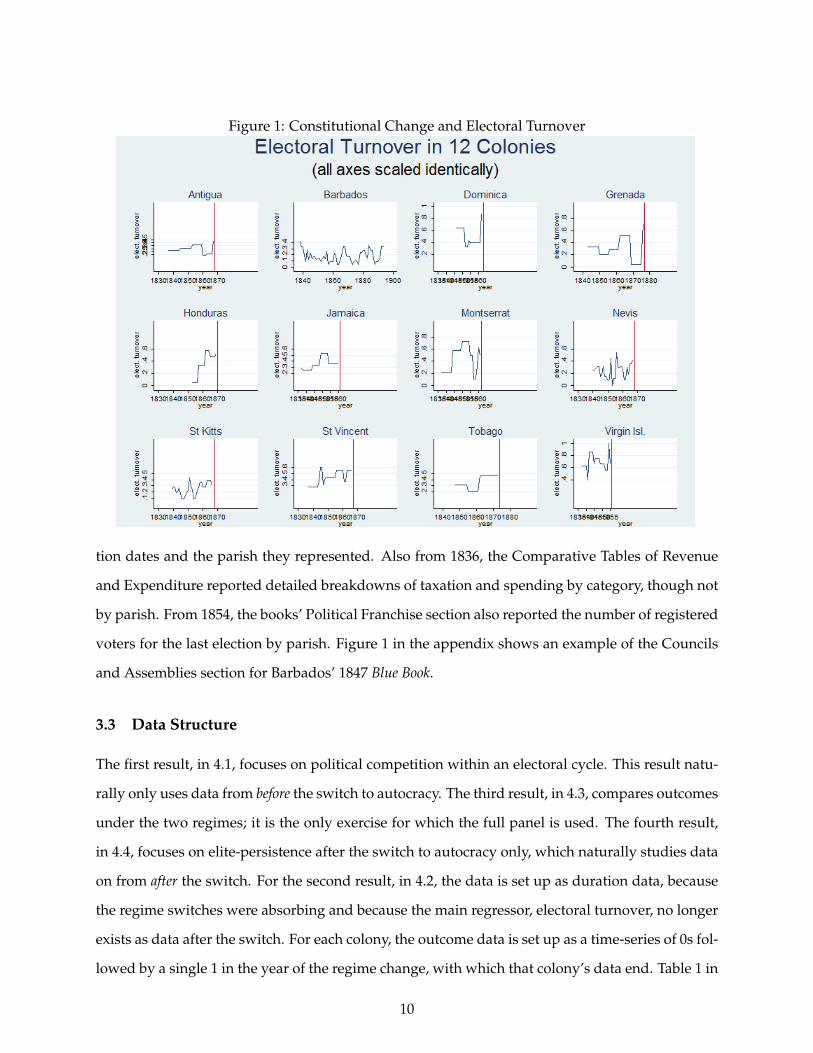
Figure 1: Constitutional Change and Electoral Turnover
tion dates and the parish they represented. Also from 1836, the Comparative Tables of Revenue
and Expenditure reported detailed breakdowns of taxation and spending by category, though not
by parish. From 1854, the books’ Political Franchise section also reported the number of registered
voters for the last election by parish. Figure 1 in the appendix shows an example of the Councils
and Assemblies section for Barbados’ 1847 Blue Book.
3.3 Data Structure
The first result, in 4.1, focuses on political competition within an electoral cycle. This result natu-
rally only uses data from before the switch to autocracy. The third result, in 4.3, compares outcomes
under the two regimes; it is the only exercise for which the full panel is used. The fourth result,
in 4.4, focuses on elite-persistence after the switch to autocracy only, which naturally studies data
on from after the switch. For the second result, in 4.2, the data is set up as duration data, because
the regime switches were absorbing and because the main regressor, electoral turnover, no longer
exists as data after the switch. For each colony, the outcome data is set up as a time-series of 0s fol-
lowed by a single 1 in the year of the regime change, with which that colony’s data end. Table 1 in
10
the appendix illustrates the structure of duration data for Antigua’s 1853, 1860 and 1867 elections,
ending in the regime change.
3.4 Measuring Political Competition
Electoral turnover suffers from several deficiencies as a measure of political competition. On the
one hand, some turnover within the elite is likely. On the other hand, an increase in political com-
petition could take the form of a one-time permanent entry of competitors into politics, followed
by limited subsequent electoral turnover. Unfortunately, electoral turnover is the only available
measure of political competition in this data.22 Fortunately, two better measures of political com-
petition are available for sub-samples of the data, and can be correlated with electoral competition
for those sub-samples as a validity check. The first measure is the franchise (the number of voters
per capita). Franchise data was only reported after 1854, which leaves too short a panel to be use-
ful for estimation at the colony level. But at the sub-colony parish level, the cross-sectional sample
size is increased to over 100, which gives enough power to test for a partial correlation between
the franchise and electoral turnover at the parish level. The second measure is political entry. To
assess the flow of entrants into politics, one needs to accurately measure the stock of established
political families from a reasonably long prior history, which the Blue Books unfortunately do not
provide. However, for Jamaica only, these data exist in a complete history of Jamaica’s parliament
Roby [1831].
In correlating franchise and electoral turnover at the parish level, I can compare data within
parishes over time or within a colony (and electoral cycle) across parishes. The following regres-
sion nests both comparisons:
electoral turnoverip,el−cycle = γlog(reg. voters)ip,el−cycle + ϕip + φel−cycle + εipt, (1)
where φel−cycle are colony-specific electoral-cycle fixed effects and ϕip are fixed effects for parish
p in colony i. Colony-specific electoral-cycle fixed effects are more conservative than colony fixed
effects because they imply a comparison of parishes across a given colony only within the same
electoral cycle. Columns 1 and 2 in Table 2 show that electoral turnover and the franchise are
22The Blue Books do not provide enough additional information about the listed politicians to infer their politicalaffiliation. Similarly, there is no obvious way to link names to race or economic class.
11

Table 2: Does Electoral Turnover Measure Political Competition
Dependent: log(reg. voters/population) Number of political newcomersin one electoral cycle in Jamaica
(1) (2) (3)
Elect.Turnover 0.258*** 0.137** 28.770***(2.646) (2.164) (3.245)
Unit of observation parish-year parish-year Jamaican elections 1800-1865fixed effects: parish parish & el.cycle
Observations 1,363 1,363 14R2 0.891 0.948 0.467Note:Thistablesvalidateelectoralturnoverasameasureofpoliticalcompetition,usingtwoadditionaldata‐sources.Incolumns1‐2,electoralturnoverisrelatedtothefranchise(percapitaregisteredvoters)attheparishlevel,fromthe BlueBooks.10%‐pointshigherelectoralturnoverisassociatedwitha1.5%‐3%highernumberofvoters(Thefranchise‐datawasreportedonlyafter1854,socannotbeusedtoexplainregimechangesatthecolonylevel.)Column3usesRoby's(1831)historyofJamaicanparliamenttorelatethenumberofnamesthatappearedforthefirsttimeevertoelectoralturnoverinthatelectoralcycle.10%‐pointshigherelectoralturnoverisassociatedwiththeentranceof3newpoliticalfamilies.(Thismeasureofentranceintopoliticsrequiresdataonthefullpreviouspoliticalhistory,onlyavailableforJamaica.)Incolumns1‐2,s.e.aretwo‐wayclusteredattheparishandthecolony‐electoralcyclelevel.InColumn3,s.e.arenotclustered.
significantly positively correlated, whether I compare only within-parish over time in column 1
or within-parish over time and across parishes within a colony in column 2. Electoral turnover
falls between 0 and 1 so Table 2 says that 10 percentage-points higher electoral turnover is asso-
ciated with a 1.5% - 3% higher number of voters. Column 3 is more straightforward because the
number of observations is limited to the 14 elections that took place in Jamaica from 1800 to 1865.
A simple regression of entry on electoral turnover shows a strong correlation between the two.
10 percentage-points higher electoral turnover is associated with the entrance of 3 new political
families. In combination, these results thus lend considerable credence to electoral turnover as a
measure of political competition, in the specific context studied here.
4 Four Key Results
4.1 Evidence of Political Pressure on Elites in the Lead-Up to the Regime Switch
If political competition from freedmen had real bite, then politicians should have had to cater to
freedmen in election years, leading to electoral cycles (Besley and Case [1995]). The historical
record suggests that the interests of the freedmen and the elite were conflicting on several dimen-
sions, including taxation sources, land redistribution, and public spending (Holt [1991, ch. 7]). I
focus on public spending because this is the only one of these dimensions on which there is data
12
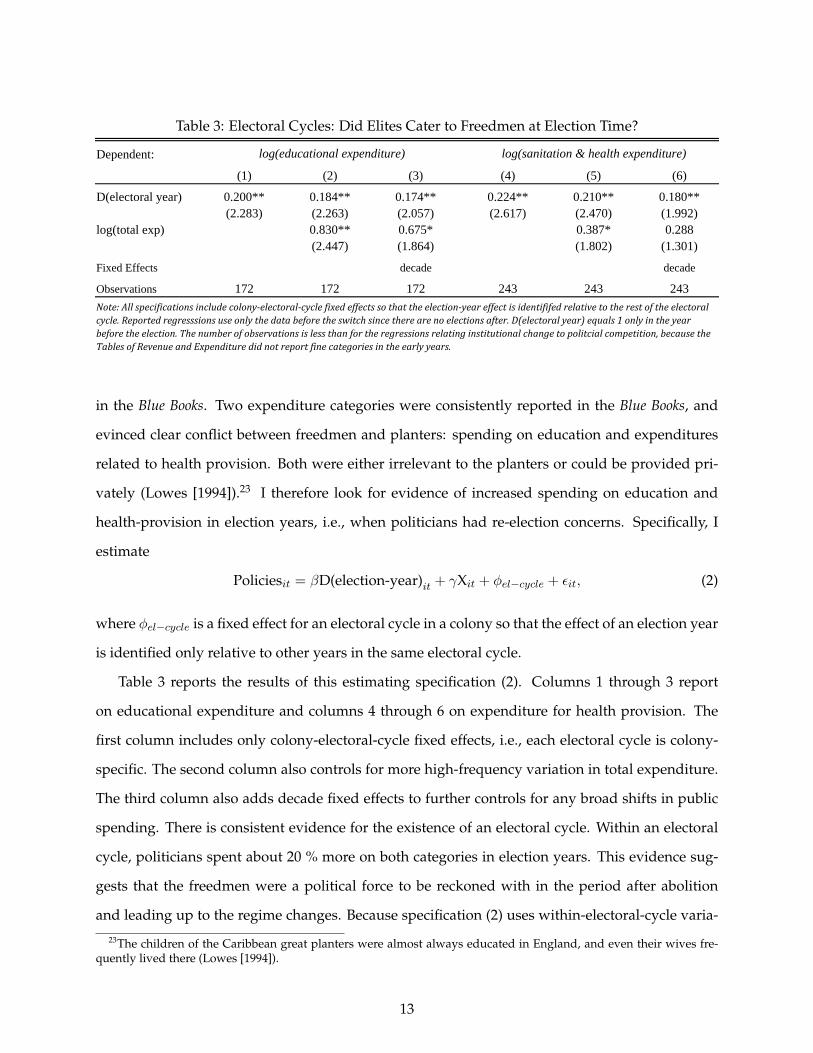
Table 3: Electoral Cycles: Did Elites Cater to Freedmen at Election Time?
Dependent: log(educational expenditure) log(sanitation & health expenditure)
(1) (2) (3) (4) (5) (6)
D(electoral year) 0.200** 0.184** 0.174** 0.224** 0.210** 0.180**(2.283) (2.263) (2.057) (2.617) (2.470) (1.992)
log(total exp) 0.830** 0.675* 0.387* 0.288(2.447) (1.864) (1.802) (1.301)
Fixed Effects decade decade
Observations 172 172 172 243 243 243Note:Allspecificationsincludecolony‐electoral‐cyclefixedeffectssothattheelection‐yeareffectisidentififedrelativetotherestoftheelectoralcycle.Reportedregresssionsuseonlythedatabeforetheswitchsincetherearenoelectionsafter.D(electoralyear)equals1onlyintheyearbeforetheelection.Thenumberofobservationsislessthanfortheregressionsrelatinginstitutionalchangetopolitcialcompetition,becausetheTablesofRevenueandExpendituredidnotreportfinecategoriesintheearlyyears.
in the Blue Books. Two expenditure categories were consistently reported in the Blue Books, and
evinced clear conflict between freedmen and planters: spending on education and expenditures
related to health provision. Both were either irrelevant to the planters or could be provided pri-
vately (Lowes [1994]).23 I therefore look for evidence of increased spending on education and
health-provision in election years, i.e., when politicians had re-election concerns. Specifically, I
estimate
Policiesit = βD(election-year)it + γXit + φel−cycle + εit, (2)
where φel−cycle is a fixed effect for an electoral cycle in a colony so that the effect of an election year
is identified only relative to other years in the same electoral cycle.
Table 3 reports the results of this estimating specification (2). Columns 1 through 3 report
on educational expenditure and columns 4 through 6 on expenditure for health provision. The
first column includes only colony-electoral-cycle fixed effects, i.e., each electoral cycle is colony-
specific. The second column also controls for more high-frequency variation in total expenditure.
The third column also adds decade fixed effects to further controls for any broad shifts in public
spending. There is consistent evidence for the existence of an electoral cycle. Within an electoral
cycle, politicians spent about 20 % more on both categories in election years. This evidence sug-
gests that the freedmen were a political force to be reckoned with in the period after abolition
and leading up to the regime changes. Because specification (2) uses within-electoral-cycle varia-
23The children of the Caribbean great planters were almost always educated in England, and even their wives fre-quently lived there (Lowes [1994]).
13
tion, as opposed to within-colony, standard errors should be clustered at the electoral-cycle level.
And with 163 electoral cycles in the data, there should not be an issue with the asymptotics of
clustering (Cameron and Miller [2013]). Indeed the p-values for wild-bootstrapped standard er-
rors (clustered at the colony level), are 0.000 and 0.0033 in columns 2 and 5 respectively.24 This is
smaller than the p-values of 0.0266 and 0.0150, obtained with standard clustering at the electoral-
cycle level.
4.2 Did Political Competition Cause Regime Switches to Autocracy
To test the main hypothesis that regime changes to autocracy were elites’ defense against political
competition, I regress
Regime Switchit = βpolitical competitionit + φi + φt + εit, (3)
where the dependent Regime Switchit takes value 1 in the year when the switch occurs and value
0 in all years before then.25 Political competition is measured by electoral turnover, φi are colony
fixed effects, and φt measures a time-trend in several different ways across specifications. Because
Figure 1 displayed both considerable cross-sectional and time-series variation in electoral compe-
tition, I separately report pooled cross-sectional results (without φi) in table 4, and fixed-effects
results in table 5.
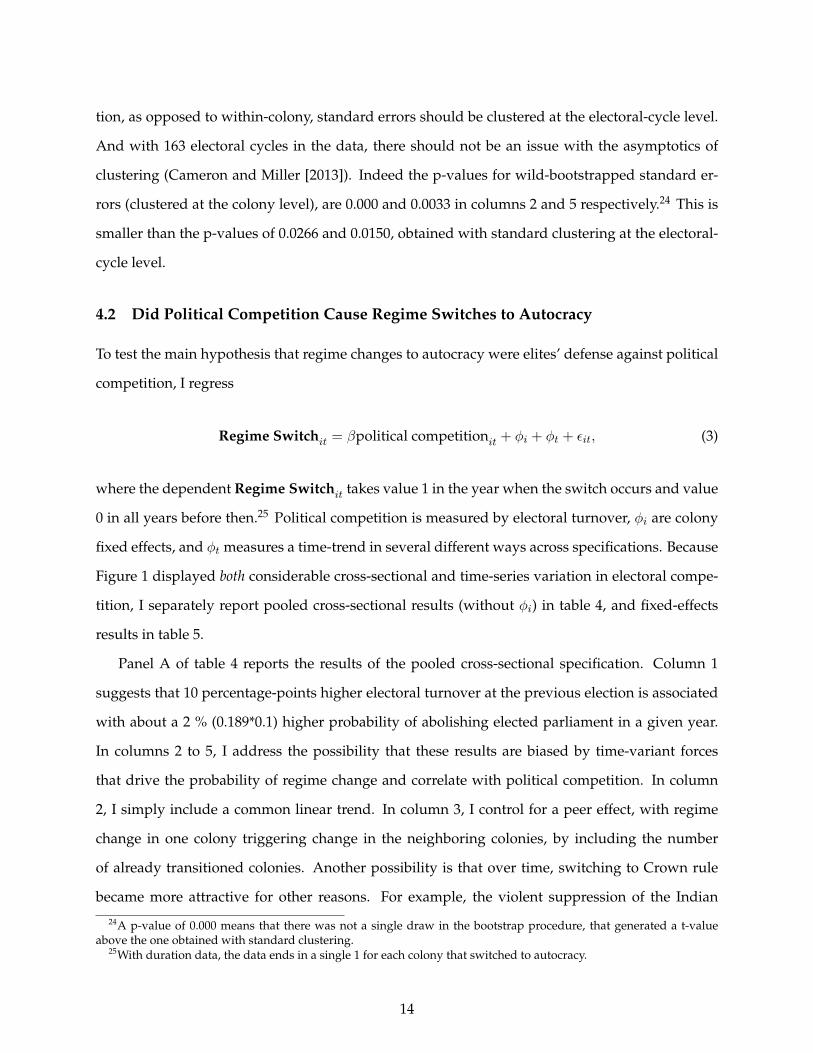
Panel A of table 4 reports the results of the pooled cross-sectional specification. Column 1
suggests that 10 percentage-points higher electoral turnover at the previous election is associated
with about a 2 % (0.189*0.1) higher probability of abolishing elected parliament in a given year.
In columns 2 to 5, I address the possibility that these results are biased by time-variant forces
that drive the probability of regime change and correlate with political competition. In column
2, I simply include a common linear trend. In column 3, I control for a peer effect, with regime
change in one colony triggering change in the neighboring colonies, by including the number
of already transitioned colonies. Another possibility is that over time, switching to Crown rule
became more attractive for other reasons. For example, the violent suppression of the Indian
24A p-value of 0.000 means that there was not a single draw in the bootstrap procedure, that generated a t-valueabove the one obtained with standard clustering.
25With duration data, the data ends in a single 1 for each colony that switched to autocracy.
14
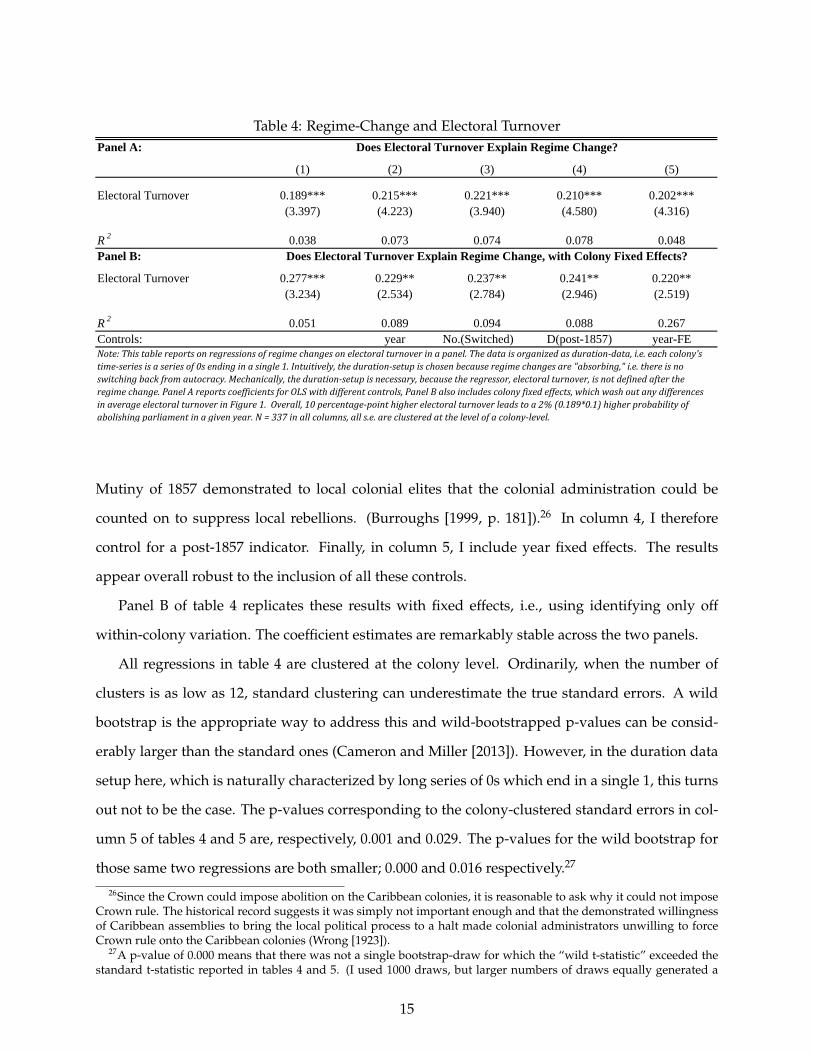
Table 4: Regime-Change and Electoral TurnoverPanel A: Does Electoral Turnover Explain Regime Change?
(1) (2) (3) (4) (5)
Electoral Turnover 0.189*** 0.215*** 0.221*** 0.210*** 0.202***(3.397) (4.223) (3.940) (4.580) (4.316)
R 2 0.038 0.073 0.074 0.078 0.048Panel B: Does Electoral Turnover Explain Regime Change, with Colony Fixed Effects?
Electoral Turnover 0.277*** 0.229** 0.237** 0.241** 0.220**(3.234) (2.534) (2.784) (2.946) (2.519)
R 2 0.051 0.089 0.094 0.088 0.267Controls: year No.(Switched) D(post-1857) year-FENote:Thistablereportsonregressionsofregimechangesonelectoralturnoverinapanel.Thedataisorganizedasduration‐data,i.e.eachcolony'stime‐seriesisaseriesof0sendinginasingle1.Intuitively,theduration‐setupischosenbecauseregimechangesare"absorbing,"i.e.thereisnoswitchingbackfromautocracy.Mechanically,theduration‐setupisnecessary,becausetheregressor,electoralturnover,isnotdefinedaftertheregimechange.PanelAreportscoefficientsforOLSwithdifferentcontrols,PanelBalsoincludescolonyfixedeffects,whichwashoutanydifferencesinaverageelectoralturnoverinFigure1.Overall,10percentage‐pointhigherelectoralturnoverleadstoa2%(0.189*0.1)higherprobabilityofabolishingparliamentinagivenyear.N=337inallcolumns,alls.e.areclusteredatthelevelofacolony‐level.
Mutiny of 1857 demonstrated to local colonial elites that the colonial administration could be
counted on to suppress local rebellions. (Burroughs [1999, p. 181]).26 In column 4, I therefore
control for a post-1857 indicator. Finally, in column 5, I include year fixed effects. The results
appear overall robust to the inclusion of all these controls.
Panel B of table 4 replicates these results with fixed effects, i.e., using identifying only off
within-colony variation. The coefficient estimates are remarkably stable across the two panels.
All regressions in table 4 are clustered at the colony level. Ordinarily, when the number of
clusters is as low as 12, standard clustering can underestimate the true standard errors. A wild
bootstrap is the appropriate way to address this and wild-bootstrapped p-values can be consid-
erably larger than the standard ones (Cameron and Miller [2013]). However, in the duration data
setup here, which is naturally characterized by long series of 0s which end in a single 1, this turns
out not to be the case. The p-values corresponding to the colony-clustered standard errors in col-
umn 5 of tables 4 and 5 are, respectively, 0.001 and 0.029. The p-values for the wild bootstrap for
those same two regressions are both smaller; 0.000 and 0.016 respectively.27
26Since the Crown could impose abolition on the Caribbean colonies, it is reasonable to ask why it could not imposeCrown rule. The historical record suggests it was simply not important enough and that the demonstrated willingnessof Caribbean assemblies to bring the local political process to a halt made colonial administrators unwilling to forceCrown rule onto the Caribbean colonies (Wrong [1923]).
27A p-value of 0.000 means that there was not a single bootstrap-draw for which the “wild t-statistic” exceeded thestandard t-statistic reported in tables 4 and 5. (I used 1000 draws, but larger numbers of draws equally generated a
15

To strengthen the claim of a causal link between electoral turnover and the probability of
regime change, I next explore the underlying causes of the panel-variation in electoral turnover,
that drives the results in table 4. This paper’s argument is that the increase in political competition
– measured by electoral turnover – was linked to freedmen being increasingly successful at getting
their votes registered, and, further, that the degree to which political competition increased was
determined by how easily freedmen could obtain the land needed to register their vote. Based on
this causal chain, the historical record strongly suggests the introduction of the Caribbean Incum-
bered Estate Act (IEA) as an exogenous shock that increased political competition by increasing
land transactions (Lowes [1994]).
The historical record further suggests the differential impact of the IEA on different islands as
an underlying driver of the differential increase in electoral competition. Before the IEA was im-
plemented across the Caribbean in 1854, many estates were already bankrupt because of increased
labor costs imposed by abolition. However, until then, a bankrupt plantation’s debt was insep-
arable from its owner’s other assets. If an estate was worth 20,000 pounds but indebted to the
amount of 30,000, its owner still had to cover the remainder after the estate’s sale. Consequently,
many estate owners held on to their bankrupt estates, and, while there was pervasive squatting
by freedmen on abandoned plantations, this did not give the legal title required for registering a
vote. The IEA resolved this bottleneck by clearing estates’ owners of any remaining liabilities after
selling incumbered estates.28 However, this effect of the IEA varied by islands, its impact depend-
ing largely on the profitability of estates. Where plantations remained profitable after abolition,
the IEA had little impact (Lowes [1994]). The key cross-sectional characteristic which determined
plantations’ profitability was the cost of labor, which in turn depended on freedmen’s options out-
side of estate work. Where there was little land, there were limited outside options, labor remained
cheap and estates profitable (Dippel et al. [2014]).29 The importance of density is well-illustrated
by the case of Barbados. Barbados was the only one of the 12 Caribbean plantation colonies that
did not abolish its parliament, it had the lowest average electoral turnover of all the colonies, and
it was more than twice as dense as any other Caribbean colony. (See Figure 1 and table 1.)
p-value of 0.000.28Essentially the same legal arrangement as in those U.S. states that have “non-recourse” bankruptcy laws today.29Dippel et al. [2014] study Caribbean labor markets. They provide a model of coercion in which plantation workers’
outside options and plantations’ profitability a jointly determined by underlying geographic factors, and they providedetailed historical accounts of the functioning of these labor markets and the Caribbean plantations.
16

Tabl
e5:
Exog
enou
sV
aria
tion
Und
erly
ing
the
Cha
nges
inEl
ecto
ralT
urno
ver
and
Polit
ical
Reg
ime
(1)
(2)
(3)
(4)
(5)
(6)
(7)
(8)
(9)
(10)
Pane
l A:
Did
the
Intr
oduc
tion
of th
e IE
A c
ause
Reg
ime
Cha
nge,
but
less
so W
here
Elit
es h
ad M
ore
Con
trol
? (T
he "
Red
uced
For
m")
D(I
EA)
0.09
8***
0.06
20.
080*
*0.
060.
100*
*0.
108*
**0.
063
0.08
6*0.
063
0.14
1***
(5.2
56)
(1.7
72)
(2.6
47)
(1.7
57)
(2.3
05)
(4.4
93)
(1.3
79)
(2.1
49)
(1.6
02)
(3.4
64)
D(I
EA)*
1836
-den
sity
-0.0
39**
*-0
.055
***
-0.0
61**
*-0
.043
***
-0.0
45**
-0.0
41**
-0.0
61**
*-0
.069
***
-0.0
46**
-0.0
54*
(-3.
469)
(-5.
631)
(-4.
774)
(-3.
474)
(-2.
305)
(-2.
604)
(-4.
089)
(-3.
716)
(-2.
651)
(-2.
052)
R2
0.05
20.
068
0.07
70.
061
0.24
20.
059
0.07
60.
090
0.06
90.
254
Pane
l B:
Did
the
IEA
Incr
ease
Ele
ctor
al T
urno
ver,
but
Les
s so
whe
re E
lites
had
Mor
e C
ontr
ol?
(The
"Fi
rst S
tage
")
D(I
EA)
0.05
70.
033
0.05
50.
046
0.14
8*0.
047
0.00
60.
039
0.00
90.
278*
**(1
.326
)(0
.741
)(1
.351
)(0
.928
)(1
.862
)(1
.304
)(0
.128
)(1
.096
)(0
.227
)(4
.566
)D
(IEA
)*18
36-d
ensi
ty-0
.104
***
-0.1
16**
*-0
.107
***
-0.1
05**
*-0
.110
***
-0.0
24-0
.061
*-0
.044
-0.0
30-0
.056
**(-
6.98
8)(-
4.95
7)(-
4.53
5)(-
7.54
9)(-
5.84
0)(-
1.14
2)(-
2.12
9)(-
1.41
7)(-
1.32
3)(-
2.69
2)
R2
0.11
30.
119
0.11
40.
114
0.21
40.
488
0.51
20.
498
0.49
60.
618
Pane
l C:
IV e
stim
ates
Elec
tora
l Tur
nove
r0.
376*
**0.
491*
**0.
570*
**0.
409*
**0.
408*
**2.
303
1.52
1**
2.07
92.
062
1.44
3**
(5.2
22)
(7.5
26)
(6.0
90)
(4.7
86)
(3.6
12)
(1.1
89)
(2.4
40)
(1.6
30)
(1.3
21)
(2.4
08)
Wea
k-In
stru
men
t F-T
est
11.7
46.
664
4.39
211
.06
12.0
21.
304
4.53
32.
009
1.75
07.
248
Con
trols
:ye
arN
o.(S
witc
hed)
D(p
ost-1
857)
year
-FE
year
No.
(Sw
itche
d)D
(pos
t-185
7)ye
ar-F
EC
olon
y Fi
xed
Effe
cts
Yes
Yes
Yes
Yes
Yes
Note:Thistablespresentstheresultsfrom
theinstrumentalvariableexercise,dividedintoa"reducedform"regressionofregimechangeontheinstruments(PanelA),the"firststage"regressionofturnoveronthe
instruments(PanelB),andtheIVregressionofregimechangeoninstrumenedturnover(PanelC).PanelsDtoFreplicatepanelsAtoC,withcolony‐fixedeffectsincluded.Althoughthecoefficienton"D(IEA)"isreported
asamatterofseparateinterest,onlytheinteractionterm
"D(IEA)*1836‐density"istreatedasanexcludeableinstrumentinPanelCandF.Thenum
berofobservationsis337inallspecifications.Alls.e.areclusteredat
thecolonylevel.
17
Motivated by this background, table 5 shows how the introduction of the IEA related to the
timing and instance of the regime changes, as well as to electoral turnover, and how this relation-
ship depended on density. Across columns, columns 1 – 5 are organized like table 4, incrementally
introducing the same controls, while columns 6 – 10 do the same but further add colony fixed ef-
fects as in Panel B of table 4. In table 5, Panel A reports the effect of D(IEA) (time–varying) and
“D(IEA) · 1836-density” (time-and-colony-varying) on the likelihood of regime change. Panel B
reports the effect of D(IEA) and “D(IEA) · 1836-density” on electoral turnover. If one is will-
ing to assume that D(IEA) and “D(IEA) · 1836-density” impacted regime change only through
their effect on electoral turnover, then one can instrument electoral turnover with D(IEA) and
“D(IEA) · 1836-density.” A somewhat weaker assumption, and the one on which I report here,
is that D(IEA), which is essentially a post-1854 break, may have correlated with other unobserv-
able factors influencing regime change, but that the interaction “D(IEA) · 1836-density” impacted
regime change only through electoral turnover. (This implies D(IEA) is treated as a control vari-
able and “D(IEA)·1836-density” as the instrument.) Under this assumption, I also report IV results
in Panel C of table 5.
Panel A shows that the introduction of the IEA was indeed associated with a higher probability
of regime change, and that this was more true in islands that were less dense, i.e., where more
land was freed up by the IEA. The results for D(IEA) are weakest in columns 4 and 9, which
allows for a trend break after the Indian Mutiny. This is not surprising because columns 4 and 9
amount to a “horserace” between a post-1854 and a post-1857 indicator. Overall, more credence
should be given to the interactions term “D(IEA) · 1836-density,” which remains significant to all
specifications. Panel B shows that the introduction of the IEA was also associated with higher
electoral turnover, although these results are not very strong with colony fixed effects. The IV
results in panel C also broadly confirm the previous results, although the results with colony fixed
effects are again much weaker. While the IV results should be taken with a grain of salt because
of the relatively strong assumptions needed to interpret them literally, it is worth noting that the
IV results are about twice as large as those in table 4, suggesting that 10 percentage-points higher
electoral turnover increased the likelihood of abolishing parliament by between 4 and 20 % in a
given year. A plausible interpretation of these larger IV estimates is that the IV better isolates the
part of electoral turnover that truly represents political competition.
18
Overall, the results in all three panels of table 5 are consistent with the logic of the paper’s argu-
ment that increasing electoral turnover caused preemptive regime changes, and with the historical
record which suggests that the rate at which electoral turnover increased depended at least in part
on external factors like changing legal conditions and their interaction with islands’ geography.
4.3 The Consequences of Regime Change
Next, I investigate the consequences of abolishing parliament. Because of the endogeneity of the
regime-switch, the time-window just around it is of separate interest here. For example, it is
possible that elites strategically delayed utilizing the regime change in order to secure a smooth
transition to the new regime. To pick up such transition-patterns in addition to the level effect of
autocracy, I regress
Policiesit = βAutocracyit +
2∑k=−3
λkRegime-Switchit+k + φt + θi + εit, (4)
where Policiesit are the two measures of expenditure, on education or health. The main coefficient
of interest is on autocracyit, which estimates the permanent effect of the regime switch; it turns from
0 to 1 on the year of the regime change, and stays at 1 afterward.∑2
k=−3 λkRegime-Switchit+k is
a set indicators for the 6 years around the year of the change.30 Lastly, θi are colony fixed effects,
and the counter-factual time-trend φt is modeled with either year fixed effects only or year fixed
effects plus a colony-specific linear trend. Table 6 shows the results of estimating specification
(4). The first two columns consider educational expenditure, the next two expenditure on health-
provision. All columns include colony and year fixed effects and columns 2 and 4 add colony-
specific linear trends. The permanent effect of abolishing parliament appears to have reduced
educational expenditure by about 50 percent and reduced expenditure for health-related public
goods by about 30 percent while the estimates in Table 6 suggest that it increased by about 20 per-
30I show a window of six years because the only significant movement is in the four years around the change, andcoefficients get monotonically less significant away from the regime switch.
19
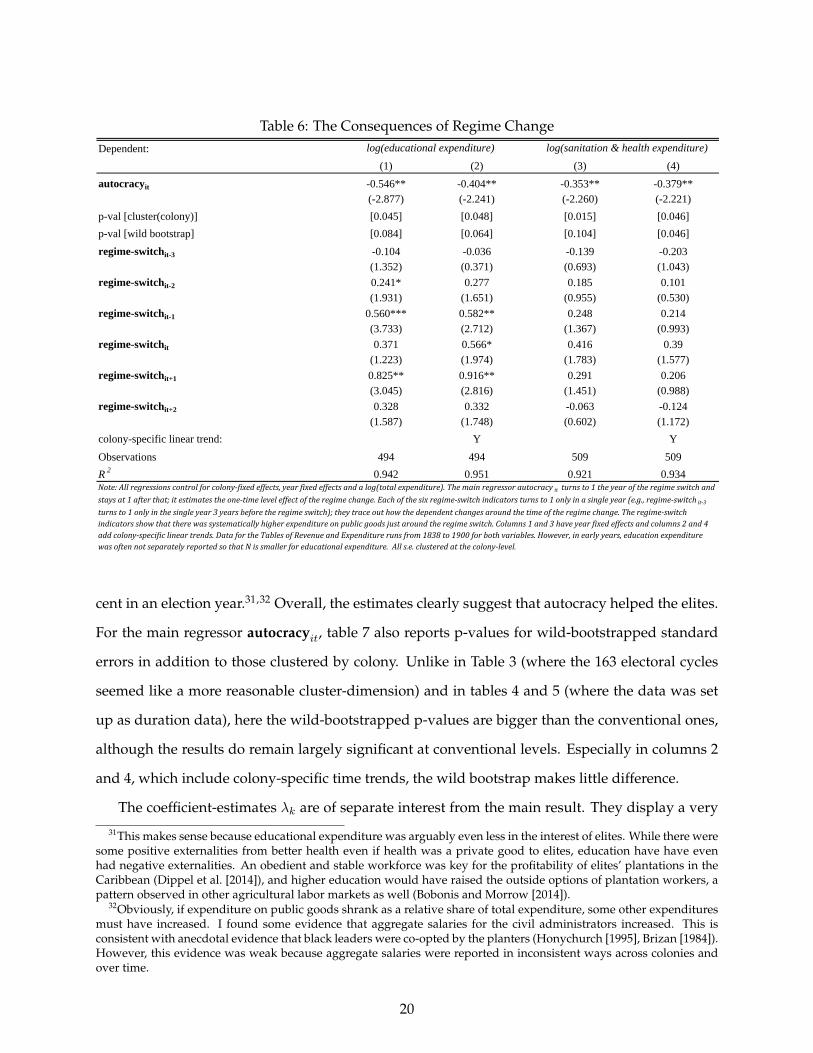
Table 6: The Consequences of Regime ChangeDependent: log(educational expenditure) log(sanitation & health expenditure)
(1) (2) (3) (4)
autocracyit -0.546** -0.404** -0.353** -0.379**(-2.877) (-2.241) (-2.260) (-2.221)
p-val [cluster(colony)] [0.045] [0.048] [0.015] [0.046]
p-val [wild bootstrap] [0.084] [0.064] [0.104] [0.046]
regime-switchit-3 -0.104 -0.036 -0.139 -0.203(1.352) (0.371) (0.693) (1.043)
regime-switchit-2 0.241* 0.277 0.185 0.101(1.931) (1.651) (0.955) (0.530)
regime-switchit-1 0.560*** 0.582** 0.248 0.214(3.733) (2.712) (1.367) (0.993)
regime-switchit 0.371 0.566* 0.416 0.39(1.223) (1.974) (1.783) (1.577)
regime-switchit+1 0.825** 0.916** 0.291 0.206(3.045) (2.816) (1.451) (0.988)
regime-switchit+2 0.328 0.332 -0.063 -0.124(1.587) (1.748) (0.602) (1.172)
colony-specific linear trend: Y Y
Observations 494 494 509 509
R 2 0.942 0.951 0.921 0.934Note:Allregressionscontrolforcolony‐fixedeffects,yearfixedeffectsandalog(totalexpenditure).Themainregressorautocracy it turnsto1theyearoftheregimeswitchand
staysat1afterthat;itestimatestheone‐timeleveleffectoftheregimechange.Eachofthesixregime‐switchindicatorsturnsto1onlyinasingleyear(e.g.,regime‐switch it‐3turnsto1onlyinthesingleyear3yearsbeforetheregimeswitch);theytraceouthowthedependentchangesaroundthetimeoftheregimechange.Theregime‐switchindicatorsshowthattherewassystematicallyhigherexpenditureonpublicgoodsjustaroundtheregimeswitch.Columns1and3haveyearfixedeffectsandcolumns2and4addcolony‐specificlineartrends.DatafortheTablesofRevenueandExpenditurerunsfrom1838to1900forbothvariables.However,inearlyyears,educationexpenditurewasoftennotseparatelyreportedsothatNissmallerforeducationalexpenditure.Alls.e.clusteredatthecolony‐level.
cent in an election year.31,32 Overall, the estimates clearly suggest that autocracy helped the elites.
For the main regressor autocracyit, table 7 also reports p-values for wild-bootstrapped standard
errors in addition to those clustered by colony. Unlike in Table 3 (where the 163 electoral cycles
seemed like a more reasonable cluster-dimension) and in tables 4 and 5 (where the data was set
up as duration data), here the wild-bootstrapped p-values are bigger than the conventional ones,
although the results do remain largely significant at conventional levels. Especially in columns 2
and 4, which include colony-specific time trends, the wild bootstrap makes little difference.
The coefficient-estimates λk are of separate interest from the main result. They display a very
31This makes sense because educational expenditure was arguably even less in the interest of elites. While there weresome positive externalities from better health even if health was a private good to elites, education have have evenhad negative externalities. An obedient and stable workforce was key for the profitability of elites’ plantations in theCaribbean (Dippel et al. [2014]), and higher education would have raised the outside options of plantation workers, apattern observed in other agricultural labor markets as well (Bobonis and Morrow [2014]).
32Obviously, if expenditure on public goods shrank as a relative share of total expenditure, some other expendituresmust have increased. I found some evidence that aggregate salaries for the civil administrators increased. This isconsistent with anecdotal evidence that black leaders were co-opted by the planters (Honychurch [1995], Brizan [1984]).However, this evidence was weak because aggregate salaries were reported in inconsistent ways across colonies andover time.
20
specific time-path of public-goods provision around the regime change. There was systematically
higher expenditure on public goods from about two years before the change to about two years
after. These results are more clear for education, but also come close to 10% significance for the
other public good category. Educational expenditure, was between 50% and 90% higher in the
three years around the regime switch. This at least strongly suggests that elites strategically de-
layed utilizing the regime change in their favor, in order to secure a smooth transition to the new
regime.
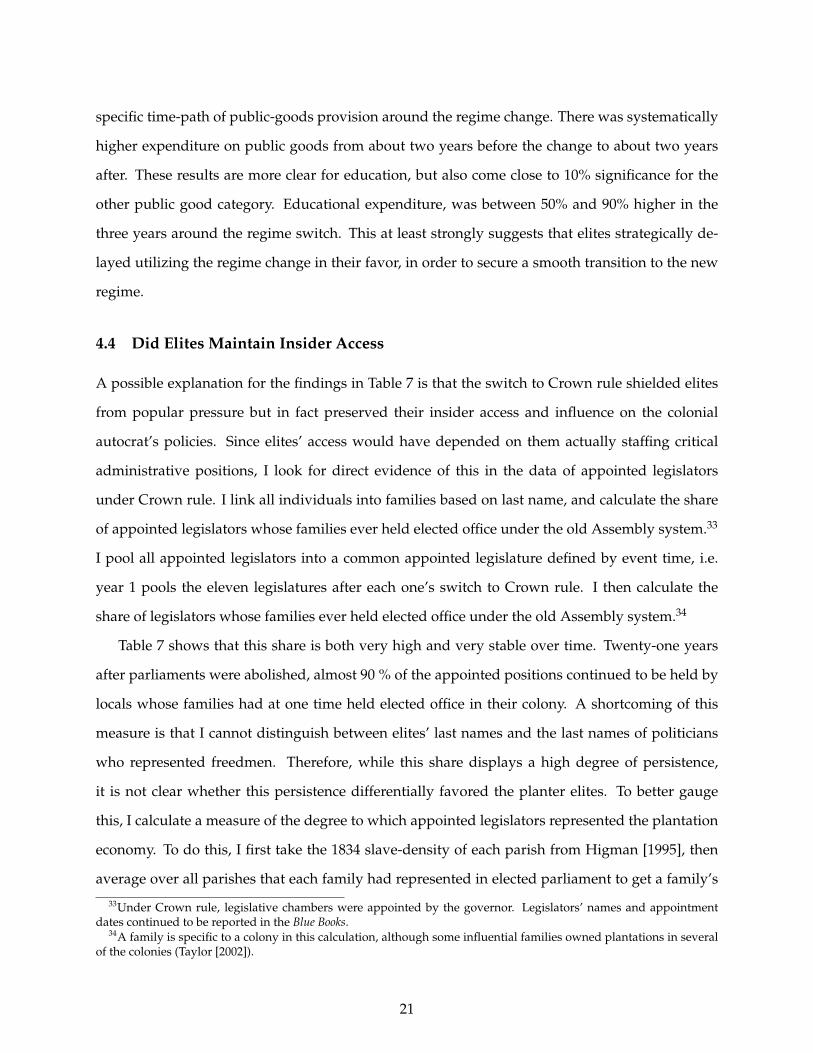
4.4 Did Elites Maintain Insider Access
A possible explanation for the findings in Table 7 is that the switch to Crown rule shielded elites
from popular pressure but in fact preserved their insider access and influence on the colonial
autocrat’s policies. Since elites’ access would have depended on them actually staffing critical
administrative positions, I look for direct evidence of this in the data of appointed legislators
under Crown rule. I link all individuals into families based on last name, and calculate the share
of appointed legislators whose families ever held elected office under the old Assembly system.33
I pool all appointed legislators into a common appointed legislature defined by event time, i.e.
year 1 pools the eleven legislatures after each one’s switch to Crown rule. I then calculate the
share of legislators whose families ever held elected office under the old Assembly system.34
Table 7 shows that this share is both very high and very stable over time. Twenty-one years
after parliaments were abolished, almost 90 % of the appointed positions continued to be held by
locals whose families had at one time held elected office in their colony. A shortcoming of this
measure is that I cannot distinguish between elites’ last names and the last names of politicians
who represented freedmen. Therefore, while this share displays a high degree of persistence,
it is not clear whether this persistence differentially favored the planter elites. To better gauge
this, I calculate a measure of the degree to which appointed legislators represented the plantation
economy. To do this, I first take the 1834 slave-density of each parish from Higman [1995], then
average over all parishes that each family had represented in elected parliament to get a family’s
33Under Crown rule, legislative chambers were appointed by the governor. Legislators’ names and appointmentdates continued to be reported in the Blue Books.
34A family is specific to a colony in this calculation, although some influential families owned plantations in severalof the colonies (Taylor [2002]).
21

Table 7: Measured Elite Persistence
Years Since Switch to Autocracy (Crown Rule): 3 6 9 12 18 21
Share Appointees from Elected Families: 87.04 88.33 91.23 91.04 90.32 86.67
Slave-Density of Appointee's Former Elective Parishes: 3.19 2.66 2.55 2.56 2.64 2.53(relative to equal representation)Note:Thistablereportstwomeasuresofpersistence,in3‐yearstepsaftertheswitchtoCrownrule.BothmeasuresarecalculatedbypoolingallappointedlegislatorsaftertheswitchtoCrownruleintoonelegislatureandcalculatingsharessothatallappointedlegislatorsofall11coloniesarerepresentedineachyear."AppointeesfromElectedFamilies"arethosewhosefamilyhadheldanassemblyseatatanytimebeforeacolony'sabolitionofitsassembly.Toconstructthesecondmeasure,Icalculateforeachparishitsslave‐density(#slaves/area)in1836,relativetothecolony‐average.Thisproxiesforthedominanceoftheplantation‐systeminaparish,andisdividedbythecolonyaveragetomakeitcomparableacrosscolonies.Thetablereportstheaverageofthisrelativeslave‐densityacrossallappointedlegislatures.
“implied” slave-density.35 For each year since the regime change, I then average this family-
specific measure over all appointed legislators across colonies. If this average is larger than 1, then
plantation districts are systematically over-represented across colonies. Table 7 shows that this
measure remains very stable at around 2.5 over the two decades after parliaments were abolished.
This evidence suggests that the planters continued to wield disproportionate influence over policy
making long after the regime changes.
5 Discussion
5.1 Alternative Responses
While the evidence in sections 4.3 and 4.4 suggests that the regime switches did help the planter
elites, it is nonetheless important to ask whether they could not have pursued other options to
limit political competition. An obvious choice may have been changes in franchise rules, like
those adopted in the U.S. South.36 Caribbean planters did try this to some extent: Craton [1997,
p. 392] argues that “there were organized efforts to evict peasants from the land throughout the
Caribbean,” and McLewin [1987, p. 189] argues that “assemblies brought into law an umbrella of
coercive acts with the purpose of creating a landless peasantry.”37 There is also some evidence of
electoral engineering: Holt [1991, p. 244] recounts how in Jamaica, “in 1844, governor Elgin called
for early elections to blunt the registration drive. Yet, when the new assemblymen convened, there
35I normalize this measure by a colony’s total slave-density to create a measure that is comparable across colonies.36See Kousser [1999] for a discussion of disenfranchisement in the post-Reconstruction US South.37For example, “crown land was priced to encourage labor for wages and was chiefly in remote locations and of poor
quality” (Bolland [1981]) and “parochial land taxes pressed hard on small proprietors” (McLewin [1987, p. 184]).
22
were five new colored faces among them.”38
In the end, however, Caribbean planters were constrained in their use both of overt coercion
and of coercive legislation. For one, they did not have the sort of influence in London that South-
ern planters enjoyed in Washington. The colonial office was much more influenced by abolitionists
in London than by Caribbean planters. As a result, the Crown would overrule discriminatory lo-
cal acts with so-called “orders-in-council” (Craig-James [2000, p. 65]).39 Moreover, planters could
scarcely use brute force because their numbers were very low compared to, for example, the U.S.
South.40 The Caribbean lacked the white manpower for an equivalent of the Ku Klux Klan.41
5.2 The Role of the Freedmen
Why did the freedmen accept the regime change to autocracy? The historical record suggests that
black political leaders were aware that abolishing parliament would stunt their political influ-
ence.42 One possibility is that the freedmen’s leaders were at least in part bought off with admin-
istrative positions (Honychurch [1995]). Another possibility is that the freedmen’s leaders could
not prevent it, because the majority of freedmen had genuinely positive expectations of Crown
rule. This was reasonable given that the Crown had imposed the abolition of slavery.43 Perhaps
reflecting this, the switch to Crown rule did not trigger any reported unrest, although rioting
was overall a fairly common form of resistance to oppression (Morrell and Parker [1969, p. 396],
Dookhan [1977, p. 114]).44 Given the evidence presented, why did freedmen not mobilize against
Crown rule once it failed to generate favorable outcomes for them? One answer is provided by the
social science literature on mobilization and the coordination of beliefs (Schelling [1980]). Because
38To the extent that such efforts at election-timing were successful, measured electoral competition will underestimatetrue political competition, which would also lead to the OLS coefficients being smaller than the IV coefficients.
39Lowes [1994, ch. 5] writes that “because of pressures from the Colonial Office, a comfortable translation of pre-emancipation legal distinctions into distinctions of skin color was not possible.”
40In the South, a “black county” may have been 50 % black. By contrast, all of the Caribbean plantation colonies weremore than 90 % black.
41Another mechanism for elite control in many rural settings is the paternalism of landlord-tenant relationships(Baland and Robinson [2008]). This mechanism had no bite in the Caribbean precisely because the vote was tied tolegal title to land, so that tenants were excluded from the electorate.
42Hall [1959, p. 262] quotes a black assemblyman in Jamaica: “You and I have been equals, but what will be therespective position of our children? Yours will hardly speak to mine.”
43Further, the three Caribbean colonies that had always been governed under Crown colony rule were perceived asbeing run more in the interests of the freedmen. Laurence [1971, p. 53] writes that “conditions were much better there,as planters never enjoyed the same influence over local government”.
44The 1865 Morant Bay Rebellion was caused by the imprisonment of squatters on an abandoned plantation. It leddirectly to Jamaica’s switch to Crown Colony rule, which actually calmed the unrest (Dookhan [1977, p. 65]).
23
slavery had been specifically designed to undermine such coordination, post-abolition freedmen
did not have many social ties that reached past the individual plantation, making mobilization
difficult (Chay and Munshi [2011]). While this obstacle may have been overcome in the face of
overt oppression, the mere absence of positive change may not have provided the necessary im-
petus required for mobilization (Hacker and Pierson [2011]). Furthermore, freedmen may not
have associated the slow stagnation in public-good provision with the regime switch at all, given
the evidence in section 4.3 that there was a temporary increase in public good provision around
the time of the regime change.
5.3 The Role of the Crown
The identification strategy does not allow me to rule out entirely the possibility that the Crown
was a driving factor behind the abolition of parliament. The Crown clearly did want more control
over its colonies, and it is possible that,it put differential pressure for Crown rule on colonies
where local elites were losing political control. However, the Crown also clearly had objectives
that ran counter to those of the elites. It had imposed abolition against planters’ protests, and
before the regime switches, many planters expressed grave concern that the Crown would side
with the interests of the freedmen by spending on public goods (Will [1970, p. 289], Dookhan
[1977, pp. 70-71, 80]). These concerns were echoed in the Crown’s stated intentions to improve
local public goods and to develop an independent smallholder society (Wrong [1923, pp. 78-79];
Burroughs [1999, pp. 172-173]).45
Yet, the evidence in Table 7 clearly shows that the regime changes did not have these effects.
Overall, the historical record suggests that where the Crown wanted policies that ran counter
to the elites’ interests, its ability to implement these policies was curtailed by the reality on the
ground. This could simply mean for colonial administrators to be socially ostracized. Lewis [2004,
p. 104] writes of the governors’ incentives that “to join with local white society meant a pleasant
tour of duty, to fight them meant political conflict and social ostracism. Inevitably, the governor
passed smoothly into the union, political and social, of government and vested interests.” Or it
could mean more overt push-back. Craig-James [2000, p. 252] recounts a confrontation between
45Henry Taylor, the colonial office’s supervisor of West Indian affairs, publicly chastised the assemblies for being“eminently disqualified for the great task of educating and improving a people newly born to freedom” (Wrong [1923]).
24
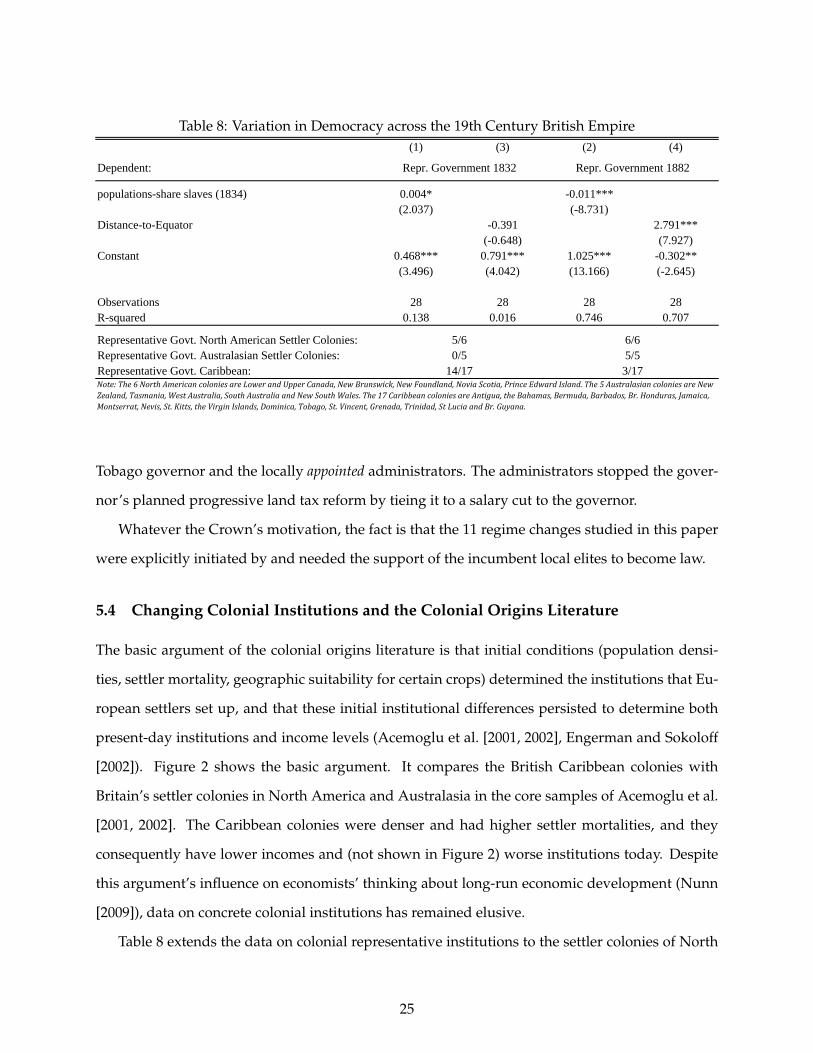
Table 8: Variation in Democracy across the 19th Century British Empire (1) (3) (2) (4)
Dependent: Repr. Government 1832 Repr. Government 1882
populations-share slaves (1834) 0.004* -0.011***(2.037) (-8.731)
Distance-to-Equator -0.391 2.791***(-0.648) (7.927)
Constant 0.468*** 0.791*** 1.025*** -0.302**(3.496) (4.042) (13.166) (-2.645)
Observations 28 28 28 28R-squared 0.138 0.016 0.746 0.707
Representative Govt. North American Settler Colonies: 5/6 6/6Representative Govt. Australasian Settler Colonies: 0/5 5/5Representative Govt. Caribbean: 14/17 3/17Note:The6NorthAmericancoloniesareLowerandUpperCanada,NewBrunswick,NewFoundland,NoviaScotia,PrinceEdwardIsland.The5AustralasiancoloniesareNewZealand,Tasmania,WestAustralia,SouthAustraliaandNewSouthWales.The17CaribbeancoloniesareAntigua,theBahamas,Bermuda,Barbados,Br.Honduras,Jamaica,Montserrat,Nevis,St.Kitts,theVirginIslands,Dominica,Tobago,St.Vincent,Grenada,Trinidad,StLuciaandBr.Guyana.
Tobago governor and the locally appointed administrators. The administrators stopped the gover-
nor’s planned progressive land tax reform by tieing it to a salary cut to the governor.
Whatever the Crown’s motivation, the fact is that the 11 regime changes studied in this paper
were explicitly initiated by and needed the support of the incumbent local elites to become law.
5.4 Changing Colonial Institutions and the Colonial Origins Literature
The basic argument of the colonial origins literature is that initial conditions (population densi-
ties, settler mortality, geographic suitability for certain crops) determined the institutions that Eu-
ropean settlers set up, and that these initial institutional differences persisted to determine both
present-day institutions and income levels (Acemoglu et al. [2001, 2002], Engerman and Sokoloff
[2002]). Figure 2 shows the basic argument. It compares the British Caribbean colonies with
Britain’s settler colonies in North America and Australasia in the core samples of Acemoglu et al.
[2001, 2002]. The Caribbean colonies were denser and had higher settler mortalities, and they
consequently have lower incomes and (not shown in Figure 2) worse institutions today. Despite
this argument’s influence on economists’ thinking about long-run economic development (Nunn
[2009]), data on concrete colonial institutions has remained elusive.
Table 8 extends the data on colonial representative institutions to the settler colonies of North
25
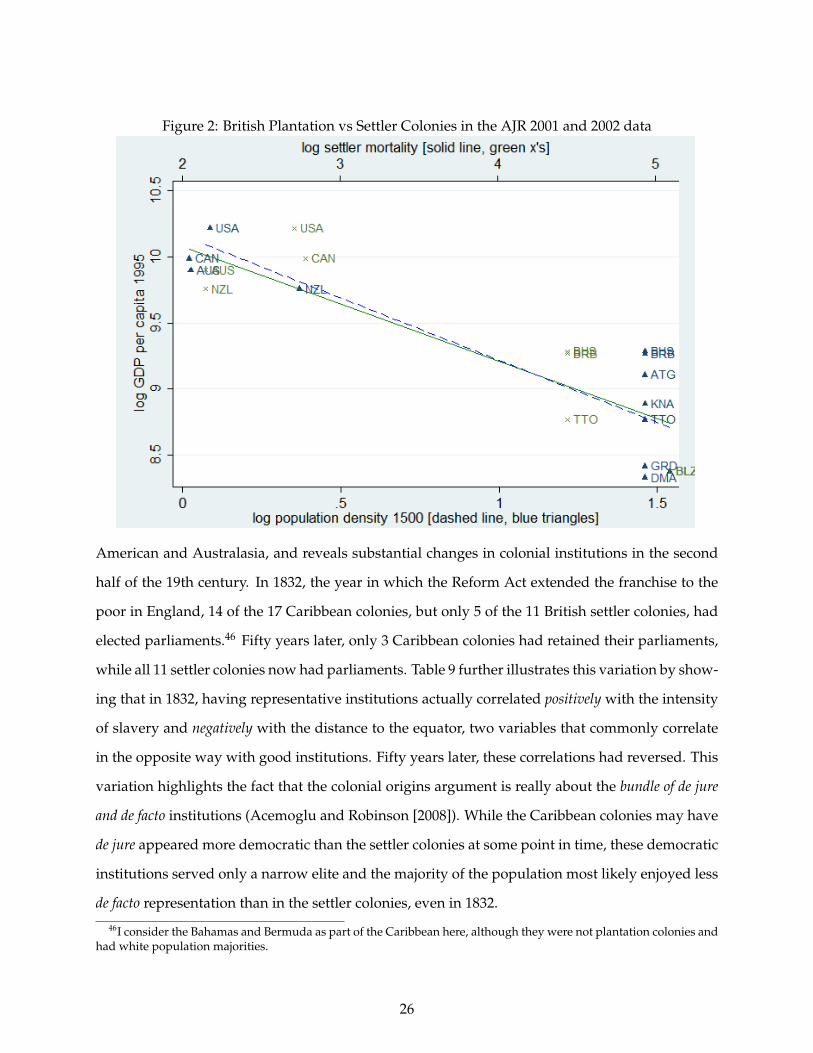
Figure 2: British Plantation vs Settler Colonies in the AJR 2001 and 2002 data
American and Australasia, and reveals substantial changes in colonial institutions in the second
half of the 19th century. In 1832, the year in which the Reform Act extended the franchise to the
poor in England, 14 of the 17 Caribbean colonies, but only 5 of the 11 British settler colonies, had
elected parliaments.46 Fifty years later, only 3 Caribbean colonies had retained their parliaments,
while all 11 settler colonies now had parliaments. Table 9 further illustrates this variation by show-
ing that in 1832, having representative institutions actually correlated positively with the intensity
of slavery and negatively with the distance to the equator, two variables that commonly correlate
in the opposite way with good institutions. Fifty years later, these correlations had reversed. This
variation highlights the fact that the colonial origins argument is really about the bundle of de jure
and de facto institutions (Acemoglu and Robinson [2008]). While the Caribbean colonies may have
de jure appeared more democratic than the settler colonies at some point in time, these democratic
institutions served only a narrow elite and the majority of the population most likely enjoyed less
de facto representation than in the settler colonies, even in 1832.
46I consider the Bahamas and Bermuda as part of the Caribbean here, although they were not plantation colonies andhad white population majorities.
26
6 Conclusion
This paper presents evidence that elites in non-inclusive democracies may prefer to initiate a
regime change to autocracy rather than seeing their political influence become eroded as democ-
racy becomes more broad-based. Because the coups that drive most regime changes are illegal,
who supported them is usually difficult to observe even ex post. This paper’s approach is there-
fore to focus on data on a series of legal regime changes from democracy to autocracy, which
occurred in in the 19th-century British Empire, where local parliaments could vote themselves out
of existence and replace themselves with legislative bodies that would be appointed autocratically
by the colonial administration. The paper’s key findings are that (i) increasing political competi-
tion from freed slaves explained the instance and timing of these voluntary switches to autocracy,
and (ii) that autocracy shielded entrenched elites from the political pressures they were exposed to
under democratic rule. Overall, this paper highlights an unexplored mechanism for why democ-
racies become autocracies and shows that elites that emerged in very limited democracies may be
better able to secure their interests by switching to autocracy.
References
Acemoglu, D., S. Johnson, and J. Robinson (2001). The Colonial Origins of Comparative Develop-ment: An Empirical Investigation. The American Economic Review.
Acemoglu, D., S. Johnson, and J. Robinson (2002). Reversal of Fortune: Geography and Institu-tions in the Making of the Modern World Income Distribution. The Quarterly Journal of Eco-nomics 117(4), 1231–1294.
Acemoglu, D. and J. Robinson (2000). Why did the West Extend the Franchise? Democracy, In-equality, and Growth in Historical Perspective. Quarterly Journal of Economics 115(4), 1167–1199.
Acemoglu, D. and J. Robinson (2001). A Theory of Political Transitions. The American EconomicReview 91(4), 938–963.
Acemoglu, D. and J. Robinson (2006). Economic Origins of Dictatorship and Democracy. CambridgeUniversity Press.
Acemoglu, D. and J. Robinson (2008). Persistence of Power, Elites, and Institutions. AmericanEconomic Review 98(1), 267–293.
Ashdown, P. (1979). Caribbean History in Maps. Addison-Wesley Longman Ltd.
27

Baland, J.-M. and J. A. Robinson (2008). Land and Power: Theory and Evidence from Chile. TheAmerican Economic Review, 1737–1765.
Banerjee, A. and L. Iyer (2005). History, Institutions, and Economic Performance: The Legacy ofColonial Land Tenure Systems in India. The American Economic Review 95(4), 1190–1213.
Besley, T. and A. Case (1995). Does Electoral Accountability Affect Economic Policy Choices?Evidence from Gubernatorial Term Limits. The Quarterly Journal of Economics 110(3), 769–798.
Besley, T., T. Persson, and M. Reynal-Querol (2012). Political Instability and Institutional Reform:Theory and Evidence. London School of Economics (unpublished).
Bobonis, G. and P. Morrow (2014). Labor Coercion and the Accumulation of Human Capital.Conditionally accepted, Journal of Development Economics.
Boix, C. (2003). Democracy and Redistribution. Cambridge University Press.
Bolland, O. (1981). Systems of Domination After Slavery: The Control of Land and Labor in theBritish West Indies after 1838. Comparative Studies in Society and History 23(04), 591–619.
Britain, C. O. G. (1879). The Colonial Office List. HM Stationery Office.
Brizan, G. (1984). Grenada, Island of conflict: from Amerindians to People’s Revolution, 1498-1979. ZedBooks London.
Bruckner, M. and A. Ciccone (2011). Rain and the Democratic Window of Opportunity. Economet-rica 79(3), 923–947.
Burroughs, P. (1999). Imperial Institutions and the Government of Empire. The Oxford History ofthe British Empire 3, 170–197.
Cameron, A. C. and D. L. Miller (2013). A Practitioner’s Guide to Cluster-Robust Inference.
Cartwright, J. (1970). Politics in Sierra Leone 1947-67. University of Toronto Press Toronto.
Chay, K. and K. Munshi (2011). Slavery’s Legacy: Black Mobilization in the Postbellum South.Manuscript, Brown Univ.
Craig-James, S. (2000). The Social and Economic History of Tobago (1838–1990).
Craton, M. (1997). Empire, Enslavement, and Freedom in the Caribbean. James Currey.
Dell, M. (2010). The Persistent Effects of Peru’s Mining Mita. Econometrica 78(6), 1863–1903.
Dippel, C., A. Greif, and D. Trefler (2014). The Rents from Trade: Removing the Sugar Coating.Working Paper, UCLA.
Dookhan, I. (1977). A Post-Emancipation History of the West Indies. Collins.
28
Dunn, R. and J. Parker (1972). Sugar and Slaves: The Rise of the Planter Class in the English WestIndies, 1624–1713. History: Reviews of New Books 1(1), 4–4.
Dutt, P. and D. Mitra (2008). Inequality and the Instability of Polity and Policy. The EconomicJournal 118(531), 1285–1314.
Engerman, S. (1982). Economic Adjustments to Emancipation in the United States and BritishWest Indies. Journal of Interdisciplinary History 13(2), 191–220.
Engerman, S. (1984). Economic Change and Contract Labor in the British Caribbean: The End ofSlavery and the Adjustment to Emancipation. Explorations in Economic History 21(2), 133–150.
Engerman, S. and K. Sokoloff (2002). Factor Endowments, Inequality, and Paths of DevelopmentAmong New World Economics. National Bureau of Economic Research.
Engerman, S. L. and K. L. Sokoloff (2005). The Evolution of Suffrage Institutions in the New World.The Journal of Economic History 65(04), 891–921.
Feroz, A. (2002). The Making of Modern Turkey. Routledge.
Feyrer, J. and B. Sacerdote (2009). Colonialism and modern income: islands as natural experi-ments. The Review of Economics and Statistics 91(2), 245–262.
Fuller, T. (2014). Thai Army Declares Coup, Citing Need to Reform Nation. New York Times May22nd.
Hacker, J. S. and P. Pierson (2011). Winner-Take-All Politics: How Washington Made the Rich Richer–and Turned Its Back on the Middle Class. Simon and Schuster.
Haggard, S. and R. R. Kaufman (1997). The Political Economy of Democratic Transitions. Compar-ative Politics, 263–283.
Haggard, S. and R. R. Kaufman (2012). Inequality and Regime Change: Democratic Transitionsand the Stability of Democratic Rule. American Political Science Review 1(1), 1–22.
Hall, D. (1959). Free Jamaica, 1838-1865: an economic history, Volume 1. Yale University Press.
Henry, P. B. and C. Miller (2009). Institutions versus Policies: A Tale of Two Islands. AmericanEconomic Review Papers & Proceedings.
Higman, B. (1995). Slave Populations of the British Caribbean, 1807-1834. Univ of West Indies Pr.
Holt, T. (1991). The Problem of Freedom: Race, Labor, and Politics in Jamaica and Britain, 1832–1938.The Johns Hopkins University Press.
Honychurch, L. (1995). The Dominica Story: A History of the Island. Macmillan Pub Limited.
29
Husted, T. A. and L. W. Kenny (1997). The Effect of the Expansion of the Voting Franchise on theSize of Government. Journal of Political Economy, 54–82.
Iyer, L. (2010). Direct versus Indirect Colonial Rule in India: Long-Term Consequences. The Reviewof Economics and Statistics 92(4), 693–713.
Kassimeris, C. (2006). Causes of the 1967 Greek Coup. Democracy and Security 2(1), 61–72.
Kousser, J. (1974). The Shaping of Southern Politics: Suffrage Restriction and the Establishment of theOne-Party South, 1880-1910. Yale University Press New Haven.
Kousser, J. (1999). Colorblind Injustice: Minority Voting Rights and the Undoing of the Second Recon-struction. University of North Carolina Press.
Lange, M. (2004). British Colonial Legacies and Political Development. World Development 32(6),905–922.
Laurence, K. (1971). Immigration into the West Indies in the 19th Century. Caribbean UniversitiesPress (Barbados and Aylesbury, Bucks, UK).
Lewis, G. (2004). The growth of the Modern West Indies. Ian Randle Publishers.
Lipset, S. (1959). Some Social Requisites of Democracy: Economic Development and PoliticalLegitimacy. American Political Science Review 53(1), 69–105.
Lizzeri, A. and N. Persico (2004). Why Did the Elites Extend the Suffrage? Democracy and theScope Of Government, with an Application to Britain’s “Age Of Reform”. Quarterly Journal ofEconomics 119(2), 707–765.
Lowes, S. (1994). The Peculiar Class: The Formation, Collapse, and Reformation of the Middle Class inAntigua, West Indies, 1834-1940. Columbia University.
Margo, R. A. (1990). Race and Schooling in the South, 1880-1950: an Economic History. University ofChicago Press.
McLewin, P. (1987). Power and Economic Change: The Response to Emancipation in Jamaica and BritishGuiana, 1840-1865. Garland.
Meltzer, A. and S. Richard (1981). A Rational Theory of the Size of Government. The Journal ofPolitical Economy, 914–927.
Meyersson, E. (2014). Political Man on Horseback. Military Coups and Development. workingpaper, SITE.
Morrell, W. and W. Parker (1969). British Colonial Policy in the Mid-Victorian Age: South Africa, NewZealand, the West Indies. Clarendon P.
30
Naidu, S. (2009). Suffrage, Schooling, and Sorting in the Post-Bellum US South. working paper,Columbia University.
North, D. C. and B. R. Weingast (1989). Constitutions and Commitment: the Evolution of In-stitutions Governing Public Choice in Seventeenth-Century England. The journal of economichistory 49(04), 803–832.
Nunn, N. (2009). The Importance of History for Economic Development. Annual Review of Eco-nomics 1, 65–92.
Przeworski, A., M. Alvarez, J. A. Cheibub, and F. Limongi (2000). Democracy and Development: Po-litical Regimes and Economic Well-Being in the World, 1950-1990. New York: Cambridge UniversityPress.
Ragatz, L. (1928). The Fall of the Planter Class in the British Caribbean, 1763-1833: a Study in Social andEconomic History. The Century Co.
Roby, J. (1831). Members of the Assembly of Jamaica from the Institution of that Branch of the Legislatureto the Present Time, Arranged in Parochial Lists. Published by Alex holmes, Montego-bay, Jamaica.
Schelling, T. C. (1980). The Strategy of Conflict. Harvard university press.
Sewell, W. (1861). The Ordeal of Free Labor in the British West Indies. Harper & brothers.
Taylor, A. (2002). The American Colonies, Volume 1. Penguin Group USA.
Trebbi, F., P. Aghion, and A. Alesina (2008). Electoral Rules and Minority Representation in U.S.Cities. The Quarterly Journal of Economics 123(1), 325–357.
Will, H. (1970). Constitutional Change in the British West Indies, 1880-1903: with Special Reference toJamaica, British Guiana, and Trinidad. Clarendon press.
Wrong, H. (1923). Government of the West Indies. Clarendon Press.
31
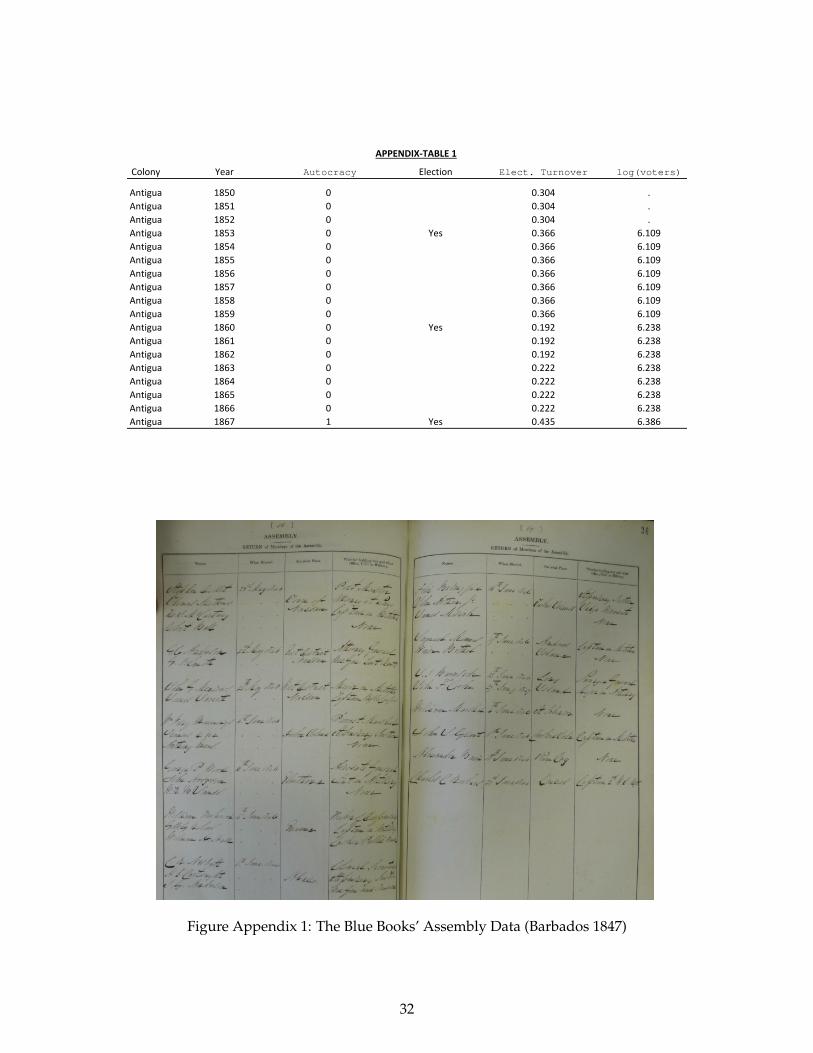
APPENDIX‐TABLE 1
Colony & Year & Autocracy & Election & Elect. Turnover & log(voters)
Antigua & 1850 & 0 & & 0.304 & .Antigua & 1851 & 0 & & 0.304 & .Antigua & 1852 & 0 & & 0.304 & .Antigua & 1853 & 0 & Yes & 0.366 & 6.109Antigua & 1854 & 0 & & 0.366 & 6.109Antigua & 1855 & 0 & & 0.366 & 6.109Antigua & 1856 & 0 & & 0.366 & 6.109Antigua & 1857 & 0 & & 0.366 & 6.109Antigua & 1858 & 0 & & 0.366 & 6.109Antigua & 1859 & 0 & & 0.366 & 6.109Antigua & 1860 & 0 & Yes & 0.192 & 6.238Antigua & 1861 & 0 & & 0.192 & 6.238Antigua & 1862 & 0 & & 0.192 & 6.238Antigua & 1863 & 0 & & 0.222 & 6.238Antigua & 1864 & 0 & & 0.222 & 6.238Antigua & 1865 & 0 & & 0.222 & 6.238Antigua & 1866 & 0 & & 0.222 & 6.238Antigua & 1867 & 1 & Yes & 0.435 & 6.386
Figure Appendix 1: The Blue Books’ Assembly Data (Barbados 1847)
32