
Autistic Children Show a Surprising Relationship between ... · measured by the Raven’s...
9
ORIGINAL RESEARCH published: 11 May 2017 doi: 10.3389/fnhum.2017.00239 Autistic Children Show a Surprising Relationship between Global Visual Perception, Non-Verbal Intelligence and Visual Parvocellular Function, Not Seen in Typically Developing Children Alyse C. Brown and David P. Crewther * Centre for Human Psychopharmacology, Swinburne University of Technology, Melbourne, VIC, Australia Edited by: Srikantan S. Nagarajan, University of California, San Francisco, USA Reviewed by: Dongseok Yang, University of Ulsan College of Medicine, South Korea Mor Nahum, Posit Science Corporation, USA *Correspondence: David P. Crewther [email protected] Received: 08 March 2016 Accepted: 25 April 2017 Published: 11 May 2017 Citation: Brown AC and Crewther DP (2017) Autistic Children Show a Surprising Relationship between Global Visual Perception, Non-Verbal Intelligence and Visual Parvocellular Function, Not Seen in Typically Developing Children. Front. Hum. Neurosci. 11:239. doi: 10.3389/fnhum.2017.00239 Despite much current research into the visual processing style of individuals with Autism Spectrum Disorder (ASD), understanding of the neural mechanisms is lagging, especially with respect to the contributions of the overlapping dichotomies of magnocellular/parvocellular (afferent neural pathways), global/local (perception) and dorsal/ventral (cortical streams). Here, we addressed this deficiency by measuring inspection times (ITs) for novel global/local stimuli as well as recording nonlinear visually evoked potentials (VEPs), in particular, magnocellular and parvocellular temporal efficiencies. The study was conducted on a group of male ASD children and a typically developing (TD) group matched for mean age and mean non-verbal intelligence, as measured by the Raven’s Progressive Matrices. The IT results did not differ between groups, however a negative correlation between global IT and Raven’s score was found in the ASD group, that was not evident in the TD group. Nonlinear VEP showed the ASD group had smaller amplitude parvocellular-generated second order responses compared to the TD group. This is a sign of improved temporal responsiveness in ASD vs. TD groups. Principal Component Analysis linked global IT, non-verbal intelligence scores and VEP parvocellular efficiency in a single factor for the ASD but not the TD group. The results are suggestive of a constraint on pathways available for cognitive response in the ASD group, with temporal processing for those with ASD becoming more reliant on the parvocellular pathway. Keywords: Autism Spectrum Disorders, perception, parvocellular, magnocellular, inspection time (IT), non-verbal intelligence, visual evoked potential, neural efficiency INTRODUCTION Autism Spectrum Disorder (ASD) encompasses the previously discrete diagnoses of autism, Asperger’s disorder and pervasive developmental disorder (PDD) not otherwise specified (NOS; American Psychiatric Association, 2013). Its features include social deficits and communication difficulties, stereotyped or repetitive behaviors and interests, sensory issues, and in many cases, cognitive delays. Visual perception in ASD is characterized Frontiers in Human Neuroscience | www.frontiersin.org 1 May 2017 | Volume 11 | Article 239
Transcript of Autistic Children Show a Surprising Relationship between ... · measured by the Raven’s...

ORIGINAL RESEARCHpublished: 11 May 2017
doi: 10.3389/fnhum.2017.00239
Autistic Children Show a SurprisingRelationship between Global VisualPerception, Non-Verbal Intelligenceand Visual Parvocellular Function,Not Seen in Typically DevelopingChildrenAlyse C. Brown and David P. Crewther*
Centre for Human Psychopharmacology, Swinburne University of Technology, Melbourne, VIC, Australia
Edited by:Srikantan S. Nagarajan,University of California,
San Francisco, USA
Reviewed by:Dongseok Yang,
University of Ulsan College ofMedicine, South Korea
Mor Nahum,Posit Science Corporation, USA
*Correspondence:David P. Crewther
Received: 08 March 2016Accepted: 25 April 2017Published: 11 May 2017
Citation:Brown AC and Crewther DP
(2017) Autistic Children Show aSurprising Relationship between
Global Visual Perception, Non-VerbalIntelligence and Visual Parvocellular
Function, Not Seen in TypicallyDeveloping Children.
Front. Hum. Neurosci. 11:239.doi: 10.3389/fnhum.2017.00239
Despite much current research into the visual processing style of individuals withAutism Spectrum Disorder (ASD), understanding of the neural mechanisms is lagging,especially with respect to the contributions of the overlapping dichotomies ofmagnocellular/parvocellular (afferent neural pathways), global/local (perception) anddorsal/ventral (cortical streams). Here, we addressed this deficiency by measuringinspection times (ITs) for novel global/local stimuli as well as recording nonlinearvisually evoked potentials (VEPs), in particular, magnocellular and parvocellular temporalefficiencies. The study was conducted on a group of male ASD children and a typicallydeveloping (TD) group matched for mean age and mean non-verbal intelligence, asmeasured by the Raven’s Progressive Matrices. The IT results did not differ betweengroups, however a negative correlation between global IT and Raven’s score was foundin the ASD group, that was not evident in the TD group. Nonlinear VEP showed the ASDgroup had smaller amplitude parvocellular-generated second order responses comparedto the TD group. This is a sign of improved temporal responsiveness in ASD vs. TDgroups. Principal Component Analysis linked global IT, non-verbal intelligence scoresand VEP parvocellular efficiency in a single factor for the ASD but not the TD group.The results are suggestive of a constraint on pathways available for cognitive responsein the ASD group, with temporal processing for those with ASD becoming more relianton the parvocellular pathway.
Keywords: Autism Spectrum Disorders, perception, parvocellular, magnocellular, inspection time (IT), non-verbalintelligence, visual evoked potential, neural efficiency
INTRODUCTION
Autism Spectrum Disorder (ASD) encompasses the previously discrete diagnoses of autism,Asperger’s disorder and pervasive developmental disorder (PDD) not otherwise specified(NOS; American Psychiatric Association, 2013). Its features include social deficits andcommunication difficulties, stereotyped or repetitive behaviors and interests, sensoryissues, and in many cases, cognitive delays. Visual perception in ASD is characterized
Frontiers in Human Neuroscience | www.frontiersin.org 1 May 2017 | Volume 11 | Article 239

Brown and Crewther Parvocellular Efficiency, IQ, Global Perception
by an atypical bias towards local perception, thought to oftenoverride the normal global precedence for objects (Dakinand Frith, 2005). Indeed, Simmons et al. (2009), in review,proposed that unusual sensory processing could be causal in ASDsymptomatology.
Two cognitive theories have emerged to explain anomalousASD perception. The enhanced perceptual functioning(EPF) theory suggested that there is an over-developmentof low-level perceptual operations that causes detection, primarydiscrimination and other low-level abilities to be enhanced(Mottron et al., 2006). By contrast, the Weak Central Coherence(WCC) theory proposed that individuals with ASD have a localprocessing style bias as they use gestalt principles less (Happé,1999; Happé and Frith, 2006). Both of these theories allude tothere being less processing in the later stages of visual processing.A meta-analysis of global/local perception in ASD by Van derHallen et al. (2015) combining data from several different tasks,found no evidence of enhanced local processing, and foundthat global processing was slowed. However, a meta-analysisof global/local processing by Muth et al. (2014) in which thetasks were separately analyzed showed that enhanced localprocessing in ASD was not a general finding but was task-dependent. In terms of theories based on neural processing, thedorsal stream vulnerability hypothesis (Braddick et al., 2003)posited that global form and motion sensitivity is particularlysusceptible to damage in many neurodevelopmental disordersincluding autism, because of the more stringent neural temporalrequirements of the magnocellular pathway that supports theseabilities. Recently, the idea of altered neural noise has been usedto explain aspects of autism (Simmons et al., 2009; Pellicanoand Burr, 2012; Greenaway et al., 2013), however work is stillrequired to make a strongly predictive theory.
The first measures of global/local precedence used the Navonfigures task (Navon, 1977) where participants are asked torespond to the large letters (global form) or small letters(local form) that make up the large letter. In the yearssince the emergence of Navon figures, the understanding ofglobal and local perception has become more sophisticated.Thus, the notions of edge vs. object, of part vs. whole, havebeen summarized according to grouping principles based onproximity; good continuation; similarity; closure; symmetry andparallelism; and convexity (Wagemans et al., 2012). Now thereis a growing interest in identifying the neural mechanisms atplay. An outstanding example of differential neural analysis ofglobal vs. local perception is the diamond illusion, where perceptfluctuates between four ungrouped moving lines or the linesappearing to move coherently as a diamond shape. FunctionalMRI activations (Fang et al., 2008), show the local perceptactivating primary visual cortex (V1) and the global form perceptpredominantly activating Lateral Occipital Complex (LOC), atthe expense of V1 activation.
While the classic global/local Navon figures task is ubiquitous,we argued that it is not the optimal stimulus for determiningglobal/local neural processing differences. This is on the basisthat both global and local outcomes of task demand requirerecognition of a letter, and as such, the likely activation site—theneural end-point of recognition (Grill-Spector et al., 2004),
is the same—the visual word-form area (Lux et al., 2004;Billington et al., 2008), no matter if a global or local letteris identified. Similarly, hierarchical figures, based on the sameNavon principles but using shapes as elements (Mottron andBelleville, 1993; Plaisted et al., 1999; Rinehart et al., 2000; Bölteet al., 2007) again fail to address the similarity of global/localbrain activations (Mottron et al., 2006). We addressed thisproblem by increasing the comparative complexity between theglobal and local stimulus levels to ensure that the global imagesare processed further into the inferotemporal pipe-line than thelocal images. The novel stimuli developed were complex formsmade up of simple forms (e.g., truck/squares, fish/circles, asshown in Figure 1A).
The second part of this study aimed to examine the tenuouslink between dorsal stream vulnerability and poor global formprocessing in ASD that has been suggested by Braddick et al.(2003). Central to Braddick’s argument is that the dorsal stream ismade vulnerable due to the stringent neural timing requirementsof the magnocellular pathway that dominates its input (Milnerand Goodale, 2008). In the lateral geniculate nucleus (LGN)the magnocellular neurons have a latency advantage over theparvocellular neurons because of faster axonal conduction speeds(Maunsell and Gibson, 1992; Maunsell et al., 1999). Physiologicalestimates of the magnocellular advantage (Laycock et al., 2007)in activating human cortical area V1, range from 25 ms to 30 ms(Baseler and Sutter, 1997; Klistorner et al., 1997; Sutherland andCrewther, 2010; Jackson et al., 2013). Possessing high temporalresolution, visual evoked potential (VEP) studies of the ASDprocessing style have shown abnormal responses in children
FIGURE 1 | (A) An example of global/local stimuli presented during theinspection times (ITs) tasks. (B) Mean and error bars (1 SE) of global and localIT for autism spectrum disorder (ASD; red) and typically developing (TD; blue)groups. The TD group showed consistently lower thresholds. (C) Global ITsdemonstrated a negative relationship with Ravens score for the ASD group(red), whereas the TD group (blue) global IT showed no significant correlationwith Raven’s score. (D) Local IT showed no significant correlation with Ravensscore for either ASD (red) or TD (blue) groups.
Frontiers in Human Neuroscience | www.frontiersin.org 2 May 2017 | Volume 11 | Article 239

Brown and Crewther Parvocellular Efficiency, IQ, Global Perception
(Vandenbroucke et al., 2008; Pei et al., 2009; Fujita et al., 2011)and adults (Jemel et al., 2010) with ASD. Interestingly, differencesin nonlinear VEP responses between groups high and low inautistic tendency have been attributed to altered magnocellularfunction (Sutherland and Crewther, 2010; Jackson et al., 2013).
Nonlinear VEP allows for the analysis of the temporalstructure of responses that occur during rapid stimulation. Thefirst order response is similar to the impulse response functionof a standard VEP, while the second order responses measurethe effect of prior stimulation as a function of interaction time.This temporal analysis allows for an independent analysis ofthe magnocellular and parvocellular pathways by capitalizingon their different contrast and temporal response properties inthe second order response (Klistorner et al., 1997). Previousresearch has used nonlinear VEP results as an index ofneural efficiency with amplitude reduction in the second orderresponse associated with more efficient response recovery (Baueret al., 2011; Jackson et al., 2013). In neurotypicals with highautistic tendency, nonlinear VEP recordings have revealedmagnocellularly-generated second order nonlinearities are lessefficient (greater magnitude) compared to those low in autistictendency (Jackson et al., 2013).
Intelligence and PerceptionWhile ASD has been recognized as being associated withgenerally lower IQ, the nature of the intellectual disability inASD is not classically subnormal (Frith, 2003; Brown et al., 2017).This understanding is based on the profile of subtest scores thatindividuals with ASD receive on the Wechsler Intelligence Scalefor Children (WISC), for example, high performance on theBlock Design task even as general IQ decreases (Lincoln et al.,1988; Allen et al., 1991; Shah and Frith, 1993; Happé, 1994). Inaddition, the language-based subtest scores that are predictiveof general IQ in a typical population are not predictive in ASD(Bello et al., 2008; Charman et al., 2011; Courchesne et al., 2015).One of the fundamental tenets of general intelligence—speed ofprocessing, appears not to contribute to low intelligence for thosewith ASD (Anderson, 2008). A review by Brown et al. (2017)extends these deviations from the normal relation between ASDand IQ to visual processing. For example inspection time (IT)has a well-studied relationship with intelligence in typicallydeveloping (TD) individuals, established since the late 1970’s(Nettelbeck, 1982). Meta-analysis of the standard IT task (tuningfork with unequal legs) shows a mean correlation between ITand IQ of −0.54 in normal healthy adults (Kranzler and Jensen,1989). However, for ASD populations, correlations appearsvariable (Scheuffgen et al., 2000; Wallace et al., 2009; Barbeauet al., 2013), depending on the type of intelligence assessmentand the inclusion or not of Asperger subtype (DSM-IV) withinthe autistic sample.
Hence, the current study aimed to investigateneurophysiological function and visual processing speed inrelation to non-verbal intelligence in groups of male ASD andTD school-age children matched in mean age and non-verbalintelligence. We measured IT for novel global/local figuresdifferentiated by level of complexity, hypothesizing that theASD group would show shorter IT for the local condition
and longer IT for the global condition compared to the TDgroup. In addition, we recorded multifocal VEP to test whetherdifferences in magnocellular function found in adult high vs. lowautistic tendency (Jackson et al., 2013) extended to our clinicalchild sample. Thus in this design, measures related to the threedichotomies: speed of global/local perception, non-verbal IQ andphysiological measures of magnocellular/parvocellular functionwere compared in the same populations.
MATERIALS AND METHODS
ParticipantsParticipants were recruited from a primary school in the easternsuburbs of Melbourne, Australia. The ASD group comprisedof male children aged 7–11 years. Due to ethical restrictionstied to this study, the ASD diagnostic status was confirmed viathe school’s special needs program and departmental evaluationof diagnostic records. We requested to be given names onlyof children with a full clinical diagnosis that included both apediatrician and a psychologist. All members of the ASD groupmet the special needs criteria on the basis of autism (in thiscase assessed under DSM-IV). The TD group was matched forchronological age, gender and non-verbal intelligence using theRaven’s Colored Progressive Matrices test (RCPM; Raven et al.,1998)—see Table 1.
The study was approved by the university’s human researchethics committee as well as by the Department of Education andEarly Childhood Development of Victoria. As the participantswere under the age of 18 years consent was obtained from aparent or legal guardian of the participant. Participants wereasked at the beginning of each new task if they would like toparticipate in the activity. If the child said no or became distressedduring the testing session testing was stopped. Written informedconsent was obtained from parents of children prior to collectionof data. Severity of autistic symptoms was measured using theCambridge University Behavior and Personality Questionnairefor Children (CBPQ-Child; Auyeung et al., 2008) which theparents of both child participant groups were required tocomplete at the start of the study. Exclusion criteria existed forindividuals diagnosed with epilepsy or abnormal vision (otherthan refractive error). On the CBPQ, two TD children scoredhigher than 76 (/150)—the threshold score thought to separateclinical from healthy controls with 95% confidence (Auyeunget al., 2008), but these individuals were retained in the TD groupso as to not skew the distribution of data.
ProcedureFirst, participants completed the Ravens Colored ProgressiveMatrices test (RCPM) which took approximately 10 min to
TABLE 1 | Comparison of Autism Spectrum Disorder (ASD) and typicallydeveloping (TD) groups.
Age (years) Raven’s score Child CBPQ
M SD M SD M SD
ASD (n = 11) 9.09 1.30 29.73 6.21 90.91 25.71TD (n = 14) 8.79 1.31 29.86 5.07 45.36 23.08
Frontiers in Human Neuroscience | www.frontiersin.org 3 May 2017 | Volume 11 | Article 239

Brown and Crewther Parvocellular Efficiency, IQ, Global Perception
complete, followed by a computer based global/local IT task,created using VPixx software1. Testing was based around twoperiods with a 2-week gap in between. The first period acted as afamiliarization to the tasks and the testing protocols. The secondperiod included both psychophysical and electrophysiological(VEP) data collection.
IT Using Global/Local FiguresIT refers to the exposure duration required for a participant toreliably identify a stimulus. The global/local stimuli used in theIT tasks consisted of complex figures (fish, trucks and butterflies)each made up of simple geometrical shapes (circles, trianglesor squares)—for an example of the stimuli see Figure 1A.Global stimuli were displayed in two different orientations usingleft/right reversal to decrease the possible reliance on local featuredetection during the global condition. The number of localelements in each global stimulus (truck, fish, butterfly) wascontrolled, differing by no more than 5. The dimensions of theglobal images displayed were 32◦W × 25◦H, with the small localshapes 1◦W × 1◦H. Images were created using Mathematica(Wolfram Research).
The children were first familiarized with the stimuli; theexperimenter asked ‘‘what do you see’’ for each image, withthe objective of making sure the children were able to correctlyidentify the stimuli in either the global or local aspect. TheIT task was run twice each time with a different instruction;‘‘What picture did you see?’’ (global IT) or ‘‘What shape didyou see?’’ (local IT). The order of global and local recognitiontasks was counterbalanced across subjects. Depending on theparticipants’ capabilities (verbal or non-verbal) participants gavetheir responses verbally or by pointing to one of the three imageson a print-out of the stimuli, the experimenter then enteringthe participants’ responses into the program. Participants wereinstructed to guess, if they were unsure. Before starting eachIT task, 10 practice trials were given so to allow for adaptationto the new instructions. Each IT task consisted of 35 trials,with threshold reached in approximately 3 min. A three-alternate forced-choice (3AFC) paradigm was used and stimuluspresentation was fully randomized. Each trial started with afixation cross displayed for 0.5 s followed by the presentationof one of the three possible target stimuli which was displayedfor a varying amount of time followed by a masking stimulusof dynamic random dot noise stimulus for 17 ms. The taskwaited for a button press response before moving on to thenext trial. Target stimulus display time (starting at 2 s yieldingcorrect percept in all participants) was modulated under a PESTprocedure (built into VPixx) the threshold estimate used as theparticipants’ inspection time.
Nonlinear VEPGold cup electrodes filled with electrode paste were placed atprepared sites Oz referenced to Fz (10/20 system) with the rightear used as ground. During the recording of the multifocalstimulus, participants were directed to maintain fixation onthe red dot in the middle of the visual stimulus. Throughout
1www.vpixx.com
the recordings, one experimenter watched the participant’seye gaze and when necessary, reminded the participant tolook at the red central dot. A second experimenter watchedthe waveforms for evidence of electromyographic noise andreminded the participant to relax if the recording started to getnoisy.
To record the nonlinear VEP, a software/hardwarecombination was used, with the binary pseudorandommultifocalstimulus (9 square patches) coded in VPixx and employing aDATAPixx1 interface box for strict video frame registration.Each of the 9 square patches fluctuated between two luminancelevels under the control of a pseudo-random m = 14 binarysequence with each patch set to an independent flicker sequence.To an observer these stimuli appear to rapidly flicker. Twotemporal stimulus contrasts were used—24% and 96% contrast.The 4 min pseudo-random binary sequence was divided into1-min segments of recording to allow for rest breaks (a fewsecond, during which time the participant was asked to blinkrapidly three or four times to hydrate their corneas). Thestimulus was presented using a 75 Hz frame rate CRT monitor.The central square patch stimulus (8◦
× 8◦) was larger thanthose used in previous multifocal VEP studies (Klistorner et al.,1997) to better accommodate deviations from fixation.
Data Pre-ProcessingThe signal was amplified 50,000 times with band-pass filteringbetween 1 Hz and 1 kHz. Data was sampled at 1 kHz. Onlyresponses recorded from the central patch were analyzed. Usingthe Wiener kernel expansion (for a detailed explanation, seeSutter, 2000; Jackson et al., 2013) first order Kernel, K1 andsecond order Kernels K2.1 and K2.2 of the VEP were extractedusing custom software (Lab VIEW, National Instruments). Forexample, the first order response (K1) for a pseudo-randomsequence of black (b) and white (w) stimuli is the average of allresponses to white stimuli Rw, minus the average of responsesto the black stimuli Rb during the pseudorandom sequence,i.e., K1 = 1/2 (Rw − Rb). The second order responses takeaccount of the stimulation history. The first slice of the secondorder response (K2.1) takes into account stimulation one frameback so it represents a comparison between two consecutiveframes when a transition has happened and when a transition hasnot occurred, i.e., 1/4(Rww + Rbb − Rwb − Rbw). The secondslice (K2.2) takes into account the same responses but with anadditional intervening frame of both polarities. The differencein temporal recovery responses in first slice (13 ms with a75 Hz frame rate) and second slice (27 ms) of the second orderkernel separates inputs of the magno and parvocellular pathways(Klistorner et al., 1997; Jackson et al., 2013) on the basis ofcontrast gain, saturation and peak latency (Baseler and Sutter,1997; Klistorner et al., 1997; Crewther et al., 1999; Laycock et al.,2007; Sutherland and Crewther, 2010; Jackson et al., 2013).
Mean average waves were calculated for each group.One-way between-group ANOVAs were used to examine groupdifferences in the amplitudes and latencies of all peaks. To reducebetween-subject variation in recording conditions (e.g., skullthickness), ratios of the second order to first order amplitudes ofthe most prominent parvocellular and magnocellular generated
Frontiers in Human Neuroscience | www.frontiersin.org 4 May 2017 | Volume 11 | Article 239
Brown and Crewther Parvocellular Efficiency, IQ, Global Perception
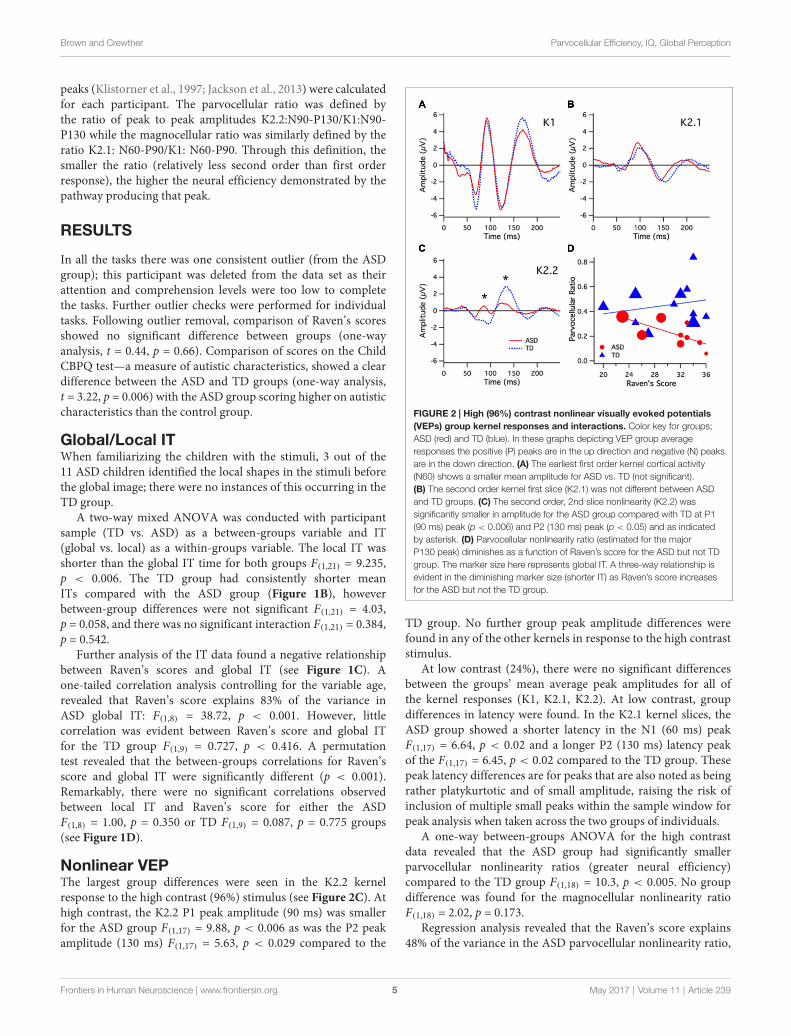
peaks (Klistorner et al., 1997; Jackson et al., 2013) were calculatedfor each participant. The parvocellular ratio was defined bythe ratio of peak to peak amplitudes K2.2:N90-P130/K1:N90-P130 while the magnocellular ratio was similarly defined by theratio K2.1: N60-P90/K1: N60-P90. Through this definition, thesmaller the ratio (relatively less second order than first orderresponse), the higher the neural efficiency demonstrated by thepathway producing that peak.
RESULTS
In all the tasks there was one consistent outlier (from the ASDgroup); this participant was deleted from the data set as theirattention and comprehension levels were too low to completethe tasks. Further outlier checks were performed for individualtasks. Following outlier removal, comparison of Raven’s scoresshowed no significant difference between groups (one-wayanalysis, t = 0.44, p = 0.66). Comparison of scores on the ChildCBPQ test—a measure of autistic characteristics, showed a cleardifference between the ASD and TD groups (one-way analysis,t = 3.22, p = 0.006) with the ASD group scoring higher on autisticcharacteristics than the control group.
Global/Local ITWhen familiarizing the children with the stimuli, 3 out of the11 ASD children identified the local shapes in the stimuli beforethe global image; there were no instances of this occurring in theTD group.
A two-way mixed ANOVA was conducted with participantsample (TD vs. ASD) as a between-groups variable and IT(global vs. local) as a within-groups variable. The local IT wasshorter than the global IT time for both groups F(1,21) = 9.235,p < 0.006. The TD group had consistently shorter meanITs compared with the ASD group (Figure 1B), howeverbetween-group differences were not significant F(1,21) = 4.03,p = 0.058, and there was no significant interaction F(1,21) = 0.384,p = 0.542.
Further analysis of the IT data found a negative relationshipbetween Raven’s scores and global IT (see Figure 1C). Aone-tailed correlation analysis controlling for the variable age,revealed that Raven’s score explains 83% of the variance inASD global IT: F(1,8) = 38.72, p < 0.001. However, littlecorrelation was evident between Raven’s score and global ITfor the TD group F(1,9) = 0.727, p < 0.416. A permutationtest revealed that the between-groups correlations for Raven’sscore and global IT were significantly different (p < 0.001).Remarkably, there were no significant correlations observedbetween local IT and Raven’s score for either the ASDF(1,8) = 1.00, p = 0.350 or TD F(1,9) = 0.087, p = 0.775 groups(see Figure 1D).
Nonlinear VEPThe largest group differences were seen in the K2.2 kernelresponse to the high contrast (96%) stimulus (see Figure 2C). Athigh contrast, the K2.2 P1 peak amplitude (90 ms) was smallerfor the ASD group F(1,17) = 9.88, p < 0.006 as was the P2 peakamplitude (130 ms) F(1,17) = 5.63, p < 0.029 compared to the
FIGURE 2 | High (96%) contrast nonlinear visually evoked potentials(VEPs) group kernel responses and interactions. Color key for groups;ASD (red) and TD (blue). In these graphs depicting VEP group averageresponses the positive (P) peaks are in the up direction and negative (N) peaksare in the down direction. (A) The earliest first order kernel cortical activity(N60) shows a smaller mean amplitude for ASD vs. TD (not significant).(B) The second order kernel first slice (K2.1) was not different between ASDand TD groups. (C) The second order, 2nd slice nonlinearity (K2.2) wassignificantly smaller in amplitude for the ASD group compared with TD at P1(90 ms) peak (p < 0.006) and P2 (130 ms) peak (p < 0.05) and as indicatedby asterisk. (D) Parvocellular nonlinearity ratio (estimated for the majorP130 peak) diminishes as a function of Raven’s score for the ASD but not TDgroup. The marker size here represents global IT. A three-way relationship isevident in the diminishing marker size (shorter IT) as Raven’s score increasesfor the ASD but not the TD group.
TD group. No further group peak amplitude differences werefound in any of the other kernels in response to the high contraststimulus.
At low contrast (24%), there were no significant differencesbetween the groups’ mean average peak amplitudes for all ofthe kernel responses (K1, K2.1, K2.2). At low contrast, groupdifferences in latency were found. In the K2.1 kernel slices, theASD group showed a shorter latency in the N1 (60 ms) peakF(1,17) = 6.64, p < 0.02 and a longer P2 (130 ms) latency peakof the F(1,17) = 6.45, p < 0.02 compared to the TD group. Thesepeak latency differences are for peaks that are also noted as beingrather platykurtotic and of small amplitude, raising the risk ofinclusion of multiple small peaks within the sample window forpeak analysis when taken across the two groups of individuals.
A one-way between-groups ANOVA for the high contrastdata revealed that the ASD group had significantly smallerparvocellular nonlinearity ratios (greater neural efficiency)compared to the TD group F(1,18) = 10.3, p < 0.005. No groupdifference was found for the magnocellular nonlinearity ratioF(1,18) = 2.02, p = 0.173.
Regression analysis revealed that the Raven’s score explains48% of the variance in the ASD parvocellular nonlinearity ratio,
Frontiers in Human Neuroscience | www.frontiersin.org 5 May 2017 | Volume 11 | Article 239

Brown and Crewther Parvocellular Efficiency, IQ, Global Perception
TABLE 2 | Principal components analysis (PCA) analysis for five variables, showing leading eigenvalues, cumulative percentage contribution andprobability for ASD and TD groups.
ASD TD
Number Eigenval Cum % Prob > χ2 Number Eigenval Cum % Prob > χ2
1 2.643 52.87 0.0004∗ 1 1.819 36.37 0.3522 1.237 77.60 0.0079∗ 2 1.386 64.10 0.439
∗ Indicates significant results.
F(1,7) = 6.52, p = 0.038, but no significant relationship in theTD group was found. The correlation between parvocellularnonlinearity ratio and global IT (RSq = 0.42, F = 4.98, p = 0.06)showed a strong trend for the ASD group where there was nonefor the TDs. The correlations between global IT and parvocellularratio (ASD: RSq = 0.42, F = 5.05, p = 0.058; TD: RSq = 0.039,F = 0.37, p = 0.56), are different (p = 0.038) for the two groups, asdemonstrated by a permutation test. Figure 2D shows a 3-wayinteraction plot between Ravens, global IT and parvocellularnonlinearity ratio.
Interestingly, children with a Ravens score ≥30 all showedshort global IT values (see Figure 2D), however had differentlevels of neural efficiency.When only those children with Raven’sscore ≥30 were considered, a one-way ANOVA revealed that theASD sub-group had a smaller parvocellular nonlinearity ratio(higher parvocellular neural efficiency) compared to the TDsub-group F(1,12) = 15.64, p < 0.002.
Principal Components AnalysisTo investigate relations between all of the variables recorded inthis study, a multivariate correlational analysis was conductedon the variables global IT, local IT, parvocellular VEP ratio,magnocellular VEP ratio and Raven’s score, comparing the ASDand TD groups.We used principal components analysis (PCA) tofind the major components (eigenvalues >1) for the two groups(see Table 2).
Two eigenvectors showed significant contributions toexplaining the cumulative variance for the ASD group, howevernone of the eigenvectors for the TD group showed significance.The first eigenvalue of 2.643 was associated with an eigenvectorexplaining nearly 53% of the variation in that population data.An inspection of the contribution of the five variables to theleading eigenvectors (see Table 3) shows that the first factorreceived virtually no contribution from magnocellular functionand a relatively small contribution from local IT. However,Raven’s scores, parvocellular VEP ratio and global IT were allstrong contributors.
TABLE 3 | Comparison of leading eigenvectors from PCA analysis offive variables (global, local inspection time (IT); magno, parvo visuallyevoked potential (VEP); non-verbal intelligence).
ASD TD
1 2 1 2
RCPM −0.595 0.147 0.349 −0.319Parvo_VEP 0.498 −0.091 0.595 0.390Magno_VEP 0.033 0.776 0.552 0.418IT_local −0.255 −0.601 −0.284 0.521IT_global 0.576 −0.080 −0.371 0.548
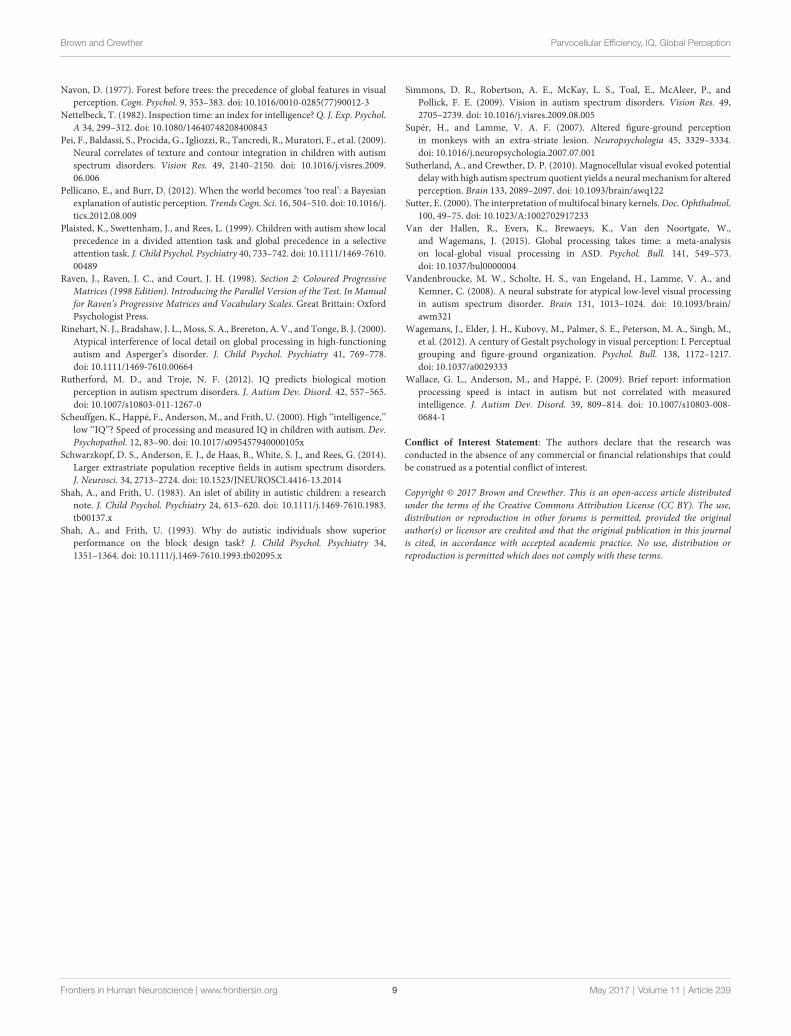
FIGURE 3 | Prediction probabilities for group membership (ASD vs. TD)based on discriminant analysis using Raven’s score, global IT andparvocellular efficiency data as inputs. One ASD participant wasincorrectly predicted as TD.
Quadratic discriminant analysis was carried out (jmp; SAScorporation) using the three variables (i.e., Raven’s score, globalIT and parvocellular efficiency) with a major contribution to thefirst eigenvector for the ASD. Using a leave-one out validationtechnique across the whole sample, the model generated only onefalse prediction of group membership—see Figure 3).
DISCUSSION
Despite claims of diversity in the genetics of ASD (Happé et al.,2006), the results presented here show a singular relationshiplinking non-verbal intelligence, global perception and the neuralefficiency of the parvocellular pathway, present in the ASDgroup, but not shown in the TD group.
In this study we used inspection time to measure the rapidityof recognition of the global and local levels of our novelstimuli. These stimuli were designed to probe different depthsof the inferotemporal pipeline of cortical areas when attendingto the global vs. local level. We found that global IT andRaven’s score were significantly negatively correlated for theASD but not for the TD group. No significant correlationswere found in the local IT condition for either ASD or TDgroups. In the conventional IT task (tuning fork with unequallegs) intelligence has an established weak relationship in thetypical population (Nettelbeck, 1982). Reports of correlationalrelationships between TD and standard IT, and the absenceof the same relationship in ASD are mixed and seem to bedependent on measures of IQ and type of ASD group used(Scheuffgen et al., 2000; Wallace et al., 2009; Barbeau et al., 2013).
Frontiers in Human Neuroscience | www.frontiersin.org 6 May 2017 | Volume 11 | Article 239

Brown and Crewther Parvocellular Efficiency, IQ, Global Perception
We propose that the added complexity in the Global IT conditionmight boost the IT relationship with IQ in an ASD population.
The literature is supportive of a relationship between visualprocessing and mental ability in ASD (Brown et al., 2017).The report of correlations between full-scale WAIS scores andperformance on biological (Koldewyn et al., 2010; Rutherfordand Troje, 2012) and coherent (Jones et al., 2011) motiontasks (associated with ASD populations but not TD groups),appears qualitatively similar. However, the current study showsan ASD relationship dependent on mental ability in a staticvisual processing task. Furthermore, the results show that thisrelationship between visual processing and mental ability isnot general but is potentially driven by the degree of stimuluscomplexity. Notably, this study demonstrates the danger ofgeneralizing findings from high functioning ASD populationsas representative of all those with ASD. Our study, togetherwith others (Pei et al., 2009; Koldewyn et al., 2010; Jones et al.,2011; Rutherford and Troje, 2012) demonstrates an interactionbetween ASD and intelligence, not found in the control group.
The comparison of nonlinear VEP between ASD and TDgroups did not show differences in magnocellular processing,a difference expected from studies of autistic tendency in highfunctioning populations (Braddick et al., 2003; Dakin and Frith,2005; Simmons et al., 2009). However, most neurally basedexplanations in the literature, targetingmagnocellular function asa likely cause of perceptual differences in autism, have generallyintuited the neural cause from psychophysical experiments(Dakin and Frith, 2005; Simmons et al., 2009). Articles assessingphysiological function in ASD are confined to high functioningASD populations (Vandenbroucke et al., 2008; Jemel et al., 2010;Schwarzkopf et al., 2014), or TD groups with high or low autistictendency (Sutherland and Crewther, 2010; Jackson et al., 2013).
In the current study, where non-verbal intelligence wasincluded as a factor, the major group physiological differencesrevolved around the parvocellularly generated nonlinearities.The parvocellular activation (second order K2.2 response)showed significantly smaller P2 amplitudes for the ASD group athigh contrast visual stimulation (see Figure 2) compared to theTD group.
The comparison between groups of the main contributions ofmagnocellular and parvocellular systems to the VEP was furtheranalyzed through measures of the corresponding nonlinearitiesexpressed as neural efficiencies (ratios of second order nonlinearamplitude moderated by first order peak amplitudes). The resultspresent a strong argument for enhanced parvocellular efficiencyin the ASD group as measured by the reduction in the ratio ofsecond to first order parvocellularly generated wave amplitudes.
Correlational analysis demonstrated relationships betweenglobal IT, parvocellular efficiency and Raven’s score in the ASDbut not TD groups. The first relationship makes sense, when itis realized that the parvocellular efficiency is really a measure ofthe readiness of parvocellular neurons to fire after stimulation.Greater temporal readiness on the part of neurons is likelyto enhance rapid recognition embodied in a short global IT.What stands out in the global IT data (which also showed astrong correlation with Raven’s score) is that group global ITperformance for children who scored 30 and over on the RCPM
test is not significantly different between ASD and Controls, yetthe ASD group showed superior parvocellular efficiency. A moreefficient parvocellular pathway could help explain why those withASD are found to have enhanced local search skills (Shah andFrith, 1983; Mottron et al., 2003; Caron et al., 2006; Muth et al.,2014).
We propose that the three-way relation between non-verbalintelligence, global processing speed and parvocellular neuralefficiency seen in the ASD but not the TD population suggestssome sort of restriction on functional connectivity. While itis generally accepted that in the normal population there is arelation between non-verbal intelligence and visual processingspeed as represented by IT (Nettelbeck, 1982; Barbeau et al.,2013), the mechanism of rapid processing would be attributedby most researchers to magnocellular function, certainly in termsof its role in figure-ground segregation (Bullier, 2001; Supérand Lamme, 2007). A disengagement of transient attention inASD has been related to ineffectiveness of magnocellular/dorsalfunction (Laycock et al., 2007; Greenaway et al., 2013). Tosupport this, our data (Figure 1) showed, for those in theASD group, pattern recognition and hence global IT tend tobe better in those with faster processing and neural recoverythrough the parvocellular system. However, it does not explainwhy local IT was not related in the same way. Our resultssupport Van der Hallen et al. (2015) meta-analysis thatfound a difference in temporal pattern for ASD global/localprocessing.
We suggest that the three-way relation evident in ourASD group data are consistent with a constraint enforcedby an ineffective magnocellular/dorsal network causing rapidrecognition to be more reliant on restricted neural pathwayconnections to ventral stream processing. These connections arelikely to be more dependent on parvocellular processing. Undersuch conditions, the relation between non-verbal intelligence andrapid neural processing would remain in ASD, but such rapiditywould be more dependent on efficient parvocellular connections.The high discriminant accuracy of group prediction (ASD vs.TD) found in our data suggests utility in autism diagnosis,although further testing is required to assess the reliability of thefindings.
AUTHOR CONTRIBUTIONS
DPC supervised the study. DPC and ACB were involved inthe intellectual contributions for this study; analyzed the data;wrote the manuscript. ACB recruited the participants and ran thetesting sessions with participants.
ACKNOWLEDGMENTS
We would like to thank Essex Heights Primary School forallowing us to use their facilities during testing. We wouldalso like to thank Stephanie Bevan and Reneta Slikboer forresearch assistance. The authors acknowledge project grantsupport (ID1004740) from the National Health and MedicalResearch Council of Australia.
Frontiers in Human Neuroscience | www.frontiersin.org 7 May 2017 | Volume 11 | Article 239

Brown and Crewther Parvocellular Efficiency, IQ, Global Perception
REFERENCES
Allen, M. H., Lincoln, A. J., and Kaufman, A. S. (1991). Sequential andsimultaneous processing abilities of high-functioning autistic and language-impaired children. J. Autism Dev. Disord. 21, 483–502. doi: 10.1007/bf02206872
American Psychiatric Association. (2013). Diagnostic and Statistical Manual ofMental Disorders, Fifth Edition (DSM-5). Arlington, VA: American PsychiatricAssociation.
Anderson, M. (2008). What can autism and dyslexia tell us about intelligence?Q. J. Exp. Psychol. Hove. 61, 116–128. doi: 10.1080/17470210701508806
Auyeung, B., Baron-Cohen, S., Wheelwright, S., and Allison, C. (2008). The autismspectrum quotient: children’s version (AQ-Child). J. Autism Dev. Disord. 38,1230–1240. doi: 10.1007/s10803-007-0504-z
Barbeau, E. B., Soulières, I., Dawson,M., Zeffiro, T. A., andMottron, L. (2013). Thelevel and nature of autistic intelligence III: inspection time. J. Abnorm. Psychol.122, 295–301. doi: 10.1037/a0029984
Baseler, H. A., and Sutter, E. E. (1997). M and P components of the VEP andtheir visual field distribution. Vision Res. 37, 675–690. doi: 10.1016/s0042-6989(96)00209-x
Bauer, I., Crewther, D. P., Pipingas, A., Rowsell, R., Cockerell, R., andCrewther, S. G. (2011). Omega-3 fatty acids modify human corticalvisual processing—a double-blind, crossover study. PLoS One 6:e28214.doi: 10.1371/journal.pone.0028214
Bello, K. D., Goharpey, N., Crewther, S. G., and Crewther, D. P. (2008). A puzzleform of a non-verbal intelligence test gives significantly higher performancemeasures in children with severe intellectual disability. BMC Pediatr. 8:30.doi: 10.1186/1471-2431-8-30
Billington, J., Baron-Cohen, S., and Bor, D. (2008). Systemizing influencesattentional processes during the Navon task: an fMRI study. Neuropsychologia46, 511–520. doi: 10.1016/j.neuropsychologia.2007.09.003
Bölte, S., Holtmann, M., Poustka, F., Scheurich, A., and Schmidt, L. (2007). Gestaltperception and local-global processing in high-functioning autism. J. AutismDev. Disord. 37, 1493–1504. doi: 10.1007/s10803-006-0231-x
Braddick, O., Atkinson, J., and Wattam-Bell, J. (2003). Normal and anomalousdevelopment of visual motion processing: motion coherence and ‘dorsal-stream vulnerability’. Neuropsychologia 41, 1769–1784. doi: 10.1016/s0028-3932(03)00178-7
Brown, A., Chouinard, P., and Crewther, S. (2017). Vision research literature maynot represent the full intellectual range of autism spectrum disorder. Front.Hum. Neurosci. 11:57. doi: 10.3389/fnhum.2017.00057
Bullier, J. (2001). Integratedmodel of visual processing. Brain Res. Rev. 36, 96–107.doi: 10.1016/s0165-0173(01)00085-6
Caron, M. J., Mottron, L., Berthiaume, C., and Dawson, M. (2006). Cognitivemechanisms, specificity and neural underpinnings of visuospatial peaks inautism. Brain 129, 1789–1802. doi: 10.1093/brain/awl072
Charman, T., Pickles, A., Simonoff, E., Chandler, S., Loucas, T., and Baird, G.(2011). IQ in children with autism spectrum disorders: data from theSpecial Needs and Autism Project (SNAP). Psychol. Med. 41, 619–627.doi: 10.1017/S0033291710000991
Courchesne, V., Meilleur, A.-A.S., Poulin-Lord, M.-P., Dawson, M., andSoulières, I. (2015). Autistic children at risk of being underestimated: school-based pilot study of a strength-informed assessment. Mol. Autism 6:12.doi: 10.1186/s13229-015-0006-3
Crewther, S. G., Crewther, D. P., Klistorner, A., and Kiely, P. M. (1999).Development of the magnocellular VEP in children: implications for readingdisability. Electroencephalogr. Clin. Neurophysiol. Suppl. 49, 123–128.
Dakin, S., and Frith, U. (2005). Vagaries of visual perception in autism.Neuron 48,497–507. doi: 10.1016/j.neuron.2005.10.018
Fang, F., Kersten, D., and Murray, S. O. (2008). Perceptual grouping andinverse fMRI activity patterns in human visual cortex. J. Vis. 8, 2.1–2.9.doi: 10.1167/8.7.2
Frith, U. (2003). Autism: Explaining the Enigma. Oxford, UK: Blackwell.Fujita, T., Yamasaki, T., Kamio, Y., Hirose, S., and Tobimatsu, S. (2011).
Parvocellular pathway impairment in autism spectrum disorder: evidence fromvisual evoked potentials. Res. Autism Spectr. Disord. 5, 277–285. doi: 10.1016/j.rasd.2010.04.009
Greenaway, R., Davis, G., and Plaisted-Grant, K. (2013). Marked selectiveimpairment in autism on an index of magnocellular function.Neuropsychologia51, 592–600. doi: 10.1016/j.neuropsychologia.2013.01.005
Grill-Spector, K., Knouf, N., and Kanwisher, N. (2004). The fusiform face areasubserves face perception, not generic within-category identification. Nat.Neurosci. 7, 555–562. doi: 10.1038/nn1224
Happé, F. G. E. (1994). Wechsler IQ profile and theory of mind in autism: aresearch note. J. Child Psychol. Psychiatry 35, 1461–1471. doi: 10.1111/j.1469-7610.1994.tb01287.x
Happé, F. (1999). Autism: cognitive deficit or cognitive style? Trends Cogn. Sci. 3,216–222. doi: 10.1016/s1364-6613(99)01318-2
Happé, F., and Frith, U. (2006). The weak coherence account: detail-focusedcognitive style in autism spectrum disorders. J. Autism Dev. Disord. 36, 5–25.doi: 10.1007/s10803-005-0039-0
Happé, F., Ronald, A., and Plomin, R. (2006). Time to give up on a singleexplanation for autism. Nat. Neurosci. 9, 1218–1220. doi: 10.1038/nn1770
Jackson, B. L., Blackwood, E. M., Blum, J., Carruthers, S. P., Nemorin, S.,Pryor, B. A., et al. (2013). Magno- and parvocellular contrast responses invarying degrees of autistic trait. PLoS One 8:e66797. doi: 10.1371/journal.pone.0066797
Jemel, B., Mimeault, D., Saint-Amour, D., Hosein, A., andMottron, L. (2010). VEPcontrast sensitivity responses reveal reduced functional segregation of mid andhigh filters of visual channels in autism. J. Vis. 10:13. doi: 10.1167/10.6.13
Jones, C. R. G., Swettenham, J., Charman, T., Marsden, A. J. S., Tregay, J.,Baird, G., et al. (2011). No evidence for a fundamental visual motion processingdeficit in adolescents with autism spectrum disorders. Autism Res. 4, 347–357.doi: 10.1002/aur.209
Klistorner, A., Crewther, D. P., and Crewther, S. G. (1997). Separate magnocellularand parvocellular contributions from temporal analysis of the multifocal VEP.Vision Res. 37, 2161–2169. doi: 10.1016/s0042-6989(97)00003-5
Koldewyn, K., Whitney, D., and Rivera, S. M. (2010). The psychophysics ofvisual motion and global form processing in autism. Brain 133, 599–610.doi: 10.1093/brain/awp272
Kranzler, J. H., and Jensen, A. R. (1989). Inspection time and intelligence:a meta-analysis. Intelligence 13, 329–347. doi: 10.1016/s0160-2896(89)80006-6
Laycock, R., Crewther, S. G., and Crewther, D. P. (2007). A role for the‘magnocellular advantage’ in visual impairments in neurodevelopmental andpsychiatric disorders. Neurosci. Biobehav. Rev. 31, 363–376. doi: 10.1016/j.neubiorev.2006.10.003
Lincoln, A. J., Courchesne, E., Kilman, B. A., Elmasian, R., and Allen, M. (1988). Astudy of intellectual abilities in high-functioning people with autism. J. AutismDev. Disord. 18, 505–524. doi: 10.1007/bf02211870
Lux, S., Marshall, J. C., Ritzl, A., Weiss, P. H., Pietrzyk, U., Shah, N. J., et al. (2004).A functional magnetic resonance imaging study of local/global processing withstimulus presentation in the peripheral visual hemifields. Neuroscience 124,113–120. doi: 10.1016/j.neuroscience.2003.10.044
Maunsell, J. H., and Gibson, J. R. (1992). Visual response latencies in striate cortexof the macaque monkey. J. Neurophysiol. 68, 1332–1344.
Maunsell, J. H., Ghose, G. M., Assad, J. A., McAdams, C. J., Boudreau, C. E.,and Noerager, B. D. (1999). Visual response latencies of magnocellular andparvocellular LGN neurons in macaque monkeys. Vis. Neurosci. 16, 1–14.doi: 10.1017/s0952523899156177
Milner, A. D., and Goodale, M. A. (2008). Two visual systems re-viewed.Neuropsychologia 46, 774–785. doi: 10.1016/j.neuropsychologia.2007.10.005
Mottron, L., and Belleville, S. (1993). A study of perceptual analysis in a high-levelautistic subject with exceptional graphic abilities. Brain Cogn. 23, 279–309.doi: 10.1006/brcg.1993.1060
Mottron, L., Burack, J. A., Iarocci, G., Belleville, S., and Enns, J. T. (2003). Locallyoriented perception with intact global processing among adolescents withhigh-functioning autism: evidence from multiple paradigms. J. Child Psychol.Psychiatry 44, 904–913. doi: 10.1111/1469-7610.00174
Mottron, L., Dawson, M., Soulieres, I., Hubert, B., and Burack, J. (2006). Enhancedperceptual functioning in autism: an update and eight principles of autisticperception. J. Autism Dev. Disord. 36, 27–43. doi: 10.1007/s10803-005-0040-7
Muth, A., Hönekopp, J., and Falter, C. M. (2014). Visuo-spatial performancein autism: a meta-analysis. J. Autism Dev. Disord. 44, 3245–3263.doi: 10.1007/s10803-014-2188-5
Frontiers in Human Neuroscience | www.frontiersin.org 8 May 2017 | Volume 11 | Article 239
Brown and Crewther Parvocellular Efficiency, IQ, Global Perception
Navon, D. (1977). Forest before trees: the precedence of global features in visualperception. Cogn. Psychol. 9, 353–383. doi: 10.1016/0010-0285(77)90012-3
Nettelbeck, T. (1982). Inspection time: an index for intelligence?Q. J. Exp. Psychol.A 34, 299–312. doi: 10.1080/14640748208400843
Pei, F., Baldassi, S., Procida, G., Igliozzi, R., Tancredi, R., Muratori, F., et al. (2009).Neural correlates of texture and contour integration in children with autismspectrum disorders. Vision Res. 49, 2140–2150. doi: 10.1016/j.visres.2009.06.006
Pellicano, E., and Burr, D. (2012). When the world becomes ‘too real’: a Bayesianexplanation of autistic perception.Trends Cogn. Sci. 16, 504–510. doi: 10.1016/j.tics.2012.08.009
Plaisted, K., Swettenham, J., and Rees, L. (1999). Children with autism show localprecedence in a divided attention task and global precedence in a selectiveattention task. J. Child Psychol. Psychiatry 40, 733–742. doi: 10.1111/1469-7610.00489
Raven, J., Raven, J. C., and Court, J. H. (1998). Section 2: Coloured ProgressiveMatrices (1998 Edition). Introducing the Parallel Version of the Test. In Manualfor Raven’s Progressive Matrices and Vocabulary Scales. Great Brittain: OxfordPsychologist Press.
Rinehart, N. J., Bradshaw, J. L., Moss, S. A., Brereton, A. V., and Tonge, B. J. (2000).Atypical interference of local detail on global processing in high-functioningautism and Asperger’s disorder. J. Child Psychol. Psychiatry 41, 769–778.doi: 10.1111/1469-7610.00664
Rutherford, M. D., and Troje, N. F. (2012). IQ predicts biological motionperception in autism spectrum disorders. J. Autism Dev. Disord. 42, 557–565.doi: 10.1007/s10803-011-1267-0
Scheuffgen, K., Happé, F., Anderson, M., and Frith, U. (2000). High ‘‘intelligence,’’low ‘‘IQ’’? Speed of processing and measured IQ in children with autism. Dev.Psychopathol. 12, 83–90. doi: 10.1017/s095457940000105x
Schwarzkopf, D. S., Anderson, E. J., de Haas, B., White, S. J., and Rees, G. (2014).Larger extrastriate population receptive fields in autism spectrum disorders.J. Neurosci. 34, 2713–2724. doi: 10.1523/JNEUROSCI.4416-13.2014
Shah, A., and Frith, U. (1983). An islet of ability in autistic children: a researchnote. J. Child Psychol. Psychiatry 24, 613–620. doi: 10.1111/j.1469-7610.1983.tb00137.x
Shah, A., and Frith, U. (1993). Why do autistic individuals show superiorperformance on the block design task? J. Child Psychol. Psychiatry 34,1351–1364. doi: 10.1111/j.1469-7610.1993.tb02095.x
Simmons, D. R., Robertson, A. E., McKay, L. S., Toal, E., McAleer, P., andPollick, F. E. (2009). Vision in autism spectrum disorders. Vision Res. 49,2705–2739. doi: 10.1016/j.visres.2009.08.005
Supér, H., and Lamme, V. A. F. (2007). Altered figure-ground perceptionin monkeys with an extra-striate lesion. Neuropsychologia 45, 3329–3334.doi: 10.1016/j.neuropsychologia.2007.07.001
Sutherland, A., and Crewther, D. P. (2010). Magnocellular visual evoked potentialdelay with high autism spectrum quotient yields a neural mechanism for alteredperception. Brain 133, 2089–2097. doi: 10.1093/brain/awq122
Sutter, E. (2000). The interpretation of multifocal binary kernels.Doc. Ophthalmol.100, 49–75. doi: 10.1023/A:1002702917233
Van der Hallen, R., Evers, K., Brewaeys, K., Van den Noortgate, W.,and Wagemans, J. (2015). Global processing takes time: a meta-analysison local-global visual processing in ASD. Psychol. Bull. 141, 549–573.doi: 10.1037/bul0000004
Vandenbroucke, M. W., Scholte, H. S., van Engeland, H., Lamme, V. A., andKemner, C. (2008). A neural substrate for atypical low-level visual processingin autism spectrum disorder. Brain 131, 1013–1024. doi: 10.1093/brain/awm321
Wagemans, J., Elder, J. H., Kubovy, M., Palmer, S. E., Peterson, M. A., Singh, M.,et al. (2012). A century of Gestalt psychology in visual perception: I. Perceptualgrouping and figure-ground organization. Psychol. Bull. 138, 1172–1217.doi: 10.1037/a0029333
Wallace, G. L., Anderson, M., and Happé, F. (2009). Brief report: informationprocessing speed is intact in autism but not correlated with measuredintelligence. J. Autism Dev. Disord. 39, 809–814. doi: 10.1007/s10803-008-0684-1
Conflict of Interest Statement: The authors declare that the research wasconducted in the absence of any commercial or financial relationships that couldbe construed as a potential conflict of interest.
Copyright © 2017 Brown and Crewther. This is an open-access article distributedunder the terms of the Creative Commons Attribution License (CC BY). The use,distribution or reproduction in other forums is permitted, provided the originalauthor(s) or licensor are credited and that the original publication in this journalis cited, in accordance with accepted academic practice. No use, distribution orreproduction is permitted which does not comply with these terms.
Frontiers in Human Neuroscience | www.frontiersin.org 9 May 2017 | Volume 11 | Article 239