Author's personal copy - אוניברסיטת בן-גוריון בנגב...
11
This article appeared in a journal published by Elsevier. The attached copy is furnished to the author for internal non-commercial research and education use, including for instruction at the authors institution and sharing with colleagues. Other uses, including reproduction and distribution, or selling or licensing copies, or posting to personal, institutional or third party websites are prohibited. In most cases authors are permitted to post their version of the article (e.g. in Word or Tex form) to their personal website or institutional repository. Authors requiring further information regarding Elsevier’s archiving and manuscript policies are encouraged to visit: http://www.elsevier.com/authorsrights
Transcript of Author's personal copy - אוניברסיטת בן-גוריון בנגב...
This article appeared in a journal published by Elsevier. The attachedcopy is furnished to the author for internal non-commercial researchand education use, including for instruction at the authors institution
and sharing with colleagues.
Other uses, including reproduction and distribution, or selling orlicensing copies, or posting to personal, institutional or third party
websites are prohibited.
In most cases authors are permitted to post their version of thearticle (e.g. in Word or Tex form) to their personal website orinstitutional repository. Authors requiring further information
regarding Elsevier’s archiving and manuscript policies areencouraged to visit:
http://www.elsevier.com/authorsrights

Author's personal copy
Technical Note
A new failure mode chart for toppling and sliding with considerationof earthquake inertia force
G. Yagoda-Biran n, Y.H. HatzorDepartment of Geological and Environmental Sciences, Ben-Gurion University of the Negev, Beer-Sheva, Israel
a r t i c l e i n f o
Article history:Received 5 October 2012Received in revised form25 April 2013Accepted 28 August 2013Available online 20 September 2013
1. Introduction
Rock slope failures involving single plane sliding or toppling havebeen studied extensively in the past. The problem has typically beenformulated for the case of a block on an inclined plane. The model ofa block on an inclined plane can help simulate many problems inrock slope engineering: it can be used to represent finite rock blocksformed by intersections of steeply inclined joints and shallowlyinclined bedding planes and thus it can sometimes be used tosimulate landslides or rock slides. The simplicity of the model andits attractive applicability calls for development of analytical solu-tions as these are quite useful in practice.
A block on an incline has four different possible modes of failure(Fig. 1): (1) static stability, (2) downslope sliding, (3) toppling andsliding simultaneously and (4) rotation and toppling. The failuremode is controlled by the geometry of both the block and theinclined plane, and the frictional resistance of the interface betweenthem, the three of which are defined by three angles as follows(Fig. 1): δ, the block aspect angle defined by the ratio of the blockwidth b and height h; α, the inclination angle of the slope, will bereferred to herein as the slope angle; and ϕ, the friction angle of theinterface between the slope and the block. Any combination of thesethree angles will determine whether the block will move or not, andif so, what will be the mode of its first motion. Clearly, correctassessment of the failure mode is a prerequisite for correct riskassessment and sound support design.
Ashby [1] and Hoek and Bray [2] derived and plotted the modesof failure for the case of block on an incline in δ–α space usingstatic limit equilibrium analysis (LEA). Static LEA implies finding
the forces acting on the block at a state of limiting equilibrium,namely, before imminent failure. Ashby's [1] and Hoek and Bray's[2] chart is presented in Fig. 2.
According to results of the static LEA performed by Ashby [1]and Hoek and Bray [2], when αoϕ the block will either bestable (δ4α) or topple (δoα). When α4ϕ the block will eitherslide (δ4α), or slide and topple simultaneously (δoα). Theoriginal boundaries between those failure modes are assignednumbers here (Fig. 2); these numbers will be referred to hereinwhen discussing failure mode boundaries.
Voegele [3] compared the analytical results with distinctelement method (DEM) simulations and discovered that in somecases while the block should have failed in sliding and topplingaccording to the mode chart in Fig. 2, in fact it experienced slidingalone when studied with DEM. Thus, he concluded that the Hoekand Bray [2] chart was too elementary to predict the exactdynamic behavior of slender blocks resting on an inclined plane.
Bray and Goodman [4] re-visited this problem and treated bound-ary 3 in Fig. 2 as a “dynamic” boundary. Their approach changed thecondition for sliding to α4ϕ, and δZϕ (Fig. 3). Yu et al. [5] laterfound that results of DEM simulations and physical models agree withBray and Goodman's [4] modified chart.
Sagaseta [6] argued that Bray and Goodman's modificationis correct but incomplete because at boundary 4 the state ofequilibrium is dynamic rather than static; the derivation of theequilibrium equations for that boundary is provided in his paper.Yeung [7] studied this problem with the two dimensionalDiscontinuous Deformation Analysis method (2D-DDA, [8–11])and compared his results to the chart published by Bray andGoodman [4]. He discovered that while 2D-DDA results agree withthe first three boundaries, reassuring the modification of Bray andGoodman [4] to boundary 3, there is a discrepancy betweenthe results obtained by 2D-DDA and the behavior predicted byboundary 4 in Bray and Goodman's chart. In some cases, whileBray and Goodman's chart predicts sliding and toppling, DDA
Contents lists available at ScienceDirect
journal homepage: www.elsevier.com/locate/ijrmms
International Journal ofRock Mechanics & Mining Sciences
1365-1609/$ - see front matter & 2013 Elsevier Ltd. All rights reserved.http://dx.doi.org/10.1016/j.ijrmms.2013.08.035
n Correspondence to: The Department of Geological and Environmental Sciences,Ben-Gurion University of the Negev, P.O. Box 653, 84105 Beer-Sheva, Israel.Tel.: þ972 8 6477855; fax: þ972 8 6472997.
E-mail address: [email protected] (G. Yagoda-Biran).
International Journal of Rock Mechanics & Mining Sciences 64 (2013) 122–131

Author's personal copy
results suggest toppling only. This led Yeung [7] to treat boundary4 as a dynamic boundary as well. The analytical solution forboundary 4 as derived by Yeung [7] is presented in the nextparagraph, with incorporation of dynamic effects into the solution.
When a block is on the verge of toppling, the hinge (center ofrotation; Fig. 4) tends to move upslope. This movement mayprevent sliding, even when permissible by virtue of kinematics,namely when ϕoα. Boundary 4 distinguishes between toppling
with and without sliding, therefore the analytical solution derivedby Yeung [7] assumes limiting friction (ϕ¼α). Fig. 4 schematicallydescribes the state of forces acting on the block at boundary 4.
The block is under pure rotation, therefore its angular accel-eration €θ at the hinge and at the centroid is identical. The forcesacting on the block are its weight mg, acting at the centroid, thenormal from the incline N, and the limiting friction force N tan ϕ,both acting at the hinge. Applying Newton's second law, bothparallel and perpendicular to the slope, and taking moments aboutthe centroid of the block, three equations with four variables( €θ, €u, ϕ and N) can be written as
mg sin α�N tan ϕ¼m €u cos δ ð1Þ
N�mg cos α¼m €u sin δ ð2Þ
N tan ϕh2�N
b2¼ 112
mðh2þb2Þ €θ ð3Þ
The following equation relates €θ and €u:
€u¼ 12€θffiffiffiffiffiffiffiffiffiffiffiffiffiffiffih2þb2
qð4Þ
Solving the set of equations yields the following equation for afriction angle satisfying boundary 4, with any combination of αand δː
tan ϕ¼ 3 sin δ cos ðα�δÞþ sin α3 cos δ cos ðα�δÞþ cos α
ð5Þ
or
tan α¼ 3 cos 2δ tan ϕ�3 sin δ cos δþ tan ϕ3 sin 2δ�3 sin δ cos δ tan ϕþ1
ð6Þ
A modified chart for different modes after correction of boundary4 for dynamic LEA is presented in Fig. 5 following Yeung [7],for the case of ϕ¼301. With the modified boundary 4 Yeung hasobtained good agreement between 2D-DDA and the modifiedkinematic chart.
In a classic paper Goodman and Bray [12] further developed astatic LEA solution for the toppling failure of multiple blocks, whenthe slope is represented by a series of blocks resting on a steppedbasal discontinuity. They distinguished between three modes:block toppling, flexural toppling, and both block and flexuraltoppling. Following Goodman and Bray, flexural toppling andblock toppling have been further investigated by many groups,both analytically [13–19], experimentally [13,20] and numerically[16,21,22]. The mode of block slumping has also been studiedanalytically, experimentally and numerically by [23].
Fig. 1. Sign convention for the block on an inclined plane model used in this paper.
Fig. 2. Kinematic conditions for sliding and toppling for a block on an inclinedplane – static analysis; after [1].
Fig. 3. Kinematic conditions for sliding and toppling with the modified boundary 3;after [4].
Fig. 4. The dynamics of the block at boundary 4. The block is toppling, hence it hasrotational acceleration from which linear acceleration €u is derived, and is on theverge of sliding. The rotation hinge is marked with a star; after [7].
G. Yagoda-Biran, Y.H. Hatzor / International Journal of Rock Mechanics & Mining Sciences 64 (2013) 122–131 123

Author's personal copy
2. Three dimensional visualization of the kinematicmode chart
In the introduction section we have shown that the mode offailure of a single block on an incline depends on three variables:the angles α, ϕ and δ. A three dimensional representation of themode chart is therefore called for, as presented in Fig. 6. The 3Dspace, the three axes of which are the three angles, is divided intothe four regions of block behavior, namely Mode 1 – stable, Mode2 – sliding, Mode 3 – sliding and toppling, and Mode 4 – toppling.Consider Fig. 6a, the different failure modes are plotted as follows:
Mode 1, the stable mode, is above the red surface (delineatingthe α¼δ surface) and to the left of the blue surface (delineatingthe α¼ϕ surface).
Mode 2, the sliding mode, is above the green surface (delineat-ing the ϕ¼δ surface) and to the right of the blue surface(delineating the α¼ϕ surface).Mode 3, the sliding and toppling mode, is below the greensurface, indicating the ϕ¼δ surface, and in front of the curvedsurface representing Eq. (6) (note that in this view the curvedsurface is actually behind the green surface).Mode 4, or the toppling mode, is below the red surface,indicating α¼δ , and behind the curved surface representingEq. (6).
Fig. 6a presents the 3D space from a point of view similarto those of Figs. 2, 3 and 5 but for different values of ϕ. In Fig. 6bwe map the 3D boundaries as viewed from vector (�1, �1, �1).When using (�1, �1, �1) as a viewing vector, vector (1, 1, 1)is reduced to a point, and the surfaces separating the differentmodes are reduced to lines. With this mapping the 3D spaceappears as a 2D space where it is easier to perceive the boundariesbetween the four modes.
3. Adding pseudo-static inertia force to toppling analysis
When trying to determine stability and failure mode underseismic conditions, a common practice in geotechnical engineeringis to impose a static force, acting at the centroid of the blockin the direction that drives the failure, which simulates thedestabilizing effects of an earthquake. Typically, the peak groundacceleration (PGA) of the earthquake record is converted into apseudo-static horizontal force F acting at the centroid, normal-ized by the block weight W, and the pseudo-static coefficient k isdefined, i.e. F ¼ kW . Fig. 7 illustrates the schematics of the block onan incline problem with a horizontal static force F. When addingthe pseudo-static force F, a new angle β is introduced, defined hereas the angle between the block self-weight W and the resultant offorce F and block self-weight W (see Fig. 7), namely:
tan β¼ FW
¼ k ð7Þ
Fig. 6. Kinematic conditions for toppling and sliding. (a) a point of view similar to Figs. 2, 3 and 5. (b) Isometric point of view, viewing vector (�1, �1, �1).
Fig. 5. Kinematic conditions for sliding and toppling with modified boundary 4, forϕ¼301; after [7].
G. Yagoda-Biran, Y.H. Hatzor / International Journal of Rock Mechanics & Mining Sciences 64 (2013) 122–131124

Author's personal copy
In this section a mode analysis for the block on an incline problemwith horizontal force F ¼ kW is derived.
3.1. Boundary 1: between toppling and stable modes
The forces acting on the block at this boundary are W, F, Nand the frictional resistance. At the onset of toppling the normaland the frictional forces act at the hinge, therefore they do notcontribute to the moments acting on the block. In order forthe block to remain stable against toppling, the line of action ofthe resultant of F and W must pass through the hinge, and so itproduces no moments as well. In other words, the stabilizingmoments have to be equal to the driving moments at a state oflimiting equilibrium
12bW cos α¼ 1
2hW sin αþ1
2hF cos αþ1
2bF sin α ð8Þ
Inserting the definition of β into Eq. (8) yields
bh¼ sin αþ cos α tan β
cos α� sin α tan β¼ tan αþ tan β1� tan α tan β
¼ tan ðαþβÞ ð9Þ
Therefore at the point of limiting equilibrium with respect totoppling
δ¼ αþβ ð10ÞIf δoαþβ, the block will topple. If δ4αþβ, the block will nottopple.
3.2. Boundary 2: between sliding and stable modes
At the point of imminent sliding friction is limiting, thereforethe force preventing sliding at the point of limiting equilibriumwith respect to sliding is N tan ϕ. Force equilibrium parallel to thesliding direction yields
N tan ϕ¼ F cos αþW sin α ð11ÞForce equilibrium perpendicular to the sliding direction yields
N¼W cos α�F sin α ð12ÞInserting Eq. (12) into Eq. (11), and using results from Eq. (9), yields
tan ϕ¼ F cos αþW sin αW cos α�F sin α
¼ sin αþ cos α tan βcos α� sin α tan β
¼ tan ðαþβÞ
ð13ÞTherefore the limiting condition for sliding is ϕ¼ αþβ.
3.3. Boundary 3: between sliding and slidingþtoppling modes
Bray and Goodman [4] treated boundary 3 as a dynamic one,since the block is both sliding and on the verge of toppling.According to Newton's second law, the force equilibrium in the
downslope direction is
F cos αþW sin α�N tan ϕ¼m €u ð14ÞForce equilibrium perpendicular to the slope yields
N¼W cos α�F sin α ð15ÞFinding €u from Eqs. (14) and (15), and using Eq. (7), yields
m €u¼ F cos αþW sin α� tan ϕðW cos α�F sin αÞ¼W ½ tan β cos αþ sin α� tan ϕð cos α� tan β sin αÞ�
ð16ÞSince the block is on the verge of rotating, the sum of momentsabout the hinge is (see Fig. 7)
h2F cos αþb
2F sin αþh
2W sin α¼ b
2W cos αþh
2m €u ð17Þ
Substituting Eq. (16) into Eq. (17) yields
b=h¼ tan ϕ δ¼ϕ ð18ÞTherefore, the limiting condition for dynamic equilibrium forboundary 3 is δ¼ϕ.
3.4. Boundary 4: between toppling and slidingþtoppling modes
Yeung [7] treated boundary 4 as a dynamic boundary becauseat this boundary the block is toppling and on the verge of sliding.According to Newton's second law, force equilibrium in the down-slope direction yields
F cos αþW sin α�N tan ϕ¼m €u cos δ ð19Þand the force equilibrium perpendicular to the slope yields
F sin αþN�W cos α¼m €u sin δ ð20ÞTaking moments about the centroid (since at the onset of slidingthe angular acceleration is uniform about the block) will againyield Eq. (3). Solving Eqs. (3), (4), (19) and (20) yields
tan ϕ¼ 3 sin δ cos ½δ�ðαþβÞ�þ sin ðαþβÞ3 cos δ cos ½δ�ðαþβÞ�þ cos ðαþβÞ
¼ 3 sin δ cos ðδ�ψ Þþ sin ψ3 cos δ cos ðδ�ψ Þþ cos ψ
ð21Þ
The complete derivation of boundary 4 is provided in theAppendix.
To summarize, in the case where a horizontal force of sizeF ¼ kW acts on the centroid of the block, the boundaries ofthe failure modes become a function of three angles: ϕ, δ andψ¼αþβ, instead of α for the case of gravitational loading alone.Alternatively, if using k instead of β is preferable in the definitionof ψ, then
ψ ¼ tan�1 kþ tan α1�k tan α
ð22Þ
4. Verification of the dynamic toppling and slidingboundaries with DDA
As mentioned earlier, Yeung [7] verified the 2D-DDA with theanalytical solutions of mode analysis under gravitational loading.He found that the 2D-DDA results agreed well with the analyticalsolution for sliding or toppling and has utilized the DDA results tomodify the dynamic boundary between toppling and slidingþtop-pling (boundary 4). Here we use both 2D and 3D-DDA to verify ourpseudo-static analysis which considers an additional inertia force.DDA basics will not be reviewed here; the fundamentals of DDAhave been published by Shi and Goodman [11]; for a comprehen-sive review see [24]. The extension of DDA to three dimensions hasbeen published by Shi [25] and will not be reviewed here either.
Fig. 7. Force diagram for a block on an incline with pseudo-static force F. The hingeof rotation is marked by a star.
G. Yagoda-Biran, Y.H. Hatzor / International Journal of Rock Mechanics & Mining Sciences 64 (2013) 122–131 125

Author's personal copy
Since the 3D-DDA code is relatively new, it has not beenextensively verified as the 2D-DDA code. We begin with verifica-tion of 3D-DDA using the existing analytical solution for the fourfailure modes of the block on an incline problem, discussed inSection 4.1. Once verified, we use 2D and 3D-DDA to confirm ourmodified boundaries which also consider pseudo-static loading, inSections 4.2 and 4.3, respectively.
The block and the incline are modeled in the DDA, and ameasurement point, of which displacements and rotations aredocumented throughout the simulations, is placed at the hinge(see Fig. 7). The displacements and rotations of the measure-ment point for the first 0.5 s of the simulation are thenexamined, and their values determine the nature of the failuremode. It is important to state here that in DDA the rotationsare uniform throughout the block, because of the first orderapproximation.
The following criteria are adopted to judge the obtained failuremode from DDA output:
� The block is considered stable if the recorded displacements atthe measurement point are less than 0.001 m and attainstabilization, and if the rotation is less than 0.0001 rad.
� The block is sliding if the displacements are more than 0.001 mand the block accelerates, and if the rotation is less than0.0001 rad.
Fig. 8. Flow chart describing criteria for determination of failure mode in numericalsimulations.
Table 1Numerical and physical parameters used for 3D-DDAverification study.
Parameter Value
Static-dynamic parameter 1 (fully dynamic)Maximum displacement ratio 0.0001Maximum time step interval 0.00001 sNormal contact spring stiffness 1�109 N/mDensity 2730 kg/m3
Young's modulus 42.9 GPaPoisson's ratio 0.18
Table 2Numerical and physical parameters used for 2D-DDA ver-ification study by Yeung [7].
Parameter Value
Static-dynamic parameter 0 (fully static)Maximum displacement ratio 0.005Maximum time step interval 0.05 sNormal contact spring stiffness 1�1010 N/mDensity 3000 kg/m3
Young's modulus 10 GPaPoisson's ratio 0.49
Table 3Analytical mode analysis vs. 3D-DDA results for gravitational loading.
α ϕ δ Mode predicted byanalytical solution
Mode obtained by DDA
15 20 14 toppling toppling15 20 14.4 toppling toppling15 20 14.8 toppling toppling15 20 15.2 stable stable15 20 15.6 stable stable15 20 16 stable stable15 20 30 stable stable15 20 50 stable stable15 20 70 stable stable40 20 19 slidingþtoppling slidingþtoppling40 20 19.8 slidingþtoppling slidingþtoppling40 20 20.2 sliding sliding40 20 21 sliding sliding40 20 30 sliding sliding14 20 15 stable stable14.8 20 15 stable stable15.2 20 15 toppling toppling15.6 20 15 toppling toppling16 20 15 toppling toppling30 20 15 toppling toppling40 20 15 slidingþtoppling slidingþtoppling50 20 15 slidingþtoppling slidingþtoppling10 20 50 stable stable19 20 50 stable stable19.8 20 50 stable stable20.2 20 50 sliding stable20.6 20 50 sliding stable21 20 50 sliding sliding30 20 50 sliding sliding40 20 50 sliding sliding50 20 50 sliding sliding30 40 30.96 stable stable10 20 30.96 stable stable50 60 56.31 stable stable30 5 11.31 sliding sliding10 5 8.53 sliding sliding50 45 56.31 sliding sliding30 40 11.31 toppling toppling10 20 8.53 toppling toppling50 60 38.66 toppling toppling50 45 38.66 toppling toppling30 30 11.3 slidingþtoppling slidingþtoppling10 9 8.53 slidingþtoppling slidingþtoppling22 20 50 sliding sliding20.8 20 50 sliding sliding15 20 10 toppling toppling22 20 10 toppling toppling30 20 11.31 toppling toppling37 20 11.31 toppling toppling37 20 15 toppling toppling22 20 18 toppling toppling
Table 4Physical and numerical parameters used in the 2D-DDAwith external force F.
Parameter Value
Static-dynamic parameter 1 (fully dynamic)Maximum displacement ratio 0.001Maximum time step interval 0.001 sNormal contact spring stiffness 1�1010 N/mDensity 2730 kg/m3
Young's modulus 42.9 GPaPoisson's ratio 0.18
G. Yagoda-Biran, Y.H. Hatzor / International Journal of Rock Mechanics & Mining Sciences 64 (2013) 122–131126
Author's personal copy
� The block is toppling if the displacements are less than0.001 m, but the rotation is more than 0.0001 rad.
� The block is sliding and toppling if both the displacement islarger than 0.001 m and the rotation is larger than 0.0001 rad.
A flow chart describing the failure mode judgment criteria forDDA output is presented in Fig. 8. The numerical control para-meters used in the DDA verification are provided in Tables 1 and 4.
4.1. Verification of 3D-DDA with mode analysis charts undergravitational loading
The numerical and physical parameters used in the verificationstudy of the 3D-DDA are presented in Table 1. For the sake ofcomparison with the original verification study performed byYeung [7] the control parameters used in his analysis are providedin Table 2. As can be observed from Tables 1 and 2, the density andYoung's modulus are of the same order of magnitude, whereas thetime step interval and the normal contact spring stiffness in3D-DDA are three and one orders of magnitude lower, respec-tively. The friction angle selected for the study was 201 in mostanalyses. The list of analyses performed in the verification study isprovided in Table 3. Projection of the results on the three-dimensional mode chart is presented in Fig. 9. The agreementbetween the 3D-DDA and the analytical solution is excellent.
4.2. Verification of the mode analysis charts with 2D-DDA forpseudo-static force
The 2D-DDA has been verified many times in the past, and hasproved to be a useful and reliable tool for numerical modeling ofdiscontinuous problems in geomechanics and rock mechanics[26–28]. Therefore we use the 2D-DDA to confirm the analyticalsolution derived for a block on an incline subjected to gravity and ahorizontal pseudo-static force. The physical and numerical para-meters used in the 2D-DDA simulations are presented in Table 4.The time step size that can be used in the 2D-DDA is 100 timeslarger than the one used in 3D-DDA.
Since the addition of an external force F introduces a new angleto the mode chart, the angle ψ¼αþβ, different values for ψ can begenerated by changing β (through a change in F) without changingα. This allows for fast modeling and multiple simulations using thesame DDA mesh. The α used in the verification study was 101.Table 5 lists the different simulations and their results for the2D-DDA verification.
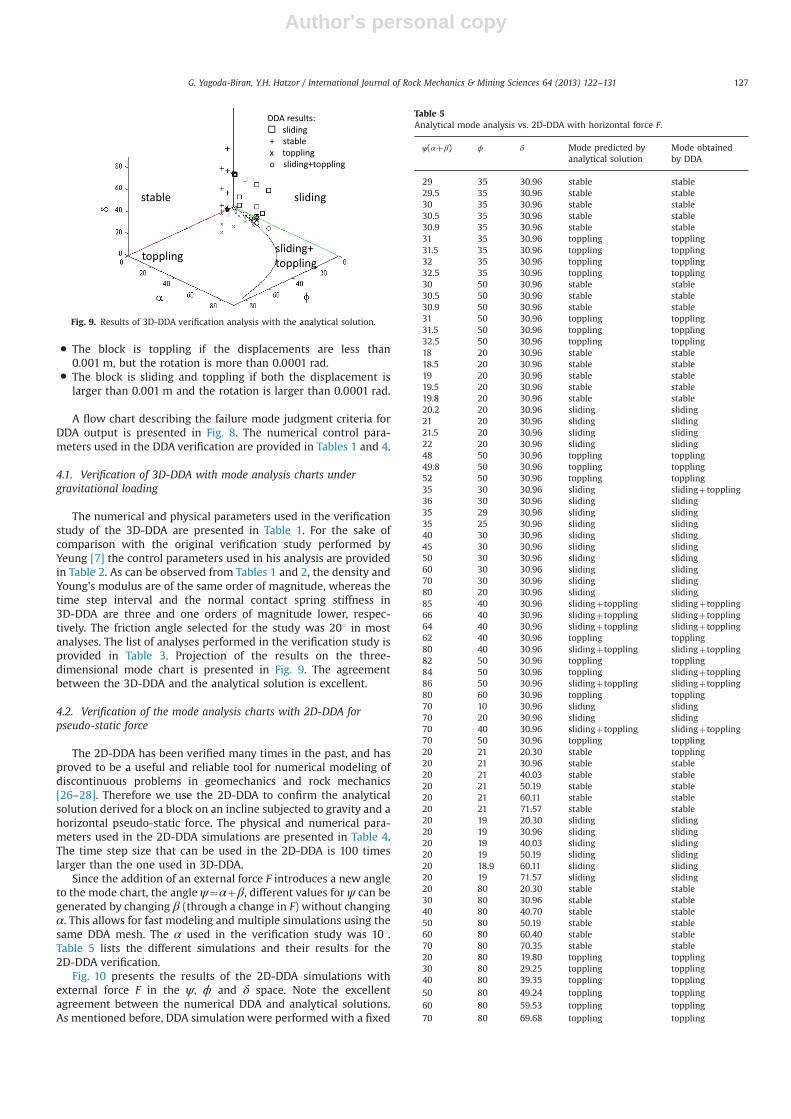
Fig. 10 presents the results of the 2D-DDA simulations withexternal force F in the ψ, ϕ and δ space. Note the excellentagreement between the numerical DDA and analytical solutions.As mentioned before, DDA simulation were performed with a fixed
Fig. 9. Results of 3D-DDA verification analysis with the analytical solution.
Table 5Analytical mode analysis vs. 2D-DDA with horizontal force F.
ψ(αþβ) ϕ δ Mode predicted byanalytical solution
Mode obtainedby DDA
29 35 30.96 stable stable29.5 35 30.96 stable stable30 35 30.96 stable stable30.5 35 30.96 stable stable30.9 35 30.96 stable stable31 35 30.96 toppling toppling31.5 35 30.96 toppling toppling32 35 30.96 toppling toppling32.5 35 30.96 toppling toppling30 50 30.96 stable stable30.5 50 30.96 stable stable30.9 50 30.96 stable stable31 50 30.96 toppling toppling31.5 50 30.96 toppling toppling32.5 50 30.96 toppling toppling18 20 30.96 stable stable18.5 20 30.96 stable stable19 20 30.96 stable stable19.5 20 30.96 stable stable19.8 20 30.96 stable stable20.2 20 30.96 sliding sliding21 20 30.96 sliding sliding21.5 20 30.96 sliding sliding22 20 30.96 sliding sliding48 50 30.96 toppling toppling49.8 50 30.96 toppling toppling52 50 30.96 toppling toppling35 30 30.96 sliding slidingþtoppling36 30 30.96 sliding sliding35 29 30.96 sliding sliding35 25 30.96 sliding sliding40 30 30.96 sliding sliding45 30 30.96 sliding sliding50 30 30.96 sliding sliding60 30 30.96 sliding sliding70 30 30.96 sliding sliding80 20 30.96 sliding sliding85 40 30.96 slidingþtoppling slidingþtoppling66 40 30.96 slidingþtoppling slidingþtoppling64 40 30.96 slidingþtoppling slidingþtoppling62 40 30.96 toppling toppling80 40 30.96 slidingþtoppling slidingþtoppling82 50 30.96 toppling toppling84 50 30.96 toppling slidingþtoppling86 50 30.96 slidingþtoppling slidingþtoppling80 60 30.96 toppling toppling70 10 30.96 sliding sliding70 20 30.96 sliding sliding70 40 30.96 slidingþtoppling slidingþtoppling70 50 30.96 toppling toppling20 21 20.30 stable toppling20 21 30.96 stable stable20 21 40.03 stable stable20 21 50.19 stable stable20 21 60.11 stable stable20 21 71.57 stable stable20 19 20.30 sliding sliding20 19 30.96 sliding sliding20 19 40.03 sliding sliding20 19 50.19 sliding sliding20 18.9 60.11 sliding sliding20 19 71.57 sliding sliding20 80 20.30 stable stable30 80 30.96 stable stable40 80 40.70 stable stable50 80 50.19 stable stable60 80 60.40 stable stable70 80 70.35 stable stable20 80 19.80 toppling toppling30 80 29.25 toppling toppling40 80 39.35 toppling toppling50 80 49.24 toppling toppling60 80 59.53 toppling toppling70 80 69.68 toppling toppling
G. Yagoda-Biran, Y.H. Hatzor / International Journal of Rock Mechanics & Mining Sciences 64 (2013) 122–131 127
Author's personal copy
inclination angle of 101, and the angle ψ was altered by the force F.A few simulations were performed with different inclinationangles, to make sure results of the simulations are repeated.
4.3. Verification of the mode analysis charts with 3D-DDAfor pseudo-static force
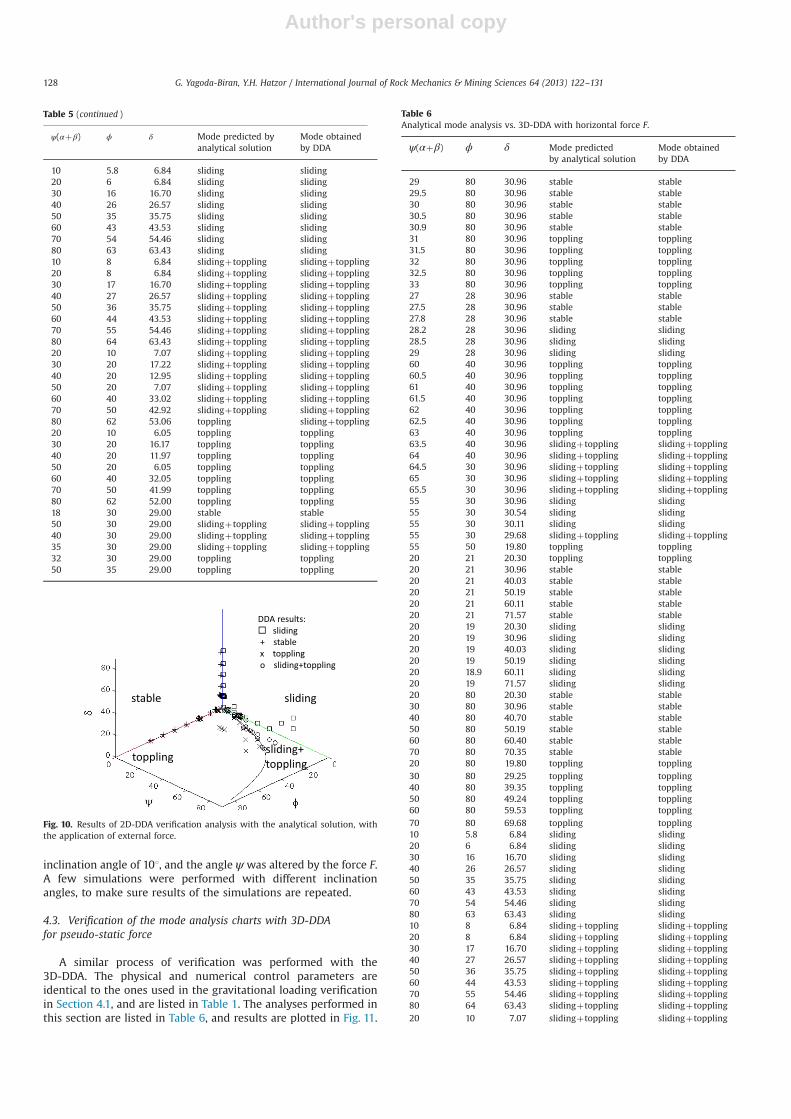
A similar process of verification was performed with the3D-DDA. The physical and numerical control parameters areidentical to the ones used in the gravitational loading verificationin Section 4.1, and are listed in Table 1. The analyses performed inthis section are listed in Table 6, and results are plotted in Fig. 11.
Table 5 (continued )
ψ(αþβ) ϕ δ Mode predicted byanalytical solution
Mode obtainedby DDA
10 5.8 6.84 sliding sliding20 6 6.84 sliding sliding30 16 16.70 sliding sliding40 26 26.57 sliding sliding50 35 35.75 sliding sliding60 43 43.53 sliding sliding70 54 54.46 sliding sliding80 63 63.43 sliding sliding10 8 6.84 slidingþtoppling slidingþtoppling20 8 6.84 slidingþtoppling slidingþtoppling30 17 16.70 slidingþtoppling slidingþtoppling40 27 26.57 slidingþtoppling slidingþtoppling50 36 35.75 slidingþtoppling slidingþtoppling60 44 43.53 slidingþtoppling slidingþtoppling70 55 54.46 slidingþtoppling slidingþtoppling80 64 63.43 slidingþtoppling slidingþtoppling20 10 7.07 slidingþtoppling slidingþtoppling30 20 17.22 slidingþtoppling slidingþtoppling40 20 12.95 slidingþtoppling slidingþtoppling50 20 7.07 slidingþtoppling slidingþtoppling60 40 33.02 slidingþtoppling slidingþtoppling70 50 42.92 slidingþtoppling slidingþtoppling80 62 53.06 toppling slidingþtoppling20 10 6.05 toppling toppling30 20 16.17 toppling toppling40 20 11.97 toppling toppling50 20 6.05 toppling toppling60 40 32.05 toppling toppling70 50 41.99 toppling toppling80 62 52.00 toppling toppling18 30 29.00 stable stable50 30 29.00 slidingþtoppling slidingþtoppling40 30 29.00 slidingþtoppling slidingþtoppling35 30 29.00 slidingþtoppling slidingþtoppling32 30 29.00 toppling toppling50 35 29.00 toppling toppling
Table 6Analytical mode analysis vs. 3D-DDA with horizontal force F.
ψ(αþβ) ϕ δ Mode predictedby analytical solution
Mode obtainedby DDA
29 80 30.96 stable stable29.5 80 30.96 stable stable30 80 30.96 stable stable30.5 80 30.96 stable stable30.9 80 30.96 stable stable31 80 30.96 toppling toppling31.5 80 30.96 toppling toppling32 80 30.96 toppling toppling32.5 80 30.96 toppling toppling33 80 30.96 toppling toppling27 28 30.96 stable stable27.5 28 30.96 stable stable27.8 28 30.96 stable stable28.2 28 30.96 sliding sliding28.5 28 30.96 sliding sliding29 28 30.96 sliding sliding60 40 30.96 toppling toppling60.5 40 30.96 toppling toppling61 40 30.96 toppling toppling61.5 40 30.96 toppling toppling62 40 30.96 toppling toppling62.5 40 30.96 toppling toppling63 40 30.96 toppling toppling63.5 40 30.96 slidingþtoppling slidingþtoppling64 40 30.96 slidingþtoppling slidingþtoppling64.5 30 30.96 slidingþtoppling slidingþtoppling65 30 30.96 slidingþtoppling slidingþtoppling65.5 30 30.96 slidingþtoppling slidingþtoppling55 30 30.96 sliding sliding55 30 30.54 sliding sliding55 30 30.11 sliding sliding55 30 29.68 slidingþtoppling slidingþtoppling55 50 19.80 toppling toppling20 21 20.30 toppling toppling20 21 30.96 stable stable20 21 40.03 stable stable20 21 50.19 stable stable20 21 60.11 stable stable20 21 71.57 stable stable20 19 20.30 sliding sliding20 19 30.96 sliding sliding20 19 40.03 sliding sliding20 19 50.19 sliding sliding20 18.9 60.11 sliding sliding20 19 71.57 sliding sliding20 80 20.30 stable stable30 80 30.96 stable stable40 80 40.70 stable stable50 80 50.19 stable stable60 80 60.40 stable stable70 80 70.35 stable stable20 80 19.80 toppling toppling30 80 29.25 toppling toppling40 80 39.35 toppling toppling50 80 49.24 toppling toppling60 80 59.53 toppling toppling70 80 69.68 toppling toppling10 5.8 6.84 sliding sliding20 6 6.84 sliding sliding30 16 16.70 sliding sliding40 26 26.57 sliding sliding50 35 35.75 sliding sliding60 43 43.53 sliding sliding70 54 54.46 sliding sliding80 63 63.43 sliding sliding10 8 6.84 slidingþtoppling slidingþtoppling20 8 6.84 slidingþtoppling slidingþtoppling30 17 16.70 slidingþtoppling slidingþtoppling40 27 26.57 slidingþtoppling slidingþtoppling50 36 35.75 slidingþtoppling slidingþtoppling60 44 43.53 slidingþtoppling slidingþtoppling70 55 54.46 slidingþtoppling slidingþtoppling80 64 63.43 slidingþtoppling slidingþtoppling20 10 7.07 slidingþtoppling slidingþtoppling
Fig. 10. Results of 2D-DDA verification analysis with the analytical solution, withthe application of external force.
G. Yagoda-Biran, Y.H. Hatzor / International Journal of Rock Mechanics & Mining Sciences 64 (2013) 122–131128

Author's personal copy
Note the good agreement between the analytical solution and the3D-DDA.
5. Discussion
To demonstrate the applicability of the newly incorporatedpseudo-static force in the failure mode chart for block on an inclinedplane, two cases of blocks with different geometries are presented(Fig. 12), and the failure modes are calculated analytically. In the firstexample, a block of height¼1 m and width¼1.19 m (δ¼501) isresting on a plane inclined at α¼101. The friction of the interface isϕ¼301. Let us examine the mode of the block as a function of the kvalue, i.e. the pseudo-static coefficient. As explained earlier, a changein k will lead to a change in β, which in turn will change the value ofψ. We start with a k value of 0, increase it by intervals of 0.1, up to 0.8,and plot the combination of the three angles, δ, ϕ and ψ, for thechanging values of k on the three-dimensional plot (square symbolsin Fig. 12). For k values from 0 (no pseudo-static force) to 0.3, theblock remains in the stable region. For values of kZ0.4, thecombination of angles shifts the block to the sliding region. Thismeans that for the described set of angles, k value of 0.4 and greaterwould cause the block to fail in sliding. In the second example, ablock of height¼1 m and width¼0.27 m (δ¼151) is resting on thesame incline as in the previous example (Fig. 12). For k¼0, the blockis at rest. Increasing k to 0.1 is sufficient to cause toppling, and theblock will shift to the mode of slidingþtoppling when k exceeds thevalue of 1.35 (� symbols in Fig. 12). These two examples clearlydemonstrate how by simple calculations, our newmode chart can beused in order to predict the mode of failure of a block on an incline,when subjected to a pseudo-static force.
Now one may ask: why is pre-knowledge of the exact failure moderequired? In order to demonstrate the importance of determining thefailure mode of a block before a design strategy is decided, twosimulations were performed using the 2D-DDA, with k¼0, forsimplicity. The model used in the simulations is presented in Fig. 13.The model consists of a fixed base block, inclined at α¼251, a fixedback wall representing the rock mass, and a block which is kinema-tically free to move (see Fig. 13). The block angle, δ, is 221. The block isanchored to the back wall by three identical horizontal rock bolts(Fig. 13). The stiffness of the rock bolts is 321.7 MN/m. In the firstsimulation, the friction angleϕ is set to 151, a value that puts the blockin the sliding mode. In the second simulation, ϕ is set to 301, whichputs the block in the toppling mode. The physical and numericalcontrol parameters used in these simulations are listed in Table 4. InFig. 14 the bolt forces are plotted, for the two different simulations. Ascan be observed from Fig. 14, when the block is sliding the forces thatdevelop at the different bolts are very similar, with differences of up to
5%. When the block is toppling however, there is a great differencebetween the forces that develop in the different bolts, for example,250% difference between the top bolt and the bottom one. This way,when designing the support scheme for toppling failure, the engineercan use shorter bolts for the bottom part, and long ones for the top,while when designing support for sliding mode, similar bolt lengthsshould be used at all slope heights. This demonstrates how
Table 6 (continued )
ψ(αþβ) ϕ δ Mode predictedby analytical solution
Mode obtainedby DDA
30 20 17.22 slidingþtoppling slidingþtoppling40 20 12.95 slidingþtoppling slidingþtoppling50 20 7.07 slidingþtoppling slidingþtoppling60 40 33.02 slidingþtoppling slidingþtoppling70 50 42.92 slidingþtoppling slidingþtoppling80 62 53.06 slidingþtoppling slidingþtoppling20 10 6.05 toppling toppling30 20 16.17 toppling toppling40 20 11.97 toppling toppling50 20 6.05 toppling toppling60 40 32.05 toppling toppling70 50 41.99 toppling toppling80 62 52.00 toppling toppling30 80 30.96 stable stable30 80 29.25 toppling toppling Fig. 11. Results of 3D-DDA verification analysis with the analytical solution, with
the application of external force.
Fig. 12. Mode analysis for two block geometries: δ¼501 (square symbols) andδ¼151 (� symbols). For both geometries α¼101 and ϕ¼301. The mode of the blockchanges with changing value of k, the pseudo-static coefficient, denoted near thesymbols.
Fig. 13. The model used for the rock bolt force simulations.
G. Yagoda-Biran, Y.H. Hatzor / International Journal of Rock Mechanics & Mining Sciences 64 (2013) 122–131 129

Author's personal copy
determining the failure mode of a block, both under static andpseudo-static conditions, can greatly assist the engineer in designingthe most efficient support and stabilizing method.
6. Summary and conclusions
In this paper, we first review previous research regarding thefailure mode analysis for the problem of a block on an incline. Weplot, for the first time, the four possible modes (stability, sliding,slidingþtoppling and toppling) in a three dimensional space,as the modes are a function of three angles: the block angle δ(block width/block height), the friction angle of the interfacebetween the slope and the block ϕ, and the inclination of theslope α. We then derive a new failure mode chart, incorporatingthe frequently used pseudo-static approach. We verify the numer-ical 3D-DDA code with mode analysis for gravitational loading, andthen confirm the pseudo-static mode chart, derived in this paper,with the 2D and 3D-DDA.
In the new chart, derived in this paper, the mode of failure of theblock is again a function of three angles: δ, ϕ, and a new angle,ψ¼αþβ, where β is the angle between the resultant of the blockweight and the pseudo-static force applied on the block, and thevertical direction. Verification of the 3D-DDA with the formerlyderived analytical solution for a block on an inclined plane undergravitational loading alone proves the 3D-DDA can accurately solvethe problem. Furthermore, the 2D and 3D-DDA simulations of theblock subjected to pseudo-static horizontal force confirm the newanalytical boundaries derived here, and once again confirm thedynamic nature of boundary 4, which separates toppling from slidingand toppling.
When designing reinforcement for rock slopes that are suscep-tible for either sliding or toppling failure modes, it is crucial to takeinto account seismic forces that can affect the stability of the rockmass. The new chart for failure modes, with the incorporation of apseudo-static horizontal force simulating the seismic force of anearthquake, is an easy, more intuitive way to understand andpredict the behavior of rock masses subjected to seismic forces,when those are modeled as a pseudo-static horizontal force. Whenusing the new chart, the pseudo-static force for the mode analysisshould be carefully selected, taking into account seismic hazardassessments in the region discussed, and preferably site effects,where these are known.
Acknowledgments
This study is funded by Israel Science Foundation throughGrant ISF-2201, Contract no. 556/08.
Appendix. Derivation of boundary 4: between toppling andslidingþtoppling
For boundary 4, which is a dynamic boundary betweentoppling and toppling with sliding, the block is toppling, and onthe verge of sliding, i.e. friction is limiting. There are four unknownvariables {N, ϕ, ü, and θ}, and so four equations must be derived.Forces in the downslope direction
F cos αþW sin α¼N tan ϕþm €u cos δ ðA:1ÞForces perpendicular to slope
F sin αþN¼W cos αþm €u sin δ ðA:2ÞMoments about the centroid
12Nh tan ϕ¼ 1
2Nbþ 1
12mðh2þb2Þ €θ ðA:3Þ
And the relationship between the linear acceleration and rotationalacceleration
€u¼ 12€θffiffiffiffiffiffiffiffiffiffiffiffiffiffiffih2þb2
qðA:4Þ
Remembering that
h2þb2 ¼ h2 1þb2
h2
!¼ h2ð1þ tan 2δÞ ¼ h2
cos 2δðA:5Þ
Eq. (A.4) can be re-written as
€u¼€θh
2 cos δðA:6Þ
€θ¼ 2 €u cos δh
ðA:7Þ
Inserting Eq. (A.7) into Eq. (A.3)
Nðh tan ϕ�bÞ ¼m6
h2
cos 2δ2 €u cos δ
h¼ mh €u3 cos δ
ðA:8Þ
m €u¼N3 cos δðh tan ϕ�bÞ
h¼ 3N cos δ tan ϕ�b
h
� �¼ 3N cos δð tan ϕ� tan δÞ ðA:9Þ
Remembering that F ¼W tan β, and inserting Eq. (A.9), Eq. (A.1)becomes
W tan β cos αþW sin α¼N½ tan ϕþ3 cos 2δ tan ϕ� tan δ� ��
N¼ Wð tan β cos αþ sin αÞtan ϕþ3 cos 2δð tan ϕ� tan δÞ ðA:10Þ
Inserting Eqs. (A.10) and (A.9) into Eq. (A.2) yields
W tan β sin αþ Wð tan β cos αþ sin αÞtan ϕþ3 cos 2δð tan ϕ� tan δÞ
¼W cos αþ3Wð tan β cos αþ sin αÞ sin δ cos δð tan ϕ� tan δÞtan ϕþ3 cos 2δð tan ϕ� tan δÞ
ðA:11ÞFinding a common denominator and eliminating it on both sides ofthe equation yields
3 sin α cos 2δð tan ϕ� tan δÞ tan βþ sin α tan ϕ tan βþ sin αþ cos α tan β
¼ 3 cos α cos 2δð tan ϕ� tan δÞþ cos α tan ϕ
þ3 sin δ cos δð cos α tan βþ sin αÞð tan ϕ� tan δÞ ðA:12ÞThe left hand side of Eq. (A.12) becomes
tan ϕð sin α tan βþ3 sin α cos 2δ tan βÞ�3 sin α sin δ cos δ tan βþ cos α tan βþ sin α
Fig. 14. The forces developed at the rock bolts for the two simulations. Triangularsymbols: ϕ¼151, the block is sliding. Square symbols: ϕ¼301, the block is toppling.
G. Yagoda-Biran, Y.H. Hatzor / International Journal of Rock Mechanics & Mining Sciences 64 (2013) 122–131130

Author's personal copy
The right hand side of Eq. (A.12) becomes
tan ϕð3 cos α cos 2δþ cos αþ3 sin δ cos δ cos α tan βþ3 sin δ cos δ sin αÞ�3 cos α sin δ cos δ�3 sin 2δ cos α tan β�3 sin 2δ sin α
Combining from both sides of Eq. (A.12) all the expressions multi-plied by tan ϕ gives
3 sin α tan β cos 2δþ sin α tan β�3 sin δ cos δ sin α�3 sin δ cos δ cos α tan β�3 cos α cos 2δ� cos α
Multiply by cos β
3 sin α sin β cos 2δþ sin α sin β�3 sin δ cos δ sin α cos β�3 sin δ cos δ cos α sin β�3 cos α cos 2δ cos β� cos α cos β¼ 3 cos 2δð sin α sin β� cos α cos βÞ�3 sin δ cos δð sin α cos βþ cos α sin βÞþ sin α sin β� cos α cos β¼�3 cos 2δ cos ðαþβÞ�3 sin δ cos δ sin ðαþβÞ� cos ðαþβÞ
Combine from both sides of Eq. (A.12) all the expressions that arenot multiplied by tan ϕ
3ð sin α tan β sin δ cos δ� sin 2δ sin α� sin 2δ cos α tan β� cos α sin δ cos δÞ� sin α� cos α tan β
Multiplying by cos β
3ð sin α sin β sin δ cos δ� sin 2δ sin α cos β� sin 2δ cos α sin β
� cos α sin δ cos δ cos βÞ� sin α cos β� cos α sin β¼ 3½ sin δ cos δð sin α sin β
� cos α cos βÞ� sin 2δð sin α cos βþ cos α sin βÞ�� sin α cos β� cos α sin β¼ 3½� sin δ cos δ cos ðαþβÞ� sin 2δ sin ðαþβÞ�� sin ðαþβÞ
Combine both expressions
tan ϕ¼ 3½ sin δ cos δ cos ðαþβÞþ sin 2δ sin ðαþβÞ�þ sin ðαþβÞ3½ sin δ cos δ sin ðαþβÞþ cos 2δ cos ðαþβÞ�þ cos ðαþβÞ
¼ 3 sin δ½ cos δ cos ðαþβÞþ sin δ sin ðαþβÞ�þ sin ðαþβÞ3 cos δ½ cos δ cos ðαþβÞþ sin δ sin ðαþβÞ�þ cos ðαþβÞ
ðA:13ÞAnd finally
tan ϕ¼ 3 sin δ cos ½δ�ðαþβÞ�þ sin ðαþβÞ3 cos δ cos ½δ�ðαþβÞ�þ cos ðαþβÞ ðA:14Þ
References
[1] Ashby J.P. Sliding and toppling modes of failure in models and jointed rockslopes. MSc thesis. Imperial College; 1971.
[2] Hoek E, Bray JW. Rock slope engineering. London: The Institution of Miningand Metallurgy; 1977.
[3] Voegele M.D. Rational design of tunnel supports: an interactive graphics basedanalysis of the support requirements of excavations in jointed rock masses.
PhD thesis. Department of Civil and Mineral Engineering, University ofMinnesota; 1979.
[4] Bray JW, Goodman RE. The theory of base friction models. InternationalJournal of Rock Mechanics and Mining Sciences 1981;18:453–68.
[5] Yu Z, Ishijima Y, Sato M. Distinct element method – application to analysesliding and toppling failures. Nonferrous Metals 1987;39:1–11.
[6] Sagaseta C. On the modes of instability of a rigid block on an inclined plane.Rock Mechanics and Rock Engineering 1986;19:261–6.
[7] Yeung M.R. Application of Shi's Discontinuous Deformation Analysis to thestudy of rock behavior. PhD thesis. Department of Civil Engineering, Berkeley:University of California; 1991.
[8] Shi G. Discontinuous Deformation Analysis – a new numerical method for thestatics and dynamics of block system. PhD thesis. Department of CivilEngineering, Berkeley: University of California; 1988.
[9] Shi G. Block system modeling by Discontinuous Deformation Analysis. South-hampton: Computational Mechanics Publications; 1993.
[10] Shi G-H, Goodman RE. Two dimensional Discontinuous Deformation Analysis.International Journal for Numerical and Analytical Methods in Geomechanics1985;9:541–56.
[11] Shi G-H, Goodman RE. Generalization of two dimensional DiscontinuousDeformation Analysis for forward modelling. International Journal for Numer-ical and Analytical Methods in Geomechanics 1989;13:359–80.
[12] Goodman R.E., Bray J.W. Toppling of rock slopes. In: Proceedings of thespecialty conference on rock engineering for foundations and slopes. Boulder,Colorado: American Society of Civil Engineers; 1976. p. 201–34.
[13] Amini M, Majdi A, Aydan O. Stability analysis and the stabilisation of flexuraltoppling failure. Rock Mechanics and Rock Engineering 2009;42:751–82.
[14] Amini M, Majdi A, Veshadi MA. Stability analysis of rock slopes against block-flexure toppling failure. Rock Mechanics and Rock Engineering 2012;45:519–32.
[15] Aydan O, Kawamoto T. The stability of slopes and underground openingsagainst flexural toppling and their stabilization. Rock Mechanics and RockEngineering 1992;25:143–65.
[16] Bobet A. Analytical solutions for toppling failure. International Journal of RockMechanics and Mining Sciences 1999;36:971–80.
[17] Liu CH, Jaksa MB, Meyers AG. Improved analytical solution for topplingstability analysis of rock slopes. International Journal of Rock Mechanics andMining Sciences 2008;45:1361–72.
[18] Majdi A, Amini M. Analysis of geo-structural defects in flexural topplingfailure. International Journal of Rock Mechanics and Mining Sciences 2011;48:175–86.
[19] Sagaseta C, Sanchez JM, Canizal J. A general analytical solution for the requiredanchor force in rock slopes with toppling failure. International Journal of RockMechanics and Mining Sciences 2001;38:421–35.
[20] Adhikary DP, Dyskin AV, Jewell RJ, Stewart DP. A study of the mechanism offlexural toppling failure of rock slopes. Rock Mechanics and Rock Engineering1997;30:75–93.
[21] Brideau MA, Stead D. Controls on block toppling using a three-dimensionaldistinct element approach. Rock Mechanics and Rock Engineering 2010;43:241–60.
[22] Scholtes L, Donze FV. Modelling progressive failure in fractured rock massesusing a 3D discrete element method. International Journal of Rock Mechanicsand Mining Sciences 2012;52:18–30.
[23] Kieffer S.D. Rock Slumping – a compound failure mode of jointed hard rockslopes. PhD thesis. Department of Civil and Envonronmental Engineering,Berkeley: University of California; 1998.
[24] Jing LR. Formulation of discontinuous deformation analysis (DDA) – animplicit discrete element model for block systems. Engineering Geology1998;49:371–81.
[25] Shi G. Three dimensional discontinuous deformation analyses. In: Proceedingsof the 38th US rock mechanics symposium. Washington, DC; 2001. p. 1421–8.
[26] Kamai R, Hatzor YH. Numerical analysis of block stone displacements inancient masonry structures: a new method to estimate historic groundmotions. International Journal for Numerical and Analytical Methods inGeomechanics 2008;32:1321–40.
[27] MacLaughlin MM, Doolin DM. Review of validation of the discontinuousdeformation analysis (DDA) method. International Journal for Numerical andAnalytical Methods in Geomechanics 2006;30:271–305.
[28] Yagoda-Biran G, Hatzor YH. Constraining paleo PGA values by numericalanalysis of overturned columns. Earthquake Engineering and StructuralDynamics 2010;39:462–72.
G. Yagoda-Biran, Y.H. Hatzor / International Journal of Rock Mechanics & Mining Sciences 64 (2013) 122–131 131