Authorities Budget Office - New York · The Authorities Budget Office (ABO) ... from the targets...
65
Authorities Budget Office ● Accountability ● Transparency ● Integrity Annual Report on Public Authorities in New York State July 1, 2017
-
Upload
truongkien -
Category
Documents
-
view
214 -
download
0
Transcript of Authorities Budget Office - New York · The Authorities Budget Office (ABO) ... from the targets...

Authorities Budget Office
Authorities
Budget
Office
● Accountability
● Transparency
● Integrity
Annual Report on Public
Authorities in New York State
July 1, 2017

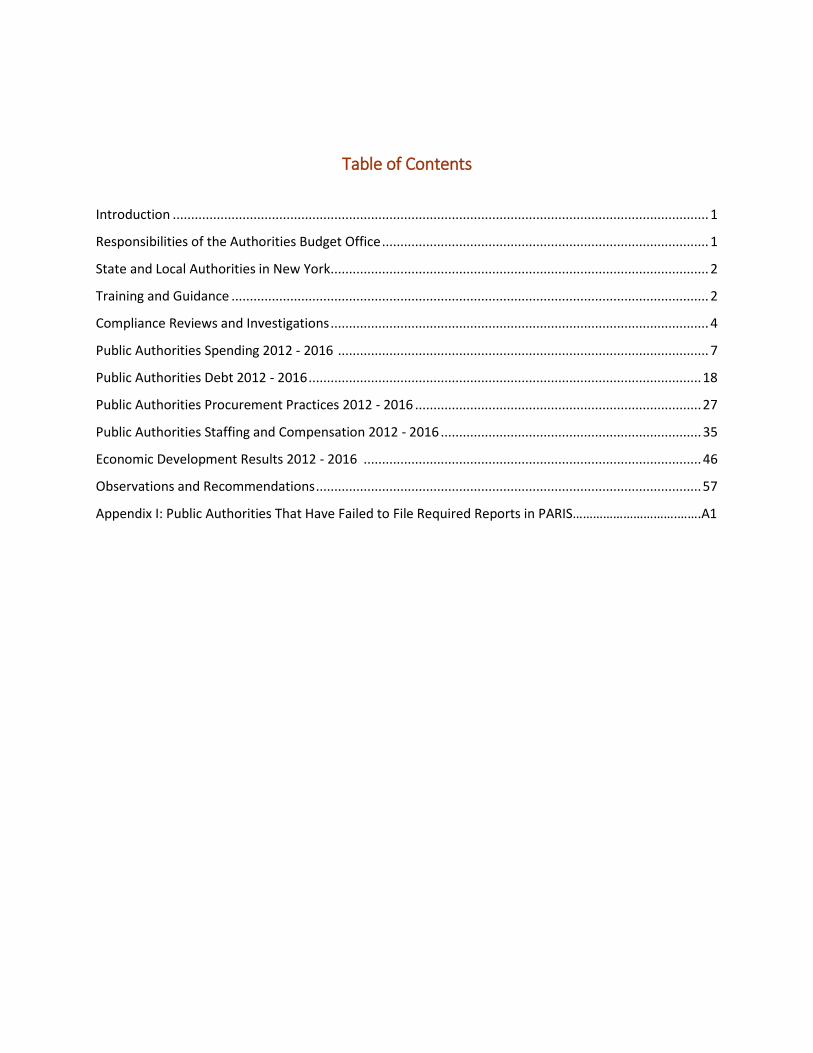
Table of Contents
Introduction .................................................................................................................................................. 1
Responsibilities of the Authorities Budget Office ......................................................................................... 1
State and Local Authorities in New York ....................................................................................................... 2
Training and Guidance .................................................................................................................................. 2
Compliance Reviews and Investigations ....................................................................................................... 4
Public Authorities Spending 2012 - 2016 ..................................................................................................... 7
Public Authorities Debt 2012 - 2016 ........................................................................................................... 18
Public Authorities Procurement Practices 2012 - 2016 .............................................................................. 27
Public Authorities Staffing and Compensation 2012 - 2016 ....................................................................... 35
Economic Development Results 2012 - 2016 ............................................................................................ 46
Observations and Recommendations ......................................................................................................... 57
Appendix I: Public Authorities That Have Failed to File Required Reports in PARIS………………………….…….A1

Authorities Budget Office 1
2017 Annual Report on Public Authorities in New York State
Introduction
The Authorities Budget Office (ABO) was first created in unconsolidated law as the Authority Budget Office
with enactment of the Public Authorities Accountability Act of 2005 (PAAA). The ABO was re-established
as an independent office in Title 2 of Public Authorities Law when the 2009 Public Authorities Reform Act
(PARA) took effect on March 1, 2010. From its inception, the ABO’s mission has been to make public
authorities more accountable and transparent and to act in ways consistent with their governing statutes
and public purpose. The ABO carries out its mission by: collecting, analyzing and disseminating to the
public information on the finances and operations of state and local public authorities; conducting reviews
to assess the operating and governance practices of public authorities and their compliance with state
laws; promoting good governance principles through training, policy guidance, the issuance of best
practices recommendations and assistance to public authority staff and board members; and investigating
complaints made against public authorities for noncompliance or inappropriate conduct. Consistent with
this public purpose, and pursuant to Section 7 of Title 2 of Public Authorities Law, the ABO also issues an
annual report which contains its conclusions, assessments and opinions on the performance of state and
local authorities. The 2017 Annual Report on Public Authorities in New York State is the eleventh annual
report released by the Authorities Budget Office.
Responsibilities of the Authorities Budget Office
The ABO’s powers and duties include collecting and analyzing financial and program information,
exercising oversight of public entities, and enforcing statutory requirements through its ability to conduct
investigations and sanction boards of directors. No other office in the country has a similar centralized
mission, including oversight of such a diverse system of more than 578 state and local public authorities.
The 2009 Public Authorities Reform Act provided the ABO with added enforcement powers to more
effectively carry out these duties and responsibilities. Key additional powers include the authority to:
Promulgate regulations necessary to effectuate the purposes of the Act.
Make recommendations to the Governor and the Legislature concerning changes in the terms of
office of board members.
Initiate investigations and act upon complaints received concerning the lack of compliance with
statutory requirements by state or local authorities.
Issue subpoenas in conjunction with such investigations.
Conduct examinations of the books, records, acts and practices of public authorities.
Publicly warn and censure authorities for non-compliance with the law and establish guidelines
governing such actions.
Recommend the suspension or dismissal of officers or directors who fail to act in accordance
with the law, their oath, or their fiduciary duty.
Authorities Budget Office 2
2017 Annual Report on Public Authorities in New York State
The ABO is headed by a Director, appointed by the Governor and confirmed by the State Senate. The
Director serves a fixed four year term to protect and assure the independence of the Office and can only
be removed for reasons of permanent disability, inefficiency, neglect of duty, malfeasance, illegal or
inappropriate conduct, or a breach of fiduciary duty.
State and Local Authorities in New York
New York State has a complex system of public authorities that are formed to achieve public or quasi-
public objectives, including financing, building and managing public projects or improving a variety of
governmental functions.
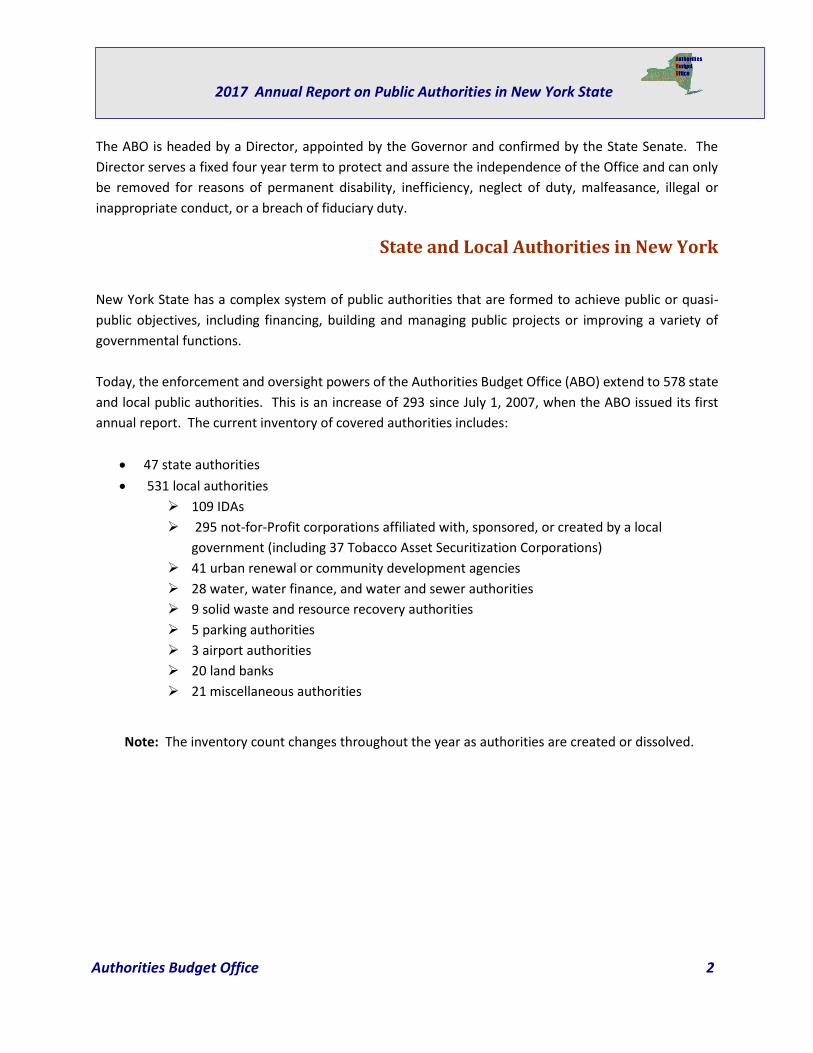
Today, the enforcement and oversight powers of the Authorities Budget Office (ABO) extend to 578 state
and local public authorities. This is an increase of 293 since July 1, 2007, when the ABO issued its first
annual report. The current inventory of covered authorities includes:
47 state authorities
531 local authorities
109 IDAs
295 not-for-Profit corporations affiliated with, sponsored, or created by a local
government (including 37 Tobacco Asset Securitization Corporations)
41 urban renewal or community development agencies
28 water, water finance, and water and sewer authorities
9 solid waste and resource recovery authorities
5 parking authorities
3 airport authorities
20 land banks
21 miscellaneous authorities
Note: The inventory count changes throughout the year as authorities are created or dissolved.

Authorities Budget Office 3
2017 Annual Report on Public Authorities in New York State
Training and Guidance
During 2016-2017 the ABO provided training to board members and staff of public authorities, issued
policy guidance concerning the implementation of the laws governing public authorities, and issued
recommended practices to promote good governance of public authorities.
Board Member Training
530 board members trained in 2017
More than 6,000 board members trained since 2006
Section 2824 of Public Authorities Law requires board members of public authorities to receive training
regarding their legal, fiduciary, financial and ethical responsibilities as board members of an authority.
Since July 2011, the ABO has offered board member training through interactive online webinars. As the
sessions are offered to small groups of less than 20 participants, board members have the ability to ask
and answer questions and address issues which affect their experience as a board member of both small
and large public authorities. Webinars are an efficient, and convenient way for board members to receive
this required training and to be informed of best practices, policy guidance assistance, and regulatory
changes. This method also allows for interaction with other participants and the trainer regarding topics
such as the use of executive session, ethical conduct, board member independence, conflicts of interest
and fiduciary responsibilities. Board members are also given a demonstration of the Public Authorities
Reporting Information System (PARIS) so as to better understand reporting requirements. During the last
year, approximately 530 board members and staff were trained in this manner. Overall, more than 6,000
board members and staff have received training since 2006.
Public Authority Reporting Information System (PARIS) Training
The Authorities Budget Office also conducts PARIS webinar training for Authority staff members which is
interactive and online. This training is ongoing and intended primarily for staff responsible for entering
information into PARIS. Sessions are conducted as needed.
The trainer reviews each required report in PARIS (Annual, Budget, Procurement, Investment) and staff
are encouraged to ask questions regarding their particular issues with PARIS. Common topics include how
to report full time equivalent (FTE) staff in the Annual Report, how to report debt, reporting on real and
personal property, procurement contracts, IDA Project information as well as how to correctly report
budget information.

Authorities Budget Office 4
2017 Annual Report on Public Authorities in New York State
New Policy Guidance
17-02 Public Authority Procurement Guidelines: The Authorities Budget Office issued a new policy
guidance that provides procurement guidelines for both state and local authorities. Procurement
guidelines help enable authorities to acquire maximum quality at the lowest possible cost, and guard
against favoritism, fraud and corruption. With New York procurement contract spending for public
authorities totaling billions of dollars a year, it is vital for the authorities to establish policies regarding
soliciting proposals, obtaining quotes and awarding, monitoring and reporting of contracts to ensure
authority moneys are used in a financially sound manner.
Public Authorities Law (PAL) requires boards of state and local authorities to adopt written policies and
procedures for the procurement of goods and services, which includes a prompt payment policy and
Minority and Women Owned Business Enterprise (MWBE) targets for state authorities. Public authorities
are also subject to the Procurement Lobbying Act of State Finance Law, which requires the authority to
designate a person or persons to serve as the authorized contact on a specific procurement.
With each authority procuring different goods and services, no single policy exists that is appropriate for
all authorities. As a result, each individual board of directors must review its own operations and
determine an appropriate policy that best fits its needs. Policy Guidance 17-02 outlines items that should
be considered when an authority is developing its own procurement guidelines. Items include establishing
approval and procedural thresholds, creating safeguards for services and allowable expenses, maintaining
a list of qualified vendors, identifying exceptions to the authority’s procurement policy, lobbying reporting
and internal controls, MWBE targets, and prompt payment.
Compliance Reviews and Investigations
The ABO completed a total of four compliance and operational reviews, limited scope reviews of
operations, and investigations of public complaints in 2016-17.
Compliance Reviews
St. Lawrence County IDA LDC: The Authorities Budget Office (ABO) reviewed the operating practices of
the St. Lawrence County IDA Local Development Corporation (LDC), a public authority responsible for
administering several loan funds to stimulate the growth of private sector employment in St. Lawrence
County.
The review found the LDC board needs to improve its transparency and the accountability of board actions
and LDC operations. The board approved several loans to the Industrial Development Agency (IDA), a
separate entity which is comprised of the same board members, without appropriately disclosing the

Authorities Budget Office 5
2017 Annual Report on Public Authorities in New York State
conflict of interest. Two of those loans were approved by the board even though the projects did not meet
the criteria established for the loan funds. For example, one loan fund caps loan amounts at $400,000 and
is to be used for private sector businesses. Yet, the LDC approved a $700,000 loan from this fund to the
IDA, which is a public authority, not a private sector business. There was no public discussion or disclosure
why the LDC determined that the loan criteria did not apply to this project. In addition, the LDC board also
provided favorable repayment terms for the IDA; extending the loan repayments for 30 years rather than
the 10 year repayment period required for private sector loans, and charging only 0.5 percent interest.
The review also found that the LDC board approved loans for other businesses whose projects did not
meet the criteria established for the loan funds, again without public disclosure as to why the criteria did
not apply.
The review found that the job creation targets proposed by businesses in loan applications often differed
from the targets approved by the board. These discrepancies occurred because the LDC board did not
review the completed applications when evaluating whether to approve a loan. Further, the board did not
review or approve the loan agreements that were negotiated by staff to formalize the loan terms that
were approved by the board. The review found that the terms of the loan agreements did not always
match the terms approved by the board.
The review also determined that since the same LDC board members also served as board members for
four other economic development entities established in the county, the board appeared to treat these
entities as though they were a single operation. As such, it was not always clear if the board acted in the
best interest of the LDC, and whether its decisions were always appropriately and clearly disclosed in the
board meeting minutes. The review also identified instances where the loan funds administered by the
board may not have been used appropriately, such as paying for all marketing costs for the LDC and the
related entities.
Eastern Rensselaer County Solid Waste Management Authority: The Authorities Budget Office (ABO)
reviewed the operating practices of the Eastern Rensselaer County Solid Waste Management Authority
(Authority). The Authority is responsible for managing solid waste generated within seven member
communities in the County in the most economically feasible and environmentally sound manner.
The review found the Authority’s Executive Director had a significant conflict of interest by working for
two solid waste management organizations that solicit funds from companies for annual conferences – a
relationship that was not approved by the Authority board. Several of these companies also had contracts
with the Authority. The review also found that the Executive Director did not solicit proposals or
competitively select the vendors that provide transportation services and disposal services. Instead, the
Executive Director simply extended the contract with the disposal company in exchange for a $50,000

Authorities Budget Office 6
2017 Annual Report on Public Authorities in New York State
payment to the Authority. For the transportation contract the Executive Director again extended the
previous contract, resulting in over $20,000 in excess transportation costs to member municipalities.
The review also found the Authority board failed its fiduciary duty to oversee management and ensure
the Authority operated efficiently and effectively. The board did not review or monitor the Authority’s
finances, but instead allowed the Executive Director to act autonomously. This lack of oversight resulted
in member municipalities being overcharged more than $85,000 in disposal and operating cost in 2013,
2014 and 2015. In addition, the review found Authority funds were being inappropriately used by the
Executive Director for personal use. Although most of the instances were reimbursed by the Executive
Director, the use of Authority funds represents an interest-free loan to the Executive Director and is
inappropriate.
The ABO found that board members had not signed an acknowledgement of fiduciary duty as required by
Public Authorities Law and that not all board members had attended mandatory board member training.
If they had done so, they would have been better equipped to handle the matters regarding the Executive
Director. The report includes recommendations to improve board oversight over financial transactions
and the effectiveness of the Authority’s operations.
Board Member Training Compliance: Public Authorities Law Section 2824(2) requires board members of
public authorities to participate in state approved training regarding their legal, fiduciary, financial and
ethical responsibilities within one year of appointment to a board. The Authorities Budget Office (ABO)
reviewed board member training compliance and found that over 25 percent of the 577 public authorities
had board members that had not attended the required training. This training is critical to ensure that
every member of public authority boards maintain a level of knowledge of good governance principles
and the requirements of the law to provide the appropriate oversight to carry out their authority’s mission
-- making well-informed and independent decisions free of conflicts.
The review also reconfirmed that the accuracy of the data reported by public authorities is questionable.
The review found that of the 649 board members who were reported in 2015 annual reports as not having
attended the required training, 262 (40 percent) board members had actually attended training. The 387
board members that had not attended training were from 153 different public authorities, and the
majority of the board members (67 percent) were members of local development corporations (LDCs).
The ABO sent letters to 149 authorities requesting an explanation of the non-compliance of 381 board
members that had not attended training and received responses from 109 authorities addressing 236
board members. The remaining 40 authorities have not responded in any form to the ABO’s request for
an explanation of the non-compliance of 145 board members, and may be subject to additional
enforcement actions such as censure or recommending removal of board members.

Authorities Budget Office 7
2017 Annual Report on Public Authorities in New York State
The report recommends that all public authorities establish policies and procedures that ensure board
members are trained within one year of appointment, including tracking and documenting each board
members completion of training. It also reemphasizes the ABO’s guidance that directors participate in
training upon re-appointment to the Board or at least every three years.
Investigations
Review of Public Complaint: Niagara Frontier Transit Authority: The Authorities Budget Office (ABO)
received a complaint that was referred from the New York State Office of the Inspector General. The
complaint was received from an individual that was a board member of the Niagara Frontier
Transportation Authority (NFTA) at the time of the complaint. The complainant alleged that he was denied
access to specific information that he was entitled to as a board member, that the location where NFTA
held public meetings were not always sufficient for the number of attendees, and that the public was
escorted out of the facility and denied access when the meetings became overcrowded. The investigation
found there was no basis to these allegations, but also made a recommendation to NFTA for improving
the transparency and accountability of its operations.
Public Authorities Spending 2012 – 2016
The data presented in the following tables is as reported by the public authorities in the Public Authorities
Reporting Information System (PARIS), and while certified not all data is confirmed to be accurate.
Through a quality assurance process the ABO may have requested a public authority to make corrections
to the data reported, but the ABO itself does not change or correct any information that is submitted.
The following tables include state and local authorities that filed at least one referenced report for the
2012-2016 reporting periods.
Authority Operating Expenses
As Table 1 indicates, state authority expenses increased by 14.8 percent between 2012 and 2016. The
majority of the increase is due to the Housing Trust Fund Corporation reporting approximately a $2.8
billion increase, mostly due to significant increases in program expenditures related to Hurricane Sandy
disaster relief projects, and the Metropolitan Transportation Authority reporting approximately a $2.2
billion increase, mostly due to salary, wages and other benefits. This table does not include data from
Nassau Health Care Corporation or Port of Oswego Authority, since their 2016 reports were not submitted
and have repeatedly been delinquent.
Table 2 shows that local authorities in total reported a 28.4 percent increase, ($3.8 billion) in operating
expenses from 2012 to 2016. This is mainly due to the New York City Health and Hospitals Corporation

Authorities Budget Office 8
2017 Annual Report on Public Authorities in New York State
and New York City Transitional Finance Authority having increases of $2.2 billion and $1.7 billion,
respectively, over this period. Also, for the 2016 reporting period the Syracuse Urban Renewal Agency
(SURA) reported payroll and payroll related expenses as $0. It appears that SURA incorrectly reported
these operating expenses as non-operating expenses.
Industrial development agencies (IDAs) operating expenses, as shown in Table 3, have continued to
decrease as reported in recent years. Between 2012 and 2016, IDAs have a decrease of 16.1 percent
($11.0 million), with Onondaga County IDA and Glen Cove IDA having the largest decreases in operating
expenses over the five year period.
The ABO uses “local development corporation (LDC)” as a generic term to include not-for-profit
corporations that meet the definition of a local authority in accordance with Section 2 of Public Authorities
Law. Table 4 indicates that for 2016, a total of 188 LDCs, excluding Tobacco Asset Securitization
Corporations (TASCs), reported having a total of $970.8 million in operating expenses. New York City
Economic Development Corporation comprises 83.4 percent of the reported operating expenses with a
total of $810.1 million for 2016. The 34 TASCs that reported indicated a total of $25.9 million in operating
expenses for the reporting period. Of the TASCs, Suffolk TASC’s operating expenses comprised 40.7
percent of the total operating expenses and Niagara County TASC comprised 11 percent.

Authorities Budget Office 9
2017 Annual Report on Public Authorities in New York State
Authority Name 2012
Amount
2013
Amount
2014
Amount
2015
Amount
2016
Amount
Percent
Change
2012-2016
Agriculture and New York State Horse Breeding Development Fund 18.60 17.42 15.72 15.55 15.18 -18.4%
Albany Convention Center Authority 0.52 0.50 0.61 0.75 1.33 157.5%
Battery Park City Authority 42.42 43.66 44.03 53.57 46.15 8.8%
Buffalo Fiscal Stability Authority 0.83 0.77 0.71 0.75 1.15 38.0%
Capital District Transportation Authority 94.19 94.70 94.46 95.69 105.67 12.2%
Central New York Regional Transportation Authority 81.13 85.82 84.80 85.94 89.15 9.9%
Development Authority of the North Country 17.06 18.16 21.71 23.14 23.58 38.2%
Dormitory Authority of the State of New York 2,155.70 2,257.49 2,251.44 2,276.12 2,332.38 8.2%
Environmental Facilities Corporation 600.73 554.42 472.15 440.10 433.84 -27.8%
Erie County Fiscal Stability Authority 0.47 0.45 0.49 0.44 0.43 -7.6%
Erie County Medical Center Corporation 451.03 458.71 505.40 543.92 606.39 34.4%
Homeless Housing Assistance Corporation 41.21 34.54 44.27 44.04 48.44 17.5%
Housing Trust Fund Corporation 21.58 1,689.00 - 2,612.35 2,846.75 13,093.4%
Hudson River Park Trust 22.17 24.22 27.28 28.98 31.30 41.2%
Hudson River-Black River Regulating District 9.01 12.83 9.90 7.16 6.43 -28.6%
Long Island Power Authority 3,925.95 3,434.97 3,351.38 3,187.38 3,163.35 -19.4%
Metropolitan Transportation Authority 13,962.00 15,008.00 15,848.00 15,337.00 16,167.00 15.8%
Municipal Assistance Corporation for the City of Troy 0.05 0.04 0.04 0.05 0.05 7.4%
Nassau County Interim Finance Authority 1.27 1.24 1.76 1.74 1.63 27.8%
Nassau Health Care Corporation 508.13 529.90
Natural Heritage Trust 1.05 0.98 1.14 0.68 0.57 -45.7%
Nelson A. Rockefeller Empire State Plaza Performing Arts Center Operating Corp. 1.71 1.61 1.73 1.81 1.70 -0.8%
New York Convention Center Operating Corporation 123.68 129.48 155.40 168.85 185.69 50.1%
New York Job Development Authority 1.88 1.83 1.21 2.83 5.67 202.2%
New York Local Government Assistance Corporation 6.34 5.02 4.05 3.70 3.41 -46.1%
New York State Affordable Housing Corporation 2.04 1.92 1.97 2.35 2.57 26.0%
New York State Bridge Authority 48.82 63.79 85.72 65.89 38.00 -22.2%
New York State Energy Research and Development Authority 532.29 116.55 127.26 146.00 128.77 -75.8%
New York State Housing Finance Agency 171.04 148.54 141.35 140.39 228.11 33.4%
New York State Olympic Regional Development Authority 39.93 46.90 53.85 54.46 51.88 29.9%
New York State Thoroughbred Breeding Development Fund 16.68 19.44 22.10 21.91 21.68 30.0%
New York State Thruway Authority 783.50 751.06 777.28 802.54 1,024.00 30.7%
New York State Urban Development Corporation 1,102.11 738.40 871.94 696.70 992.50 -9.9%
Niagara Frontier Transportation Authority 250.52 250.42 251.85 252.32 251.13 0.2%
Ogdensburg Bridge and Port Authority 6.26 8.39 7.80 7.48 8.32 32.9%
Port of Oswego Authority 3.80 4.26 4.84 4.65
Power Authority of the State of New York 2,354.00 2,655.00 2,765.00 2,330.00 2,125.00 -9.7%
Rochester-Genesee Regional Transportation Authority 92.26 94.97 100.46 110.05 116.56 26.3%
Roosevelt Island Operating Corporation 21.29 21.39 22.53 23.02 23.20 9.0%
Roswell Park Cancer Institute Corporation 499.85 537.72 556.77 598.00 637.53 27.5%
State of New York Mortgage Agency 55.57 49.42 55.91 47.13 56.87 2.3%
State of New York Municipal Bond Bank Agency 4.07 3.39 2.74 0.42 0.55 -86.5%
Tobacco Settlement Financing Corporation 1.15 1.58 7.84 0.65 0.63 -45.4%
United Nations Development Corporation 25.77 30.24 30.77 26.53 26.36 2.3%
Utility Debt Securitization Authority (UDSA) 96.73 18.11 108.95
Westchester County Health Care Corporation 874.55 892.65 1,035.62 1,201.55 1,304.32 49.1%
Total: 28,974.18 30,841.78 29,957.99 31,482.69 33,264.17 14.8%
Table 1: State Authority Operating Expenses 2012-2016*
($ millions)
*Data Reported as of June 4, 2017, except for Westchester County Health Care Corporation, which is reported as of June 9, 2017, and Metropolitan
Transportation Authority, which is reported as of June 22, 2017. Data shown as 0.00 indicates an authority had operating expenses, but they round to
$0.00 million. Data shown as - indicates an authority reported $0 in operating expenses.

Authorities Budget Office 10
2017 Annual Report on Public Authorities in New York State
Authority Name 2012
Amount
2013
Amount
2014
Amount
2015
Amount
2016
Amount
Percent
Change
2012-2016
Albany Community Development Agency 0.98 1.03 0.80 0.93
Albany County Airport Authority 44.34 45.38 46.28 45.26 46.51 4.9%
Albany Municipal Water Finance Authority 0.08 0.08 - -
Albany Parking Authority 3.70 3.80 4.09 5.73 5.79 56.7%
Albany Port District Commission 4.72 4.94 5.13 5.64 6.00 27.0%
Albany Water Board 27.51 26.83 26.95 26.30
American Museum of Natural History Planetarium Authority 3.06 3.30 3.18 3.23 3.21 4.7%
Amsterdam Urban Renewal Agency 0.01 0.01 0.01 0.01 0.01 15.6%
Binghamton Urban Renewal Agency 0.06 0.07 0.07 0.07 0.06 -0.5%
Buffalo Municipal Water Finance Authority 0.61 0.59 0.51 1.08 0.08 -86.5%
Buffalo Sewer Authority 47.91 44.09 51.33 45.88 58.20 21.5%
Buffalo Urban Renewal Agency 18.55 49.79 49.88 - 54.55 194.0%
Buffalo Water Board 25.14 25.83 26.16 28.52 27.01 7.4%
Cayuga County Water and Sewer Authority 1.16 1.38 1.38 1.68 1.87 60.7%
Central New York Regional Market Authority 1.40 1.35 1.52 1.62 1.53 9.2%
Chautauqua, Cattaraugus, Allegany and Steuben Southern Tier Ext. Railroad 1.23 0.85 0.60 1.17 1.03 -16.3%
City of Fulton Community Development Agency 0.67 0.56 0.51 0.54
City of Hudson Community Development and Planning Agency1 0.05 0.12 0.10 0.15 0.09 90.8%
Clifton Park Water Authority 4.22 4.24 4.19 4.72 4.91 16.3%
Dutchess County Resource Recovery Agency 18.99 17.67 18.00 16.38 15.60 -17.9%
Dutchess County Water and Wastewater Authority 5.88 6.15 6.09 6.29 7.02 19.5%
Eastern Rensselaer County Solid Waste Management Authority 0.72 0.74 0.72 0.60 0.63 -12.7%
Elmira Urban Renewal Agency 0.25 0.03 0.00 0.00 0.00 -100.0%
Erie County Water Authority 52.05 54.38 57.81 57.44 59.50 14.3%
Franklin County Solid Waste Management Authority 11.35 10.92 11.45 11.49
Freeport Community Development Agency 0.46 0.42 0.66 0.29 0.88 91.5%
Genesee Valley Regional Market Authority 1.70 1.78 1.84 1.75 1.77 3.8%
Glen Cove Community Development Agency 10.43 5.52 4.96 4.67 5.02 -51.9%
Glens Falls Urban Renewal Agency 0.25 0.06 0.01 0.02 0.08 -69.9%
Gloversville Community Development Agency 0.05 0.05 0.05 0.05 0.04 -26.8%
Greater Rochester Sports Authority 0.02 0.30 0.01
Green Island Power Authority 3.83 3.03 3.48 5.74 3.33 -13.2%
Harrison Parking Authority - - -
Haverstraw Urban Renewal Agency - - - -
Huntington Community Development Agency 1.49 0.68 0.88 2.01 1.72 15.9%
Incorporated Village of Hempstead Community Development Agency 1.95 0.37 0.32 -83.5%
Islip Resource Recovery Authority 38.95 41.83 36.46 35.40 38.42 -1.4%
Ithaca Urban Renewal Agency 1.19 0.93 0.82 0.83 1.01 -15.0%
Jamestown Urban Renewal Agency 0.90 0.95 0.10 0.91 0.92 2.4%
Little Falls Urban Renewal Agency - 0.44
Livingston County Water and Sewer Authority 3.72 3.39 3.44 3.41 3.43 -7.8%
Middletown Community Development Agency - 0.00 0.01 0.05
Monroe County Airport Authority 24.74 25.17 24.67 25.04 24.43 -1.2%
Monroe County Water Authority 50.02 53.93 59.17 59.57 61.00 21.9%
Mount Vernon Urban Renewal Agency 1.32
Nassau County Bridge Authority 6.38 6.70 6.12 6.03 6.22 -2.5%
Nassau County Sewer and Storm Water Finance Authority 88.17 46.54 161.73 0.04 0.04 -100.0%
New York City Educational Construction Fund 7.30 7.73 7.67
New York City Health and Hospitals Corporation 7,460.98 7,848.06 8,018.38 8,214.97 9,639.71 29.2%
New York City Housing Development Corporation 203.05 217.76 229.89 270.78 293.23 44.4%
New York City Municipal Water Finance Authority 79.05 45.17 43.17 45.92 49.60 -37.3%
New York City School Construction Authority 133.74 142.83 132.49 144.46
New York City Transitional Finance Authority 2,352.12 2,963.88 3,541.87 4,074.32 4,009.15 70.4%
New York City Water Board 2,177.17 2,081.88 2,312.05 2,574.28 2,249.11 3.3%
Niagara Falls Public Water Authority 0.03
Niagara Falls Urban Renewal Agency 0.02 0.04 0.06 0.03 0.16 640.7%
Niagara Falls Water Board 24.35 24.52 25.74 27.30
North Hempstead Solid Waste Management Authority 16.81 19.62 17.09 16.75
Nyack Parking Authority 0.66 1.64 1.55
Olean Urban Renewal Agency 0.04 0.02 0.02 0.05
Oneida County Sports Facility Authority 0.06 0.05 0.05 0.06 0.01 -80.5%
Oneida-Herkimer Solid Waste Management Authority 18.36 18.96 20.05 18.83 19.89 8.3%
Table 2: Local (Other) Authority Operating Expenses 2012-2016*
($ millions)

Authorities Budget Office 11
2017 Annual Report on Public Authorities in New York State
Authority Name 2012
Amount
2013
Amount
2014
Amount
2015
Amount
2016
Amount
Percent
Change
2012-2016
Onondaga County Resource Recovery Agency 34.72 34.54 35.55 35.02 31.65 -8.8%
Onondaga County Water Authority 35.09 34.90 36.36 37.60 37.81 7.7%
Orange County Water Authority 0.49 0.60 0.52 0.45 0.53 7.8%
Port Jervis Community Development Agency 1.85 1.81 1.75
Poughkeepsie Urban Renewal Agency - - - - -
Rensselaer County Water and Sewer Authority 0.29 0.34 0.52 0.34 0.31 5.5%
Rochester Urban Renewal Agency - - - - -
Rockland County Solid Waste Management Authority 41.51 42.84 44.00 45.96 47.43 14.3%
Saratoga County Water Authority 5.76 4.47 4.48 4.23 4.30 -25.4%
Saratoga Springs City Center Authority 1.42 1.47 1.59 1.61
Schenectady Metroplex Development Authority 0.96 1.02 1.04 0.98 1.09 13.4%
Schenectady Urban Renewal Agency 0.04 0.02 0.01 0.00 0.00 -97.1%
Suffolk County Judicial Facilities Agency 0.02 0.31 1.73 1.72 1.72 8,172.3%
Suffolk County Water Authority 152.53 152.13 157.22 161.92 167.14 9.6%
Syracuse Parking Authority - - - - -
Syracuse Regional Airport Authority 0.47 2.91 13.86 28.86 28.14 5,891.6%
Syracuse Urban Renewal Agency 1.68 7.10 6.01 5.88 - -100.0%
Tonawanda (City) Community Development Agency -
Town of Erwin Urban Renewal Agency 0.31 0.33 0.25 0.15 0.20 -34.9%
Town of Islip Community Development Agency 1.63 1.47 1.58 1.45 1.56 -4.6%
Town of North Hempstead Community Development Agency 1.34 0.92 0.94 1.09 2.19 63.2%
Town of Riverhead Community Development Agency 0.23 0.14 0.72 0.74
Trust for Cultural Resources of the City of New York 6.64 5.53 6.08 6.57 6.39 -3.9%
Trust for Cultural Resources of the County of Onondaga 0.05 0.04 0.04 0.04 0.05 -2.1%
Ulster County Resource Recovery Agency 12.30 11.69 11.50 10.13 11.13 -9.5%
Upper Mohawk Valley Memorial Auditorium Authority 1.11 0.86 1.08
Upper Mohawk Valley Regional Water Board2 13.72 14.20 26.81 15.59 15.61 13.7%
Upper Mohawk Valley Regional Water Finance Authority - - - 0.16
Utica Urban Renewal Agency 0.40 0.44 0.52 0.33 0.35 -12.9%
Victor Urban Renewal Agency3 0.00 0.00 0.00 0.00 0.00 -5.7%
Village of Elmira Heights Urban Renewal Agency 0.38 0.80 0.08 0.06 0.08 -80.2%
Village of Fairport Urban Renewal Agency 1.93 2.38 2.35 2.36 2.39 23.7%
Village of Patchogue Community Development Agency 2.57 2.44 2.28 2.38 2.33 -9.4%
Village of Rockville Centre Community Development Agency - - 0.33 - 0.08
Village of Spring Valley Urban Renewal Agency -
Water Authority of Great Neck North 5.57 5.98 5.86 6.44 6.66 19.6%
Water Authority of Southeastern Nassau County - - -
Water Authority of Western Nassau County 9.17 9.88 10.61 10.78 10.62 15.8%
Wayne County Water and Sewer Authority 5.19 5.53 5.77 6.06 7.41 42.9%
White Plains Urban Renewal Agency 0.03 5.12 0.33 0.41 0.37 1,148.1%
Wilton Water and Sewer Authority 1.96 1.31 1.32 1.33
Yonkers Community Development Agency 0.09 0.15 0.36 0.14 1.23 1,212.5%
Yonkers Parking Authority 5.69 6.00 6.05 6.32
Total: 13,321.33 14,220.22 15,361.41 16,204.32 17,099.75 28.4%
3 Victor Urban Renewal Agency reported $4,269 in operating expenses in 2012 and $4,015 in operating expenses in 2016. While the data rounds to $0,
it is a 5.7% decrease over the 5 year period.
*Data reported as of June 4, 2017. Data shown as 0.00 indicates an authority had operating expenses, but they round to $0.00 million. Data shown as -
indicates an authority reported $0 in operating expenses.1 City of Hudson Community Development and Planning Agency changed their FYE Date for the 2014 reporting period. 2014 data is for 15 months.2 Upper Mohawk Valley Regional Water Board changed their FYE Date for the 2014 reporting period. 2014 data is for 21 months.

Authorities Budget Office 12
2017 Annual Report on Public Authorities in New York State
Authority Name 2012
Amount
2013
Amount
2014
Amount
2015
Amount
2016
Amount
Percent
Change
2012-2016
Albany City IDA 0.31 0.30 0.37 0.34 0.46 48.1%
Albany County IDA 0.07 0.17 0.14 0.10 0.09 23.5%
Allegany IDA 0.15 0.19 0.21 0.24 0.24 60.4%
Amherst IDA 0.81 0.76 0.78 0.79 0.93 14.9%
Amsterdam IDA 0.35 0.32 0.37 0.39 0.43 23.1%
Auburn IDA 1.53 1.39 1.30 1.48 0.04 -97.3%
Babylon IDA 0.74 0.88 1.01 0.88 1.13 52.5%
Bethlehem IDA 0.11 0.15 0.16 0.16 0.17 49.0%
Brookhaven IDA 0.43 0.50 0.58 0.51 0.58 37.4%
Broome IDA 1.79 2.19 2.47 3.10 3.43 91.8%
Cattaraugus IDA 0.22 0.25 0.28 0.27 0.29 34.9%
Cayuga IDA 0.33 0.05 0.14 0.08 0.06 -82.5%
Chautauqua IDA 1.22 1.40 0.59 2.20 3.05 150.9%
Chemung IDA 0.83 1.20 1.04 0.20 0.50 -39.6%
Chenango IDA 0.13 0.14 0.34 0.14 0.13 -2.9%
City of Rensselaer IDA - 0.00 0.00 0.01 0.02
City of Schenectady IDA 0.09 0.03 0.02 0.05 0.11 20.0%
City of Utica IDA 0.10 0.01 0.01 0.01 0.02 -83.8%
Clarence IDA 0.05 0.06 0.07 0.07 0.09 91.6%
Clifton Park IDA 0.04 0.03 0.03 0.02 0.03 -37.4%
Clinton County IDA 0.72 0.74 0.11 0.10 0.10 -86.0%
Cohoes IDA 0.02 0.02 0.02 0.03 0.16 917.2%
Colonie IDA 0.33 0.65 0.13 0.15 0.10 -70.2%
Columbia IDA 0.04 0.03 0.06 0.05 0.05 19.6%
Concord IDA 0.01 0.01 0.01 0.01 0.01 29.6%
Cortland IDA 0.02 0.04 0.04 0.05 0.04 73.7%
Delaware County IDA 0.42 0.20 0.48 0.26 0.47 11.9%
Dunkirk IDA1 0.00 0.00 - 0.00 0.00 2,446.9%
Dutchess County IDA 0.34 0.67 0.64 0.63 0.60 80.1%
Erie County IDA 2.40 2.81 2.60 2.90 3.50 45.9%
Essex County IDA 0.34 0.41 0.33 0.35 0.40 16.2%
Fairport IDA 0.41 0.37 0.33 0.27 0.28 -30.8%
Franklin County IDA 0.50 0.37 0.39 0.30
Fulton County IDA 0.05 0.04 0.08 0.08 0.21 323.3%
Genesee County IDA 1.20 1.19 1.34 1.27 1.38 14.5%
Geneva IDA 0.34 0.31 0.03 0.35 0.42 25.1%
Glen Cove IDA 6.81 3.10 2.39 2.30 1.79 -73.7%
Glens Falls IDA 0.10 0.04 0.07 0.18 0.07 -29.8%
Green Island IDA 0.11 0.10 0.08 0.06 0.07 -39.4%
Greene County IDA 0.71 0.62 0.81 0.61 1.01 42.8%
Guilderland IDA 0.01 0.01 0.01 0.01 0.02 103.7%
Hamburg IDA 0.13 0.14 0.20 0.25 0.19 46.7%
Hamilton County IDA 0.10 0.15 0.02 0.02 0.02 -83.7%
Hempstead IDA 1.03 1.02 1.05 0.98 1.21 17.8%
Herkimer IDA 0.34 0.36 0.30 0.30 0.30 -11.2%
Hornell IDA2 0.67 0.83 1.28 0.99 0.86 28.3%
Hudson IDA 0.02 0.00 - 0.00 0.01 -70.8%
Islip IDA 0.22 0.25 0.35 0.48
Jefferson IDA 1.53 1.90 1.47 1.34 0.97 -36.5%
Lancaster IDA 0.09 0.09 0.09 0.12 0.21 130.8%
Lewis County IDA 0.10 0.81 0.11 0.10 0.58 467.5%
Livingston County IDA 0.09 0.11 0.13 0.57 0.48 427.6%
Madison County IDA 0.29 0.30 0.31 0.31 0.35 21.5%
Mechanicville-Stillwater IDA 0.01 0.03 0.01 0.01 0.01 14.4%
Middletown IDA 0.00 0.02 0.00 0.03 0.03 902.8%
Monroe IDA 0.96 0.96 0.86 0.64 0.71 -25.8%
Montgomery County IDA 0.07 0.11 0.08 0.26 0.15 123.5%
Mount Pleasant IDA 0.00 0.00 0.00 0.00
Mount Vernon IDA 0.16 0.16 0.18 0.18
Nassau County IDA 2.00 2.43 1.88 1.93 2.11 5.6%
New Rochelle IDA 0.12 0.12 0.16 0.21 0.21 80.9%
New York City IDA 6.30 6.28 6.22 4.77 4.19 -33.6%
Newburgh IDA 0.22 0.31 0.10 0.11 0.09 -59.2%
Table 3: IDA Operating Expenses 2012-2016*
($ millions)

Authorities Budget Office 13
2017 Annual Report on Public Authorities in New York State
Authority Name 2012
Amount
2013
Amount
2014
Amount
2015
Amount
2016
Amount
Percent
Change
2012-2016
Niagara County IDA 1.87 1.46 1.45 1.34 1.25 -33.2%
Niagara Town IDA 0.02 0.02 0.02 0.02 0.03 87.8%
North Greenbush IDA 0.07 0.19 0.01 0.01 0.04 -49.9%
Oneida County IDA 0.18 0.18 0.18 0.19 0.19 5.5%
Onondaga County IDA 10.56 0.34 0.75 0.89 0.76 -92.8%
Ontario County IDA 0.84 0.91 0.97 1.11 1.07 27.7%
Orange County IDA 1.16 1.17 1.25 1.28 1.88 61.3%
Orleans County IDA 0.34 0.34 0.53 0.47 0.42 22.9%
Oswego County IDA 0.73 0.49 0.38 0.47 0.60 -17.5%
Otsego County IDA 0.12 0.28 1.12 0.77 0.95 724.0%
Peekskill IDA 0.03 0.05 0.03 0.02 0.06 89.6%
Port Chester IDA 0.19 0.04 0.03 0.12 0.07 -63.1%
Port Jervis IDA - - 0.01 0.01 0.00
Poughkeepsie IDA 0.01 0.01 0.01 0.01 0.03 102.2%
Putnam County IDA 0.07 0.01 0.02
Rensselaer County IDA 1.33 1.76 1.50 1.48 1.55 17.3%
Riverhead IDA 0.19 0.19 0.22 0.21 0.23 22.3%
Rockland County IDA 0.16 0.24 0.26 0.27 0.29 85.3%
Salamanca IDA 0.54 1.18 0.97 0.76 0.82 52.4%
Saratoga County IDA 0.18 0.16 0.14 0.68 0.20 13.7%
Schenectady County IDA 0.02 0.04 0.04 0.03 0.02 -14.4%
Schoharie County IDA 0.07 0.07 0.09 0.06 0.10 38.0%
Schuyler County IDA 0.09 0.06 0.07 0.15 0.10 12.2%
Seneca County IDA 0.56 0.62 0.61 0.59 0.73 31.2%
St. Lawrence County IDA 1.11 0.77 1.02 0.91 0.82 -26.6%
Steuben County IDA 0.45 1.59 0.95 0.75 0.56 24.4%
Suffolk County IDA 0.72 1.03 1.32 1.29 1.27 77.9%
Sullivan County IDA 0.42 0.42 0.60 0.57 0.48 16.2%
Syracuse IDA 1.68 0.48 5.11 6.07 2.27 35.3%
Tioga County IDA 1.65 0.31 0.38 0.29 0.50 -69.4%
Tompkins County IDA 0.32 0.11 0.11 0.20 0.32 -1.3%
Town of Erwin IDA 0.06 0.03 0.03 0.03 0.02 -66.0%
Town of Lockport IDA 0.11 0.16 0.15 0.14 0.15 40.3%
Town of Malone IDA 0.02 0.02 0.02 0.02 0.02 -0.2%
Town of Montgomery IDA 0.01 0.01 0.01 0.01
Troy IDA 0.10 0.18 0.67 0.68 0.16 60.3%
Ulster County IDA 0.12 0.20 0.29 0.07 0.11 -3.6%
Village of Groton IDA 0.00 0.01 0.01 0.01
Wallkill IDA 0.00 0.01 0.00 0.02 0.03 956.0%
Warren and Washington Counties IDA 0.13 0.14 0.11 0.15 0.14 3.9%
Wayne County IDA 0.81 0.81 0.57 0.54 0.58 -29.3%
Westchester County IDA 0.93 0.90 1.18 1.07 1.16 25.1%
Wyoming County IDA 0.23 0.29 0.27 0.33
Yates County IDA 0.56 0.60 0.69 0.61 0.68 20.9%
Yonkers IDA 0.78 0.74 1.29 0.82 1.36 73.3%
Total: 68.12 56.75 60.06 60.05 57.16 -16.1%
2 Hornell IDA changed their FYE date for the 2014 reporting period. 2014 data is for 21 months.
*Data reported as of June 4, 2017. Data shown as 0.00 indicates an authority had operating expenses, but they round to $0.00 million.
Data shown as - indicates an authority reported $0 in operating expenses.1 Dunkirk IDA reported $32 in operating expenses in 2012 and $815 in operating expenses in 2016. While the data rounds to $0, it is a
2,446.9% increase over the 5 year period.

Authorities Budget Office 14
2017 Annual Report on Public Authorities in New York State
Authority Name 2012
Amount
2013
Amount
2014
Amount
2015
Amount
2016
Amount
Percent
Change
2012-2016
Albany CSO Pool Communities Corporation 3.03
Albany County Business Development Corporation 0.26 0.32 0.31 0.68 0.45 73%
Albany County Capital Resource Corporation 0.00 0.01 0.01
Albany County Land Bank Corporation 0.30 1.20
Allegany County Capital Resource Corporation - 0.32 - 0.04
Auburn Local Development Corporation 0.04 0.04 0.04 0.01 0.01 -79%
Batavia Development Corporation 0.05 0.08 0.08 0.12 0.11 119%
Bethel Local Development Corporation 0.01 0.02 0.04 0.02
Binghamton Local Development Corporation 0.40 0.41 0.13 0.17 0.18 -54%
Bolton Local Development Corporation 0.01 0.01 0.01 0.01
Bronx Overall Economic Development Corporation 2.35 1.99 3.30
Brooklyn Bridge Park Corporation 5.58 10.09 13.00 15.83 184%
Brooklyn Navy Yard Development Corporation 45.18 44.60
Broome County Land Bank - 0.09 0.12 0.23
Broome County Local Development Corporation - 0.00 0.11 0.07 0.09
Broome Tobacco Asset Securitization Corporation - - 0.04 0.04 0.05
Buffalo Erie Niagara Land Improvement Corporation 0.00 1.10 1.05 1.27
Buffalo Urban Development Corporation 1.04 1.53 1.33 1.75 1.39 33%
Buffalo and Erie County Industrial Land Development Corporation 0.11 0.24 0.02 1.79 0.48 326%
Buffalo and Erie County Regional Development Corporation 0.43 0.81 0.47 0.40 0.58 35%
Build NYC Resource Corporation 0.02 0.28 0.21 1.70 2.07 9,608%
Business Development Corporation for a Greater Massena 0.17 0.17 0.09
Canton Capital Resource Corporation 0.01 0.00 0.00 0.00 0.00 -71%
Capitalize Albany Corporation 1.18 1.38 1.24 1.37 1.40 19%
Carthage Industrial Development Corporation 0.35 0.27 0.20 0.27 0.25 -29%
Catskill Watershed Corporation 14.06 12.58 9.88 16.49 13.19 -6%
Cattaraugus County Capital Resource Corporation 0.01 0.01 0.01 0.01 0.02 109%
Cattaraugus County Economic Sustainability and Growth Corp. -
Cayuga County Development Corporation 0.00 0.01 0.02 0.02 0.02 331%
Cayuga Tobacco Asset Securitization Corporation 1.62 1.67 1.70 1.78 1.73 6%
Chadwick Bay Regional Development Corporation 0.07 0.09 0.17
Chautauqua County Capital Resource Corporation 0.06 0.04 0.01 0.01 - -100%
Chautauqua County Land Bank Corporation 0.03 0.25 0.66 1.29
Chautauqua Tobacco Asset Securitization Corporation 0.09 0.08 0.06 0.09 0.08 -10%
Cheektowaga Economic Development Corporation 0.05 0.04 0.01 0.03 0.02 -64%
Chemung County Capital Resource Corporation - 0.00 0.00 - 0.00
Chemung Tobacco Asset Securitization Corporation 0.42 0.42 0.02 0.02 0.02 -95%
City of Albany Capital Resource Corporation 0.01 0.00 0.01 0.01 0.05 624%
City of Kingston Local Development Corporation 0.29 0.49 0.40 0.32 0.28 -6%
City of Peekskill Local Development Corporation - - - - -
City of Troy Capital Resource Corporation 0.01 0.01 0.00 0.00 0.03 544%
City of Watertown Local Development Corporation 0.57 0.37 0.36 0.64 0.38 -33%
City of Watervliet Local Development Corporation 0.05 0.11 0.02
Civic Center Monroe County Local Development Corporation 0.65 0.76 0.87 0.95 0.92 41%
Clayton Local Development Corporation 0.05 0.05 0.04 0.08 0.05 -1%
Clinton County Capital Resource Corporation - - - 0.00 0.02
Cohoes Local Development Corporation 0.05 0.04 0.06 0.12
Columbia County Capital Resource Corporation 0.03 0.02 0.01 0.01 0.01 -81%
Columbia Economic Development Corporation 0.66 1.04 0.72 0.82 0.67 2%
Columbia Tobacco Asset Securitization Corporation 1.22 1.24 1.26 0.04 1.29 6%
Cornell Agriculture and Food Technology Park Corporation 0.49 0.58 0.72 0.61 0.68 38%
Cortland County Business Development Corporation 0.49 0.37 0.42 0.51 0.45 -9%
Cortland County Development Corporation 0.00 0.00
Cortland Tobacco Asset Securitization Corporation 0.79 0.79 0.79 0.85 0.04 -95%
Counties of Warren and Washington Civic Development Corporation 0.02 0.01 0.02 0.04 0.00 -87%
Delaware County Local Development Corporation 0.03 0.05 0.04 0.04 0.05 64%
Development Chenango Corporation 0.23 0.26 0.25 0.35 0.24 4%
Dobbs Ferry Local Development Corporation 0.01 0.01 0.02 0.01 0.02 36%
Dunkirk Local Development Corporation 0.13 0.12 0.22 67%
Table 4: Local Development Corporation Operating Expenses 2012-2016*
($ millions)

Authorities Budget Office 15
2017 Annual Report on Public Authorities in New York State
Authority Name 2012
Amount
2013
Amount
2014
Amount
2015
Amount
2016
Amount
Percent
Change
2012-2016
Dutchess County Local Development Corporation 0.03 0.03 0.09 0.23 0.96 3,058%
Dutchess Tobacco Asset Securitization Corporation 1.11 0.04 0.05 0.07 0.07 -94%
East of Hudson Watershed Corporation 2.05 10.84 8.31 3.14 2.75 34%
Economic Development Corporation - Warren County 0.37 0.56 0.62 0.64
Emerald Corporate Center Economic Development Corporation 0.06 0.07 0.05 0.06
Energy Improvement Corporation 0.27 0.40 0.53 1.37 1.49 459%
Erie Tobacco Asset Securitization Corporation 0.13 0.14 0.14 0.13 0.13 -3%
Essex County Capital Resource Corporation - - - - -
Fairport Local Development Corporation - 0.01 0.02 0.01 0.02
Finger Lakes Horizon Economic Development Corporation 0.00 0.00 0.01 0.01 0.01 268%
Finger Lakes Regional Land Bank Corporation 0.00
Finger Lakes Regional Telecommunications Development Corp. 0.98 1.23 1.03 1.01 1.00 3%
Fiscal Year 2005 Securitization Corporation 0.12 0.12 0.10 0.10 0.10 -22%
Franklin County Civic Development Corporation 0.00 0.00 0.00 0.00
Franklin County Local Development Corporation 0.01 0.01 0.08 0.00 0.02 72%
Fulton County Center for Regional Growth, Inc. 0.36 0.43
Genesee County Funding Corporation - - - 0.00 0.00
Genesee Gateway Local Development Corporation 4.91 2.28 2.49 1.37 0.92 -81%
Genesee Tobacco Asset Securitization Corporation 0.48 0.50 0.03 0.03 0.03 -94%
Geneva Local Development Corporation 0.00 0.08 0.01 0.06 0.05 1,768%
Glen Cove Local Economic Assistance Corporation - - 0.00
Glens Falls Civic Development Corporation - 0.14 0.05
Glenville Local Development Corporation 0.01 0.02 0.01 0.01
Golden Hill Local Development Corporation 0.10 0.38 0.00 0.00 0.00 -98%
Governors Island Corporation 13.50 13.80 16.06 26.31 30.35 125%
Greater Brockport Development Corporation 0.03 0.02 0.01 0.01
Greater Glens Falls Local Development Corporation 0.31 0.13 0.09 0.18 0.06 -79%
Greater Lockport Development Corporation 0.68 1.17 1.71
Greater Rochester Outdoor Sports Facility Corporation 2.97 2.67 2.46 2.08 2.15 -28%
Greater Syracuse Property Development Corporation - 0.17 2.74 5.59 5.38
Greater Wawarsing Local Development Corporation 0.01 0.00 0.00 0.00
Greene Tobacco Asset Securitization Corporation 0.04 0.03 0.03 0.03 0.03 -18%
Griffiss Local Development Corporation 4.77 7.54 5.50 5.79 3.98 -16%
Griffiss Utility Services Corporation 11.07 11.67 9.85 9.53
Hamburg New York Land Development Corporation 0.03 0.01 0.02 0.02 0.02 -17%
Herkimer Tobacco Asset Securitization Corporation 1.36 1.38 1.41 1.44 1.44 6%
Hilton Local Development Corporation 0.02 0.02 0.01 0.02 0.03 36%
Hornell Area Industrial Development Corporation 0.02 0.06 0.01 0.01 0.01 -24%
Hudson Development Corporation1 0.11 0.31 0.11 0.32 0.12 13%
Hudson Valley AgriBusiness Development Corp 0.38 0.63 0.64 0.59
Hudson Yards Development Corporation 1.98 1.87 1.62 0.63 1.09 -45%
Hudson Yards Infrastructure Corporation 0.70 0.46 0.44 0.51 0.50 -28%
Jamestown Local Development Corporation 0.18 0.10 0.10 0.13 0.16 -9%
Jefferson County Civic Facility Development Corporation - - - 0.00 0.10
Jefferson County Local Development Corporation 0.00 0.06 1.70 1.06 0.98 113,147%
Lake City Local Development Corporation 0.00
Land Reutilization Corporation of The Capital Region - 0.01 0.10 0.71 1.11
Lewis County Development Corporation 0.03 0.03 0.04 1.03
Livingston County Capital Resource Corporation - - -
Livingston County Development Corporation 0.28 0.24 0.23 0.51 0.76 169%
Livingston Tobacco Asset Securitization Corporation 1.10 1.12 1.15 1.18 1.18 8%
Lloyd Community Development Corporation - 0.00 0.00 0.00
Local Development Corporation of the Town of Union 0.10 0.11 0.11 0.13 0.12 22%
Long Beach Local Development Corporation 0.17 0.11 0.01
Lumber City Development Corporation 0.46 0.21 0.21 0.08
MUNIPRO, Inc. 0.03 0.02 0.02 0.02 0.05 110%
Madison County Capital Resource Corporation - 0.09 0.12 0.09 0.20
Maplewood Manor Local Development Corporation 2.34 0.07 0.12 0.65
Monroe County Industrial Development Corporation 0.61 0.66 0.67 0.77 0.96 57%
Monroe Tobacco Asset Securitization Corporation 0.10 0.11 0.11 0.11 0.12 19%
Montgomery County Capital Resource Corporation 0.01 - 0.00

Authorities Budget Office 16
2017 Annual Report on Public Authorities in New York State
Authority Name 2012
Amount
2013
Amount
2014
Amount
2015
Amount
2016
Amount
Percent
Change
2012-2016
Municipal Electric and Gas Alliance, Inc 0.49
NFC Development Corporation 0.10 0.10 0.10 0.08 0.07 -28%
NYC Neighborhood Capital Corporation 0.05 0.00
NYC Technology Development Corporation 1.30 4.01 3.71 4.46
Nassau County Local Economic Assistance Corporation 0.30 0.18 0.40 0.17
Nassau County Tobacco Settlement Corporation 10.45 10.02 0.12 0.13 0.10 -99%
New Rochelle Corporation for Local Development 0.00 0.01 0.01 0.03
New York City Business Assistance Corporation 0.03 0.01 0.01 0.00
New York City Economic Development Corporation 756.52 860.67 857.49 742.03 810.11 7%
New York City Energy Efficiency Corporation 1.71 2.46 2.60 2.94 3.00 76%
New York City Land Development Corporation 0.02 0.02 0.02 0.02
Newburgh Community Land Bank 0.07 0.15 0.22 3.13
Niagara Area Development Corporation - 0.00 0.00 - -
Niagara County Brownfields Development Corporation 0.02 0.17 0.01 0.03 0.01 -29%
Niagara County Development Corporation 0.11 0.06
Niagara Power Coalition 0.05 0.06 0.09 0.06 0.05 -1%
Niagara Tobacco Asset Securitization Corporation - - - 2.86 2.85
Ogdensburg Growth Fund Development Corp. 0.04 0.08 0.12 0.04
Olean Local Development Corporation 0.02 0.04 0.01 0.01
Oneida County Local Development Corporation 0.05 0.16 0.06 0.03
Oneida Tobacco Asset Securitization Corporation 0.03 0.03 0.03 0.03 0.03 -16%
Onondaga Civic Development Corporation 0.44 0.71 0.58 1.28 0.65 50%
Onondaga Convention Center Hotel Development Corporation - 15.00
Onondaga Tobacco Asset Securitization Corporation 0.10 0.11 0.12 0.12 1.65 1,522%
Ontario County Economic Development Corporation 0.53 0.22 0.11 0.11
Ontario County Four Seasons Development Corporation 0.91 0.90 0.89 0.98 0.88 -3%
Ontario County Local Development Corporation 0.06 0.02 0.01 0.01 0.01 -89%
Ontario Tobacco Asset Securitization Corporation 0.03 0.03 0.03 0.03 0.03 3%
Operation Oswego County 1.08
Orange County Funding Corporation 0.02 0.02 0.02 0.02 0.03 19%
Orleans County Local Development Corporation 0.12 0.03 0.05 0.07 0.06 -53%
Orleans Land Restoration Corporation 0.16 0.15 0.30 0.31 0.83 417%
Oswego County Civic Facilities Corporation - - - -
Oswego Tobacco Asset Securitization Corporation 1.19 0.04 0.05 0.04 0.05 -96%
Otsego County Capital Resource Corporation 0.01 0.00 0.00 0.48 0.12 1,634%
Peekskill Facilities Development Corporation 0.00 - - - - -100%
Port Chester Local Development Corporation - - - -
Prattsville Local Development Corporation - 0.00 0.00 0.00 0.00
Putnam County Economic Development Corporation 0.13 0.19 0.17 0.10 0.17 32%
Putnam Tobacco Asset Securitization Corporation 0.05 0.05 0.05 0.05 4%
Queens Economic Development Corporation 1.55 1.62 1.79 1.70 1.82 17%
Ramapo Local Development Corporation 2.99 3.37 2.38
Rensselaer Tobacco Asset Securitization Corporation 0.08 0.06 0.06 0.07 0.07 -12%
Riverhead IDA Economic Job Development Corporation 0.10 - - 0.00
Roberts Road Development Corporation - - - -
Rochester Economic Development Corporation 0.31 0.29 0.32 0.58 0.27 -13%
Rochester Land Bank Corporation 0.77 0.94 1.45
Rockland County Economic Assistance Corporation 0.02 0.02 0.01 0.01 0.01 -45%
Rockland County Health Facilities Corporation - 0.51 0.46
Rockland Economic Development Corporation 0.71 0.72 0.89 0.77 0.67 -6%
Rockland Second Tobacco Asset Securitization Corporation 0.04 0.04 0.03 0.03
Rockland Tobacco Asset Securitization Corporation 0.12 0.07 0.07 0.07
STAR (Sales Tax Asset Receivable) Corporation 0.32 0.35 0.37 0.43 0.27 -16%
Sackets Harbor Local Development Corporation 0.01 0.02 0.01 0.05 - -100%
Salamanca Area Development Corporation 0.01 0.01 0.00 -47%
Saranac Lake Local Development Corporation - 0.00 0.00 0.00 0.00
Saratoga County Capital Resource Corporation - 0.02 0.04 0.04 0.04
Saratoga County Prosperity Partnership, Inc 0.52 0.74
Schenectady County Capital Resource Corporation 0.06 0.01 0.01 0.01 0.00 -93%
Schoharie County Capital Resource Corporation 0.01 0.00 0.05 0.00 0.01 136%
Schuyler County Human Services Development Corporation 0.15 0.15 0.14 0.15 0.15 1%
Schuyler Tobacco Asset Securitization Corporation 0.36 0.36 0.37 0.37 0.37 2%
Seneca County Economic Development Corporation 0.17 0.13 0.15 0.11 0.12 -30%

Authorities Budget Office 17
2017 Annual Report on Public Authorities in New York State
Authority Name 2012
Amount
2013
Amount
2014
Amount
2015
Amount
2016
Amount
Percent
Change
2012-2016
Seneca County Funding Corporation -
Seneca Falls Development Corporation 0.03 0.02 0.02 0.04 0.02 -34%
Seneca Knit Development Corporation 0.12 0.02 0.02 0.01 0.01 -93%
Seneca Tobacco Asset Securitization Corporation 1.76 0.08 0.69 0.74 0.74 -58%
Sherburne Area Local Development Corporation 0.05 0.05 0.11 0.05 0.05 -11%
Sleepy Hollow Local Development Corporation 0.06 0.12
Southern Tier Network, Inc. 0.55 1.28 2.06 1.64 1.53 178%
Southold Local Development Corporation 0.03 0.03 0.02
St. Lawrence County IDA Civic Development Corporation3 0.00 0.00 0.00 0.00 0.00 -8%
St. Lawrence County IDA Local Development Corporation 2.11 0.58 0.56 0.34 0.40 -81%
Steuben Area Economic Development Corporation 0.08 0.01 0.00 0.01 0.01 -85%
Steuben Tobacco Asset Securitization Corporation 0.03 2.11 0.03 0.03 0.03 1%
Suffolk County Economic Development Corporation 0.02 0.19 0.03 0.08 0.28 1,306%
Suffolk Tobacco Asset Securitization Corporation 5.37 5.43 6.08 5.34 10.52 96%
Sullivan County Funding Corporation 0.08 0.07 0.07 0.13 0.11 39%
Sullivan Tobacco Asset Securitization Corporation 0.04 0.03 0.03 0.03 0.03 -34%
Syracuse Economic Development Corporation 0.40 0.41 0.12 0.24 0.40 1%
Syracuse Local Development Corporation - - - 0.00
TSASC, Inc. 0.48 0.45 0.44 0.44 0.42 -12%
The Catskill Local Development Corporation 0.10 0.02
The Greene Local Development Corporation - 0.00
The Mayor’s Fund to Advance New York City 4.07
The Suffolk County Land Bank Corporation - 0.05 0.21 0.48
The Town of Huntington Economic Development Corporation 0.03 0.03 0.03 0.03 0.02 -29%
Theater Subdistrict Council Local Development Corporation 0.04 0.02 0.02 0.01 0.02 -38%
Ticonderoga Revitalization Alliance 0.21 0.04 0.00 0.03 0.04 -81%
Tioga County Local Development Corporation 0.22 0.19 0.10 0.22 0.11 -48%
Tioga Tobacco Asset Securitization Corporation 0.02 0.02 0.02 0.02
Tompkins County Development Corporation 0.15 0.19 0.13 0.16 0.04 -75%
Tompkins Tobacco Asset Securitization Corporation 0.05 0.05 0.05 0.06 0.06 28%
Town Of Islip Economic Development Corporation - 0.02 0.02
Town of Amherst Development Corporation 0.25 0.03 0.00 0.00 0.00 -100%
Town of Babylon L. D. Corporation II 0.06 0.01 0.01 0.02
Town of Brookhaven Local Development Corporation 0.01 0.07 0.07 0.02 0.02 100%
Town of Colonie Local Development Corporation 0.01 0.01 0.01 0.01
Town of Dewitt Local Development Corporation 0.08 0.09 0.07 0.08
Town of Hempstead Local Development Corp. 0.04 0.04 0.04 0.04 0.04 0%
Town of Huntington Local Development Corporation 0.00 0.01 0.00 0.06 0.05 2,980%
Town of Montgomery Capital Resource Corporation 0.00
Town of Moreau Local Development Corporation - - - - -
Town of North Hempstead Business and Tourism Development Corp. 0.29 0.34 0.05 0.03 0.04 -87%
Town of Plattsburgh Local Development Corporation 0.03 0.00 0.00 0.01 0.01 -73%
Troy Community Land Bank Corporation - -
Troy Local Development Corporation 0.13 0.47 0.48 0.29 114%
Tuxedo Farms Local Development Corporation 0.04 0.09
Ulster County Capital Resource Corporation 0.01 0.01 0.03 0.07 0.05 623%
Ulster County Economic Development Alliance, Inc. 0.75 0.24 0.16 0.14 0.43 -42%
Ulster Tobacco Asset Securitization Corporation 0.12 0.04 0.04 0.03 1.04 786%
Utica Harbor Point Local Development Corporation 0.00 0.00 - - -100%
Victor Local Development Corporation 0.13 0.12 0.01 0.01 -90%
Village of Chittenango Local Development Corporation 0.01 0.01
Village of South Glens Falls Local Development Corporation 0.00 0.00 0.02 0.01
Village of Valatie Local Development Corporation 0.05
Warren County Local Development Corporation 0.12 0.05 0.06 0.06 0.08 -30%
Warren Tobacco Asset Securitization Corporation 0.45 0.42 0.47 0.48 0.03 -94%
Washington County Local Development Corporation 0.21 0.12 0.10 0.10 0.13 -39%
Washington Tobacco Asset Securitization Corporation 0.04 0.69 0.71 0.68 0.68 1,783%
Watertown Industrial Center Local Development Corporation 0.68 0.66 0.62 0.59 0.61 -10%
Wayne County Civic Facility Development Corporation 0.01 0.01 0.01 0.01 0.01 -49%
Wayne Economic Development Corporation 0.40 0.45 0.05 0.04 0.88 119%
Wayne Industrial Sustainability Development Corporation 0.01 - 0.01 0.02 0.02 87%
West Brighton Community Local Development Corporation 0.26 0.35 0.34 0.39 0.33 25%
Westchester County Local Development Corporation - 0.02 0.12 0.18 0.21

Authorities Budget Office 18
2017 Annual Report on Public Authorities in New York State
Public Authorities Debt 2012 – 2016
Authority Debt Outstanding
As shown in Table 5, the total amount of outstanding debt reported by all public authorities for 2016 was
$269.9 billion. Of this, $159.0 billion (nearly 60 percent) was debt issued by state authorities. The amount
of debt originally issued at the direction of New York State or backed by its moral obligation or direct
appropriations (state debt) totaled $48.6 billion, which constitutes 30.5 percent of the total outstanding
debt issued by state authorities. This is down from 33.9 percent in 2012. State authorities continue to
report a decrease in the amount of debt that has been issued for State purposes. Outstanding debt issued
by state authorities to finance the capital needs and purposes of these authorities, and retired using the
authorities’ own revenue streams and not State Fund dollars, totaled $68.1 billion, or 42.8 percent of the
total, which increased from 38.6 percent in 2012. Conduit debt, or debt issued on behalf of third parties,
issued by state authorities was $42.3 billion in 2016. This comprised 26.6 percent of all outstanding debt
as reported by state authorities, which decreased slightly from the 27.6 percent reported for 2012.
The outstanding debt reported by local authorities for the 2016 reporting period totaled $82.0 billion, a
19.5 percent increase in outstanding debt compared to 2012. Debt issued to finance the purposes of the
authority comprised 83.1 percent of the total outstanding debt of local authorities. The remaining
outstanding debt included state backed debt, 9.8 percent, and conduit debt, 7.1 percent. The total
amount of outstanding debt reported by IDAs continues to decline. IDAs reported a total of $9.9 billion
of total outstanding debt for the 2016 reporting period, down from $17.1 billion reported in 2012. This is
a 42.3 percent decrease. Conduit debt continues to make up most of the outstanding debt for IDAs, with
less than one percent reported as debt issued for authority purposes. However, the total amount of
Authority Name 2012
Amount
2013
Amount
2014
Amount
2015
Amount
2016
Amount
Percent
Change
2012-2016
Westchester Tobacco Asset Securitization Corporation 0.21 0.13 0.14 0.14
Wheatfield Local Development Corporation 0.00
White Plains Center Local Development Corporation - - -
Wyandanch Community Development Corporation 0.45 0.45 0.42 0.50 0.46 2%
Wyandanch Rising Inc. - 0.01 0.01 -
Wyoming County Business Center 0.14 0.10 0.15 0.12
Wyoming Tobacco Asset Securitization Corporation 0.03 0.03 - 0.18 0.77 2,254%
Yates County Capital Resource Corporation2 0.00 0.00 0.00 0.00 0.00 112%
Yates Tobacco Asset Securitization Corporation 0.40 0.41 0.41 0.04 0.04 -89%
Yonkers Downtown Waterfront Development Corporation 1.90 0.27 0.47
Yonkers Economic Development Corporation 0.26 0.20 0.20 0.17 0.03 -89%
Total: 869.91 994.98 1,035.66 941.64 996.65 15%
1 Hudson Development Corporation changed their FYE date for the 2014 reporting period. 2014 data is for 15 months.
*Data reported as of June 4, 2017. Data shown as 0.00 indicates an authority had operating expenses, but they round to $0.00 million. Data
shown as - indicates an authority reported $0 in operating expenses.
2 Yates County Capital Resource Corporation reported $1,746 in operating expenses in 2012 and $3,707 in operating expenses in 2016.
While the data rounds to $0, it is a 112% decrease over the 5 year period.3 St. Lawrence County IDA Civic Development Corporation reported $4,401 in operating expenses in 2012 and $4,062 in operating expenses
in 2016. While the data rounds to $0, it is a 8% decrease over the 5 year period.

Authorities Budget Office 19
2017 Annual Report on Public Authorities in New York State
outstanding debt reported by LDCs continues to increase. Conduit debt reported by LDCs comprises 55.9
percent of total debt, which increased from 28.4 percent in 2012.
As indicated in Table 6, the amount of outstanding debt reported by state authorities continues an
increasing trend from 2012. Most state authorities report a decrease in the amount of debt outstanding,
although the Metropolitan Transportation Authority, the New York State Housing Finance Agency and the
New York State Urban Development Corporation combined reported $65.1 billion in outstanding debt in
2016 compared to $51.5 billion in 2012, a 26.4 percent increase.
Table 7 shows that the amount of outstanding debt reported by local authorities continues to increase.
This is due primarily to continued debt issuances by the New York City Transitional Finance Authority
Authority
Type
Authority Name 2012 Debt
Outstanding
2013 Debt
Outstanding
2014 Debt
Outstanding
2015 Debt
Outstanding
2016 Debt
Outstanding
State Total: 150,645.55 152,662.78 157,141.62 156,284.86 158,993.50
State Guaranteed 18.94 15.44 12.35 9.26 6.17
State Supported 47,756.09 48,354.52 48,488.26 46,592.07 47,400.32
State Contingent Obligation 502.63 421.48 351.36 304.10 256.53
State Moral Obligation 16.94 12.20 6.79 2.21 1.68
Other State-Funded 2,769.96 2,438.03 2,022.35 1,637.64 889.54
Authority Debt - General Obligation 347.70 260.03 239.23 191.15 183.29
Authority Debt - Revenue 56,776.53 57,590.42 61,156.17 61,312.33 62,066.13
Authority Debt - Other 959.73 2,954.90 2,969.08 4,961.68 5,869.03
Conduit Debt 41,497.04 40,615.78 41,896.04 41,274.42 42,320.82
Local Total: 68,633.13 72,928.48 75,457.89 78,676.90 81,995.81
State Guaranteed 0.16 0.08 - - -Other State-Funded 5,308.66 6,154.12 6,051.42 7,425.76 8,045.98
Authority Debt - General Obligation 201.01 195.71 193.10 183.35 131.78
Authority Debt - Revenue 56,246.06 59,525.96 62,757.96 64,575.56 67,959.96
Authority Debt - Other 625.66 288.07 137.41 88.77 37.67
Conduit Debt 6,213.23 6,729.18 6,285.52 6,374.00 5,794.13
Conduit Debt - Pilot Increment Financing 38.36 35.38 32.48 29.47 26.30
Local - IDA Total: 17,114.69 15,260.11 13,577.69 11,384.04 9,876.17
Authority Debt - General Obligation 16.61 9.73 10.47 9.68 8.95
Authority Debt - Revenue - 0.88 0.72 0.43 0.23
Authority Debt - Other 35.62 33.68 11.68 12.32 16.09
Conduit Debt 17,062.45 15,152.83 13,496.27 11,308.15 9,802.86
Conduit Debt - Pilot Increment Financing - 62.99 58.55 53.45 48.05
Local - LDC Total: 12,598.77 14,492.92 16,228.25 18,313.25 18,985.58
Other State-Funded 23.77 17.53 20.17 26.79 12.75
Authority Debt - General Obligation 39.27 40.23 117.45 129.62 89.47
Authority Debt - Revenue 4,970.48 4,963.03 4,975.59 4,971.39 4,913.17
Authority Debt - Other 3,991.34 3,886.80 3,898.69 3,910.30 3,358.85
Conduit Debt 3,570.15 5,582.52 7,214.20 9,273.70 10,610.29
Conduit Debt - Pilot Increment Financing 3.78 2.81 2.14 1.45 1.06
Debt Total: 248,992.14 255,344.29 262,405.44 264,659.05 269,851.07
Table 5: Debt Categories by Authority Type*
($ millions)
*Data reported as of June 4, 2017, except for Westchester County Health Care Corporation, which is reported as of June 9, 2017. Data shown as -
indicates no debt outstanding during reporting period.

Authorities Budget Office 20
2017 Annual Report on Public Authorities in New York State
(increase of $11.1billion), the New York City Municipal Water Finance Authority (increase of $1.3 billion),
and the New York City Housing Development Corporation (increase of $1.2 billion).
IDA debt continues its decreasing trend, which is shown in Table 8. IDA total debt in 2016 was $9.8 billion,
which is a 42.3 percent decrease from the debt reported in 2012. This decreasing trend of IDA debt is
primarily due to the expiration of the IDA’s statutory authority to provide financial assistance to civic
facility projects in January 2008. Of the 100 reporting IDAs, only three (Brookhaven, Greene, Orleans)
reported increasing the amount of outstanding debt in 2016.
As shown in Table 9, LDCs reported a 79.8 percent increase for total outstanding debt, or an increase of
$7.0 billion, between 2012 and 2016. The Build NYC Resource Corporation was the biggest contributor to
this increase, jumping from $93.5 million in 2012 to $2.6 billion in 2016. Other LDCs reporting a significant
increase in outstanding debt are the Monroe County Industrial Development Corporation ($893 million
increase), the Dutchess County Local Development Corporation ($722 million increase), the Westchester
County Local Development Corporation ($636 million increase), and the Buffalo and Erie County Industrial
Land Development Corporation ($202 million increase).
Table 10 shows the total debt outstanding in 2016 for all TASCs was $2.9 billion. This is a 15.8 percent
decrease when compared to 2012 for those reporting.

Authorities Budget Office 21
2017 Annual Report on Public Authorities in New York State
Authority Name 2012 Debt
Outstanding
2013 Debt
Outstanding
2014 Debt
Outstanding
2015 Debt
Outstanding
2016 Debt
Outstanding
Percent
Change
2012 - 2016
Battery Park City Authority 1,051.42 1,075.08 1,058.63 1,058.63 1,009.08 -4.0%
Buffalo Fiscal Stability Authority 91.24 76.70 63.16 48.90 34.93 -61.7%
Central New York Regional Transportation Authority 0.13 0.09 - - - -100.0%
Development Authority of the North Country 21.25 16.77 12.14 9.14 13.94 -34.4%
Dormitory Authority of the State of New York 44,493.94 45,333.54 45,772.00 45,664.53 47,286.01 6.3%
Environmental Facilities Corporation 8,108.29 7,236.56 6,721.39 6,414.72 6,053.60 -25.3%
Erie County Fiscal Stability Authority 353.37 422.67 391.77 349.04 300.15 -15.1%
Erie County Medical Center Corporation 187.29 180.35 173.13 175.53 173.65 -7.3%
Long Island Power Authority 6,783.03 7,048.87 7,584.60 7,283.00 6,168.41 -9.1%
Metropolitan Transportation Authority 31,490.03 33,218.76 34,746.67 36,474.61 37,238.42 18.3%
Municipal Assistance Corporation for the City of Troy 45.58 41.79 38.00 33.78 29.40 -35.5%
Nassau County Interim Finance Authority 1,379.12 1,228.16 1,087.52 921.61 783.65 -43.2%
Nassau Health Care Corporation 251.83 247.47
New York Job Development Authority 6,596.45 6,998.39 6,939.30 6,436.63 6,595.92 0.0%
New York Local Government Assistance Corporation 3,118.92 2,835.68 2,592.38 2,345.04 2,058.40 -34.0%
New York State Bridge Authority 122.74 116.67 110.28 103.70 96.86 -21.1%
New York State Energy Research and Development Authority 3,426.14 3,426.14 3,388.14 3,386.35 3,059.30 -10.7%
New York State Housing Finance Agency 10,785.15 11,266.16 12,661.28 13,644.43 15,446.38 43.2%
New York State Thruway Authority 14,340.47 14,791.10 13,627.38 10,977.11 10,165.42 -29.1%
New York State Urban Development Corporation 9,221.42 8,982.74 10,720.56 11,083.64 12,418.80 34.7%
Niagara Frontier Transportation Authority 187.78 168.67 152.34 140.28 134.73 -28.3%
Ogdensburg Bridge and Port Authority 5.38 4.82 4.13 3.38 2.59 -51.8%
Port of Oswego Authority 0.42 0.35 1.41 1.27
Power Authority of the State of New York 1,745.95 1,675.43 1,597.24 1,562.97 1,370.77 -21.5%
Roswell Park Cancer Institute Corporation 229.47 216.24 232.36 218.23 203.82 -11.2%
State of New York Mortgage Agency 3,032.28 2,823.12 2,703.24 2,602.72 2,510.08 -17.2%
State of New York Municipal Bond Bank Agency 629.29 577.80 551.56 506.11 454.93 -27.7%
Tobacco Settlement Financing Corporation 2,411.21 2,131.09 1,744.90 1,377.64 659.87 -72.6%
United Nations Development Corporation 97.36 92.38 87.19 81.75 76.07 -21.9%
Utility Debt Securitization Authority (UDSA)1 1,932.32 2,919.44 3,965.53
Westchester County Health Care Corporation 438.65 429.19 446.63 460.71 682.84 55.7%
Total: 150,645.55 152,662.78 157,141.62 156,284.86 158,993.50 5.5%
Table 6: State Authority Debt Outstanding 2012 - 2016*
($ millions)
*Data reported as of June 4, 2017, except for Westchester County Health Care Corporation, which is reported as of June 9, 2017. Data shown as 0.00 indicates an
authority had debt, but it rounds to $0.00 million. Data shown as - indicates no debt outstanding during reporting period.1 Utility Debt Securitization Authority (UDSA) was created by Part B of Chapter 173, Laws of New York, 2013, and is not required to report for prior periods.

Authorities Budget Office 22
2017 Annual Report on Public Authorities in New York State
Authority Name 2012 Debt
Outstanding
2013 Debt
Outstanding
2014 Debt
Outstanding
2015 Debt
Outstanding
2016 Debt
Outstanding
Percent
Change
2012 - 2016
Albany Community Development Agency 0.89 0.66 0.59 0.51
Albany County Airport Authority 121.75 113.15 105.05 96.78 88.22 -27.5%
Albany Municipal Water Finance Authority 55.82 51.45 46.97 42.34
Albany Parking Authority 18.37 17.47 16.58 15.61 14.63 -20.4%
Albany Port District Commission 1.15 1.00 - - - -100.0%
American Museum of Natural History Planetarium Authority 0.57 0.57 0.57 0.57 0.57 0.0%
Buffalo Municipal Water Finance Authority 162.22 160.16 152.61 143.42 136.92 -15.6%
Buffalo Sewer Authority 42.12 38.63 36.89 43.86 41.83 -0.7%
Buffalo Urban Renewal Agency 8.56 7.29 6.03 3.87 - -100.0%
Cayuga County Water and Sewer Authority 8.55 7.38 5.98 5.66 5.35 -37.4%
Central New York Regional Market Authority 0.55 0.52 1.02 0.95 0.89 60.8%
Clifton Park Water Authority 23.58 20.92 19.79 18.62 17.41 -26.2%
Dutchess County Resource Recovery Agency 23.15 19.74 16.14 15.22 14.24 -38.5%
Dutchess County Water and Wastewater Authority 36.01 34.67 35.85 34.70 38.95 8.1%
Elmira Urban Renewal Agency 0.41 0.31 0.21 0.11 - -100.0%
Erie County Water Authority 91.70 83.16 74.97 66.45 51.56 -43.8%
Franklin County Solid Waste Management Authority 12.38 9.66 22.28 14.51
Freeport Community Development Agency - 0.10 - 1.16 1.16
Gloversville Community Development Agency - - 0.15 0.15 0.15
Green Island Power Authority 16.97 16.37 15.58 14.79 13.95 -17.8%
Haverstraw Urban Renewal Agency 2.98 2.85 2.73 2.60
Incorporated Village of Hempstead Community Development Agency 4.71 1.57 1.57 -66.6%
Islip Resource Recovery Authority 16.59 11.59 9.43 8.34 7.23 -56.4%
Ithaca Urban Renewal Agency 0.81 0.78 0.75 0.75 0.72 -11.1%
Livingston County Water and Sewer Authority 4.92 4.77 4.48 4.34 4.19 -14.8%
Monroe County Airport Authority 49.51 43.47 37.11 30.41 23.37 -52.8%
Monroe County Water Authority 132.83 148.19 145.34 142.39 139.01 4.6%
Nassau County Bridge Authority 10.31 10.11 9.90 9.68 9.45 -8.3%
Nassau County Sewer and Storm Water Finance Authority 146.80 138.84 157.20 154.26 144.06 -1.9%
New York City Educational Construction Fund 266.16 264.19 240.41
New York City Health and Hospitals Corporation 1,002.04 917.41 880.21 833.41 784.42 -21.7%
New York City Housing Development Corporation 8,796.63 9,461.81 9,200.76 10,099.42 9,978.06 13.4%
New York City Municipal Water Finance Authority 28,378.28 29,078.57 29,872.18 29,570.91 29,714.29 4.7%
New York City Transitional Finance Authority 26,267.35 29,202.45 31,038.82 33,850.11 37,357.48 42.2%
Niagara Falls Water Board 104.69 109.00 105.87 105.72
North Hempstead Solid Waste Management Authority 5.05 4.25 3.44 2.61
Nyack Parking Authority - 0.22 0.17
Oneida-Herkimer Solid Waste Management Authority 47.91 42.41 36.93 33.24 30.79 -35.7%
Onondaga County Resource Recovery Agency 58.14 52.20 46.02 54.56 52.82 -9.2%
Onondaga County Water Authority 67.40 64.67 62.00 64.26 60.12 -10.8%
Rensselaer County Water and Sewer Authority 14.12 13.96 13.80 10.18 10.04 -28.9%
Rockland County Solid Waste Management Authority 59.86 59.51 55.76 51.77 47.60 -20.5%
Saratoga County Water Authority 43.63 42.64 46.46 45.93 44.98 3.1%
Schenectady Metroplex Development Authority 43.05 45.73 56.33 54.62 51.62 19.9%
Suffolk County Judicial Facilities Agency - 69.08 66.23 63.94 63.05
Suffolk County Water Authority 742.97 800.29 745.84 726.21 814.91 9.7%
Town of Islip Community Development Agency 0.93 0.80 - - - -100.0%
Trust for Cultural Resources of the City of New York 1,666.87 1,618.21 1,645.80 1,542.71 1,567.20 -6.0%
Trust for Cultural Resources of the County of Onondaga 153.55 216.75 214.06 211.24 209.42 36.4%
Ulster County Resource Recovery Agency 19.06 16.63 14.18 12.11 9.98 -47.6%
Upper Mohawk Valley Memorial Auditorium Authority 0.22 0.69 0.72
Upper Mohawk Valley Regional Water Board1 58.75 - - - - -100.0%
Upper Mohawk Valley Regional Water Finance Authority 65.10 62.34 58.70 61.92
Water Authority of Great Neck North 33.93 32.53 31.07 30.57 30.11 -11.3%
Water Authority of Western Nassau County 67.66 66.11 64.52 112.59 110.20 62.9%
Wayne County Water and Sewer Authority 1.10 0.99 0.89 0.78 0.67 -39.3%
Wilton Water and Sewer Authority 1.11 0.84 0.57 0.29
Yonkers Community Development Agency 2.84 0.34 0.34 0.34 0.34 -88.0%
Yonkers Parking Authority 2.07 1.95 2.32 2.17
Total: 68,633.13 72,928.48 75,457.89 78,676.90 81,995.81 19.5%
1 Upper Mohawk Valley Regional Water Board changed their FYE date for the 2014 reporting period. 2014 data is for 21 months.
* Data reported as of June 4, 2017. Data shown as 0.00 indicates an authority had debt, but it rounds to $0.00 million. Data shown as - indicates no debt outstanding
during reporting period.
Table 7: Local Authority (Other) Debt Outstanding 2012 - 2016*
($ millions)

Authorities Budget Office 23
2017 Annual Report on Public Authorities in New York State
Authority Name 2012 Debt
Outstanding
2013 Debt
Outstanding
2014 Debt
Outstanding
2015 Debt
Outstanding
2016 Debt
Outstanding
Percent
Change
2012 - 2016
Albany City IDA 569.51 533.75 438.10 198.91 176.62 -69.0%
Albany County IDA 26.06 21.73 18.66 17.38 16.73 -35.8%
Allegany IDA 23.14 21.59 18.75 10.72 10.70 -53.7%
Amherst IDA 26.69 21.06 19.83 18.56 17.25 -35.4%
Amsterdam IDA 1.64 1.36 1.07 .87 .80 -51.5%
Auburn IDA 3.36 2.35 2.20 2.09 1.97 -41.4%
Babylon IDA 59.77 50.06 42.27 33.94 25.83 -56.8%
Bethlehem IDA 22.43 12.61 12.32 12.02 11.70 -47.8%
Brookhaven IDA 98.30 70.63 107.84 104.94 100.97 2.7%
Broome IDA 113.84 103.01 59.80 .48 - -100.0%
Cattaraugus IDA 18.73 15.54 14.10 13.29 5.50 -70.6%
Cayuga IDA 2.07 2.07 - - - -100.0%
Chautauqua IDA 120.90 92.97 96.45 93.66 92.07 -23.8%
Chemung IDA 73.21 65.29 38.73 12.28 11.90 -83.8%
Chenango IDA 1.86 1.14 - - - -100.0%
City of Schenectady IDA 48.06 45.75 37.10 33.09 31.25 -35.0%
City of Utica IDA 22.07 - - - - -100.0%
Clarence IDA 2.97 .35 - - - -100.0%
Clifton Park IDA 12.45 .12 - - - -100.0%
Clinton County IDA 59.09 56.12 52.66 40.87 2.82 -95.2%
Cohoes IDA 34.35 33.12 4.54 4.38 4.22 -87.7%
Colonie IDA 17.75 6.59 6.35 6.11 5.81 -67.3%
Columbia IDA 14.70 13.80 12.89 12.25 11.60 -21.1%
Concord IDA 1.36 1.31 - - - -100.0%
Cortland IDA 17.51 - - - - -100.0%
Delaware County IDA 12.12 11.00 9.52 8.36 7.14 -41.1%
Dutchess County IDA 355.81 292.07 252.78 234.73 215.16 -39.5%
Erie County IDA 1,586.44 1,537.81 1,163.80 1,019.75 1,097.95 -30.8%
Essex County IDA 21.37 9.49 4.18 3.85 3.71 -82.7%
Fairport IDA - .30 .30 .30 -
Franklin County IDA 19.35 15.25 13.89 12.45
Fulton County IDA 8.60 8.02 7.42 6.78 3.84 -55.3%
Genesee County IDA 18.48 15.41 14.08 13.32 12.53 -32.2%
Geneva IDA 57.56 57.56 57.56 57.56 57.56 0.0%
Glen Cove IDA 11.06 10.83 15.15 15.15 - -100.0%
Glens Falls IDA 21.42 21.18 11.18 10.90 - -100.0%
Green Island IDA 14.17 14.04 13.91 13.76 13.60 -4.1%
Greene County IDA .28 .63 .57 .51 .46 61.0%
Guilderland IDA 6.49 5.86 5.29 4.65 4.29 -33.9%
Hamburg IDA 1.75 1.46 1.13 .63 .50 -71.6%
Hamilton County IDA - - - - -
Hempstead IDA 263.75 210.23 177.75 135.88 133.07 -49.5%
Herkimer IDA 27.17 31.63 16.84 14.59 8.54 -68.6%
Hornell IDA1 .96 .86 1.91 .81 .70 -26.6%
Islip IDA 90.17 71.02 56.99 16.78
Jefferson IDA 9.87 3.93 3.48 28.38 27.46 178.2%
Lancaster IDA 37.00 35.18 32.34 25.01 26.95 -27.2%
Lewis County IDA .01 .01 .01 0.00 0.00 -100.0%
Livingston County IDA 11.76 10.72 9.62 8.48 7.23 -38.5%
Madison County IDA 161.46 113.75 110.78 15.24 17.24 -89.3%
Middletown IDA .86 5.41 .75 - - -100.0%
Monroe IDA 511.16 544.11 429.65 412.80 407.66 -20.2%
Montgomery County IDA 31.33 29.41 .30 - - -100.0%
Mount Pleasant IDA 44.73 36.56 21.06 20.11
Mount Vernon IDA 33.51 32.80 34.14 20.90
Nassau County IDA 584.22 537.00 525.29 460.92 431.52 -26.1%
New Rochelle IDA 62.38 71.92 68.48 63.84 62.59 0.3%
New York City IDA 7,747.57 6,842.52 6,269.17 5,549.31 4,688.97 -39.5%
Newburgh IDA 37.71 36.14 34.61 33.12 31.53 -16.4%
Niagara County IDA 51.53 47.33 42.90 39.98 37.23 -27.7%
Niagara Town IDA 0.00 0.00 0.00 0.00 0.00 0.0%
North Greenbush IDA 2.19 2.05 1.91 1.65 1.50 -31.5%
Oneida County IDA 81.64 59.37 37.80 26.09 9.84 -87.9%
Onondaga County IDA 200.40 171.70 165.57 153.37 145.92 -27.2%
Ontario County IDA 46.48 45.34 44.24 42.75 41.68 -10.3%
Orange County IDA 200.06 195.34 182.99 50.31 49.08 -75.5%
Orleans County IDA 3.75 1.93 10.19 9.73 8.82 135.2%
Table 8: IDA Debt Outstanding 2012 - 2016*
($ millions)

Authorities Budget Office 24
2017 Annual Report on Public Authorities in New York State
Authority Name 2012 Debt
Outstanding
2013 Debt
Outstanding
2014 Debt
Outstanding
2015 Debt
Outstanding
2016 Debt
Outstanding
Percent
Change
2012 - 2016
Oswego County IDA 25.04 22.32 21.34 19.96 18.46 -26.3%
Otsego County IDA 31.72 25.06 10.67 1.14 .99 -96.9%
Peekskill IDA 35.96 24.58 24.15 23.66 23.14 -35.7%
Port Chester IDA 18.48 18.21 18.00 17.78 17.55 -5.0%
Port Jervis IDA 7.08 7.01 6.56 6.56 - -100.0%
Poughkeepsie IDA 18.19 3.68 3.57 3.47 3.35 -81.6%
Putnam County IDA 37.31 28.33 26.37
Rensselaer County IDA 142.73 138.18 111.49 101.79 66.27 -53.6%
Riverhead IDA 78.13 74.79 64.06 60.05 56.56 -27.6%
Rockland County IDA 107.95 103.84 84.40 61.92 57.17 -47.0%
Salamanca IDA .53 .48 .42 .28 .20 -63.1%
Saratoga County IDA 84.43 119.21 98.33 91.33 83.35 -1.3%
Schenectady County IDA 19.19 18.64 17.96 9.41 9.02 -53.0%
Schoharie County IDA 1.53 1.41 0.00 0.00 - -100.0%
Schuyler County IDA 1.20 1.04 .88 .72 .55 -54.3%
Seneca County IDA 162.44 30.73 28.91 27.03 6.56 -96.0%
St. Lawrence County IDA 106.64 103.70 102.71 97.92 85.42 -19.9%
Steuben County IDA .43 .38 - - - -100.0%
Suffolk County IDA 558.81 517.34 406.43 263.00 183.75 -67.1%
Sullivan County IDA 31.07 .74 .55 .40 .37 -98.8%
Syracuse IDA 695.40 690.15 716.37 697.67 451.37 -35.1%
Tioga County IDA 1.10 1.04 1.14 1.05 .94 -14.8%
Tompkins County IDA 303.30 264.36 247.55 196.74 188.30 -37.9%
Town of Lockport IDA 4.16 4.15 4.14 .12 .11 -97.4%
Town of Montgomery IDA - - - -
Troy IDA 31.88 29.69 28.34 25.00 25.00 -21.6%
Ulster County IDA 101.81 98.10 77.64 75.62 73.48 -27.8%
Warren and Washington Counties IDA 70.25 67.99 65.61 11.70 10.74 -84.7%
Wayne County IDA 6.58 5.06 5.06 5.06 - -100.0%
Westchester County IDA 412.47 308.56 337.30 219.94 231.01 -44.0%
Wyoming County IDA 2.28 2.18 2.06 1.93
Yates County IDA 7.44 6.78 6.05 5.33 4.56 -38.7%
Yonkers IDA 240.79 232.89 226.46 208.87 195.96 -18.6%
Total: 17,114.69 15,260.11 13,577.69 11,384.03 9,876.17 -42.3%
1 Hornell IDA changed their FYE date for the 2014 reporting period. 2014 data is for 21 months.
* Data reported as of June 4, 2017. Data shown as 0.00 indicates an authority had debt, but it rounds to $0.00 million. Data shown as - indicates no debt
outstanding during reporting period.
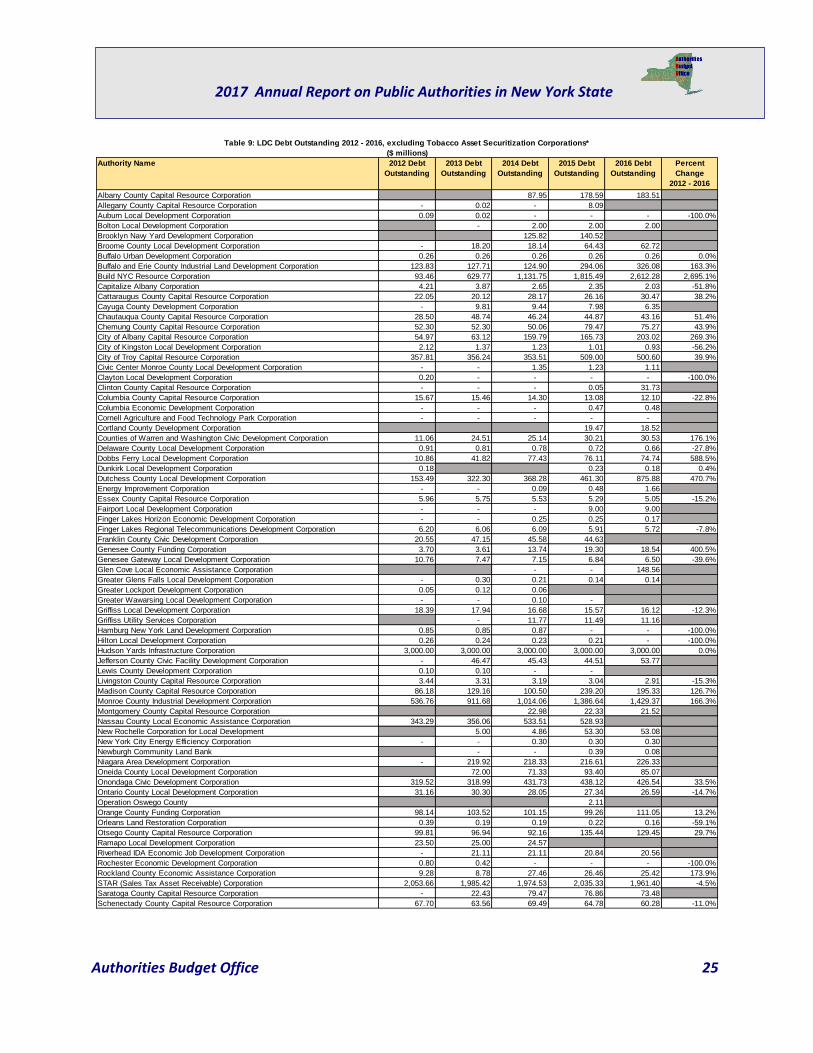
Authorities Budget Office 25
2017 Annual Report on Public Authorities in New York State
Authority Name 2012 Debt
Outstanding
2013 Debt
Outstanding
2014 Debt
Outstanding
2015 Debt
Outstanding
2016 Debt
Outstanding
Percent
Change
2012 - 2016
Albany County Capital Resource Corporation 87.95 178.59 183.51
Allegany County Capital Resource Corporation - 0.02 - 8.09
Auburn Local Development Corporation 0.09 0.02 - - - -100.0%
Bolton Local Development Corporation - 2.00 2.00 2.00
Brooklyn Navy Yard Development Corporation 125.82 140.52
Broome County Local Development Corporation - 18.20 18.14 64.43 62.72
Buffalo Urban Development Corporation 0.26 0.26 0.26 0.26 0.26 0.0%
Buffalo and Erie County Industrial Land Development Corporation 123.83 127.71 124.90 294.06 326.08 163.3%
Build NYC Resource Corporation 93.46 629.77 1,131.75 1,815.49 2,612.28 2,695.1%
Capitalize Albany Corporation 4.21 3.87 2.65 2.35 2.03 -51.8%
Cattaraugus County Capital Resource Corporation 22.05 20.12 28.17 26.16 30.47 38.2%
Cayuga County Development Corporation - 9.81 9.44 7.98 6.35
Chautauqua County Capital Resource Corporation 28.50 48.74 46.24 44.87 43.16 51.4%
Chemung County Capital Resource Corporation 52.30 52.30 50.06 79.47 75.27 43.9%
City of Albany Capital Resource Corporation 54.97 63.12 159.79 165.73 203.02 269.3%
City of Kingston Local Development Corporation 2.12 1.37 1.23 1.01 0.93 -56.2%
City of Troy Capital Resource Corporation 357.81 356.24 353.51 509.00 500.60 39.9%
Civic Center Monroe County Local Development Corporation - - 1.35 1.23 1.11
Clayton Local Development Corporation 0.20 - - - - -100.0%
Clinton County Capital Resource Corporation - - - 0.05 31.73
Columbia County Capital Resource Corporation 15.67 15.46 14.30 13.08 12.10 -22.8%
Columbia Economic Development Corporation - - - 0.47 0.48
Cornell Agriculture and Food Technology Park Corporation - - - - -
Cortland County Development Corporation 19.47 18.52
Counties of Warren and Washington Civic Development Corporation 11.06 24.51 25.14 30.21 30.53 176.1%
Delaware County Local Development Corporation 0.91 0.81 0.78 0.72 0.66 -27.8%
Dobbs Ferry Local Development Corporation 10.86 41.82 77.43 76.11 74.74 588.5%
Dunkirk Local Development Corporation 0.18 0.23 0.18 0.4%
Dutchess County Local Development Corporation 153.49 322.30 368.28 461.30 875.88 470.7%
Energy Improvement Corporation - - 0.09 0.48 1.66
Essex County Capital Resource Corporation 5.96 5.75 5.53 5.29 5.05 -15.2%
Fairport Local Development Corporation - - - 9.00 9.00
Finger Lakes Horizon Economic Development Corporation - - 0.25 0.25 0.17
Finger Lakes Regional Telecommunications Development Corporation 6.20 6.06 6.09 5.91 5.72 -7.8%
Franklin County Civic Development Corporation 20.55 47.15 45.58 44.63
Genesee County Funding Corporation 3.70 3.61 13.74 19.30 18.54 400.5%
Genesee Gateway Local Development Corporation 10.76 7.47 7.15 6.84 6.50 -39.6%
Glen Cove Local Economic Assistance Corporation - - 148.56
Greater Glens Falls Local Development Corporation - 0.30 0.21 0.14 0.14
Greater Lockport Development Corporation 0.05 0.12 0.06
Greater Wawarsing Local Development Corporation - - 0.10 -
Griffiss Local Development Corporation 18.39 17.94 16.68 15.57 16.12 -12.3%
Griffiss Utility Services Corporation - 11.77 11.49 11.16
Hamburg New York Land Development Corporation 0.85 0.85 0.87 - - -100.0%
Hilton Local Development Corporation 0.26 0.24 0.23 0.21 - -100.0%
Hudson Yards Infrastructure Corporation 3,000.00 3,000.00 3,000.00 3,000.00 3,000.00 0.0%
Jefferson County Civic Facility Development Corporation - 46.47 45.43 44.51 53.77
Lewis County Development Corporation 0.10 0.10 - -
Livingston County Capital Resource Corporation 3.44 3.31 3.19 3.04 2.91 -15.3%
Madison County Capital Resource Corporation 86.18 129.16 100.50 239.20 195.33 126.7%
Monroe County Industrial Development Corporation 536.76 911.68 1,014.06 1,386.64 1,429.37 166.3%
Montgomery County Capital Resource Corporation 22.98 22.33 21.52
Nassau County Local Economic Assistance Corporation 343.29 356.06 533.51 528.93
New Rochelle Corporation for Local Development 5.00 4.86 53.30 53.08
New York City Energy Efficiency Corporation - - 0.30 0.30 0.30
Newburgh Community Land Bank - - 0.39 0.08
Niagara Area Development Corporation - 219.92 218.33 216.61 226.33
Oneida County Local Development Corporation 72.00 71.33 93.40 85.07
Onondaga Civic Development Corporation 319.52 318.99 431.73 438.12 426.54 33.5%
Ontario County Local Development Corporation 31.16 30.30 28.05 27.34 26.59 -14.7%
Operation Oswego County 2.11
Orange County Funding Corporation 98.14 103.52 101.15 99.26 111.05 13.2%
Orleans Land Restoration Corporation 0.39 0.19 0.19 0.22 0.16 -59.1%
Otsego County Capital Resource Corporation 99.81 96.94 92.16 135.44 129.45 29.7%
Ramapo Local Development Corporation 23.50 25.00 24.57
Riverhead IDA Economic Job Development Corporation - 21.11 21.11 20.84 20.56
Rochester Economic Development Corporation 0.80 0.42 - - - -100.0%
Rockland County Economic Assistance Corporation 9.28 8.78 27.46 26.46 25.42 173.9%
STAR (Sales Tax Asset Receivable) Corporation 2,053.66 1,985.42 1,974.53 2,035.33 1,961.40 -4.5%
Saratoga County Capital Resource Corporation - 22.43 79.47 76.86 73.48
Schenectady County Capital Resource Corporation 67.70 63.56 69.49 64.78 60.28 -11.0%
Table 9: LDC Debt Outstanding 2012 - 2016, excluding Tobacco Asset Securitization Corporations*
($ millions)

Authorities Budget Office 26
2017 Annual Report on Public Authorities in New York State
Authority Name 2012 Debt
Outstanding
2013 Debt
Outstanding
2014 Debt
Outstanding
2015 Debt
Outstanding
2016 Debt
Outstanding
Percent
Change
2012 - 2016
Schoharie County Capital Resource Corporation - - 10.00 9.74 9.36
Schuyler County Human Services Development Corporation 5.14 4.98 4.81 4.63 4.45 -13.3%
Seneca Knit Development Corporation - - 0.03 - -
Sherburne Area Local Development Corporation 1.76 1.61 1.29 1.13 0.98 -44.1%
Southold Local Development Corporation - 19.56 19.56
St. Lawrence County Industrial Development Agency Civic Development Corp. 110.24 97.89 96.58 95.13 178.71 62.1%
Steuben Area Economic Development Corporation 16.77 16.76 16.51 16.17 15.81 -5.7%
Suffolk County Economic Development Corporation 258.82 295.15 398.36 463.82 449.11 73.5%
Sullivan County Funding Corporation 66.09 61.42 65.71 61.75 57.67 -12.7%
Syracuse Economic Development Corporation 5.45 5.25 5.16 5.02 4.89 -10.3%
Syracuse Local Development Corporation - - - - 42.60
Tompkins County Development Corporation 49.15 112.73 141.88 190.25 181.33 268.9%
Town Of Islip Economic Development Corporation 21.72 21.06 20.19
Town of Amherst Development Corporation 168.57 169.42 165.44 157.75 152.77 -9.4%
Town of Babylon L. D. Corporation II - - 24.95 23.63
Town of Brookhaven Local Development Corporation 53.53 81.88 91.95 89.03 123.02 129.8%
Town of Colonie Local Development Corporation 22.00 37.00 30.32 36.89
Town of Dewitt Local Development Corporation 3.42 3.21 2.99 2.75
Town of Hempstead Local Development Corp. 201.93 322.34 380.04 375.69 370.63 83.5%
Town of Huntington Local Development Corporation 19.60 19.60 17.45 16.40 12.95 -33.9%
Troy Local Development Corporation 2.33 2.17 2.00 1.53 1.39 -40.5%
Tuxedo Farms Local Development Corporation 30.00 30.00
Ulster County Capital Resource Corporation 13.55 12.78 23.56 22.75 21.96 62.0%
Ulster County Economic Development Alliance, Inc. 0.09 0.12 0.12 0.09 0.07 -23.7%
Village of Valatie Local Development Corporation 0.24
Washington County Local Development Corporation - - 0.16 0.16 0.14
Wayne County Civic Facility Development Corporation 18.31 16.79 15.24 13.64 12.89 -29.6%
Westchester County Local Development Corporation - 93.43 246.45 257.78 636.04
Wheatfield Local Development Corporation 0.00
Wyandanch Community Development Corporation 0.41 0.58 0.76 1.17 - -100.0%
Yates County Capital Resource Corporation 9.82 9.40 8.98 8.53 8.08 -17.7%
Yonkers Downtown Waterfront Development Corporation 2.35 2.09 1.94
Yonkers Economic Development Corporation 37.74 36.72 56.29 53.80 51.23 35.8%
Total: 8,714.25 10,656.50 12,413.86 14,551.35 15,668.77 79.8%
* Data reported as of June 4, 2017. Data shown as 0.00 indicates an authority had debt, but it rounds to $0.00 million. Data shown as - indicates no debt outstanding during
reporting period.

Authorities Budget Office 27
2017 Annual Report on Public Authorities in New York State
Public Authorities Procurement Practices 2012 – 2016
Procurement Practices
Public authorities are required to report in PARIS all procurement transactions made during the year that
have an actual or estimated cumulative value of $5,000 or more. While competitive bidding is only
required by law for certain types of procurements, it is important that public authorities also seek
competition for other types of procurement to assure that goods or services of desired quality are
procured in the most economic manner. Table 11 displays the procurement transactions reported by
state authorities for 2016. State authorities reported spending a total of $7.3 billion in procurement
contracts during the 2016 reporting year. This is an 8.8 percent decrease from the total amount reported
by state authorities in 2015.
Authority Name 2012 Debt
Outstanding
2013 Debt
Outstanding
2014 Debt
Outstanding
2015 Debt
Outstanding
2016 Debt
Outstanding
Percent
Change
2012 - 2016
Broome TASC 57.36 56.35 54.86 53.86 46.47 -19.0%
Cayuga TASC 19.88 19.61 19.17 18.91 17.42 -12.4%
Chautauqua TASC 60.70 60.43 71.88 71.67 69.18 14.0%
Chemung TASC 6.24 5.86 5.71 5.31 4.53 -27.4%
Columbia TASC 17.53 17.53 14.18 13.97 12.75 -27.2%
Cortland TASC 11.27 11.04 10.71 10.48 9.65 -14.4%
Dutchess TASC 59.52 57.84 55.61 53.84 52.12 -12.4%
Erie TASC 314.49 319.15 321.14 326.18 315.89 0.4%
Fiscal Year 2005 Securitization Corporation 270.24 259.85 230.79 197.38 175.17 -35.2%
Genesee TASC 16.19 16.12 15.95 15.90 15.07 -6.9%
Greene TASC 11.99 11.89 11.70 11.60 10.94 -8.8%
Herkimer TASC 20.03 19.96 19.76 19.70 18.66 -6.8%
Livingston TASC 13.16 12.97 12.67 12.50 11.49 -12.7%
Monroe TASC 225.92 224.95 222.84 222.33 211.19 -6.5%
Niagara TASC 37.53 36.56 59.17 58.10 53.71 43.1%
Oneida TASC 77.02 76.90 76.24 76.19 72.48 -5.9%
Onondaga TASC 119.67 117.60 114.50 112.46 99.34 -17.0%
Ontario TASC 23.13 22.72 22.12 21.71 19.96 -13.7%
Oswego TASC 14.42 13.65 12.57 11.75 27.68 91.9%
Putnam TASC 17.59 17.28 17.21 16.08 -8.6%
Rensselaer TASC 39.17 38.43 37.35 36.59 32.15 -17.9%
Rockland Second TASC 5.81 5.42 4.90 4.47Rockland TASC 70.00 68.99 67.57 66.34Schuyler TASC 3.84 3.78 3.67 3.61 3.27 -15.0%
Seneca TASC 99.22 99.10 98.90 98.78 98.14 -1.1%
Steuben TASC 30.51 30.44 30.16 30.11 28.66 -6.1%
Suffolk TASC 265.06 263.73 262.24 260.59 255.20 -3.7%
Sullivan TASC 13.78 12.84 12.23 12.02 22.16 60.9%
TSASC, Inc. 1,252.75 1,245.44 1,228.37 1,222.04 1,144.53 -8.6%
Tioga TASC 14.23 14.16 13.99 13.93Tompkins TASC 9.70 9.55 9.30 9.16 8.38 -13.6%
Ulster TASC 36.64 36.10 35.18 34.64 35.53 -3.0%
Warren TASC 4.17 4.03 3.83 3.69 3.13 -24.8%
Washington TASC 13.59 13.50 13.31 13.23 12.38 -8.9%
Westchester TASC 197.29 195.25 191.65 189.80Wyoming TASC 9.23 9.09 8.86 8.73 7.99 -13.4%Yates TASC 5.53 5.48 5.39 5.34 4.99 -9.8%
Total: 3,464.39 3,416.30 3,395.72 3,344.10 2,916.28 -15.8%
Table 10: Tobacco Asset Securitization Corporations (TASC) Debt Outstanding 2012 - 2016*
($ millions)
* Data reported as of June 4, 2017. Data shown as 0.00 indicates an authority had debt, but it rounds to $0.00 million. Data shown as - indicates no debt
outstanding during reporting period.
Authorities Budget Office 28
2017 Annual Report on Public Authorities in New York State
Approximately 74.0 percent of the total reported by state authorities for 2016 was spent on contracts
awarded through a competitive selection process as shown in Table 11. The remaining amounts expended
by state authorities on procurement contracts was either through non-competitive bid (18.0 percent),
non-contract procurement/purchase order (5.9 percent), or were purchased under state contract (2.0
percent). Overall, these numbers illustrate that the majority expended by state authorities in 2016 was
awarded through a competitive selection process. However, several authorities including Homeless
Housing Assistance Corporation, New York State Thoroughbred Breeding Development Fund, Long Island
Power Authority, Nassau County Interim Finance Authority, Westchester County Health Care Corporation,
Hudson River-Black River Regulating District, Municipal Assistance Corporation for the City of Troy, and
Natural Heritage Trust reported expending higher amounts on contracts awarded through non-
competitive procurement processes than contracts awarded through competitive bids.
As shown in Table 12, local authorities reported spending $2.5 billion in procurement contracts during the
2016 reporting year, which is a 6.4 percent decrease from 2015. The majority of the expended amount
(51.3 percent) was for contracts awarded through a competitive selection process. The remaining
procurements were either for contracts awarded without a competitive selection process (27.9 percent),
purchases under state contract (11.0 percent), or non-contract procurement/purchase order (9.9
percent). New York City Health and Hospitals Corporation and Eastern Rensselaer County Solid Waste
Management Authority have the greatest percentage increases compared to 2015 in awarding contracts
through non-contract procurement or purchase order.
Table 13 indicates that IDAs reported spending $34.5 million in procurement contracts during the 2016
reporting year which is significantly less than all the other authority types, although it is still a 41 percent
increase from 2015. Unlike the other authority types, IDAs spent more on non-competitively bid contracts
(55.7 percent) than competitively selected contracts (28.1 percent). The remaining procurements were
either awarded through non-contract procurement/purchase order (15.3 percent) or purchases under
state contract (0.9 percent).
Additionally, Table 14 shows that LDCs reported spending $94.3 million in procurement contracts during
the 2016 reporting year. The majority expended was on contracts awarded through a competitive
selection process (63.0 percent). The remaining procurements were either awarded through a non-
contract procurement/purchase order (17.9 percent), non-competitive bidding process (17.4 percent), or
purchases under state contract (1.7 percent).

Authorities Budget Office 29
2017 Annual Report on Public Authorities in New York State
Authority Name Authority
Contract -
Competitive Bid
($)
Authority
Contract - Non-
Competitive
Bid ($)
Non Contract
Procurement/
Purchase
Order ($)
Purchased
Under State
Contract ($)
Total
Procurements
($)
Agriculture and New York State Horse Breeding Development Fund 363,653 196,663 - - 560,316
Albany Convention Center Authority 53,063,845 43,190 - - 53,107,035
Battery Park City Authority 11,152,688 2,819,491 29,898,782 - 43,870,961
Buffalo Fiscal Stability Authority 283,569 165,248 37,000 - 485,817
Capital District Transportation Authority 31,712,010 8,880,402 2,009,713 1,362,552 43,964,677
Central New York Regional Transportation Authority 13,616,280 3,782,963 7,956,034 1,627,151 26,982,427
Development Authority of the North Country 7,975,320 4,471,507 2,748,341 481,092 15,676,260
Dormitory Authority of the State of New York 585,803,464 18,259 - - 585,821,723
Environmental Facilities Corporation 4,238,173 282,910 404,826 42,772 4,968,681
Erie County Medical Center Corporation 26,912,235 - 217,900,986 - 244,813,221
Homeless Housing Assistance Corporation 25,100 2,425,379 - - 2,450,479
Housing Trust Fund Corporation 181,961,126 2,810,220 2,023,922 5,937,869 192,733,137
Hudson River Park Trust 20,169,081 12,467,047 587,651 191,016 33,414,795
Hudson River-Black River Regulating District 394,157 430,946 - 7,990 833,093
Long Island Power Authority 538,885,033 690,102,243 1,635,368 - 1,230,622,644
Metropolitan Transportation Authority 2,267,562,789 174,756,443 86,956,529 57,183,123 2,586,458,885
Municipal Assistance Corporation for the City of Troy 4,550 32,735 10,558 - 47,843
Nassau County Interim Finance Authority 1,705,752 16,113,938 98,146 234,929 18,152,765
Natural Heritage Trust 804,205 1,932,159 1,120,048 283,647 4,140,059
Nelson A. Rockefeller Empire State Plaza Performing Arts Center Operating Corp. 22,943 - 516,972 243,212 783,127
New York Convention Center Operating Corporation 18,406,975 10,363,961 20,533,171 7,547,101 56,851,208
New York Job Development Authority 415,305 - - - 415,305
New York Local Government Assistance Corporation 22,678,578 161,350 24,000 - 22,863,928
New York State Affordable Housing Corporation 123,361 12,824 - - 136,185
New York State Bridge Authority 6,708,326 570,633 6,917,932 932,837 15,129,728
New York State Energy Research and Development Authority 470,491,308 98,484,609 - - 568,975,917
New York State Housing Finance Agency 6,514,722 758,034 476,112 392,207 8,141,075
New York State Olympic Regional Development Authority 11,329,149 4,262,746 4,700,954 1,642,458 21,935,308
New York State Thoroughbred Breeding Development Fund 38,049 634,584 497,247 - 1,169,880
New York State Thruway Authority 108,085,510 3,107,240 - 27,017,128 138,209,877
New York State Urban Development Corporation 158,856,483 29,789,202 17,208,870 77,603 205,932,158
Niagara Frontier Transportation Authority 41,669,068 1,994,056 4,238,399 3,580,729 51,482,252
Ogdensburg Bridge and Port Authority 3,929,558 68,729 2,391,039 112,730 6,502,056
Power Authority of the State of New York 553,486,077 40,195,002 3,288,690 28,818,094 625,787,863
Rochester-Genesee Regional Transportation Authority 21,928,489 1,366,512 15,167,833 2,665,669 41,128,503
Roosevelt Island Operating Corporation 7,875,562 288,185 1,301,149 - 9,464,895
Roswell Park Cancer Institute Corporation 137,432,594 36,333,468 - 6,163,066 179,929,128
State of New York Mortgage Agency 1,464,538 1,294,965 779,226 - 3,538,729
State of New York Municipal Bond Bank Agency 57,864 - - - 57,864
Tobacco Settlement Financing Corporation 38,900 - - - 38,900
United Nations Development Corporation 14,208,896 8,710,102 2,031,315 3,399,649 28,349,962
Westchester County Health Care Corporation 86,890,310 156,144,071 - - 243,034,381
Total: 5,419,285,592 1,316,272,016 433,460,814 149,944,624 7,318,963,046
*Data reported as of June 4, 2017, except for Westchester County Health Care Corporation, which is reported as of June 9, 2017.
Table 11: State Authority Procurements 2016*

Authorities Budget Office 30
2017 Annual Report on Public Authorities in New York State
Authority Name Authority
Contract -
Competitive Bid
($)
Authority
Contract - Non-
Competitive
Bid ($)
Non Contract
Procurement/
Purchase
Order ($)
Purchased
Under State
Contract ($)
Total
Procurements
($)
Albany County Airport Authority 21,088,987 3,692,969 1,355,652 633,800 26,771,408
Albany Parking Authority 326,256 531,240 368,758 - 1,226,254
Albany Port District Commission 621,687 364,324 1,065,306 22,708 2,074,025
Buffalo Municipal Water Finance Authority 43,335 - 57,568 - 100,903
Buffalo Sewer Authority 26,431,505 1,131,827 5,615,829 518,820 33,697,981
Buffalo Urban Renewal Agency 408,475 2,866,948 531,859 - 3,807,282
Buffalo Water Board 17,297,928 - 4,670,532 - 21,968,461
Cayuga County Water and Sewer Authority 11,000 381,429 304,717 - 697,146
Central New York Regional Market Authority - 31,456 20,194 - 51,650
Chautauqua, Cattaraugus, Allegany and Steuben Southern Tier Ext. Railroad 5,182 3,412,593 - - 3,417,775
Clifton Park Water Authority 43,036 1,371,622 1,020,203 79,228 2,514,089
Dutchess County Resource Recovery Agency 2,178,471 9,824,848 492,885 56,027 12,552,231
Dutchess County Water and Wastewater Authority 4,905,936 358,471 799,042 20,564 6,084,014
Eastern Rensselaer County Solid Waste Management Authority 405,006 - 119,568 - 524,574
Erie County Water Authority 33,335,187 2,320,961 1,957,001 5,440,626 43,053,775
Genesee Valley Regional Market Authority 1,042,515 286,064 176,305 - 1,504,884
Glen Cove Community Development Agency 7,300 - - - 7,300
Gloversville Community Development Agency - 25,863 - - 25,863
Green Island Power Authority - - 1,296,911 - 1,296,911
Huntington Community Development Agency - 6,500 - - 6,500
Islip Resource Recovery Authority 984,371 18,010,333 151,410 - 19,146,114
Ithaca Urban Renewal Agency 25,888 - - - 25,888
Jamestown Urban Renewal Agency - 8,795 - - 8,795
Livingston County Water and Sewer Authority 504,574 537,857 2,106,311 77,607 3,226,349
Middletown Community Development Agency 176,827 - - - 176,827
Monroe County Airport Authority 968,620 15,859,327 154,754 128,105 17,110,806
Monroe County Water Authority 32,953,668 3,147,110 3,425,891 1,919,714 41,446,383
Nassau County Bridge Authority 779,002 104,990 47,903 34,408 966,303
Nassau County Sewer and Storm Water Finance Authority 26,000 - - - 26,000
New York City Health and Hospitals Corporation 852,978,658 606,881,744 173,460,102 255,297,260 1,888,617,764
New York City Housing Development Corporation 4,481,065 3,755,614 206,229 480,325 8,923,233
New York City Municipal Water Finance Authority 36,272,288 - - - 36,272,288
New York City Transitional Finance Authority 40,882,455 - - - 40,882,455
New York City Water Board 35,120,696 109,166 120,317 - 35,350,179
Niagara Falls Urban Renewal Agency - 5,900 - - 5,900
Oneida County Sports Facility Authority - - - 23,598 23,598
Oneida-Herkimer Solid Waste Management Authority 4,852,456 2,245,248 3,692,274 1,720,246 12,510,225
Onondaga County Resource Recovery Agency 3,107,129 1,157,865 392,232 63,440 4,720,666
Onondaga County Water Authority 11,278,511 15,254,486 1,360,189 1,322,609 29,215,795
Orange County Water Authority 107,783 - - - 107,783
Rensselaer County Water and Sewer Authority 297,123 56,310 37,717 - 391,150
Rockland County Solid Waste Management Authority 34,923,732 3,055,007 454,181 2,344,273 40,777,193
Saratoga County Water Authority 1,090,030 617,515 19,519 21,774 1,748,838
Schenectady Metroplex Development Authority 2,278,432 1,188,309 414,012 9,333 3,890,086
Suffolk County Judicial Facilities Agency 8,015 28,913 - - 36,928
Suffolk County Water Authority 83,895,125 - 25,669,850 4,604,289 114,169,264
Syracuse Regional Airport Authority 10,886,182 1,860,911 4,755,167 434,570 17,936,829
Syracuse Urban Renewal Agency 7,000 20,336 - - 27,336
Town of Erwin Urban Renewal Agency - 17,860 - - 17,860
Town of Islip Community Development Agency 714,906 - - - 714,906
Town of North Hempstead Community Development Agency 1,311,301 129,258 9,700 - 1,450,258
Trust for Cultural Resources of the City of New York 75,000 310,000 159,249 - 544,249
Trust for Cultural Resources of the County of Onondaga 6,920 35,000 - - 41,920
Ulster County Resource Recovery Agency 6,585,219 801,819 1,669,680 7,950 9,064,668
Upper Mohawk Valley Regional Water Board 6,477,742 367,456 3,632,020 884,720 11,361,939
Utica Urban Renewal Agency 13,800 25,444 - 83,831 123,075
Village of Elmira Heights Urban Renewal Agency 44,689 5,000 - - 49,689
Village of Fairport Urban Renewal Agency 16,846 7,656 - - 24,502
Village of Patchogue Community Development Agency 21,700 - 53,046 - 74,746
Village of Rockville Centre Community Development Agency 43,000 - - - 43,000
Water Authority of Great Neck North 2,193,536 210,584 2,956,032 985,101 6,345,253
Water Authority of Western Nassau County 6,290,831 654,887 - - 6,945,718
Wayne County Water and Sewer Authority 1,255,876 - 4,040,962 346,781 5,643,619
White Plains Urban Renewal Agency 25,596 - - - 25,596
Yonkers Community Development Agency 1,183,748 2,000 - - 1,185,748
Total: 1,293,298,144 703,079,814 248,841,079 277,561,710 2,522,780,747
*Data reported as of June 4, 2017.
Table 12: Local Authority Procurements 2016*

Authorities Budget Office 31
2017 Annual Report on Public Authorities in New York State
Authority Name Authority
Contract -
Competitive
Bid ($)
Authority
Contract - Non-
Competitive
Bid ($)
Non Contract
Procurement/
Purchase
Order ($)
Purchased
Under State
Contract ($)
Total
Procurements
($)
Albany City IDA 33,160 417,602 - - 450,762
Albany County IDA 6,100 - 10,000 - 16,100
Allegany IDA - 11,668 51,637 - 63,305
Amherst IDA 11,000 10,500 15,968 - 37,468
Amsterdam IDA 13,804 73,645 11,318 - 98,767
Auburn IDA 21,332 25,900 - - 47,232
Babylon IDA - 348,159 - - 348,159
Bethlehem IDA - 90,800 6,950 - 97,750
Brookhaven IDA 55,347 110,642 - - 165,989
Broome IDA 1,080,032 64,465 327,943 101,431 1,573,871
Cattaraugus IDA - 58,809 - - 58,809
Cayuga IDA 12,290 25,500 - - 37,790
Chautauqua IDA 159,341 183,734 - - 343,075
Chemung IDA - 195,839 75,000 - 270,839
City of Schenectady IDA 4,250 101,625 38,073 - 143,948
City of Utica IDA 10,300 - - - 10,300
Clarence IDA - 45,000 19,300 - 64,300
Clifton Park IDA 11,000 13,875 - - 24,875
Clinton County IDA - 86,129 - - 86,129
Cohoes IDA - 143,876 - - 143,876
Colonie IDA 15,633 68,400 - - 84,033
Columbia IDA - - 20,329 - 20,329
Cortland IDA 6,500 25,000 8,433 - 39,933
Delaware County IDA - - 141,976 - 141,976
Dutchess County IDA 12,750 582,500 - - 595,250
Erie County IDA 1,219,256 60,000 998,284 5,758 2,283,298
Essex County IDA 14,000 - - - 14,000
Fairport IDA - 204,303 - - 204,303
Fulton County IDA 7,520 17,500 - - 25,020
Genesee County IDA 186,757 2,667,256 427,391 - 3,281,404
Glen Cove IDA 571,048 268,517 71,153 - 910,717
Glens Falls IDA - 16,357 - - 16,357
Green Island IDA - 7,000 - - 7,000
Greene County IDA 35,832 735,252 - - 771,084
Guilderland IDA - 7,000 - - 7,000
Hempstead IDA 24,500 122,712 - - 147,212
Herkimer IDA - 25,603 9,300 - 34,903
Hornell IDA 80,142 97,945 106,838 - 284,925
Jefferson IDA 215,136 810,984 187,217 - 1,213,337
Lancaster IDA - - 173,800 - 173,800
Lewis County IDA - 21,787 174,746 - 196,533
Livingston County IDA 757,763 51,545 - - 809,308
Madison County IDA 2,300 64,771 - - 67,071
Middletown IDA - 24,000 - - 24,000
Monroe IDA 106,511 470,000 - - 576,511
Montgomery County IDA 132,425 52,100 - - 184,525
Nassau County IDA 829,676 649,528 30,789 - 1,509,993
New Rochelle IDA - 105,000 96,083 - 201,083
New York City IDA 416,604 52,327 42,171 - 511,102
Newburgh IDA 208,585 44,147 - - 252,732
Niagara County IDA 107,409 228,165 25,588 - 361,163
Niagara Town IDA - 19,318 - - 19,318
North Greenbush IDA - 21,846 - - 21,846
Oneida County IDA - - 178,000 - 178,000
Onondaga County IDA 357,312 266,884 - - 624,196
Ontario County IDA 528,717 181,443 78,360 - 788,520
Orange County IDA - - 951,673 - 951,673
Orleans County IDA 39,149 - 88,125 10,338 137,612
Oswego County IDA 29,494 648,092 248,409 - 925,995
Otsego County IDA 180,481 635,416 17,645 - 833,542
Table 13: IDA Procurements 2016*

Authorities Budget Office 32
2017 Annual Report on Public Authorities in New York State
Authority Name Authority
Contract -
Competitive
Bid ($)
Authority
Contract - Non-
Competitive
Bid ($)
Non Contract
Procurement/
Purchase
Order ($)
Purchased
Under State
Contract ($)
Total
Procurements
($)
Peekskill IDA - 40,162 - - 40,162
Port Chester IDA 108,728 74,100 - - 182,828
Poughkeepsie IDA - - 24,842 - 24,842
Rensselaer County IDA 37,814 218,750 - - 256,564
Riverhead IDA - 53,800 - - 53,800
Rockland County IDA 6,746 26,424 - - 33,170
Saratoga County IDA 5,050 226,720 - - 231,770
Schenectady County IDA 4,250 - 10,931 - 15,181
Schoharie County IDA 6,000 - 16,832 - 22,832
Seneca County IDA 10,600 189,627 - - 200,227
St. Lawrence County IDA 93,546 4,982,634 45,348 - 5,121,529
Steuben County IDA 13,500 36,825 - - 50,325
Suffolk County IDA 354,402 134,139 24,671 187,711 700,924
Sullivan County IDA - - 356,555 - 356,555
Syracuse IDA 201,389 416,152 - - 617,540
Tioga County IDA 716,175 14,518 5,000 - 735,693
Tompkins County IDA 7,000 307,325 - - 314,325
Town of Erwin IDA - 211,889 - - 211,889
Town of Lockport IDA - 91,695 - - 91,695
Troy IDA 1,260 130,354 - - 131,614
Ulster County IDA 7,237 75,000 23,704 - 105,941
Wallkill IDA 4,550 30,258 - - 34,808
Warren and Washington Counties IDA - 8,500 81,071 - 89,571
Wayne County IDA - - 61,506 - 61,506
Westchester County IDA 541,475 525,828 - - 1,067,302
Wyoming County IDA - 83,863 3,995 - 87,858
Yates County IDA 9,450 - - - 9,450
Yonkers IDA 52,000 57,369 - - 109,369
Total: 9,684,627 19,196,397 5,286,956 305,238 34,473,218
* Data reported as of June 4, 2017.

Authorities Budget Office 33
2017 Annual Report on Public Authorities in New York State
Authority Name Authority
Contract -
Competitive
Bid ($)
Authority
Contract - Non-
Competitive
Bid ($)
Non Contract
Procurement/
Purchase
Order ($)
Purchased
Under State
Contract ($)
Total
Procurements
($)
Albany County Land Bank Corporation 723,331 31,227 225,806 - 980,364
Albany CSO Pool Communities Corporation 12,803 - - - 12,803
Auburn Local Development Corporation - 6,450 - - 6,450
Batavia Development Corporation 32,846 - - - 32,846
Bolton Local Development Corporation 7,595 - - - 7,595
Brooklyn Bridge Park Corporation 26,137,871 30,550 730,812 1,558,685 28,457,918
Broome County Land Bank 154,930 - 6,983 - 161,913
Broome County Local Development Corporation 4,500 - - - 4,500
Broome Tobacco Asset Securitization Corporation 14,800 34,972 - - 49,772
Buffalo and Erie County Industrial Land Development Corporation 26,489 - 27,862 - 54,351
Buffalo and Erie County Regional Development Corporation 71,526 - 313,327 - 384,853
Buffalo Erie Niagara Land Improvement Corporation 484,748 67,953 99,690 - 652,390
Buffalo Urban Development Corporation 1,377,514 253,269 166,149 - 1,796,932
Build NYC Resource Corporation 37,085 1,500,000 34,869 - 1,571,954
Capitalize Albany Corporation 43,645 247,789 181,548 - 472,982
Catskill Watershed Corporation 562,551 351,071 - - 913,622
Cattaraugus County Capital Resource Corporation - 22,600 - - 22,600
Cayuga County Development Corporation - 15,000 - - 15,000
Cayuga Tobacco Asset Securitization Corporation 5,700 - 5,250 - 10,950
Chautauqua County Land Bank Corporation 87,691 - 733,990 - 821,680
Chautauqua Tobacco Asset Securitization Corporation - - 43,735 - 43,735
Chemung County Capital Resource Corporation - 6,000 - - 6,000
City of Watertown Local Development Corporation - - 100,209 - 100,209
Civic Center Monroe County Local Development Corporation 519,014 140,422 198,650 - 858,086
Clinton County Capital Resource Corporation - 11,880 - - 11,880
Cohoes Local Development Corporation - 87,072 - - 87,072
Columbia Economic Development Corporation - 26,223 173,322 - 199,545
Cortland County Business Development Corporation 6,500 - 36,674 - 43,174
Cortland Tobacco Asset Securitization Corporation - 5,250 5,250 - 10,500
Delaware County Local Development Corporation 9,300 - - - 9,300
Development Chenango Corporation 9,613 224,058 - - 233,671
Dobbs Ferry Local Development Corporation - - 12,000 - 12,000
Dutchess County Local Development Corporation 324,048 24,052 - - 348,100
Dutchess Tobacco Asset Securitization Corporation - 20,735 - - 20,735
East of Hudson Watershed Corporation 2,052,714 - - - 2,052,714
Economic Development Corporation - Warren County 52,232 33,706 60,342 - 146,280
Erie Tobacco Asset Securitization Corporation 35,079 70,013 16,200 - 121,292
Finger Lakes Horizon Economic Development Corporation 1,900 - - - 1,900
Finger Lakes Regional Telecommunications Development Corporation - - 643,829 16,000 659,829
Fiscal Year 2005 Securitization Corporation 17,500 - - - 17,500
Franklin County Local Development Corporation - 11,804 - - 11,804
Fulton County Center for Regional Growth, Inc. 14,950 11,905 7,264 - 34,119
Genesee Gateway Local Development Corporation 100,272 471,950 20,306 - 592,528
Genesee Tobacco Asset Securitization Corporation - - 10,972 - 10,972
Glens Falls Civic Development Corporation 1,445 2,700 - - 4,145
Governors Island Corporation 13,646,722 - - - 13,646,722
Greater Glens Falls Local Development Corporation 8,500 28,676 - - 37,176
Greater Rochester Outdoor Sports Facility Corporation 79,598 297,572 474,873 - 852,043
Greater Syracuse Property Development Corporation 1,245,561 214,103 - - 1,459,665
Greene Tobacco Asset Securitization Corporation - - 11,200 - 11,200
Griffiss Local Development Corporation 1,912,205 - 2,120,966 - 4,033,171
Griffiss Utility Services Corporation - - 6,483,529 - 6,483,529
Herkimer Tobacco Asset Securitization Corporation - - 11,500 - 11,500
Hudson Valley AgriBusiness Development Corp - 197,925 - - 197,925
Hudson Yards Development Corporation 221,713 579,467 - - 801,180
Hudson Yards Infrastructure Corporation 198,076 - - - 198,076
Jamestown Local Development Corporation - 100,000 - - 100,000
Jefferson County Local Development Corporation 17,532 149,494 81,357 - 248,383
Land Reutilization Corporation of The Capital Region 1,376,121 169,419 31,018 - 1,576,557
Livingston County Development Corporation 59,736 48,466 - - 108,202
Local Development Corporation of the Town of Union - - 94,772 - 94,772
Lumber City Development Corporation - - 19,878 - 19,878
Madison County Capital Resource Corporation - 89,618 - - 89,618
Maplewood Manor Local Development Corporation 111,073 5,398 - - 116,471
Monroe County Industrial Development Corporation 8,300 166,983 - - 175,283
Monroe Tobacco Asset Securitization Corporation 15,175 94,303 - - 109,478
Table 14: LDC Procurements 2016*
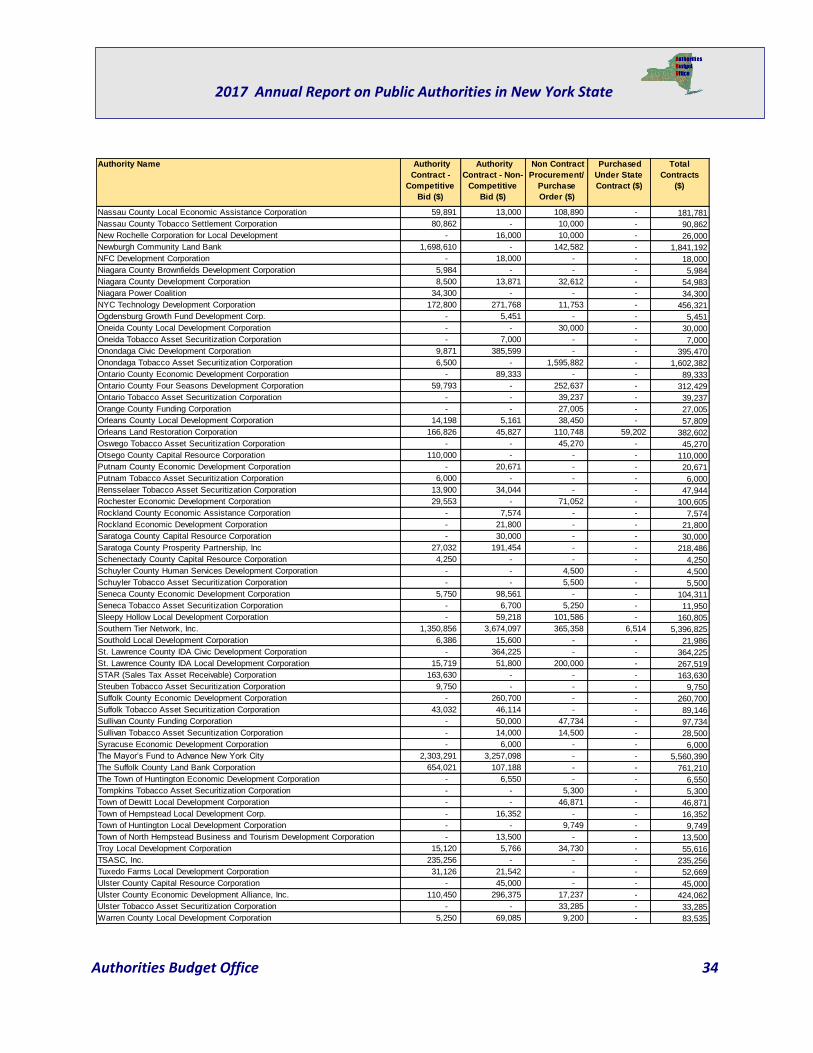
Authorities Budget Office 34
2017 Annual Report on Public Authorities in New York State
Authority Name Authority
Contract -
Competitive
Bid ($)
Authority
Contract - Non-
Competitive
Bid ($)
Non Contract
Procurement/
Purchase
Order ($)
Purchased
Under State
Contract ($)
Total
Contracts
($)
Nassau County Local Economic Assistance Corporation 59,891 13,000 108,890 - 181,781
Nassau County Tobacco Settlement Corporation 80,862 - 10,000 - 90,862
New Rochelle Corporation for Local Development - 16,000 10,000 - 26,000
Newburgh Community Land Bank 1,698,610 - 142,582 - 1,841,192
NFC Development Corporation - 18,000 - - 18,000
Niagara County Brownfields Development Corporation 5,984 - - - 5,984
Niagara County Development Corporation 8,500 13,871 32,612 - 54,983
Niagara Power Coalition 34,300 - - - 34,300
NYC Technology Development Corporation 172,800 271,768 11,753 - 456,321
Ogdensburg Growth Fund Development Corp. - 5,451 - - 5,451
Oneida County Local Development Corporation - - 30,000 - 30,000
Oneida Tobacco Asset Securitization Corporation - 7,000 - - 7,000
Onondaga Civic Development Corporation 9,871 385,599 - - 395,470
Onondaga Tobacco Asset Securitization Corporation 6,500 - 1,595,882 - 1,602,382
Ontario County Economic Development Corporation - 89,333 - - 89,333
Ontario County Four Seasons Development Corporation 59,793 - 252,637 - 312,429
Ontario Tobacco Asset Securitization Corporation - - 39,237 - 39,237
Orange County Funding Corporation - - 27,005 - 27,005
Orleans County Local Development Corporation 14,198 5,161 38,450 - 57,809
Orleans Land Restoration Corporation 166,826 45,827 110,748 59,202 382,602
Oswego Tobacco Asset Securitization Corporation - - 45,270 - 45,270
Otsego County Capital Resource Corporation 110,000 - - - 110,000
Putnam County Economic Development Corporation - 20,671 - - 20,671
Putnam Tobacco Asset Securitization Corporation 6,000 - - - 6,000
Rensselaer Tobacco Asset Securitization Corporation 13,900 34,044 - - 47,944
Rochester Economic Development Corporation 29,553 - 71,052 - 100,605
Rockland County Economic Assistance Corporation - 7,574 - - 7,574
Rockland Economic Development Corporation - 21,800 - - 21,800
Saratoga County Capital Resource Corporation - 30,000 - - 30,000
Saratoga County Prosperity Partnership, Inc 27,032 191,454 - - 218,486
Schenectady County Capital Resource Corporation 4,250 - - - 4,250
Schuyler County Human Services Development Corporation - - 4,500 - 4,500
Schuyler Tobacco Asset Securitization Corporation - - 5,500 - 5,500
Seneca County Economic Development Corporation 5,750 98,561 - - 104,311
Seneca Tobacco Asset Securitization Corporation - 6,700 5,250 - 11,950
Sleepy Hollow Local Development Corporation - 59,218 101,586 - 160,805
Southern Tier Network, Inc. 1,350,856 3,674,097 365,358 6,514 5,396,825
Southold Local Development Corporation 6,386 15,600 - - 21,986
St. Lawrence County IDA Civic Development Corporation - 364,225 - - 364,225
St. Lawrence County IDA Local Development Corporation 15,719 51,800 200,000 - 267,519
STAR (Sales Tax Asset Receivable) Corporation 163,630 - - - 163,630
Steuben Tobacco Asset Securitization Corporation 9,750 - - - 9,750
Suffolk County Economic Development Corporation - 260,700 - - 260,700
Suffolk Tobacco Asset Securitization Corporation 43,032 46,114 - - 89,146
Sullivan County Funding Corporation - 50,000 47,734 - 97,734
Sullivan Tobacco Asset Securitization Corporation - 14,000 14,500 - 28,500
Syracuse Economic Development Corporation - 6,000 - - 6,000
The Mayor’s Fund to Advance New York City 2,303,291 3,257,098 - - 5,560,390
The Suffolk County Land Bank Corporation 654,021 107,188 - - 761,210
The Town of Huntington Economic Development Corporation - 6,550 - - 6,550
Tompkins Tobacco Asset Securitization Corporation - - 5,300 - 5,300
Town of Dewitt Local Development Corporation - - 46,871 - 46,871
Town of Hempstead Local Development Corp. - 16,352 - - 16,352
Town of Huntington Local Development Corporation - - 9,749 - 9,749
Town of North Hempstead Business and Tourism Development Corporation - 13,500 - - 13,500
Troy Local Development Corporation 15,120 5,766 34,730 - 55,616
TSASC, Inc. 235,256 - - - 235,256
Tuxedo Farms Local Development Corporation 31,126 21,542 - - 52,669
Ulster County Capital Resource Corporation - 45,000 - - 45,000
Ulster County Economic Development Alliance, Inc. 110,450 296,375 17,237 - 424,062
Ulster Tobacco Asset Securitization Corporation - - 33,285 - 33,285
Warren County Local Development Corporation 5,250 69,085 9,200 - 83,535

Authorities Budget Office 35
2017 Annual Report on Public Authorities in New York State
Public Authorities Staffing and Compensation 2012 – 2016
Authority Staffing Information
As shown in Table 15, state authorities have reported an increase in staffing levels from 2012 to 2016,
mainly due to an increase in staff reported by the Metropolitan Transportation Authority, New York
Convention Center Operating Corporation, Erie County Medical Center and New York State Olympic
Regional Development Authority. Some state authorities do report decreases in staffing levels from 2012
to 2016. These include Dormitory Authority of the State of New York, New York State Thruway Authority,
and Westchester Health Care Corporation.
Local authorities have reported an increase in staffing levels from 2012 to 2016, as indicated in Table 16.
The increase in staffing can still be attributed to New York City Health and Hospitals Corporation reporting
the addition of more than 3,900 staff (an 8.8 percent increase).
As indicated in Table 17, IDAs reported having a total of 359 staff in 2016 earning a total compensation of
$11.0 million. However, this compensation doesn’t represent the total amount paid to staff working for
IDAs since many IDAs rely on staff that are paid by either a local government or an LDC to perform the
work of the IDA.
Also in 2016, a total of 122 LDCs, not including TASCs, reported having staff. These entities employed
1,158 individuals at a total cost of $57.6 million. The New York City Economic Development Corporation
alone reported 463 staff, representing 40.0 percent of total staff and 60.6 percent of total compensation.
However, this compensation doesn’t represent the total amount paid to staff working for LDCs since many
LDCs rely on staff that are paid by either a local government or another authority to perform the work of
the LDC.
Authority Name Authority
Contract -
Competitive
Bid ($)
Authority
Contract - Non-
Competitive
Bid ($)
Non Contract
Procurement/
Purchase
Order ($)
Purchased
Under State
Contract ($)
Total
Procurements
($)
Washington Tobacco Asset Securitization Corporation - - 6,975 - 6,975
Watertown Industrial Center Local Development Corporation 91,056 8,022 117,798 - 216,876
Wayne Industrial Sustainability Development Corporation - - 11,570 - 11,570
West Brighton Community Local Development Corporation 16,500 28,850 - - 45,350
Westchester County Local Development Corporation 14,077 159,010 27,530 - 200,617
Wyandanch Community Development Corporation - 646,161 - - 646,161
Wyoming County Business Center - 28,600 23,012 - 51,612
Wyoming Tobacco Asset Securitization Corporation 5,200 - 5,250 - 10,450
Yates County Capital Resource Corporation 1,900 - - - 1,900
Yates Tobacco Asset Securitization Corporation - - 25,750 - 25,750
Yonkers Economic Development Corporation 1,250 16,000 - - 17,250
Total: 59,418,992 16,398,742 16,828,932 1,640,401 94,287,067
*Data reported as of June 4, 2017.

Authorities Budget Office 36
2017 Annual Report on Public Authorities in New York State
Authority Name 2012
Staff
2012 Comp. 2013
Staff
2013 Comp. 2014
Staff
2014 Comp. 2015
Staff
2015 Comp. 2016
Staff
2016 Comp.
Agriculture and New York State Horse Breeding Development Fund 2 85,941 2 100,257 2 44,077 1 44,077 1 45,840
Albany Convention Center Authority 2 196,515 2 196,515 2 196,515 2 196,515 2 196,515
Battery Park City Authority 183 7,761,519 208 9,310,546 226 9,597,595 194 6,021,897 233 10,383,144
Buffalo Fiscal Stability Authority 5 318,461 5 349,342 5 342,861 5 352,452 5 380,212
Capital District Transportation Authority 778 34,810,208 738 34,771,071 781 35,464,746 771 36,531,923 883 38,151,017
Central New York Regional Transportation Authority 635 26,796,992 617 26,309,893 698 28,491,322 736 29,333,979 764 29,375,705
Development Authority of the North Country 75 3,647,804 76 3,881,460 74 4,169,104 80 4,330,995 84 4,563,852
Dormitory Authority of the State of New York 599 47,566,267 580 47,851,956 549 45,104,535 523 44,306,107 534 46,156,854
Environmental Facilities Corporation 107 7,525,845 110 7,786,492 112 8,054,515 114 8,235,704 122 8,362,226
Erie County Fiscal Stability Authority 5 263,471 4 250,877 4 263,553 4 281,763 4 281,763
Erie County Medical Center Corporation 3,436 153,848,953 3,493 168,146,141 3,506 179,187,483 3,800 201,182,031 3,945 208,273,474
Housing Trust Fund Corporation 56 3,926,791 56 3,645,469 130 7,258,673 213 13,055,048 242 17,352,325
Hudson River Park Trust 103 3,871,606 101 4,466,838 110 4,766,549 104 5,060,349 109 5,238,909
Hudson River-Black River Regulating District 19 1,073,919 19 1,128,705 19 1,109,697 20 1,236,182 22 1,413,996
Long Island Power Authority 105 11,330,209 103 11,257,133 100 6,967,473 55 5,722,811 52 5,679,212
Metropolitan Transportation Authority 71,882 5,280,979,581 72,489 5,370,447,027 78,551 6,231,899,537 78,493 6,198,769,381 78,087 6,354,767,490
Municipal Assistance Corporation for the City of Troy 2 - 2 -
Nassau County Interim Finance Authority 5 719,732 6 673,750 5 732,822 5 745,500 5 745,962
Nassau Health Care Corporation 4,358 273,872,956 4,382 245,651,811
Natural Heritage Trust 63 2,594,973 62 2,509,666 82 2,920,027 69 2,623,035 73 2,690,201
Nelson A. Rockefeller Empire State Plaza Performing Arts Center Operating Corp. 59 503,412 58 492,507 62 514,879 55 563,700 67 581,672
New York Convention Center Operating Corporation 2,725 64,673,591 3,117 64,000,719 3,468 72,401,098 3,580 83,262,577 4,238 93,386,708
New York Job Development Authority 7 - 4 - 4 - 4 -
New York Local Government Assistance Corporation 23 - 24 - 24 - 25 - 24 -
New York State Affordable Housing Corporation 45 3,773,250 44 3,551,891 52 4,006,703 208 4,758,047 214 5,176,315
New York State Bridge Authority 238 11,156,842 252 11,356,679 261 11,605,335 256 11,432,851 257 11,550,248
New York State Energy Research and Development Authority 313 22,874,304 329 23,233,862 337 25,963,409 337 26,761,182 335 28,845,625
New York State Housing Finance Agency 32 3,189,999 30 2,897,876 200 2,844,644 207 2,866,096 246 3,192,973
New York State Olympic Regional Development Authority 1,310 12,632,497 1,647 14,542,307 1,734 18,329,230 1,860 20,139,624 1,771 18,968,417
New York State Thoroughbred Breeding Development Fund 5 337,114 5 346,427 6 402,946 7 439,921 6 448,427
New York State Thruway Authority 4,438 189,246,395 4,434 181,377,154 4,294 182,657,999 4,245 172,744,686 4,303 170,413,305
New York State Urban Development Corporation 284 21,070,373 291 20,924,747 290 20,683,595 317 23,105,723 329 26,183,009
Niagara Frontier Transportation Authority 1,688 83,228,661 1,647 81,813,159 1,694 83,805,127 1,728 85,106,736 1,712 85,749,375
Ogdensburg Bridge and Port Authority 51 1,537,037 120 2,629,338 66 1,756,412 58 1,654,681 76 1,743,123
Port of Oswego Authority 103 1,035,959 115 1,273,502 136 1,503,435 108 1,285,832
Power Authority of the State of New York 1,636 146,267,272 1,642 152,011,758 1,655 150,961,355 1,728 166,369,687 1,782 177,481,232
Rochester-Genesee Regional Transportation Authority 886 40,365,402 905 42,150,561 916 44,276,562 1,005 46,581,650 1,022 46,163,119
Roosevelt Island Operating Corporation 166 6,675,005 170 6,695,983 165 6,692,228 171 7,063,762 188 7,551,564
Roswell Park Cancer Institute Corporation 2,521 177,203,502 2,620 189,983,083 2,614 194,440,539 2,593 201,265,593 2,716 217,261,423
State of New York Mortgage Agency 95 7,243,269 101 7,080,599 200 8,180,675 207 8,981,161 246 11,235,767
State of New York Municipal Bond Bank Agency 200 - 207 - 246 -
Tobacco Settlement Financing Corporation 200 - 207 - 248 -
United Nations Development Corporation 17 1,490,210 14 1,438,677 15 1,600,577 14 1,352,952 12 1,305,120
Utility Debt Securitization Authority (UDSA) 3 - 3 - 3 -
Westchester County Health Care Corporation 3,928 280,192,184 3,272 257,641,285 3,227 275,294,014 3,296 275,095,811 3,306 285,459,346
Total: 102,981 6,935,888,021 103,899 7,004,177,065 106,781 7,674,491,848 107,615 7,698,862,020 108,518 7,926,755,465
Table 15: State Authority Staff (number) and Total Compensation 2012-2016*
*Data Reported as of June 4, 2017, except for Westchester County Health Care Corporation, which is reported as of June 9, 2017. Data shown as - indicates an authority reported $0 in compensation. Fields shaded in
grey represent either the authority reported that it had no staff or the annual report was not submitted. If an authority has never reported staff, they are not included in the table. Additionally, the staff count may include
duplicate staff members as some employees perform work at multiple authorities.

Authorities Budget Office 37
2017 Annual Report on Public Authorities in New York State
Authority Name 2012
Staff
2012 Comp. 2013
Staff
2013 Comp. 2014
Staff
2014 Comp. 2015
Staff
2015 Comp. 2016
Staff
2016 Comp.
Albany Community Development Agency 21 844,082 16 781,551 13 669,017 15 701,877 Albany County Airport Authority 26 1,622,107 28 1,723,551 28 1,681,250 26 1,746,440 30 1,820,953
Albany Municipal Water Finance Authority 1 - 1 - 1 -
Albany Parking Authority 25 938,250 24 870,555 28 908,727 47 1,691,677 47 1,584,852
Albany Port District Commission 45 1,079,410 52 1,384,569 55 1,663,476 50 1,663,253 53 1,591,603
Albany Water Board 137 5,660,838 145 5,897,621 146 5,841,817 148 5,609,104
Amsterdam Urban Renewal Agency 1 9,927 1 10,812 1 10,614 1 10,967 1 11,579
Binghamton Urban Renewal Agency 2 - 2 - 2 - 3 - 2 -
Buffalo Sewer Authority 216 10,820,351 213 10,137,427 202 10,652,703 202 10,059,062 235 10,481,193
Buffalo Urban Renewal Agency 64 2,960,142 47 2,095,959 47 2,095,959 49 2,113,931 50 2,336,214
Buffalo Water Board 102 - 94 - 95 - 87 - 104 -
Cayuga County Water and Sewer Authority 6 121,367 6 121,464 6 109,712 6 190,083 8 205,138
Central New York Regional Market Authority 8 290,312 7 267,882 12 357,833 15 409,425 20 385,839
City of Fulton Community Development Agency 19 479,040 8 298,849 8 277,880 7 280,944
City of Hudson Community Development and Planning Agency1 2 - 2 - 2 - 3 25,000
Clifton Park Water Authority 23 929,127 22 968,367 22 980,220 22 1,007,544 23 1,054,598
Dutchess County Resource Recovery Agency 6 347,184 5 301,185 5 309,899 3 223,491 5 206,854
Dutchess County Water and Wastewater Authority 21 1,281,292 22 1,284,405 21 1,304,053 23 1,467,540 25 1,527,758
Eastern Rensselaer County Solid Waste Management Authority 2 86,783 2 67,283 4 76,416 4 83,219 4 82,723
Elmira Urban Renewal Agency 1 - 4 -
Erie County Water Authority 293 15,827,630 299 15,907,880 296 16,736,892 289 16,841,676 277 16,725,391
Franklin County Solid Waste Management Authority 32 830,470 43 1,118,080 41 1,147,395 40 1,132,075
Freeport Community Development Agency 3 130,200 3 215,370 5 289,121 5 289,121 3 150,733
Genesee Valley Regional Market Authority 7 272,252 7 282,204 7 260,106 8 206,934 7 208,984
Glen Cove Community Development Agency 5 196,962 8 296,192 9 414,823 8 223,601 9 233,205
Glens Falls Urban Renewal Agency 1 4,000 1 4,000 1 4,000 1 4,000 1 4,304
Gloversville Community Development Agency 1 21,235 1 17,305 1 17,243 1 23,493 1 9,795
Greater Rochester Sports Authority 1 - 1 - 1 -
Green Island Power Authority 12 479,765 11 445,943 12 402,727 12 432,522 12 384,194
Huntington Community Development Agency 7 355,538 6 416,348 8 510,851 8 565,424 9 553,099
Incorporated Village of Hempstead Community Development Agency 4 318,307 3 164,158 6 330,928
Islip Resource Recovery Authority 35 1,688,190 34 1,794,443 32 1,782,634 32 1,830,647 32 1,778,268
Ithaca Urban Renewal Agency 4 220,989 3 153,509 4 192,504 4 217,497 5 198,949
Jamestown Urban Renewal Agency 12 553,891 12 553,891 10 502,280 10 510,738
Little Falls Urban Renewal Agency 2 83,486 2 83,486
Livingston County Water and Sewer Authority 12 636,965 12 647,080 14 676,162 12 562,787 10 557,413
Middletown Community Development Agency 3 - 3 - 3 -
Monroe County Airport Authority 110 - 112 - 108 - 111 - 113 -
Monroe County Water Authority 263 14,014,702 252 14,666,697 252 15,617,823 250 15,653,496 252 15,347,009
Mount Vernon Urban Renewal Agency 27 830,261
Nassau County Bridge Authority 81 2,200,383 88 2,157,608 71 2,070,596 65 2,447,529 61 1,854,750
Nassau County Sewer and Storm Water Finance Authority 3 - 3 - 3 - 3 -
New York City Educational Construction Fund 3 344,574 4 469,570 3 350,960
New York City Health and Hospitals Corporation 44,439 2,507,695,575 42,887 2,501,310,632 43,308 2,479,668,129 47,409 2,622,427,198 48,346 2,876,896,521
New York City Housing Development Corporation 167 13,819,859 169 14,451,758 175 15,191,330 175 15,619,749 173 14,969,532
New York City Municipal Water Finance Authority 27 860,569 26 880,087 29 858,629 27 861,545 23 755,274
New York City School Construction Authority 851 63,335,670 854 63,981,557 896 64,095,897 935 72,365,029
New York City Transitional Finance Authority 25 683,004 27 710,213 31 674,239 27 734,340 24 761,045
New York City Water Board 11 - 10 - 10 - 10 - 9 -
Niagara Falls Urban Renewal Agency 2 8,750 3 - 3 - 4 - 4 -
Niagara Falls Water Board 108 4,891,716 91 4,768,419 108 4,955,482 104 5,097,182
North Hempstead Solid Waste Management Authority 17 1,205,530 19 1,305,060 19 1,191,690 22 1,243,947
Nyack Parking Authority 12 256,165 12 256,165 12 256,165
Olean Urban Renewal Agency 4 5,062 4 5,062 4 4,059 4 4,059 4 4,059
Oneida County Sports Facility Authority 4 - 5 - 4 - 3 - 6 -
Oneida-Herkimer Solid Waste Management Authority 84 3,489,700 86 3,644,701 80 3,656,638 84 3,896,430 83 3,861,297
Onondaga County Resource Recovery Agency 73 3,638,304 73 3,638,304 70 3,830,027 78 3,737,420 77 3,737,568
Onondaga County Water Authority 134 8,398,236 137 8,580,687 141 9,165,367 146 9,505,707 143 9,522,690
Orange County Water Authority 2 53,077 2 55,733 2 55,733 2 57,189 2 59,046
Port Jervis Community Development Agency 5 146,655 4 150,358 5 136,650
Rensselaer County Water and Sewer Authority 3 - 3 - 3 - 3 - 3 -
Rockland County Solid Waste Management Authority 31 2,390,131 32 2,227,622 32 2,221,695 30 2,257,553 35 2,404,314
Saratoga County Water Authority 10 477,383 11 488,474 13 506,245 8 356,767 11 330,769
Saratoga Springs City Center Authority 23 608,298 26 629,474 26 672,509 22 668,174
Table 16: Local (Other) Authority Staff (number) and Total Compensation 2012-2016*

Authorities Budget Office 38
2017 Annual Report on Public Authorities in New York State
Authority Name 2012
Staff
2012 Comp. 2013
Staff
2013 Comp. 2014
Staff
2014 Comp. 2015
Staff
2015 Comp. 2016
Staff
2016 Comp.
Schenectady Metroplex Development Authority 5 438,000 6 452,565 6 452,565 5 481,145 5 535,490
Schenectady Urban Renewal Agency 1 - 2 - 2 - 2 -
Suffolk County Water Authority 591 40,544,370 596 42,430,374 605 42,293,383 598 41,827,365 600 41,537,934
Syracuse Regional Airport Authority 3 - 4 - 10 394,668 12 488,683 15 785,127
Syracuse Urban Renewal Agency 86 3,703,352
Town of Erwin Urban Renewal Agency 5 286,971 5 290,315 5 212,086 3 203,533 3 150,063
Town of Islip Community Development Agency 13 940,298 13 912,103 15 955,940 13 845,650 15 904,012
Town of North Hempstead Community Development Agency 3 277,058 3 282,578 3 289,612 3 298,254 3 307,167
Town of Riverhead Community Development Agency 4 415,170 4 415,170
Trust for Cultural Resources of the County of Onondaga 5 - 5 - 5 - 4 - 5 -
Ulster County Resource Recovery Agency 41 1,586,690 47 1,555,050 43 1,560,559 37 1,676,141 36 1,621,593
Upper Mohawk Valley Regional Water Board2 99 4,613,919 99 4,774,427 190 9,367,997 106 4,983,419 94 4,753,978
Upper Mohawk Valley Regional Water Finance Authority 3 -
Utica Urban Renewal Agency 7 124,017 6 146,607 5 145,625 5 145,625 10 139,859
Victor Urban Renewal Agency 1 - 1 - 1 - 1 - 1 -
Village of Elmira Heights Urban Renewal Agency 1 72,187 1 27,540 1 27,540 1 27,540
Village of Fairport Urban Renewal Agency 7 340,231 6 344,576 6 349,843 7 388,832 7 357,760
Village of Patchogue Community Development Agency 5 168,915 5 172,102 5 123,247 5 125,182 4 112,545
Village of Rockville Centre Community Development Agency 1 30,000 1 30,000 1 30,000
Water Authority of Great Neck North 25 1,889,884 27 1,892,745 27 1,886,001 25 1,943,612 25 2,190,590
Water Authority of Western Nassau County 57 3,957,340 57 3,957,340 56 4,054,327 54 4,240,590 57 4,015,508
Wayne County Water and Sewer Authority 31 1,079,107 32 1,090,332 31 1,150,302 35 1,354,980 44 1,605,626
White Plains Urban Renewal Agency 3 - 3 - 3 -
Wilton Water and Sewer Authority 5 184,568 5 184,568 5 184,568 5 208,750
Yonkers Community Development Agency 7 - 7 - 6 - 8 - 8 -
Yonkers Parking Authority 37 2,635,108 37 2,836,307 42 3,242,658 40 2,928,973
Total: 48,682 2,740,556,047 47,055 2,733,850,522 47,637 2,722,098,695 51,644 2,869,798,389 51,306 3,032,859,928
1 City of Hudson Community Development and Planning Agency changed their FYE Date for the 2014 reporting period. 2014 data is for 15 months.2 Upper Mohawk Valley Regional Water Board changed their FYE Date for the 2014 reporting period. 2014 data is for 21 months.
*Data Reported as of June 4, 2017. Data shown as - indicates an authority reported $0 in compensation. Fields shaded in grey represent either the authority reported that it had no staff or the annual
report was not submitted. If an authority has never reported staff, they are not included in the table. Additionally, the staff count may include duplicate staff members as some employees perform work
at multiple authorities.

Authorities Budget Office 39
2017 Annual Report on Public Authorities in New York State
Authority Name 2012
Staff
2012 Comp. 2013
Staff
2013 Comp. 2014
Staff
2014 Comp. 2015
Staff
2015 Comp. 2016
Staff
2016 Comp.
Albany City IDA 9 - 10 - 2 - 2 -
Albany County IDA 3 24,759 3 14,759 3 14,759 3 50,000 3 50,000
Allegany IDA 2 15,000 2 9,167 1 - 1 - 2 -
Amherst IDA 4 388,721 4 389,037 4 400,418 4 400,418 4 413,273
Amsterdam IDA 2 80,300 2 88,306 2 80,300 2 96,355 2 102,206
Auburn IDA 2 - 3 5,859 3 - 3 - 2 -
Babylon IDA 4 293,654 5 373,365 4 386,058 5 386,557 6 451,731
Bethlehem IDA 1 31,681 2 46,682 2 46,682 2 47,616 2 47,616
Brookhaven IDA 5 249,033 5 175,453 4 202,400 5 235,398 6 271,758
Broome IDA 6 409,989 6 394,252 4 323,846 5 355,000 5 420,580
Cattaraugus IDA 2 115,500 2 131,255 2 135,280 2 132,850 2 137,200
Cayuga IDA 2 - 3 669 3 - 3 - 2 -
Chautauqua IDA 8 317,742 7 312,398 7 334,200 10 444,374 14 517,629
Chemung IDA 5 - 5 - 4 - 4 - 4 -
Chenango IDA 4 - 5 - 5 - 6 - 4 -
City of Rensselaer IDA 2 -
City of Schenectady IDA 5 - 2 - 2 - 2 - 2 -
City of Utica IDA 1 - 1 - 1 - 1 - 1 -
Clarence IDA 2 6,100 2 5,850 2 6,028 4 10,622 4 10,924
Clinton County IDA 3 - 3 - 3 - 5 - 4 -
Cohoes IDA 2 - 2 14,500 2 - 2 - 2 -
Colonie IDA 4 - 4 - 5 - 4 -
Columbia IDA 5 - 7 - 7 - 6 - 7 -
Concord IDA 1 500 1 500 1 500 1 500
Cortland IDA 3 - 3 - 3 - 3 - 3 -
Delaware County IDA 4 - 1 10,000 1 10,000
Dutchess County IDA 3 - 2 - 2 - 2 -
Erie County IDA 19 1,219,430 17 1,280,748 18 1,297,780 18 1,365,093 19 1,401,927
Essex County IDA 3 147,063 3 141,564 3 147,060 3 147,060 3 157,463
Fairport IDA 3 - 3 - 3 - 3 - 3 -
Franklin County IDA 2 131,500 3 125,354 2 116,051 2 122,948
Fulton County IDA 1 18,000 1 18,000 1 18,900 1 19,467 1 19,856
Genesee County IDA 12 772,360 11 606,636 11 602,772 10 614,086 9 612,666
Geneva IDA 2 - 2 -
Glen Cove IDA 5 92,766 5 110,481 6 124,849 4 88,566 7 90,471
Green Island IDA 6 75,692 7 69,032 8 52,838 7 45,433 7 42,286
Greene County IDA 3 175,888 3 179,907 3 184,527 3 191,812 3 195,649
Guilderland IDA 2 2,575 2 2,350 2 2,350 2 2,500 2 2,500
Hamburg IDA 2 90,050 2 90,050 2 83,077 2 103,428 2 134,345
Hamilton County IDA 2 - 2 - 2 - 1 -
Hempstead IDA 5 490,097 5 498,153 5 521,322 5 533,900 6 559,397
Herkimer IDA 4 195,099 4 200,364 3 148,296 5 152,479 2 113,799
Hornell IDA1 2 43,316 2 43,316 4 149,603 3 56,241 2 47,500
Islip IDA 4 109,100
Jefferson IDA 12 527,535 12 487,503
Lancaster IDA 2 9,293 2 11,419 2 11,423 2 11,358 2 18,702
Lewis County IDA 2 57,995 4 127,752 4 127,752 1 20,286 2 36,621
Livingston County IDA 6 - 3 - 3 - 4 - 4 -
Madison County IDA 3 128,848 3 128,848 3 132,713 3 136,696 3 145,021
Mechanicville-Stillwater IDA 4 - 7 2,450 7 2,450 7 2,450
Middletown IDA 3 - 3 - 3 - 3 - 3 -
Monroe IDA 5 212,746 8 275,898 7 263,266 8 246,739 11 248,604
Montgomery County IDA 4 25,115 3 25,500 3 23,000 4 26,000 4 26,807
Mount Pleasant IDA 1 - 1 - 1 - 2 -
Mount Vernon IDA 4 45,621 1 41,270 1 86,000 1 86,000
Nassau County IDA 5 498,928 5 503,928 4 494,692 5 515,923 5 572,855
New Rochelle IDA 3 - 4 - 4 - 4 - 3 -
New York City IDA 29 -
Newburgh IDA 4 44,763 3 39,186 3 29,911 3 29,911
Niagara County IDA 9 461,537 11 446,223 10 457,238 9 401,267 9 411,944
Oneida County IDA 4 - 4 - 4 -
Onondaga County IDA 4 - 4 - 4 - 4 - 5 -
Ontario County IDA 5 43,345 5 38,104 5 52,025 5 47,854 5 56,126
Orange County IDA 8 220,194 5 128,482 5 170,439 4 213,893 6 277,935
Orleans County IDA 3 166,848 3 181,269 3 184,729 3 212,494 3 209,928
Otsego County IDA 1 - 1 - 2 78,605 4 122,976 3 138,106
Peekskill IDA 4 14,350 5 14,350 4 15,200 4 12,724 4 15,200
Port Chester IDA 4 26,400 2 7,400 3 8,450
Port Jervis IDA 1 - 1 - 2 - 1 - 1 -
Poughkeepsie IDA 6 - 6 - 5 - 7 -
Table 17: Industrial Development Agency (IDA) Staff (number) and Total Compensation 2012-2016*
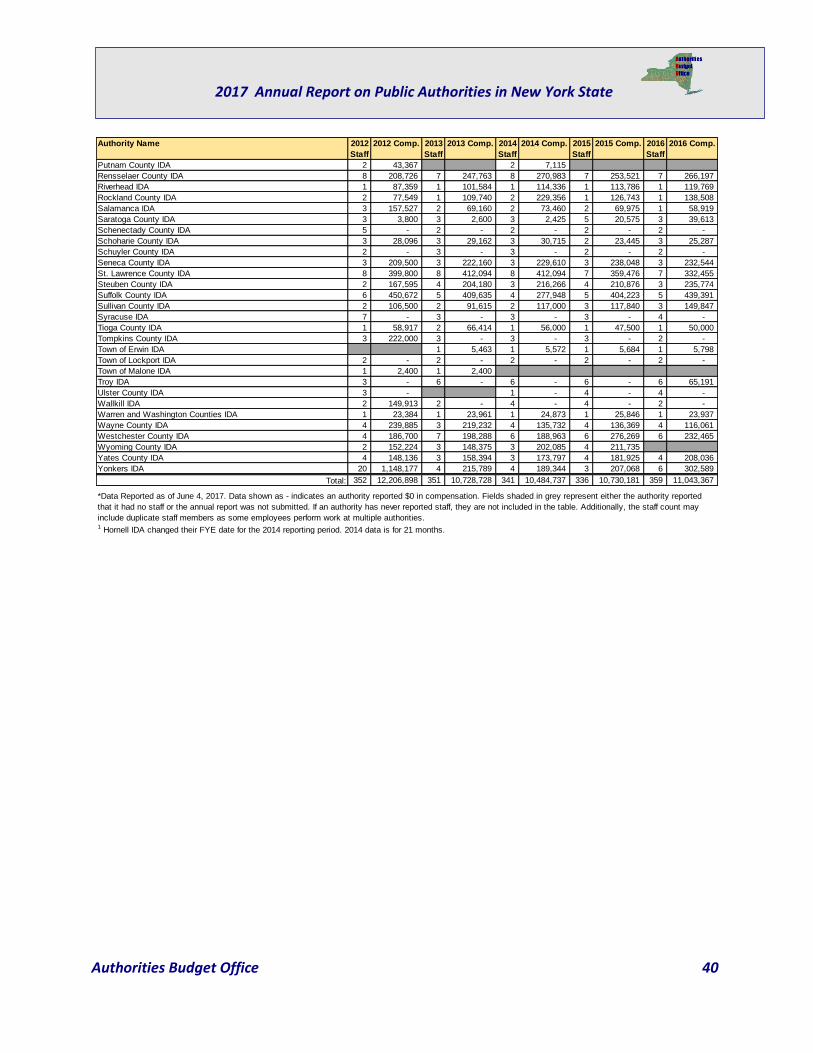
Authorities Budget Office 40
2017 Annual Report on Public Authorities in New York State
Authority Name 2012
Staff
2012 Comp. 2013
Staff
2013 Comp. 2014
Staff
2014 Comp. 2015
Staff
2015 Comp. 2016
Staff
2016 Comp.
Putnam County IDA 2 43,367 2 7,115
Rensselaer County IDA 8 208,726 7 247,763 8 270,983 7 253,521 7 266,197
Riverhead IDA 1 87,359 1 101,584 1 114,336 1 113,786 1 119,769
Rockland County IDA 2 77,549 1 109,740 2 229,356 1 126,743 1 138,508
Salamanca IDA 3 157,527 2 69,160 2 73,460 2 69,975 1 58,919
Saratoga County IDA 3 3,800 3 2,600 3 2,425 5 20,575 3 39,613
Schenectady County IDA 5 - 2 - 2 - 2 - 2 -
Schoharie County IDA 3 28,096 3 29,162 3 30,715 2 23,445 3 25,287
Schuyler County IDA 2 - 3 - 3 - 2 - 2 -
Seneca County IDA 3 209,500 3 222,160 3 229,610 3 238,048 3 232,544
St. Lawrence County IDA 8 399,800 8 412,094 8 412,094 7 359,476 7 332,455
Steuben County IDA 2 167,595 4 204,180 3 216,266 4 210,876 3 235,774
Suffolk County IDA 6 450,672 5 409,635 4 277,948 5 404,223 5 439,391
Sullivan County IDA 2 106,500 2 91,615 2 117,000 3 117,840 3 149,847
Syracuse IDA 7 - 3 - 3 - 3 - 4 -
Tioga County IDA 1 58,917 2 66,414 1 56,000 1 47,500 1 50,000
Tompkins County IDA 3 222,000 3 - 3 - 3 - 2 -
Town of Erwin IDA 1 5,463 1 5,572 1 5,684 1 5,798
Town of Lockport IDA 2 - 2 - 2 - 2 - 2 -
Town of Malone IDA 1 2,400 1 2,400
Troy IDA 3 - 6 - 6 - 6 - 6 65,191
Ulster County IDA 3 - 1 - 4 - 4 -
Wallkill IDA 2 149,913 2 - 4 - 4 - 2 -
Warren and Washington Counties IDA 1 23,384 1 23,961 1 24,873 1 25,846 1 23,937
Wayne County IDA 4 239,885 3 219,232 4 135,732 4 136,369 4 116,061
Westchester County IDA 4 186,700 7 198,288 6 188,963 6 276,269 6 232,465
Wyoming County IDA 2 152,224 3 148,375 3 202,085 4 211,735
Yates County IDA 4 148,136 3 158,394 3 173,797 4 181,925 4 208,036
Yonkers IDA 20 1,148,177 4 215,789 4 189,344 3 207,068 6 302,589
Total: 352 12,206,898 351 10,728,728 341 10,484,737 336 10,730,181 359 11,043,367
1 Hornell IDA changed their FYE date for the 2014 reporting period. 2014 data is for 21 months.
*Data Reported as of June 4, 2017. Data shown as - indicates an authority reported $0 in compensation. Fields shaded in grey represent either the authority reported
that it had no staff or the annual report was not submitted. If an authority has never reported staff, they are not included in the table. Additionally, the staff count may
include duplicate staff members as some employees perform work at multiple authorities.

Authorities Budget Office 41
2017 Annual Report on Public Authorities in New York State
Authority Name 2012
Staff
2012 Comp. 2013
Staff
2013 Comp. 2014
Staff
2014 Comp. 2015
Staff
2015 Comp. 2016
Staff
2016 Comp.
Albany County Capital Resource Corporation 1 4,800 1 4,800
Albany County Land Bank Corporation 3 110,192 4 149,040
Auburn Local Development Corporation 3 - 2 - 3 - 5 - 2 -
Batavia Development Corporation 1 40,851 1 60,000 1 60,000 1 60,000 1 60,000
Bethel Local Development Corporation 1 3,306 1 3,025
Binghamton Local Development Corporation 4 - 4 - 3 - 5 146,708 3 165,417
Bronx Overall Economic Development Corporation 21 1,175,511 13 796,240 10 705,273
Brooklyn Bridge Park Corporation 21 1,152,982 36 1,967,533 47 2,177,273 67 2,618,593 77 3,393,101
Brooklyn Navy Yard Development Corporation 189 10,855,173 208 9,495,266
Broome County Land Bank 1 - 1 55,000 1 35,493 1 35,493
Buffalo Erie Niagara Land Improvement Corporation 2 103,182 2 111,830 3 146,571
Buffalo Urban Development Corporation 2 213,786 3 259,729 3 284,797 3 331,816 3 320,621
Buffalo and Erie County Industrial Land Development Corporation 8 - 4 - 3 - 4 - 3 -
Buffalo and Erie County Regional Development Corporation 13 - 12 - 11 - 12 - 14 -
Build NYC Resource Corporation 27 -
Business Development Corporation for a Greater Massena 2 17,380 2 17,380 2 52,600 2 52,600
Capitalize Albany Corporation 10 397,715 9 509,710 10 516,131 9 586,808 10 611,017
Carthage Industrial Development Corporation 1 8,190 1 3,300
Catskill Watershed Corporation 19 898,031 18 882,156 18 901,436 19 918,773 18 1,006,602
Cayuga County Development Corporation 2 - 2 - 2 - 2 - 3 1
Chadwick Bay Regional Development Corporation 2 4,800
Chautauqua County Land Bank Corporation 2 42,173 3 119,740 3 119,836
Cheektowaga Economic Development Corporation 1 - 1 12,000
Chemung County Capital Resource Corporation 5 - 5 - 4 - 4 - 4 -
City of Albany Capital Resource Corporation 10 - 2 - 2 -
City of Kingston Local Development Corporation 2 26,379 3 28,292 4 55,792 2 29,258 2 29,258
City of Peekskill Local Development Corporation 4 - 4 - 4 - 4 - 4 -
City of Troy Capital Resource Corporation 5 - 5 - 6 -
City of Watertown Local Development Corporation 2 128,970 2 14,361 2 - 2 131,759 2 133,141
City of Watervliet Local Development Corporation 2 5,250 1 3,000
Clinton County Capital Resource Corporation 3 - 3 - 3 - 5 - 4 -
Cohoes Local Development Corporation 3 8,400 2 - 3 9,519 4 29,870
Columbia County Capital Resource Corporation 5 - 7 - 7 - 6 - 7 -
Columbia Economic Development Corporation 7 270,004 7 275,502 7 282,993 6 296,453 7 292,819
Cornell Agriculture and Food Technology Park Corporation 1 60,000 1 60,000 1 60,000 2 100,000 4 170,000
Cortland County Business Development Corporation 3 219,018 3 229,787 3 219,903 3 226,752 3 241,508
Cortland County Development Corporation 3 - 3 -
Development Chenango Corporation 5 - 5 - 6 - 4 -
Dobbs Ferry Local Development Corporation 2 - 2 - 2 - 2 - 3 -
Dunkirk Local Development Corporation 1 10,000 1 10,000 1 10,000
Dutchess County Local Development Corporation 3 - 2 - 2 - 5 88,993 5 296,111
East of Hudson Watershed Corporation 2 132,700 6 261,478 7 345,390 6 280,887 5 341,871
Economic Development Corporation - Warren County 6 209,422 4 292,426 5 313,386 7 316,031
Energy Improvement Corporation 15 241,945 15 369,777 14 427,347 17 581,084 19 642,718
Fairport Local Development Corporation 2 -
Finger Lakes Horizon Economic Development Corporation 2 - 2 - 1 - 3 - 3 -
Finger Lakes Regional Land Bank Corporation 4 -
Finger Lakes Regional Telecommunications Development Corporation 1 -
Fulton County Center for Regional Growth, Inc. 5 160,163 4 144,520
Genesee County Funding Corporation 8 - 8 - 8 - 8 - 7 -
Genesee Gateway Local Development Corporation 12 - 10 - 10 - 10 - 9 -
Geneva Local Development Corporation 2 -
Golden Hill Local Development Corporation 2 - 2 - 2 - 2 - 2 -
Governors Island Corporation 19 1,469,479 20 1,793,801 20 1,793,801 19 1,564,110 19 1,564,110
Greater Lockport Development Corporation 1 - 2 46,731
Greater Rochester Outdoor Sports Facility Corporation 2 - 2 - 2 - 3 - 3 -
Greater Syracuse Property Development Corporation 1 30,459 3 156,478 5 247,737 6 357,089
Griffiss Local Development Corporation 11 392,964 14 373,627 14 404,599 14 447,722 15 476,992
Griffiss Utility Services Corporation 6 526,277 6 557,599 6 530,005 7 632,075
Hornell Area Industrial Development Corporation 2 - 2 - 2 -
Hudson Development Corporation1 2 50,100 2 38,226 3 63,226 3 63,226 3 63,226
Hudson Valley AgriBusiness Development Corp 2 176,013 2 200,446 3 244,754 4 238,668
Hudson Yards Development Corporation 9 1,184,787 7 856,178 8 698,080 4 224,323 3 200,323
Hudson Yards Infrastructure Corporation 16 194,833 18 131,969 16 115,050 18 166,739 15 166,011
Jefferson County Local Development Corporation 9 8,683 11 473,626 8 468,026 7 484,041
Lake City Local Development Corporation 3 -
Land Reutilization Corporation of The Capital Region 1 - 1 - 2 - 1 - 3 -
Livingston County Capital Resource Corporation 6 - 3 - 3 - 4 - 4 -
Livingston County Development Corporation 1 45,887 4 47,143 4 48,000 5 48,000 5 48,000
Table 18: Local Development Corporation Staff (number) and Total Compensation 2012-2016, excluding Tobacco Asset Securitization Corporations*

Authorities Budget Office 42
2017 Annual Report on Public Authorities in New York State
Authority Name 2012
Staff
2012 Comp. 2013
Staff
2013 Comp. 2014
Staff
2014 Comp. 2015
Staff
2015 Comp. 2016
Staff
2016 Comp.
Local Development Corporation of the Town of Union 2 94,798 2 93,441 6 275,507
Long Beach Local Development Corporation 2 - 2 - 2 -
Lumber City Development Corporation 3 101,219 3 74,106 2 82,000 2 82,000
MUNIPRO, Inc. 3 - 3 - 4 -
Madison County Capital Resource Corporation 3 - 3 -
Maplewood Manor Local Development Corporation 3 - 3 - 3 - 3 -
Monroe County Industrial Development Corporation 6 - 6 - 6 - 7 - 8 -
Montgomery County Capital Resource Corporation 3 - 4 - 4 -
Municipal Electric and Gas Alliance, Inc 3 57,804
NFC Development Corporation 7 - 7 - 8 - 7 -
NYC Technology Development Corporation 11 508,040 19 1,901,668 23 2,795,823 25 3,143,243
New Rochelle Corporation for Local Development 4 - 3 -
New York City Business Assistance Corporation 1 15,000 25 146,797 13 135,237 2 32,394
New York City Economic Development Corporation 397 29,340,483 398 30,094,841 404 30,797,958 451 32,949,954 463 34,928,667
New York City Energy Efficiency Corporation 7 828,000 10 1,244,672 11 1,503,114 11 1,549,326 12 1,664,632
New York City Land Development Corporation 5 -
Newburgh Community Land Bank 2 32,326 6 186,085 6 281,253
Niagara Area Development Corporation 2 - 2 - 2 -
Niagara County Brownfields Development Corporation 1 - 1 - 1 - 1 - 1 -
Niagara County Development Corporation 2 - 2 -
Niagara Power Coalition 3 - 3 - 1 9,053 1 9,053 1 9,053
Olean Local Development Corporation 2 - 2 - 2 - 2 -
Onondaga Civic Development Corporation 5 - 4 - 5 -
Onondaga Convention Center Hotel Development Corporation 1 -
Ontario County Economic Development Corporation 5 42,954 5 31,996 5 40,008 5 39,217
Ontario County Four Seasons Development Corporation 7 282,419 6 309,262 9 317,626 14 352,847 12 414,344
Ontario County Local Development Corporation 5 5,618 5 8,025 5 2,595 5 1,660 5 -
Operation Oswego County 6 409,850
Orange County Funding Corporation 3 1,450
Otsego County Capital Resource Corporation 2 -
Peekskill Facilities Development Corporation 4 - 4 - 4 - 4 - 4 -
Port Chester Local Development Corporation 2 - 3 - 3 -
Putnam County Economic Development Corporation 2 84,951 4 66,865 2 94,014 4 32,075 3 106,948
Queens Economic Development Corporation 6 372,661 6 389,750 9 532,100 8 499,202 8 532,500
Ramapo Local Development Corporation 3 149,577 4 153,245 3 158,759
Rochester Economic Development Corporation 5 49,093 5 55,338 5 52,718 5 57,877 4 -
Rochester Land Bank Corporation 4 80,939 5 95,234 4 127,967
Rockland County Economic Assistance Corporation 1 - 1 - 1 -
Rockland County Health Facilities Corporation 1 - 1 -
Rockland Economic Development Corporation 7 355,070 5 464,391 7 418,378 7 411,173 5 364,180
STAR (Sales Tax Asset Receivable) Corporation 14 75,502 17 91,825 16 111,131 17 146,211 14 59,435
Sackets Harbor Local Development Corporation 6 6,875 6 6,875 6 6,875 2 2,075 6 6,875
Saratoga County Capital Resource Corporation 2 - 1 - 1 -
Saratoga County Prosperity Partnership, Inc 4 123,717 4 203,249
Schenectady County Capital Resource Corporation 2 - 2 - 2 - 2 -
Seneca Falls Development Corporation 1 3,000 1 3,000
Sherburne Area Local Development Corporation 2 - 2 -
Sleepy Hollow Local Development Corporation 3 - 3 1,500
Southern Tier Network, Inc. 4 -
Southold Local Development Corporation 2 - 2 - 2 168
St. Lawrence County IDA Civic Development Corporation 8 - 8 - 8 - 2 - 2 -
St. Lawrence County DA Local Development Corporation 8 56,885 8 85,000 8 86,488 3 86,488 4 126,275
Suffolk County Economic Development Corporation 2 - 2 - 2 - 2 -
Sullivan County Funding Corporation 3 - 3 - 3 -
Syracuse Economic Development Corporation 8 - 4 - 4 - 3 -
Syracuse Local Development Corporation 3 - 3 -
The Mayor’s Fund to Advance New York City 32 1,526,777
The Suffolk County Land Bank Corporation 4 - 3 - 4 - 4 -
The Town of Huntington Economic Development Corporation 5 - 2 - 1 - 1 - 1 -
Ticonderoga Revitalization Alliance 1 11,200 3 - 2 -
Tioga County Local Development Corporation 3 83,818 3 83,818 3 84,784 3 88,041 2 70,313
Town of Babylon L. D. Corporation II 5 47,000 5 47,000
Town of Brookhaven Local Development Corporation 6 - 5 - 5 - 3 -
Town of Colonie Local Development Corporation 4 - 4 - 5 - 4 -
Town of Hempstead Local Development Corp. 3 - 3 - 3 3,762 3 2,760 3 2,760
Town of Huntington Local Development Corporation 2 - 2 - 2 - 2 - 2 -
Town of North Hempstead Business and Tourism Development Corp. 1 68,500 2 118,866 2 145,553 2 155,953 2 152,407
Town of Plattsburgh Local Development Corporation 2 - 2 - 2 - 2 -
Troy Community Land Bank Corporation 1 -
Troy Local Development Corporation 6 - 6 - 4 5,766
Ulster County Capital Resource Corporation 2 - 1 - 4 - 4 -
Ulster County Economic Development Alliance, Inc. 6 256,439 2 - 3 - 4 -
Utica Harbor Point Local Development Corporation 2 -
Victor Local Development Corporation 3 47,239 3 47,239 4 -

Authorities Budget Office 43
2017 Annual Report on Public Authorities in New York State
Bonus Payments
New York State law does not expressly prohibit bonus payments to employees of state and local
authorities. Compensation for extraordinary performance above the normal job duties of a position is
permissible provided the bonus program is consistent with the guidance provided in State Comptroller
Opinion #2000-9. This opinion states that specific performance criteria must be established and disclosed
prior to the start of the performance evaluation period and before the performance of such activities.
Further, there must be a formal performance evaluation process at the end of the rating period to assess
whether the specific compensation standards were met and if the employee is eligible for the specified
additional compensation.
There were 22 public authorities that reported having a bonus program in 2016, and indicated 2,407 staff
received bonus payments. Of these, 181 received bonuses of $10,000 or more.
Authority Name 2012
Staff
2012 Comp. 2013
Staff
2013 Comp. 2014
Staff
2014 Comp. 2015
Staff
2015 Comp. 2016
Staff
2016 Comp.
Warren County Local Development Corporation 8 - 9 - 7 - 7 - 7 -
Washington County Local Development Corporation 3 109,505 2 78,260 1 44,677 1 47,893 2 60,436
Watertown Industrial Center Local Development Corporation 3 21,201 3 107,149 2 89,314 2 92,087
Wayne County Civic Facility Development Corporation 3 -
Wayne Economic Development Corporation 3 - 3 - 3 -
Wayne Industrial Sustainability Development Corporation 3 -
West Brighton Community Local Development Corporation 4 135,320 5 149,956 3 124,950 2 74,838 2 110,000
Westchester County Local Development Corporation 2 - 2 - 6 33,347 6 69,065 6 58,116
Wyandanch Community Development Corporation 5 184,900 5 187,882 5 185,966 4 193,068 6 219,119
Wyoming County Business Center 2 92,877 4 17,931 3 -
Yates County Capital Resource Corporation 2 - 2 - 2 - 3 - 3 -
Yonkers Downtown Waterfront Development Corporation 1 15,438 1 20,000
Yonkers Economic Development Corporation 2 62,882 1 83,311 1 84,615
Total: 815 39,800,597 936 44,803,829 1,208 59,432,036 1,294 62,398,695 1,158 57,600,068
1 Hudson Development Corporation changed their FYE date for the 2014 reporting period. 2014 data is for 15 months.
*Data Reported as of June 4, 2017. Data shown as - indicates an authority reported $0 in compensation. Fields shaded in grey represent either the authority reported that it had
no staff or the annual report was not submitted. If an authority has never reported staff, they are not included in the table. Additionally, the staff count may include duplicate staff
members as some employees perform work at multiple authorities.

Authorities Budget Office 44
2017 Annual Report on Public Authorities in New York State
Description Authority Name Title Employee
Total Comp.
($)
Bonus
Amount
($)
State Capital District Transportation Authority MASTER TECHNICIAN MECH CDTS1 80,831 36,698
FOREMAN GRADE 11 63,077 35,990
SUPERV FLEX SVCS GRADE 11 SYS1 27,735 22,347
BUS OPERATOR F/T ALB/TR CDTS#1 76,321 22,045
BUS OPERATOR F/T ALB/TR CDTS#1 22,170 20,970
SUPERV/DISPATCHR GRADE 11 SYS1 66,316 20,339
BUS OPERATOR F/T CDTS (SCHEN) 24,984 19,476
FOREMAN GRADE 11 84,102 16,904
BUS OPERATOR F/T ALB/TR CDTS#1 64,206 16,618
BUS OPERATOR F/T ALB/TR CDTS#1 16,908 16,108
FOREMAN GRADE 11 68,556 16,048
DIRECTOR OF TRANSPORTATION 61,096 15,904
SERV TECHNICIAN SCH-PRE 6/99 18,555 14,677
FOREMAN GRADE 11 69,114 14,354
MASTER TECHNICIAN MECH CDTS1 15,111 14,197
BUS OPERATOR F/T ALB/TR CDTS#1 73,600 13,897
TECHNICIAN CDTS1 42,117 13,694
TECHNICIAN CDTS1 14,590 13,686
BUS OPERATOR F/T ALB/TR CDTS#1 64,009 13,552
SUPERV/DISPATCHR GRADE 11 SYS1 68,028 12,801
BUS OPERATOR F/T ALB/TR CDTS#1 51,711 12,658
BUS OPERATOR F/T ALB/TR CDTS#1 61,853 12,353
BUS OPERATOR F/T CDTS (SCHEN) 64,094 12,316
FOREMAN GRADE 11 78,385 12,308
BUS OPERATOR F/T ALB/TR CDTS#1 74,445 12,232
SENIOR DEPUTY COMPTROLLER 71,646 12,210
SUPERV/DISPATCHR GRADE 11 SYS1 68,839 12,187
MASTER TECHNICIAN MECH CDTS1 57,746 12,135
SUPERV/DISPATCHR GRADE 11 SYS1 68,657 11,949
BUS OPERATOR F/T ALB/TR CDTS#1 70,957 11,892
FOREMAN GRADE 11 88,231 11,882
BUS OPERATOR F/T CDTS (SCHEN) 59,957 11,717
MAINT TRAINER GRADE 12 65,894 11,485
BUS OPERATOR F/T ALB/TR CDTS#1 58,668 11,482
SUPERV/DISPATCHR GRADE 11 SYS1 138,124 11,440
MAINT TRAINER GRADE 12 91,596 11,436
BUS OPERATOR F/T ALB/TR CDTS#1 15,258 11,423
BUS OPERATOR F/T ALB/TR CDTS#1 61,287 10,934
MASTER TECHNICIAN MECH CDTS1 48,035 10,876
FOREMAN GRADE 11 68,212 10,736
BUS OPERATOR F/T ALB/TR CDTS#1 56,132 10,720
FOREMAN GRADE 11 86,894 10,673
BUS OPERATOR F/T CDTS (SCHEN) 61,498 10,552
BUS OPERATOR F/T CDTS (SCHEN) 68,568 10,527
BUS OPERATOR F/T ALB/TR CDTS#1 48,702 10,467
BUS OPERATOR F/T CDTS (SCHEN) 63,135 10,432
ADMIN ASS'T-C-4 - 80HRS 41,424 10,430
BUS OPERATOR F/T ALB/TR CDTS#1 53,941 10,345
BUS OPERATOR F/T ALB/TR CDTS#1 37,006 10,232
SUPERV/DISPATCHR GRADE 11 SYS1 68,428 10,226
SUPERINTENDENT 52,740 10,172
BUS OPERATOR F/T ALB/TR CDTS#1 35,500 10,171
SUPERV/DISPATCHR GRADE 11 SYS1 81,395 10,149
SUPERV/DISPATCHR GRADE 11 SYS1 58,986 10,147
SUPERV/DISPATCHR GRADE 11 SYS1 59,461 10,099
BUS OPERATOR F/T ALB/TR CDTS#1 64,176 10,004
Erie County Medical Center Corporation Anesthesiologist ECMC MC 538,956 49,100
Anesthesiologist ECMC MC 482,120 46,600
Anesthesiologist ECMC MC 498,920 46,600
Anesthesiologist ECMC MC 482,463 46,600
Anesthesiologist ECMC MC 482,120 46,600
Anesthesiologist ECMC MC 482,111 46,600
Anesthesiologist ECMC MC 490,512 46,600
Clinical Director RPT 165,409 35,000
Attending Physician 347,509 26,625
Anesthesiologist RPT MC 265,541 23,479
Anesthesiologist RPT MC 299,946 23,300
Attending Physician 398,973 19,133
Attending Physician 567,068 17,708
Attending Physician Con PT 356,876 17,501
Clinical Director Medicine 279,919 15,400
Clinical Director RPT 320,576 12,500
Table 19: Authority Staff Receiving Bonus Payments >= $10,000 in FYE 2016
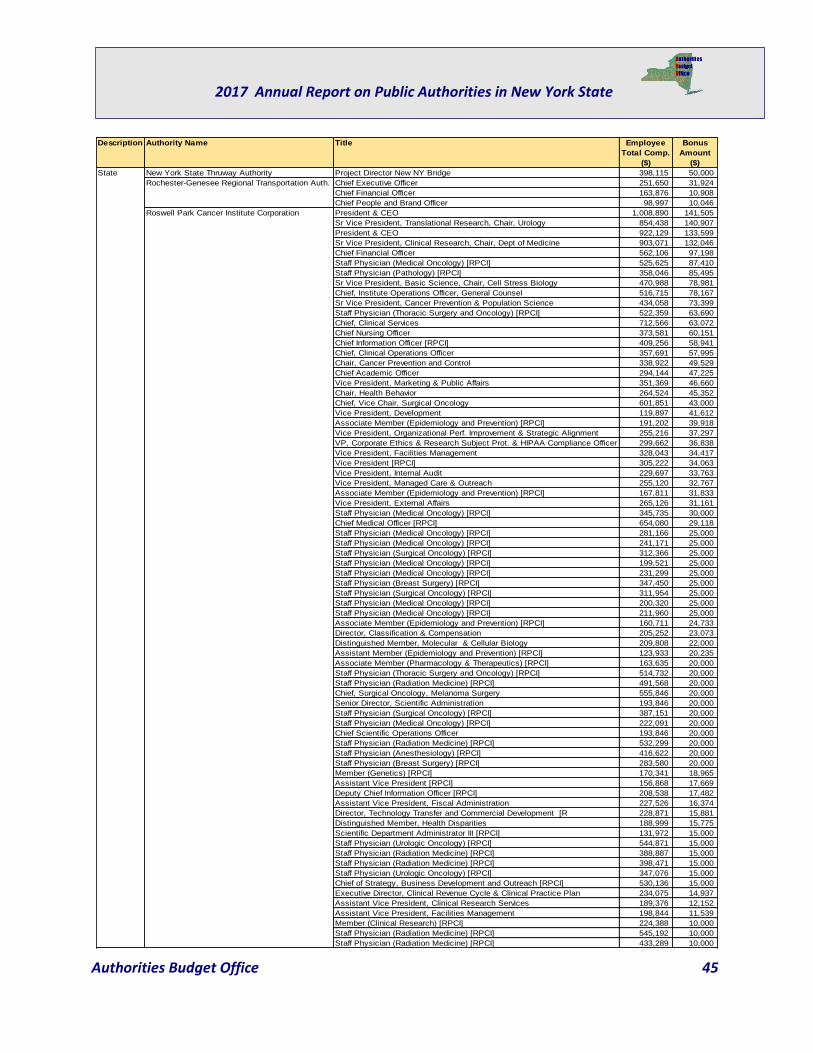
Authorities Budget Office 45
2017 Annual Report on Public Authorities in New York State
Description Authority Name Title Employee
Total Comp.
($)
Bonus
Amount
($)
State New York State Thruway Authority Project Director New NY Bridge 398,115 50,000
Rochester-Genesee Regional Transportation Auth. Chief Executive Officer 251,650 31,924
Chief Financial Officer 163,876 10,908
Chief People and Brand Officer 98,997 10,046
Roswell Park Cancer Institute Corporation President & CEO 1,008,890 141,505
Sr Vice President, Translational Research, Chair, Urology 854,438 140,907
President & CEO 922,129 133,599
Sr Vice President, Clinical Research, Chair, Dept of Medicine 903,071 132,046
Chief Financial Officer 562,106 97,198
Staff Physician (Medical Oncology) [RPCI] 525,625 87,410
Staff Physician (Pathology) [RPCI] 358,046 85,495
Sr Vice President, Basic Science, Chair, Cell Stress Biology 470,988 78,981
Chief, Institute Operations Officer, General Counsel 516,715 78,167
Sr Vice President, Cancer Prevention & Population Science 434,058 73,399
Staff Physician (Thoracic Surgery and Oncology) [RPCI] 522,359 63,690
Chief, Clinical Services 712,566 63,072
Chief Nursing Officer 373,581 60,151
Chief Information Officer [RPCI] 409,256 58,941
Chief, Clinical Operations Officer 357,691 57,995
Chair, Cancer Prevention and Control 338,922 49,529
Chief Academic Officer 294,144 47,225
Vice President, Marketing & Public Affairs 351,369 46,660
Chair, Health Behavior 264,524 45,352
Chief, Vice Chair, Surgical Oncology 601,851 43,000
Vice President, Development 119,897 41,612
Associate Member (Epidemiology and Prevention) [RPCI] 191,202 39,918
Vice President, Organizational Perf. Improvement & Strategic Alignment 255,216 37,297
VP, Corporate Ethics & Research Subject Prot. & HIPAA Compliance Officer 299,662 36,838
Vice President, Facilities Management 328,043 34,417
Vice President [RPCI] 305,222 34,063
Vice President, Internal Audit 229,697 33,763
Vice President, Managed Care & Outreach 255,120 32,767
Associate Member (Epidemiology and Prevention) [RPCI] 167,811 31,833
Vice President, External Affairs 265,126 31,161
Staff Physician (Medical Oncology) [RPCI] 345,735 30,000
Chief Medical Officer [RPCI] 654,080 29,118
Staff Physician (Medical Oncology) [RPCI] 281,166 25,000
Staff Physician (Medical Oncology) [RPCI] 241,171 25,000
Staff Physician (Surgical Oncology) [RPCI] 312,366 25,000
Staff Physician (Medical Oncology) [RPCI] 199,521 25,000
Staff Physician (Medical Oncology) [RPCI] 231,299 25,000
Staff Physician (Breast Surgery) [RPCI] 347,450 25,000
Staff Physician (Surgical Oncology) [RPCI] 311,954 25,000
Staff Physician (Medical Oncology) [RPCI] 200,320 25,000
Staff Physician (Medical Oncology) [RPCI] 211,960 25,000
Associate Member (Epidemiology and Prevention) [RPCI] 160,711 24,733
Director, Classification & Compensation 205,252 23,073
Distinguished Member, Molecular & Cellular Biology 209,808 22,000
Assistant Member (Epidemiology and Prevention) [RPCI] 123,933 20,235
Associate Member (Pharmacology & Therapeutics) [RPCI] 163,635 20,000
Staff Physician (Thoracic Surgery and Oncology) [RPCI] 514,732 20,000
Staff Physician (Radiation Medicine) [RPCI] 491,568 20,000
Chief, Surgical Oncology, Melanoma Surgery 555,846 20,000
Senior Director, Scientific Administration 193,846 20,000
Staff Physician (Surgical Oncology) [RPCI] 387,151 20,000
Staff Physician (Medical Oncology) [RPCI] 222,091 20,000
Chief Scientific Operations Officer 193,846 20,000
Staff Physician (Radiation Medicine) [RPCI] 532,299 20,000
Staff Physician (Anesthesiology) [RPCI] 416,622 20,000
Staff Physician (Breast Surgery) [RPCI] 283,580 20,000
Member (Genetics) [RPCI] 170,341 18,965
Assistant Vice President [RPCI] 156,868 17,669
Deputy Chief Information Officer [RPCI] 208,538 17,482
Assistant Vice President, Fiscal Administration 227,526 16,374
Director, Technology Transfer and Commercial Development [R 228,871 15,881
Distinguished Member, Health Disparities 188,999 15,775
Scientific Department Administrator III [RPCI] 131,972 15,000
Staff Physician (Urologic Oncology) [RPCI] 544,871 15,000
Staff Physician (Radiation Medicine) [RPCI] 388,887 15,000
Staff Physician (Radiation Medicine) [RPCI] 398,471 15,000
Staff Physician (Urologic Oncology) [RPCI] 347,076 15,000
Chief of Strategy, Business Development and Outreach [RPCI] 530,136 15,000
Executive Director, Clinical Revenue Cycle & Clinical Practice Plan 234,075 14,937
Assistant Vice President, Clinical Research Services 189,376 12,152
Assistant Vice President, Facilities Management 198,844 11,539
Member (Clinical Research) [RPCI] 224,388 10,000
Staff Physician (Radiation Medicine) [RPCI] 545,192 10,000
Staff Physician (Radiation Medicine) [RPCI] 433,289 10,000
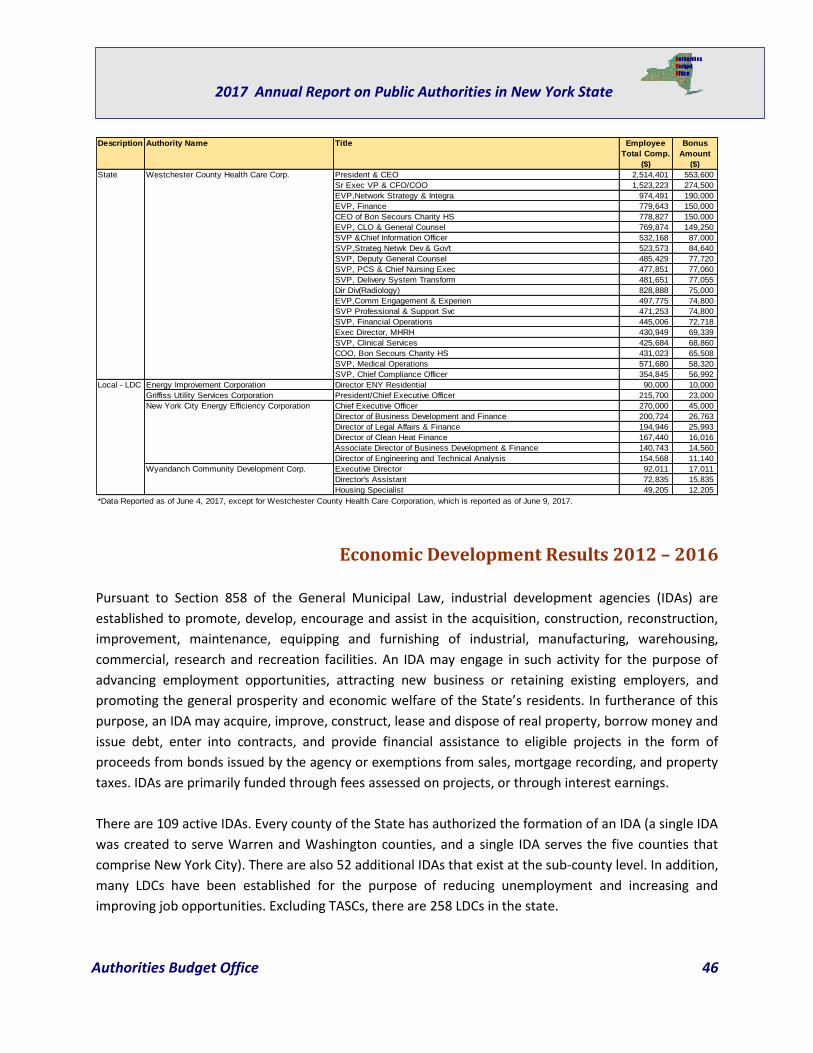
Authorities Budget Office 46
2017 Annual Report on Public Authorities in New York State
Economic Development Results 2012 – 2016
Pursuant to Section 858 of the General Municipal Law, industrial development agencies (IDAs) are
established to promote, develop, encourage and assist in the acquisition, construction, reconstruction,
improvement, maintenance, equipping and furnishing of industrial, manufacturing, warehousing,
commercial, research and recreation facilities. An IDA may engage in such activity for the purpose of
advancing employment opportunities, attracting new business or retaining existing employers, and
promoting the general prosperity and economic welfare of the State’s residents. In furtherance of this
purpose, an IDA may acquire, improve, construct, lease and dispose of real property, borrow money and
issue debt, enter into contracts, and provide financial assistance to eligible projects in the form of
proceeds from bonds issued by the agency or exemptions from sales, mortgage recording, and property
taxes. IDAs are primarily funded through fees assessed on projects, or through interest earnings.
There are 109 active IDAs. Every county of the State has authorized the formation of an IDA (a single IDA
was created to serve Warren and Washington counties, and a single IDA serves the five counties that
comprise New York City). There are also 52 additional IDAs that exist at the sub-county level. In addition,
many LDCs have been established for the purpose of reducing unemployment and increasing and
improving job opportunities. Excluding TASCs, there are 258 LDCs in the state.
Description Authority Name Title Employee
Total Comp.
($)
Bonus
Amount
($)
State Westchester County Health Care Corp. President & CEO 2,514,401 553,600
Sr Exec VP & CFO/COO 1,523,223 274,500
EVP,Network Strategy & Integra 974,491 190,000
EVP, Finance 779,643 150,000
CEO of Bon Secours Charity HS 778,827 150,000
EVP, CLO & General Counsel 769,874 149,250
SVP &Chief Information Officer 532,168 87,000
SVP,Strateg Netwk Dev & Gov't 523,573 84,640
SVP, Deputy General Counsel 485,429 77,720
SVP, PCS & Chief Nursing Exec 477,851 77,060
SVP, Delivery System Transform 481,651 77,055
Dir Div(Radiology) 828,888 75,000
EVP,Comm Engagement & Experien 497,775 74,800
SVP Professional & Support Svc 471,253 74,800
SVP, Financial Operations 445,006 72,718
Exec Director, MHRH 430,949 69,339
SVP, Clinical Services 425,684 68,860
COO, Bon Secours Charity HS 431,023 65,508
SVP, Medical Operations 571,680 58,320
SVP, Chief Compliance Officer 354,845 56,992
Local - LDC Energy Improvement Corporation Director ENY Residential 90,000 10,000
Griffiss Utility Services Corporation President/Chief Executive Officer 215,700 23,000
New York City Energy Efficiency Corporation Chief Executive Officer 270,000 45,000
Director of Business Development and Finance 200,724 26,763
Director of Legal Affairs & Finance 194,946 25,993
Director of Clean Heat Finance 167,440 16,016
Associate Director of Business Development & Finance 140,743 14,560
Director of Engineering and Technical Analysis 154,568 11,140
Wyandanch Community Development Corp. Executive Director 92,011 17,011
Director's Assistant 72,835 15,835
Housing Specialist 49,205 12,205
*Data Reported as of June 4, 2017, except for Westchester County Health Care Corporation, which is reported as of June 9, 2017.

Authorities Budget Office 47
2017 Annual Report on Public Authorities in New York State
IDA Projects and Private Sector Employment
Based on United States Department of Labor statistics, the average annual private sector jobs in New York
State increased by 570,747 between 2012 and 2016. This is an 8.1 percent increase in private sector jobs,
which is almost at the same level as reported between 2011 and 2015, 8.3 percent. New York City
accounts for 406,186, or 71.2 percent of the total increase in private employment. Other counties that
experienced above average job growth were Saratoga, Rockland, Orange, Columbia, and Putnam counties.
During each corresponding reporting period, IDAs approved a combined total of 1,754 projects from 2012
to 2016. This is 3.2 percent more projects than the number approved between 2011 and 2015. The
highest number of IDA projects were again approved in Monroe County (269), while no projects were
approved in five counties (Fulton, Franklin, Lewis, Delaware and Hamilton) during this time period.
As discussed in prior year ABO annual reports, Table 20 suggests that there is little correlation between a
county’s change in private sector employment totals between 2012 and 2016 and the number of projects
approved by an IDA in the county. The three counties with the greatest number of projects approved
(Monroe, Nassau and Suffolk) combine to have an average growth of 5.6 percent for private sector
employment between 2012 and 2016, 2.5 percent lower than the State average of 8.1
percent. Conversely, three counties with very few projects approved (Columbia, Putnam and Ulster)
combine to have an average growth of 7.9 percent for private sector employment between 2012 and
2016, almost at the same level of the State average of 8.1 percent. These three counties with very few
approved projects have a greater private sector employment growth rate from 2012 to 2016 than the
three counties with the most projects approved.

Authorities Budget Office 48
2017 Annual Report on Public Authorities in New York State
County 2012 Avg Annual
Private Sector
Employment
2016 Avg Annual
Private Sector
Employment
Prelim
Change Percent
Change
IDA Projects
Approved
2012-2016
New York City 3,220,458 3,626,644 406,186 12.6% 155
Saratoga 65,843 72,461 6,618 10.1% 20
Rockland 94,270 103,381 9,111 9.7% 20
Orange 104,825 114,451 9,626 9.2% 26
Columbia 15,921 17,254 1,333 8.4% 2
Putnam 19,920 21,523 1,603 8.0% 1
Ulster 43,784 47,155 3,371 7.7% 5
Albany 159,343 171,090 11,747 7.4% 42
Suffolk 516,941 550,088 33,147 6.4% 210
Nassau 511,704 544,199 32,495 6.4% 230
Sullivan 19,168 20,363 1,195 6.2% 21
Livingston 13,369 14,200 831 6.2% 11
Westchester 345,988 362,775 16,787 4.9% 71
Niagara 56,596 59,148 2,552 4.5% 60
Oswego 24,171 25,119 948 3.9% 12
Erie 380,749 394,693 13,944 3.7% 94
Ontario 42,618 44,148 1,530 3.6% 20
Greene 9,831 10,175 344 3.5% 4
Essex 10,131 10,471 340 3.4% 4
Monroe 326,508 337,210 10,702 3.3% 269
Montgomery 15,863 16,334 471 3.0% 3
Clinton 24,840 25,567 727 2.9% 1
Wayne 20,913 21,512 599 2.9% 18
Fulton 13,203 13,576 373 2.8% 0
Tompkins 43,123 44,327 1,204 2.8% 13
Franklin 10,348 10,632 284 2.7% 0
Genesee 17,269 17,725 456 2.6% 43
Schuyler 3,693 3,787 94 2.5% 5
Seneca 8,332 8,532 200 2.4% 19
Rensselaer 39,773 40,691 918 2.3% 33
Schoharie 5,932 6,067 135 2.3% 1
Lewis 4,095 4,183 88 2.1% 0
Yates 5,700 5,821 121 2.1% 10
Onondaga 200,172 204,134 3,962 2.0% 51
Steuben 28,676 29,221 545 1.9% 20
Herkimer 12,133 12,316 183 1.5% 11
Dutchess 89,432 90,730 1,298 1.5% 11
Chenango 13,166 13,306 140 1.1% 4
Warren & Washington 43,805 44,191 386 0.9% 20
Cattaraugus 19,954 20,070 116 0.6% 24
Oneida 78,358 78,806 448 0.6% 40
St. Lawrence 24,819 24,928 109 0.4% 20
Otsego 19,058 19,110 52 0.3% 2
Schenectady 53,072 53,181 109 0.2% 13
Jefferson 30,056 30,014 -42 -0.1% 17
Allegany 9,661 9,604 -57 -0.6% 4
Madison 17,040 16,929 -111 -0.7% 5
Cayuga 20,447 20,237 -210 -1.0% 15
Tioga 10,558 10,432 -126 -1.2% 2
Cortland 14,244 14,034 -210 -1.5% 6
Wyoming 9,522 9,368 -154 -1.6% 16
Broome 69,984 68,325 -1,659 -2.4% 13
Orleans 9,185 8,878 -307 -3.3% 5
Chautauqua 41,873 40,297 -1,576 -3.8% 18
Delaware 10,888 10,351 -537 -4.9% 0
Chemung 31,159 29,536 -1,623 -5.2% 14
Hamilton 1,044 975 -69 -6.6% 0
Outside NYC 3,833,070 3,997,631 164,561 4.3% 1,599
New York State 7,053,528 7,624,275 570,747 8.1% 1,754
Private Employers 563,757 590,322 26,565 4.7%
Source: U.S. Bureau of Labor Statistics
Table 20: Change in Private Sector Employment by County 2012 - 2016*
* Data reported as of June 4, 2017. If an IDA did not submit their report for a particular year, the data is for the years that reports were
submitted.
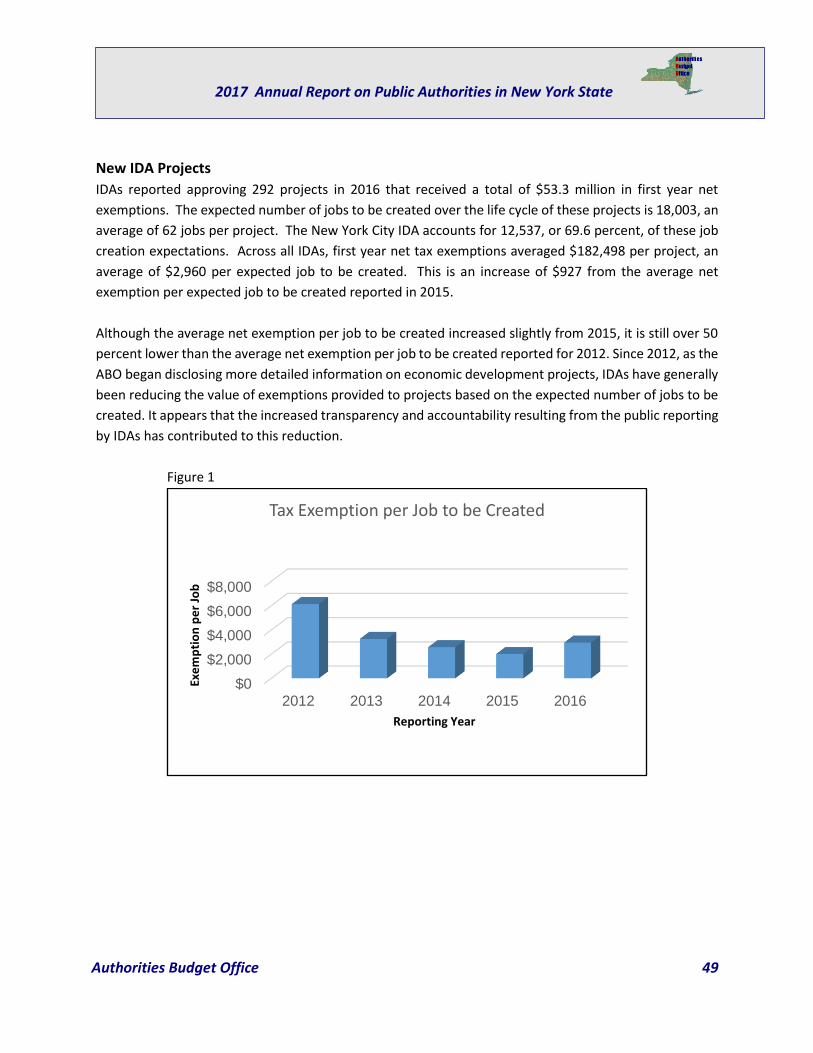
Authorities Budget Office 49
2017 Annual Report on Public Authorities in New York State
New IDA Projects
IDAs reported approving 292 projects in 2016 that received a total of $53.3 million in first year net
exemptions. The expected number of jobs to be created over the life cycle of these projects is 18,003, an
average of 62 jobs per project. The New York City IDA accounts for 12,537, or 69.6 percent, of these job
creation expectations. Across all IDAs, first year net tax exemptions averaged $182,498 per project, an
average of $2,960 per expected job to be created. This is an increase of $927 from the average net
exemption per expected job to be created reported in 2015.
Although the average net exemption per job to be created increased slightly from 2015, it is still over 50
percent lower than the average net exemption per job to be created reported for 2012. Since 2012, as the
ABO began disclosing more detailed information on economic development projects, IDAs have generally
been reducing the value of exemptions provided to projects based on the expected number of jobs to be
created. It appears that the increased transparency and accountability resulting from the public reporting
by IDAs has contributed to this reduction.
Figure 1
$0
$2,000
$4,000
$6,000
$8,000
2012 2013 2014 2015 2016
Exe
mp
tio
n p
er
Job
Reporting Year
Tax Exemption per Job to be Created

Authorities Budget Office 50
2017 Annual Report on Public Authorities in New York State
Authority Name New
Projects
State Sales
Tax
Exemptions
Local Sales
Tax
Exemptions
Mortgage
Recording
Tax
Exemptions
Total
Property Tax
Exemptions
Total
PILOT
Payment
Made
Net
Exemptions
Estimated
Jobs to
be
Created
Albany City IDA 1 12,717 12,717 65,344 - - 90,778 -
Albany County IDA 1 36,000 36,000 22,500 - - 94,500 19
Allegany IDA 2 - 8,609 - 29,391 868 37,132 13
Amherst IDA 3 118,398 140,755 16,630 - - 275,783 9
Amsterdam IDA 1 120,000 120,000 - - - 240,000 70
Babylon IDA 18 350,133 404,841 894,316 - - 1,649,290 449
Bethlehem IDA 1 86,000 86,000 25,316 - - 197,316 4
Brookhaven IDA 4 2,600 5,607 84,000 - - 92,207 66
Broome IDA 5 234,548 234,548 - - - 469,096 487
Cattaraugus IDA 4 100,348 100,348 42,500 - - 243,196 28
Cayuga IDA 3 61,697 61,697 - - - 123,394 17
Chautauqua IDA 3 17,738 55,376 34,606 - - 107,720 47
Chemung IDA 5 146,424 - 6,038 9,720 5,151 157,031 44
Chenango IDA 1 - - - 5,686 - 5,686 6
City of Schenectady IDA 4 343,206 343,206 715,405 - - 1,401,816 79
City of Utica IDA 3 61,515 73,090 226,990 - - 361,595 35
Clarence IDA 1 5,394 6,406 - - - 11,800 2
Colonie IDA 1 - - - - - - 4
Dutchess County IDA 1 2,265 2,335 46,200 - - 50,800 2
Erie County IDA 11 183,470 217,997 6,375 - - 407,842 117
Genesee County IDA 4 107,006 107,006 - - - 214,012 9
Glen Cove IDA 1 - - - - - - 2
Glens Falls IDA 3 121,000 90,750 - - - 211,750 27
Greene County IDA 2 - - 18,750 395,699 395,699 18,750 160
Guilderland IDA 1 164,783 164,783 181,250 - - 510,816 4
Hempstead IDA 3 420,328 486,004 735,000 122,531 - 1,763,863 36
Hornell IDA 1 41,830 - 500 1,331 - 43,661 4
Jefferson IDA 3 77,600 75,350 12,000 231,189 24,782 371,356 50
Lancaster IDA 1 20,512 24,358 - - - 44,870 -
Livingston County IDA 4 16,047 16,047 97,916 - - 130,010 35
Madison County IDA 1 - - 20,000 - - 20,000 -
Monroe IDA 54 1,395,574 1,305,018 507,473 - - 3,208,064 212
Montgomery County IDA 1 453 - 4,425 - - 4,878 6
Nassau County IDA 9 6,869 7,935 165,432 - - 180,236 147
New Rochelle IDA 3 120,037 131,290 172,000 - - 423,327 15
New York City IDA 20 161,604 166,193 14,964,875 - - 15,292,672 12,537
Niagara County IDA 12 227,304 227,304 147,635 64,718 23,234 643,727 252
Oneida County IDA 3 54,849 65,134 7,200 - - 127,183 13
Onondaga County IDA 9 720,689 720,689 222,812 799,783 799,783 1,664,190 420
Ontario County IDA 4 439,768 384,798 78,200 7,963,500 38,590 8,827,676 34
Orange County IDA 3 1,156,177 1,192,344 380,100 - - 2,728,620 137
Orleans County IDA 2 49,720 49,720 - - - 99,440 6
Oswego County IDA 4 641,901 641,901 20,000 67,759 33,881 1,337,680 51
Rensselaer County IDA 7 531,225 531,225 509,434 - - 1,571,884 214
Riverhead IDA 3 5,595 6,468 - - - 12,063 43
Rockland County IDA 2 17,367 18,995 87,750 - - 124,112 30
Saratoga County IDA 7 170,807 - - - - 170,807 258
Steuben County IDA 1 14,286 14,286 - - - 28,572 -
Suffolk County IDA 11 90,374 86,830 353,850 - - 531,054 607
Sullivan County IDA 7 22,001 22,001 354,185 611,163 594,864 414,487 314
Syracuse IDA 3 200,394 - 399,233 - - 599,627 14
Tompkins County IDA 4 121,736 121,736 26,275 - - 269,747 41
Town of Lockport IDA 1 - - - 1,898 - 1,898 3
Troy IDA 7 483,260 - 492,375 804,684 - 1,780,319 15
Ulster County IDA 1 5,356 5,356 7,028 - - 17,740 5
Warren and Washington Counties IDA 2 17,713 13,285 15,625 - - 46,622 21
Wayne County IDA 3 90,540 90,540 64,900 - - 245,980 39
Westchester County IDA 3 400,914 427,836 894,385 60,000 60,000 1,723,135 12
Yates County IDA 5 68,244 68,244 5,890 - - 142,378 6
Yonkers IDA 4 131,189 159,886 1,281,600 152,524 - 1,725,199 727
Total: 292 10,197,505 9,332,843 24,414,317 11,321,575 1,976,852 53,289,389 18,003
*Data reported as of June 4, 2017.
Table 21: New IDA Projects for FYE 2016 by IDA*

Authorities Budget Office 51
2017 Annual Report on Public Authorities in New York State
Current Status of Projects Approved in 2012
The success of IDA projects in meeting job creation expectations can best be assessed over time. New IDA
projects are usually not expected to result in immediate employment changes but new jobs are created
over time as project construction is finished and the benefited companies build capacity. For this reason,
IDA officials contend that reporting employment change information of projects just a few years after
their approval can be misleading. To address this concern, the ABO compiled reported information on all
projects that were approved by the IDAs in 2012 and remained active in 2016.
A total of 284 projects were approved in 2012 and have received $147.2 million in financial assistance
over the past 5 years. This financial assistance was in the form of exemptions from local, county and school
property taxes (62.2 percent), state sales taxes (18.2 percent), local sales taxes (15.4 percent) and
mortgage recording taxes (4.2 percent).
These projects were expected to create a total of 8,766 new jobs. As reported by the IDAs these projects
have resulted in a total of 9,746 jobs since 2012, which is 980 more than expected when the projects were
approved. This net job growth is not reflective of individual results; 30 of the 66 IDAs that had projects
approved in 2012 that remained active in 2016 reported fewer jobs than anticipated.
We also note that four specific projects significantly impacted the results reported. Job growth reported
was primarily due to two projects, which accounted for a net increase of 1,535 jobs:
Suffolk IDA – Peconic Bay Health System, Inc. Project – The IDA reported that there were no
existing jobs prior to IDA involvement, that the project was expected to create 105 jobs, and that
900 jobs currently exist, resulting in a net increase of 900 jobs.
Suffolk County IDA – Broadridge Investor Communication Solutions, Inc. Project – The IDA
reported that there were 1,500 jobs prior to IDA involvement, and that the project was not
expected to create any additional jobs. The IDA reported that the project currently has 2,135 jobs,
resulting in a net increase of 635 jobs.
Two other projects accounted for a net decrease of 1,481 jobs:
New York City IDA - Salmar Properties, LLC Project – The IDA reported that there were no existing
jobs prior to IDA involvement, that the project was expected to create 1,300 jobs, but that no jobs
currently exist, resulting in a decrease of 1,300 jobs.
Seneca County IDA – Goulds Pumps Inc. 2012/2013 Project – The IDA reported that there were
870 jobs prior to IDA involvement, that the project was expected to create 50 jobs, and that 739
jobs currently exist, resulting in a decrease of 181 jobs.

Authorities Budget Office 52
2017 Annual Report on Public Authorities in New York State
Authority Name Projects
Approved in
2012, Still
Active in 2016
Value of Net
Exemptions 2012-
2016
($)
Projected
Jobs to be
Created by
Project
Net
Employment
Change
2012-2016
Difference
Between Jobs
Created and
Jobs Promised
Albany City IDA 7 1,238,221 57 106 49
Albany County IDA 1 95,928 33 17 (16)
Allegany IDA 1 179,254 60 (3) (63)
Amherst IDA 5 2,889,187 566 395 (171)
Amsterdam IDA 1 46,617 3 7 4
Auburn IDA 1 187,489 28 50 22
Babylon IDA 13 5,602,080 213 587 374
Bethlehem IDA 4 592,828 15 26 11
Brookhaven IDA 3 4,011,680 414 519 105
Cattaraugus IDA 3 643,920 55 92 37
Cayuga IDA 1 3,730,779 52 69 17
Chautauqua IDA 2 361,491 3 12 9
Chemung IDA 4 1,235,106 143 222 79
City of Utica IDA 1 516,475 45 5 (40)
Clarence IDA 3 972,015 43 54 11
Clifton Park IDA 1 81,913 28 34 6
Cohoes IDA 1 750,938 2 6 4
Columbia IDA 1 42,494 10 56 46
Cortland IDA 3 904,060 36 83 47
Dutchess County IDA 1 487,905 182 47 (135)
Erie County IDA 5 3,367,631 167 157 (10)
Essex County IDA 1 151,043 18 11 (7)
Fulton County IDA 1 2,138,370 13 18 5
Genesee County IDA 6 5,459,340 209 11 (198)
Glens Falls IDA 1 108,276 - 16 16
Hamburg IDA 5 127,137 16 43 27
Hempstead IDA 12 14,607,098 203 265 62
Herkimer IDA 5 878,913 146 42 (104)
Hornell IDA1 1 51,452 1 1 -
Jefferson IDA 4 6,650,685 52 42 (10)
Lancaster IDA 4 71,711 109 56 (53)
Livingston County IDA 1 288,498 15 52 37
Middletown IDA 1 606,820 4 (2) (5)
Monroe IDA 30 11,186,730 294 1,272 978
Nassau County IDA 12 4,101,112 136 497 361
New Rochelle IDA 1 147,000 - - -
New York City IDA 16 5,752,986 1,409 402 (1,007)
Niagara County IDA 7 1,514,768 75 131 56
Niagara Town IDA 1 142,010 15 - (15)
Oneida County IDA 5 615,879 43 (12) (55)
Onondaga County IDA 3 635,185 56 18 (38)
Ontario County IDA 6 630,500 285 231 (54)
Orange County IDA 4 3,564,823 422 413 (9)
Orleans County IDA 1 26,721 7 26 19
Oswego County IDA 5 538,017 144 153 9
Peekskill IDA 1 454,173 25 21 (4)
Port Chester IDA 2 2,740,332 108 (25) (133)
Rensselaer County IDA 3 1,492,526 179 108 (71)
Riverhead IDA 3 539,719 85 91 6
Rockland County IDA 1 (7,184,339) 300 340 40
Saratoga County IDA 3 1,326,710 70 72 2
Schenectady County IDA 1 925,202 - (264) (264)
Schuyler County IDA 13 214,030 57 - (57)
Seneca County IDA 2 2,131,247 60 (116) (176)
St. Lawrence County IDA 6 957,383 18 12 (5)
Steuben County IDA 2 6,110,558 14 53 39
Suffolk County IDA 16 9,942,673 1,450 2,693 1,243
Sullivan County IDA 3 398,748 25 16 (9)
Syracuse IDA 7 1,609,926 238 38 (200)
Troy IDA 5 2,316,243 24 4 (20)
Ulster County IDA 2 331,777 39 62 23
Warren and Washington Counties IDA 2 182,839 37 38 1
Wayne County IDA 4 363,778 85 24 (61)
Westchester County IDA 4 28,225,872 36 264 228
Yates County IDA 4 89,562 18 12 (6)
Yonkers IDA 5 6,085,924 73 77 4
Total: 284 147,187,968 8,766 9,746 980
* Data reported as of June 4, 2017.1Hornell IDA changed their FYE date for the 2014 reporting period. 2014 data is for 21 months.
Table 22: Current Status of Active Projects Approved in 2012*

Authorities Budget Office 53
2017 Annual Report on Public Authorities in New York State
Not-for-Profit Corporations
Section 2(2)(b) of Public Authorities Law defines a not-for-profit corporation affiliated with, sponsored
by, or created by a county, city, town or village government as a “local authority”. The most common
type of not-for-profit corporation that meets this definition is a local development corporation (LDC),
formed pursuant to Section 1411 of the Not-for-Profit Corporation Law. Unlike other authorities, LDCs
are not authorized by special acts of the Legislature, but are incorporated through the filing of certificates
of incorporation with the Department of State. The ABO uses “LDC” as a generic term to include not-for-
profit corporations not incorporated under Section 1411, but which were formed to perform a mission
and purpose similar to those corporations formed pursuant to Section 1411. These corporations were
created for lawful business purposes that achieve a public or quasi-public objective. Their certificates of
incorporation often characterize their mission as reducing unemployment, promoting employment, or
attracting new industry or expanding existing industry in the community. The term “LDC” is also intended
to include land banks established pursuant to Section 1600 of Not-for-Profit Corporation Law.
In furtherance of their specific purposes, an LDC has the power to construct and rehabilitate industrial or
manufacturing facilities for use by others; provide grants and loans; borrow money; issue debt; acquire
real property from a municipality below market value; sell or lease property without appraisal or public
bid; enter into contracts; and provide certain tax exemptions in support of its corporate purposes. Any
county, city, town or village in New York State may cause the incorporation of an LDC by public officers or
private individuals.
Since 2000, the number of LDCs incorporated has increased by over 200 percent. The proliferation of
LDCs in recent years has increased the risk for waste and abuse of public funds. LDCs could be used as
vehicles to alleviate municipal budget pressures by taking debt off the municipality’s books or providing
cash infusions to balance budgets. That is why the ABO has focused on identifying LDCs that meet the
definition of a local authority and subjecting those corporations to the regulatory, governance and
reporting provisions of the PAAA and PARA.
Excluding TASCs, there were a total of 63 LDCs that reported having provided 1,251 loans with a total
amount of $192.9 million outstanding, as shown in Table 23. Outstanding loans issued by the Albany
County Business Development Corporation, Buffalo and Erie County Regional Development Corporation,
the Catskill Watershed Corporation, Griffiss Utility Services Corporation and the New York City Economic
Development Corporation, and the New York City Energy Efficiency Corporation comprised 62.8 percent
of the number of loans outstanding.
Table 24 shows that excluding TASCs, there were a total of 40 LDCs that provided data for 2016, and
reported providing grant funds in 2016. These LDCs reported providing a total of 241 grants totaling $19.0
million.

Authorities Budget Office 54
2017 Annual Report on Public Authorities in New York State
Excluding TASCS, 64 LDCs reported bonds issued for development projects, as indicated in Table 25. These
LDCs reported a total of 399 bonds issued, with $14.7 billion outstanding. Four LDCs account for 57.9
percent of the amount outstanding in bonds: Hudson Yards Infrastructure Corporation ($3.0 billion), Build
NYC Resource Corporation ($2.1 billion), STAR Corporation ($2.0 billion), and Monroe County Industrial
Development Corporation ($1.4 billion).
Authority Name Number
of
Loans
Original
Loan
Amount
($)
Amount
Repaid ($)
Amount
Outstanding
($)
Jobs
Planned
Jobs
Created
Amount
Loaned per
Job Created
($)
Albany County Business Development Corporation 89 20,881,915 7,145,802 13,736,113 860 248 84,201
Binghamton Local Development Corporation 29 2,709,747 1,139,607 1,570,140 61 80 33,872
Buffalo and Erie County Industrial Land Development Corporation 4 115,000 77,295 37,705 5 -
Buffalo and Erie County Regional Development Corporation 72 20,909,850 10,020,150 10,889,701 462 253 82,648
Buffalo Urban Development Corporation 2 1,500,000 - 1,500,000 - -
Capitalize Albany Corporation 42 6,639,737 2,078,379 4,561,358 42 33 201,204
Carthage Industrial Development Corporation 8 2,677,887 175,887 2,502,000 - -
Catskill Watershed Corporation 135 43,550,984 16,496,403 27,054,580 - -
Cayuga County Development Corporation 1 140,000 5,899 134,101 3 2 70,000
Cheektowaga Economic Development Corporation 8 1,770,161 1,188,561 581,600 87 79 22,407
City of Kingston Local Development Corporation 16 2,470,000 1,125,470 1,344,530 41 41 60,244
City of Watertown Local Development Corporation 93 8,478,180 2,360,048 6,118,132 - -
Cohoes Local Development Corporation 25 905,736 489,503 416,233 43 46 19,690
Columbia Economic Development Corporation 69 2,592,917 1,118,640 1,474,277 205 230 11,274
Cortland County Business Development Corporation 11 470,047 321,304 148,743 17 12 39,171
Delaware County Local Development Corporation 40 4,133,476 1,559,135 2,574,341 255 255 16,210
Development Chenango Corporation 20 1,292,335 426,146 866,189 155 30 43,078
Dobbs Ferry Local Development Corporation 1 79,000 32,187 46,813 2 2 39,500
Energy Improvement Corporation 14 1,495,346 16,215 1,479,131 12 12 124,612
Fairport Local Development Corporation 11 1,002,500 155,976 846,524 63 47 21,330
Finger Lakes Horizon Economic Development Corporation 27 1,075,450 574,565 500,885 38 50 21,509
Franklin County Local Development Corporation 7 2,262,415 1,227,059 1,035,356 102 53 42,687
Genesee Gateway Local Development Corporation 8 1,955,005 457,165 1,497,840 163 43 45,465
Glenville Local Development Corporation 4 322,000 55,511 266,489 13 17 18,941
Greater Glens Falls Local Development Corporation 7 355,000 103,093 251,907 28 28 12,679
Griffiss Local Development Corporation 2 9,654,765 3,032,565 6,622,200 365 375 25,746
Griffiss Utility Services Corporation 1 12,000,000 - 12,000,000 - -
Jamestown Local Development Corporation 8 1,120,316 28,420 1,091,896 16 16 70,020
Jefferson County Local Development Corporation 8 2,079,166 212,629 1,866,537 197 231 9,001
Livingston County Development Corporation 12 1,071,928 458,030 613,899 243 388 2,763
Lloyd Community Development Corporation 11 680,212 314,024 366,188 55 33 20,612
Local Development Corporation of the Town of Union 27 1,724,594 519,712 1,204,882 74 210 8,212
Lumber City Development Corporation 20 900,909 355,407 545,502 121 108 8,342
Monroe County Industrial Development Corporation 16 1,685,080 1,217,820 467,260 29 32 52,659
MUNIPRO, Inc. 1 1,300,000 1,300,000 - - -
New York City Economic Development Corporation 18 29,561,869 7,828,817 21,733,052 - -
New York City Energy Efficiency Corporation 23 35,705,124 - 35,705,124 - -
NFC Development Corporation 17 880,207 384,278 495,929 49 40 22,005
Niagara County Brownfields Development Corporation 4 1,446,286 315,625 1,130,661 30 24 60,262
Niagara County Development Corporation 25 2,525,928 1,361,102 1,164,826 329 588 4,296
Ogdensburg Growth Fund Development Corp. 7 1,496,000 852,124 643,876 55 31 48,258
Onondaga Civic Development Corporation 2 200,000 115,740 84,260 18 18 11,111
Ontario County Economic Development Corporation 20 6,218,381 2,699,343 3,519,038 270 280 22,209
Orleans County Local Development Corporation 17 452,000 263,326 188,674 15 12 37,667
Orleans Land Restoration Corporation 8 1,534,000 692,294 841,706 215 215 7,135
Table 23: LDC Loans Outstanding FYE 2016, excluding Tobacco Asset Securitization Corporations*

Authorities Budget Office 55
2017 Annual Report on Public Authorities in New York State
Authority Name Number
of
Loans
Original
Loan
Amount
($)
Amount
Repaid ($)
Amount
Outstanding
($)
Jobs
Planned
Jobs
Created
Amount
Loaned per
Job Created
($)
Rochester Economic Development Corporation 6 4,150,000 693,544 3,456,456 272 235 17,660
Rockland Economic Development Corporation 31 590,475 391,021 199,454 47 27 21,869
Sackets Harbor Local Development Corporation 2 39,650 31,150 8,500 3 3 13,217
Seneca County Economic Development Corporation 1 367,000 160,628 206,372 50 50 7,340
St. Lawrence County IDA Civic Development Corporation 3 399,000 305,611 93,389 - -
St. Lawrence County IDA Local Development Corporation 48 9,686,876 4,267,772 5,419,104 226 228 42,486
Sullivan County Funding Corporation 7 363,621 195,695 167,926 26 17 21,389
Syracuse Economic Development Corporation 43 6,034,148 795,190 5,238,958 5 5 1,206,830
Town of Amherst Development Corporation 1 300,000 287,264 12,736 - -
Town of Plattsburgh Local Development Corporation 4 317,300 185,793 131,507 21 21 15,110
Troy Local Development Corporation 20 1,073,517 479,941 593,576 103 164 6,546
Ulster County Economic Development Alliance, Inc. 9 1,250,000 732,777 517,223 31 51 24,510
Victor Local Development Corporation 2 60,000 31,378 28,622 2 2 30,000
Warren County Local Development Corporation 24 1,629,899 691,002 938,897 79 105 15,523
Washington County Local Development Corporation 46 4,977,000 1,593,668 3,383,332 102 125 39,816
Watertown Industrial Center Local Development Corporation 2 77,916 8,820 69,096 - -
Wayne Economic Development Corporation 7 587,000 65,464 521,536 10 5 117,400
Yates County Capital Resource Corporation 5 320,000 77,450 242,550 43 32 10,000
Total: 1,251 274,244,857 81,295,425 192,949,432 5,758 5,232 3,010,712
*Data Reported as of June 4, 2017. Data shown as - indicates an authority reported 0.
Authority Name Number of
Grants
Grant Amount
($)
Jobs
Planned
Jobs
Created
Batavia Development Corporation 5 88,500 9 4
Binghamton Local Development Corporation 1 88,000 - -
Build NYC Resource Corporation 1 125,000 - -
Capitalize Albany Corporation 5 29,114 - -
Carthage Industrial Development Corporation 4 120,168 - -
Catskill Watershed Corporation 28 221,341 - -
City of Albany Capital Resource Corporation 3 419,250 - -
City of Troy Capital Resource Corporation 1 100,000 1 1
City of Watertown Local Development Corporation 3 5,866 - -
Cortland County Business Development Corporation 1 5,000 - -
Delaware County Local Development Corporation 2 257,900 4 4
Finger Lakes Regional Land Bank Corporation 1 75,000 - -
Franklin County Local Development Corporation 1 300,000 - -
Genesee County Funding Corporation 1 65,000 - -
Griffiss Local Development Corporation 4 316,819 - -
Livingston County Development Corporation 37 509,518 - -
Local Development Corporation of the Town of Union 1 300,000 5 -
Lumber City Development Corporation 3 49,064 15 32
New York City Business Assistance Corporation 9 409,730 - -
New York City Economic Development Corporation 25 13,290,024 - -
NFC Development Corporation 12 127,347 14 12
Niagara County Brownfields Development Corporation 2 6,314 - -
Ontario County Economic Development Corporation 5 59,317 22 24
Ontario County Local Development Corporation 1 7,030 - -
Orange County Funding Corporation 7 490,576 - -
Orleans County Local Development Corporation 7 80,000 - -
Peekskill Facilities Development Corporation 1 3,411 - -
Saranac Lake Local Development Corporation 1 8,494 - -
Saratoga County Capital Resource Corporation 1 1,000 - -
St. Lawrence County Industrial Development Agency Local Development Corporation 8 147,826 - -
Syracuse Local Development Corporation 1 400,000 - -
The Mayor’s Fund to Advance New York City 2 25,000 - -
The Town of Huntington Economic Development Corporation 1 10,000 - -
Theater Subdistrict Council Local Development Corporation 2 220,000 - -
Tioga County Local Development Corporation 2 66,913 - -
Tompkins County Development Corporation 1 200,000 - -
Town of Huntington Local Development Corporation 2 35,000 - -
Town of North Hempstead Business and Tourism Development Corporation 5 40,465 - -
Troy Local Development Corporation 39 312,203 5 -
Victor Local Development Corporation 5 7,424 2 2
Total: 241 19,023,614 77 79
*Data reported as of June 4, 2017. Data shown as - indicates an authority reported 0.
Table 24: LDC Grant Funds Provided FYE 2016, excluding Tobacco Asset Securitization Corporations*

Authorities Budget Office 56
2017 Annual Report on Public Authorities in New York State
Authority Name Number
of
Bonds
Issued
Original Bond
Amount ($)
Amount
Repaid ($)
Amount
Outstanding ($)
Jobs
Planned
Jobs
Created
Albany County Capital Resource Corporation 1 88,000,000 46,494 87,953,506 230 230
Broome County Local Development Corporation 2 65,550,000 2,829,742 62,720,258 10 6
Buffalo and Erie County Industrial Land Development Corporation 14 342,928,757 16,849,655 326,079,102 32 56
Build NYC Resource Corporation 87 2,194,212,300 85,684,826 2,108,527,474 1,345 1,404
Cattaraugus County Capital Resource Corporation 3 35,722,399 11,103,300 24,619,099 15 20
Cayuga County Development Corporation 1 9,805,000 3,455,000 6,350,000 - -
Chautauqua County Capital Resource Corporation 1 20,235,000 250,000 19,985,000 15 19
Chemung County Capital Resource Corporation 2 81,710,000 5,249,600 76,460,400 - -
City of Albany Capital Resource Corporation 12 209,565,900 6,546,924 203,018,976 111 631
City of Troy Capital Resource Corporation 3 432,855,000 16,070,000 416,785,000 - -
Clinton County Capital Resource Corporation 2 31,730,005 - 31,730,005 59 29
Columbia County Capital Resource Corporation 2 18,045,000 5,949,615 12,095,385 38 31
Cortland County Development Corporation 1 21,300,000 2,785,000 18,515,000 - -
Counties of Warren and Washington Civic Development Corporation 6 31,590,000 1,111,295 30,478,705 34 23
Dobbs Ferry Local Development Corporation 3 81,320,000 6,585,000 74,735,000 - -
Dutchess County Local Development Corporation 20 925,705,724 49,491,162 876,214,562 117 495
Energy Improvement Corporation 12 935,584 16,215 919,370 7 7
Essex County Capital Resource Corporation 1 6,160,000 1,110,000 5,050,000 - -
Fairport Local Development Corporation 2 9,000,000 - 9,000,000 46 46
Genesee County Funding Corporation 6 20,125,891 1,590,112 18,535,779 5 14
Genesee Gateway Local Development Corporation 1 1,489,000 933,524 555,476 - -
Glen Cove Local Economic Assistance Corporation 3 24,000,000 - 24,000,000 16 25
Hudson Yards Infrastructure Corporation 2 3,000,000,000 - 3,000,000,000 - -
Jefferson County Civic Facility Development Corporation 4 61,670,000 10,729,267 50,940,733 13 283
Livingston County Capital Resource Corporation 1 4,000,000 1,088,405 2,911,595 3 3
Madison County Capital Resource Corporation 6 206,199,000 8,920,951 197,278,049 - -
Monroe County Industrial Development Corporation 30 1,528,730,363 100,480,874 1,428,249,489 398 370
Montgomery County Capital Resource Corporation 1 22,975,000 1,460,000 21,515,000 - -
New Rochelle Corporation for Local Development 1 5,000,000 630,000 4,370,000 - -
Niagara Area Development Corporation 6 235,782,133 9,452,133 226,330,000 37 -
Oneida County Local Development Corporation 5 89,616,681 4,550,837 85,065,844 40 -
Onondaga Civic Development Corporation 12 478,950,000 52,412,694 426,537,306 527 527
Ontario County Local Development Corporation 1 29,700,000 3,110,000 26,590,000 14 14
Orange County Funding Corporation 4 119,140,000 8,744,396 110,395,605 201 115
Otsego County Capital Resource Corporation 7 147,338,000 17,890,388 129,447,612 170 3,896
Riverhead IDA Economic Job Development Corporation 2 21,105,000 550,000 20,555,000 3 55
Rockland County Economic Assistance Corporation 5 28,718,920 3,302,065 25,416,855 36 288
Saratoga County Capital Resource Corporation 4 80,805,000 7,330,000 73,475,000 60 60
Schenectady County Capital Resource Corporation 5 78,796,683 18,515,153 60,281,530 - -
Schoharie County Capital Resource Corporation 1 10,000,000 637,645 9,362,355 - -
Schuyler County Human Services Development Corporation 1 5,725,000 1,275,000 4,450,000 - -
Seneca County Funding Corporation 1 13,915,181 1,068,531 12,846,650 - -
Sherburne Area Local Development Corporation 2 1,700,000 907,800 792,200 - -
Southold Local Development Corporation 1 19,555,000 - 19,555,000 40 52
St. Lawrence County Industrial Development Agency Civic Development Corp. 10 186,305,000 7,591,479 178,713,521 67 65
STAR (Sales Tax Asset Receivable) Corporation 1 2,035,330,000 73,935,000 1,961,395,000 - -
Steuben Area Economic Development Corporation 1 16,773,000 961,723 15,811,277 13 10
Suffolk County Economic Development Corporation 19 484,614,000 35,500,281 449,113,719 - -
Sullivan County Funding Corporation 3 77,710,000 20,040,000 57,670,000 - -
Syracuse Local Development Corporation 3 9,832,800 - 9,832,800 - -
Tompkins County Development Corporation 12 206,352,408 25,014,417 181,337,991 37 37
Town of Amherst Development Corporation 7 182,962,970 30,188,494 152,774,476 - -
Town of Babylon L. D. Corporation II 3 27,074,000 3,445,000 23,629,000 - -
Town of Brookhaven Local Development Corporation 5 74,660,000 11,881,554 62,778,446 - -
Town of Colonie Local Development Corporation 4 49,800,000 12,905,900 36,894,100 142 138
Town of Dewitt Local Development Corporation 1 2,990,000 245,000 2,745,000 - -
Town of Hempstead Local Development Corp. 15 388,640,000 18,010,000 370,630,000 111 233
Town of Huntington Local Development Corporation 3 56,834,000 5,702,000 51,132,000 - -
Tuxedo Farms Local Development Corporation 1 30,000,000 - 30,000,000 - -
Ulster County Capital Resource Corporation 4 32,345,000 10,383,492 21,961,508 - -
Wayne County Civic Facility Development Corporation 2 16,230,000 3,340,000 12,890,000 - -
Westchester County Local Development Corporation 14 647,026,000 10,987,081 636,038,919 - -
Yates County Capital Resource Corporation 1 10,500,000 2,422,030 8,077,970 220 220
Yonkers Economic Development Corporation 3 59,858,000 8,629,000 51,229,000 78 1,235
Total: 399 15,437,244,699 751,896,054 14,685,348,646 4,290 10,637
*Data reported as of June 4, 2017. Data shown as - indicates an authority reported 0.
Table 25: LDC Bonds Outstanding FYE 2016, excluding Tobacco Asset Securitization Corporations*

Authorities Budget Office 57
2017 Annual Report on Public Authorities in New York State
Observations and Recommendations
The Authorities Budget Office continues to encourage the Governor and the Legislature to evaluate the
structure of public authorities as it exists today in New York State, and to address the uncontrolled growth
in the number of authorities – both public benefit corporations and not-for-profit corporations - that are
formed to manage the State’s infrastructure and public services. As a matter of public policy the State
needs to agree on the appropriate level of independence that public authorities should exercise and
conform the selection and appointment of boards of directors, and how they carry out their duties and
govern to that consensus.
Role and Responsibility of Board Members
Over the past 11 years in conducting compliance reviews, investigations, quality assurance of reporting,
and responding to inquiries, an underlying theme for a public authority’s noncompliance with the law has
been the board of directors’ lack of oversight of and engagement with staff and the authority’s activities.
This is disconcerting; it is the primary responsibility of board members to understand the mission and
public purpose of the authority and to act in the best interests of the authority, its mission, and the public.
There are two very significant requirements in New York State Public Authorities Law that all board
members should complete in a timely fashion, as they educate and remind him or her of their role and
responsibility as a board member: Signing an acknowledgement of fiduciary duty within 30 days of
appointment to the board; and participating in state approved board member training within one year of
appointment of the board. This past year, the ABO again followed up with authorities and their board
members that had reported not signing the required acknowledgement of fiduciary duty and those that
had not participated in the state required board member training.
While the ABO can continue to monitor authorities and provide board member training, the ABO is left
with few enforcement powers to remedy these issues. The law allows for the ABO to censure boards of
directors and to recommend to the appointing authority the removal or suspension of board members.
Unfortunately, there have been instances over the years when the ABO used these powers and there was
little or no reaction by the board or appointing authority.
The ABO believes that consideration should be given to granting it the ability to assess fines, suspend
directors, or to curtail certain activities of an authority and its board which have been censured but
remain out of compliance with state law or deficient in performing its fiduciary duty.
Authorities Budget Office 58
2017 Annual Report on Public Authorities in New York State
Public Authority Transparency and Accountability Issues:
Data reported in PARIS by public authorities is questionable, as it has been repeatedly inaccurate
and unreliable.
o ABO reports on IDA procurement practices and board member training have identified
inaccurate reporting by authorities.
o Authorities continue to report no staff and compensation at the authority to purposely
avoid transparency.
o Public authorities may not put adequate processes in place to ensure the data is reliable.
For example, an authority certified an annual report as accurate and complete, yet it
included only 9 months of data in the report.
o IDAs report incorrect data and subsequently request to make changes to projects,
including job creation data and financial assistance, in certified reports.
The ABO routinely identifies about one-quarter of the public authorities that repeatedly fail to
submit required reports.
o The ABO issued 50 warning letters in 2017 to authorities that failed to submit reports,
and has been working with some of these authorities to finalize dissolution.
There are entities that routinely deny being a public authority, although there is sufficient
evidence that they meet the definition of a local authority, as defined in law.
o The ABO will be working with other state enforcement agencies that also have oversight
of these entities to ensure these entities are following requirements of NYS laws, or they
could possibly encounter dissolution.
Laws and Practices of Economic Development Activities
We also need to examine the laws and practices governing economic development activities. The majority
of the 578 public authorities have a primary mission of economic development and more specifically job
growth and retention. Yet the presence or concentration of these authorities within a geographic area,
the number of projects provided financial assistance by these authorities, or the amount of financial
assistance that is provided to a project appears to have no direct impact on private sector job growth.
New York State and its local governments spend billions of dollars annually through grants, loans and
other operating assistance provided to projects with no clear measurable understanding of the benefits
realized from such expenditures. In addition, state and local government and local school districts are
significantly impacted by millions of dollars of tax abatements and other foregone revenues that are being
provided annually. New York needs to better understand the factors that contribute to and impact private
sector job growth within the state and determine how best to impact those factors. The current practice
of creating public authorities to address the issue of economic development can hardly be considered
effective.

Authorities Budget Office A1
2017 Annual Report on Public Authorities in New York State
Appendix I
Type of
Authority Authority Name
Budget
Report Due*
Annual
Report Due
Audit
Report Due
State Nassau Health Care Corporation 3/31/2017 3/31/2017
Local - Other Albany Community Development Agency 3/31/2017 3/31/2017
Albany Municipal Water Finance Authority 3/31/2017 3/31/2017
Albany Water Board 3/31/2017 3/31/2017
City of Fulton Community Development Agency 3/31/2017 3/31/2017
Clifton-Fine Health Care Corporation1 11/1/2016 3/31/2017 3/31/2017
Franklin County Solid Waste Management Authority 5/1/2017 9/30/2016 9/30/2016
Greater Rochester Sports Authority 11/1/2016 3/31/2017 3/31/2017
Haverstraw Urban Renewal Agency 3/31/2017 3/31/2017
Little Falls Urban Renewal Agency 11/1/2016 3/31/2017 3/31/2017
Mechanicville Community Development Agency 11/1/2016 3/31/2017 3/31/2017
Mount Vernon Urban Renewal Agency 11/1/2016 3/31/2017 3/31/2017
New York City Educational Construction Fund 5/1/2017
New York City School Construction Authority 5/1/2017 9/30/2016 9/30/2016
Niagara Falls Public Water Authority 11/1/2016 3/31/2017 3/31/2017
Niagara Falls Water Board 11/1/2016 3/31/2017 3/31/2017
North Hempstead Solid Waste Management Authority 3/31/2017 3/31/2017
Nyack Parking Authority 4/1/2017 8/31/2016 8/31/2016
Olean Urban Renewal Agency 5/1/2017
Port Jervis Community Development Agency 3/31/2017 3/31/2017
Saratoga Springs City Center Authority 3/31/2017 3/31/2017
Tonawanda (City) Community Development Agency 11/1/2016 3/31/2017 3/31/2017
Town of Riverhead Community Development Agency 3/31/2017 3/31/2017
Upper Mohawk Valley Memorial Auditorium Authority 11/1/2016 3/31/2017 3/31/2017
Village of Spring Valley Urban Renewal Agency 4/1/2017 8/31/2016 8/31/2016
Wilton Water and Sewer Authority 3/31/2017 3/31/2017
Yonkers Parking Authority 3/31/2017 3/31/2017
Local - IDA Chenango Industrial Development Agency 3/31/2017
Corinth Industrial Development Agency 11/1/2016 3/31/2017 3/31/2017
Franklin County Industrial Development Agency 3/31/2017
Mount Vernon Industrial Development Agency 3/31/2017 3/31/2017
Putnam County Industrial Development Agency 3/31/2017 3/31/2017
Town of Montgomery Industrial Development Agency 3/31/2017 3/31/2017
Village of Groton Industrial Development Agency 4/1/2017 8/31/2016 8/31/2016
Local - Not-for- Albion Housing and Economic Development Corporation 11/1/2016 3/31/2017 3/31/2017
Profit Allegany County Telecommunications Development Corp 11/1/2016 3/31/2017 3/31/2017
Corporations Batavia Regional Recreation Corporation 9/1/2016 1/31/2017 1/31/2017
Bethel Local Development Corporation 3/31/2017 3/31/2017
Bronx Overall Economic Development Corporation 5/1/2017 9/30/2016 9/30/2016
Brooklyn Navy Yard Development Corporation 9/30/2016
Buffalo Economic Renaissance Corporation1 4/1/2017 8/31/2016 8/31/2016
Buffalo Niagara Convention Center Management Corporation 3/31/2017
Business Development Corporation for a Greater Massena 11/1/2016 3/31/2017 3/31/2017
Cattaraugus County Economic Sustainability and Growth Corporation 3/31/2017 3/31/2017
Cattaraugus County Land Bank Corporation 3/31/2017 3/31/2017
Chadwick Bay Regional Development Corporation 11/1/2016 3/31/2017 3/31/2017
Cheektowaga Economic Development Corporation 2/1/2017
City of Watervliet Local Development Corporation 11/1/2016 3/31/2017 3/31/2017
Crossroads Incubator Corporation 4/1/2017 8/31/2016 8/31/2016
Emerald Corporate Center Economic Development Corporation 3/31/2017 3/31/2017
Franklin County Civic Development Corporation 3/31/2017
Fulton County Economic Development Corporation 11/1/2016 3/31/2017 3/31/2017
Public Authorities That Have Failed to File Reports in the
Public Authorities Reporting Information System as of June 29, 2017
Pursuant to Section 2800 of Public Authorities Law, public authorities are required to file an annual report and audit report within 90 days of the
fiscal year end (FYE). In accordance with Section 2801 of this Law, State authorities must submit a budget report 90 days prior to the start of the
fiscal year; local authorities must file a budget report 60 days prior to the start of the fiscal year. The following authorities have failed to satisfy
one or more of these requirements. The delinquent report(s) are identified by the date the report was due.
The Authorities Budget Office has the authority to "publically warn and censure authorities for non-compliance" with this requirement and to
recommend the "suspension or dismissal of officers or directors, based on information that is, or is made, available to the public under law."
This report constitutes an official warning to those authorities that appear on this list.

Authorities Budget Office A2
2017 Annual Report on Public Authorities in New York State
Type of
Authority Authority Name
Budget
Report Due*
Annual
Report Due
Audit
Report Due
Local - Not-for- Greater Brockport Development Corporation 7/31/2016 7/31/2016
Profit Greater Lockport Development Corporation 3/31/2017 3/31/2017
Corporations Greater Wawarsing Local Development Corporation 11/1/2016 3/31/2017
Hoosick Local Development Corporation 11/1/2016 3/31/2017 3/31/2017
Johnstown Economic Development Corporation1 4/1/2017 8/31/2016 8/31/2016
Lake City Local Development Corporation 11/1/2016 3/31/2017 3/31/2017
Lewis County Development Corporation 3/31/2017
Local Development Corporation of Laurelton, Rosedale, and Springfield Gardens 11/1/2016 3/31/2017 3/31/2017
Local Development Corporation of Mount Vernon1 11/1/2016 3/31/2017 3/31/2017
Long Beach Local Development Corporation 3/31/2017
Madison Grant Facilitation Corporation 11/1/2016 3/31/2017 3/31/2017
Malone Economic Development Corporation1 11/1/2016 3/31/2017 3/31/2017
Municipal Electric and Gas Alliance, Inc 2/1/2017 6/30/2016 6/30/2016
Nassau County Economic Development Corporation1 11/1/2016 3/31/2017 3/31/2017
Nassau County Land Bank Corporation 11/1/2016 3/31/2017 3/31/2017
New Rochelle Local Development Corporation1 11/1/2016 3/31/2017 3/31/2017
New York City Economic Development Corporation 5/1/2017
New York City Energy Efficiency Corporation 5/1/2017
New York City Land Development Corporation 5/1/2017
Orange County Economic Development Corporation 11/1/2016 3/31/2017 3/31/2017
Oswegatchie Development Corporation 11/1/2016 3/31/2017 3/31/2017
Oswego County Land Bank Corporation 11/1/2016 3/31/2017 3/31/2017
Otsego County Development Corporation 4/1/2017 8/31/2016 8/31/2016
Potsdam Community Development Corporation1 4/1/2017 8/31/2016 8/31/2016
Ramapo Local Development Corporation 3/31/2017 3/31/2017
Roberts Road Development Corporation 3/31/2017 3/31/2017
Rockland County Health Facilities Corporation 3/31/2017 3/31/2017
Rockland Second Tobacco Asset Securitization Corporation 3/31/2017 3/31/2017
Rockland Tobacco Asset Securitization Corporation 3/31/2017 3/31/2017
Rome Community Brownfield Restoration Corporation 11/1/2016 3/31/2017 3/31/2017
Southern Tier Economic Development, Inc. 11/1/2016 3/31/2017 3/31/2017
Sullivan County Partnership for Economic Development 11/1/2016 3/31/2017 3/31/2017
The Castleton-Schodack Local Development Corporation1 4/1/2017 8/31/2016 8/31/2016
The Catskill Local Development Corporation 11/1/2016 3/31/2017 3/31/2017
The City of Newburgh Local Development Corporation1 11/1/2016 3/31/2017 3/31/2017
The Development Corporation - Clinton County 11/1/2016 3/31/2017 3/31/2017
The Recreation and Economic Development Corporation of Suffolk County 11/1/2016 3/31/2017 3/31/2017
The Sullivan County Infrastructure Local Development Corporation 3/31/2017 3/31/2017
The Village of Waterford Local Development Corporation1 4/1/2017 8/31/2016 8/31/2016
The Walden Local Development Corporation 11/1/2016 3/31/2017 3/31/2017
Theater Subdistrict Council Local Development Corporation 4/1/2017
Tioga Tobacco Asset Securitization Corporation 3/31/2017
Tompkins Consolidated Area Transit Inc. 11/1/2016 3/31/2017 3/31/2017
Tompkins County Area Development 11/1/2016 3/31/2017 3/31/2017
Town of Allegany Economic Development Corporation1 11/1/2016 3/31/2017 3/31/2017
Town of Montgomery Capital Resource Corporation 3/31/2017 3/31/2017
Town of Sullivan Development Corporation1 11/1/2016 3/31/2017 3/31/2017
Town of Tonawanda Development Corporation1 11/1/2016 3/31/2017 3/31/2017
Town of Waterford Capital Resource Corporation 3/31/2017 3/31/2017
Town of Wawayanda Local Development Corporation 11/1/2016 3/31/2017 3/31/2017
Troy Community Land Bank Corporation 3/31/2017 3/31/2017
Tusten Local Development Corporation 11/1/2016 3/31/2017 3/31/2017
Tuxedo Local Development Corporation 11/1/2016 3/31/2017 3/31/2017
Utica Industrial Development Corporation 7/1/2016 11/30/2016 11/30/2016
Village of Highland Falls High Point Utility Local Development Corporation 11/1/2016 3/31/2017 3/31/2017
Village of Holley Development Corporation 11/1/2016 3/31/2017 3/31/2017
Village of Lancaster Community Development Corporation 4/1/2017 8/31/2016 8/31/2016
Village of Penn Yan Local Development Corporation1 4/1/2017 8/31/2016 8/31/2016
Village of South Glens Falls Local Development Corporation 3/31/2017 3/31/2017
Village of Valatie Local Development Corporation1 6/1/2016 10/31/2016 10/31/2016
Warren Tobacco Asset Securitization Corporation 11/1/2016
Western Ontario Local Community Development Corporation1 5/1/2017 9/30/2016 9/30/2016
Yonkers Downtown Waterfront Development Corporation1 11/1/2016 3/31/2017 3/31/2017
* Budget reports are to be submitted 90 days in advance of a State authority's fiscal year. For example, a State authority with a fiscal year beginning
1/1/2017 should have submitted a Budget Report by 10/1/2016. All non-State Authorities must submit a Budget report 60 days prior to the start of the
fiscal year. For example, a non-State authority with a fiscal year beginning on 1/1/2017 should have submitted a Budget Report by 11/1/2016.1 Authorities that have indicated their intentions to dissolve, but have not completed the formal dissolution process. These authorities are subject to
public disclosure, reporting and corporate governance provisions of the Public Authorities Law until such time as they are legally dissolved.

Authorities Budget Office
Authorities Budget Office
PO Box 2076
Albany, NY 12220-0076
(518) 474-1932 (Albany and Capital District)
1-800-560-1770 (For use outside the 518 area code only)
E-mail address: [email protected]