AUSTRALIA’S TRADE IN SERVICES WI TH CHINA · Australia’s trade in services with China Page 2 ....
17
STATISTICS SECTION, OFFICE OF ECONOMIC ANALYSIS INVESTMENT & ECONOMIC DIVISION Australia’s trade in services with China Page 1 AUSTRALIA’S TRADE IN SERVICES WITH CHINA China was Australia’s second largest two-way trade in services partner in 2016. Australia’s two-way trade in services with China was valued at $13.9 billion. Two-way trade in services has grown by an average 10.8 per cent per annum over the past ten years, above the average for Australia’s total services trade with the world of 4.6 per cent per annum. Australia became a net exporter of services to China from 1999 onwards. Growth in services has been dominated by growth in travel services, particularly exports of education and other personal travel services. China was Australia’s largest services export market in 2016 and Australia’s ninth largest source of services imports. Long term trends in trade in services with China The value of Australia’s exports of services to China increased by an average 18.6 per cent per annum since 1996 to be valued at $11.3 billion in 2016 (Chart 1). The growth rate has been fairly consistent with growth dominated by travel services which have risen from just $187 million in 1996 to $10.1 billion in 2016. Non- travel services have grown from $170 million to $1.2 billion. The growth in travel services has been dominated by Education-related travel service and Other personal travel services (mainly travel for recreational purposes). Chart 1: Australia’s trade in services with China Based on ABS catalogue 5368.0.55.004. 0 2 4 6 8 10 12 0 2 4 6 8 10 12 1996 1998 2000 2002 2004 2006 2008 2010 2012 2014 2016 A$b Exports Imports A$b
-
Upload
trinhhuong -
Category
Documents
-
view
216 -
download
0
Transcript of AUSTRALIA’S TRADE IN SERVICES WI TH CHINA · Australia’s trade in services with China Page 2 ....
STATISTICS SECTION, OFFICE OF ECONOMIC ANALYSIS INVESTMENT & ECONOMIC DIVISION
Australia’s trade in services with China Page 1
AUSTRALIA’S TRADE IN SERVICES WITH CHINA
China was Australia’s second largest two-way trade in services partner in 2016. Australia’s two-way trade in services with China was valued at $13.9 billion. Two-way trade in services has grown by an average 10.8 per cent per annum over the past ten years, above the average for Australia’s total services trade with the world of 4.6 per cent per annum. Australia became a net exporter of services to China from 1999 onwards. Growth in services has been dominated by growth in travel services, particularly exports of education and other personal travel services. China was Australia’s largest services export market in 2016 and Australia’s ninth largest source of services imports.
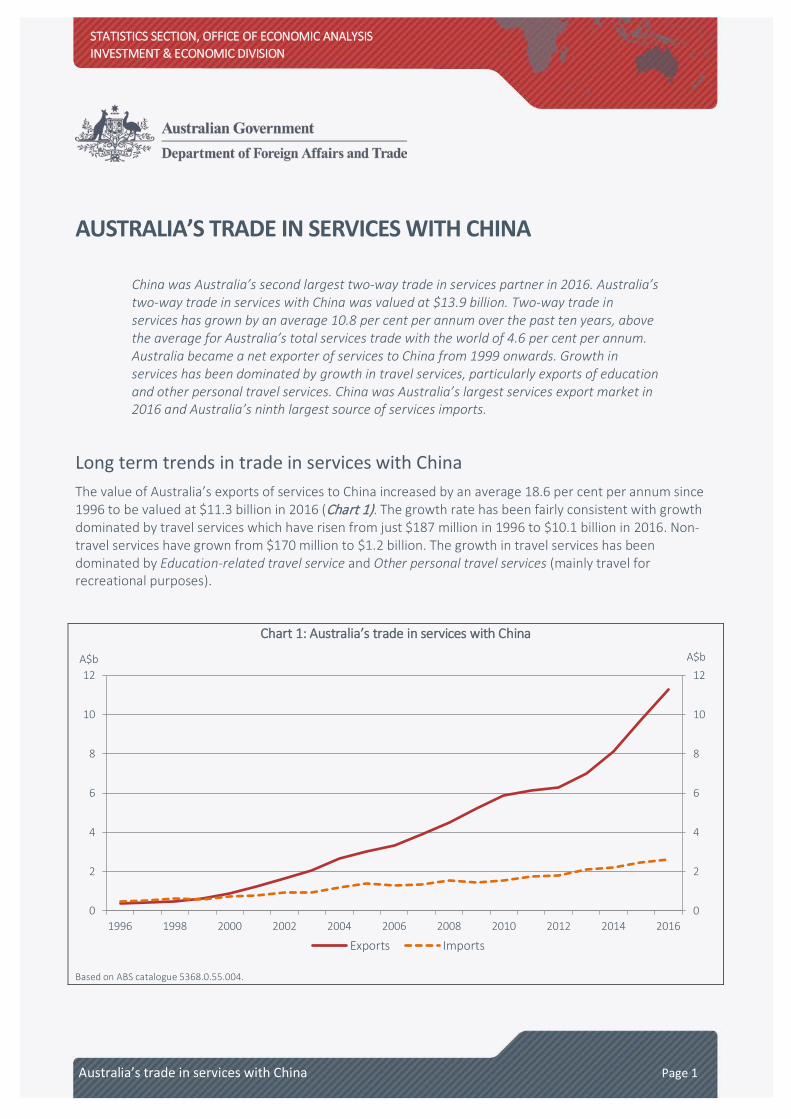
Long term trends in trade in services with China The value of Australia’s exports of services to China increased by an average 18.6 per cent per annum since 1996 to be valued at $11.3 billion in 2016 (Chart 1). The growth rate has been fairly consistent with growth dominated by travel services which have risen from just $187 million in 1996 to $10.1 billion in 2016. Non-travel services have grown from $170 million to $1.2 billion. The growth in travel services has been dominated by Education-related travel service and Other personal travel services (mainly travel for recreational purposes).
Chart 1: Australia’s trade in services with China
Based on ABS catalogue 5368.0.55.004.
0
2
4
6
8
10
12
0
2
4
6
8
10
12
1996 1998 2000 2002 2004 2006 2008 2010 2012 2014 2016
A$b
Exports Imports
A$b
Australia’s trade in services with China Page 2
Australia’s imports of services from China increased by an average 8.6 per cent per annum since 1996 to be valued at $2.6 billion in 2016. Compared to exports, imports have grown at a much slower rate. Unlike exports the growth in imports has been more broadly based with travel services growing from $140 million in 1996 to just under $1.3 billion in 2016, while non-travel services have grown from $316 million to be valued at just over $1.3 billion.
Australia became a net exporter of services to China from 1999, with the surplus on trade in services valued at $8.6 billion in 2016.
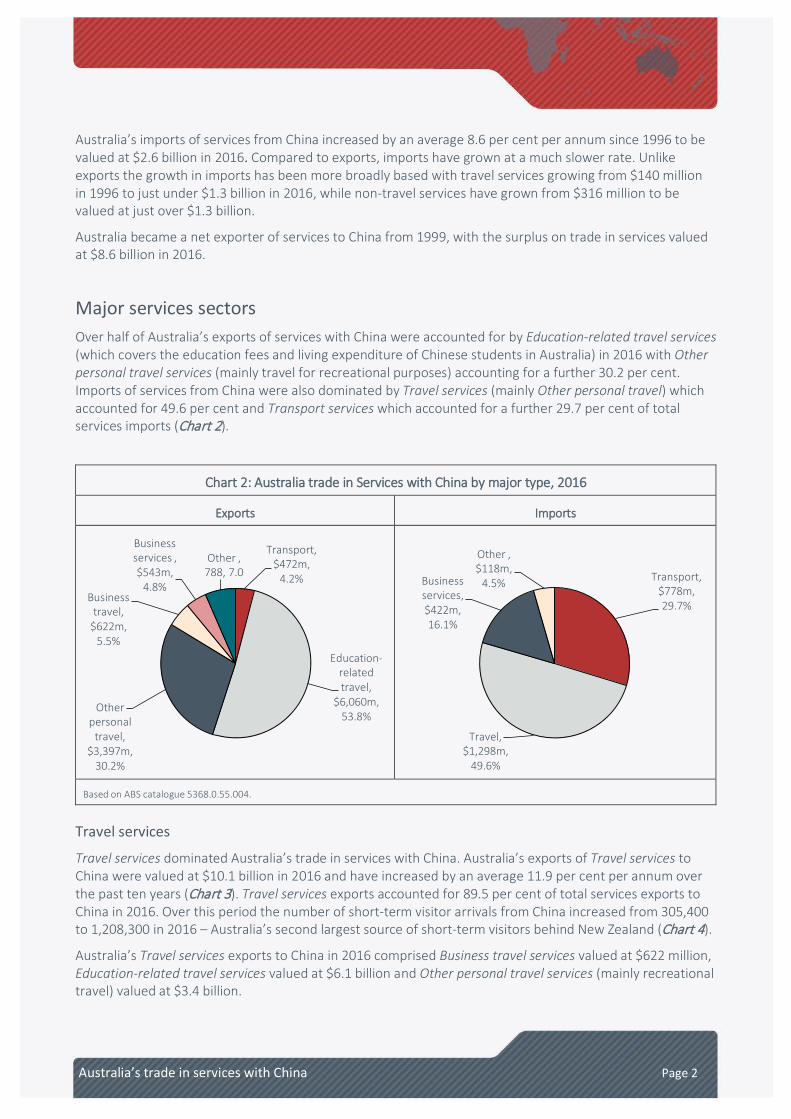
Major services sectors Over half of Australia’s exports of services with China were accounted for by Education-related travel services (which covers the education fees and living expenditure of Chinese students in Australia) in 2016 with Other personal travel services (mainly travel for recreational purposes) accounting for a further 30.2 per cent. Imports of services from China were also dominated by Travel services (mainly Other personal travel) which accounted for 49.6 per cent and Transport services which accounted for a further 29.7 per cent of total services imports (Chart 2).
Chart 2: Australia trade in Services with China by major type, 2016
Exports Imports
Based on ABS catalogue 5368.0.55.004.
Travel services
Travel services dominated Australia’s trade in services with China. Australia’s exports of Travel services to China were valued at $10.1 billion in 2016 and have increased by an average 11.9 per cent per annum over the past ten years (Chart 3). Travel services exports accounted for 89.5 per cent of total services exports to China in 2016. Over this period the number of short-term visitor arrivals from China increased from 305,400 to 1,208,300 in 2016 – Australia’s second largest source of short-term visitors behind New Zealand (Chart 4).
Australia’s Travel services exports to China in 2016 comprised Business travel services valued at $622 million, Education-related travel services valued at $6.1 billion and Other personal travel services (mainly recreational travel) valued at $3.4 billion.
Transport, $472m,
4.2%
Education-related travel,
$6,060m, 53.8%
Other personal
travel, $3,397m,
30.2%
Business travel,
$622m, 5.5%
Businessservices , $543m,
4.8%
Other , 788, 7.0 Transport,
$778m, 29.7%
Travel, $1,298m,
49.6%
Business services, $422m, 16.1%
Other , $118m,
4.5%

Australia’s trade in services with China Page 3
Chart 3: Australia's trade in Travel services with China
Based on ABS catalogue 536.0.55.004.
Education-related travel services exports
Education-related travel services are the most important Australian services export to China and accounted for 53.8 per cent of total services exports in 2016 (Chart 5). China is Australia’s largest market for these services. However, growth in exports has not been consistent over this period. Strong growth in Education-related travel services occurred between 2006 and 2010, up from $2.3 billion to $4.0 billion in 2010. Student numbers subsequently declined from 123,234 to 110,700 between 2010 and 2013.
Chart 4: Short-term China visitors and Australian resident departures
Chart 5: Exports of Education-related travel services
Based on ABS catalogue 3401.0. Student numbers only available from 2008 onwards.
Based on ABS catalogue 5368.0.55.004 & Department of Education & Training.
0
2
4
6
8
10
12
2006 2008 2010 2012 2014 2016
A$b
Exports Imports
0
200
400
600
800
1,000
1,200
1,400
2006 2008 2010 2012 2014 2016
000's
Arrivals Departures
0
40
80
120
160
0
2
4
6
8
2006 2008 2010 2012 2014 2016
A$b
Exports (A$b) LHSStudent numbers (000's) RHS
000's
Australia’s trade in services with China Page 4
This fall between 2010 and 2013 was due to a range of issues, including concerns with the quality of some vocational education institutions in Australia, changes to student visa criteria, the high Australian exchange rate (making the cost of education in Australia more expensive) and concerns for the personal security of international students in Australia.
Since 2013 Education-related travel services has rebounded quickly with exports growing from $4.1 billion to $6.1 billion in 2016 with most of the concerns that drove the fall having abated or been addressed. Student numbers increased strongly from 110,700 to 157,000 over the same period.
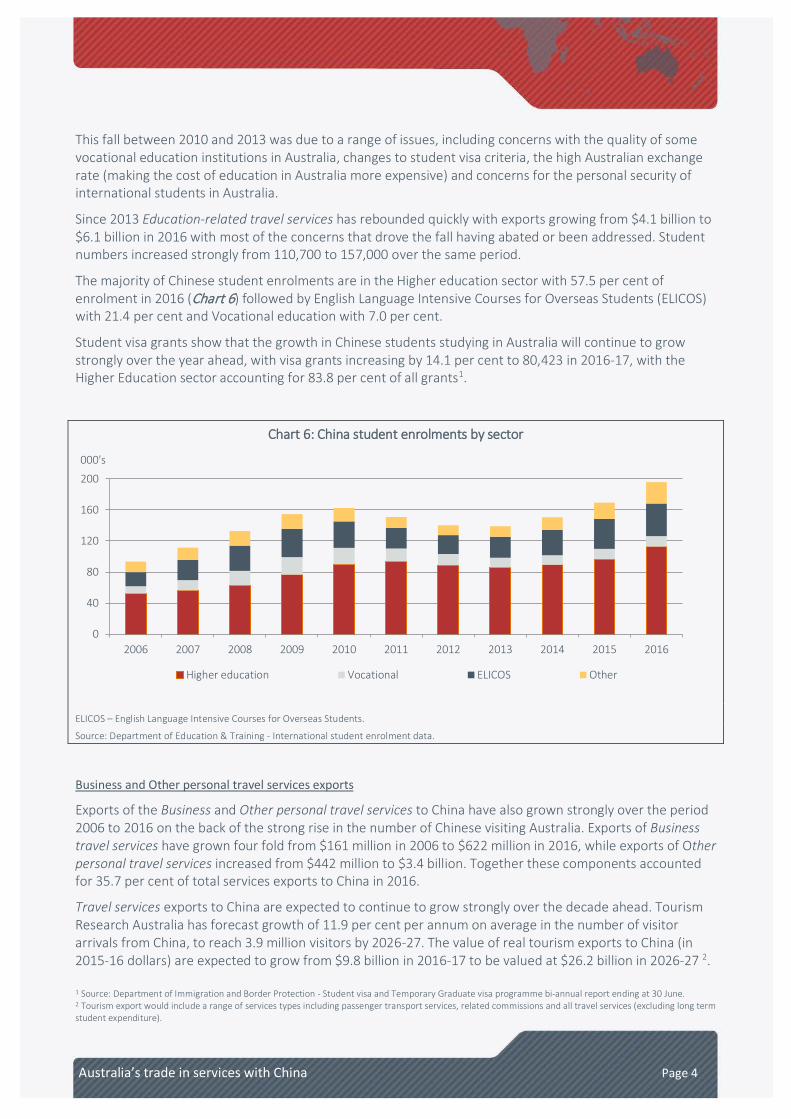
The majority of Chinese student enrolments are in the Higher education sector with 57.5 per cent of enrolment in 2016 (Chart 6) followed by English Language Intensive Courses for Overseas Students (ELICOS) with 21.4 per cent and Vocational education with 7.0 per cent.
Student visa grants show that the growth in Chinese students studying in Australia will continue to grow strongly over the year ahead, with visa grants increasing by 14.1 per cent to 80,423 in 2016-17, with the Higher Education sector accounting for 83.8 per cent of all grants1.
Chart 6: China student enrolments by sector
ELICOS – English Language Intensive Courses for Overseas Students.
Source: Department of Education & Training - International student enrolment data.
Business and Other personal travel services exports
Exports of the Business and Other personal travel services to China have also grown strongly over the period 2006 to 2016 on the back of the strong rise in the number of Chinese visiting Australia. Exports of Business travel services have grown four fold from $161 million in 2006 to $622 million in 2016, while exports of Other personal travel services increased from $442 million to $3.4 billion. Together these components accounted for 35.7 per cent of total services exports to China in 2016.
Travel services exports to China are expected to continue to grow strongly over the decade ahead. Tourism Research Australia has forecast growth of 11.9 per cent per annum on average in the number of visitor arrivals from China, to reach 3.9 million visitors by 2026-27. The value of real tourism exports to China (in 2015-16 dollars) are expected to grow from $9.8 billion in 2016-17 to be valued at $26.2 billion in 2026-27 2.
1 Source: Department of Immigration and Border Protection - Student visa and Temporary Graduate visa programme bi-annual report ending at 30 June. 2 Tourism export would include a range of services types including passenger transport services, related commissions and all travel services (excluding long term student expenditure).
0
40
80
120
160
200
2006 2007 2008 2009 2010 2011 2012 2013 2014 2015 2016
000's
Higher education Vocational ELICOS Other
Australia’s trade in services with China Page 5
Chinese business travellers will grow by 3.2 per cent per annum on average while Chinese visitors here for holiday will increase by 14.1 per cent per annum over the same time period3.
Travel services imports
Australia’s imports of Travel services from China increased by an average 3.8 per cent per annum over the past ten years to be valued at $1.3 billion in 2016. Travel services imports accounted for 49.6 per cent of Australia’s imports of services from China. Over this period the number of short-term Australian resident departures to China increased from 250,900 to 455,000 in 2016.
Australia’s Travel services imports from China in 2016 comprised Business travel services valued at $261 million, Education-related travel services valued at $103 million and Other personal travel services valued at $934 million.
Other personal travel services dominated imports of Travel services from China (accounting for 72.0 per cent of total Travel services imports). This series has grown by an average 5.2 per over the past ten years.
Transport services
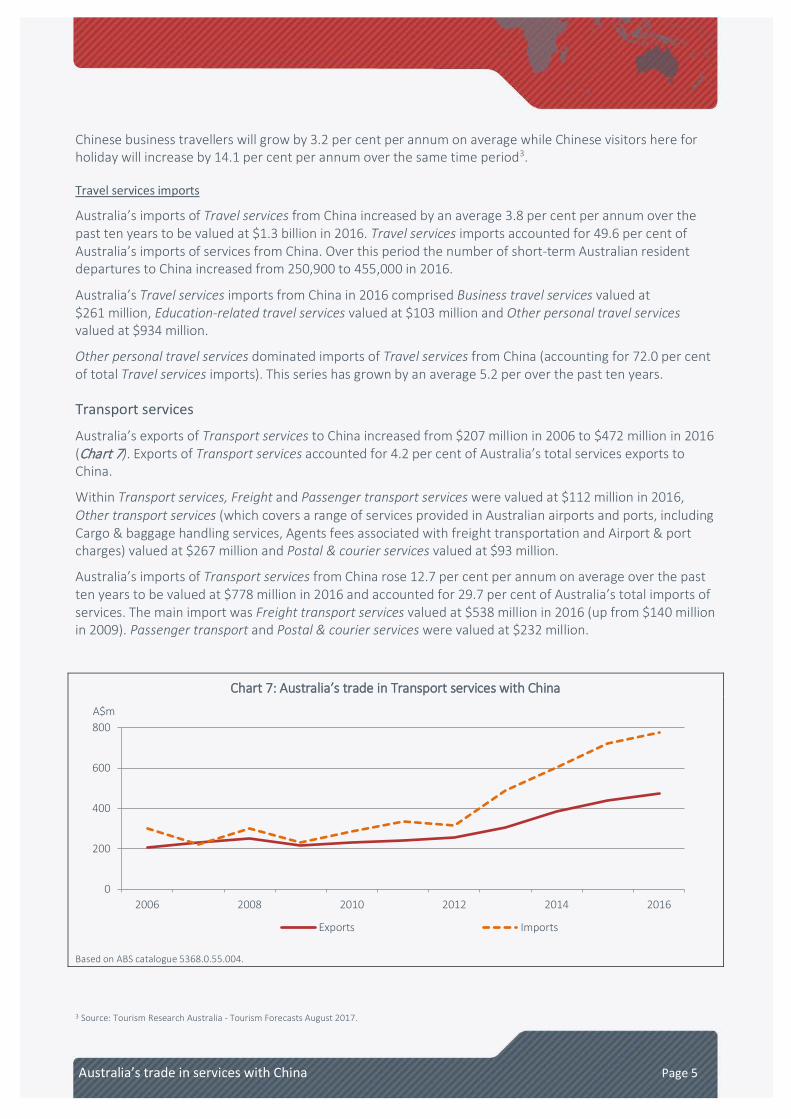
Australia’s exports of Transport services to China increased from $207 million in 2006 to $472 million in 2016 (Chart 7). Exports of Transport services accounted for 4.2 per cent of Australia’s total services exports to China.
Within Transport services, Freight and Passenger transport services were valued at $112 million in 2016, Other transport services (which covers a range of services provided in Australian airports and ports, including Cargo & baggage handling services, Agents fees associated with freight transportation and Airport & port charges) valued at $267 million and Postal & courier services valued at $93 million.
Australia’s imports of Transport services from China rose 12.7 per cent per annum on average over the past ten years to be valued at $778 million in 2016 and accounted for 29.7 per cent of Australia’s total imports of services. The main import was Freight transport services valued at $538 million in 2016 (up from $140 million in 2009). Passenger transport and Postal & courier services were valued at $232 million.
Chart 7: Australia’s trade in Transport services with China
Based on ABS catalogue 5368.0.55.004.
3 Source: Tourism Research Australia - Tourism Forecasts August 2017.
0
200
400
600
800
2006 2008 2010 2012 2014 2016
A$m
Exports Imports
Australia’s trade in services with China Page 6
Box A: Exports and imports of Passenger services
The Australian Bureau of Statistics (ABS) does not publish a breakdown of Passenger transport services exports and imports with China4. Using data sourced from the Department of Immigration and Border Protection (DIBP) overseas arrivals and departure statistics, more information can be obtained on the trends in Australia’s Passenger services exports and imports with China.
Before analysing this data it is necessary to clarify what the ABS defines as an export and import of Passenger services in Australia’s Balance of Payments statistics. Exports are defined as non-residents flying internationally on Australian resident carriers (e.g. a foreign traveller flying on Qantas from China to Australia) while imports are defined as Australian residents flying internationally on non-resident carriers (e.g. an Australian flying on China Eastern Airlines from China to Australia). Australian residents flying internationally on resident carriers are not an Australian export (Australian domestic transaction) while non-residents flying internationally on non-resident carriers are not an Australian import (rest of the world transaction).
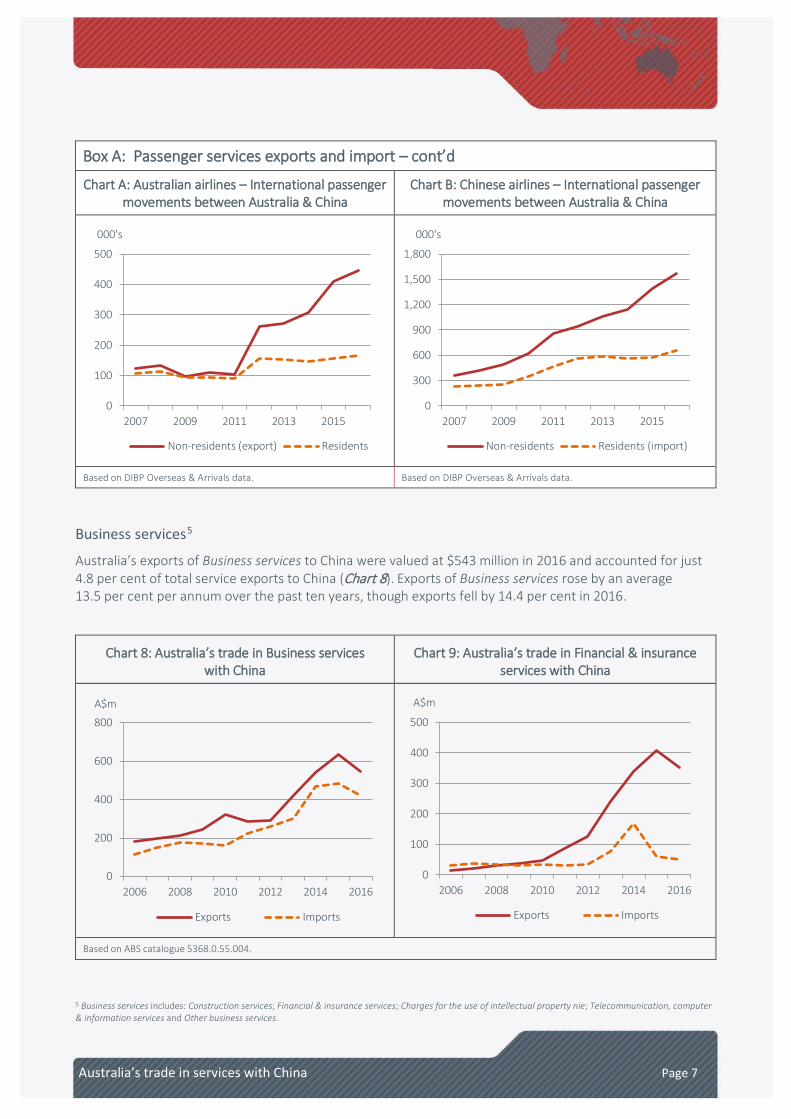
Chart A shows the number of travellers flying on Australia’s resident airlines between Australia and China between 2007 and 2016. In 2007, 228,900 people travelled between Australia and China on Australian resident carriers, of which 54.1 per cent were foreign travellers (123,800) – i.e. an export. By 2016 the number of travellers on Australian resident airlines had increased to 612,000. However the share of foreign travellers had risen to 72.7 per cent (or 445,000). Foreign travellers on Australian resident airlines have grown by an average of 19.2 per cent per annum over this period (compared to an average increase of only 6.6 per cent per annum for resident travellers) - which represents strong growth in passenger services exports. The rising share of foreign travellers on resident airlines has been one of the main reasons behind the rise in Australian exports of Transport services to the China over this period.
Chart B shows the number of travellers flying on Chinese airlines between 2007 and 2016. In 2007, 590,300 people travelled between Australia and China on Chinese carriers, of which 38.0 per cent were Australian travellers (224,500) – i.e. an import. By 2016 the number of travellers on Chinese airlines had increased to 2,225,000. However the share of Australian travellers had fallen to 29.6 per cent (or 659,000). Australian travellers on Chinese airlines have only grown by an average of 13.9 per cent per annum over this period (compared to an average increase of 18.0 per cent per annum for Chinese travellers to over 1.5 million). Therefore the growth in imports of Passenger services has made up only a small component of the overall growth in imports of Transport services from China over the period.
The tripling in airline capacity (both resident and non-resident airlines) over the period (from 819,200 movements in 2007 to 2,837,000 in 2016) has been critical to supporting the recent Chinese tourist boom to Australia.
4 Data is suppressed due to business confidentiality.
Australia’s trade in services with China Page 7
Business services5
Australia’s exports of Business services to China were valued at $543 million in 2016 and accounted for just 4.8 per cent of total service exports to China (Chart 8). Exports of Business services rose by an average 13.5 per cent per annum over the past ten years, though exports fell by 14.4 per cent in 2016.
Chart 8: Australia’s trade in Business services with China
Chart 9: Australia’s trade in Financial & insurance services with China
Based on ABS catalogue 5368.0.55.004.
5 Business services includes: Construction services; Financial & insurance services; Charges for the use of intellectual property nie; Telecommunication, computer & information services and Other business services.
0
200
400
600
800
2006 2008 2010 2012 2014 2016
A$m
Exports Imports
0
100
200
300
400
500
2006 2008 2010 2012 2014 2016
A$m
Exports Imports
Box A: Passenger services exports and import – cont’d
Chart A: Australian airlines – International passenger movements between Australia & China
Chart B: Chinese airlines – International passenger movements between Australia & China
Based on DIBP Overseas & Arrivals data. Based on DIBP Overseas & Arrivals data.
0
100
200
300
400
500
2007 2009 2011 2013 2015
000's
Non-residents (export) Residents
0
300
600
900
1,200
1,500
1,800
2007 2009 2011 2013 2015
000's
Non-residents Residents (import)
Australia’s trade in services with China Page 8
Imports of Business services from China were valued at $422 million and accounted for 16.1 per cent of total service imports from China in 2016. Imports of Business services have increased by an average 15.4 per cent per annum over the past ten years but as with exports, fell in 2016 by 12.8 per cent. Within Business services the major services were:
Financial and Insurance services
Exports of Financial and Insurance services to China increased by an average 43.5 per cent per annum over the past ten years to be valued at $353 million in 2016. Chart 9 shows that these services rose strongly from 2010 to 2015, up from $47 million to $408 million before falling in 2016. The main reason for the strong growth was Financial services (up from $13 million in 2010 to $317 million in 2016). China was Australia’s third largest market for Financial services in 2016. Imports of Financial and Insurance services from China also follow a similar growth pattern. Imports grew strongly from 2010 to 2014, up from $34 million to $167 million before falling to $51 million in 2016.
Telecommunication, computer & information services
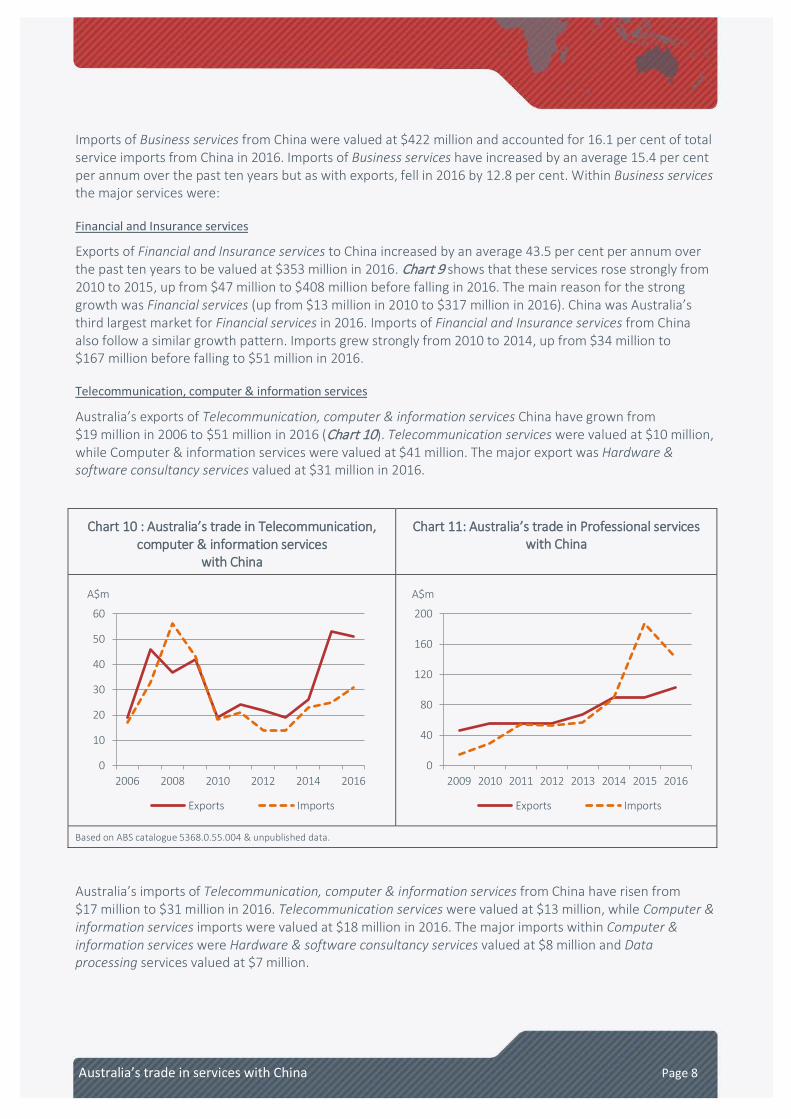
Australia’s exports of Telecommunication, computer & information services China have grown from $19 million in 2006 to $51 million in 2016 (Chart 10). Telecommunication services were valued at $10 million, while Computer & information services were valued at $41 million. The major export was Hardware & software consultancy services valued at $31 million in 2016.
Chart 10 : Australia’s trade in Telecommunication, computer & information services
with China
Chart 11: Australia’s trade in Professional services with China
Based on ABS catalogue 5368.0.55.004 & unpublished data.
Australia’s imports of Telecommunication, computer & information services from China have risen from $17 million to $31 million in 2016. Telecommunication services were valued at $13 million, while Computer & information services imports were valued at $18 million in 2016. The major imports within Computer & information services were Hardware & software consultancy services valued at $8 million and Data processing services valued at $7 million.
0
10
20
30
40
50
60
2006 2008 2010 2012 2014 2016
A$m
Exports Imports
0
40
80
120
160
200
2009 2010 2011 2012 2013 2014 2015 2016
A$m
Exports Imports
Australia’s trade in services with China Page 9
Professional services6
Australia’s exports of Professional services to China have grown from $46 million in 2009 to $103 million in 2016. (Chart 11). The major professional services exports to China in 2016 were Management fees7 valued at $42 million and Legal services valued at $26 million.
Imports of Professional services from China have grown from $15 million in 2009 to $143 million in 2016. The major Professional services imported from China in 2016 were Management fees valued at $81 million and Advertising services valued at $44 million.
Technical & other business services8
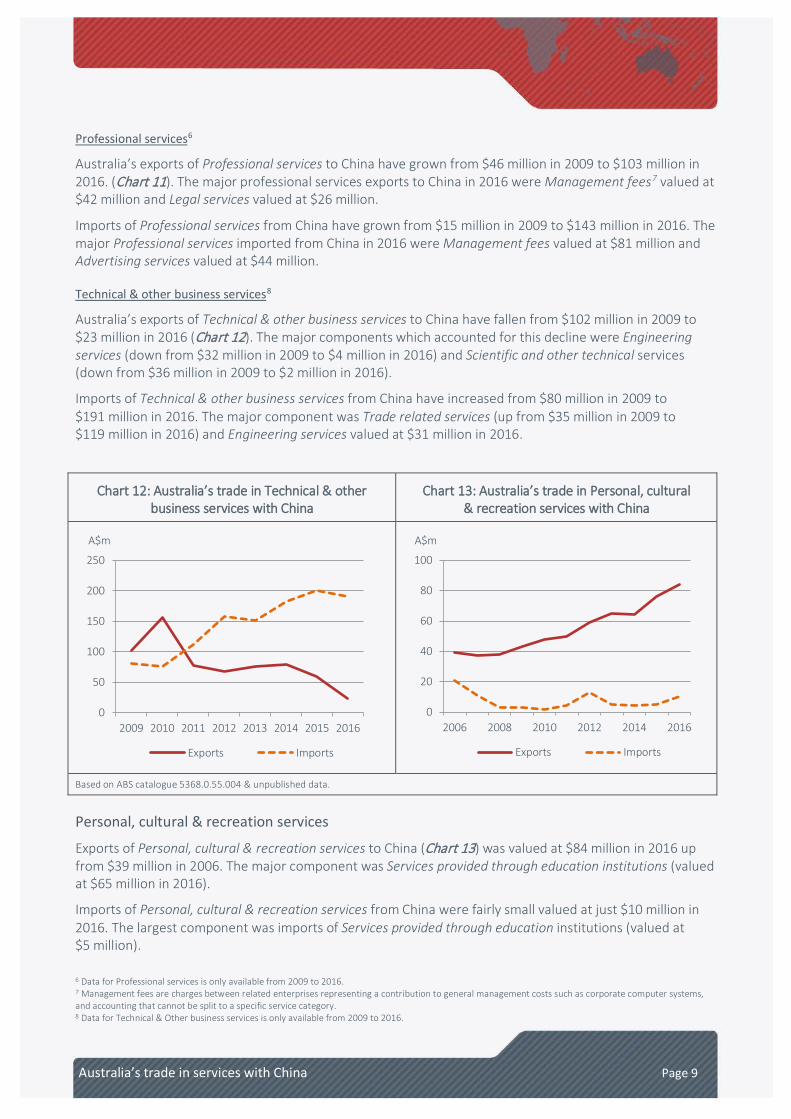
Australia’s exports of Technical & other business services to China have fallen from $102 million in 2009 to $23 million in 2016 (Chart 12). The major components which accounted for this decline were Engineering services (down from $32 million in 2009 to $4 million in 2016) and Scientific and other technical services (down from $36 million in 2009 to $2 million in 2016).
Imports of Technical & other business services from China have increased from $80 million in 2009 to $191 million in 2016. The major component was Trade related services (up from $35 million in 2009 to $119 million in 2016) and Engineering services valued at $31 million in 2016.
Chart 12: Australia’s trade in Technical & other business services with China
Chart 13: Australia’s trade in Personal, cultural & recreation services with China
Based on ABS catalogue 5368.0.55.004 & unpublished data.
Personal, cultural & recreation services
Exports of Personal, cultural & recreation services to China (Chart 13) was valued at $84 million in 2016 up from $39 million in 2006. The major component was Services provided through education institutions (valued at $65 million in 2016).
Imports of Personal, cultural & recreation services from China were fairly small valued at just $10 million in 2016. The largest component was imports of Services provided through education institutions (valued at $5 million).
6 Data for Professional services is only available from 2009 to 2016. 7 Management fees are charges between related enterprises representing a contribution to general management costs such as corporate computer systems, and accounting that cannot be split to a specific service category. 8 Data for Technical & Other business services is only available from 2009 to 2016.
0
50
100
150
200
250
2009 2010 2011 2012 2013 2014 2015 2016
A$m
Exports Imports
0
20
40
60
80
100
2006 2008 2010 2012 2014 2016
A$m
Exports Imports
Australia’s trade in services with China Page 10
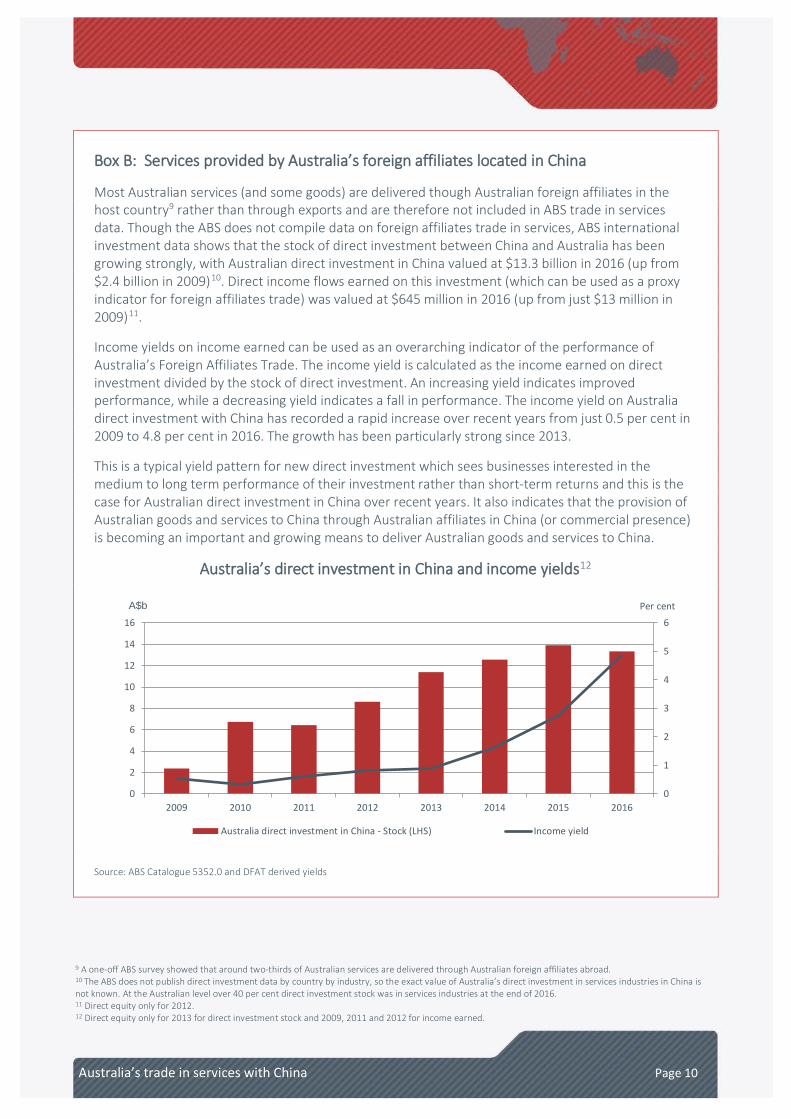
Box B: Services provided by Australia’s foreign affiliates located in China
Most Australian services (and some goods) are delivered though Australian foreign affiliates in the host country9 rather than through exports and are therefore not included in ABS trade in services data. Though the ABS does not compile data on foreign affiliates trade in services, ABS international investment data shows that the stock of direct investment between China and Australia has been growing strongly, with Australian direct investment in China valued at $13.3 billion in 2016 (up from $2.4 billion in 2009)10. Direct income flows earned on this investment (which can be used as a proxy indicator for foreign affiliates trade) was valued at $645 million in 2016 (up from just $13 million in 2009)11.
Income yields on income earned can be used as an overarching indicator of the performance of Australia’s Foreign Affiliates Trade. The income yield is calculated as the income earned on direct investment divided by the stock of direct investment. An increasing yield indicates improved performance, while a decreasing yield indicates a fall in performance. The income yield on Australia direct investment with China has recorded a rapid increase over recent years from just 0.5 per cent in 2009 to 4.8 per cent in 2016. The growth has been particularly strong since 2013.
This is a typical yield pattern for new direct investment which sees businesses interested in the medium to long term performance of their investment rather than short-term returns and this is the case for Australian direct investment in China over recent years. It also indicates that the provision of Australian goods and services to China through Australian affiliates in China (or commercial presence) is becoming an important and growing means to deliver Australian goods and services to China.
Australia’s direct investment in China and income yields12
Source: ABS Catalogue 5352.0 and DFAT derived yields
9 A one-off ABS survey showed that around two-thirds of Australian services are delivered through Australian foreign affiliates abroad. 10 The ABS does not publish direct investment data by country by industry, so the exact value of Australia’s direct investment in services industries in China is not known. At the Australian level over 40 per cent direct investment stock was in services industries at the end of 2016. 11 Direct equity only for 2012. 12 Direct equity only for 2013 for direct investment stock and 2009, 2011 and 2012 for income earned.
0
1
2
3
4
5
6
0
2
4
6
8
10
12
14
16
2009 2010 2011 2012 2013 2014 2015 2016
Australia direct investment in China - Stock (LHS) Income yield
A$b Per cent
Australia’s trade in services with China Page 11
Conclusion China is a key services trading partner for Australia and trade has grown from $4.6 billion in 2006 to $13.9 billion in 2016. China is Australia’s largest services export market.
Australia’s export profile is dominated by Education-related travel services which accounted for nearly 54 per cent of all services exports to China in 2016. The other major service export is Other personal travel services which accounted for 30.2 per cent of all exports to China. The strong growth in these services have been supported by the increase in both Chinese students and Chinese tourists coming to Australia. The strong growth in these visitors has also supported the growth in exports of Transport services.
Official statistics of exports of Business services remain small in comparison. However many of these services are not included in ABS trade in services statistics but are supplied through Australian affiliates located in China.
Travel and Transport services dominated imports accounting for almost 80 per cent of total services imports from China.
Author: Frank Bingham Statistics Section Office of Economic Analysis [email protected]
Published: January 2018
Australia’s trade in services with China Page 12
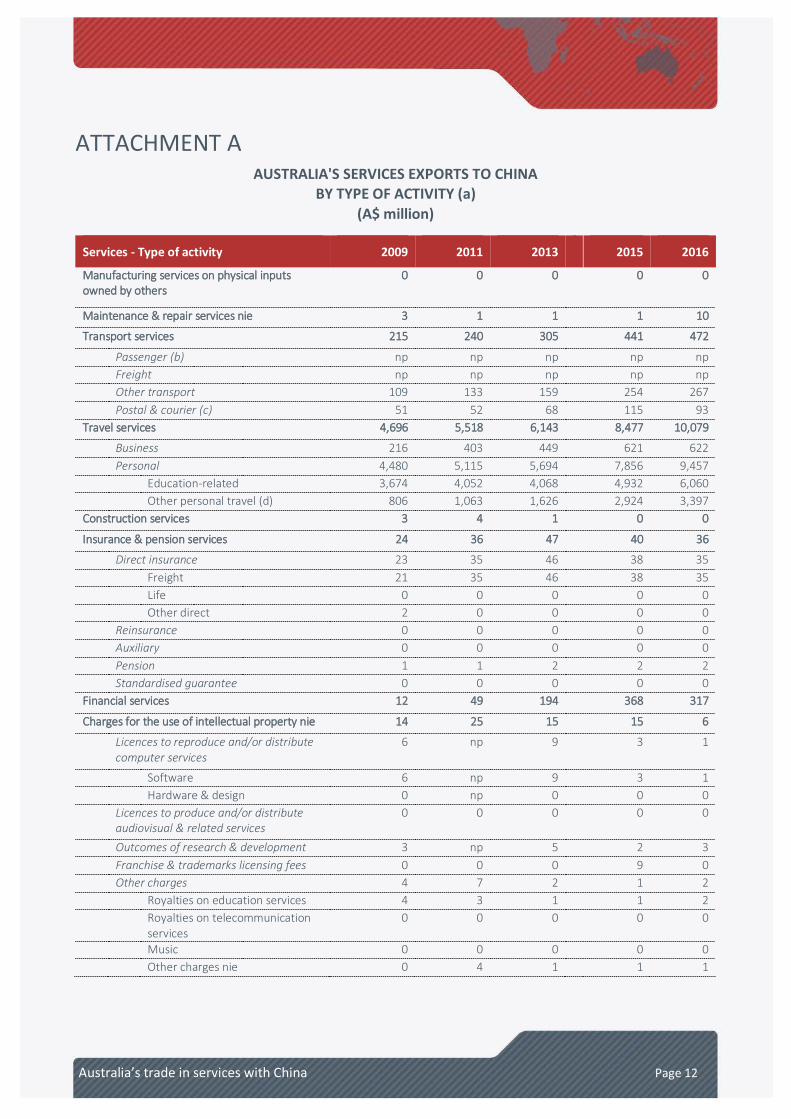
ATTACHMENT A AUSTRALIA'S SERVICES EXPORTS TO CHINA
BY TYPE OF ACTIVITY (a) (A$ million)
Services - Type of activity 2009 2011 2013 2015 2016
Manufacturing services on physical inputs owned by others
0 0 0 0 0
Maintenance & repair services nie 3 1 1 1 10
Transport services 215 240 305 441 472
Passenger (b) np np np np np Freight np np np np np Other transport 109 133 159 254 267 Postal & courier (c) 51 52 68 115 93 Travel services 4,696 5,518 6,143 8,477 10,079
Business 216 403 449 621 622 Personal 4,480 5,115 5,694 7,856 9,457 Education-related 3,674 4,052 4,068 4,932 6,060 Other personal travel (d) 806 1,063 1,626 2,924 3,397 Construction services 3 4 1 0 0
Insurance & pension services 24 36 47 40 36
Direct insurance 23 35 46 38 35 Freight 21 35 46 38 35 Life 0 0 0 0 0 Other direct 2 0 0 0 0 Reinsurance 0 0 0 0 0 Auxiliary 0 0 0 0 0 Pension 1 1 2 2 2 Standardised guarantee 0 0 0 0 0 Financial services 12 49 194 368 317
Charges for the use of intellectual property nie 14 25 15 15 6
Licences to reproduce and/or distribute computer services
6 np 9 3 1
Software 6 np 9 3 1 Hardware & design 0 np 0 0 0 Licences to produce and/or distribute
audiovisual & related services 0 0 0 0 0
Outcomes of research & development 3 np 5 2 3 Franchise & trademarks licensing fees 0 0 0 9 0 Other charges 4 7 2 1 2 Royalties on education services 4 3 1 1 2 Royalties on telecommunication
services 0 0 0 0 0
Music 0 0 0 0 0 Other charges nie 0 4 1 1 1
Australia’s trade in services with China Page 13
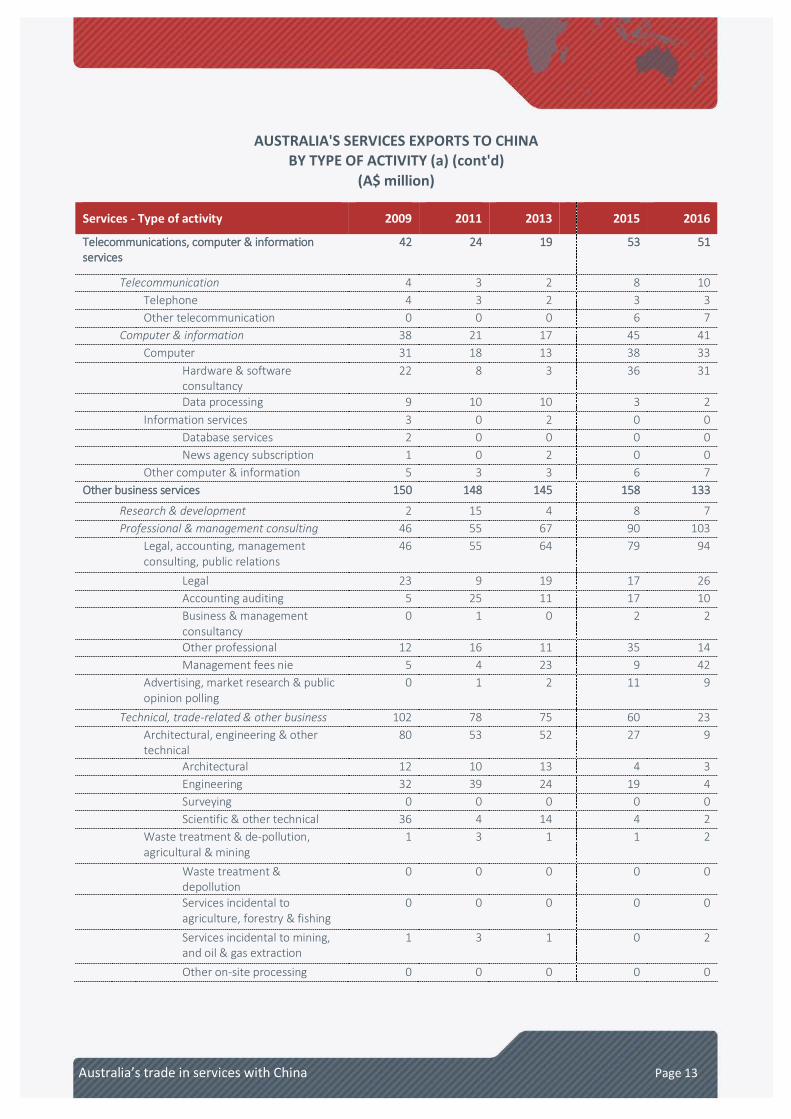
AUSTRALIA'S SERVICES EXPORTS TO CHINA BY TYPE OF ACTIVITY (a) (cont'd)
(A$ million)
Services - Type of activity 2009 2011 2013 2015 2016
Telecommunications, computer & information services
42 24 19 53 51
Telecommunication 4 3 2 8 10 Telephone 4 3 2 3 3 Other telecommunication 0 0 0 6 7 Computer & information 38 21 17 45 41 Computer 31 18 13 38 33 Hardware & software
consultancy 22 8 3 36 31
Data processing 9 10 10 3 2 Information services 3 0 2 0 0 Database services 2 0 0 0 0 News agency subscription 1 0 2 0 0 Other computer & information 5 3 3 6 7 Other business services 150 148 145 158 133
Research & development 2 15 4 8 7 Professional & management consulting 46 55 67 90 103 Legal, accounting, management
consulting, public relations 46 55 64 79 94
Legal 23 9 19 17 26 Accounting auditing 5 25 11 17 10 Business & management
consultancy 0 1 0 2 2
Other professional 12 16 11 35 14 Management fees nie 5 4 23 9 42 Advertising, market research & public
opinion polling 0 1 2 11 9
Technical, trade-related & other business 102 78 75 60 23 Architectural, engineering & other
technical 80 53 52 27 9
Architectural 12 10 13 4 3 Engineering 32 39 24 19 4 Surveying 0 0 0 0 0 Scientific & other technical 36 4 14 4 2 Waste treatment & de-pollution,
agricultural & mining 1 3 1 1 2
Waste treatment & depollution
0 0 0 0 0
Services incidental to agriculture, forestry & fishing
0 0 0 0 0
Services incidental to mining, and oil & gas extraction
1 3 1 0 2
Other on-site processing 0 0 0 0 0
Australia’s trade in services with China Page 14
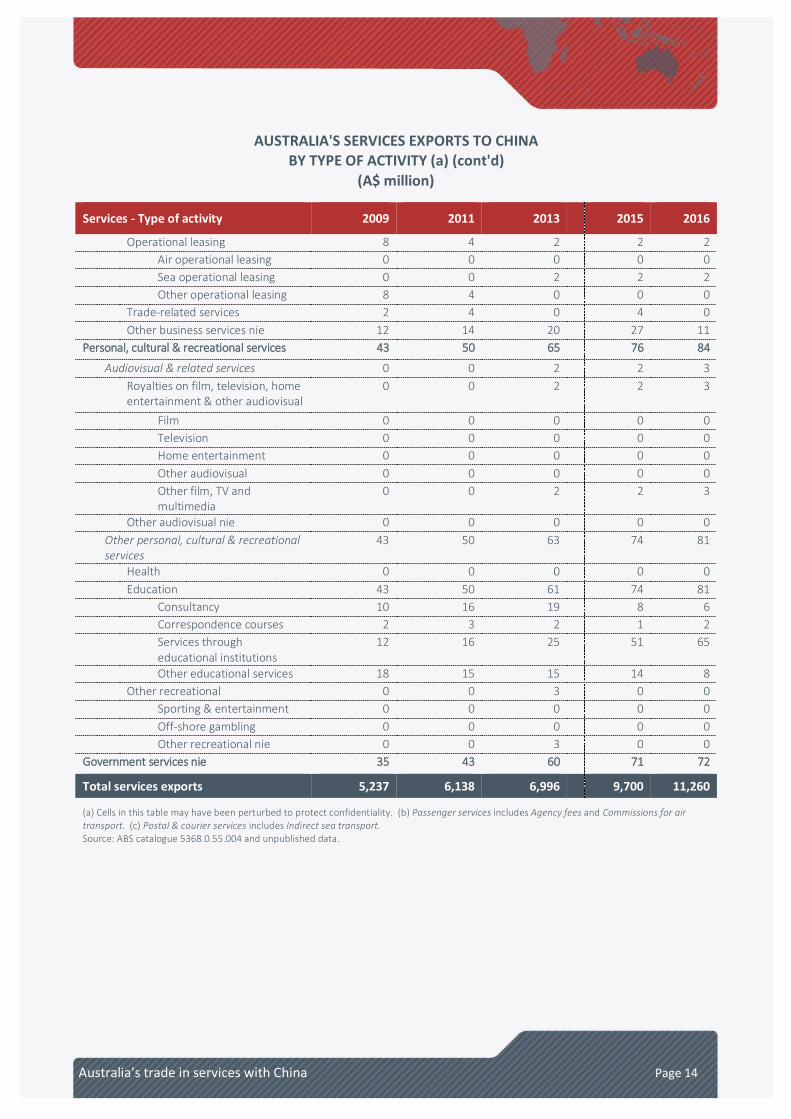
AUSTRALIA'S SERVICES EXPORTS TO CHINA BY TYPE OF ACTIVITY (a) (cont'd)
(A$ million)
Services - Type of activity 2009 2011 2013 2015 2016
Operational leasing 8 4 2 2 2 Air operational leasing 0 0 0 0 0 Sea operational leasing 0 0 2 2 2 Other operational leasing 8 4 0 0 0 Trade-related services 2 4 0 4 0 Other business services nie 12 14 20 27 11 Personal, cultural & recreational services 43 50 65 76 84
Audiovisual & related services 0 0 2 2 3 Royalties on film, television, home
entertainment & other audiovisual 0 0 2 2 3
Film 0 0 0 0 0 Television 0 0 0 0 0 Home entertainment 0 0 0 0 0 Other audiovisual 0 0 0 0 0 Other film, TV and
multimedia 0 0 2 2 3
Other audiovisual nie 0 0 0 0 0 Other personal, cultural & recreational
services 43 50 63 74 81
Health 0 0 0 0 0 Education 43 50 61 74 81 Consultancy 10 16 19 8 6 Correspondence courses 2 3 2 1 2 Services through
educational institutions 12 16 25 51 65
Other educational services 18 15 15 14 8 Other recreational 0 0 3 0 0 Sporting & entertainment 0 0 0 0 0 Off-shore gambling 0 0 0 0 0 Other recreational nie 0 0 3 0 0 Government services nie 35 43 60 71 72
Total services exports 5,237 6,138 6,996 9,700 11,260
(a) Cells in this table may have been perturbed to protect confidentiality. (b) Passenger services includes Agency fees and Commissions for air transport. (c) Postal & courier services includes Indirect sea transport. Source: ABS catalogue 5368.0.55.004 and unpublished data.
Australia’s trade in services with China Page 15
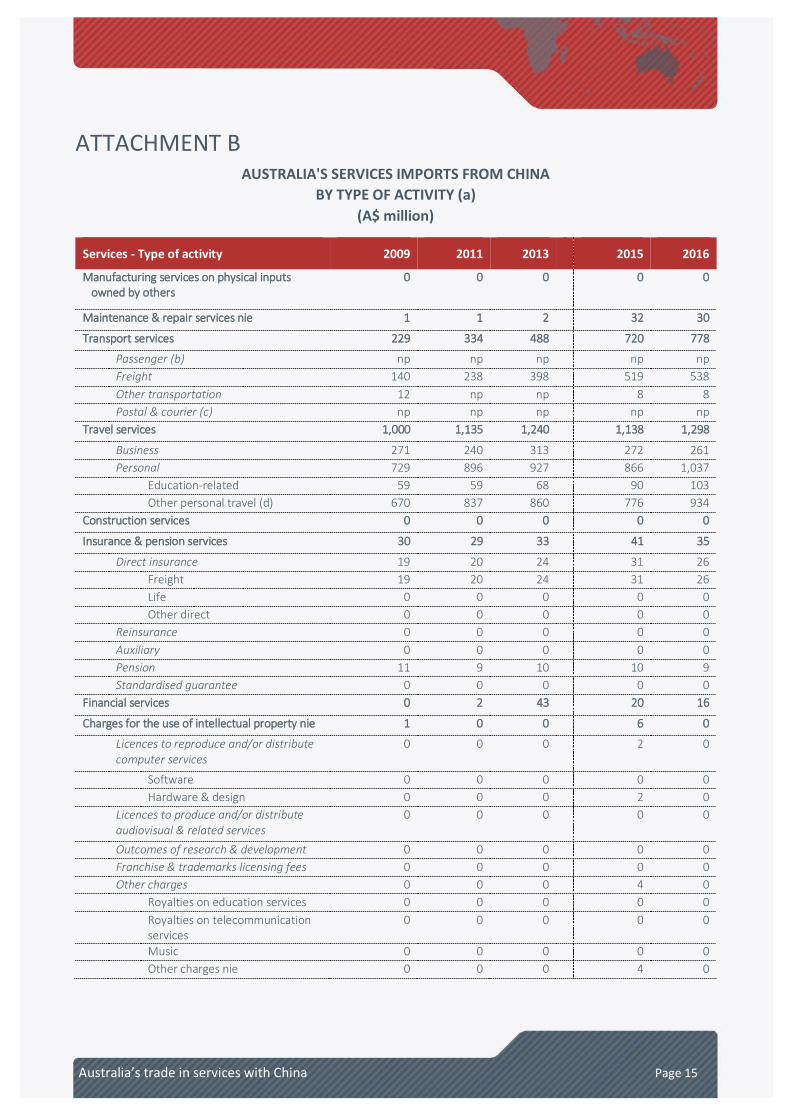
ATTACHMENT B AUSTRALIA'S SERVICES IMPORTS FROM CHINA
BY TYPE OF ACTIVITY (a) (A$ million)
Services - Type of activity 2009 2011 2013 2015 2016
Manufacturing services on physical inputs owned by others
0 0 0 0 0
Maintenance & repair services nie 1 1 2 32 30
Transport services 229 334 488 720 778
Passenger (b) np np np np np Freight 140 238 398 519 538 Other transportation 12 np np 8 8 Postal & courier (c) np np np np np Travel services 1,000 1,135 1,240 1,138 1,298
Business 271 240 313 272 261 Personal 729 896 927 866 1,037 Education-related 59 59 68 90 103 Other personal travel (d) 670 837 860 776 934 Construction services 0 0 0 0 0
Insurance & pension services 30 29 33 41 35
Direct insurance 19 20 24 31 26 Freight 19 20 24 31 26 Life 0 0 0 0 0 Other direct 0 0 0 0 0 Reinsurance 0 0 0 0 0 Auxiliary 0 0 0 0 0 Pension 11 9 10 10 9 Standardised guarantee 0 0 0 0 0 Financial services 0 2 43 20 16
Charges for the use of intellectual property nie 1 0 0 6 0
Licences to reproduce and/or distribute computer services
0 0 0 2 0
Software 0 0 0 0 0 Hardware & design 0 0 0 2 0 Licences to produce and/or distribute
audiovisual & related services 0 0 0 0 0
Outcomes of research & development 0 0 0 0 0 Franchise & trademarks licensing fees 0 0 0 0 0 Other charges 0 0 0 4 0 Royalties on education services 0 0 0 0 0 Royalties on telecommunication
services 0 0 0 0 0
Music 0 0 0 0 0 Other charges nie 0 0 0 4 0
Australia’s trade in services with China Page 16
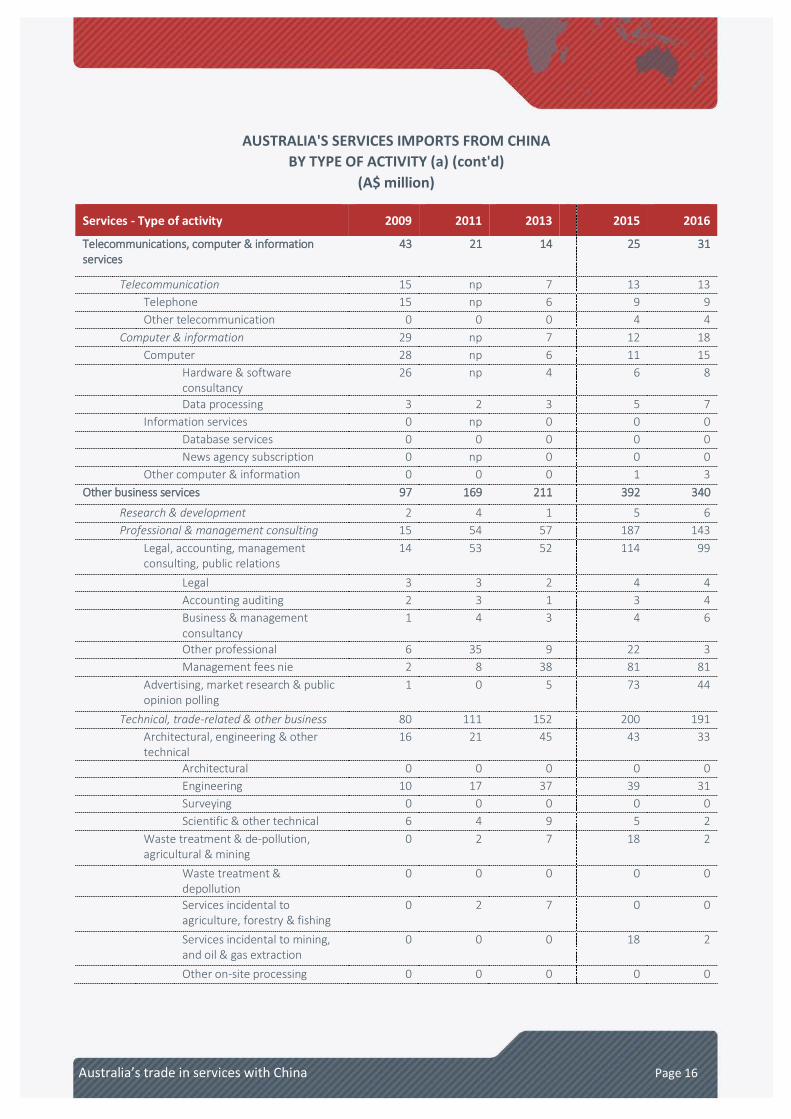
AUSTRALIA'S SERVICES IMPORTS FROM CHINA BY TYPE OF ACTIVITY (a) (cont'd)
(A$ million)
Services - Type of activity 2009 2011 2013 2015 2016
Telecommunications, computer & information services
43 21 14 25 31
Telecommunication 15 np 7 13 13 Telephone 15 np 6 9 9 Other telecommunication 0 0 0 4 4 Computer & information 29 np 7 12 18 Computer 28 np 6 11 15 Hardware & software
consultancy 26 np 4 6 8
Data processing 3 2 3 5 7 Information services 0 np 0 0 0 Database services 0 0 0 0 0 News agency subscription 0 np 0 0 0 Other computer & information 0 0 0 1 3 Other business services 97 169 211 392 340
Research & development 2 4 1 5 6 Professional & management consulting 15 54 57 187 143 Legal, accounting, management
consulting, public relations 14 53 52 114 99
Legal 3 3 2 4 4 Accounting auditing 2 3 1 3 4 Business & management
consultancy 1 4 3 4 6
Other professional 6 35 9 22 3 Management fees nie 2 8 38 81 81 Advertising, market research & public
opinion polling 1 0 5 73 44
Technical, trade-related & other business 80 111 152 200 191 Architectural, engineering & other
technical 16 21 45 43 33
Architectural 0 0 0 0 0 Engineering 10 17 37 39 31 Surveying 0 0 0 0 0 Scientific & other technical 6 4 9 5 2 Waste treatment & de-pollution,
agricultural & mining 0 2 7 18 2
Waste treatment & depollution
0 0 0 0 0
Services incidental to agriculture, forestry & fishing
0 2 7 0 0
Services incidental to mining, and oil & gas extraction
0 0 0 18 2
Other on-site processing 0 0 0 0 0
Australia’s trade in services with China Page 17
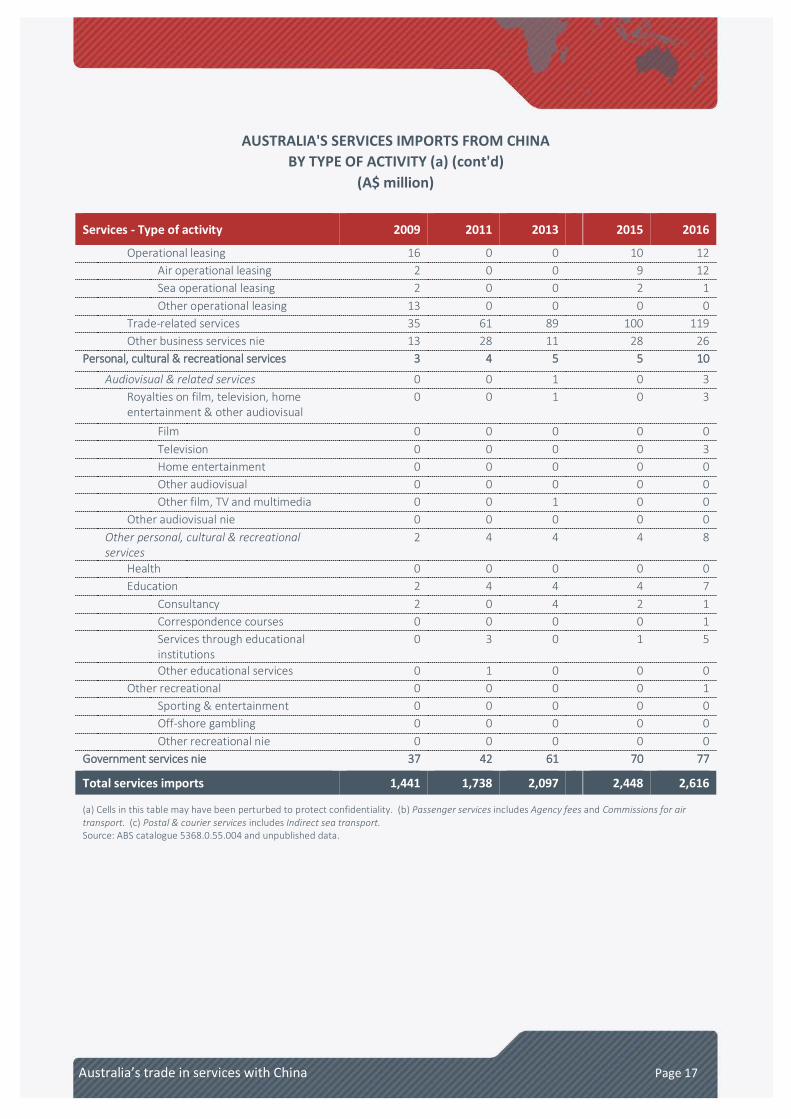
AUSTRALIA'S SERVICES IMPORTS FROM CHINA BY TYPE OF ACTIVITY (a) (cont'd)
(A$ million)
Services - Type of activity 2009 2011 2013 2015 2016
Operational leasing 16 0 0 10 12 Air operational leasing 2 0 0 9 12 Sea operational leasing 2 0 0 2 1 Other operational leasing 13 0 0 0 0 Trade-related services 35 61 89 100 119 Other business services nie 13 28 11 28 26 Personal, cultural & recreational services 3 4 5 5 10
Audiovisual & related services 0 0 1 0 3 Royalties on film, television, home
entertainment & other audiovisual 0 0 1 0 3
Film 0 0 0 0 0 Television 0 0 0 0 3 Home entertainment 0 0 0 0 0 Other audiovisual 0 0 0 0 0 Other film, TV and multimedia 0 0 1 0 0 Other audiovisual nie 0 0 0 0 0 Other personal, cultural & recreational
services 2 4 4 4 8
Health 0 0 0 0 0 Education 2 4 4 4 7 Consultancy 2 0 4 2 1 Correspondence courses 0 0 0 0 1 Services through educational
institutions 0 3 0 1 5
Other educational services 0 1 0 0 0 Other recreational 0 0 0 0 1 Sporting & entertainment 0 0 0 0 0 Off-shore gambling 0 0 0 0 0 Other recreational nie 0 0 0 0 0 Government services nie 37 42 61 70 77
Total services imports 1,441 1,738 2,097 2,448 2,616
(a) Cells in this table may have been perturbed to protect confidentiality. (b) Passenger services includes Agency fees and Commissions for air transport. (c) Postal & courier services includes Indirect sea transport. Source: ABS catalogue 5368.0.55.004 and unpublished data.