Australia’s health 016
15
Australia’s health 2016 Australian Institute of Health and Welfare 2016. Australia’s health 2016. Australia’s health series no. 15. Cat. no. AUS 199. Canberra: AIHW. Australia’s health 2016 Australia’s health 2016 6.14 Safety and quality in Australian hospitals The safety and quality of care provided to patients in Australia’s hospitals is of utmost importance to all patients, and it is a key focus for Australian governments and service providers. The definition of safety and quality can vary slightly, depending on source. Australia’s National Health Performance Framework (NHPF), defines safety as ‘the avoidance, or reduction to acceptable limits, of actual or potential harm from health care management or the environment in which health care is delivered’ (NHISSC 2009). The Australian Commission on Safety and Quality in Health Care (the Commission) defines safety as ‘reducing the risk of unnecessary harm associated with health care to an acceptable minimum’ (ACSQHC 2015). In the NHPF there is no specific ‘quality’ domain, as quality is described as relating to a number of domains including ‘Effectiveness’, ‘Continuity of care’, ‘Accessibility’ and ‘Responsiveness’ (see ‘Chapter 7.1 Indicators of Australia’s health’). The Commission defines quality as ‘the degree to which health services for individuals and populations increase the likelihood of desired health outcomes, and are consistent with current professional knowledge’ (ACSQHC 2015). The Commission is Australia’s key agency providing national leadership for improving health care safety and quality for both hospitals and other health care providers (see Box 6.14.1). There are also many other organisations integral to efforts to improve safety and quality at the state or territory level, or for particular components of the health sector. The efforts to improve safety and quality include public reporting of information on health care safety and quality, including that undertaken by the AIHW. These efforts are also accompanied by activities undertaken by health service providers to measure and monitor performance within their organisations to improve clinical outcomes and the appropriateness of services. This article summarises how information on the safety and quality of care in Australia’s hospitals is publicly reported. It presents information on the safety and quality measures that are routinely reported, including international comparisons. It also reports on the recent work of the Commission on variation in health care across Australia as it relates to the safety and quality of hospital care.
Transcript of Australia’s health 016

Australia’s health 2016
Australian Institute of Health and Welfare 2016. Australia’s health 2016. Australia’s health series no. 15. Cat. no. AUS 199. Canberra: AIHW.
Au
stra
lia
’s h
ea
lth
20
16
Au
stra
lia
’s h
ea
lth
20
16 6.14 Safety and quality in
Australian hospitals
The safety and quality of care provided to patients in Australia’s hospitals is of utmost importance to all patients, and it is a key focus for Australian governments and service providers.
The definition of safety and quality can vary slightly, depending on source. Australia’s National Health Performance Framework (NHPF), defines safety as ‘the avoidance, or reduction to acceptable limits, of actual or potential harm from health care management or the environment in which health care is delivered’ (NHISSC 2009). The Australian Commission on Safety and Quality in Health Care (the Commission) defines safety as ‘reducing the risk of unnecessary harm associated with health care to an acceptable minimum’ (ACSQHC 2015).
In the NHPF there is no specific ‘quality’ domain, as quality is described as relating to a number of domains including ‘Effectiveness’, ‘Continuity of care’, ‘Accessibility’ and ‘Responsiveness’ (see ‘Chapter 7.1 Indicators of Australia’s health’). The Commission defines quality as ‘the degree to which health services for individuals and populations increase the likelihood of desired health outcomes, and are consistent with current professional knowledge’ (ACSQHC 2015).
The Commission is Australia’s key agency providing national leadership for improving health care safety and quality for both hospitals and other health care providers (see Box 6.14.1). There are also many other organisations integral to efforts to improve safety and quality at the state or territory level, or for particular components of the health sector. The efforts to improve safety and quality include public reporting of information on health care safety and quality, including that undertaken by the AIHW. These efforts are also accompanied by activities undertaken by health service providers to measure and monitor performance within their organisations to improve clinical outcomes and the appropriateness of services.
This article summarises how information on the safety and quality of care in Australia’s hospitals is publicly reported. It presents information on the safety and quality measures that are routinely reported, including international comparisons. It also reports on the recent work of the Commission on variation in health care across Australia as it relates to the safety and quality of hospital care.
Australia’s health 2016
Australian Institute of Health and Welfare 2016. Australia’s health 2016. Australia’s health series no. 15. Cat. no. AUS 199. Canberra: AIHW.
Au
stra
lia
’s h
ea
lth
20
16
2
Au
stra
lia
’s h
ea
lth
20
16
Box 6.14.1: The Australian Commission on Safety and Quality in Health Care
The Commission is a national agency that leads and coordinates improvements in safety and quality in health care across Australia. The Commission engages in collaborative work in patient safety and health care quality that benefits service providers and receivers using the Australian health system including through:• provision of strategic advice to health ministers on best practices to improve
the safety and quality of health care• developing and supporting national clinical care standards • developing national health care safety and quality related indicators• working to reduce unwarranted variation in practice and outcomes for
individuals and populations • coordinating national action to address health care-associated infections and
antimicrobial resistance (ACSQHC 2015).
A key area of work for the Commission is the development and implementation of the first National Safety and Quality Health Service (NSQHS) Standards. The 10 NSQHS Standards provide a nationally consistent statement about the level of care consumers can expect from health services. All public and private hospitals in Australia are required to be accredited against these standards through an accreditation scheme developed by the Commission. The work of the Commission supports the implementation of these standards to drive ongoing safety and quality improvement in Australian hospitals.
The first NSQHS standard, ‘Governance for safety and quality in health service organisations’, requires that regular reports on safety and quality indicators and other safety and quality performance data are monitored by health service organisation leaders.
To support such local efforts to monitor and improve hospital safety and quality, the Commission develops and maintains a number of indicators, and produces tools to support their use (ACSQHC 2016). These include ‘Core hospital-based outcome indicators’; ‘Hospital-acquired complications’; ‘Classification of hospital-acquired diagnosis’; and indicators to support the implementation of clinical care standards. The Commission is also developing ‘core common questions’ for patient experience surveys in hospitals and ‘staff experience and organisational culture measurement’.
In addition, the Commission disseminates information relating to health care safety and quality in its annual report The state of safety and quality in Australian health care and in reports such as the Australian atlas of healthcare variation (see ‘Health care variation and hospitals’ later in this article).

Australia’s health 2016
Australian Institute of Health and Welfare 2016. Australia’s health 2016. Australia’s health series no. 15. Cat. no. AUS 199. Canberra: AIHW.
Au
stra
lia
’s h
ea
lth
20
16
3
Au
stra
lia
’s h
ea
lth
20
16 National reporting on hospital safety and quality
National reporting on safety and quality (across jurisdictions and over time) supports accountability and transparency in service provision and also has the potential to create incentives for improved safety and quality.
There are a number of national agreements and frameworks that support national monitoring and reporting of the safety and quality of patient care in hospitals. For example, performance indicators are included in the National Healthcare Agreement (NHA), the NHPF, and the Performance and Accountability Framework of the National Health Reform Agreement. (See ‘Chapter 7.1 Indicators of Australia’s health’ for more information on these indicator frameworks and Table 6.14.1 in this article).
Selected indicators of hospital safety and qualityThis section presents information on national indicators of safety and quality of the care for admitted patients in Australian hospitals that are routinely nationally reported. The indicators are:• health care-associated infections: Staphylococcus aureus bacteraemia (SAB) cases in
public hospitals• adverse events treated in hospital • falls resulting in patient harm in hospitals• unplanned hospital readmission rates• patient satisfaction/experience.
Information on adverse events, falls and unplanned readmissions is derived from the AIHW’s National Hospital Morbidity Database (NHMD). It should be noted that the data in the NHMD are collected primarily for the purposes of recording care provided to admitted patients and that their use for purposes such as reporting adverse events has not been validated for accuracy in Australia. The results should therefore be treated with caution (AIHW 2015a).
Note too, that the available information does not provide a complete picture. For example, there is no routinely available information on some aspects of quality, such as continuity or responsiveness of hospital services.
Health care-associated infections: Staphylococcus aureus bacteraemia cases in public hospitalsSAB is a type of infection often associated with health care. It occurs when Staphylococcus aureus bacteria (‘Golden staph’) cause an infection of the bloodstream (bacteraemia). When associated with health care procedures, these infections are considered to be potentially preventable.
Patients who develop SAB are more likely to suffer complications that result in longer stays in hospital, and the most serious infections can result in death.
The bacteria that cause SAB are frequently found on the skin or in the nose and are commonly spread from person to person in the community. In this form, they are usually harmless and most people are unaware that they are carrying them.

Australia’s health 2016
Australian Institute of Health and Welfare 2016. Australia’s health 2016. Australia’s health series no. 15. Cat. no. AUS 199. Canberra: AIHW.
Au
stra
lia
’s h
ea
lth
20
16
4
Au
stra
lia
’s h
ea
lth
20
16
Tab
le 6
.14.
1: N
atio
nal
rep
orti
ng
fram
ewor
ks
and
saf
ety
and
qu
alit
y in
dic
ator
s fo
r h
osp
ital
s
Fram
ewor
kPu
rpos
eIn
dica
tors
of s
afet
y an
d qu
alit
y in
hos
pita
lsRe
port
ed in
The
Nat
iona
l Hea
lth P
erfo
rman
ce
Fram
ewor
k 20
09 (r
evis
ed)
To p
rovi
de a
str
uctu
re fo
r rep
ortin
g on
Aus
tral
ia’s
heal
th s
tatu
s an
d th
e pe
rfor
man
ce o
f the
Aus
tral
ian
heal
th s
yste
m a
t the
nat
iona
l lev
el
Adve
rse
even
ts tr
eate
d in
hos
pita
ls
Falls
resu
lting
in p
atie
nt h
arm
in c
are
sett
ing
AIH
W’s
Aust
ralia
n ho
spita
l sta
tistic
s se
ries
annu
ally
and
in A
ustr
alia
’s he
alth
ev
ery
two
year
s
Perf
orm
ance
and
Acc
ount
abili
ty
Fram
ewor
k 20
11To
sup
port
a s
afe,
hig
h qu
ality
Au
stra
lian
heal
th s
yste
m, t
hrou
gh
impr
oved
tran
spar
ency
and
ac
coun
tabi
lity
Stap
hylo
cocc
us a
ureu
s bac
tera
emia
cas
es
in h
ospi
tals
Patie
nt e
xper
ienc
e
Unp
lann
ed re
adm
issi
ons(a
)
Hos
pita
l sta
ndar
dise
d m
orta
lity
ratio
(a)
Dea
th in
low
-mor
talit
y di
agno
sic
rela
ted
grou
ps(a
)
In h
ospi
tal m
orta
lity
rate
s(a)
Hea
lth c
are-
asso
ciat
ed C
lost
ridiu
m d
iffici
le
infe
ctio
ns(a
)
Rate
of c
omm
unity
follo
w-u
p w
ithin
the
first
se
ven
days
of d
isch
arge
from
a p
sych
iatr
ic
adm
issi
on(a
)
Indi
vidu
al h
ospi
tals
on
the
MyH
ospi
tals
w
ebsi
te (m
anag
ed b
y A
IHW
from
Ju
ly 2
016
and
form
erly
by
the
Nat
iona
l H
ealth
Per
form
ance
Aut
horit
y)
Prim
ary
Hea
lth N
etw
orks
on
the
MyH
ealth
yCom
mun
ities
web
site
(m
anag
ed b
y A
IHW
from
July
201
6 an
d fo
rmer
ly b
y th
e N
atio
nal H
ealth
Pe
rfor
man
ce A
utho
rity)
The
Nat
iona
l Hea
lthca
re
Agre
emen
t 201
2To
cla
rify
the
role
s an
d re
spon
sibi
litie
s th
at g
uide
the
Com
mon
wea
lth a
nd s
tate
s an
d te
rrito
ries
in d
eliv
ery
of s
ervi
ces
acro
ss th
e he
alth
sec
tor a
nd to
de
fine
shar
ed o
bjec
tives
, out
com
es,
and
perf
orm
ance
indi
cato
rs
Stap
hylo
cocc
us a
ureu
s bac
tera
emia
cas
es
in h
ospi
tals
Unp
lann
ed re
adm
issi
ons
Patie
nt e
xper
ienc
e
AIH
W’s
Aust
ralia
n ho
spita
l sta
tistic
s se
ries
The
Stee
ring
Com
mitt
ee fo
r the
Rev
iew
of
Gov
ernm
ent S
ervi
ce P
rovi
sion
’s Re
view
of g
over
nmen
t ser
vice
s rep
orts
Aust
ralia
n Bu
reau
of S
tatis
tics
(ABS
) Pa
tient
exp
erie
nces
in A
ustr
alia
(a)
Not
yet
repo
rted
.

Australia’s health 2016
Australian Institute of Health and Welfare 2016. Australia’s health 2016. Australia’s health series no. 15. Cat. no. AUS 199. Canberra: AIHW.
Au
stra
lia
’s h
ea
lth
20
16
5
Au
stra
lia
’s h
ea
lth
20
16
Figure 6.14.1: Cases of Staphylococcus aureus bacteraemia (SAB) in public hospitals, by antibiotic sensitivity status (MSSA or MRSA), 2010–11 to 2014–15
In hospitals, transmission is most commonly via the hands of health care workers. Bacteria can gain direct entry into the patient’s bloodstream if they have open wounds or when devices that pierce the skin are used, such as for giving intravenous fluids or for taking blood samples. Hospitals aim to have as few SAB cases as possible.
Patients who have a greater risk of infection than the general public are those with open wounds; invasive devices such as catheters; weakened immune systems (associated with cancer, or with transplant receipt, or with being very young or elderly); chronic disease such as diabetes or severe underlying illness; or prolonged or recurrent exposure to antibiotics (AIHW 2015b).
The rate of SAB is a performance indicator for the NHA outcome area of Australians receive appropriate high quality and affordable hospital and hospital-related care. A performance benchmark for public hospital-associated SAB is included for that outcome area: the rate of SAB (including methicillin-resistant Staphylococcus aureus, or MRSA) is no more than 2.0 per 10,000 days of patient care for acute care public hospitals in each state and territory.
In 2014–15: • the national rate of SAB in public hospitals was 0.8 cases per 10,000 days of patient care• all jurisdictions had rates below the national benchmark • most cases of SAB (78%) were treatable with commonly used antibiotics. These cases
are termed methicillin-sensitive Staphylococcus aureus (MSSA) cases, while 22% of cases were MRSA (antibiotic resistant) cases (AIHW 2015b).
Between 2010–11 and 2014–15: • rates of SAB decreased from 1.1 cases to 0.8 cases per 10,000 days of patient care• the overall number of SAB cases decreased from 1,876 to 1,490. The number of MRSA
cases decreased from 505 to 331 (Figure 6.14.1).
0
400
800
1,200
1,600
2,000
2010–11 2011–12 2012–13 2013–14 2014–15
Year
MSSA MRSA
Number
Source: AIHW 2015b.
Improvement in the hand hygiene of health care workers is the highest priority for reducing the risk of health care-associated infections. Between July 2009 and June 2015, hand hygiene compliance in public hospitals increased from about 64% to 82% (HHA 2015).

Australia’s health 2016
Australian Institute of Health and Welfare 2016. Australia’s health 2016. Australia’s health series no. 15. Cat. no. AUS 199. Canberra: AIHW.
Au
stra
lia
’s h
ea
lth
20
16
6
Au
stra
lia
’s h
ea
lth
20
16 Adverse events treated in hospitals
‘Adverse events treated in hospitals’ is an NHPF performance indicator under the dimension of ‘Safety’ (see ‘Chapter 7.1 Indicators of Australia’s health’). It is a measure of the safety and quality of the care provided to admitted patients, and encompasses a range of events, rather than focusing on one type, such as readmissions or falls.
Adverse events are defined as incidents in which harm resulted to a person receiving health care. They include adverse effects of drugs, injuries that occur during care, and conditions that occur following procedures such as infections and bleeding. Some of these adverse events may be preventable.
Adverse events such as these can lead to increased length of stay and poorer patient outcomes, along with increased costs of treatment. ‘Adverse events treated in hospitals’ is based on events that have been identified by the treating doctor in the clinical record, indicating that an adverse event has resulted in, or affected, hospital admission.
This indicator is limited to adverse events that can be identified by specific codes and therefore may not include all adverse events.
In 2013–14:• almost 547,000 hospitalisation reports indicated that one or more adverse events
had resulted in, or affected the hospitalisation. These reports accounted for about 6.7 per 100 hospitalisations in public hospitals and 4.1 per 100 hospitalisations in private hospitals (Figure 6.14.2). The data for public hospitals are not comparable with the data for private hospitals because their casemixes differ and recording practices may be different
• the most common adverse event groups reported for public hospitals were Procedures causing abnormal reactions/complications (52%) and Adverse effects of drugs, medicaments and biological substances (37%)
• the most common adverse event group reported for private hospitals was Procedures causing abnormal reactions/complications (70%)
• overnight hospitalisations had higher rates of adverse events (11 per 100) than same-day hospitalisations (1.7 per 100)
• hospitalisations for subacute and non-acute care had higher rates of adverse events (10.5 per 100) than acute care hospitalisations (5.4 per 100)
• emergency hospitalisations had higher rates of adverse events (9.9 per 100) than non-emergency hospitalisations (4.1 per 100).
Other ways to assess the safety and quality of care provided to admitted patients cover a wider range of issues reported as either arising (or being acquired) during the hospital episode; these measures are not recognised as performance indicators and information on them is presented in Box 6.14.2.

Australia’s health 2016
Australian Institute of Health and Welfare 2016. Australia’s health 2016. Australia’s health series no. 15. Cat. no. AUS 199. Canberra: AIHW.
Au
stra
lia
’s h
ea
lth
20
16
7
Au
stra
lia
’s h
ea
lth
20
16 Figure 6.14.2: Adverse events per 100 hospitalisations, all hospitals,
2013–14
0 1 2 3 4 5 6
All adverse events
Procedures causing abnormalreactions/complications
Adverse ef fects of drugs,medicaments and biological substances
Complications of internalprosthetic devices
Selected post-procedural disorders
Other diagnoses of complicationsof medical and surgical care
Haemorrhage and haematomacomplicating a procedure
Infection following a procedure
Misadventures to patientsduring surgical and medical care
Events per 100 hospitalisations
Adverse event
Note: The adverse events presented are not mutually exclusive. For example, a hospitalisation may have both a diagnosis for ‘Selected post-procedural disorders’ and an external cause of ‘Procedures causing abnormal reactions/complications’. In addition, a hospitalisation may include more than one adverse event.
Box 6.14.2: Other measures relating to the overall safety and quality of care in hospitals
Information presented in this box relates to other measures of the overall safety and quality of care provided to admitted patients that are not performance indicators. These measures overlap with each other and with the safety and quality performance indicators presented in this article. These measures and the performance indicators should not be added together due to the overlap.
Conditions that arose during the hospital stayThis measure includes all conditions which arose during the episode of admitted patient care and were not present on admission. Not all conditions that arise during a hospitalisation are classified as adverse events. Conditions that arise during a hospital stay are identified using a ‘condition onset flag’ (this is a means of differentiating between conditions that were present on admission, or arose during the episode of care).
These condition onset flag data are available for about 91% of hospitalisations in public hospitals and about 72% of hospitalisations in private hospitals.
(continued)
Australia’s health 2016
Australian Institute of Health and Welfare 2016. Australia’s health 2016. Australia’s health series no. 15. Cat. no. AUS 199. Canberra: AIHW.
Au
stra
lia
’s h
ea
lth
20
16
8
Au
stra
lia
’s h
ea
lth
20
16
Box 6.14.2 (continued): Other measures relating to the overall safety and quality of care in hospitals
In 2013–14: • about 717,000 hospitalisations were affected by a condition that arose during
the hospital stay. These accounted for about 10% of hospitalisations in public hospitals and 6% of hospitalisations in private hospitals
• hospitalisations for childbirth had the highest proportion recording a condition that arose during the hospital stay, in both public and private hospitals and for same-day and overnight hospitalisations. This was 58% and 54% for overnight hospitalisations in public and private hospitals respectively and 33% and 36% for same-day, public and private hospitalisations respectively
• approximately 31% of conditions that arose during the hospital stay were also classified as adverse events and 91% were classified as a hospital-acquired diagnosis.
Hospital-acquired conditions (diagnoses)The ‘Classification of hospital-acquired diagnoses’ is a classification system that allows hospitals to identify, count and monitor adverse events, as markers of patient safety. For the most part, the occurrence of a hospital-acquired condition is identified using the condition onset flag along with diagnosis information. These condition onset flag data are available for about 91% of hospitalisations in public hospitals and about 72% of hospitalisations in private hospitals.
In 2013–14:• more than 709,000 hospitalisations reported a hospital-acquired condition.
These accounted for about 9.9% of hospitalisations in public hospitals and 6.0% in private hospitals
• for public hospitals, the most common hospital-acquired conditions were Labour, delivery and postpartum complications and Cardiovascular complications (accounting for 20% and 16% of hospitalisations that included a hospital-acquired condition, respectively)
• for private hospitals, the most common hospital-acquired conditions were Gastrointestinal complications accounting for 18% of hospitalisations that included a hospital-acquired condition
• Post-procedural complications accounted for about 14% of hospital-acquired conditions in public hospitals and 16% in private hospitals
• about 31% of hospital-acquired conditions were also classified as ‘Adverse events treated in hospital’ and 97% were classified as ‘Conditions that arose during the hospital stay’.

Australia’s health 2016
Australian Institute of Health and Welfare 2016. Australia’s health 2016. Australia’s health series no. 15. Cat. no. AUS 199. Canberra: AIHW.
Au
stra
lia
’s h
ea
lth
20
16
9
Au
stra
lia
’s h
ea
lth
20
16 Falls resulting in patient harm in hospitals
‘Falls resulting in patient harm in hospitals’ is a performance indicator under the NHPF domain of ‘Safety’ (see ‘Chapter 7.1 Indicators of Australia’s health’). This indicator is intended to report where a fall occurred in hospital during the episode of care, resulting in patient harm. ‘Falls resulting in patient harm in hospitals’ is a subset of ‘Adverse events treated in hospital’.
The indicator identifies falls occurring in any health service area as it is not currently possible to identify falls as occurring specifically in hospitals. Therefore, these rates may overestimate falls in hospitals. However, patients with an injury as the primary reason for hospitalisation are excluded to minimise the inclusion of falls that occurred before admission. These rates may also be underestimated as the place of occurrence was not reported for about 26% of hospitalisations with a fall recorded.
In 2013–14, more than 30,000 hospitalisations, or 3.1 per 1,000 hospitalisations, reported a fall. More falls were reported for public hospitals (4.2 per 1,000 hospitalisations) than for private hospitals (1.6 per 1,000). The difference between the rates in public and private hospitals may reflect differences in casemix and recording practices.
These data should be treated with caution. A study by the Commission showed that the rate of recording falls in the medical records varied between hospitals, with some hospitals recording falls better in incident reporting systems (ACSQHC 2012).
Unplanned readmissions ‘Unplanned or unexpected readmissions after surgery’ is an NHA performance indicator for the outcome Australians receive appropriate high quality and affordable hospital and hospital-related care. It is regarded as an indicator of the safety and quality of admitted patient care in hospitals.
This indicator includes hospitalisations for which an unplanned readmission to the same public hospital occurred within 28 days following surgery (for selected surgical procedures) (Figure 6.14.3), and the cause of the hospitalisation was an adverse event. The diagnosis codes used to identify adverse events for unplanned readmissions are a subset of those used in ‘Adverse events treated in hospitals’, and ‘Unplanned readmissions’ account for 0.4% of hospitalisations with ‘Adverse events‘.
In 2013–14, rates of readmission to the same public hospital were 33 per 1,000 hospitalisations for Tonsillectomy and adenoidectomy and 3.1 per 1,000 for Cataract extractions (Figure 6.14.3). The rate for Tonsillectomy and adenoidectomy readmissions was higher than in 2011–12, when it was 28 per 1,000, but similar to 2012–13 (33). Cataract extraction readmission rates were similar for all 3 years (3.2 per 1,000 in 2011–12 and 3.4 in 2012–13) (AIHW 2013, 2014).
Patient experience‘Patient experience’ is an NHA performance indicator in the outcome area of ‘Australians have positive health and aged care experiences which take account of individual circumstances and care needs’. A patient experience survey is one tool that health services can use to assess whether they are meeting the needs of the patient.

Australia’s health 2016
Australian Institute of Health and Welfare 2016. Australia’s health 2016. Australia’s health series no. 15. Cat. no. AUS 199. Canberra: AIHW.
Au
stra
lia
’s h
ea
lth
20
16
10
Au
stra
lia
’s h
ea
lth
20
16 Figure 6.14.3: Readmissions within 28 days to the same public
hospital after selected types of surgery, 2013–14
0 5 10 15 20 25 30 35
Tonsillectomy andadenoidectomy
Hysterectomy
Prostatectomy
Knee replacement
Appendicectomy
Hip replacement
Cataract extraction
Readmissions per 1,000 hospitalisations
Surgery
Note: Excludes data for WA.Source: AIHW 2015a.
The ABS Patient Experience Survey included about 19,000 people aged 15 and over in 2014–15. Of these, more than 2,500 people (14%) had attended a hospital in the past 12 months, either as an admitted patient or as an emergency department patient. The survey asked patients whether doctors or nurses:• listened carefully to them• showed respect to them• spent enough time with them.
The survey found that at least 86% of patients responded ‘always’ or ‘often’ to each of these questions for both doctors and nurses. More than 90% of patients responded ‘always’ or ‘often’ to the questions about whether the doctors or nurses showed respect to them (ABS 2015).
Health care variation and hospitalsIn 2015 the Commission published the Australian atlas of healthcare variation (ACSQHC and NHPA 2015). Understanding variation across geographic areas is important to improving the appropriateness of health care, including hospital care, and increasing the value obtained from resources allocated to health.
The Australian atlas of healthcare variation reported substantial variation in health care use in six clinical areas, including prescribing and diagnostic, medical and surgical interventions. Some of these differences would reflect variation in the provision of hospital care, although many would also reflect variation in the provision of non-hospital care. Some variation in health care use is expected if associated with differences in patients’ health, or personal preferences. However, the Commission found that much of the variation was likely to be unwarranted. This may mean that some people are receiving inappropriate or unnecessary care, while others may be missing out on care that might be beneficial.
Hospital-related examples from the Australian atlas of healthcare variation include Knee arthroscopy and Hysterectomy and endometrial ablation.

Australia’s health 2016
Australian Institute of Health and Welfare 2016. Australia’s health 2016. Australia’s health series no. 15. Cat. no. AUS 199. Canberra: AIHW.
Au
stra
lia
’s h
ea
lth
20
16
11
Au
stra
lia
’s h
ea
lth
20
16
Figure 6.14.4: Age-standardised rate of knee arthroscopy hospitalisations per 100,000 people aged 55 and over, by local area, 2012–13
Variation in knee arthroscopy rates In 2012–13, more than 33,000 knee arthroscopy operations were performed for patients aged 55 and over. This was the case despite evidence that knee arthroscopy is of limited value for people with osteoarthritis and may cause harm.
The rates of knee arthroscopy varied across states and territories, from 264 per 100,000 people aged 55 and over in the Australian Capital Territory, to 980 in South Australia. Hospitalisations for patients aged 55 and over were seven times as high in some local areas than other areas, ranging from 1,319 hospitalisations per 100,000 population to 185 per 100,000 (Figure 6.14.4). After excluding the highest and lowest results, the knee arthroscopy hospitalisation rates were up to 4.2 times higher in some areas compared with others.
Hospitalisation rates for knee arthroscopy tended to be higher in Inner and Outer regional areas than in Major cities (ACSQHC and NHPA 2015).
BRISBANE
PERTH
ADELAIDE
HOBART
MELBOURNE
DARWIN
Not available for publication
873–1,319 733–872 666–732 590–665 537–589
488–536 443–487 385–442 324–384 185–323
SYDNEY
CANBERRA
Note: For this item, ‘local area’ refers to an ABS standard geographic region known as a Statistical Area Level 3 (SA3).
Source: ACSQHC and NHPA 2015.
Australia’s health 2016
Australian Institute of Health and Welfare 2016. Australia’s health 2016. Australia’s health series no. 15. Cat. no. AUS 199. Canberra: AIHW.
Au
stra
lia
’s h
ea
lth
20
16
12
Au
stra
lia
’s h
ea
lth
20
16
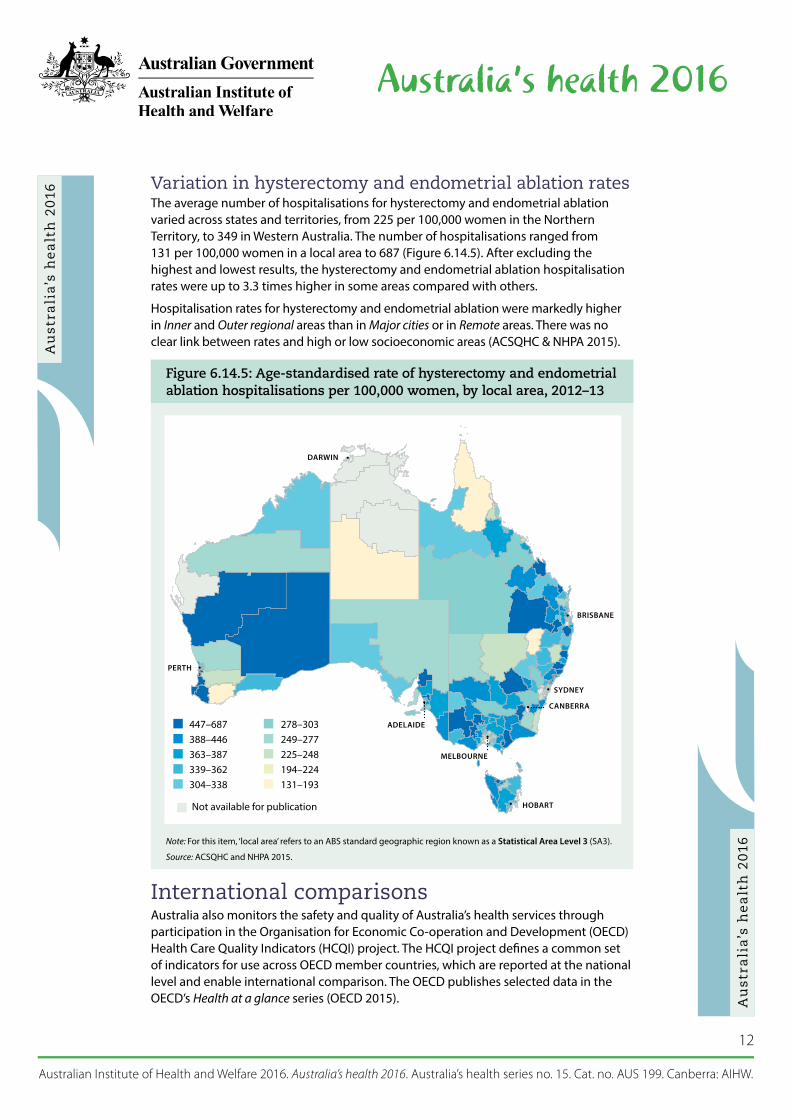
Figure 6.14.5: Age-standardised rate of hysterectomy and endometrial ablation hospitalisations per 100,000 women, by local area, 2012–13
Variation in hysterectomy and endometrial ablation ratesThe average number of hospitalisations for hysterectomy and endometrial ablation varied across states and territories, from 225 per 100,000 women in the Northern Territory, to 349 in Western Australia. The number of hospitalisations ranged from 131 per 100,000 women in a local area to 687 (Figure 6.14.5). After excluding the highest and lowest results, the hysterectomy and endometrial ablation hospitalisation rates were up to 3.3 times higher in some areas compared with others.
Hospitalisation rates for hysterectomy and endometrial ablation were markedly higher in Inner and Outer regional areas than in Major cities or in Remote areas. There was no clear link between rates and high or low socioeconomic areas (ACSQHC & NHPA 2015).
Not available for publication
447–687 388–446 363–387 339–362 304–338
278–303 249–277 225–248 194–224 131–193
BRISBANE
PERTH
ADELAIDE
HOBART
MELBOURNE
DARWIN
SYDNEY
CANBERRA
Note: For this item, ‘local area’ refers to an ABS standard geographic region known as a Statistical Area Level 3 (SA3).
Source: ACSQHC and NHPA 2015.
International comparisonsAustralia also monitors the safety and quality of Australia’s health services through participation in the Organisation for Economic Co-operation and Development (OECD) Health Care Quality Indicators (HCQI) project. The HCQI project defines a common set of indicators for use across OECD member countries, which are reported at the national level and enable international comparison. The OECD publishes selected data in the OECD’s Health at a glance series (OECD 2015).

Australia’s health 2016
Australian Institute of Health and Welfare 2016. Australia’s health 2016. Australia’s health series no. 15. Cat. no. AUS 199. Canberra: AIHW.
Au
stra
lia
’s h
ea
lth
20
16
13
Au
stra
lia
’s h
ea
lth
20
16 The OECD acknowledges the challenge in collating data of this type in a comparable
manner, and suggests that some caution should be taken in interpreting the results. Differences in hospital admission practices/criteria, data coding practices, and sources of data (for example, whether based on hospital administrative data or registry-based data) can result in large variations in rates reported.
Table 6.14.2 lists the patient safety-related indicators that were reported to the most recent OECD collection, and indicates how Australia compares against the OECD averages.
In Australia the Post-operative wound dehiscence rate per 100,000 (75) was lower than the OECD average (220), as was the rate for Post-operative pulmonary embolism (363 per 100,000 compared with 531). Other patient safety indicator rates were higher than the OECD average.
Table 6.14.2: OECD HCQI patient safety indicators, Australia (2012–13) and OECD average (2013)
HCQI indicator Australia OECD average
Rate per 100,000 hospitalisations
Foreign body left in during procedure 8.6 5.7
Post-operative deep vein thrombosis 787 336
Post-operative pulmonary embolism 363 531
Post-operative sepsis 1,445 967
Post-operative wound dehiscence (wound rupture) 75 220
Rate per 100 vaginal deliveries
Obstetric trauma—vaginal delivery with instrument 7.3 6.0
Obstetric trauma—vaginal delivery without instrument 2.4 1.6
Notes 1. Caution should be taken in interpreting these findings due to differences in data capture and reporting that may
influence the reported rates. 2. OECD rate is for 2013 (or nearest year).
Source: AIHW 2016.
In addition to variation in recording practices, Health at a glance 2015 notes that in ‘some cases, higher adverse event rates may signal more developed patient safety monitoring systems and a stronger patient safety culture rather than worse care’ (OECD 2015:144). A number of features of Australian patient safety monitoring would support the claim that Australia is one of those countries that has a more developed patient safety monitoring system (AIHW forthcoming).
What is the AIHW doing?The AIHW is currently undertaking work to improve the NHA unplanned hospital readmission rates performance indicator.
The AIHW’s work involves the refinement of the list of principal diagnoses that can be used to indicate an unplanned readmission as specifically relevant to each of the seven types of surgical procedures. The work is also incorporating different lengths of time (between 7 and 60 days) for a principal diagnosis to signal an unplanned readmission for each type of surgery. Work is also being undertaken towards identification of readmissions to hospitals other than the one in which the surgery was performed.

Australia’s health 2016
Australian Institute of Health and Welfare 2016. Australia’s health 2016. Australia’s health series no. 15. Cat. no. AUS 199. Canberra: AIHW.
Au
stra
lia
’s h
ea
lth
20
16
14
Au
stra
lia
’s h
ea
lth
20
16 What is missing from the picture?
Current public reporting on safety and quality using admitted patient care data is only a small component of what could potentially be reported. There is ongoing effort to enhance the information value of this data collection through the improvement of consistent data collection across states and territories and through the development of indicators and other data analysis methods.
Routine national data linkage to inform safety and quality improvement is also an area for future work. The ability to link data across hospitals or across different health services would enhance our understanding of the patient’s journey through the health system and outcomes of care.
Although most jurisdictions and many hospitals already collect and analyse patient experience information, there is a lack of consistency in the information collected that prevents meaningful comparisons between jurisdictions. However, work is being conducted by the Commission to develop standard patient experience measures. These will comprise two short sets of core common questions to assess patients’ experiences of overnight hospital care and same-day care. Unlike in the existing ABS Patient Experience Survey, which is population-based, the questions will be administered to recently discharged patients. The resulting information will be a resource for use by public and private services across Australia to pinpoint areas for local service improvement, as well as offering the opportunity for national-level comparisons.
Where do I go for more information?More information is available at the Commission’s website Australian Commission in Safety and Quality in Health Care.
Selected safety and quality information for individual hospitals is available at MyHospitals.gov.au.
ReferencesABS (Australian Bureau of Statistics) 2015. Patient experiences in Australia: summary of findings, 2014–15. ABS cat. no. 4839.0. Canberra: ABS.
ACSQHC (Australian Commission on Safety and Quality in Health Care) 2012. An evaluation of the preventing falls and harm from falls in older people best practice guidelines for Australian hospitals. Sydney: ACSQHC.
ACSQHC 2015. Australian Commission on Safety and Quality in Health Care annual report 2014/15. Sydney: ACSQHC.
ACSQHC 2016. Australian Commission on Safety and Quality in Health Care annual report 2015/16. Sydney: ACSQHC.
ACSQHC & NHPA (Australian Commission on Safety and Quality in Health Care and National Health Performance Authority) 2015. Australian atlas of healthcare variation. Sydney: ACSQHC.
AIHW (Australian Institute of Health and Welfare) 2013. Australian hospital statistics 2011–12. Health services series no. 50. Cat. no. HSE 134. Canberra: AIHW.
AIHW 2014. Australian hospital statistics 2012–13. Health services series no. 54. Cat. no. HSE 145. Canberra: AIHW.
AIHW 2015a. Admitted patient care 2013–14: Australian hospital statistics. Health series no. 60. Cat. no. HSE 156. Canberra: AIHW.

Australia’s health 2016
Australian Institute of Health and Welfare 2016. Australia’s health 2016. Australia’s health series no. 15. Cat. no. AUS 199. Canberra: AIHW.
Au
stra
lia
’s h
ea
lth
20
16
15
Au
stra
lia
’s h
ea
lth
20
16 AIHW 2015b. Staphylococcus aureus bacteraemia in Australian public hospitals 2014–15:
Australian hospital statistics. Health services series no. 67. Cat. no. HSE 171. Canberra: AIHW.
AIHW, forthcoming. OECD health-care quality indicators for Australia 2015. Canberra: AIHW.
HHA (Hand Hygiene Australia) 2015. National data period 1, 2015. Melbourne: HHA. Viewed 9 November 2015, <http://www.hha.org.au/LatestNationalData/national-data-2015.aspx>.
NHISSC (National Health Information Standards and Statistics Committee) 2009. The National Health Performance Framework (2nd edn). Canberra: AIHW. Viewed 8 January 2016, <http://www.aihw.gov.au/health-indicators/>.
OECD (Organisation for Economic Cooperation and Development) 2015. Health at a glance 2015: OECD indicators. Paris: OECD. Viewed 4 January 2016. <http://www.oecd-ilibrary.org/ social-issues-migration-health/health-at-a-glance-2015_health_glance-2015-en>.