Australia’s Digital Pulse - Deloitte challenges for our nation – digital skills, jobs and...
80
Australian Computer Society, 2015 Australia’s Digital Pulse Key challenges for our nation – digital skills, jobs and education
Transcript of Australia’s Digital Pulse - Deloitte challenges for our nation – digital skills, jobs and...

Australian Computer Society, 2015
Australia’s Digital PulseKey challenges for our nation – digital skills, jobs and education

General use restriction
This report is prepared solely for the Australian Computer Society (ACS) by Deloitte Access Economics (DAE). This report is not intended to and should not be used or relied upon by anyone else and we accept no duty of care to any other person or entity. The report has been prepared for the purpose of analysing digital skills, jobs and education in Australia. You should not refer to or use our name or the advice for any other purpose.

Contents
Glossary
Executive summary
Digital economy snapshotDigital disruption and the ICT workforceContribution of the digital economyWomen in the ICT sectorTrade in ICT servicesICT research and developmentAustralia’s ICT strengths and weaknesses
Occupational analysisDemand for ICT workersSupply of ICT workersOverall demand and supply balance
ICT education in schoolsThe need for ICT education in schoolsAustralian students’ ICT literacyICT education in Australian schoolsInternational experiences in ICT educationDirections and barriers for ICT education
Future directions
Appendix: statistical compendium
Our people
iv
1
4 6
10 11 14 16 17
20 22 25 33
36 38 3940 47 49
50
52
73

Glossary
Australian Bureau of Statistics
Australian Computer Society
Australian Curriculum, Assessment and Reporting Authority
Australian and New Zealand Standard Classification of Occupations
Australian and New Zealand Standard Industrial Classification
Board of Studies, Teaching and Educational Standards (NSW)
Centre for Innovative Industries Economic Research Inc
Deloitte Access Economics
Department of Immigration and Border Protection
Gross Domestic Product
Human Resources
Information and Communications Technology
Information, Media and Telecommunications (ABS industry)
Information Technology
Massive Open Online Course
National Assessment Program
National ICT Australia
New South Wales
Organisation for Economic Co-operation and Development
Science, Technology, Engineering, Mathematics
University of Technology Sydney
Victoria Curriculum and Assessment Authority
Vocational Education and Training
ABS
ACS
ACARA
ANZSCO
ANZSIC
BOSTES
CIIER
DAE
DIBP
GDP
HR
ICT
IMT
IT
MOOC
NAP
NICTA
NSW
OECD
STEM
UTS
VCAA
VET
iv Australia’s Digital Pulse

1Key challenges for our nation – digital skills, jobs and education
Executive summary
The Australian digital economy has experienced rapid growth over recent years. The contribution of digital technologies to the Australian economy was $79 billion in 2013–14 compared with $50 billion in 2011, and is expected to continue growing in a globally-connected digital world.
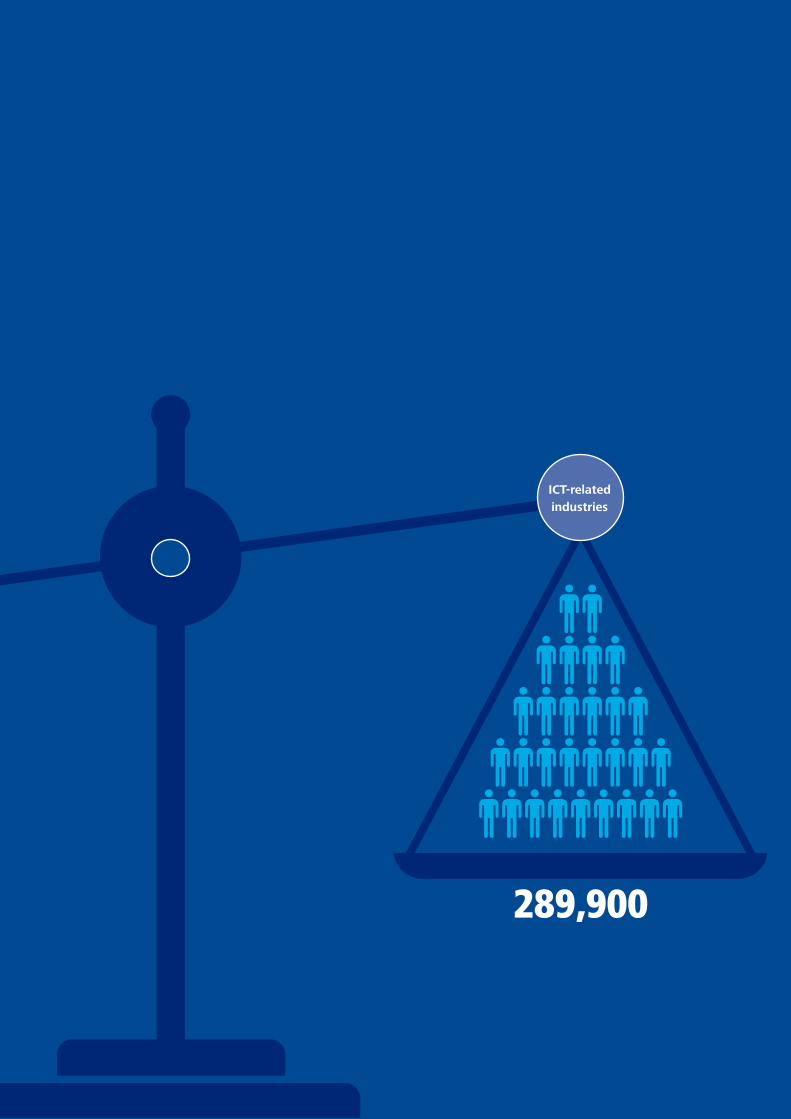
Digital disruption is dramatically changing industries and occupations across the economy. The number of Information and Communications Technology (ICT) workersi increased to 600,000 in 2014, and now more than half (52%) are in industries outside ICT itself including professional services, public administration and financial services (Chart 1).
The changing role of ICT is also evident in education statistics. Almost half (47%) of all workers who studied ICT are in other professions such as advertising, marketing and accounting, while almost half (43%) of workers in ICT occupations studied courses other than ICT or engineering, such as commerce and management degrees. Industry consultations suggest that Australian businesses across a diverse range of sectors have significant ICT skills needs (refer to box on next page).
Chart 1: ICT workers by industries, 2014
Source: ABS customised report (2015)
ICT-related industries
Professional services
Public administration
Financial services
Other industries
289,900
67,378
47,300
41,527
159,647
Table 1: ICT employment forecast in selected occupations, 2014 to 2020
Source: Deloitte Access Economics (2015)
CIIER occupation grouping
2014 2020 Average annual growth
ICT management and operations
184,907 222,080 3.1%
ICT technical and professional
213,107 247,919 2.6%
Other ICT occupations
207,738 230,484 1.7%
Total ICT workers 605,752 700,483 2.5%
Productivity growth in the Australian economy will be increasingly driven by digital technology in the future, particularly as the mining boom wanes. A strong digital economy is an important economic reform. Australia needs a workforce that is equipped with the ICT skills necessary to fuel its digitally-driven economic growth. Professor Roy Green, Dean of the UTS Business School, believes that in the future computational thinking skills and specialised disciplinary thinking need to be combined with business analytics and design thinking in order to foster innovation in the economy.
Australia is already a relatively high user of digital technologies, with impressive penetration rates for mobile broadband and e-commerce. However, there are gaps in Australia’s digital capability, having fewer ICT specialists and investing a smaller share of research and development in ICT compared with other OECD countries.
Demand for ICT workers in Australia is forecast to increase by 100,000 workers over six years, from around 600,000 workers in 2014 to more than 700,000 workers in 2020. In particular, growth is expected to be strongest for technical, professional, management and operational occupations (Table 1). This reflects the integration of ICT workers across a broad range of industries as digital disruption continues to change the role of technology across the workforce in the future. Consequently, demand for ICT skills and qualifications is also expected to increase in the future, with the strongest growth projected to be in postgraduate ICT qualifications.
i. CIIER definition as used in ACS ICT Statistical Compendia 2008-2013. In order to maintain continuity with previous ACS published
reports, the workforce analysis in this report draws upon definitions and nomenclature developed by the Centre for Innovative
Industries Economic Research Inc. lead researcher, Ian Dennis FACS, and used in ACS ICT Statistical Compendia 2008-2013 and
other CIIER analysis.

2 Australia’s Digital Pulse
Yet graduates with ICT qualifications have declined significantly since the early 2000s, and in recent years many Australian businesses have relied on workers from overseas and importing ICT skills to fill the gap. More than 10,000 temporary skilled migration (457) visas have been granted annually to ICT workers over recent years, and net arrivals of ICT workers were around 19,000 in 2013–14. Consultations with the business community suggest that workers from overseas are being relied upon for key technical capabilities such as software development and programming.
This raises an important question for the future: where will the additional 100,000 ICT workers required by 2020 come from? How can Australia ensure that its workforce is equipped with the ICT skills required to take advantage of the opportunities created by digital disruption?
The solution needs to be multifaceted: government, businesses, education institutions and industry associations must all play a role in positioning the Australian workforce for the future. Addressing these issues begins at the primary school education level, where computing skills and technical ICT capabilities should be included in the curriculum and taught to students from a young age. The new Australian Curriculum, which includes a Technologies learning area (Figure 1), will be a significant step in the process of teaching students to use computational thinking and information systems to define, design and implement digital solutions.
Source: Australian Curriculum, Assessment and Reporting Authority (2015)
Figure 1: ICT learning areas in the Australian Curriculum, foundation to year 10
English
Learning Areas
Humanities & Social Sciences
Health & PE
Science
Technologies
Subjects
Digital Technologies
Design & Technologies
Mathematics
The Arts
Languages
ColesColes operates traditional ‘bricks and mortar’ supermarket stores as well as an online retailing division. Investing in IT is a critical part of Coles’ overall business strategy to increase efficiency and cost-effectiveness to meet customer needs.
Google AustraliaGoogle’s Australian office is one of the company’s largest global engineering centres. The company employs a large team of engineers who work on product development and infrastructure.
Department of Immigration and Border Protection (DIBP)DIBP is the Federal Government department responsible for managing migration, humanitarian and citizenship policy and programs. DIBP has significant digital technology needs and requirements, as ICT is a critical business enabler supporting all aspects of the Department’s activities.

3Key challenges for our nation – digital skills, jobs and education
The inclusion of the Technologies learning area in the curriculum is part of addressing the broader challenge of developing Science, Technology, Engineering and Mathematics (STEM) capabilities in Australia’s workforce. Not only do Australian students need to be digitally literate, but they are also required to be capable in building digital solutions for the problems of the future. Results from the 2011 National Assessment Program show that currently, only 3% of Year 6 students frequently use ICT in schools for technical tasks. The new curriculum is designed to address this by teaching young students technical capabilities such as programming, coding and computer science.
At present, it is up to state authorities to advise schools of when and how the Technologies curriculum should be taught. In implementing ICT education across Australian schools, comprehensive teacher education will be required to assist teachers in developing effective teaching and learning practices using digital technology – particularly at the earlier year levels. An example of this is the online tool being developed by the Victorian Department of Education, which provides teachers with information on terminology, assessments, case studies and lesson plans for the new curriculum.
In summary, future directions in digital technology skills should include:• An increased national focus on growing Australia’s
ICT capabilities and skills in the workforce, particularly among groups with the potential to significantly increase their ICT workforce participation (for example, women – who represent only 28% of the ICT workforce – and mature-aged employees, as well as workers displaced from other industries)
• Federal and State Governments accelerating the development and implementation of the Technologies component of the Australian Curriculum, focusing on equipping school students with critical technical computing skills and ensuring that school teachers are trained in delivering the curriculum
• Higher education institutions promoting the strength and diversity of ICT-related study and career paths to students, with the aim of increasing the future pipeline of ICT graduates, as well as developing more interdisciplinary opportunities between ICT and other subject areas
• Businesses providing opportunities for employees to develop their ICT skills through on the job training, workshops, upskilling courses and other business development initiatives, while also continuing to invest in ICT research and encouraging the integration of digital technology into wider business operations.
The rapidly growing digital economy means that ICT skills will play an increasingly important role in future economic growth. Australia needs to ensure that its education system, policy settings and business practices are all working towards equipping our workers with the required technological skills. This will ensure that the Australian workforce is well-placed to meet the future challenges associated with digital disruption.

1Digital economy snapshot
This chapter examines the current state of the Australian ICT workforce, including recent trends and the impact of digital disruption. It examines ICT occupations and industries, growth in the digital economy, the role of women in the workforce, the offshoring of ICT services and ICT research and development. It also includes international comparisons between the Australian digital economy and other countries.
ICT workers by selected industries, 2014
315,852
Otherindustries
Professional services67,378
Public administration47,300
Financial services41,527
Other industries159,647
289,900
ICT-relatedindustries

6 Australia’s Digital Pulse
Digital disruption and the ICT workforce
A snapshot of the ICT workforce shows that there were around 600,000 ICT workers in Australia in 2014, representing approximately 5% of the total Australian labour force.1 Around two-thirds of these workers were employed in management, operations, technical or professional roles (Chart 1.1, or Table A.4 for more details).
There are around 600,000 ICT workers employed in the Australian labour force. Around half of these workers are employed in industries outside of ICT itself, such as other professional industries. Digital disruption in the Australian economy means that tasks that use and produce ICT are becoming increasingly embedded into the jobs of workers outside the ICT profession. As such, ICT skills will be critical in supporting innovation and productivity growth in the future.
Chart 1.1: ICT workers by CIIER occupation groupings, 2014
Source: ABS customised report (2015)
ICT management and operations
ICT technical and professional
ICT sales
ICT trades
Electronic trades and professional
ICT industry admin and logistics support
184,907
213,107
80,109
28,909
3,82894,892
Around half of all ICT workers are directly employed in ICT-related industries such as computer system design, telecommunications services and internet service providers. Beyond that core group, ICT workers can be found across a range of areas outside these ICT-related industries, with a particularly large presence in professional industries such as other professional services, public administration and financial services (Chart 1.2).

7Key challenges for our nation – digital skills, jobs and education
1. ABS industry classifications include an ‘Information, Media and Telecommunications’ (IMT) industry. However, in practice there
are a large number of ICT workers outside the IMT industry (for example, software developers working in the banking industry)
and there are some employees in the IMT industry who are not ICT workers (for example, publishers of print newspapers). In this
study, employment figures for ICT workers have been calculated using ABS occupation and industry classifications based on the
methodology used in previous ACS Statistical Compendiums. For a list of which occupations and industries have been classified as
ICT workers, refer to Table A.3.
2. For more details, see Deloitte (2012) Digital disruption: Short fuse, big bang? <http://www2.deloitte.com/content/dam/Deloitte/au/
Documents/Building%20Lucky%20Country/deloitte-au-consulting-digital-disruption-whitepaper-0912.pdf>.
Chart 1.2: ICT workers by industry, 2014
* Excluding Computer System Design and Related Services
which is separately identified as an ICT industry subdivision
Source: ABS customised report (2015)
0 50,000 100,000 150,000 200,000 250,000 300,000
Other industries
Health Care andSocial Assistance
Manufacturing
Wholesale Trade
Retail Trade
Education and Training
Financial andInsurance Services
Public Administrationand Safety
Rest of Professional, Scientificand Technical Services*
ICT-related industrysubdivisions
ICT workers are employed in a wide variety of organisations that may not have been viewed as traditional employers of ICT workers in the past. This reflects the increasing importance of ICT as the digital economy continues to grow, and the way digital disruption is changing the nature of occupations that a decade ago would not have involved using or producing digital technology. Technological developments associated with this digital disruption have resulted in ICT becoming increasingly accessible to non-ICT workers, changing the way ICT interacts with other business processes and operations.
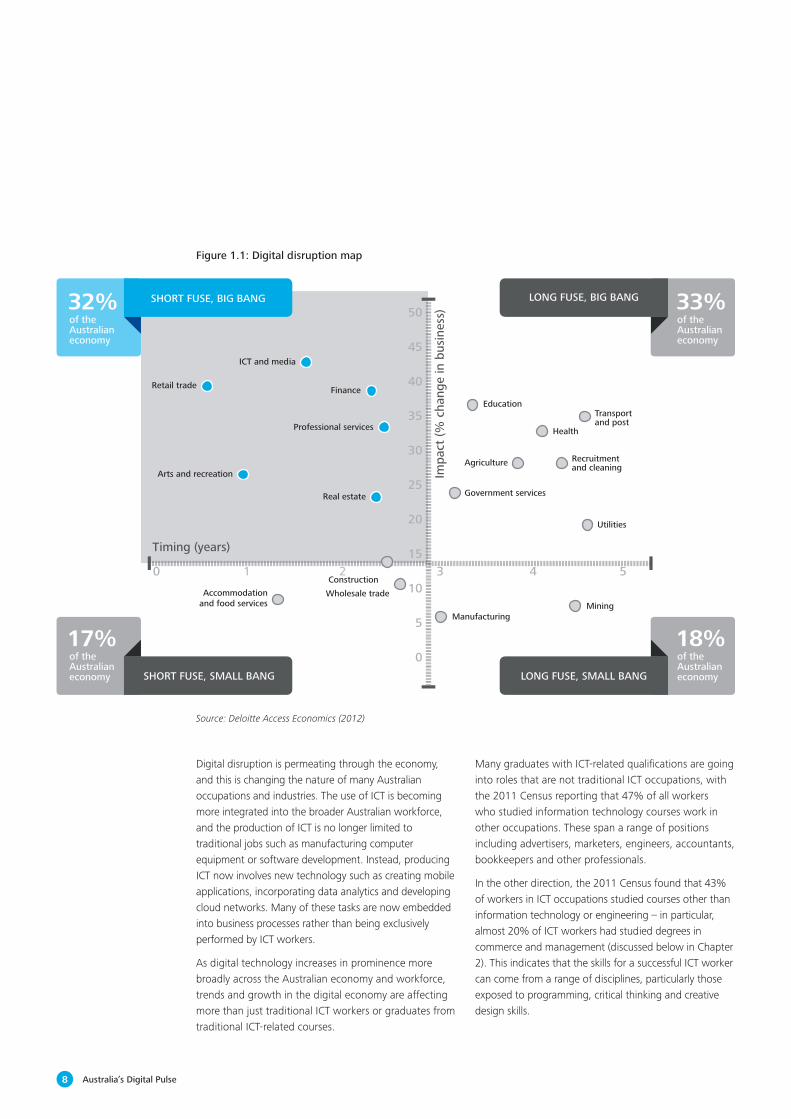
The rapidly growing digital economy (discussed in more detail below) means that ICT skills have an increasingly important role in Australia’s labour force. Greater technology use in the workforce means that Australian workers are increasingly required to possess strong skills in using and producing ICT. Deloitte’s report Digital disruption: Short fuse, big bang? (2012) found that two-thirds of all industries in Australia will be significantly impacted by digital disruption by 2017 (Figure 1.1).2 ICT skills will be critical in responding to these changes.
ICT workers
8 Australia’s Digital Pulse
Digital disruption – Short fuse, big bang? 9
Deloitte’s Digital Disruption Map
In our Digital Disruption Map (Figure 1), we look at the same 18 industries and compare their vulnerability to disruption from two perspectives: the size of the impact and the imminence of change. The map considers the extent to which digital disruption will affect specific industries, plus the timing of that disruption.
To assess the degree of digital disruption for each industry, we considered factors including:
• The extent to which products and services are delivered physically
• The propensity of customers to use digital channels
• The importance of broadband and computing infrastructure in business operations
• How mobile a company’s customers and workforce are, and their average age
• The significance of social media and innovations like cloud computing
• How digital innovation might be inhibited by government regulations or other factors.
This gives us a ranking of how different industries will be more or less affected, and whether it will be soon or further down the track. Companies that stand to experience significant digital disruption within the next three years are said to be on a ‘short fuse’. Those that can expect major change in four to ten years are on a ‘long fuse’.
We then describe the size of the impact, or ‘bang’, as the expected change in percentage terms across a range of key business metrics. Companies that can expect to see a 15–50 per cent change in their metrics, such as mix of revenue channels or cost structures will experience a ‘big bang’. Below 15 per cent, companies will feel a smaller ‘bang’.
Arts and recreationAgriculture
MiningWholesale trade
Government services
Recruitment and cleaning
Transport and post
Health
Education
Utilities
Retail trade
Impa
ct (%
cha
nge
in b
usin
ess)
ICT and media
Finance
Real estate
Professional services
Timing (years)
Accommodation and food services
1 2
Manufacturing
50
45
40
35
30
25
20
15 0 3 4 5
10
5
0
SHORT FUSE, BIG BANG LONG FUSE, BIG BANG
LONG FUSE, SMALL BANGSHORT FUSE, SMALL BANG
of the Australian economy
of the Australian economy
of the Australian economy
of the Australian economy
17%
32%
18%
33%
Construction
Figure 1: Deloitte’s Digital Disruption MapFigure 1.1: Digital disruption map
Source: Deloitte Access Economics (2012)
Digital disruption is permeating through the economy, and this is changing the nature of many Australian occupations and industries. The use of ICT is becoming more integrated into the broader Australian workforce, and the production of ICT is no longer limited to traditional jobs such as manufacturing computer equipment or software development. Instead, producing ICT now involves new technology such as creating mobile applications, incorporating data analytics and developing cloud networks. Many of these tasks are now embedded into business processes rather than being exclusively performed by ICT workers.
As digital technology increases in prominence more broadly across the Australian economy and workforce, trends and growth in the digital economy are affecting more than just traditional ICT workers or graduates from traditional ICT-related courses.
Many graduates with ICT-related qualifications are going into roles that are not traditional ICT occupations, with the 2011 Census reporting that 47% of all workers who studied information technology courses work in other occupations. These span a range of positions including advertisers, marketers, engineers, accountants, bookkeepers and other professionals.
In the other direction, the 2011 Census found that 43% of workers in ICT occupations studied courses other than information technology or engineering – in particular, almost 20% of ICT workers had studied degrees in commerce and management (discussed below in Chapter 2). This indicates that the skills for a successful ICT worker can come from a range of disciplines, particularly those exposed to programming, critical thinking and creative design skills.
9Key challenges for our nation – digital skills, jobs and education
Given the rising prominence of digital technology, the breadth of ICT skills across the Australian economy is increasing. ICT workers are going into a variety of industries, and digital disruption is resulting in increased ICT use within traditionally non-ICT occupations.
In 2010, the OECD estimated that around 22% of the Australian workforce were intense users of ICT in their work, with a significant majority of these roles being non-ICT occupations such as engineers, accountants, lawyers, human resources and marketing.
In fact, for many businesses outside traditional technology industries, ICT is becoming an increasingly important component of their business strategy. Katrina Anderson, Human Resources Manager – Digital at Coles, recognises the importance of ICT for driving innovation within the business. As such, the company’s employees are encouraged to find new ways of applying ICT to increase the quality of customer service across the business, and staff often rotate between the digital department and other areas in order to gain exposure to a range of business activities (for more details, see the Coles box below).
ColesAs one of Australia’s largest supermarket chains, Coles employs around 100,000 team members across Australia. The company operates traditional ‘bricks and mortar’ stores as well as an online retailing division, Coles Online.
Katrina Anderson, Human Resources Manager – Digital at Coles, states that a range of skills required in the IT (Digital) function are currently in short supply, including ‘project management, solutions architects and security experts. Our customers trust us with their personal information, which is why online security is a particular priority for Coles’.
Like most large Australian companies, Coles is determined to increase the number of women in leadership positions within the IT (Digital) function. Female representation at Coles, including in leadership roles, continues to increase.
Investing in IT is a critical part of Coles’ overall business strategy to increase efficiency and cost-effectiveness to meet its customer needs. Katrina observes that this is not limited to the IT department; rather, ‘all team members are encouraged to contribute to innovation and find smarter ways of working by incorporating IT into their roles’.
One example of this is in the role of in-store shoppers – team members who collect orders for Coles Online customers. ‘Our in-store shoppers now have iPads on their trolleys with pictures of the products in the customer’s order. As text can be read differently or is harder to understand, pictures on iPads make the task easier for team members.’
The notion that all team members, even those not specifically working in IT roles, can utilise digital technology in their roles is further developed at Coles by encouraging team members to rotate between areas within the business. This means that the company develops good generalist team members with a broad range of leadership, financial, people and technical skills. It begins at a graduate level and continues through a team member’s career pathway – Katrina notes that ‘we have a graduate from HR doing a rotation in Digital because she wants to understand how, as an HR practitioner, she can apply efficiencies to HR processes in the future. We also have an IT graduate working within the HR team, applying their knowledge to analyse gaps and opportunities in the business using statistics and data analytics’.
These rotations are encouraged because they enable team members to exploit crossovers between IT (Digital) and other areas of the business. This allows Coles team members across the company to find new ways of using IT to improve business processes and more efficiently serve their number one focus: the customer.
Clearly, digital disruption is not just affecting the ICT sector. In light of these trends, Australia needs more ICT skills in the workforce and the broader economy, in order to support innovation and productivity growth in the future. By thoroughly and continuously assessing current and future ICT skills needs in the Australian economy, and ensuring that policy settings and the education system are sufficiently equipping workers with the necessary ICT skills, we can ensure that Australia is well-placed to meet future challenges in the face of digital disruption and a rapidly growing digital economy. These issues will be discussed further in Chapters 2 and 3.

10 Australia’s Digital Pulse
Contribution of the digital economy
Australia’s digital economy was estimated to have contributed around $79 billion to 2013–14 GDP in Deloitte’s report The Connected Continent II: How digital technology is transforming the Australian economy (2015), representing around 5% of total Australian GDP over this period.
The economic contribution of the internet and digital technologies can be difficult to estimate, particularly given the changes generated by digital disruption within Australian businesses across a variety of industries. In Deloitte’s report The Connected Continent II: How digital technology is transforming the Australian economy (2015), the digital economy in Australia was estimated to have contributed $78.8 billion to GDP in 2013–14, representing 5.1% of total Australian GDP.3
This estimate was calculated by examining the economic contribution of the internet and related digital technologies in the Information, Media and Telecommunications (IMT) industry; the rest of the market sector including goods and services produced in other industries; and the non-market sector including education, health and government (Table 1.1).
Table 1.1: Value-added estimate of the economic contribution of the internet and digital technologies, 2013–14
Information, Media and Telecommunications
The rest of the market sector
Non-market sector
Total
Total value added $43.5 billion $1,160.8 billion $256.0 billion $1,460.3 billion
Share of GDP 3% 74% 16% 94%
Internet and digital technologies economic contribution
$13.0 billion $51.7 billion $14.1 billion $78.8 billion
As a share of the total economic contribution of the internet
16% 66% 18% -
As a share of GDP 0.8% 3.3% 0.9% 5.1%
Source: Deloitte Access Economics (2015)
The analysis focused specifically on the contribution of internet and internet-related technologies, a measure that is similar to but not directly comparable with ICT economic activity.4 However, it provides an indication of how critical the internet and digital technologies are in Australia’s economy – which is closely related to the importance of the roles and contribution of ICT workers more broadly.
There has been significant growth in the Australian digital economy over recent years. The $79 billion contribution of the internet in 2013–14 compares with an estimate of $50 billion in 2011, and the rapid growth is expected to continue in a globally-connected digital world. As the digital economy continues to grow, it will become increasingly important to equip Australian workers with ICT skills to further develop innovation and productivity growth in the economy.
3. For more details, see Deloitte (2015), The Connected Continent II: How digital technology is transforming the Australian economy
<http://www2.deloitte.com/content/dam/Deloitte/au/Documents/Economics/deloitte-au-economics-connected-continent-
ii-2015-300315.pdf>.
4. For example, ICT includes some communications, electronics and sales positions that are not internet related and are therefore not
included as part of the economic contribution analysis in the previous report.
11Key challenges for our nation – digital skills, jobs and education
Women in the ICT sector
Women are significantly underrepresented in the Australian ICT sector compared to the wider professional workforce, comprising around one-quarter of all ICT workers. There is also a significant income gap across the ICT workforce, with women on average earning 20% less than men. Other forms of gender discrimination are also apparent in the sector.
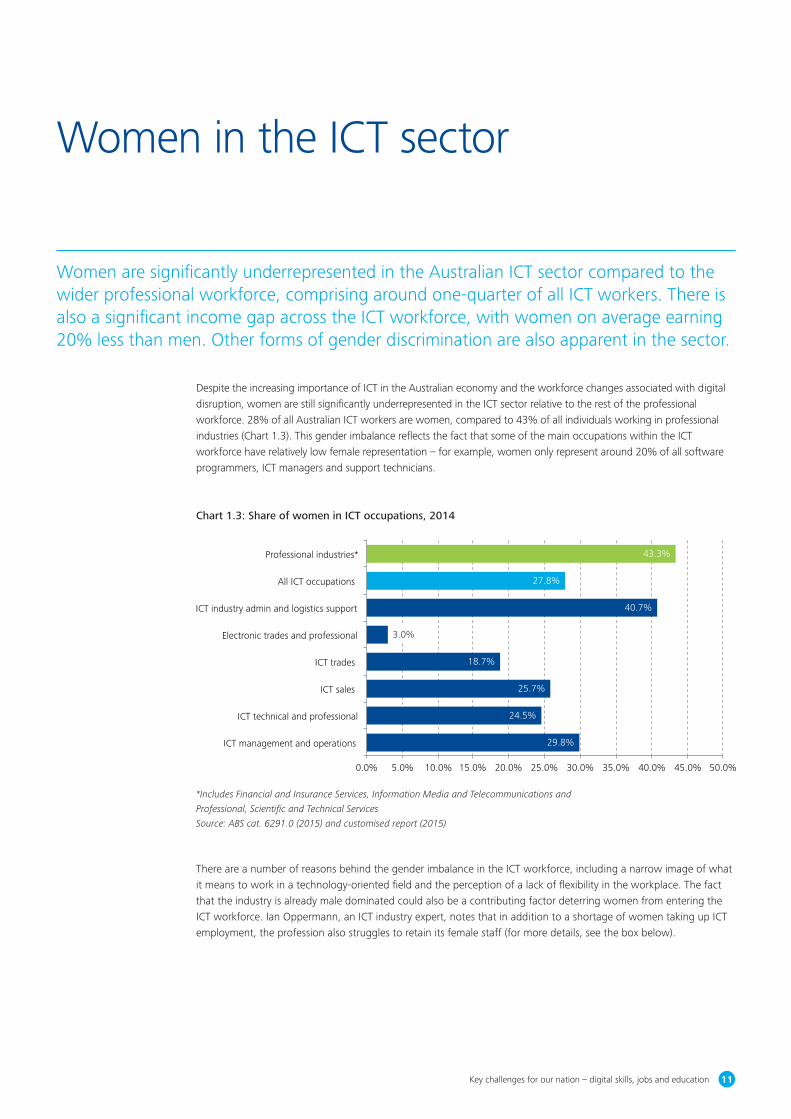
Despite the increasing importance of ICT in the Australian economy and the workforce changes associated with digital disruption, women are still significantly underrepresented in the ICT sector relative to the rest of the professional workforce. 28% of all Australian ICT workers are women, compared to 43% of all individuals working in professional industries (Chart 1.3). This gender imbalance reflects the fact that some of the main occupations within the ICT workforce have relatively low female representation – for example, women only represent around 20% of all software programmers, ICT managers and support technicians.
Chart 1.3: Share of women in ICT occupations, 2014
*Includes Financial and Insurance Services, Information Media and Telecommunications and
Professional, Scientific and Technical Services
Source: ABS cat. 6291.0 (2015) and customised report (2015)
0.0%
43.3%
27.8%
40.7%
18.7%
25.7%
24.5%
29.8%
3.0%
5.0% 10.0% 15.0% 20.0% 25.0% 30.0% 35.0% 40.0% 45.0% 50.0%
ICT management and operations
ICT technical and professional
ICT sales
ICT trades
Electronic trades and professional
ICT industry admin and logistics support
All ICT occupations
Professional industries*
There are a number of reasons behind the gender imbalance in the ICT workforce, including a narrow image of what it means to work in a technology-oriented field and the perception of a lack of flexibility in the workplace. The fact that the industry is already male dominated could also be a contributing factor deterring women from entering the ICT workforce. Ian Oppermann, an ICT industry expert, notes that in addition to a shortage of women taking up ICT employment, the profession also struggles to retain its female staff (for more details, see the box below).

12 Australia’s Digital Pulse
Women and skills in the ICT industryIan Oppermann is a thought leader in the digital economy area and an expert in the ICT sector, with more than 20 years’ experience in the industry. In his experience leading organisations in the ICT industry, Ian has generally perceived few issues in sourcing ICT graduates for entry-level positions. However, ‘while formal qualifications are easy to come by, it is a struggle to find new staff with the right experience’, and Ian notes that workers with a few years’ experience, transferable skills and a broader understanding of system infrastructure as well as an understanding of computing language are more highly valued but in shorter supply. He says that ICT skills issues are part of a broader issue in Australia where talented young graduates with ICT or engineering backgrounds find it difficult to develop technical career paths in Australia due to a lack of a technology company ecosystem, which encourages people overseas.
Ian also identifies a significant shortage of women in the ICT research workforce. He believes that ‘cultural stereotypes, a shortage of strong female role models in the industry and gender divides in research and development’ have a greater influence on the number of women taking up ICT research employment rather than what is specifically taught in schools. Compared with other sciences such as astronomy and material sciences, ICT research also struggles to retain its female workforce. Ian identifies a gap in the understanding of the ‘higher purpose’ associated with ICT, and its potential ‘to change the world through providing equal opportunities to society (for example through the NBN), or through the development of cutting-edge technology’. Ian believes that communicating this purpose more broadly will contribute to retaining the industry’s female staff.
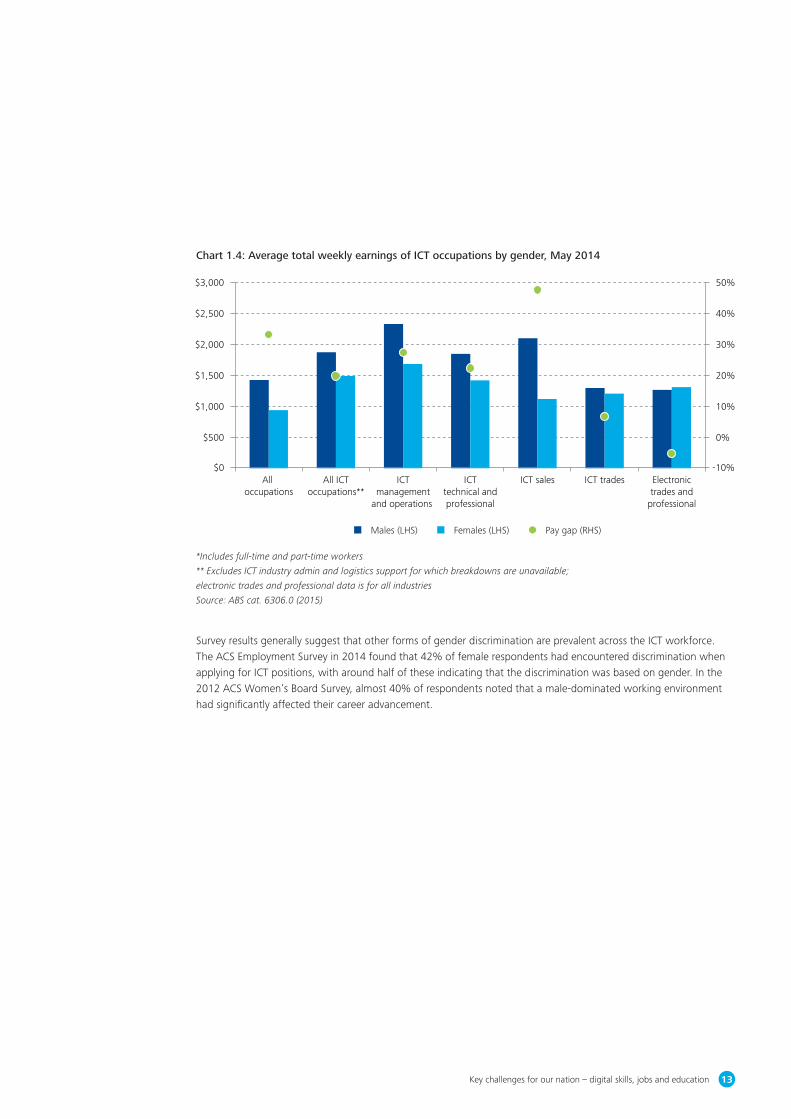
The gender imbalance is also reflected in the incomes paid to ICT workers. Average earnings tend to be significantly lower for women in the ICT workforce compared to men, with an average pay gap of around 20% (Chart 1.4, or Table A.14 for more details). However, income inequality among ICT workers is lower than income inequality across the entire Australian workforce, where females on average earn 34% less than their male counterparts.5 Nonetheless, an earnings differential of 20% is a significant gap, which suggests that the ICT sector has some way to go with respect to improving income equality for women.
5. Note that these comparisons are based on average total earnings by occupation and gender, and as such the pay gaps may partly
be picking up the fact that more women have part-time roles. Nonetheless, data from the 2011 Census show that gender pay
gaps also exist across the ICT occupations for full-time employees only. On this measure, average earnings for women in the ICT
workforce are 7% lower than men, compared to an average pay gap of 14% across all occupations. The CIIER ICT occupation
groupings with the largest gender pay gaps for full-time workers are ICT sales (22%), ICT technical and professional (14%) and ICT
management and operations (10%).
13Key challenges for our nation – digital skills, jobs and education
$0
$500
$1,000
$1,500
$2,000
$2,500
$3,000
0%
-10%
10%
20%
30%
40%
50%
All occupations
All ICToccupations**
ICTmanagement
and operations
ICTtechnical andprofessional
ICT sales ICT trades Electronictrades and
professional
Chart 1.4: Average total weekly earnings of ICT occupations by gender, May 2014
Males (LHS) Females (LHS) Pay gap (RHS)
*Includes full-time and part-time workers
** Excludes ICT industry admin and logistics support for which breakdowns are unavailable;
electronic trades and professional data is for all industries
Source: ABS cat. 6306.0 (2015)
Survey results generally suggest that other forms of gender discrimination are prevalent across the ICT workforce. The ACS Employment Survey in 2014 found that 42% of female respondents had encountered discrimination when applying for ICT positions, with around half of these indicating that the discrimination was based on gender. In the 2012 ACS Women’s Board Survey, almost 40% of respondents noted that a male-dominated working environment had significantly affected their career advancement.

14 Australia’s Digital Pulse
Chart 1.5: Trade in computer services, 2000 to 2014
Trade in ICT services
Australia is both an exporter and importer of ICT services, with total trade flows in 2014 of almost $5 billion in this area. Over recent years, there has been an increase in the offshoring of computer services in particular, with a rise in computer services imports occurring between 2012 and 2014. Australian goods imports also tend to have a higher share of ICT inputs embedded into them compared to exports.
Trade in ICT services totalled almost $5 billion in 2014, comprising $2.9 billion in imports and $2 billion in exports. Within the category of ICT services, trade in computer services such as data processing, IT help desk and hardware and software consultancy represents more than 70% of total trade flows both in and out of Australia (for more details, see Table A.17 and Table A.18).
Exports and imports of computer services have generally tended to be quite balanced since 2000, with both flows gradually rising in the 2000s before levelling out towards the end of the decade. However, the past couple of years have seen a rise in computer services imports, which increased by almost 50% between 2012 and 2014 (Chart 1.5). This indicates that there has been an increase in the offshoring of computer services over recent years, which could be associated with more companies choosing to locate their IT functions overseas.
$0.0b
$0.5b
$1.0b
$1.5b
$2.0b
$2.5b
2000 2001 2002 2003 2004 2005 2006 2007 2008 2009 2010 2011 2012 2013 2014
Imports Exports
Source: ABS cat. 5302.0 (2015)
Returning to the broader category of ICT services, trade data from 2013 shows that one-third of ICT services imports come from Asian countries, roughly the same share as import flows from the United States (Figure 1.2). In particular, one of the faster-growing sources of ICT services imports is India, whose import share almost doubled over five years to reach close to 10% of Australia’s total imports of ICT services in 2013.

15Key challenges for our nation – digital skills, jobs and education
Figure 1.2: Imports of ICT services by region, 2013
$800mUnited States
$810mAsia
$351mEuropean Union
$380mOther
Source: ABS cat. 5368.0 (2015)
Beyond trade in ICT services, OECD data suggests that Australia also has a sizeable trade deficit in ICT goods (for more details, see Table A.25). ICT is also embedded into goods imported and exported across all industries in the economy. For example, manufactured transport equipment imported into Australia could include a computer systems design or software development component. In comparison, the ICT intensity of the inputs used to produce commodity exports is likely to be relatively lower.
An analysis of the industry breakdown of Australian goods imports and exports, combined with an assessment of the average ICT intensity of the intermediate inputs used by Australian industries, suggests that the ICT input share of goods imports was around 7% in 2013.6 In comparison, the ICT input share of goods exports was lower at around 4%, indicating the ICT intensity of Australia’s goods trade is greater on the import side.
6. The intermediate inputs categorised as ICT inputs are ‘Computer Systems Design and Related Services’ and ‘Professional,
Scientific and Technical Services’ under the ABS’s classifications of intermediate use. While the second category may include some
inputs that are not technically ICT-related, these categories provide a good basis for comparison between the ICT intensity of
goods imports and exports.

16 Australia’s Digital Pulse
ICT research and development
ICT research in Australia is largely business-led, in contrast to other areas of research and development. One reason for this is that ICT research is one of the few areas from which individual companies across most industries can benefit, as there are users and producers of ICT across the entire Australian economy.
The majority of research and development in the ICT field in Australia is conducted by businesses. Australian businesses spent around $5.5 billion on ICT research and development in 2011–12, representing around 90% of total ICT research spend (Chart 1.6, or Table A.15 and Table A.16 for more details). Business expenditure on ICT research has grown rapidly over recent years, at an average annual rate of 10% since 2007–08.
Australian businesses spend a relatively large share of their research and development funds on ICT research, which comprises around 30% of businesses’ research expenditure. In contrast, expenditure on ICT research and development by Australian government, higher education and private non-profit organisations represents less than 5% of their overall research spend. The fact that ICT research is largely business-led stands in contrast to other areas of research and development in Australia – for example, medical research is primarily funded by higher education organisations, while the government largely leads research into agriculture.
This could point to two factors. First, the economic and social importance of ICT has emerged over a period where higher education funding has declined and government budgets have been tightened. Given that these organisations have already committed funding or dedicated research facilities in other fields of research, it is not surprising that their priorities for research and development expenditure are in other areas. This means that businesses are required to fill the gap of investing in ICT research and development if this is necessary for growth.
Second, ICT is one of the few general use technologies where individual companies across most industries can invest in research and development and obtain a return on their investment, as digital disruption creates users and producers of ICT across the entire Australian economy. While other major areas of research such as medicine and agriculture are mainly for their respective industries, increased efficiency in the use and production of ICT can benefit a wide range of industries. As such, it makes sense that ICT research is largely business-led – because it is a profitable action for businesses in a range of industries to take.
Chart 1.6: Expenditure on ICT research and development, 2011–12
$5,496m
$9m
$2m
$331m
$314m
Sources: ABS cat. 8104.0 (2013), 8109.0 (2014), 8111.0 (2014)
Business
Government – state
Government – federal
Higher education
Private non-profit

17Key challenges for our nation – digital skills, jobs and education
Australia’s ICT strengths and weaknesses
Compared with other developed countries, Australia is a high-level user and adopter of ICT, with comparatively high rates of mobile broadband penetration and business adoption of ICT for commercial practices. However, Australians are relatively low-level producers of ICT, as the size of Australia’s ICT workforce is around the middle of the pack and ICT’s share of Australian research expenditure is relatively low.
The size of Australia’s ICT workforce as a share of total jobs in the economy is around the middle of the pack when compared to other developed countries. While data from the OECD suggests that the share of ICT specialists in the workforce is smaller than a number of Nordic and North American countries, Australia outranks several other European countries on this measure (Table 1.2, or Table A.19 and Table A.20 for more details).7 This is also the case for the share of ICT-intensive occupations in each economy’s workforce.
While Australia is around average for the size of its ICT workforce and the share of ICT-intensive occupations in the economy, the adoption of ICT by Australian businesses for commercial practices ranks highly compared to other developed countries. A relatively high share of 38% of Australian businesses engage with customers through e-commerce and online sales, while around three quarters of businesses have an online presence through a website or homepage (Table 1.3, or Table A.27 and Table A.28 for more details).
Table 1.2: Share of ICT specialists and intensive users in the total economy, 2010
Specialists (narrow)
Intensive occupations (broad)
Sweden 5.4% 26.5%
Norway 4.7% 24.1%
Finland 4.5% 25.5%
Denmark 4.4% 27.3%
Canada 4.4% 21.2%
United States 4.0% 20.3%
Australia 3.6% 22.1%
Germany 3.5% 22.5%
United Kingdom 3.3% 28.1%
France 3.1% 20.7%
Spain 3.1% 19.5%
Italy 3.1% 20.4%
Source: OECD, Information Technology Outlook (2010)
Source: OECD, ICT Database (2014)
Table 1.3: E-commerce by country
Share engaged in sales via e-commerce (2012)
Share of businesses with website (2013)
New Zealand 47% 78%
Australia 38% 74%
Denmark 30% 92%
Norway 28% 79%
Germany 26% 84%
Sweden 26% 89%
Japan 25% 89%
United Kingdom 22% 82%
Finland 19% 94%
Canada 19% 78%
Korea 15% 60%
Spain 14% 68%
France 14% 65%
Italy 8% 67%
18 Australia’s Digital Pulse
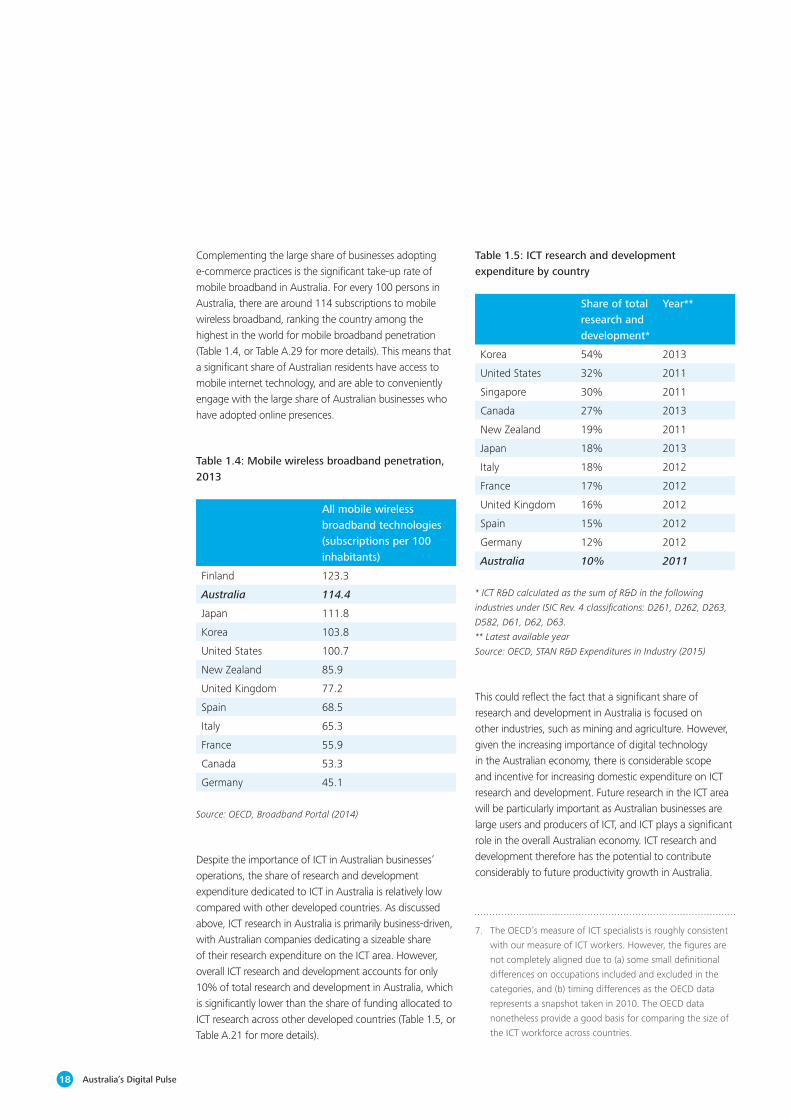
Complementing the large share of businesses adopting e-commerce practices is the significant take-up rate of mobile broadband in Australia. For every 100 persons in Australia, there are around 114 subscriptions to mobile wireless broadband, ranking the country among the highest in the world for mobile broadband penetration (Table 1.4, or Table A.29 for more details). This means that a significant share of Australian residents have access to mobile internet technology, and are able to conveniently engage with the large share of Australian businesses who have adopted online presences.
Table 1.4: Mobile wireless broadband penetration, 2013
All mobile wireless broadband technologies (subscriptions per 100 inhabitants)
Finland 123.3
Australia 114.4
Japan 111.8
Korea 103.8
United States 100.7
New Zealand 85.9
United Kingdom 77.2
Spain 68.5
Italy 65.3
France 55.9
Canada 53.3
Germany 45.1
Despite the importance of ICT in Australian businesses’ operations, the share of research and development expenditure dedicated to ICT in Australia is relatively low compared with other developed countries. As discussed above, ICT research in Australia is primarily business-driven, with Australian companies dedicating a sizeable share of their research expenditure on the ICT area. However, overall ICT research and development accounts for only 10% of total research and development in Australia, which is significantly lower than the share of funding allocated to ICT research across other developed countries (Table 1.5, or Table A.21 for more details).
Table 1.5: ICT research and development expenditure by country
Share of total research and development*
Year**
Korea 54% 2013
United States 32% 2011
Singapore 30% 2011
Canada 27% 2013
New Zealand 19% 2011
Japan 18% 2013
Italy 18% 2012
France 17% 2012
United Kingdom 16% 2012
Spain 15% 2012
Germany 12% 2012
Australia 10% 2011
This could reflect the fact that a significant share of research and development in Australia is focused on other industries, such as mining and agriculture. However, given the increasing importance of digital technology in the Australian economy, there is considerable scope and incentive for increasing domestic expenditure on ICT research and development. Future research in the ICT area will be particularly important as Australian businesses are large users and producers of ICT, and ICT plays a significant role in the overall Australian economy. ICT research and development therefore has the potential to contribute considerably to future productivity growth in Australia.
Source: OECD, Broadband Portal (2014)
* ICT R&D calculated as the sum of R&D in the following
industries under ISIC Rev. 4 classifications: D261, D262, D263,
D582, D61, D62, D63.
** Latest available year
Source: OECD, STAN R&D Expenditures in Industry (2015)
7. The OECD’s measure of ICT specialists is roughly consistent
with our measure of ICT workers. However, the figures are
not completely aligned due to (a) some small definitional
differences on occupations included and excluded in the
categories, and (b) timing differences as the OECD data
represents a snapshot taken in 2010. The OECD data
nonetheless provide a good basis for comparing the size of
the ICT workforce across countries.

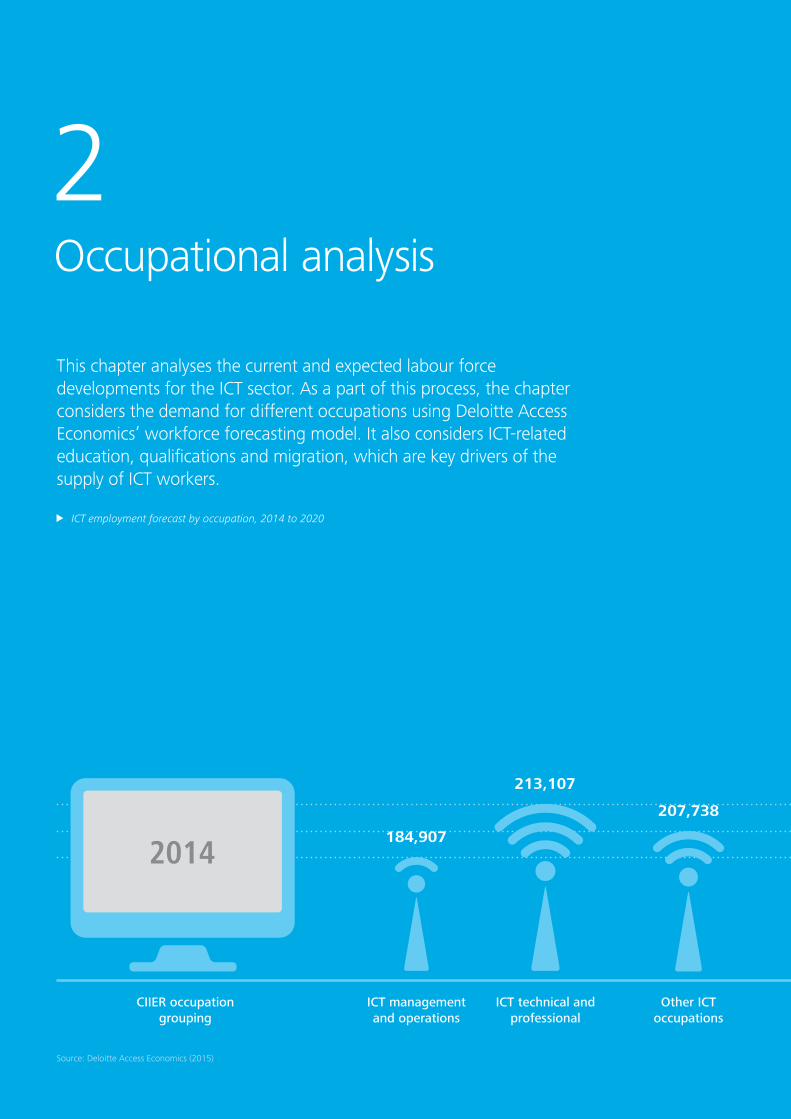
2Occupational analysis
This chapter analyses the current and expected labour force developments for the ICT sector. As a part of this process, the chapter considers the demand for different occupations using Deloitte Access Economics’ workforce forecasting model. It also considers ICT-related education, qualifications and migration, which are key drivers of the supply of ICT workers.
ICT employment forecast by occupation, 2014 to 2020
CIIER occupation grouping
2014
ICT technical and professional
213,107
ICT management and operations
184,907
207,738
Other ICT occupations
Source: Deloitte Access Economics (2015)

605,752
2020
CIIER occupation grouping(Average annual growth
in percentage)
ICT technical and professional
ICT management and operations
Other ICT occupations
222,080
3.1%247,919
2.6%
230,484
1.7%
20202014
700,483
2.5%
Total ICT workers Total ICT workers(Average annual growth
in percentage)

22 Australia’s Digital Pulse
Table 2.1: ICT employment forecast by occupation, 2014 to 2020
CIIER occupation grouping
2014 2020 Average annual growth
ICT management and operations
184,907 222,080 3.1%
ICT technical and professional
213,107 247,919 2.6%
ICT sales 28,909 35,193 3.3%
ICT trades 80,109 87,148 1.4%
Electronic trades and professional*
3,828 3,939 0.5%
ICT industry admin and logistics support*
94,892 104,205 1.6%
Total ICT workers 605,752 700,483 2.50%
Demand for ICT workers
Despite evidence of some offshoring of ICT work occurring, the demand for ICT workers remains strong. The role of ICT workers in facilitating the increasingly important digital economy means that forecast employment growth for the sector is stronger than the economy as a whole. Growth in the ICT sector is likely to be strongest for technical, professional, management and operational occupations. This reflects the integration of ICT workers across a broad range of industries, particularly professional services.
The demand outlook for the ICT sector remains robust. In Deloitte’s thought leadership piece Positioning for prosperity? Catching the next wave (2014), the ICT sector was identified as a ‘slipstream star’, a sector uniquely positioned for growth with strong global opportunity meeting Australian advantage.8 The ICT sector is an important catalyst for growth in other sectors and will benefit from the increasingly digital and data driven nature of economies worldwide.
Future demand for ICT occupationsAs discussed in Chapter 1, there are many more people who can be classed as ICT workers than there are people working in the Information, Media and Telecommunications industry designated by the ABS. The analysis of the ICT workforce in Chapter 1 found that there were around 600,000 people working in ICT relevant occupations, amounting to around 5% of the Australian labour force.
Looking forward, solid jobs growth is expected for the ICT sector over the coming six years. Overall employment in the ICT sector is expected to grow by 2.5% per year over the next six years to 2020 (Table 2.1). This is higher than forecast growth in employment for the economy as a whole, which is forecast to grow by around 1.6% over the same period. The outperformance of the ICT sector reflects its importance in Australia’s workforce and its role in enabling the digital economy.
Within the ICT workforce, jobs growth is predicted to be strongest for ICT management and operations (3.1% average annual growth), ICT technical and professional workers (2.6% average annual growth) and ICT sales workers (3.3% average annual growth). ICT workers in the trades fields are expected to see more modest growth; 1.4% p.a. for ICT trades and 0.5% p.a. for electronic trades and professionals. Finally, employment in the ICT industry admin and logistics support employment group is expected to see reasonably healthy growth of 1.6% p.a.
* Employment in these occupations has only been counted
for the ICT-related industry subdivisions, consistent with the
definitions in Table A.3
Source: Deloitte Access Economics (2015)
8. For more details, see Deloitte (2014), Positioning for
prosperity? Catching the next wave <http://www2.deloitte.
com/content/dam/Deloitte/au/Documents/Building%20
Lucky%20Country/Deloitte_au_business_positioning_for_
prosperity_2014.pdf>. Note that the ICT sector as defined
in the 2014 report is not directly comparable with the
definition of the ICT workforce applied in Table A.3 and
throughout this report, which is primarily based on ABS
occupational classifications at the 4-digit ANZSCO level.

23Key challenges for our nation – digital skills, jobs and education
Chart 2.1: Historical and forecast ICT employment, 2008 to 2020
The fact that ICT management, operations, technical and professional roles are expected to drive employment growth in the ICT workforce over the near future is consistent with the trend observed over the past six years. Between 2008 and 2014, these particular ICT occupations accounted for almost 70% of total growth in the ICT workforce (Chart 2.1). This reflects the integration of technical and operational ICT workers across a broad range of sectors outside of traditional technology industries (such as the professional services industry) – a trend which is expected to persist as the digital economy grows and digital disruption continues to change the way different occupations use and produce technology.
Importantly, this trend towards continued integration of ICT into business operations means that the definition of ICT workers and the ICT requirements of Australian businesses are likely to expand further over the coming decade. For example, mining that is currently done on-site may be done remotely in the future, which could mean that some traditional engineering roles will merge with ICT-related positions. Because of these trends, the projected growth in demand for ICT workers may be understated as the forecasts assume that the role of ICT in the future will be constrained to similar functions as are performed now.
0
50,000
100,000
150,000
200,000
250,000
300,000
ICTmanagement
andoperations
ICT technicaland
professional
ICT sales ICT trades Electronictrades and
professional
ICT industryadmin and
logistic support
2008 2014 2020
Future demand for ICT qualifications and skillsThe expected increase in demand for ICT workers implies that future demand for ICT qualifications and skills in the Australian economy will also increase. However, demand for qualifications depends not only on the employment forecasts above, but also on other skills and market considerations. These considerations include the propensity for different occupations to hold certain education levels and forecast retirement rates.
24 Australia’s Digital Pulse
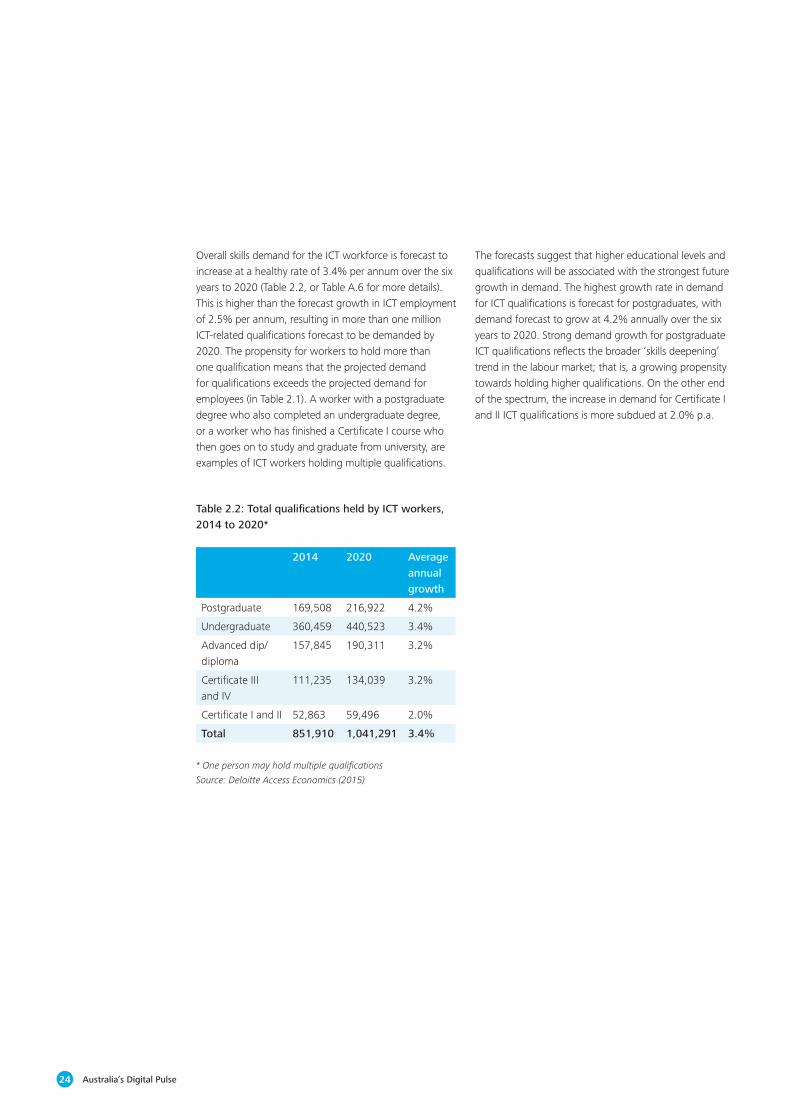
Overall skills demand for the ICT workforce is forecast to increase at a healthy rate of 3.4% per annum over the six years to 2020 (Table 2.2, or Table A.6 for more details). This is higher than the forecast growth in ICT employment of 2.5% per annum, resulting in more than one million ICT-related qualifications forecast to be demanded by 2020. The propensity for workers to hold more than one qualification means that the projected demand for qualifications exceeds the projected demand for employees (in Table 2.1). A worker with a postgraduate degree who also completed an undergraduate degree, or a worker who has finished a Certificate I course who then goes on to study and graduate from university, are examples of ICT workers holding multiple qualifications.
2014 2020 Average annual growth
Postgraduate 169,508 216,922 4.2%
Undergraduate 360,459 440,523 3.4%
Advanced dip/diploma
157,845 190,311 3.2%
Certificate III and IV
111,235 134,039 3.2%
Certificate I and II 52,863 59,496 2.0%
Total 851,910 1,041,291 3.4%
The forecasts suggest that higher educational levels and qualifications will be associated with the strongest future growth in demand. The highest growth rate in demand for ICT qualifications is forecast for postgraduates, with demand forecast to grow at 4.2% annually over the six years to 2020. Strong demand growth for postgraduate ICT qualifications reflects the broader ‘skills deepening’ trend in the labour market; that is, a growing propensity towards holding higher qualifications. On the other end of the spectrum, the increase in demand for Certificate I and II ICT qualifications is more subdued at 2.0% p.a.
* One person may hold multiple qualifications
Source: Deloitte Access Economics (2015)
Table 2.2: Total qualifications held by ICT workers, 2014 to 2020*

25Key challenges for our nation – digital skills, jobs and education
Supply of ICT workers
The ICT field of education has struggled to attract domestic students. Despite a growing tertiary market, ICT enrolments and completions at the tertiary level are well below the levels seen in the early years of the 2000s. Employers of ICT workers have been able to source workers from other fields of education, such as engineering. Vocational education outcomes are steadily improving in terms of student numbers. Anecdotal evidence suggests that workers from overseas are being used to address skills gaps in technical computing capabilities which are currently in short supply in Australia.
Higher educationThe higher education market is one of the most important sources of new domestic talent to the ICT sector. The increase in the use of digital technology across the broader economy, as well as increasing specialisation within ICT-related industries, means that higher education will be a critical source of ICT skills supply in the future.
The broad IT field of education includes: computer science, information systems and other information technology.9 Furthermore, anecdotal evidence gathered in consultations with the business community indicates that employers also hire ICT workers from other fields of education where skills are transferrable, such as engineering, physics or maths. In particular, growth areas within ICT are increasingly requiring strong mathematical skills to take advantage of big data, for example through artificial intelligence (for more details, see box below).
Artificial intelligence and machine learningArtificial intelligence has been identified as a high growth and disruptive area of ICT, particularly the area of machine learning. Machine learning is a form of artificial intelligence where computers teach themselves, as opposed to being instructed in what to do (as is the case with traditional programming). This involves training machines to identify patterns and make predictions by crunching vast amounts of data, allowing machines to handle problems and issues which previously had to be solved by humans.
Machine learning and artificial intelligence, as evidenced in robotic cars and automated trading in financial services, will be crucial in future developments in the ICT and robotics sectors. This is the case not only for large businesses but also for smaller start-up companies. A recent article in the Financial Times described artificial intelligence as ‘one of the hottest trends in start-up investing’, with significant investor interest in this area.10 For the entrepreneurs and their employees who are facilitating these frontier developments in artificial intelligence, strong coding abilities and exceptional mathematical skills are essential.
9. This is consistent with the ABS’s Australian Standard Classification of Education.
10. For more details, see Financial Times (2015), Investor rush to artificial intelligence is real deal (http://www.ft.com/intl/cms/
s/2/019b3702-92a2-11e4-a1fd-00144feabdc0.html).

26 Australia’s Digital Pulse
Data on the fields of education studied by ICT workers in 2011 supports the idea that ICT workers can be sourced from a range of degrees. While the IT field of education is the largest feeder into ICT occupations, it only accounted for around 35% of ICT workers’ field of education overall (Chart 2.2 and Table A.9). Engineering was a large source of ICT workers, while management and commerce was also a significant contributor. As a result, employers of ICT workers are by no means reliant on sourcing graduates solely from IT degrees.
0.0% 10.0% 20.0% 30.0% 40.0%
Natural andPhysical Sciences
Other
Society and Culture
Creative Arts
Management andCommerce
Engineering andRelated Technologies
InformationTechnology
Chart 2.2: ICT workers’ field of education, 2011Chart 2.3: Domestic enrolments by field of education, 2001 to 2013
Source: ABS Census (2011)Source: Department of Education u-Cube (2015)
ICT workers
However, enrolments in IT degrees specifically have seen weak periods over recent years (Chart 2.3 and Table A.10). Domestic IT enrolments peaked in the early 2000s during the ‘dot-com boom’, but declined sharply over the 2000s despite a generally prosperous period for the broader economy. Domestic IT enrolments stabilised around the time of the global financial crisis in 2008 and have gradually increased since then, though they have remained well below previous highs.
In contrast, engineering student enrolments have performed strongly over this period, with strong increases since the mid-2000s. However, while engineering degrees represent a significant source of ICT workers, this trend is likely related to the increase in employment opportunities in the resources construction sector presented by the mining boom (now waning), rather than an increase in enrolments in ICT-related engineering degrees such as computer or software engineering.11
0
10,000
20,000
30,000
40,000
50,000
60,000
2000 2003 2008 2013
Engineering undergraduate enrolments
Engineering postgraduate enrolments
IT undergraduate enrolments
IT postgraduate enrolments
As the lucrative employment opportunities afforded by the mining boom recede and the broader community increasingly grasps the prospects of the ICT sector, it can be expected that student interest will pick up again. Professor Roy Green, Dean of the University of Technology Sydney Business School, notes that there are already signs of this occurring as the digital economy grows in prominence across Australia (for more details, see the University of Technology Sydney box below).
11. A further breakdown of the engineering category into type of engineering degree is unavailable.

27Key challenges for our nation – digital skills, jobs and education
University of Technology SydneyThe University of Technology Sydney (UTS) is one of Australia’s leading universities of technology. It offers a number of courses in information technology, computer science and engineering, with a focus on practice-based learning, industry engagement and user-centred research. Given the increasing importance of digital technology in business and innovation, joint courses in information technology and business are also offered at UTS. These courses are designed to equip graduates with the combined skills to apply an in-depth knowledge of information technology to business activities.
Professor Roy Green, Dean of the UTS Business School, believes that the future of the economy will increasingly be in ‘design thinking and business analytics’, skills which students develop through ICT-related degrees. ‘These skills, as well as problem solving and critical thinking skills, need to be combined with specialised disciplinary thinking in order to foster innovation in the economy.’ In light of this, UTS has created a new Digital Creative Hub Intersection to support the ecosystem of digital and creative start-ups in Sydney.
Professor Green thinks that the decline in domestic enrolments and completions in ICT-related degrees since the early 2000s is in part related to the mining boom in Australia over this period. ‘During the mining boom, there was a decline in interest in technology courses in favour of mining-related courses. As the mining boom recedes, we could potentially see a swing back towards technology courses.’ Consistent with this, ‘UTS saw a 3% increase in enrolments in IT-related undergraduate courses in 2014, and based on 2015 offer-to-enrolled conversion figures, enrolments are still growing’.
Notwithstanding the recent pickup in IT enrolments, Professor Green acknowledges that the decline in technology graduates over the past decade has led to employers bringing in overseas workers on 457 visas in order to meet their technical skills needs. Further exacerbating this skills shortage is the fact that ‘Silicon Valley companies are doing worldwide recruitment drives – so we are losing our best graduates to overseas when we don’t have enough to begin with’.

28 Australia’s Digital Pulse
Completions of IT degrees have followed a similar path to enrolments, peaking in the early 2000s before declining and stabilising over recent years (Chart 2.4 and Table A.11). The trend upwards in enrolments over the past couple of years indicates that completions should move modestly higher in coming years. In contrast, engineering completions are at record high levels, but may soon start to fade as employment opportunities driven by the mining boom recede.
0
1,000
2,000
3,000
4,000
5,000
6,000
7,000
8,000
9,000
2001 2002 2003 2004 2005 2006 2007 2008 2009 2010 2011 2012 2013
Chart 2.4: Domestic completions by field of education, 2001 to 2013
Source: Department of Education u-Cube (2015)
Engineering undergraduate completions
Engineering postgraduate completions
IT undergraduate completions
IT postgraduate completions
Overall, the low level of domestic ICT degree completions has resulted in a weak graduate pipeline of ICT workers. Some employers have also been disappointed by the quantity and quality of students graduating from domestic universities. While there are signs student interest is starting to turn around, the argument that the sector suffers from an ‘image problem’ which affects its ability to attract high quality students perhaps still has merit. In 2013, the Australian Workforce Planning Authority (AWPA) reported in its ICT Workforce Study:‘The ICT industry and profession has an image problem. Persistent and long-held negative perceptions of predominantly male ICT professionals engaged in desk-bound, repetitive, isolating jobs have implications for the pipeline of ICT skills.’
At a colloquial level, the ICT industry is consistently portrayed with this stereotype in popular culture (for example, in TV programs such as The IT Crowd), while other professions are gloried in terms of money and prestige in the entertainment space (such as law, finance and medicine). This could be contributing to the industry’s image problem amongst younger generations in particular.

29Key challenges for our nation – digital skills, jobs and education
Chart 2.5: VET enrolments in the IT field of education, 2009 to 2013
Source: National Centre for Vocational Education Research
(2015)
Vocational education and trainingVocational education and training (VET) relevant to the IT industry has picked up in the past couple of years with enrolments and completions increasing significantly from 2011. Certificates, particularly the introductory Certificate I level, have been the key driver of this increase in total enrolments (Chart 2.5 and Table A.12), and greater levels of such introductory training may provide some impetus for students to seek further (higher level) training at a later stage.12
0
5,000
10,000
15,000
20,000
25,000
30,000
35,000
40,000
2009 2010 2011 2012 2013
Advanced dip/dip
Cert III/IV Cert I/II
Aside from the formal qualifications received through vocational and tertiary education, it should be noted that on the job training is also important for developing ICT skills in the workforce. For example, a representative from the Department of Immigration and Border Protection’s ICT Division notes that such training is important for keeping workers’ skills up to date given the rapidly changing nature of digital technology (for more details, see the Department of Immigration and Border Protection box below).
12. The large increase in Certificate I enrolments in 2012 are in large part due to classification issues, as non-AQF (Australian
Qualifications Framework) qualifications fell sharply at the same time, indicating that those qualifications may now be classified
as a Certificate I level.
Australian Department of Immigration and Border ProtectionThe Department of Immigration and Border Protection (DIBP) is the Federal Government department responsible for managing migration, humanitarian and citizenship policy and programmes. DIBP works to keep Australia secure through border management and facilitates travellers crossing the border.
DIBP has significant digital technology needs and requirements, as ICT is a critical business enabler that supports all aspects of the Department’s activities. DIBP currently employs an ICT workforce of around 1,600. The Department employs a broad set of ICT occupations, ‘including business analysts, testers, infrastructure specialists, security analysts, network operations analysts, helpdesk workers and program management staff’. These employees work on projects that are both internal and external facing, and the pervasiveness of digital technology across the organisation highlights the importance of ICT within large Government departments.
However, despite the size of DIBP’s ICT workforce, there are still a number of gaps in relation to the technical skills required within the organisation. Increasing the supply of qualified ICT workers is not just about increasing graduates from ICT-related degrees. ‘It’s also important for ICT workers to keep upskilling and regularly refreshing their skill set, including non-technical skills. Given the rapid pace of technological change, this includes on the job training in addition to formal qualifications in order to keep skills up to date. It’s not just about the inflow of ICT Entry Level staff, apprentices, cadets and graduates, but also about managing the process of ICT change and staying innovative.’

30 Australia’s Digital Pulse
MigrationRelative to many other professional occupations, ICT skills and workers are more readily transferrable between countries. For example, there is likely to be less country-specific knowledge required to perform an ICT role than, say, a position in law or finance which might involve more detailed knowledge of local regulation and government policy. This suggests that skilled migration is likely to be a more realistic option for filling ICT-related vacancies in Australia, compared with other professional roles.
A moderate share of temporary 457 visas (which allow skilled workers to work in Australia for a period of up to four years with approved Australian businesses) have been granted to ICT workers. Visa grants for temporary skilled migration of ICT workers have historically accounted for around 10–15% of total 457 visa grants (Chart 2.6, or Table A.7 for more details). In the 2013–14 financial year, almost 12,000 ICT workers were granted 457 visas, representing 12% of total visas granted.
Chart 2.6: Subclass 457 (temporary skilled work) visas in the ICT sector
* Excludes ICT industry admin and logistics support for which breakdowns are unavailable; electronic trades and professional data
is for all industries
Source: Department of Immigration, Subclass 457 Visa Statistics (2015)
0
2,000
4,000
6,000
8,000
10,000
12,000
14,000
16,000
0%
2%
4%
6%
8%
10%
12%
14%
16%
2005-06 2006-07 2007-08 2008-09 2009-10 2010-11 2011-12 2012-13 2013-14
ICT 457 visa grants* (LHS) Share of total 457 visa grants (RHS)
More than 10,000 457 visas per year have been granted to ICT workers over recent years. While temporary skilled migration of a little more than 10,000 workers per year is not a significant number in a workforce totalling around 600,000 ICT workers, anecdotal evidence indicates that 457 visas are being used to address skills gaps in key areas of technical computing capabilities within the ICT workforce. In particular, consultations with the business community suggest that there are shortages in skills such as programming and coding, computer science theory and computational thinking, which could potentially be associated with the weak graduate pipeline.
The view that there continues to be ongoing domestic shortages in technical ICT skills is supported by the fact that the occupation in which the most 457 visas are granted out of all ICT roles is software and applications programmers. In recent years, between one-third and one-half of all 457 visas granted to ICT workers have been to this particular occupation, suggesting that programming skills are in short supply amongst domestic workers. Deloitte’s report Australia’s STEM workforce: a survey of employers (2014) also found that these technical capabilities are valuable to Australian employers, with more than half of all employers of technology-qualified individuals rating programming skills as important or very important in an employee.13
13. For more details, see Deloitte (2014), Australia’s STEM workforce: a survey of employers <http://www2.deloitte.com/content/
dam/Deloitte/au/Documents/Economics/deloitte-au-economics-australia-stem-workforce-report-010515.pdf>.

31Key challenges for our nation – digital skills, jobs and education
* Excludes ICT industry admin and logistics support for which breakdowns are unavailable; electronic trades and professional data
is for all industries
Source: Department of Immigration and Border Protection, Overseas Arrivals and Departures Statistics (2015)
Consistent with the data on 457 visa grants, software and applications programmers also recorded the highest visitor arrivals for employment purposes amongst all ICT occupations, with around 5,800 workers arriving in Australia in 2013–14 (Table 2.3, or Table A.8 for more details). Significantly, the occupation recorded only 600 residents departing for employment purposes, resulting in a net migration inflow of around 5,200 programmers.14 This accords with the views of employers in the industry that technical skills are in short supply domestically. More broadly, across all ICT occupations there were around 21,000 arrivals and only 2,000 departures in 2013–14, indicating that Australia received a pronounced net ‘brain gain’ of ICT workers and skills over this period.
Table 2.3: Arrivals and departures of ICT workers, 2013–14
Arrivals Departures Net migration
Software and Applications Programmers 5,797 645 5,152
ICT Business and Systems Analysts 2,630 127 2,503
Management and Organisation Analysts 3,180 771 2,409
ICT Sales Professionals 1,260 6 1,254
Other Information and Organisation Professionals 1,223 6 1,217
ICT Managers 1,335 123 1,212
ICT Support and Test Engineers 969 3 966
Other ICT occupations 4,687 321 4,366
Total ICT workers* 21,081 2,002 19,079
14. Note that these figures do not account for any potential double counting which could be associated with the same ICT worker
arriving in Australia twice in one year.
This net ‘brain gain’ of ICT skills has been an ongoing trend, with net arrivals of ICT workers for employment purposes totalling between 16,000 and 21,000 in recent years. In particular, arrivals of software and applications programmers have been relatively high for a number of years (Chart 2.7). The consistently elevated number of arrivals of programmers reinforces the notion that employers are relying on workers from overseas to meet their needs in technical ICT skills and capabilities.

32 Australia’s Digital Pulse
*Excludes ICT industry admin and logistics support for which breakdowns are unavailable; electronic trades and professional data is
for all industries.
Source: Department of Immigration and Border Protection, Overseas Arrivals and Departures Statistics (2015)
Chart 2.7: Net migration of ICT workers, 2011–12 to 2013–14
0 1,000 2,000 3,000 4,000 5,000 6,000
Other ICT occupations*
ICT Support and Test Engineers
ICT Managers
Other Information and Organisation Professionals
ICT Sales Professionals
Management and Organisation Analysts
ICT Business and Systems Analysts
Software and Applications Programmers
2011–2012 2012–2013 2013–2014
Some employers of ICT workers have indicated that there could be an element of circularity related to employment of domestic workers in ICT occupations. Australian students are reluctant to study ICT-related degrees due to a perception that ICT jobs are going offshore or to temporary migrants. As a result, these jobs do go overseas or to foreign workers in Australia due to a weak pipeline of domestic graduates with technical capabilities.
Industry experts have observed that this is a concern in relation to ICT roles that are being commoditised and offshored (discussed above in Chapter 1), particularly for entry-level roles. While the offshoring of these positions allows Australian businesses to fulfil some of their ICT skills needs now, a reduction in the number of entry-level ICT workers employed in Australia now could potentially result in an insufficient talent pool for more advanced roles in the future. Increased offshoring of ICT roles means that there are fewer workers being trained domestically, which could lead to fewer employees progressing through ICT careers in Australia into management roles in future years.

33Key challenges for our nation – digital skills, jobs and education
Source: Department of Employment, Labour Market Research –
Information and Telecommunications (ICT) Professions (2014)
Source: Department of Employment, Labour Market Research –
Information and Telecommunications (ICT) Professions (2014)
Overall demand and supply balance
The overall Australian ICT labour market appears to be adequately supplied at present, noting the reliance on workers from overseas. However, the expected increase in future demand for ICT workers means that skills shortages – particularly in technical capabilities – could constrain future economic activity. This suggests that domestic completions of ICT-related tertiary degrees will need to rise from their currently subdued levels. Raising female participation in ICT occupations could also increase the future supply of ICT workers.
Amidst the domestic shortage in ICT skills, Australian employers have been turning to workers from overseas to meet their skills needs, particularly in technical capabilities. As a result of this, it appears that there are no acute worker shortages in the ICT sector at present. Information published by the Department of Employment supports the idea that the ICT labour market is adequately supplied at present. A 2014 listing of selected ICT-related occupations and the Department’s shortage ratings for each role showed that the Department determined no skill shortages across all occupations listed (Table 2.4).
Table 2.4: Selected ICT occupations and shortage ratings, 2014
Chart 2.8: Trends in applicants for ICT employment, 2013 to 2014
Occupations Title Rating
2611–11 ICT Business Analyst
No shortage
2611–12 Systems Analyst
No shortage
2613–11 and 2613–12
Analyst and Development Programmer
No shortage
2613–13 Software Engineer
Recruitment difficult for software engineers with high level security clearance
2631–11 Computer Network and Systems Engineer
No shortage
Furthermore, recent analysis conducted by the Department found that competition for vacancies in ICT employment increased over the year, with an average of 49.9 applicants per vacancy in 2014, up from 31.9 in 2013 (Chart 2.8). The number of suitable applicants also increased over this period, from 3.6 per vacancy in 2013 to 5.0 in 2014. The analysis also found that qualifications were not a key requirement for most ICT occupations. Rather, there was a significant focus placed on certifications in software packages and relevant experience.
0
10
20
30
40
50
60
0
1
2
3
4
5
6
2013 2014
Applicants per vacancy (LHS)
Suitable applicants per vacancy (RHS)

34 Australia’s Digital Pulse
In summary, the supply of domestic graduates from ICT-related courses currently remains at low levels. This may reflect image problems related to the ICT profession, as well as the perception that hiring foreign ICT workers has resulted in a limited number of jobs for domestic graduates. However, there continues to be a healthy demand for ICT skills given the increasing role of digital technology in the Australian economy.
Employers have looked to workers from overseas and recruiting employees on 457 visas to meet their skills needs. This inflow of migrant ICT workers on 457 visas, along with support from the modest tertiary pipeline of ICT skills, has resulted in an adequately supplied ICT employment market for the present. That is, like many industries in the Australian economy, the supply of workers is currently sufficient to meet demand for workers. This is also reflected in the fact that wage pressures in many industries with a large share of ICT workers – including the Information, Media and Telecommunications industry and the Professional, Scientific and Technical Services industry – are no higher than in the broader economy, where wage growth has been relatively low by historical standards (running at 2.5% in 2014).
This raises the question of whether an employment equilibrium where a large share of the demand for ICT workers is met by a supply of imported ICT skills is ultimately beneficial for the Australian economy. On the one hand, it could be argued that if Australia does not have a comparative advantage in ICT workers (particularly in technical competencies), it is logical to import skills using migrant workers on 457 visas.
On the other hand, it is clear that demand for ICT workers in Australia is forecast to increase in future years as the digital economy continues to grow, with almost 100,000 additional ICT workers required by 2020. Skills demand is also expected to steadily increase.
This could cause further skills shortages, and a reliance on foreign ICT skills may leave Australia vulnerable to these shortages if the supply of foreign ICT workers is unable to be sustained – for example, due to increasing competition for these workers as noted in AWPA’s 2013 ICT Workforce Study: ‘As Australia competes with emerging economies for this skilled labour, and as the demand for ICT workers across a range of professional, technical and trade occupations increases in coming years, a substantial increase in the domestic supply of ICT specialists will be required.’
Indeed, Australian employers are already showing signs of apprehension about potential skills shortages in the future, particularly in technical capabilities given the forecast growth in demand for higher educational qualifications. Although skills needs are currently being met, the modest tertiary pipeline of skills due to the subdued rate of enrolments in ICT-related degrees and the reliance on workers from overseas to meet ICT skills needs, is of concern. This suggests that it will be necessary to increase the domestic uptake of ICT-related degrees going forward.
Consultations with the business community reinforce the fact that industry is particularly concerned about potential skills shortages in advanced technical capabilities, rather than in general ICT skills. For example, Sally-Ann Williams, Engineering Community and Outreach Program Manager at the Google Australia office, identifies programming skills, computer science theory and computational thinking as key areas where there are domestic skills gaps in Australia (for more details, see the Google Australia box below).

35Key challenges for our nation – digital skills, jobs and education
Google AustraliaGoogle’s Australian office in Sydney is one of the company’s largest global engineering centres. Over 1,000 workers are employed in the Australian office, with a little over half of these comprising of engineers who work on product development and infrastructure.
Sally-Ann Williams, Engineering Community and Outreach Program Manager at Google Australia, says that engineers recruited to Google’s Australian office are required to have a broad set of technical skills. She adds: ‘Google is and always will be an engineering company. We hire people who are ready to tackle some of technology’s greatest challenges and who want to make a positive impact on millions of people.’
She notes Australia’s skills shortage in technical occupations such as software engineers, programmers and computer scientists. ‘The skills gap in Australia is at the higher levels of technical capabilities such as core computer science and programming skills, rather than in the broader category of workers who are competent in the use of technology’, she notes.
Google Australia supports the new Digital Technologies curriculum (discussed in further detail below in Chapter 3) as a means for addressing the domestic shortage in technical capabilities in the long-term future. In particular, Sally-Ann believes that ‘engaging students at the primary school level will encourage more students, particularly females, to develop technical capabilities and pursue further study in computer science’.
Another option for increasing the supply of ICT workers in the future is raising female participation rates in ICT occupations. For example, bringing the number of women employed in the ICT workforce up to the number of men currently working in ICT occupations would result in around 270,000 additional ICT workers. This could be another way of strengthening the domestic pipeline of ICT skills, but would require addressing the issues which are currently discouraging women from working in ICT occupations (discussed in Chapter 1).
Another question to ask is whether the lack of an ICT skills gap at present in Australia is a problem. As discussed earlier, Australia ranks around the middle of the pack compared to other developed countries with respect to the size of its ICT workforce, and also has relatively low levels of ICT research and development by international standards. If the ICT workforce is adequately supplied because businesses have stopped demanding ICT workers due to a lack of domestic skills, this could inhibit future innovation and productivity growth in the Australian economy.

3ICT education in schools
This chapter discusses the benefits of incorporating ICT into school education, and assesses the digital literacy of Australian school students. The chapter also examines ICT education in the school curriculum and how well-equipped Australian teachers and schools are for teaching ICT to students, as well as providing some international examples of ICT education.
ICT learning areas in the Australian Curriculum, foundation to year 10
Digital Technologies Design and TechnologiesTechnologies
Subjects

MathematicsEnglish Science
Humanities and Social Sciences
The Arts Technologies
Health and PE Languages Work Studies
0* #
Learning areas

38 Australia’s Digital Pulse
The need for ICT educationin schools
There are significant benefits associated with the inclusion of ICT in school education. Aside from increasing student engagement, teaching computer science or programming in schools will enable students to build their computing skills from a young age. This is an important step in increasing the technical capabilities of Australia’s future workforce.
As demand for workers with ICT skills is expected to increase over the coming years, ICT education in Australian schools will be crucial, both for building the foundation ICT skills required of the future Australian workforce, and for increasing students’ interest in studying ICT to ensure that the supply of ICT workers can keep pace with the rising demand.
There are two main ways that ICT can enter the school curriculum: through a specific ICT component in the syllabus, or by integrating ICT use into other areas of the curriculum. The first method might take the form of computer science or programming classes. The latter could involve the use of ICT for collaborative purposes, adaptive technologies for personalising learning or online-based teaching methods.
Studies have found significant wider benefits associated with developing foundational ICT skills through the general use of technology in school. In addition to increasing digital literacy more broadly, teaching and learning using ICT can increase student engagement by facilitating greater collaboration, independence and accessibility. There is also a positive association between school children’s ICT use and their academic achievement across other areas such as English, mathematics and science.15
However, given the increasingly digital nature of the economy, it is not sufficient for Australian school students to just be comfortable using technology. Students also need to develop their technical computing skills from a young age, so that they can design, build and implement digital solutions and applications when they enter the workforce in the future. As discussed above, digital disruption is changing the nature of many occupations in the Australian workforce, and strong technical capabilities are increasingly being required in many roles that had not previously been associated with traditional ICT positions. The inclusion of computer science or programming classes in the school curriculum is an important step in ensuring that schools educate their students in these skills.
This can also help to narrow gaps in ICT skills between different groups of students. The OECD has recently noted that while ICT proficiency has generally increased, a ‘digital divide’ is emerging whereby some students are less likely to be users and producers of digital technology – in particular, girls and children from disadvantaged backgrounds.16 Including computer science subjects in the school curriculum can help to narrow this divide by providing these groups with the opportunity to develop skills in new technologies.
15. For example, see Balanskat, Balmire and Kefala (2006), The ICT Impact Report: A review of studies of ICT impact on schools in
Europe <http://www.pedz.uni-mannheim.de/daten/edz-b/gdbk/06/ict_impact_report.pdf> and Oakley, Pegrum, Faulkner and
Striepe (2012) Exploring the Pedagogical Applications of Mobile Technologies for Teaching Literacy <http://www.education.
uwa.edu.au/__data/assets/pdf_file/0003/2195652/AISWA-Report-FINAL-Final-101012-2.pdf>.
16. For more details, see OECD (2014), Trends Shaping Education 2015: Spotlight 5 <http://www.oecd.org/edu/ceri/Spotlight%20
5-%20Infinite%20Connections.pdf>.

39Key challenges for our nation – digital skills, jobs and education
Australian students’ ICT literacy
While a majority of Australian school students are of a proficient standard in ICT literacy, around 10% achieve a standard significantly below proficient. This has been relatively unchanged since 2005, suggesting that there are areas that could be improved in ICT school education in order to avoid the entrenchment of a ‘digital divide’.
As part of the National Assessment Program (NAP), a sample of Australian students in Years 6 and 10 are tested on their ICT literacy every three years. In 2011, around 11,000 students from both government and non-government schools were assessed on their ability to use ICT to access and evaluate information, develop new understandings, and communicate with others.17
Based on the proficiency levels identified in the NAP, a little more than 60% of Year 6 and 10 students reached or exceeded the proficient standard for ICT literacy in 2011 (Chart 3.1). The share of students proficient in ICT has risen since 2005, with the increase particularly pronounced for Year 6 students. While this is a welcome development, between 2005 and 2011, the share of students whose ICT literacy was significantly below proficient has been relatively unchanged at around 10% for both Years 6 and 10, which is a concern.
In particular, the NAP results found that students’ ICT literacy varied considerably across a number of demographics. Students attending schools in remote areas, and students with parents of lower occupational and educational status, were significantly more likely to have lower ICT literacy proficiency. This may be related to the frequency of computer use by students from different socioeconomic backgrounds. While almost every Australian student had access to a computer at home, the share of students who were frequent computer users at home was lower for students living in remote areas and those whose parents were unemployed or in unskilled occupations.
ICT education in schools is one means of increasing access to ICT for students from lower socioeconomic backgrounds. However, across many of these relatively disadvantaged demographics student computer use is lower at school as well as at home. An improvement in ICT education across schools located in disadvantaged areas, for example through increased computer science classes, could assist these students with developing their ICT skills and technical capabilities.
0%
20%
40%
80%
60%
Proficientor higher
Slightlybelow
proficient
Significantlybelow
proficient
Significantlybelow
proficient
Proficientor higher
Slightlybelow
proficient
Year 6 Year 10
Source: Australian Curriculum, Assessment and Reporting Authority (2012)
Chart 3.1: Australian students’ ICT literacy proficiency standards, 2005 and 2011
2005 2011
17. The 2014 ICT literacy assessment was completed in November 2014. A public report on the results of this assessment will be
released later in 2015.
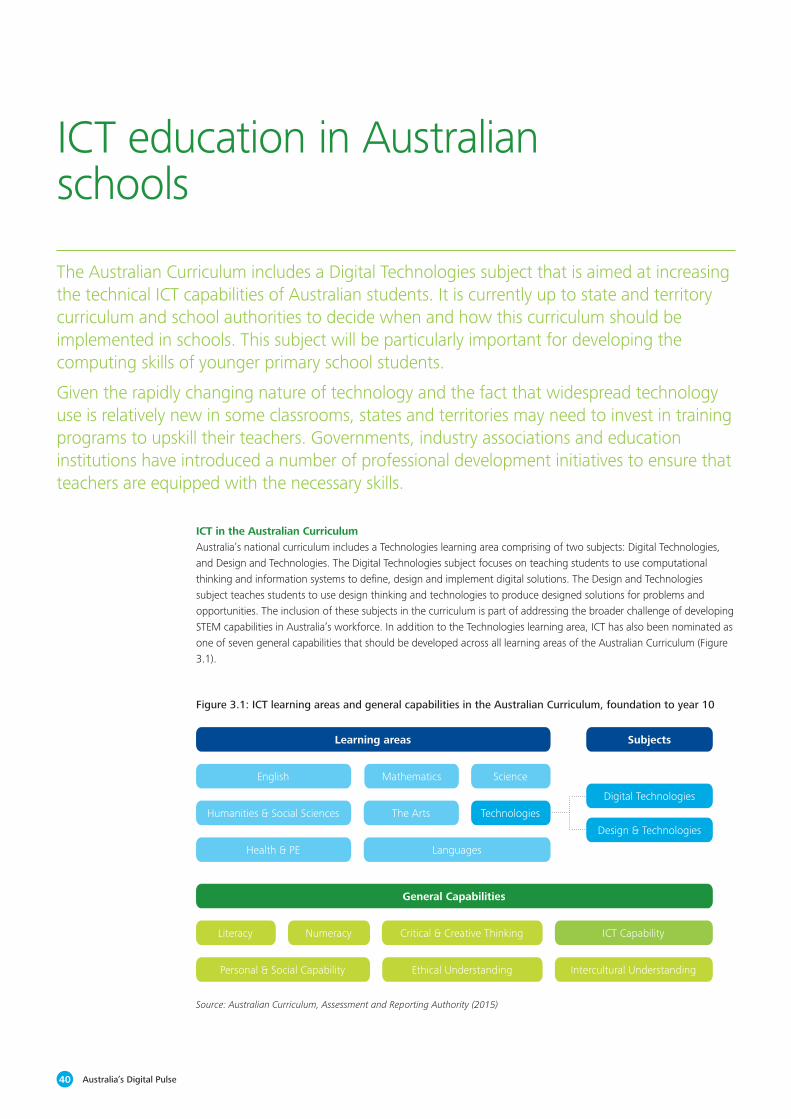
40 Australia’s Digital Pulse
ICT education in Australian schools
The Australian Curriculum includes a Digital Technologies subject that is aimed at increasing the technical ICT capabilities of Australian students. It is currently up to state and territory curriculum and school authorities to decide when and how this curriculum should be implemented in schools. This subject will be particularly important for developing the computing skills of younger primary school students.
Given the rapidly changing nature of technology and the fact that widespread technology use is relatively new in some classrooms, states and territories may need to invest in training programs to upskill their teachers. Governments, industry associations and education institutions have introduced a number of professional development initiatives to ensure that teachers are equipped with the necessary skills.
ICT in the Australian Curriculum Australia’s national curriculum includes a Technologies learning area comprising of two subjects: Digital Technologies, and Design and Technologies. The Digital Technologies subject focuses on teaching students to use computational thinking and information systems to define, design and implement digital solutions. The Design and Technologies subject teaches students to use design thinking and technologies to produce designed solutions for problems and opportunities. The inclusion of these subjects in the curriculum is part of addressing the broader challenge of developing STEM capabilities in Australia’s workforce. In addition to the Technologies learning area, ICT has also been nominated as one of seven general capabilities that should be developed across all learning areas of the Australian Curriculum (Figure 3.1).
Figure 3.1: ICT learning areas and general capabilities in the Australian Curriculum, foundation to year 10
English
Literacy Numeracy Critical & Creative Thinking
Personal & Social Capability Ethical Understanding Intercultural Understanding
ICT Capability
Learning areas
General Capabilities
Humanities & Social Sciences
Health & PE
Science
Technologies
Digital Technologies
Subjects
Design & Technologies
Mathematics
The Arts
Languages
Source: Australian Curriculum, Assessment and Reporting Authority (2015)

41Key challenges for our nation – digital skills, jobs and education
It is the Digital Technologies subject in particular that is aimed at increasing the technical capabilities of Australian students. Given the expected increase in demand for ICT workers over the next few years, this will be a significant step towards building the computing skills of Australia’s future workforce. However, it is likely to be many years between the introduction of a Digital Technologies curriculum an increase in the quantity and quality of ICT skills in the workforce. This means that it is important that the implementation of the curriculum occurs as quickly as possible.
While the Technologies curriculum has been made available for state and territory use, it is still awaiting final endorsement. As such, the curriculum is currently not mandatory in Australian schools and it is up to state and territory curriculum and school authorities to decide on when and how they will implement it in schools how they will implement it in schools. Consultation with the Australian Curriculum, Assessment and Reporting Authority (ACARA) suggests that different states and territories are at different stages of the implementation process, with a number of states already developing classroom materials, professional learning workshops and curriculum trials for the Digital Technologies curriculum (for more details, see the ACARA box below).
Australian Curriculum, Assessment and Reporting AuthorityThe Australian Curriculum, Assessment and Reporting Authority (ACARA) is the independent statutory authority seeking to improve the learning of all young Australians through world-class school curriculum, assessment and reporting.
‘The Australian Curriculum strives to meet the learning needs of students, employers and the community in the 21st century.’ says Robert Randall, Chief Executive Officer of ACARA. ‘Importantly, the national curriculum sets expectations for all young Australians wherever they go to school. Development of Australian Curriculum for Foundation to Year 10 in eight learning areas represents is a significant milestone for school education in Australia.’
As one element of the Australian Curriculum, the Digital Technologies curriculum was developed through a rigorous process of writing, national consultation and review. One of the key ideas in the Digital Technologies curriculum is the development and use of computational thinking, which is a way of thinking about information systems and how to create solutions.
While the curriculum is awaiting final endorsement by the Education Council, it is available now for use. Different states and territories are at various stages in the implementation process, including writing classroom materials, providing professional learning workshops for teachers, or trialling the new curriculum in schools. Other states and territories are waiting for its final endorsement before announcing their approach to implementation.

42 Australia’s Digital Pulse
For example, in Victoria, the Department of Education and the Victorian Curriculum and Assessment Authority (VCAA) have been working on developing and implementing the new curriculum, with the current aim that schools will be teaching the Digital Technologies curriculum to students by the end of 2017 (for more details, see the Victorian Department of Education box below). While the new curriculum is being developed and implemented, students continue to be taught the existing curriculum which includes an interdisciplinary domain on developing ICT literacy – similar to the ICT general capability discussed above – but has no focus on technical capabilities or computational thinking.
Victorian Department of EducationIn Victoria, the Victorian Curriculum and Assessment Authority (VCAA) – an independent authority under the auspices of the Department of Education – is responsible for the Early Years to senior secondary curriculum, including the Digital Technologies curriculum from Foundation to Year 10, which is expected to be based on the Australian Curriculum. The Department is responsible for supporting schools in implementing the new curriculum. While the Technologies curriculum is still awaiting official endorsement, Victorian authorities have already begun working on professional learning programs to support the implementation of the new Digital Technologies curriculum given the importance of developing these skills in school students.
Paula Christophersen, the Curriculum Manager of Digital Technologies at VCAA, states that in Victoria the Digital Technologies curriculum has been developed to ‘teach students to be confident developers of digital solutions’. She emphasises that the focus is not solely on coding and using digital devices, but also on ‘building skills in algorithmic thinking and logic, creating digital solutions through the use of computational thinking’.
On the framework for the ICT general capability, Paula says that ‘the Australian Curriculum, as it will be implemented in Victoria, includes content to develop students’ digital literacy across all other learning areas’. For example, ‘Geography uses geographic information systems and mapping technology; Mathematics includes network analysis, graphing and data visualisation; while the expectation in humanities subjects such as History is that students will access and interpret data and information from digital sources and web-based documents.’
While the implementation of the curriculum in some other states is more centrally determined, schools in Victoria are relatively autonomous and can make their own decisions regarding how they implement the Digital Technologies curriculum, supported by Department of Education resources.
Penelope Rowe, Senior Project Officer in the Digital Learning Branch of the Department, states that the Department offers a suite of tools to help teachers develop effective teaching and learning practices using digital technology. ‘These include an online repository of resources with educational materials for teachers, and hosting workshops such as ICT planning workshops to help schools understand the digital tools they have and how to use them.’ More specifically in relation to the Digital Technologies curriculum, the Department (in partnership with other key stakeholders such as the Federal Department of Education and other states) is also developing an online tool with information on terminology, assessment, case studies and lesson plans for the new curriculum.
These resources are aimed at addressing some of the barriers that will need to be overcome in implementing the new curriculum. In particular, Penelope says a key challenge will be ‘ensuring that teachers develop a holistic approach towards the curriculum and an understanding of how individual content descriptors sit together, as well as unpacking the language used in the curriculum’. She believes that this understanding will allow teachers to interpret the curriculum in an interesting way to students, enabling them to develop innovative methods of teaching the new Technologies subjects.

43Key challenges for our nation – digital skills, jobs and education
In contrast, in NSW the Board of Studies, Teaching and Educational Standards (BOSTES) is awaiting the final endorsement of the Technologies curriculum before it is implemented in the syllabus. However, there are already opportunities for students to develop technical capabilities in using and producing ICT within the current NSW curriculum, particularly throughout secondary school. Peter Thompson, Inspector of Technology Education at the BOSTES, states that this includes cross-disciplinary ICT applications, a mandatory Technology syllabus in Years 7 and 8, and technology-related electives in Years 9 to 12 (for more details, see the NSW BOSTES box below).
NSW Board of Studies, Teaching and Educational StandardsIn NSW, the Board of Studies, Teaching and Educational Standards (BOSTES) is the government authority that manages the school curriculum, including a range of teaching, assessment, registration and policy functions.
The Australian Technologies curriculum is awaiting final endorsement by Ministers. When it is endorsed, NSW will plan a timeline for revisions to the relevant content in NSW syllabuses. It is important to note that there are already many opportunities for students to study, use and produce digital technology in the current NSW curriculum.
Peter Thompson, BOSTES Inspector, Technology Education, states that ‘content from the Australian curriculum English, Mathematics, Science and History subjects has already been incorporated into NSW syllabuses for Kindergarten to Year 10. There has been an increase in explicit listings of ICT use within the new syllabuses of these subjects – in English for example, there has been a 400% increase in ICT usage in the syllabus’. This includes students building blogs and wikis, creating apps, and using software to create and edit films.
Aside from this cross-disciplinary engagement with digital technology, the NSW curriculum has a Technology (Mandatory) syllabus for Years 7 and 8. The course must be studied for at least 200 hours and teaches students an understanding of design processes and the technologies that can be used to produce innovative solutions to identified needs. Peter notes that this could include ‘using software to develop portfolios, designing coded programs using Scratch, or working with other game making software’. The use of more fundamental ICTs such as Office applications, digital photography and ePortfolio production is common place.
In addition, the NSW curriculum has a number of technological subjects that can be studied by students in Years 9 to 12.
ICT courses for Years 9 and 10:
• Information and Software Technology elective which teaches students core technical skills such as systems design, computing, building networks and programming
• Coding can also occur within other syllabuses in the Industrial and Design and Technology learning area
• Photography and Digital Media syllabus as part of the Arts learning area
ICT courses for Years 11 and 12:
• Information Processes and Technology (IPT)
• Software Design and Development (SDD)
• VET Information and Digital Technologies (IDT) framework course
Peter observes that without implementing the Digital Technologies component of the Australian Curriculum, the current NSW syllabuses contain substantial digital technology-related content.

44 Australia’s Digital Pulse
Industry consultations suggest that increasing students’ interest in studying ICT at school is critical. This could involve the provision of more information on potential ICT career paths and future opportunities in digital technology to both students and parents, in order to increase society’s understanding of future technological needs. Additionally, a key focus of the Digital Technologies curriculum is mandating the teaching of technical computer skills to students in primary school. Teaching students coding, algorithmic thinking and creating digital solutions from an early age is likely to increase their interest in technology-related subjects in the later years of schooling.
This is particularly important because relatively few students are currently learning these technical skills in their earlier years. The NAP results on Year 6 students’ uses of computer applications show that ICT use for technological tasks such as writing macros, constructing websites and uploading user-created content is relatively low compared to ICT use for study, entertainment and communication (Chart 3.2).
Studyutilities
Entertainmentapplications
Communicationpurposes
Technologicalcomputer tasks
0%
10%
20%
30%
40%
50%
60%
70%
80%
*Used almost everyday or more
**Used between a few times a week and once a month
Source: Australian Curriculum, Assessment and Reporting Authority (2012)
Chart 3.2: Australian Year 6 students’ regular ICT use by task, 2011
Home – frequent use*
School – frequent use*
Home – occasional use**
School – occasional use**
NSW Board of Studies, Teaching and Educational Standards... cont’dA common national and global issue is that student interest in these subjects has been declining over recent decades. This is consistent with the NSW experience where ‘in 2000 over 17,000 students were studying Computing Studies [the computing subject prior to the separation into IPT and SDD in 2000]. Now, the combined total of students studying IPT, SDD and the VET IDT course has reduced to around 6,000 students.’ However, in NSW there has been an increase in students undertaking major ICT specific projects in a range of other HSC subjects such as English, Visual Arts, Design and Technology and Industrial Technology-Multimedia, Photography Video & Digital Imaging and Computing Applications.
In order to address the general trend of decline, Peter suggests that ‘world-wide, we need to ramp up students’ and society’s understanding of our technological needs – for example, more information on potential career paths and future opportunities in digital technology could be publicised to both students and parents’.
Additionally, some teachers are developing their skills and confidence in teaching and learning using information and communication technology, advanced manufacturing technology and control technology. Professional associations such as the ICT Educators of NSW (ICTE NSW) and the Institute of Industrial Arts Technology Education (IIATE) run a range of workshops to assist NSW teachers in developing their technical skills.

45Key challenges for our nation – digital skills, jobs and education
Equipping teachers and schools to teach ICTIncluding digital technology and computing science in school curricula is one component of ensuring that Australian school students are educated in the technical ICT capabilities that will be required in the future workforce. Australian teachers and schools must also be sufficiently equipped with the skills and equipment required to educate students in the relevant subjects. Given the rapidly changing nature of technology and the fact that widespread technology use is relatively new in some classrooms, states and territories may need to invest in training programs to upskill their teachers.
A 2006 survey of around 1,500 teachers in Western Australia found that while 95% of teachers had access to a basic suite of ICT applications, only 18% regularly used ICT for teaching and learning.18 Furthermore, 74% of all teachers viewed more or better access to computers as a factor that could increase ICT use in the classroom.
These figures are likely to have changed over subsequent years, owing to the rapid pace of technological growth. Broader trends such as the rising general digital literacy of the Australian population, and the increasing incidence of bring-your-own devices to schools, are having a positive effect. Governments have also invested more in developing teachers’ ICT skills and supplying classrooms with the necessary equipment as ICT has become increasingly important to the Australian economy and society.
18. For more details, see WA Department of Education and Training (2006), Teacher ICT Skills <http://www.det.wa.edu.au/
accountability/detcms/education/evaluation-and-accountability/binary-files/evaluation-reports/teacher-ict-skills-2006.en?cat-
id=13027342>.
19. For more details, see U.S. Department of Education: Office of Educational Technology (2011), International Experiences with
Technology in Education: Final Report <https://oerknowledgecloud.org/sites/oerknowledgecloud.org/files/iete-full-report.pdf>.
Research conducted by the U.S. Department of Education in 2011 on the international application of ICT in education highlights a number of government policies and programs in Australia that have supported increased ICT use in schools.19 These include:• The Digital Education Revolution, a large-scale ICT
infrastructure project to increase hardware access and improve broadband connectivity in schools, and the Building the Education Revolution, which also funded the modernisation of school facilities
• The inclusion of ICT in the Australian Curriculum, providing a comprehensive nationwide plan for integrating ICT into primary and secondary education, as well as a program to monitor its implementation
• The National Assessment Program in ICT literacy, which can be used to evaluate ICT use and proficiency levels in Australian students
• The ICT Innovation Fund, supporting professional development and teacher education courses in ICT use by funding programs such as the Teaching Teachers for the Future project.
These programs have seen solid results. For example, the Digital Education Revolution saw more than 900,000 computers supplied to Australian schools, with funding also provided to cover installation and supporting infrastructure such as wireless networking in classrooms. The Teaching Teachers for the Future project resulted in measurable growth in teaching students’ confidence in using ICT as a teacher and in facilitating student use of technology as future teachers.

46 Australia’s Digital Pulse
More recently, the national Digital Careers program was launched in 2013, and provides a coordinated national approach towards addressing ICT skills development in Australia. Digital Careers is delivered by National ICT Australia (NICTA) with a consortium of industry associations, state governments, research organisations and education providers, and the program includes a range of ICT-related activities and events aimed at growing the number and diversity of tertiary students preparing for a career in ICT. In addition, Digital Careers supports school teachers in their delivery of ICT-related activities by providing resources, advice and access to a comprehensive network of activities for students.
In relation to the Australian Curriculum more specifically, the University of Adelaide’s Computer Science Education Research Group has developed a number of massive open online courses (MOOCs) to assist teachers in addressing the Digital Technologies subject within the Technologies learning area. Created with the support of Digital Careers and Google, these MOOCs introduce teachers to concepts and activities that will help to teach computer science and computational thinking to school students.
State governments are providing further teacher support as the Digital Technologies curriculum is developed and implemented. For example, the Victorian Department of Education is working with a range of other key stakeholders in order to develop an online tool with information for teachers on terminology, assessment, case studies and lesson plans on the new Digital Technologies curriculum. Industry and professional associations – such as ICTE NSW and IIATE in NSW, are also working with teachers to ensure that they are equipped with the necessary skills to teach technology-related subjects more broadly.
These initiatives all recognise the need to educate and prepare teachers to be able to deliver technology-related content in the school curriculum. Teachers across primary and secondary school must be equipped with the skills required to effectively educate students on the necessary technical computing capabilities. It is important that school teachers are supported as the Digital Technologies curriculum is developed and implemented, particularly across the younger year levels where ICT education will be critical in building the computing skills in Australia’s future workforce.

47Key challenges for our nation – digital skills, jobs and education
International experiences in ICT education
In recent years, there has been an increasing global push towards introducing computer science and technical computational skills into school curricula. Israel was an early adopter of computer science in its high school syllabus, while more recently England has introduced coding classes into primary school. The United States also intends to develop computer science education in American schools. The implementation of the Digital Technologies curriculum will ensure that Australia does not fall behind other countries in ICT education.
There has been an increasing focus on ICT education in a number of countries around the world across all levels of education, from kindergarten and primary school up to high school students. In particular, there has been a global push towards school education in computer science and technical computational skills such as programming which are currently in short supply not just in Australia, but across numerous other countries.
IsraelIsrael was one of the first countries to focus on computer science teaching in high school classrooms. The Israeli curriculum was launched in 1995, with more detailed curricula and course syllabi published in subsequent years. The high school program in Israel ‘emphasises the foundations of algorithmics, and teaches programming as a way to get the computer to carry out an algorithm’.20
Machshava, the Israeli National Centre for Computer Science Teachers, has ensured computer science learning is embedded within schools. Machshava was established by Israel’s Ministry of Education in 2000, and now hosts conferences and courses related to computer science education as well as publishing papers and learning materials relevant to the Israeli curriculum. Furthermore, Machshava supports the growth of the computer science education community across Israel by holding professional development courses for leading computer science teachers, who then go on to run workshops for their colleagues around the country.
EnglandIn contrast, England has only recently introduced computer science into its school curriculum. A new computing curriculum for primary and secondary school studentswas launched in September 2014. The new curriculum focuses on coding and programming rather than broader ICT capabilities, with the (then) Education Secretary Michael Gove noting that it ‘teaches students computer science, information technology and digital literacy; teaching them how to code and create their own programs; not just how to work a computer, but how a computer works and how to make it work for you.’21
Under the new system, it is up to schools to decide on whether they wish to introduce separate computing lessons or incorporate the learning requirements into other subjects. The government has funded the British Computer Society to develop training programs and learning materials for teachers who are new to teaching computing. Private companies have also contributed, with Google and Microsoft partnering with Code Club and Computing at School to run training sessions on computing skills for both primary and secondary school teachers.
20. See Gal-Ezer and Harel (1999), Curriculum and Course Syllabi for a High School Program in Computer Science <http://www.
openu.ac.il/Personal_sites/download/galezer/curr_and_syll.pdf> and Gal-Ezer, Beeri, Harel and Yehudai (1995), A High School
Program in Computer Science <http://www.openu.ac.il/Personal_sites/download/galezer/high-school-program.pdf>.
21. For more details, see UK Government (2014), Michael Gove speaks about computing and education technology <https://www.
gov.uk/government/speeches/michael-gove-speaks-about-computing-and-education-technology>.

48 Australia’s Digital Pulse
United StatesThe United States is another country where private companies, educational groups and industry organisations are working together to educate school teachers on incorporating computer science into their classes. In 2014, around $20 million was pledged by a group of companies (including Google, Microsoft and Salesforce) and philanthropists to train 25,000 teachers to teach computer science by the 2016 school year. Code.org will use the funds to host workshops teaching computer science modules to primary, middle and high school teachers.
A key challenge associated with introducing computer science into schools across the United States is the fragmented nature of the education system. Public school systems are locally administrated and their structure varies by state and region, with more than 14,000 public school districts across the country. Notwithstanding these difficulties, in December 2014 the White House announced that a number of school districts – including the seven largest districts in the country – have committed to offering introductory computer science courses at the high or middle school level, reaching more than four million students. Other education non-profit organisations such as the National Science Foundation, the College Board and Teach For America have also announced initiatives to support computer science education in the United States.22
22. For more details, see White House (2014), Fact Sheet: New Commitments to Support Computer Science Education <https://
www.whitehouse.gov/the-press-office/2014/12/08/fact-sheet-new-commitments-support-computer-science-education>.
Implications for AustraliaThe Digital Technologies curriculum will ensure that Australia is relatively well-placed globally in the ICT education space. However, this curriculum is still awaiting final endorsement and, as shown in the examples illustrated above, other countries such as Israel and England are already ahead of Australia in implementing computer science into primary and secondary school curricula. Given the delay between introducing the curriculum and seeing increasing ICT skills among workers, Australian states and territories need to work towards developing and implementing the Digital Technologies curriculum, to ensure that Australia does not fall behind other countries in ICT education.
Australia can draw from the experiences in other countries in relation to the training and support provided to teachers on ICT education. For example, in England and the United States, the technology industry has taken a prominent role in teacher training, with companies such as Google and Microsoft funding and hosting training sessions and workshops for school teachers. Such programs could also be developed in Australia. A national centre for educating teachers on how to teach computer science and other technical skills, such as the model adopted in Israel, could be another method for teachers’ professional development.

49Key challenges for our nation – digital skills, jobs and education
Directions and barriers for ICT education
Given the increasing prominence of digital technology in the Australian economy, it is important that Australia further develops ICT education in the school system. This includes continuing to implement the Digital Technologies curriculum, as well as ensuring that teachers receive the appropriate training in teaching and learning using technology.
It is important that Australia further develops ICT education in its school system. In particular, the Digital Technologies curriculum will ensure that students are taught computer science, computational thinking skills, and how to design and build digital solutions from the younger years of their schooling. This will be essential in ensuring that Australia’s future workforce is equipped with the ICT skills required to fuel innovation and productivity growth in a constantly changing technological environment.
However, the Technologies component of the Australian curriculum is currently awaiting final endorsement. Governments must ensure that this curriculum continues to be developed and implemented in the near future. A number of states are already moving forward with the Digital Technologies curriculum, driven by the need to equip school students with the necessary skills to enable them to be effective creators of digital solutions for the problems of the future. Nonetheless, there is a delay between the curriculum’s introduction and its impact on increasing ICT skills in the Australian workforce, and a number of other countries are already ahead of us in the ICT education space. It is therefore important that the key stakeholders in this area continue to take action on developing and implementing the Digital Technologies curriculum over the coming years.
In developing and implementing any new technology-related curricula, schools and teachers will need to be supported to ensure that they have the equipment and skills required to teach students how to use and produce digital technology. For some schools, the widespread use of technology in classrooms and specific classes dedicated to computer science and computational thinking is relatively new.
The provision of educational resources by governments, industry associations and educational institutions will be a particularly important feature of curriculum implementation in these areas. International experiences in ICT education could also be drawn on as a guide for educating teachers on teaching and learning techniques.
Educational material can be used to address one of the major barriers associated with developing ICT education in Australian schools – that is, developing teacher skills and training, and their understanding of the curriculum. This understanding will be essential in ensuring that schools take a holistic approach towards introducing the curriculum, and that teaching methods are innovative and interesting for students.
Governments, universities and professional associations within each state can play a role in promoting ICT-related education and career paths to school students and parents. Organisations across all segments of the industry can play an important informational advocacy role in demonstrating to students the strength of ICT pathways in schools, as well as in universities and workplaces once students graduate from high school. This will be critical in increasing student interest in ICT, particularly in studying the technical subjects and skills that are currently in short supply in the Australian workforce.
By continuing to move in these directions, governments and industry organisations can enable schools and teachers to provide students with the education to equip them with the technical capabilities required of Australia’s ICT workforce in the future. This will ensure that the future Australian workforce is suitably positioned to take advantage of the opportunities associated with digital disruption and the changing use of digital technology in the workforce.

4Future directions
$Federal Government
Australia
ICT workers and the digital economy
State Governments Higher education institutions
Schools Businesses

51Key challenges for our nation – digital skills, jobs and education
Given the increasing importance of digital technology in the Australian economy, it is clear that developing the ICT skills of Australian workers should be a key economic focus. There are a number of areas where government, education institutions, businesses and other organisations can show leadership to position the Australian workforce to take advantage of the opportunities associated with digital disruption going forward.
First, as a nation we need to focus on growing our ICT capabilities and skills in the workforce. Right now the ICT workforce is adequately supplied, however demand for ICT workers in Australia is forecast to increase by 100,000 over the next six years. As such, we must ensure that we continue to improve the quantity and quality of ICT skills in the Australian workforce. Businesses, policymakers and industry associations in the digital technology space can contribute to this goal by promoting the role of ICT in the workforce, particularly among groups with the potential to significantly increase their ICT workforce participation – such as women, mature-aged employees and workers displaced from other industries. A national conversation on the importance of ICT for future innovation and productivity growth in Australia will be essential for growing our ICT capabilities.
Governments can contribute by ensuring that the Technologies component of the new Australian Curriculum continues to be developed and implemented. This initiative requires the support of both Federal and State Governments around Australia, with all key stakeholders in the education space working to ensure that schools and teachers are educated on the new Technologies curriculum. The focus must be on equipping students with the digital literacy and computational thinking skills that will be required of the future Australian workforce in a rapidly growing digital economy.
Higher education institutions also have a key role in increasing the future pipeline of graduates with technical ICT skills, through computer science or other degrees that teach technical capabilities. This could include an informational advocacy role to demonstrate to students the strength and diversity of ICT-related career paths in an increasingly digital economy. Universities should also continue to promote interdisciplinary opportunities between ICT and other subject areas, enabling students to develop skills such as critical thinking and creative design within other fields of study.
Businesses need to recognise that on the job training is an important part of upskilling in ICT capabilities, particularly given the rapid evolution of digital technology and its use in the workforce. Many successful Australian businesses are already providing opportunities for employees to develop their ICT skills through on the job training, workshops, upskilling courses and other business development initiatives – this must increase if we are to strengthen our future workforce. Businesses can also encourage staff to rotate between IT, HR, marketing and other departments to promote the integration of ICT into wider business operations, as well as continuing to invest in ICT-related research and development in the future.
The rapidly growing digital economy means that ICT skills have an increasingly important role in Australia’s labour force. Australia needs to ensure that its business practices, policy settings and education system are all working towards equipping our workforce with these skills, to enable us to face the challenges associated with digital disruption in the future.

AppendixStatistical compendium

Economic contribution of the internet and digital technologies in Australia
ICT workers in Australia
ICT workers’ proportion of total workforce
605,752
28%Female share of ICT workers
Total ICT services imports ICT university enrolments by domestic students
27,547
Total ICT research and development
$6.152bn5.2%
$78.8bn
$2.886bn

54 Australia’s Digital Pulse
Sources: ABS cat. 5206.0 (2015), 6306.0 (2015), 8104.0 (2013), 8109.0 (2014), 8111.0 (2014) and customised report (2015); Department of Immigration, Subclass
457 Visa Statistics (2015); Department of Education u-Cube (2015)
Sources: ABS customised report (2015); Department of Education u-Cube (2015)
Table A.1: Summary of key national statistics
At a glance – Australia
At a glance – states and territories
Table A.2: Summary of key state statistics
Indicator Statistic Period
Economic contribution of the internet and digital technologies in Australia $78.8bn 2013–14
ICT workers in Australia 605,752 2014
of which: ICT-related industry subdivisions 289,900 2014
Other industries 315,852 2014
of which: Technical, professional, management and operational occupations 398,014 2014
Other occupations (including trades and sales) 207,738 2014
ICT workers’ proportion of total workforce 5.2% 2014
Inbound temporary migration of ICT workers (457 visas granted) 11,805 2013–14
Female share of ICT workers 28% 2014
Average weekly total cash earnings of ICT workers $1,806 May 2014
Total ICT research and development $6.152bn 2011–12
Total ICT services exports $2.010bn 2014
Total ICT services imports $2.886bn 2014
ICT university enrolments by domestic students 27,547 2013
ICT university completions by domestic students 4,886 2013
Indicator NSW VIC QLD SA WA TAS ACT & NT
ICT workers in Australia (2014) 215,580 179,963 96,423 31,903 48,212 7,776 25,906
of which: ICT-related industrysubdivisions
103,675 90,301 48,482 13,093 21,309 3,898 9,144
Other industries 111,905 89,662 47,941 18,810 26,903 3,878 16,762
of which: Technical, professional,management and operational occupations
144,773 118,583 59,165 20,972 31,251 4,222 19,051
Other occupations (including trades and sales)
70,807 61,380 37,258 10,931 16,961 3,554 6,855
ICT workers’ proportion of total workforce (2014)
6.0% 6.2% 4.1% 4.0% 3.6% 3.3% 7.5%
ICT university enrolments by domestic students (2013)
9,161 7,765 5,424 1,474 2,057 395 1,183
ICT university completions by domestic students (2013)
1,707 1,387 823 245 410 73 223

55Key challenges for our nation – digital skills, jobs and education
Sources: ABS cat. 5206.0 (2015), 6306.0 (2015), 8104.0 (2013), 8109.0 (2014), 8111.0 (2014)
and customised report (2015); Department of Immigration, Subclass 457 Visa Statistics (2015);
Department of Education u-Cube (2015)
* For these occupations, only workers employed in the ICT-related industry subdivisions (Telecommunications Services; Internet Service Providers, Web Search Portals
and Data Processing Services; and Computer System Design and Related Services) are counted as ICT workers
Source: ACS
ICT employment
Table A.3: CIIER classification of ICT workers at the 4-digit ANZSCO level
ICT management and operations
1351 ICT Managers
2232 ICT Trainers
2247 Management and Organisation Analysts
2249 Other Information and Organisation Professionals
2621 Database and Systems Administrators, and ICT Security Specialists
2632 ICT Support and Test Engineers
ICT technical and professional
2324 Graphic and Web Designers, and Illustrators
2611 ICT Business and Systems Analysts
2612 Multimedia Specialists and Web Developers
2613 Software and Applications Programmers
2631 Computer Network Professionals
2633 Telecommunications Engineering Professionals
3132 Telecommunications Technical Specialists
ICT sales
2252 ICT Sales Professionals
6212 ICT Sales Assistants
ICT trades
3131 ICT Support Technicians
3424 Telecommunications Trades Workers
Electronic trades and professional*
3123 Electrical Engineering Draftspersons and Technicians*
3124 Electronic Engineering Draftspersons and Technicians*
3423 Electronics Trades Workers*
ICT industry admin and logistics support*
All other occupations where the employee works in an ICT-related industry subdivision (Telecommunications Services; Internet Service Providers, Web Search Portals and Data Processing Services; and Computer System Design and Related Services)

56 Australia’s Digital Pulse
ICT management and operations
ICT technical and professional
ICT sales ICT trades Electronic trades and professional
ICT industry admin and logistics support
Total ICT workers
Industry divisions
Agriculture, Forestry and Fishing 355 321 0 0 0 0 676
Mining 2,412 1,459 0 963 0 0 4,834
Manufacturing 6,504 9,212 720 1,774 0 0 18,210
Electricity, Gas, Water and Waste Services
5,278 2,428 208 1,884 0 0 9,798
Construction 1,693 2,401 0 4,414 0 0 8,508
Wholesale Trade 6,377 5,422 3,319 3,283 0 0 18,401
Retail Trade 4,326 3,993 6,911 3,672 0 0 18,902
Accommodation and Food Services 346 464 0 339 0 0 1,149
Transport, Postal and Warehousing 4,580 3,867 0 923 0 0 9,370
Rest of Information, Media and Telecommunications*
1,697 4,424 202 1,772 0 0 8,095
Financial and Insurance Services 21,381 16,258 0 3,888 0 0 41,527
Rental, Hiring and Real Estate Services 1,510 1,298 169 0 0 0 2,977
Rest of Professional, Scientific and Technical Services**
35,003 29,689 0 2,686 0 0 67,378
Administrative and Support Services 3,198 4,806 0 1,252 0 0 9,256
Public Administration and Safety 24,639 15,189 0 7,472 0 0 47,300
Education and Training 7,874 8,495 88 4,845 0 0 21,302
Health Care and Social Assistance 8,466 3,493 0 2,159 0 0 14,118
Arts and Recreation Services 683 3,141 0 845 0 0 4,669
Other Services 2,588 3,133 221 3,440 0 0 9,382
ICT industry subdivisions
Telecommunications Services 11,902 16,483 7,398 18,799 707 41,296 96,585
Internet Service Providers, Web Search Portals and Data Processing Services
604 964 241 732 63 4,398 7,002
Computer System Design and Related Services
33,491 76,167 9,432 14,967 3,058 49,198 186,313
Total ICT workers 184,907 213,107 28,909 80,109 3,828 94,892 605,752
* Excluding Telecommunications Services & Internet Service Providers, Web Search Portals and Data Processing Services which are separately identified as ICT industry
subdivisions
** Excluding Computer System Design and Related Services which is separately identified as an ICT industry subdivision
Source: ABS customised report (2015)
Table A.4: ICT workers by industry and CIIER occupation grouping, 2014

57Key challenges for our nation – digital skills, jobs and education
Table A.5: ICT employment forecast by occupation, 2014 to 2020
CIIER occupation grouping 2014 2020 Average annual growth
ICT management and operations 184,907 222,080 3.1%
ICT technical and professional 213,107 247,919 2.6%
ICT sales 28,909 35,193 3.3%
ICT trades 80,109 87,148 1.4%
Electronic trades and professional* 3,828 3,939 0.5%
ICT industry admin and logistics support* 94,892 104,205 1.6%
Total ICT workers 605,752 700,483 2.50%
* Employment in these occupations has only been counted for the ICT-related industry subdivisions, consistent with the definitions in Table A.3
Source: Deloitte Access Economics (2015)
2014 2020 Average annual growth
ICT management and operations
Postgraduate 64,406 84,112 4.5%
Undergraduate 125,250 159,071 4.1%
Adv dip/Dip 50,653 63,833 3.9%
Cert III/IV 30,928 39,007 3.9%
Cert I/II 14,535 17,428 3.1%
ICT technical and professional
Postgraduate 62,660 77,948 3.7%
Undergraduate 161,591 191,057 2.8%
Adv dip/Dip 65,417 76,365 2.6%
Cert III/IV 34,004 39,714 2.6%
Cert I/II 16,293 17,769 1.5%
ICT sales
Postgraduate 4,180 6,110 6.5%
Undergraduate 9,458 12,860 5.3%
Adv dip/Dip 4,655 6,244 5.0%
Cert III/IV 3,858 5,284 5.4%
Cert I/II 2,132 2,765 4.4%
2014 2020 Average annual growth
Source: Deloitte Access Economics (2015)
Table A.6: ICT skills forecast by CIIER occupation grouping, 2014 to 2020
ICT trades
Postgraduate 18,571 23,356 3.9%
Undergraduate 32,842 37,410 2.2%
Adv dip/Dip 22,772 25,960 2.2%
Cert III/IV 26,281 29,526 2.0%
Cert I/II 13,924 14,161 0.3%
Electronic trades and professional
Postgraduate 336 344 0.4%
Undergraduate 800 737 -1.3%
Adv dip/Dip 1,235 1,164 -1.0%
Cert III/IV 2,094 2,033 -0.5%
Cert I/II 831 722 -2.3%
ICT industry admin and logistics support
Postgraduate 19,355 25,052 4.4%
Undergraduate 30,518 39,387 4.3%
Adv dip/Dip 13,114 16,744 4.2%
Cert III/IV 14,070 18,475 4.6%
Cert I/II 5,147 6,651 4.4%

58 Australia’s Digital Pulse
2010–11 2011–12 2012–13 2013–14 2014–15*
1351 ICT Managers 759 804 902 786 452
2232 ICT Trainers 13 23 26 15 7
2247 Management and Organisation Analysts 1,489 1,767 1,396 1,239 738
2249 Other Information and Organisation Professionals 780 689 478 445 242
2252 ICT Sales Professionals 376 415 525 458 285
2324 Graphic and Web Designers, and Illustrators 326 407 477 307 230
2611 ICT Business and Systems Analysts 1,457 2,013 2,111 1,795 990
2612 Multimedia Specialists and Web Developers 48 94 141 117 97
2613 Software and Applications Programmers 5,246 5,388 4,602 4,161 2,520
2621 Database and Systems Administrators, and ICT Security Specialists 460 532 560 356 170
2631 Computer Network Professionals 197 336 276 240 127
2632 ICT Support and Test Engineers 378 668 717 671 390
2633 Telecommunications Engineering Professionals 75 240 197 53 57
3123 Electrical Engineering Draftspersons and Technicians 379 535 524 365 187
3124 Electronic Engineering Draftspersons and Technicians 174 233 197 147 67
3131 ICT Support Technicians 260 358 448 340 161
3132 Telecommunications Technical Specialists 57 315 118 61 31
3423 Electronics Trades Workers 89 222 154 88 71
3424 Telecommunications Trades Workers 40 117 103 161 41
Total ICT workers** 12,603 15,156 13,952 11,805 6,863
* 2014–15 data is financial year to 31 December 2014
**Excludes ICT industry admin and logistics support for which breakdowns are unavailable; electronic trades and professional data is for all industries
Source: Department of Immigration, Subclass 457 Visa Statistics (2015)
ICT migration
Table A.7: Temporary skilled migration (457) visa grants for ICT occupations, 2010–11 to 2014–15 year to date
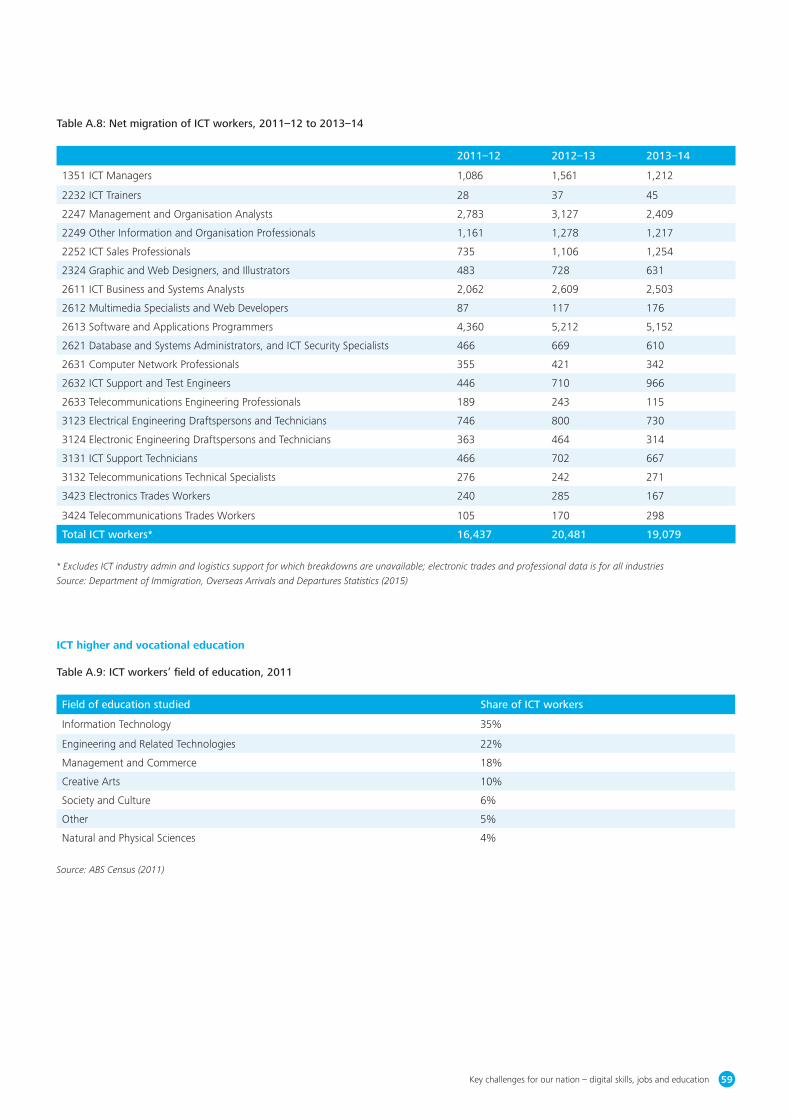
59Key challenges for our nation – digital skills, jobs and education
2011–12 2012–13 2013–14
1351 ICT Managers 1,086 1,561 1,212
2232 ICT Trainers 28 37 45
2247 Management and Organisation Analysts 2,783 3,127 2,409
2249 Other Information and Organisation Professionals 1,161 1,278 1,217
2252 ICT Sales Professionals 735 1,106 1,254
2324 Graphic and Web Designers, and Illustrators 483 728 631
2611 ICT Business and Systems Analysts 2,062 2,609 2,503
2612 Multimedia Specialists and Web Developers 87 117 176
2613 Software and Applications Programmers 4,360 5,212 5,152
2621 Database and Systems Administrators, and ICT Security Specialists 466 669 610
2631 Computer Network Professionals 355 421 342
2632 ICT Support and Test Engineers 446 710 966
2633 Telecommunications Engineering Professionals 189 243 115
3123 Electrical Engineering Draftspersons and Technicians 746 800 730
3124 Electronic Engineering Draftspersons and Technicians 363 464 314
3131 ICT Support Technicians 466 702 667
3132 Telecommunications Technical Specialists 276 242 271
3423 Electronics Trades Workers 240 285 167
3424 Telecommunications Trades Workers 105 170 298
Total ICT workers* 16,437 20,481 19,079
* Excludes ICT industry admin and logistics support for which breakdowns are unavailable; electronic trades and professional data is for all industries
Source: Department of Immigration, Overseas Arrivals and Departures Statistics (2015)
Table A.8: Net migration of ICT workers, 2011–12 to 2013–14
Field of education studied Share of ICT workers
Information Technology 35%
Engineering and Related Technologies 22%
Management and Commerce 18%
Creative Arts 10%
Society and Culture 6%
Other 5%
Natural and Physical Sciences 4%
Source: ABS Census (2011)
ICT higher and vocational education
Table A.9: ICT workers’ field of education, 2011

60 Australia’s Digital Pulse
Year IT undergraduates IT postgraduates Engineering undergraduates
Engineering postgraduates
2001 35,661 10,161 39,705 7,109
2002 36,647 10,280 40,001 7,487
2003 35,172 9,118 39,690 8,038
2004 31,323 8,139 39,023 8,268
2005 26,527 6,923 38,213 8,218
2006 22,762 6,101 38,983 8,170
2007 20,709 5,488 40,848 8,222
2008 18,905 5,077 42,570 8,417
2009 18,545 5,143 45,142 8,806
2010 18,966 5,213 47,826 9,560
2011 19,902 5,386 49,820 9,863
2012 21,047 5,562 51,922 10,305
2013 22,055 5,447 54,896 10,649
Year IT undergraduates IT postgraduates Engineering undergraduates
Engineering postgraduates
2001 5,451 2,850 6,336 1,509
2002 6,219 3,294 6,228 1,522
2003 6,580 2,588 6,246 1,674
2004 6,283 2,272 6,557 1,632
2005 5,696 1,976 6,036 1,602
2006 4,672 1,642 6,377 1,643
2007 4,185 1,474 6,153 1,808
2008 3,577 1,349 6,290 1,876
2009 3,159 1,315 6,428 1,995
2010 3,050 1,275 6,668 2,294
2011 3,266 1,353 7,105 2,306
2012 3,339 1,326 7,480 2,458
2013 3,463 1,423 7,652 2,768
Source: Department of Education u-Cube (2015)
Source: Department of Education u-Cube (2015)
Table A.10: Domestic enrolments by field of education, 2001 to 2013
Table A.11: Domestic completions by field of education, 2001 to 2013

61Key challenges for our nation – digital skills, jobs and education
Year 2009 2010 2011 2012 2013
Advanced dip/dip 7,124 7,370 6,642 6,189 6,478
Cert III/IV 18,474 16,862 17,597 18,662 19,606
Cert I/II 1,089 701 915 7,682 9,299
Source: National Centre for Vocational Education Research (2015)
* Excluding Telecommunications Services & Internet Service Providers, Web Search Portals and Data Processing Services which are separately identified as ICT industry
subdivisions
** Excluding Computer System Design and Related Services which is separately identified as an ICT industry subdivision
Source: ABS customised report (2015)
Table A.12: VET enrolments in the IT field of education, 2009 to 2013
Table A.13: Female ICT workers by industry, 2014
Female ICT workers Female % of ICT workers Female % of all occupations
Industry divisions
Agriculture, Forestry and Fishing 127 19% 30%
Mining 1,520 31% 14%
Manufacturing 5,733 31% 27%
Electricity, Gas, Water and Waste Services 2,627 27% 21%
Construction 904 11% 11%
Wholesale Trade 3,656 20% 33%
Retail Trade 4,228 22% 56%
Accommodation and Food Services 459 40% 55%
Transport, Postal and Warehousing 1,970 21% 23%
Rest of Information, Media and Telecommunications* 1,439 18% 49%
Financial and Insurance Services 11,214 27% 50%
Rental, Hiring and Real Estate Services 781 26% 50%
Rest of Professional, Scientific and Technical Services** 24,561 36% 48%
Administrative and Support Services 3,049 33% 53%
Public Administration and Safety 17,187 36% 49%
Education and Training 8,523 40% 70%
Health Care and Social Assistance 6,288 45% 78%
Arts and Recreation Services 1,254 27% 47%
Other Services 2,514 27% 43%
ICT industry subdivisions
Telecommunications Services 26,637 28% 28%
Internet Service Providers, Web Search Portals and Data Processing Services
2,262 32% 32%
Computer System Design and Related Services 41,582 22% 22%
Total ICT workers 168,515 28% 42%
Women in ICT
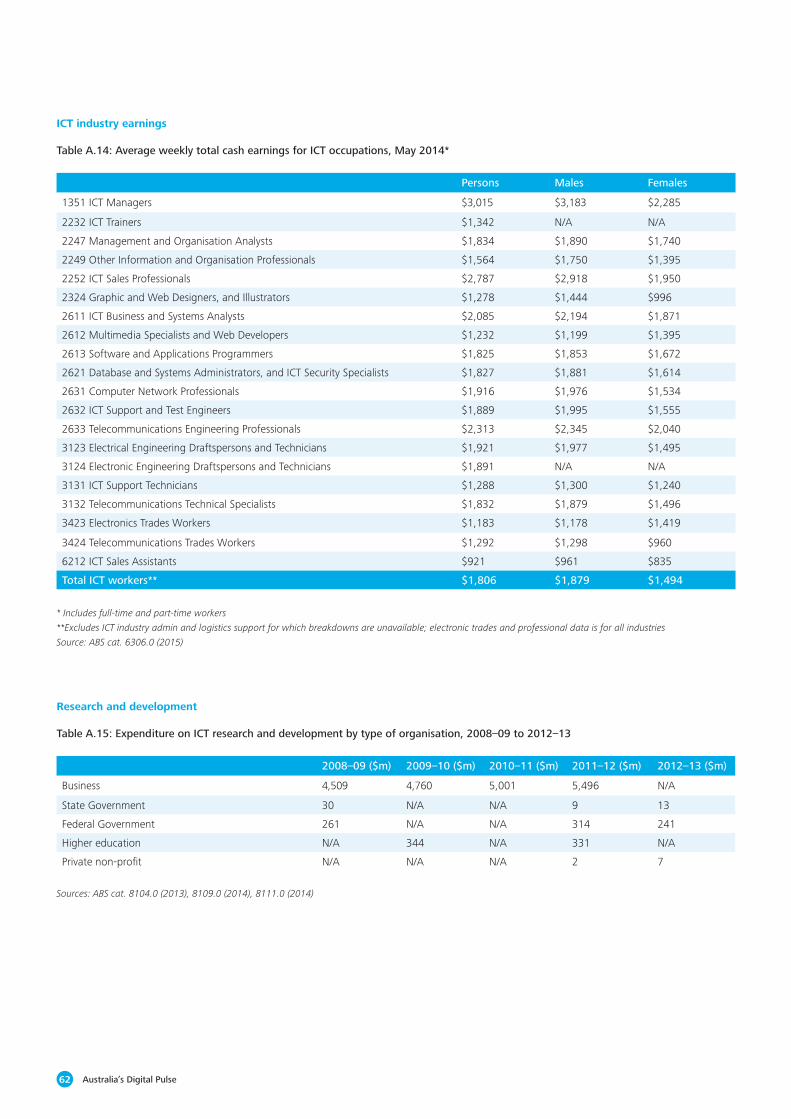
62 Australia’s Digital Pulse
Persons Males Females
1351 ICT Managers $3,015 $3,183 $2,285
2232 ICT Trainers $1,342 N/A N/A
2247 Management and Organisation Analysts $1,834 $1,890 $1,740
2249 Other Information and Organisation Professionals $1,564 $1,750 $1,395
2252 ICT Sales Professionals $2,787 $2,918 $1,950
2324 Graphic and Web Designers, and Illustrators $1,278 $1,444 $996
2611 ICT Business and Systems Analysts $2,085 $2,194 $1,871
2612 Multimedia Specialists and Web Developers $1,232 $1,199 $1,395
2613 Software and Applications Programmers $1,825 $1,853 $1,672
2621 Database and Systems Administrators, and ICT Security Specialists $1,827 $1,881 $1,614
2631 Computer Network Professionals $1,916 $1,976 $1,534
2632 ICT Support and Test Engineers $1,889 $1,995 $1,555
2633 Telecommunications Engineering Professionals $2,313 $2,345 $2,040
3123 Electrical Engineering Draftspersons and Technicians $1,921 $1,977 $1,495
3124 Electronic Engineering Draftspersons and Technicians $1,891 N/A N/A
3131 ICT Support Technicians $1,288 $1,300 $1,240
3132 Telecommunications Technical Specialists $1,832 $1,879 $1,496
3423 Electronics Trades Workers $1,183 $1,178 $1,419
3424 Telecommunications Trades Workers $1,292 $1,298 $960
6212 ICT Sales Assistants $921 $961 $835
Total ICT workers** $1,806 $1,879 $1,494
* Includes full-time and part-time workers
**Excludes ICT industry admin and logistics support for which breakdowns are unavailable; electronic trades and professional data is for all industries
Source: ABS cat. 6306.0 (2015)
Table A.14: Average weekly total cash earnings for ICT occupations, May 2014*
2008–09 ($m) 2009–10 ($m) 2010–11 ($m) 2011–12 ($m) 2012–13 ($m)
Business 4,509 4,760 5,001 5,496 N/A
State Government 30 N/A N/A 9 13
Federal Government 261 N/A N/A 314 241
Higher education N/A 344 N/A 331 N/A
Private non-profit N/A N/A N/A 2 7
Research and development
ICT industry earnings
Table A.15: Expenditure on ICT research and development by type of organisation, 2008–09 to 2012–13
Sources: ABS cat. 8104.0 (2013), 8109.0 (2014), 8111.0 (2014)

63Key challenges for our nation – digital skills, jobs and education
2008–09 ($m) 2009–10 ($m) 2010–11 ($m) 2011–12 ($m)
Engineering 9,570 8,798 9,283 8,686
Information and Computing Sciences 4,509 4,760 5,001 5,496
Technology 793 769 917 941
Medical and Health Sciences 1,003 921 928 331
Agricultural and Veterinary Sciences 367 418 493 455
Chemical Sciences 266 250 275 426
Environmental Sciences 178 155 193 281
Built Environment and Design 178 202 309 232
Commerce, Management, Tourism and Services 94 99 153 144
Earth Sciences 175 153 200 122
Other fields of research 158 235 254 301
Table A.16: Business expenditure on research and development by fields of research, 2008–09 to 2011–12
Source: ABS cat. 8104.0 (2013)
2010 ($m) 2011 ($m) 2012 ($m) 2013 ($m) 2014 ($m)
Telecommunications services 186 138 175 219 296
Computer services 1,269 1,306 1,217 1,356 1,423
Information services 77 59 74 111 106
Other ICT services 196 183 202 235 185
Total ICT services 1,728 1,686 1,668 1,921 2,010
Trade in ICT services
Table A.17: Exports of ICT services, 2010 to 2014
Sources: ABS cat. 5302.0
2010 ($m) 2011 ($m) 2012 ($m) 2013 ($m) 2014 ($m)
Telecommunications services 446 319 232 230 302
Computer services 1,310 1,378 1,379 1,691 2,067
Information services 55 67 98 172 207
Other ICT services 227 204 203 306 310
Total ICT services 2,038 1,968 1,912 2,399 2,886
Table A.18: Imports of ICT services, 2010 to 2014
Sources: ABS cat. 5302.0

64 Australia’s Digital Pulse
Table A.19: Share of ICT specialists in the total economy (narrow measure of ICT users)
International comparison: users of ICT across the workforce
1995 2010
Sweden 3.9% 5.4%
Switzerland N/A 5.0%
Czech Republic 3.9% 4.7%
Norway N/A 4.7%
Finland 2.7% 4.5%
Denmark 3.0% 4.4%
Luxembourg 2.9% 4.4%
Canada 3.0% 4.4%
Netherlands 3.3% 4.0%
United States 3.3% 4.0%
Australia 3.1% 3.6%
Germany 2.2% 3.5%
Iceland N/A 3.5%
United Kingdom 2.9% 3.3%
Estonia N/A 3.2%
Austria 2.5% 3.2%
Belgium 2.1% 3.1%
France 2.9% 3.1%
Cyprus N/A 3.1%
Spain 2.2% 3.1%
Source: OECD, Information Technology Outlook (2010)
1995 2010
Italy 2.4% 3.1%
Slovenia N/A 3.0%
Slovak Republic N/A 2.9%
Malta N/A 2.9%
Ireland 2.8% 2.8%
Poland N/A 20.4%
United States 21.2% 20.3%
Spain 15.8% 19.5%
Poland N/A 2.8%
Latvia N/A 2.7%
Hungary N/A 2.7%
Portugal 2.8% 2.6%
Bulgaria N/A 2.4%
Romania N/A 2.3%
Greece 2.2% 2.2%
Croatia N/A 2.0%
Turkey N/A 1.7%
Lithuania N/A 1.6%
FYR Macedonia N/A 1.5%
Table A.20: Share of ICT-intensive jobs in the total economy (broad measure of ICT users)
1995 2010
Luxembourg 23.0% 35.3%
United Kingdom 27.8% 28.1%
Denmark 20.4% 27.3%
Lithuania N/A 26.9%
Sweden 20.4% 26.5%
Malta N/A 26.3%
Finland 20.0% 25.5%
Estonia N/A 24.1%
Norway N/A 24.1%
Slovenia N/A 24.0%
Ireland 14.5% 24.0%
Latvia N/A 24.0%
Switzerland N/A 23.6%
Netherlands 23.0% 23.5%
Iceland N/A 23.0%
Czech Republic 18.6% 22.8%
Belgium 18.7% 22.7%
Cyprus N/A 22.7%
1995 2010
Source: OECD, Information Technology Outlook (2010)
Germany 20.4% 22.5%
Hungary N/A 22.5%
Australia 21.7% 22.1%
Canada 20.6% 21.2%
Austria 15.1% 20.8%
Slovak Republic N/A 20.8%
France 18.6% 20.7%
Italy 20.9% 20.4%
United States 21.2% 20.3%
Spain 15.8% 19.5%
Poland N/A 19.5%
Croatia N/A 16.1%
Greece 10.3% 15.2%
Bulgaria N/A 15.0%
Portugal 16.4% 15.0%
Romania N/A 11.8%
Turkey N/A 10.9%
FYR Macedonia N/A 9.4%

65Key challenges for our nation – digital skills, jobs and education
Table A.21: ICT research and development as a share of total research expenditure
International comparison: ICT research and development
ICT R&D* Year**
Chinese Taipei 73% 2013
Korea 54% 2013
Ireland 36% 2011
United States 32% 2011
Singapore 30% 2011
Canada 27% 2013
Norway 25% 2012
Turkey 25% 2013
Estonia 25% 2012
Portugal 24% 2012
Romania 23% 2012
Hungary 19% 2012
New Zealand 19% 2011
Japan 18% 2013
* ICT R&D calculated as the sum of R&D in the following industries under ISIC Rev. 4 classifications: D261, D262, D263, D582, D61, D62, D63.
** Latest available year
Source: OECD, STAN R&D Expenditures in Industry (2015)
ICT R&D* Year**
Italy 18% 2012
France 17% 2012
United Kingdom 16% 2012
Czech Republic 15% 2012
Belgium 15% 2011
Spain 15% 2012
Denmark 14% 2012
Netherlands 14% 2012
Germany 12% 2012
Austria 12% 2011
Slovenia 10% 2012
Australia 10% 2011
Finland 9% 2012
Poland 2% 2012
Table A.22: ICT-related patents as a share of total patents, 2011
ICT patents
Finland 54.5%
Korea 48.8%
Sweden 48.6%
Israel 45.3%
Canada 43.8%
Japan 42.7%
Ireland 42.3%
Estonia 41.7%
United States 40.3%
United Kingdom 33.0%
Hungary 32.8%
Netherlands 30.5%
Portugal 29.4%
France 29.2%
Australia 27.7%
Greece 27.5%
Belgium 26.6%
ICT patents
Source: OECD, Broadband Portal (2014)
Spain 26.4%
Poland 24.4%
Germany 23.7%
Switzerland 23.0%
Austria 21.8%
Denmark 21.2%
Luxembourg 20.8%
Norway 20.8%
New Zealand 19.1%
Italy 16.8%
Slovenia 16.0%
Mexico 15.1%
Slovak Republic 14.5%
Iceland 13.8%
Turkey 12.6%
Czech Republic 12.5%
Chile 9.2%
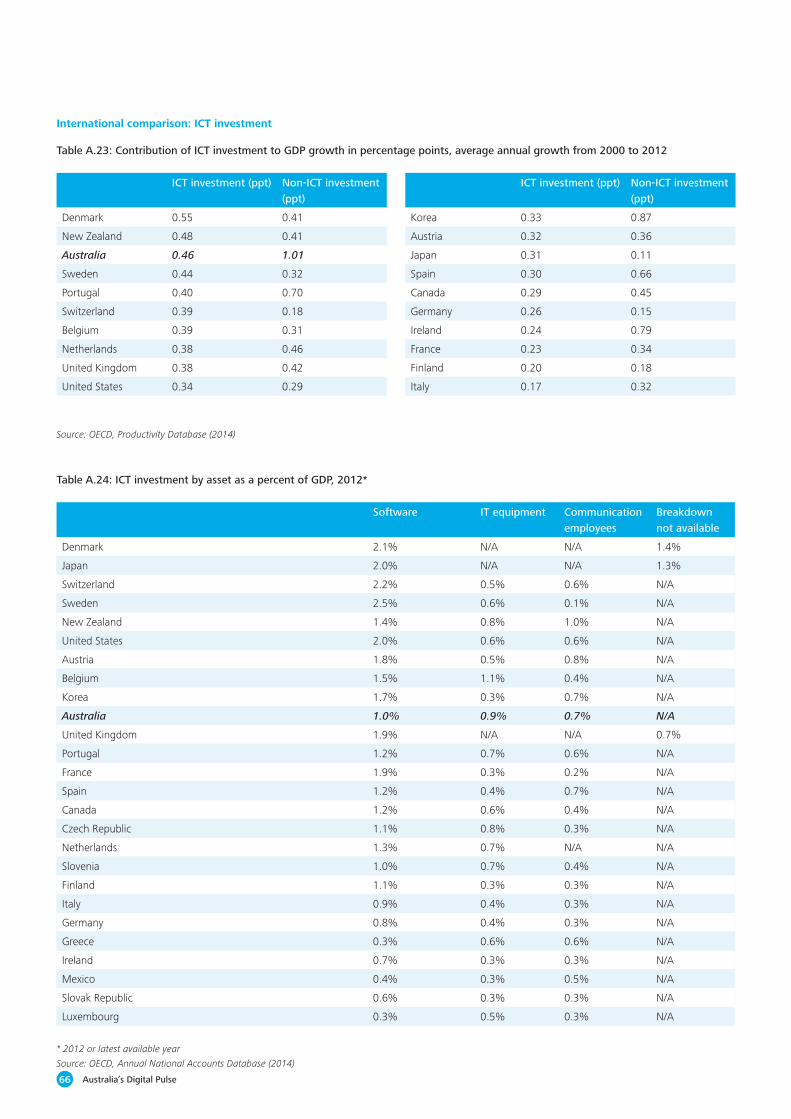
66 Australia’s Digital Pulse
Table A.23: Contribution of ICT investment to GDP growth in percentage points, average annual growth from 2000 to 2012
International comparison: ICT investment
ICT investment (ppt) Non-ICT investment (ppt)
Denmark 0.55 0.41
New Zealand 0.48 0.41
Australia 0.46 1.01
Sweden 0.44 0.32
Portugal 0.40 0.70
Switzerland 0.39 0.18
Belgium 0.39 0.31
Netherlands 0.38 0.46
United Kingdom 0.38 0.42
United States 0.34 0.29
ICT investment (ppt) Non-ICT investment (ppt)
Source: OECD, Productivity Database (2014)
Korea 0.33 0.87
Austria 0.32 0.36
Japan 0.31 0.11
Spain 0.30 0.66
Canada 0.29 0.45
Germany 0.26 0.15
Ireland 0.24 0.79
France 0.23 0.34
Finland 0.20 0.18
Italy 0.17 0.32
Table A.24: ICT investment by asset as a percent of GDP, 2012*
Software IT equipment Communication employees
Breakdown not available
Denmark 2.1% N/A N/A 1.4%
Japan 2.0% N/A N/A 1.3%
Switzerland 2.2% 0.5% 0.6% N/A
Sweden 2.5% 0.6% 0.1% N/A
New Zealand 1.4% 0.8% 1.0% N/A
United States 2.0% 0.6% 0.6% N/A
Austria 1.8% 0.5% 0.8% N/A
Belgium 1.5% 1.1% 0.4% N/A
Korea 1.7% 0.3% 0.7% N/A
Australia 1.0% 0.9% 0.7% N/A
United Kingdom 1.9% N/A N/A 0.7%
Portugal 1.2% 0.7% 0.6% N/A
France 1.9% 0.3% 0.2% N/A
Spain 1.2% 0.4% 0.7% N/A
Canada 1.2% 0.6% 0.4% N/A
Czech Republic 1.1% 0.8% 0.3% N/A
Netherlands 1.3% 0.7% N/A N/A
Slovenia 1.0% 0.7% 0.4% N/A
Finland 1.1% 0.3% 0.3% N/A
Italy 0.9% 0.4% 0.3% N/A
Germany 0.8% 0.4% 0.3% N/A
Greece 0.3% 0.6% 0.6% N/A
Ireland 0.7% 0.3% 0.3% N/A
Mexico 0.4% 0.3% 0.5% N/A
Slovak Republic 0.6% 0.3% 0.3% N/A
Luxembourg 0.3% 0.5% 0.3% N/A
* 2012 or latest available year
Source: OECD, Annual National Accounts Database (2014)
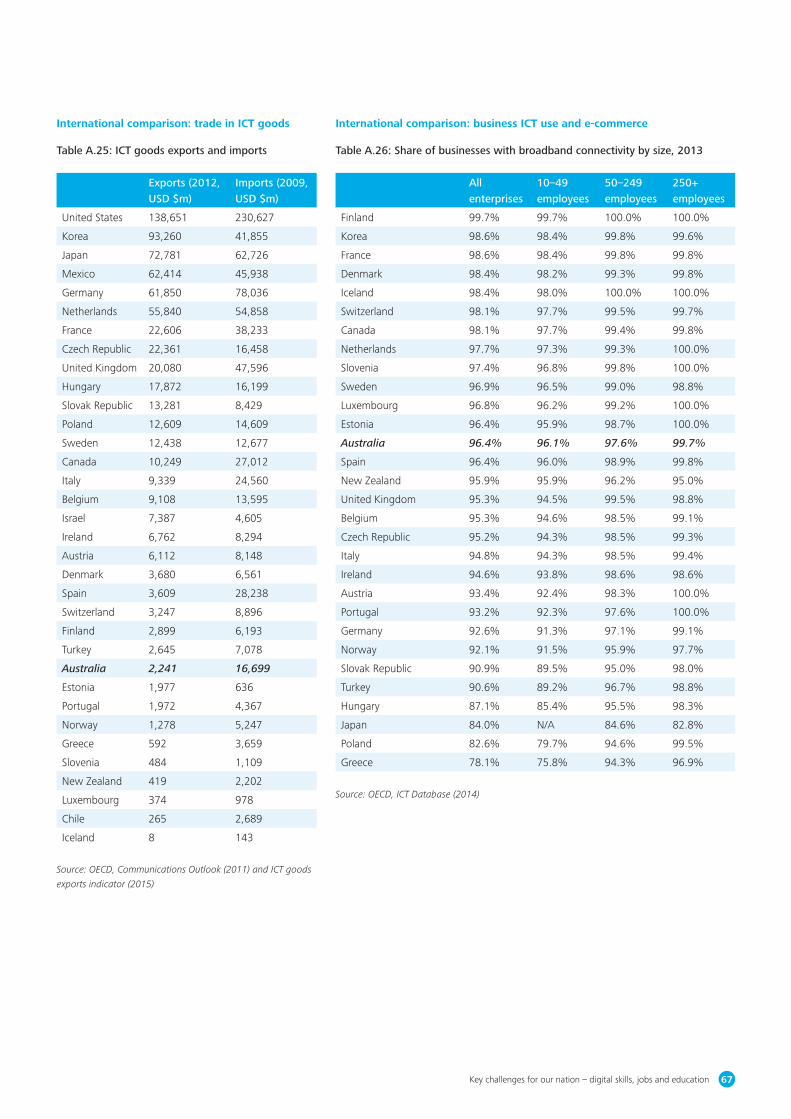
67Key challenges for our nation – digital skills, jobs and education
Table A.25: ICT goods exports and imports
Exports (2012, USD $m)
Imports (2009, USD $m)
United States 138,651 230,627
Korea 93,260 41,855
Japan 72,781 62,726
Mexico 62,414 45,938
Germany 61,850 78,036
Netherlands 55,840 54,858
France 22,606 38,233
Czech Republic 22,361 16,458
United Kingdom 20,080 47,596
Hungary 17,872 16,199
Slovak Republic 13,281 8,429
Poland 12,609 14,609
Sweden 12,438 12,677
Canada 10,249 27,012
Italy 9,339 24,560
Belgium 9,108 13,595
Israel 7,387 4,605
Ireland 6,762 8,294
Austria 6,112 8,148
Denmark 3,680 6,561
Spain 3,609 28,238
Switzerland 3,247 8,896
Finland 2,899 6,193
Turkey 2,645 7,078
Australia 2,241 16,699
Estonia 1,977 636
Portugal 1,972 4,367
Norway 1,278 5,247
Greece 592 3,659
Slovenia 484 1,109
New Zealand 419 2,202
Luxembourg 374 978
Chile 265 2,689
Iceland 8 143
Source: OECD, Communications Outlook (2011) and ICT goods
exports indicator (2015)
Table A.26: Share of businesses with broadband connectivity by size, 2013
All enterprises
10–49 employees
50–249 employees
250+ employees
Finland 99.7% 99.7% 100.0% 100.0%
Korea 98.6% 98.4% 99.8% 99.6%
France 98.6% 98.4% 99.8% 99.8%
Denmark 98.4% 98.2% 99.3% 99.8%
Iceland 98.4% 98.0% 100.0% 100.0%
Switzerland 98.1% 97.7% 99.5% 99.7%
Canada 98.1% 97.7% 99.4% 99.8%
Netherlands 97.7% 97.3% 99.3% 100.0%
Slovenia 97.4% 96.8% 99.8% 100.0%
Sweden 96.9% 96.5% 99.0% 98.8%
Luxembourg 96.8% 96.2% 99.2% 100.0%
Estonia 96.4% 95.9% 98.7% 100.0%
Australia 96.4% 96.1% 97.6% 99.7%
Spain 96.4% 96.0% 98.9% 99.8%
New Zealand 95.9% 95.9% 96.2% 95.0%
United Kingdom 95.3% 94.5% 99.5% 98.8%
Belgium 95.3% 94.6% 98.5% 99.1%
Czech Republic 95.2% 94.3% 98.5% 99.3%
Italy 94.8% 94.3% 98.5% 99.4%
Ireland 94.6% 93.8% 98.6% 98.6%
Austria 93.4% 92.4% 98.3% 100.0%
Portugal 93.2% 92.3% 97.6% 100.0%
Germany 92.6% 91.3% 97.1% 99.1%
Norway 92.1% 91.5% 95.9% 97.7%
Slovak Republic 90.9% 89.5% 95.0% 98.0%
Turkey 90.6% 89.2% 96.7% 98.8%
Hungary 87.1% 85.4% 95.5% 98.3%
Japan 84.0% N/A 84.6% 82.8%
Poland 82.6% 79.7% 94.6% 99.5%
Greece 78.1% 75.8% 94.3% 96.9%
Source: OECD, ICT Database (2014)
International comparison: business ICT use and e-commerceInternational comparison: trade in ICT goods

68 Australia’s Digital Pulse
Table A.27: Share of businesses with a website by size, 2013
All enterprises 10–49 employees
50–249 employees
250+ employees
Finland 93.6% 92.5% 98.2% 99.1%
Denmark 91.8% 91.1% 94.5% 96.4%
Switzerland 91.7% 90.5% 95.7% 99.1%
Sweden 88.9% 87.1% 98.1% 98.5%
Japan 88.6% N/A 85.9% 94.3%
Austria 85.7% 83.9% 93.8% 98.3%
Germany 84.4% 82.4% 91.7% 95.8%
Netherlands 83.8% 81.7% 91.6% 96.4%
Iceland 82.7% 80.3% 92.8% 100.0%
United Kingdom 82.0% 79.6% 92.9% 96.5%
Czech Republic 79.9% 76.7% 92.4% 92.2%
Slovenia 79.7% 76.1% 92.5% 99.5%
Slovak Republic 79.6% 78.5% 83.1% 84.5%
Norway 79.0% 77.0% 90.5% 93.2%
Luxembourg 78.6% 75.8% 88.1% 96.6%
Belgium 78.3% 75.7% 90.2% 94.2%
New Zealand 78.0% 75.7% 89.4% 95.6%
Canada 77.5% 73.7% 88.8% 91.5%
Estonia 75.7% 72.9% 87.2% 94.0%
Ireland 74.7% 71.1% 90.7% 97.3%
Australia 74.1% 73.1% 77.8% 96.7%
Spain 68.4% 65.4% 85.9% 93.2%
Italy 67.2% 65.2% 82.7% 90.2%
Poland 66.0% 61.3% 85.2% 91.9%
France 65.3% 61.5% 86.7% 93.9%
Hungary 61.2% 58.1% 76.4% 82.1%
Greece 60.6% 57.6% 81.8% 91.5%
Korea 60.1% 57.4% 73.4% 87.9%
Portugal 59.2% 54.4% 84.8% 97.0%
Turkey 53.8% 50.0% 68.5% 83.2%
Source: OECD, ICT Database (2014)

69Key challenges for our nation – digital skills, jobs and education
Table A.28: Share of businesses engaged in sales via e–commerce by size, 2012
All enterprises 10–49 employees
50–249 employees
250+ employees
New Zealand 47.4% 46.8% 49.6% 58.1%
Australia 38.4% 38.6% 36.5% 41.0%
Switzerland 34.5% 33.8% 34.8% 52.0%
Iceland 33.8% 29.9% 52.4% 55.1%
Denmark 29.8% 27.4% 37.7% 56.4%
Norway 27.6% 25.5% 38.2% 47.4%
Czech Republic 27.0% 25.2% 31.9% 44.0%
Germany 25.8% 23.5% 32.6% 48.4%
Sweden 25.7% 23.5% 33.6% 54.2%
Japan 24.6% N/A 22.9% 28.1%
Ireland 23.3% 19.2% 42.2% 43.4%
Netherlands 22.1% 19.9% 29.4% 40.7%
United Kingdom 21.7% 19.4% 29.6% 46.3%
Belgium 21.1% 18.9% 28.6% 46.7%
Slovak Republic 19.8% 18.6% 20.7% 36.0%
Finland 19.3% 15.6% 31.8% 48.8%
Canada 18.5% 16.5% 23.4% 29.2%
Luxembourg 17.1% 15.9% 19.4% 33.7%
Austria 16.4% 13.9% 25.9% 42.9%
Slovenia 15.4% 12.6% 22.4% 47.7%
Korea 15.3% 14.1% 19.9% 34.9%
Portugal 14.7% 12.7% 24.6% 36.9%
Spain 14.3% 12.4% 24.2% 32.7%
France 13.8% 11.1% 27.3% 43.2%
Hungary 12.8% 11.7% 16.4% 28.6%
Estonia 12.7% 10.7% 19.6% 30.9%
Poland 10.7% 8.9% 15.7% 33.3%
Turkey 10.1% 9.2% 12.6% 21.6%
Greece 10.0% 8.8% 18.0% 19.8%
Italy 7.5% 6.8% 11.9% 24.6%
Source: OECD, ICT Database (2014)
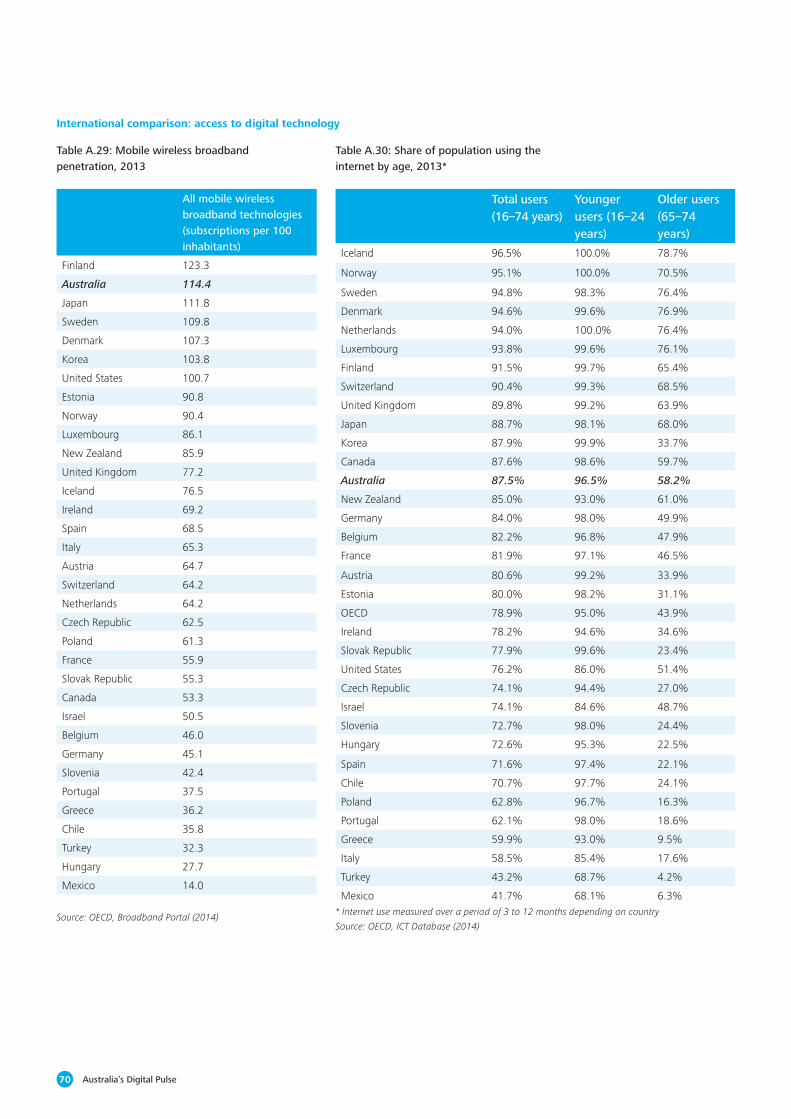
70 Australia’s Digital Pulse
Total users(16–74 years)
Younger users (16–24 years)
Older users(65–74 years)
Iceland 96.5% 100.0% 78.7%
Norway 95.1% 100.0% 70.5%
Sweden 94.8% 98.3% 76.4%
Denmark 94.6% 99.6% 76.9%
Netherlands 94.0% 100.0% 76.4%
Luxembourg 93.8% 99.6% 76.1%
Finland 91.5% 99.7% 65.4%
Switzerland 90.4% 99.3% 68.5%
United Kingdom 89.8% 99.2% 63.9%
Japan 88.7% 98.1% 68.0%
Korea 87.9% 99.9% 33.7%
Canada 87.6% 98.6% 59.7%
Australia 87.5% 96.5% 58.2%
New Zealand 85.0% 93.0% 61.0%
Germany 84.0% 98.0% 49.9%
Belgium 82.2% 96.8% 47.9%
France 81.9% 97.1% 46.5%
Austria 80.6% 99.2% 33.9%
Estonia 80.0% 98.2% 31.1%
OECD 78.9% 95.0% 43.9%
Ireland 78.2% 94.6% 34.6%
Slovak Republic 77.9% 99.6% 23.4%
United States 76.2% 86.0% 51.4%
Czech Republic 74.1% 94.4% 27.0%
Israel 74.1% 84.6% 48.7%
Slovenia 72.7% 98.0% 24.4%
Hungary 72.6% 95.3% 22.5%
Spain 71.6% 97.4% 22.1%
Chile 70.7% 97.7% 24.1%
Poland 62.8% 96.7% 16.3%
Portugal 62.1% 98.0% 18.6%
Greece 59.9% 93.0% 9.5%
Italy 58.5% 85.4% 17.6%
Turkey 43.2% 68.7% 4.2%
Mexico 41.7% 68.1% 6.3%
Table A.30: Share of population using the internet by age, 2013*
* Internet use measured over a period of 3 to 12 months depending on country
Source: OECD, ICT Database (2014)
Table A.29: Mobile wireless broadband penetration, 2013
International comparison: access to digital technology
All mobile wireless broadband technologies (subscriptions per 100 inhabitants)
Finland 123.3
Australia 114.4
Japan 111.8
Sweden 109.8
Denmark 107.3
Korea 103.8
United States 100.7
Estonia 90.8
Norway 90.4
Luxembourg 86.1
New Zealand 85.9
United Kingdom 77.2
Iceland 76.5
Ireland 69.2
Spain 68.5
Italy 65.3
Austria 64.7
Switzerland 64.2
Netherlands 64.2
Czech Republic 62.5
Poland 61.3
France 55.9
Slovak Republic 55.3
Canada 53.3
Israel 50.5
Belgium 46.0
Germany 45.1
Slovenia 42.4
Portugal 37.5
Greece 36.2
Chile 35.8
Turkey 32.3
Hungary 27.7
Mexico 14.0
Source: OECD, Broadband Portal (2014)


73Key challenges for our nation – digital skills, jobs and education
Ric SimesPartnerTel: +61 2 9322 [email protected]
Frank FarrallPartnerTel: +61 3 9671 [email protected]
John O’MahonyDirectorTel: +61 2 9322 [email protected]
David RumbensPartnerTel: +61 3 9671 [email protected]
Rob HillardPartnerTel: +61 3 9671 [email protected]
Sara MaSenior AnalystTel: +61 2 9322 [email protected]
Andrew PonsonbyAnalystTel: +61 3 9671 [email protected]
Our people


Deloitte Access Economics is Australia’s pre-eminent economics advisory practice and a member of Deloitte’s global economics group. The Directors and staff of Access Economics joined Deloitte in early 2011.
Deloitte refers to one or more of Deloitte Touche Tohmatsu Limited, a UK private company limited by guarantee, and its network of member firms, each of which is a legally separate and independent entity. Please see www.deloitte.com/au/about for a detailed description of the legal structure of Deloitte Touche Tohmatsu Limited and its member firms.
About the ACS
The ACS is the professional association for Australia’s Information and Communication Technology (ICT) sector. Over 20,000 ACS members work in business, education, government and the community. The Society exists to create the environment and provide the opportunities for members and partners to succeed. The ACS strives for ICT professionals to be recognised as drivers of innovation in our society, relevant across all sectors, and to promote the formulation of effective policies on ICT and related matters. Visit www.acs.org.au for more information.
About Deloitte
Deloitte provides audit, tax, consulting, and financial advisory services to public and private clients spanning multiple industries. With a globally connected network of member firms in more than 150 countries, Deloitte brings world-class capabilities and deep local expertise to help clients succeed wherever they operate. Deloitte’s approximately 200,000 professionals are committed to becoming the standard of excellence.
About Deloitte Australia
In Australia, the member firm is the Australian partnership of Deloitte Touche Tohmatsu. As one of Australia’s leading professional services firms. Deloitte Touche Tohmatsu and its affiliates provide audit, tax, consulting, and financial advisory services through approximately 6,000 people across the country. Focused on the creation of value and growth, and known as an employer of choice for innovative human resources programs, we are dedicated to helping our clients and our people excel. For more information, please visit our web site at www.deloitte.com.au.
Liability limited by a scheme approved under Professional Standards Legislation.
Member of Deloitte Touche Tohmatsu Limited
© 2015 Deloitte Access Economics Pty Ltd.
MCBD_Hyd_06/13_51714
Contact us
Deloitte Access EconomicsACN: 149 633 116
Level 7225 George StSydney NSW 2000Australia
Tel: +61 2 9322 7000Fax: +61 2 9322 7001
www.deloitteaccesseconomics.com.au