Australian unemployment plummets to 8.7% in September as ...
25
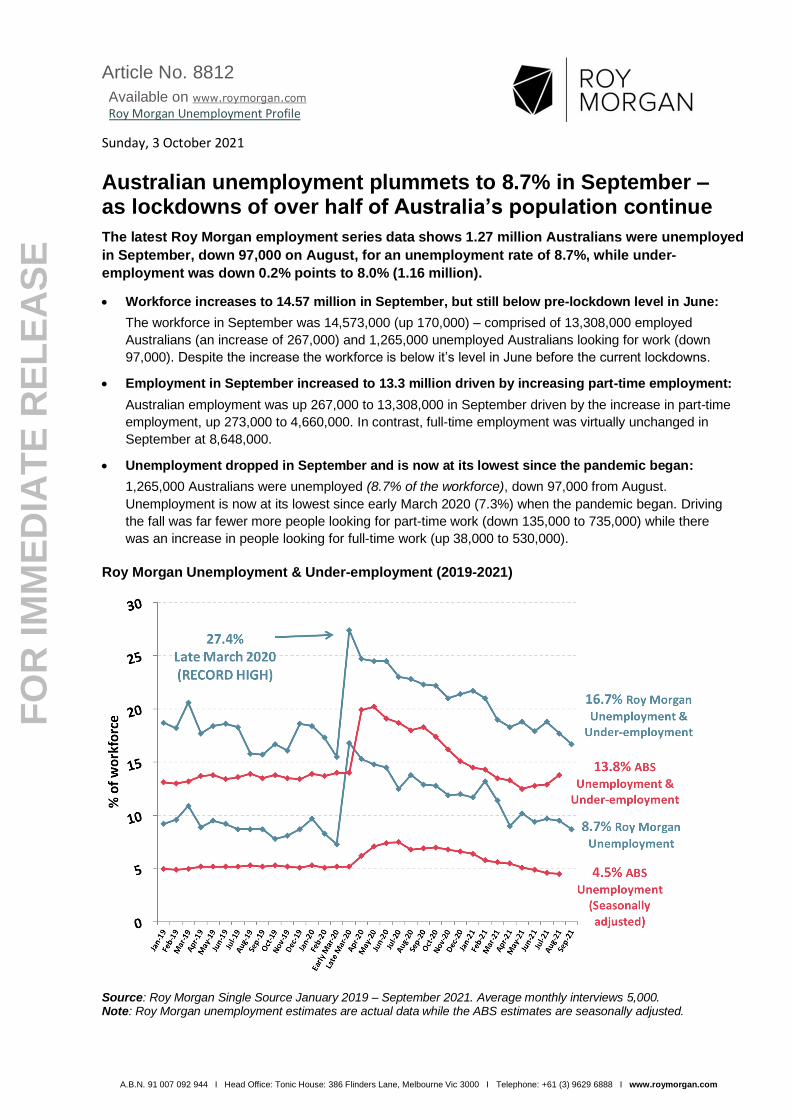
Article No. 8812 Available on www.roymorgan.com Roy Morgan Unemployment Profile A.B.N. 91 007 092 944 I Head Office: Tonic House: 386 Flinders Lane, Melbourne Vic 3000 I Telephone: +61 (3) 9629 6888 I www.roymorgan.com FOR IMMEDIATE RELEASE Sunday, 3 October 2021 Australian unemployment plummets to 8.7% in September – as lockdowns of over half of Australia’s population continue The latest Roy Morgan employment series data shows 1.27 million Australians were unemployed in September, down 97,000 on August, for an unemployment rate of 8.7%, while under- employment was down 0.2% points to 8.0% (1.16 million). • Workforce increases to 14.57 million in September, but still below pre-lockdown level in June: The workforce in September was 14,573,000 (up 170,000) – comprised of 13,308,000 employed Australians (an increase of 267,000) and 1,265,000 unemployed Australians looking for work (down 97,000). Despite the increase the workforce is below it’s level in June before the current lockdowns. • Employment in September increased to 13.3 million driven by increasing part-time employment: Australian employment was up 267,000 to 13,308,000 in September driven by the increase in part-time employment, up 273,000 to 4,660,000. In contrast, full-time employment was virtually unchanged in September at 8,648,000. • Unemployment dropped in September and is now at its lowest since the pandemic began: 1,265,000 Australians were unemployed (8.7% of the workforce), down 97,000 from August. Unemployment is now at its lowest since early March 2020 (7.3%) when the pandemic began. Driving the fall was far fewer more people looking for part-time work (down 135,000 to 735,000) while there was an increase in people looking for full-time work (up 38,000 to 530,000). Roy Morgan Unemployment & Under-employment (2019-2021) Source: Roy Morgan Single Source January 2019 – September 2021. Average monthly interviews 5,000. Note: Roy Morgan unemployment estimates are actual data while the ABS estimates are seasonally adjusted.
Transcript of Australian unemployment plummets to 8.7% in September as ...
Article No. 8812
Available on www.roymorgan.com
Roy Morgan Unemployment Profile
A.B.N. 91 007 092 944 I Head Office: Tonic House: 386 Flinders Lane, Melbourne Vic 3000 I Telephone: +61 (3) 9629 6888 I www.roymorgan.com
FO
R I
MM
ED
IAT
E R
EL
EA
SE
Sunday, 3 October 2021
Australian unemployment plummets to 8.7% in September – as lockdowns of over half of Australia’s population continue
The latest Roy Morgan employment series data shows 1.27 million Australians were unemployed
in September, down 97,000 on August, for an unemployment rate of 8.7%, while under-
employment was down 0.2% points to 8.0% (1.16 million).
• Workforce increases to 14.57 million in September, but still below pre-lockdown level in June:
The workforce in September was 14,573,000 (up 170,000) – comprised of 13,308,000 employed
Australians (an increase of 267,000) and 1,265,000 unemployed Australians looking for work (down
97,000). Despite the increase the workforce is below it’s level in June before the current lockdowns.
• Employment in September increased to 13.3 million driven by increasing part-time employment:
Australian employment was up 267,000 to 13,308,000 in September driven by the increase in part-time
employment, up 273,000 to 4,660,000. In contrast, full-time employment was virtually unchanged in
September at 8,648,000.
• Unemployment dropped in September and is now at its lowest since the pandemic began:
1,265,000 Australians were unemployed (8.7% of the workforce), down 97,000 from August.
Unemployment is now at its lowest since early March 2020 (7.3%) when the pandemic began. Driving
the fall was far fewer more people looking for part-time work (down 135,000 to 735,000) while there
was an increase in people looking for full-time work (up 38,000 to 530,000).
Roy Morgan Unemployment & Under-employment (2019-2021)
Source: Roy Morgan Single Source January 2019 – September 2021. Average monthly interviews 5,000. Note: Roy Morgan unemployment estimates are actual data while the ABS estimates are seasonally adjusted.
A.B.N. 91 007 092 944 I Head Office: Tonic House: 386 Flinders Lane, Melbourne Vic 3000 I Telephone: +61 (3) 9629 6888 I www.roymorgan.com
FO
R I
MM
ED
IAT
E R
EL
EA
SE
Roy Morgan’s unemployment figure of 8.7% for September is over 4% points higher than the current
ABS estimate for August 2021 of 4.5%. However, the ABS figure for August counts as employed an
additional 248,900 Australians who were working zero hours for ‘economic reasons’ and 371,300 Australians
who were working zero hours for ‘other reasons’ – such as being forced out of work by mandatory lockdowns.
If these 620,200 non-workers are added back the ABS unemployment estimate for June increases to 1.24
million (9.1%). The ABS also claims there are nearly 1.27 million Australians (9.3%) under-employed for a
total of over 2.51 million unemployed or under-employed (18.4% of the workforce) – a very similar estimate to
the latest Roy Morgan unemployment and under-employment estimate.
• Under-employment was also down in September despite increasing part-time employment:
In addition to those who were unemployed, 1.16 million Australians (8.0% of the workforce) were under-
employed – working part-time but looking for more work, a drop of 12,000 (down 0.2% points) from August.
In total 2.43 million Australians (16.7% of the workforce) were either unemployed or under-employed in
September, a drop of 108,000 on August. Overall, total unemployment and under-employment was at
its lowest since early March 2020 (2.16 million) just prior to the start of the pandemic.
Compared to early March 2020, before the nation-wide lockdown was implemented, in September
2021 there were over 260,000 more Australians either unemployed or under-employed (+1.1% points)
even though overall employment (13,308,000) is still higher than it was pre-COVID-19 (12,872,000).
Michele Levine, CEO Roy Morgan, says the lockdown of Australia’s two largest cities continued
throughout September although both the NSW and Victorian State Governments have now
outlined plans for re-opening beginning in October as the lockdowns come to an end:
“The latest Roy Morgan employment estimates for September show unemployment falling 0.8% points to 8.7% and the measure is now at its lowest since February 2020 (8.3%). However, the drops in unemployment over the last two months, driven by declines in NSW and Victoria, are not a true reflection of the labour market with more than half of Australia’s population currently in lockdown.
“The workforce increased in September but is still well below its level in June 2021 before the current lockdowns began in Greater Sydney. Driving the increase in the workforce was a rise in part-time employment – which increased in both New South Wales and Victoria and was up 273,000 to over 4.6 million nation-wide. In contrast full-time employment was virtually unchanged from a month ago.
“The current lockdowns in Sydney and Canberra are due to end by mid-October while the lockdown of Melbourne is projected to end in the final week of October – with all dates subject to the rates of full vaccination. The end of the lockdowns in Australia’s two largest cities will turn the focus towards the existing State border closures of Queensland, Western Australia, South Australia and Tasmania.
“The latest remarks in the past few days by Tasmanian Premier Peter Gutwein that his State won’t open up until 90% of its population are fully vaccinated echoes remarks made by Queensland Premier Annastacia Palaszczuk and WA Premier Mark McGowan.
“A target of 90% of the population fully vaccinated is far higher than the plan outlined by national cabinet for Australia to open up when 80% of the population is fully vaccinated. However, although the national cabinet plan called for the end of lockdowns at 80% full vaccination there is no reference in the plan relating to re-opening State borders.
“These circumstances suggest when NSW, Victoria and the ACT re-open their economies in October and November, possibly including the resumption of international travel soon after, it may well be easier to travel to London or Los Angeles than Brisbane or Perth.
“The end of lockdowns in Sydney, Melbourne and Canberra will also bring an end to continuing Commonwealth wage subsidies. However, the experience of a year ago suggests that the savings many workers have made while being forced to work from home for the last few months should lead to a surge in consumer spending in retail and hospitality industries over the last few months of this year.
“Combined with the closed State borders this should lead to the increased spending being concentrated in the states emerging from lockdown – NSW and Victoria – and provide a boost to economic growth in these two States in the run-up to Christmas.
A.B.N. 91 007 092 944 I Head Office: Tonic House: 386 Flinders Lane, Melbourne Vic 3000 I Telephone: +61 (3) 9629 6888 I www.roymorgan.com
FO
R I
MM
ED
IAT
E R
EL
EA
SE
“This may be an optimistic view but it likely aligns with the belief in Federal Government and why the decision has been made to end the wage subsidies when 80% of the population is fully vaccinated and out of lockdown.
“The expected surge in spending in NSW and Victoria should underpin strong growth in November and December which would be expected to support employment growth in these two States over the next few months post-lockdown.
“The likely losers of this increased spending are the tourism industries of Queensland, Western Australia and Tasmania which could well miss out on a ‘bumper summer’ if their respective State Premiers decide to keep their State borders closed until well into 2022.”
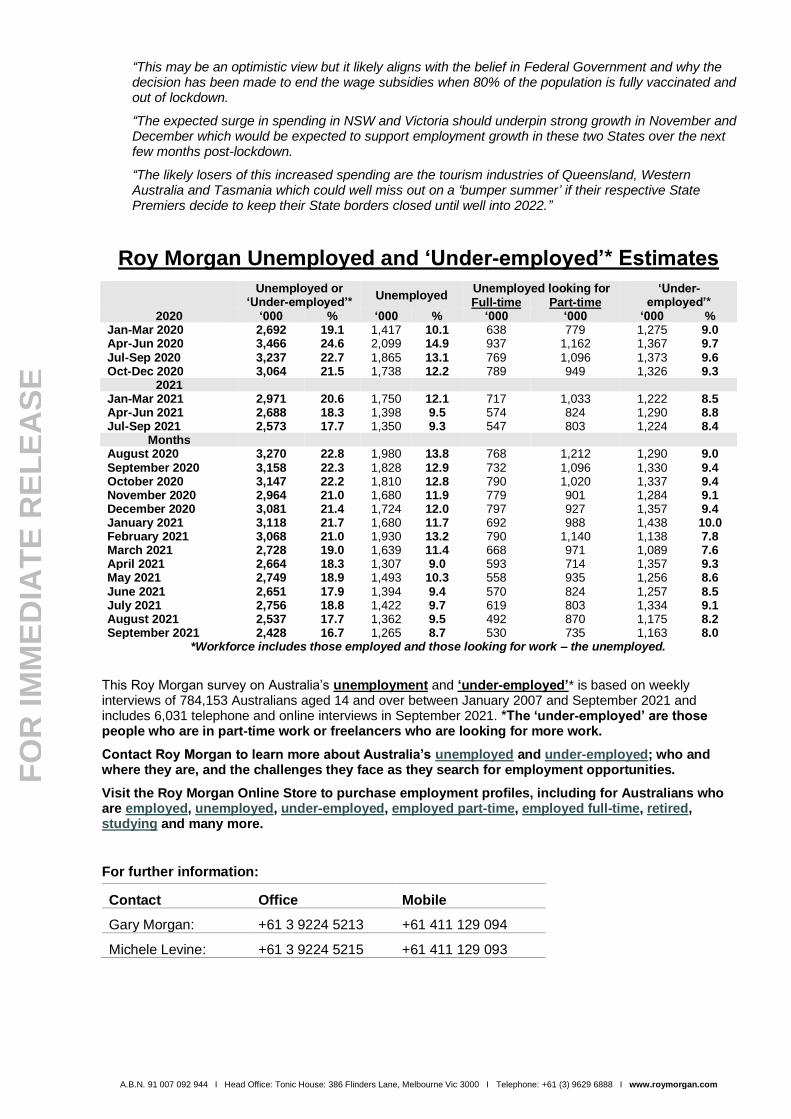
Roy Morgan Unemployed and ‘Under-employed’* Estimates
Unemployed or ‘Under-employed’*
Unemployed Unemployed looking for ‘Under-
employed’* Full-time Part-time 2020 ‘000 % ‘000 % ‘000 ‘000 ‘000 %
Jan-Mar 2020 2,692 19.1 1,417 10.1 638 779 1,275 9.0 Apr-Jun 2020 3,466 24.6 2,099 14.9 937 1,162 1,367 9.7 Jul-Sep 2020 3,237 22.7 1,865 13.1 769 1,096 1,373 9.6 Oct-Dec 2020 3,064 21.5 1,738 12.2 789 949 1,326 9.3
2021 Jan-Mar 2021 2,971 20.6 1,750 12.1 717 1,033 1,222 8.5 Apr-Jun 2021 2,688 18.3 1,398 9.5 574 824 1,290 8.8 Jul-Sep 2021 2,573 17.7 1,350 9.3 547 803 1,224 8.4
Months August 2020 3,270 22.8 1,980 13.8 768 1,212 1,290 9.0 September 2020 3,158 22.3 1,828 12.9 732 1,096 1,330 9.4 October 2020 3,147 22.2 1,810 12.8 790 1,020 1,337 9.4 November 2020 2,964 21.0 1,680 11.9 779 901 1,284 9.1 December 2020 3,081 21.4 1,724 12.0 797 927 1,357 9.4 January 2021 3,118 21.7 1,680 11.7 692 988 1,438 10.0 February 2021 3,068 21.0 1,930 13.2 790 1,140 1,138 7.8 March 2021 2,728 19.0 1,639 11.4 668 971 1,089 7.6 April 2021 2,664 18.3 1,307 9.0 593 714 1,357 9.3 May 2021 2,749 18.9 1,493 10.3 558 935 1,256 8.6 June 2021 2,651 17.9 1,394 9.4 570 824 1,257 8.5 July 2021 2,756 18.8 1,422 9.7 619 803 1,334 9.1 August 2021 2,537 17.7 1,362 9.5 492 870 1,175 8.2 September 2021 2,428 16.7 1,265 8.7 530 735 1,163 8.0
*Workforce includes those employed and those looking for work – the unemployed.
This Roy Morgan survey on Australia’s unemployment and ‘under-employed’* is based on weekly interviews of 784,153 Australians aged 14 and over between January 2007 and September 2021 and includes 6,031 telephone and online interviews in September 2021. *The ‘under-employed’ are those people who are in part-time work or freelancers who are looking for more work.
Contact Roy Morgan to learn more about Australia’s unemployed and under-employed; who and where they are, and the challenges they face as they search for employment opportunities.
Visit the Roy Morgan Online Store to purchase employment profiles, including for Australians who are employed, unemployed, under-employed, employed part-time, employed full-time, retired, studying and many more.
For further information:
Contact Office Mobile
Gary Morgan: +61 3 9224 5213 +61 411 129 094
Michele Levine: +61 3 9224 5215 +61 411 129 093
A.B.N. 91 007 092 944 I Head Office: Tonic House: 386 Flinders Lane, Melbourne Vic 3000 I Telephone: +61 (3) 9629 6888 I www.roymorgan.com
FO
R I
MM
ED
IAT
E R
EL
EA
SE
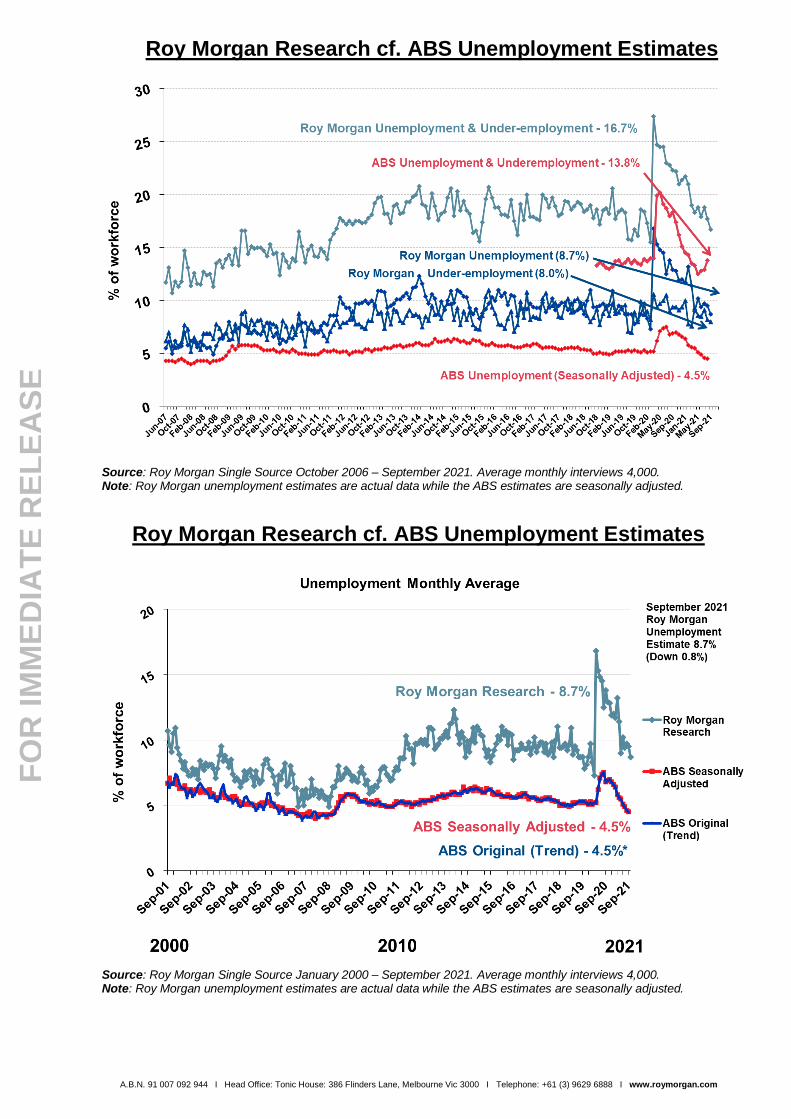
Roy Morgan Research cf. ABS Unemployment Estimates
Source: Roy Morgan Single Source October 2006 – September 2021. Average monthly interviews 4,000. Note: Roy Morgan unemployment estimates are actual data while the ABS estimates are seasonally adjusted.
Roy Morgan Research cf. ABS Unemployment Estimates
Source: Roy Morgan Single Source January 2000 – September 2021. Average monthly interviews 4,000. Note: Roy Morgan unemployment estimates are actual data while the ABS estimates are seasonally adjusted.

A.B.N. 91 007 092 944 I Head Office: Tonic House: 386 Flinders Lane, Melbourne Vic 3000 I Telephone: +61 (3) 9629 6888 I www.roymorgan.com
FO
R I
MM
ED
IAT
E R
EL
EA
SE
Source: Roy Morgan Single Source April 1995 – September 2021. Average monthly interviews 4,000. Note: Roy Morgan unemployment estimates are actual data while the ABS estimates are seasonally adjusted.
ROY MORGAN MEASURES REAL UNEMPLOYMENT IN AUSTRALIA
NOT THE ‘PERCEPTION’ OF UNEMPLOYMENT – JUNE 8, 2012
The Roy Morgan Unemployment estimate is obtained by surveying an Australia-wide cross section of people aged 14+. A person is classified as unemployed if they are looking for work, no matter when. The results are not seasonally adjusted and provide an accurate measure of monthly unemployment estimates in Australia.
Households selected for the ABS Survey are interviewed each month for eight months, with one-eighth of the sample being replaced each month. The first interview is conducted face-to-face. Subsequent interviews are then conducted by telephone.
The ABS classifies a person as unemployed if, when surveyed, they have been actively looking for work in the four weeks up to the end of the reference week and if they were available for work in the reference week.
The ABS classifies a person as employed if, when surveyed, a person worked for one hour or more during the reference week for pay, profit, commission or payment in kind, or even if a person worked for one hour or more without pay in a family business or on a farm.
The Australian Bureau of Statistics Unemployment estimates are also seasonally adjusted.
For these reasons the Australian Bureau of Statistics Unemployment estimates are different from the Roy Morgan Unemployment estimate. Gary Morgan's concerns regarding the ABS Unemployment estimate is clearly outlined in a 2012 letter to the Australian Financial Review, which was not published.
http://www.roymorgan.com/~/media/Files/Papers/2012/20120603.pdf
Margin of Error
The margin of error to be allowed for in any estimate depends mainly on the number of interviews on which it is based. The following table gives indications of the likely range within which estimates would be 95% likely to fall, expressed as the number of percentage points above or below the actual estimate. The figures are approximate and for general guidance only and assume a simple random sample. Allowance for design effects (such as stratification and weighting) should be made as appropriate.
Sample Size % Estimate
40%-60% 25% or 75% 10% or 90% 5% or 95%
5,000 ±1.4 ±1.2 ±0.8 ±0.6
50,000 ±0.4 ±0.4 ±0.3 ±0.2
A.B.N. 91 007 092 944 I Head Office: Tonic House: 386 Flinders Lane, Melbourne Vic 3000 I Telephone: +61 (3) 9629 6888 I www.roymorgan.com
FO
R I
MM
ED
IAT
E R
EL
EA
SE
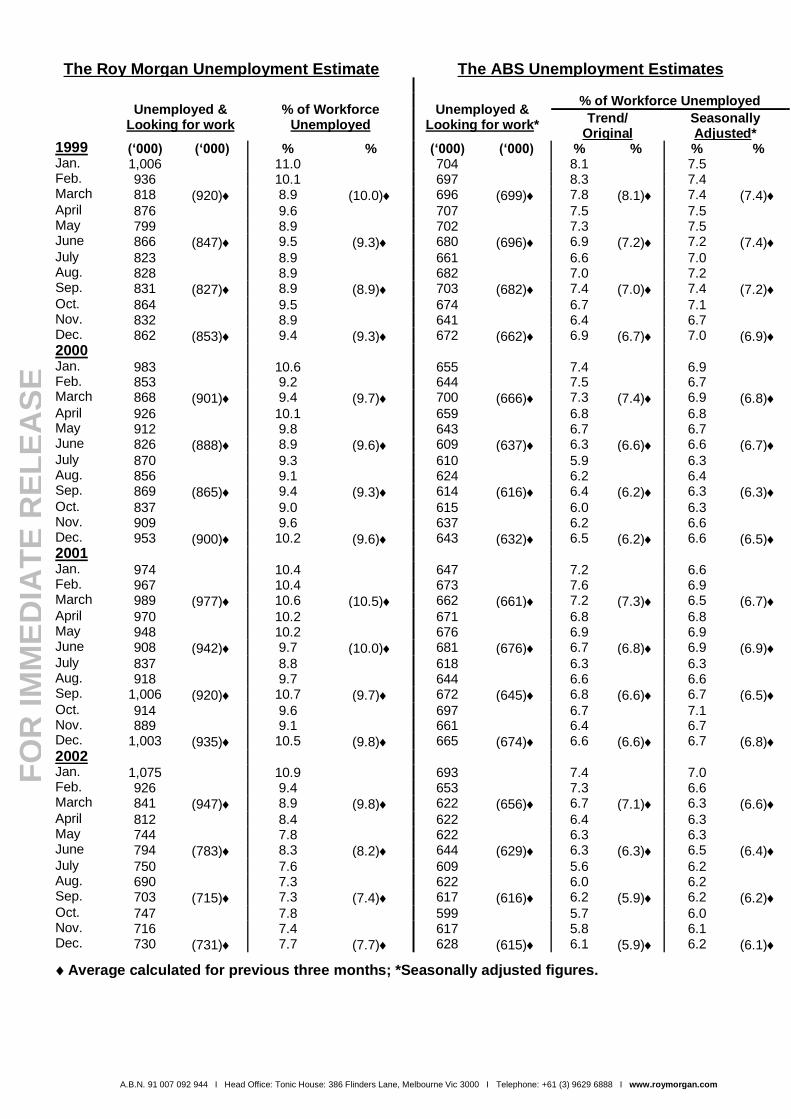
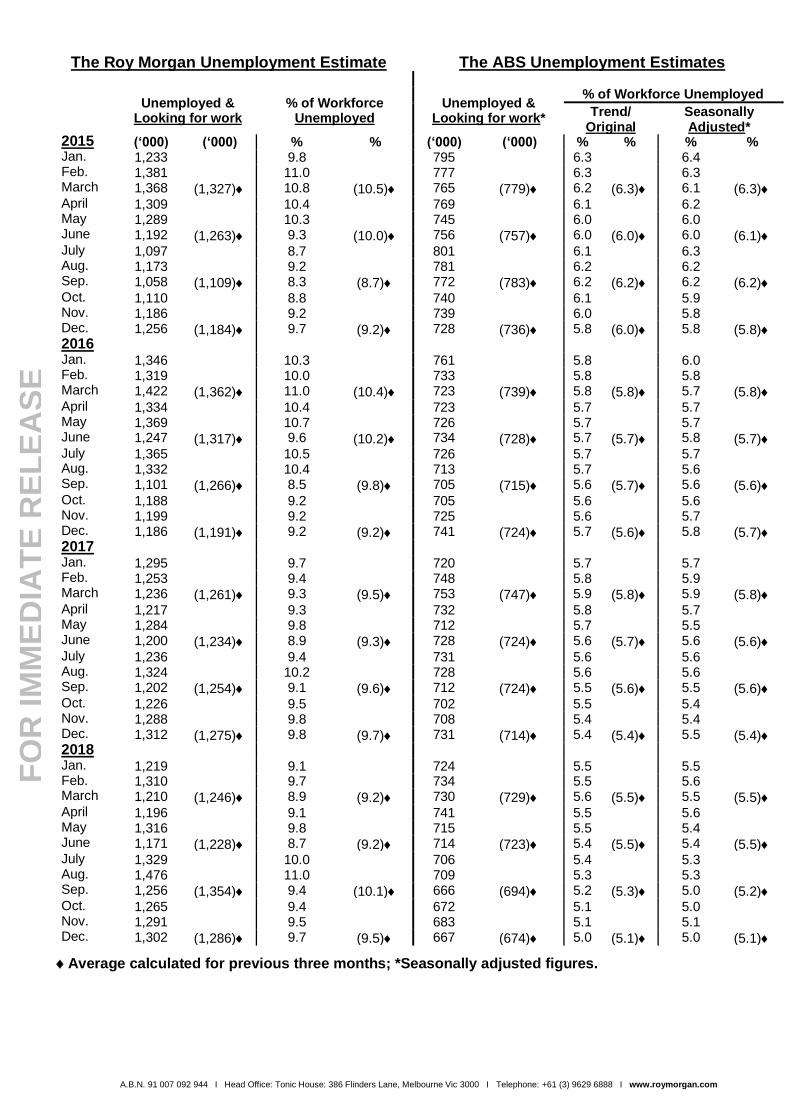
The Roy Morgan Unemployment Estimate The ABS Unemployment Estimates
Unemployed & Looking for work
% of Workforce Unemployed
Unemployed & Looking for work*
% of Workforce Unemployed
Trend/ Original
Seasonally Adjusted*
1999 (‘000) (‘000) % % (‘000) (‘000) % % % % Jan. 1,006 11.0 704 8.1 7.5 Feb. 936 10.1 697 8.3 7.4 March 818 (920) 8.9 (10.0) 696 (699) 7.8 (8.1) 7.4 (7.4) April 876 9.6 707 7.5 7.5 May 799 8.9 702 7.3 7.5 June 866 (847) 9.5 (9.3) 680 (696) 6.9 (7.2) 7.2 (7.4) July 823 8.9 661 6.6 7.0 Aug. 828 8.9 682 7.0 7.2 Sep. 831 (827) 8.9 (8.9) 703 (682) 7.4 (7.0) 7.4 (7.2) Oct. 864 9.5 674 6.7 7.1 Nov. 832 8.9 641 6.4 6.7 Dec. 862 (853) 9.4 (9.3) 672 (662) 6.9 (6.7) 7.0 (6.9) 2000 Jan. 983 10.6 655 7.4 6.9 Feb. 853 9.2 644 7.5 6.7 March 868 (901) 9.4 (9.7) 700 (666) 7.3 (7.4) 6.9 (6.8) April 926 10.1 659 6.8 6.8 May 912 9.8 643 6.7 6.7 June 826 (888) 8.9 (9.6) 609 (637) 6.3 (6.6) 6.6 (6.7) July 870 9.3 610 5.9 6.3 Aug. 856 9.1 624 6.2 6.4 Sep. 869 (865) 9.4 (9.3) 614 (616) 6.4 (6.2) 6.3 (6.3) Oct. 837 9.0 615 6.0 6.3 Nov. 909 9.6 637 6.2 6.6 Dec. 953 (900) 10.2 (9.6) 643 (632) 6.5 (6.2) 6.6 (6.5) 2001 Jan. 974 10.4 647 7.2 6.6 Feb. 967 10.4 673 7.6 6.9 March 989 (977) 10.6 (10.5) 662 (661) 7.2 (7.3) 6.5 (6.7) April 970 10.2 671 6.8 6.8 May 948 10.2 676 6.9 6.9 June 908 (942) 9.7 (10.0) 681 (676) 6.7 (6.8) 6.9 (6.9) July 837 8.8 618 6.3 6.3 Aug. 918 9.7 644 6.6 6.6 Sep. 1,006 (920) 10.7 (9.7) 672 (645) 6.8 (6.6) 6.7 (6.5) Oct. 914 9.6 697 6.7 7.1 Nov. 889 9.1 661 6.4 6.7 Dec. 1,003 (935) 10.5 (9.8) 665 (674) 6.6 (6.6) 6.7 (6.8) 2002 Jan. 1,075 10.9 693 7.4 7.0 Feb. 926 9.4 653 7.3 6.6 March 841 (947) 8.9 (9.8) 622 (656) 6.7 (7.1) 6.3 (6.6) April 812 8.4 622 6.4 6.3 May 744 7.8 622 6.3 6.3 June 794 (783) 8.3 (8.2) 644 (629) 6.3 (6.3) 6.5 (6.4) July 750 7.6 609 5.6 6.2 Aug. 690 7.3 622 6.0 6.2 Sep. 703 (715) 7.3 (7.4) 617 (616) 6.2 (5.9) 6.2 (6.2) Oct. 747 7.8 599 5.7 6.0 Nov. 716 7.4 617 5.8 6.1 Dec. 730 (731) 7.7 (7.7) 628 (615) 6.1 (5.9) 6.2 (6.1)
Average calculated for previous three months; *Seasonally adjusted figures.

A.B.N. 91 007 092 944 I Head Office: Tonic House: 386 Flinders Lane, Melbourne Vic 3000 I Telephone: +61 (3) 9629 6888 I www.roymorgan.com
FO
R I
MM
ED
IAT
E R
EL
EA
SE
The Roy Morgan Unemployment Estimate The ABS Unemployment Estimates
Unemployed & Looking for work
% of Workforce Unemployed
Unemployed & Looking for work*
% of Workforce Unemployed
Trend/ Original
Seasonally Adjusted*
2003 (‘000) (‘000) % % (‘000) (‘000) % % % % Jan. 673 7.0 620 6.5 6.1 Feb. 808 8.4 610 6.7 6.0 March 769 (750) 8.0 (7.8) 626 (619) 6.5 (6.6) 6.2 (6.1) April 744 7.7 623 6.2 6.1 May 791 8.2 613 6.1 6.0 June 764 (766) 8.0 (8.0) 620 (619) 5.9 (6.1) 6.1 (6.1) July 795 8.1 621 5.6 6.2 Aug. 774 8.1 594 5.6 5.9 Sep. 761 (776) 7.8 (8.0) 590 (602) 5.8 (5.7) 5.8 (6.0) Oct. 711 7.1 577 5.4 5.7 Nov. 769 7.8 573 5.3 5.6 Dec. 863 (781) 8.8 (7.9) 575 (575) 5.6 (5.4) 5.6 (5.6) 2004 Jan. 973 9.5 584 6.2 5.8 Feb. 832 8.4 595 6.6 5.9 March 892 (899) 8.8 (8.9) 574 (584) 5.9 (6.2) 5.6 (5.8) April 846 8.4 574 5.7 5.6 May 786 7.9 561 5.5 5.5 June 826 (819) 8.5 (8.3) 575 (570) 5.5 (5.6) 5.6 (5.6) July 757 7.4 582 5.2 5.7 Aug. 679 6.9 579 5.4 5.7 Sep. 698 (711) 7.1 (7.1) 572 (578) 5.5 (5.4) 5.6 (5.7) Oct. 694 6.9 544 5.0 5.3 Nov. 632 6.4 536 4.9 5.2 Dec. 688 (671) 6.8 (6.7) 527 (536) 5.0 (5.0) 5.1 (5.2) 2005 Jan. 775 7.6 532 5.6 5.1 Feb. 715 7.0 533 5.7 5.1 March 753 (748) 7.5 (7.4) 540 (535) 5.4 (5.6) 5.2 (5.1) April 797 7.7 540 5.2 5.1 May 737 7.2 542 5.2 5.1 June 669 (734) 6.5 (7.1) 527 (536) 4.9 (5.1) 5.0 (5.1) July 783 7.6 525 4.6 5.0 Aug. 715 7.0 530 4.8 5.0 Sep. 681 (726) 6.7 (7.1) 539 (531) 5.1 (4.8) 5.1 (5.0) Oct. 709 6.9 548 4.9 5.2 Nov. 832 8.1 538 4.7 5.1 Dec. 864 (802) 8.5 (7.8) 546 (544) 5.1 (4.9) 5.2 (5.2) 2006 Jan. 893 8.5 558 5.8 5.3 Feb. 832 7.8 554 5.9 5.2 March 815 (847) 7.7 (8.0) 532 (558) 5.3 (5.7) 5.0 (5.2) April 753 7.2 542 5.2 5.1 May 695 6.6 521 4.9 4.9 June 659 (702) 6.2 (6.6) 529 (531) 4.8 (5.0) 4.9 (5.0) July 776 7.3 514 4.4 4.8 Aug. 722 7.0 524 4.6 4.9 Sep. 803 (767) 7.6 (7.3) 513 (517) 4.8 (4.6) 4.8 (4.8) Oct. 864 8.2 496 4.3 4.6 Nov. 681 6.5 499 4.3 4.6 Dec. 712 (752) 6.7 (7.1) 502 (499) 4.5 (4.4) 4.6 (4.6)
Average calculated for previous three months; *Seasonally adjusted figures.
A.B.N. 91 007 092 944 I Head Office: Tonic House: 386 Flinders Lane, Melbourne Vic 3000 I Telephone: +61 (3) 9629 6888 I www.roymorgan.com
FO
R I
MM
ED
IAT
E R
EL
EA
SE
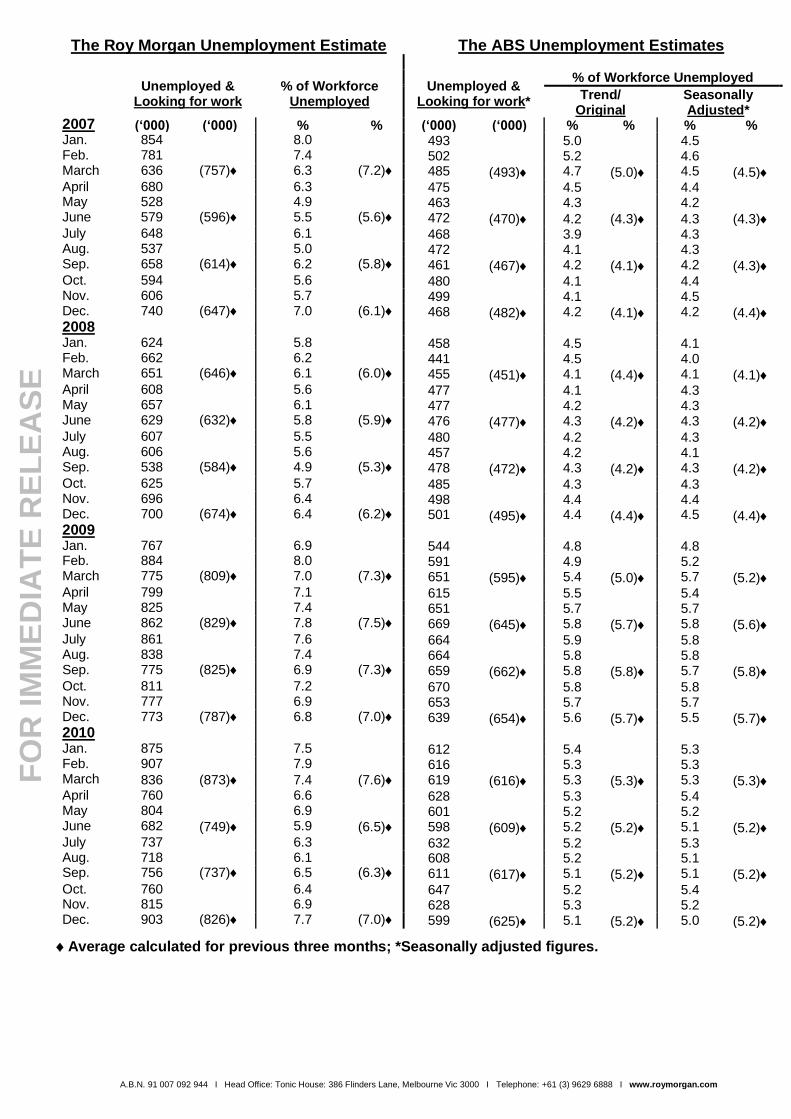
The Roy Morgan Unemployment Estimate The ABS Unemployment Estimates
Unemployed & Looking for work
% of Workforce Unemployed
Unemployed & Looking for work*
% of Workforce Unemployed
Trend/ Original
Seasonally Adjusted*
2007 (‘000) (‘000) % % (‘000) (‘000) % % % % Jan. 854 8.0 493 5.0 4.5 Feb. 781 7.4 502 5.2 4.6 March 636 (757) 6.3 (7.2) 485 (493) 4.7 (5.0) 4.5 (4.5) April 680 6.3 475 4.5 4.4 May 528 4.9 463 4.3 4.2 June 579 (596) 5.5 (5.6) 472 (470) 4.2 (4.3) 4.3 (4.3) July 648 6.1 468 3.9 4.3 Aug. 537 5.0 472 4.1 4.3 Sep. 658 (614) 6.2 (5.8) 461 (467) 4.2 (4.1) 4.2 (4.3) Oct. 594 5.6 480 4.1 4.4 Nov. 606 5.7 499 4.1 4.5 Dec. 740 (647) 7.0 (6.1) 468 (482) 4.2 (4.1) 4.2 (4.4) 2008 Jan. 624 5.8 458 4.5 4.1 Feb. 662 6.2 441 4.5 4.0 March 651 (646) 6.1 (6.0) 455 (451) 4.1 (4.4) 4.1 (4.1) April 608 5.6 477 4.1 4.3 May 657 6.1 477 4.2 4.3 June 629 (632) 5.8 (5.9) 476 (477) 4.3 (4.2) 4.3 (4.2) July 607 5.5 480 4.2 4.3 Aug. 606 5.6 457 4.2 4.1 Sep. 538 (584) 4.9 (5.3) 478 (472) 4.3 (4.2) 4.3 (4.2) Oct. 625 5.7 485 4.3 4.3 Nov. 696 6.4 498 4.4 4.4 Dec. 700 (674) 6.4 (6.2) 501 (495) 4.4 (4.4) 4.5 (4.4) 2009 Jan. 767 6.9 544 4.8 4.8 Feb. 884 8.0 591 4.9 5.2 March 775 (809) 7.0 (7.3) 651 (595) 5.4 (5.0) 5.7 (5.2) April 799 7.1 615 5.5 5.4 May 825 7.4 651 5.7 5.7 June 862 (829) 7.8 (7.5) 669 (645) 5.8 (5.7) 5.8 (5.6) July 861 7.6 664 5.9 5.8 Aug. 838 7.4 664 5.8 5.8 Sep. 775 (825) 6.9 (7.3) 659 (662) 5.8 (5.8) 5.7 (5.8) Oct. 811 7.2 670 5.8 5.8 Nov. 777 6.9 653 5.7 5.7 Dec. 773 (787) 6.8 (7.0) 639 (654) 5.6 (5.7) 5.5 (5.7) 2010 Jan. 875 7.5 612 5.4 5.3 Feb. 907 7.9 616 5.3 5.3 March 836 (873) 7.4 (7.6) 619 (616) 5.3 (5.3) 5.3 (5.3) April 760 6.6 628 5.3 5.4 May 804 6.9 601 5.2 5.2 June 682 (749) 5.9 (6.5) 598 (609) 5.2 (5.2) 5.1 (5.2) July 737 6.3 632 5.2 5.3 Aug. 718 6.1 608 5.2 5.1 Sep. 756 (737) 6.5 (6.3) 611 (617) 5.1 (5.2) 5.1 (5.2) Oct. 760 6.4 647 5.2 5.4 Nov. 815 6.9 628 5.3 5.2 Dec. 903 (826) 7.7 (7.0) 599 (625) 5.1 (5.2) 5.0 (5.2)
Average calculated for previous three months; *Seasonally adjusted figures.

A.B.N. 91 007 092 944 I Head Office: Tonic House: 386 Flinders Lane, Melbourne Vic 3000 I Telephone: +61 (3) 9629 6888 I www.roymorgan.com
FO
R I
MM
ED
IAT
E R
EL
EA
SE
The Roy Morgan Unemployment Estimate The ABS Unemployment Estimates
Unemployed & Looking for work
% of Workforce Unemployed
Unemployed & Looking for work*
% of Workforce Unemployed
Trend/ Original
Seasonally Adjusted*
2011 (‘000) (‘000) % % (‘000) (‘000) % % % % Jan. 948 7.9 606 5.1 5.0 Feb. 927 7.9 605 5.0 5.0 March 863 (913) 7.4 (7.7) 593 (601) 4.9 (5.0) 4.9 (5.0) April 847 7.2 583 4.9 4.9 May 818 6.9 593 4.9 4.9 June 846 (837) 7.0 (7.0) 591 (589) 4.9 (4.9) 4.9 (4.9) July 885 7.6 612 5.0 5.1 Aug. 939 7.9 637 5.1 5.3 Sep. 919 (914) 7.7 (7.7) 634 (628) 5.2 (5.1) 5.2 (5.2) Oct. 1,026 8.6 631 5.3 5.2 Nov. 1,044 8.6 636 5.3 5.3 Dec. 1,034 (1,035) 8.6 (8.6) 630 (632) 5.3 (5.3) 5.2 (5.2) 2012 Jan. 1,278 10.3 614 5.2 5.1 Feb. 1,177 9.7 632 5.2 5.2 March 1,120 (1,192) 9.3 (9.7) 629 (625) 5.2 (5.2) 5.2 (5.2) April 1,149 9.3 598 5.1 4.9 May 997 8.2 623 5.1 5.1 June 1,169 (1,105) 9.7 (9.1) 631 (617) 5.1 (5.1) 5.2 (5.1) July 1,171 9.7 635 5.2 5.2 Aug. 1,205 9.8 623 5.2 5.1 Sep. 1,214 (1,197) 10.0 (9.8) 663 (640) 5.3 (5.2) 5.4 (5.2) Oct. 1,163 9.7 653 5.4 5.4 Nov. 1,229 10.0 637 5.3 5.2 Dec. 1,175 (1,189) 9.6 (9.8) 656 (649) 5.4 (5.4) 5.4 (5.3) 2013 Jan. 1,327 10.9 660 5.4 5.4 Feb. 1,360 10.9 660 5.4 5.4 March 1,369 (1,352) 10.8 (10.9) 687 (669) 5.5 (5.4) 5.6 (5.5) April 1,154 9.3 685 5.5 5.5 May 1,168 9.5 683 5.6 5.5 June 1,205 (1,176) 9.7 (9.5) 709 (692) 5.7 (5.6) 5.7 (5.6) July 1,267 10.1 705 5.7 5.7 Aug. 1,251 10.1 714 5.8 5.8 Sep. 1,297 (1,272) 10.4 (10.2) 697 (705) 5.7 (5.7) 5.6 (5.7) Oct. 1,333 10.7 709 5.8 5.7 Nov. 1,268 10.2 713 5.8 5.8 Dec. 1,411 (1,337) 11.2 (10.7) 722 (715) 5.8 (5.8) 5.8 (5.8) 2014 Jan. 1,440 11.3 729 5.9 6.0 Feb. 1,561 12.3 742 6.0 6.0 March 1,465 (1,488) 11.6 (11.7) 713 (728) 6.0 (6.0) 5.8 (5.9) April 1,299 10.4 713 5.9 5.8 May 1,186 9.7 717 5.9 5.8 June 1,326 (1,273) 10.6 (10.2) 742 (724) 5.9 (5.9) 6.0 (5.9) July 1,265 10.2 789 6.1 6.4 Aug. 1,064 8.7 755 6.2 6.1 Sep. 1,208 (1,179) 9.9 (9.6) 747 (764) 6.0 (6.1) 6.2 (6.2) Oct. 1,090 9.1 772 6.2 6.2 Nov. 1,260 10.0 778 6.3 6.3 Dec. 1,402 (1,251) 10.9 (10.0) 759 (770) 6.2 (6.2) 6.1 (6.2)
Average calculated for previous three months; *Seasonally adjusted figures.
A.B.N. 91 007 092 944 I Head Office: Tonic House: 386 Flinders Lane, Melbourne Vic 3000 I Telephone: +61 (3) 9629 6888 I www.roymorgan.com
FO
R I
MM
ED
IAT
E R
EL
EA
SE
The Roy Morgan Unemployment Estimate The ABS Unemployment Estimates
Unemployed & Looking for work
% of Workforce Unemployed
Unemployed & Looking for work*
% of Workforce Unemployed
Trend/ Original
Seasonally Adjusted*
2015 (‘000) (‘000) % % (‘000) (‘000) % % % % Jan. 1,233 9.8 795 6.3 6.4 Feb. 1,381 11.0 777 6.3 6.3 March 1,368 (1,327) 10.8 (10.5) 765 (779) 6.2 (6.3) 6.1 (6.3) April 1,309 10.4 769 6.1 6.2 May 1,289 10.3 745 6.0 6.0 June 1,192 (1,263) 9.3 (10.0) 756 (757) 6.0 (6.0) 6.0 (6.1) July 1,097 8.7 801 6.1 6.3 Aug. 1,173 9.2 781 6.2 6.2 Sep. 1,058 (1,109) 8.3 (8.7) 772 (783) 6.2 (6.2) 6.2 (6.2) Oct. 1,110 8.8 740 6.1 5.9 Nov. 1,186 9.2 739 6.0 5.8 Dec. 1,256 (1,184) 9.7 (9.2) 728 (736) 5.8 (6.0) 5.8 (5.8) 2016 Jan. 1,346 10.3 761 5.8 6.0 Feb. 1,319 10.0 733 5.8 5.8 March 1,422 (1,362) 11.0 (10.4) 723 (739) 5.8 (5.8) 5.7 (5.8) April 1,334 10.4 723 5.7 5.7 May 1,369 10.7 726 5.7 5.7 June 1,247 (1,317) 9.6 (10.2) 734 (728) 5.7 (5.7) 5.8 (5.7) July 1,365 10.5 726 5.7 5.7 Aug. 1,332 10.4 713 5.7 5.6 Sep. 1,101 (1,266) 8.5 (9.8) 705 (715) 5.6 (5.7) 5.6 (5.6) Oct. 1,188 9.2 705 5.6 5.6 Nov. 1,199 9.2 725 5.6 5.7 Dec. 1,186 (1,191) 9.2 (9.2) 741 (724) 5.7 (5.6) 5.8 (5.7) 2017 Jan. 1,295 9.7 720 5.7 5.7 Feb. 1,253 9.4 748 5.8 5.9 March 1,236 (1,261) 9.3 (9.5) 753 (747) 5.9 (5.8) 5.9 (5.8) April 1,217 9.3 732 5.8 5.7 May 1,284 9.8 712 5.7 5.5 June 1,200 (1,234) 8.9 (9.3) 728 (724) 5.6 (5.7) 5.6 (5.6) July 1,236 9.4 731 5.6 5.6 Aug. 1,324 10.2 728 5.6 5.6 Sep. 1,202 (1,254) 9.1 (9.6) 712 (724) 5.5 (5.6) 5.5 (5.6) Oct. 1,226 9.5 702 5.5 5.4 Nov. 1,288 9.8 708 5.4 5.4 Dec. 1,312 (1,275) 9.8 (9.7) 731 (714) 5.4 (5.4) 5.5 (5.4) 2018 Jan. 1,219 9.1 724 5.5 5.5 Feb. 1,310 9.7 734 5.5 5.6 March 1,210 (1,246) 8.9 (9.2) 730 (729) 5.6 (5.5) 5.5 (5.5) April 1,196 9.1 741 5.5 5.6 May 1,316 9.8 715 5.5 5.4 June 1,171 (1,228) 8.7 (9.2) 714 (723) 5.4 (5.5) 5.4 (5.5) July 1,329 10.0 706 5.4 5.3 Aug. 1,476 11.0 709 5.3 5.3 Sep. 1,256 (1,354) 9.4 (10.1) 666 (694) 5.2 (5.3) 5.0 (5.2) Oct. 1,265 9.4 672 5.1 5.0 Nov. 1,291 9.5 683 5.1 5.1 Dec. 1,302 (1,286) 9.7 (9.5) 667 (674) 5.0 (5.1) 5.0 (5.1)
Average calculated for previous three months; *Seasonally adjusted figures.
A.B.N. 91 007 092 944 I Head Office: Tonic House: 386 Flinders Lane, Melbourne Vic 3000 I Telephone: +61 (3) 9629 6888 I www.roymorgan.com
FO
R I
MM
ED
IAT
E R
EL
EA
SE
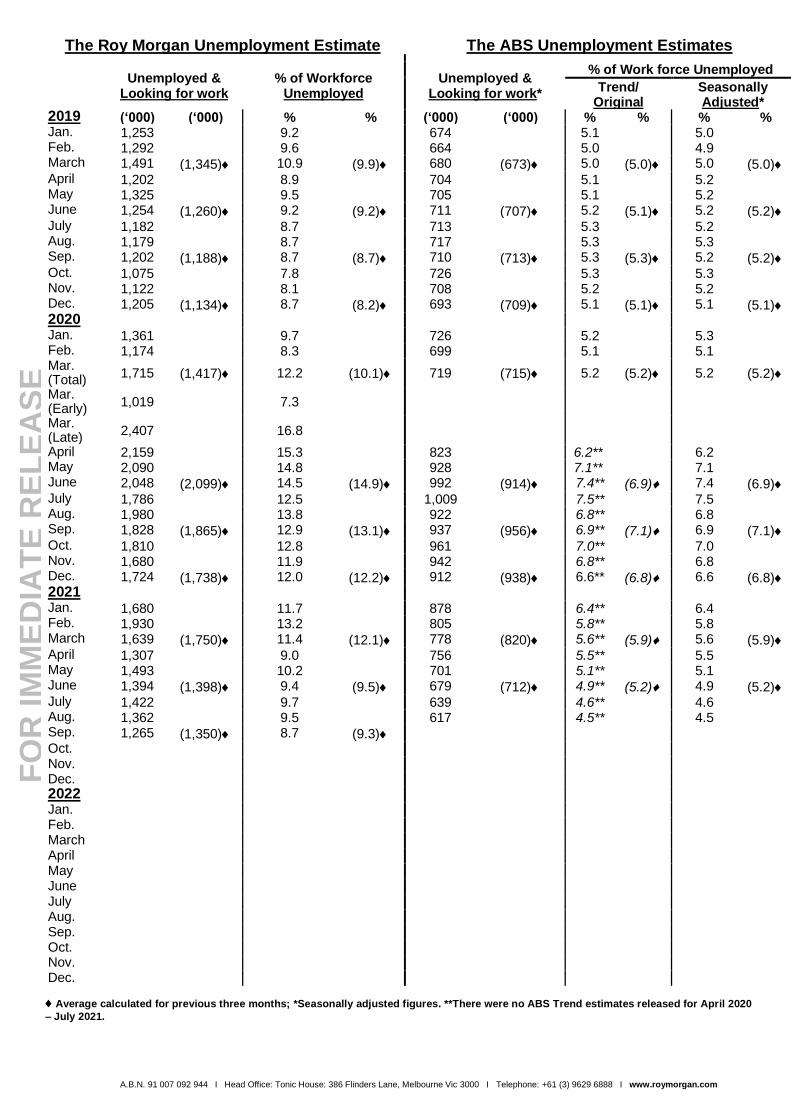
The Roy Morgan Unemployment Estimate The ABS Unemployment Estimates
Unemployed & Looking for work
% of Workforce Unemployed
Unemployed & Looking for work*
% of Work force Unemployed
Trend/ Original
Seasonally Adjusted*
2019 (‘000) (‘000) % % (‘000) (‘000) % % % % Jan. 1,253 9.2 674 5.1 5.0 Feb. 1,292 9.6 664 5.0 4.9 March 1,491 (1,345) 10.9 (9.9) 680 (673) 5.0 (5.0) 5.0 (5.0) April 1,202 8.9 704 5.1 5.2 May 1,325 9.5 705 5.1 5.2 June 1,254 (1,260) 9.2 (9.2) 711 (707) 5.2 (5.1) 5.2 (5.2) July 1,182 8.7 713 5.3 5.2 Aug. 1,179 8.7 717 5.3 5.3 Sep. 1,202 (1,188) 8.7 (8.7) 710 (713) 5.3 (5.3) 5.2 (5.2) Oct. 1,075 7.8 726 5.3 5.3 Nov. 1,122 8.1 708 5.2 5.2 Dec. 1,205 (1,134) 8.7 (8.2) 693 (709) 5.1 (5.1) 5.1 (5.1) 2020 Jan. 1,361 9.7 726 5.2 5.3 Feb. 1,174 8.3 699 5.1 5.1 Mar. (Total)
1,715 (1,417) 12.2 (10.1) 719 (715) 5.2 (5.2) 5.2 (5.2)
Mar. (Early)
1,019 7.3
Mar. (Late)
2,407 16.8
April 2,159 15.3 823 6.2** 6.2 May 2,090 14.8 928 7.1** 7.1 June 2,048 (2,099) 14.5 (14.9) 992 (914) 7.4** (6.9) 7.4 (6.9) July 1,786 12.5 1,009 7.5** 7.5 Aug. 1,980 13.8 922 6.8** 6.8 Sep. 1,828 (1,865) 12.9 (13.1) 937 (956) 6.9** (7.1) 6.9 (7.1) Oct. 1,810 12.8 961 7.0** 7.0 Nov. 1,680 11.9 942 6.8** 6.8 Dec. 1,724 (1,738) 12.0 (12.2) 912 (938) 6.6** (6.8) 6.6 (6.8) 2021 Jan. 1,680 11.7 878 6.4** 6.4 Feb. 1,930 13.2 805 5.8** 5.8 March 1,639 (1,750) 11.4 (12.1) 778 (820) 5.6** (5.9) 5.6 (5.9) April 1,307 9.0 756 5.5** 5.5 May 1,493 10.2 701 5.1** 5.1 June 1,394 (1,398) 9.4 (9.5) 679 (712) 4.9** (5.2) 4.9 (5.2) July 1,422 9.7 639 4.6** 4.6 Aug. 1,362 9.5 617 4.5** 4.5 Sep. 1,265 (1,350) 8.7 (9.3) Oct. Nov. Dec. 2022 Jan. Feb. March April May June July Aug. Sep. Oct. Nov. Dec.
Average calculated for previous three months; *Seasonally adjusted figures. **There were no ABS Trend estimates released for April 2020
– July 2021.
A.B.N. 91 007 092 944 I Head Office: Tonic House: 386 Flinders Lane, Melbourne Vic 3000 I Telephone: +61 (3) 9629 6888 I www.roymorgan.com
FO
R I
MM
ED
IAT
E R
EL
EA
SE
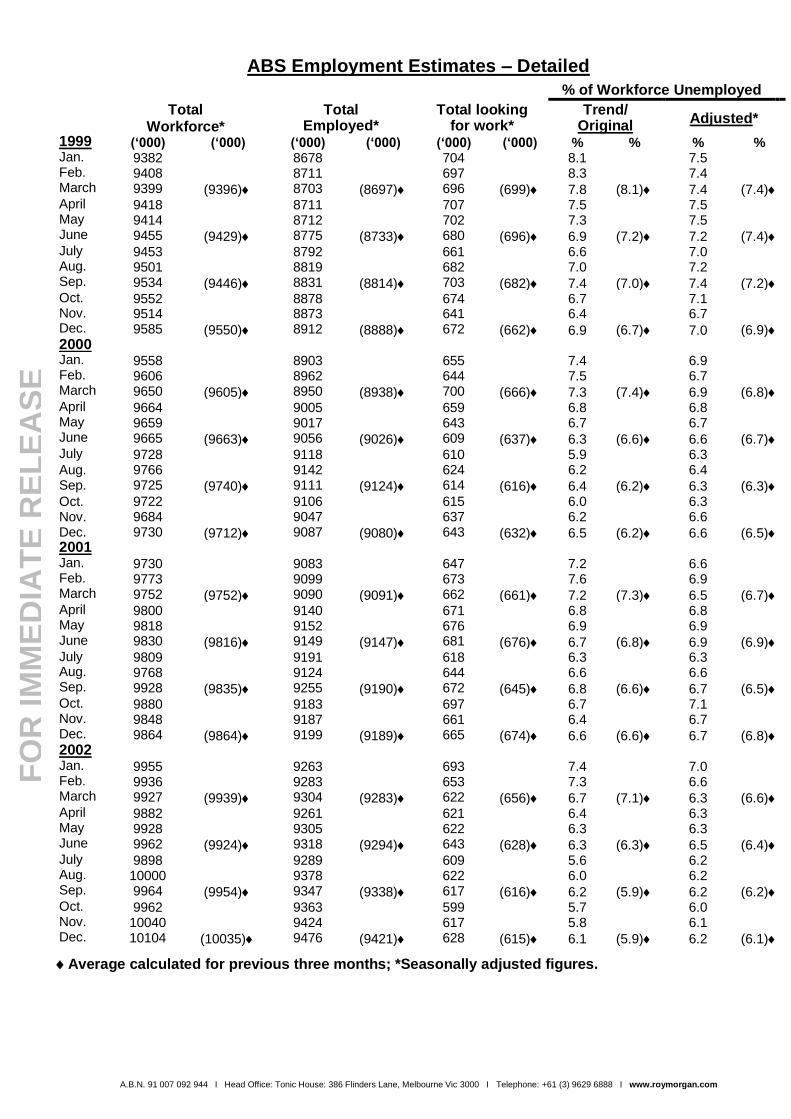
ABS Employment Estimates – Detailed
% of Workforce Unemployed
Total Workforce*
Total Employed*
Total looking for work*
Trend/ Original
Adjusted*
1999 (‘000) (‘000) (‘000) (‘000) (‘000) (‘000) % % % % Jan. 9382 8678 704 8.1 7.5 Feb. 9408 8711 697 8.3 7.4 March 9399 (9396) 8703 (8697) 696 (699) 7.8 (8.1) 7.4 (7.4) April 9418 8711 707 7.5 7.5 May 9414 8712 702 7.3 7.5 June 9455 (9429) 8775 (8733) 680 (696) 6.9 (7.2) 7.2 (7.4) July 9453 8792 661 6.6 7.0 Aug. 9501 8819 682 7.0 7.2 Sep. 9534 (9446) 8831 (8814) 703 (682) 7.4 (7.0) 7.4 (7.2) Oct. 9552 8878 674 6.7 7.1 Nov. 9514 8873 641 6.4 6.7 Dec. 9585 (9550) 8912 (8888) 672 (662) 6.9 (6.7) 7.0 (6.9) 2000 Jan. 9558 8903 655 7.4 6.9 Feb. 9606 8962 644 7.5 6.7 March 9650 (9605) 8950 (8938) 700 (666) 7.3 (7.4) 6.9 (6.8) April 9664 9005 659 6.8 6.8 May 9659 9017 643 6.7 6.7 June 9665 (9663) 9056 (9026) 609 (637) 6.3 (6.6) 6.6 (6.7) July 9728 9118 610 5.9 6.3 Aug. 9766 9142 624 6.2 6.4 Sep. 9725 (9740) 9111 (9124) 614 (616) 6.4 (6.2) 6.3 (6.3) Oct. 9722 9106 615 6.0 6.3 Nov. 9684 9047 637 6.2 6.6 Dec. 9730 (9712) 9087 (9080) 643 (632) 6.5 (6.2) 6.6 (6.5) 2001 Jan. 9730 9083 647 7.2 6.6 Feb. 9773 9099 673 7.6 6.9 March 9752 (9752) 9090 (9091) 662 (661) 7.2 (7.3) 6.5 (6.7) April 9800 9140 671 6.8 6.8 May 9818 9152 676 6.9 6.9 June 9830 (9816) 9149 (9147) 681 (676) 6.7 (6.8) 6.9 (6.9) July 9809 9191 618 6.3 6.3 Aug. 9768 9124 644 6.6 6.6 Sep. 9928 (9835) 9255 (9190) 672 (645) 6.8 (6.6) 6.7 (6.5) Oct. 9880 9183 697 6.7 7.1 Nov. 9848 9187 661 6.4 6.7 Dec. 9864 (9864) 9199 (9189) 665 (674) 6.6 (6.6) 6.7 (6.8) 2002 Jan. 9955 9263 693 7.4 7.0 Feb. 9936 9283 653 7.3 6.6 March 9927 (9939) 9304 (9283) 622 (656) 6.7 (7.1) 6.3 (6.6) April 9882 9261 621 6.4 6.3 May 9928 9305 622 6.3 6.3 June 9962 (9924) 9318 (9294) 643 (628) 6.3 (6.3) 6.5 (6.4) July 9898 9289 609 5.6 6.2 Aug. 10000 9378 622 6.0 6.2 Sep. 9964 (9954) 9347 (9338) 617 (616) 6.2 (5.9) 6.2 (6.2) Oct. 9962 9363 599 5.7 6.0 Nov. 10040 9424 617 5.8 6.1 Dec. 10104 (10035) 9476 (9421) 628 (615) 6.1 (5.9) 6.2 (6.1)
Average calculated for previous three months; *Seasonally adjusted figures.

A.B.N. 91 007 092 944 I Head Office: Tonic House: 386 Flinders Lane, Melbourne Vic 3000 I Telephone: +61 (3) 9629 6888 I www.roymorgan.com
FO
R I
MM
ED
IAT
E R
EL
EA
SE
ABS Employment Estimates – Detailed
% of Workforce Unemployed
Total Workforce*
Total Employed*
Total looking for work*
Trend/ Original
Adjusted* 2003 (‘000) (‘000) (‘000) (‘000) (‘000) (‘000) % % % % Jan. 10196 9576 620 6.5 6.1 Feb. 10173 9564 610 6.7 6.0 March 10146 (10172) 9521 (9554) 626 (619) 6.5 (6.6) 6.2 (6.1) April 10129 9506 623 6.2 6.1 May 10148 9535 613 6.1 6.0 June 10128 (10135) 9508 (9516) 620 (619) 5.9 (6.1) 6.1 (6.1) July 10102 9481 621 5.6 6.2 Aug. 10129 9535 594 5.6 5.9 Sep. 10144 (10125) 9555 (9524) 590 (602) 5.8 (5.7) 5.8 (6.0) Oct. 10190 9613 577 5.4 5.7 Nov. 10209 9637 573 5.3 5.6 Dec. 10241 (10213) 9666 (9639) 575 (575) 5.6 (5.4) 5.6 (5.6) 2004 Jan. 10156 9571 584 6.2 5.8 Feb. 10168 9573 595 6.6 5.9 March 10211 (10178) 9637 (9594) 574 (584) 5.9 (6.2) 5.6 (5.8) April 10271 9696 574 5.7 5.6 May 10216 9655 561 5.5 5.5 June 10221 (10236) 9646 (9666) 575 (570) 5.5 (5.6) 5.6 (5.6) July 10244 9662 582 5.2 5.7 Aug. 10233 9654 579 5.4 5.7 Sep. 10290 (10256) 9717 (9678) 572 (578) 5.5 (5.4) 5.6 (5.7) Oct. 10312 9768 544 5.0 5.3 Nov. 10329 9793 536 4.9 5.2 Dec. 10349 (10330) 9822 (9794) 527 (536) 5.0 (5.0) 5.1 (5.2) 2005 Jan. 10402 9870 532 5.6 5.1 Feb. 10422 9890 533 5.7 5.1 March 10488 (10437) 9948 (9903) 540 (535) 5.4 (5.6) 5.2 (5.1) April 10508 9968 540 5.2 5.1 May 10524 9982 542 5.2 5.1 June 10550 (10527) 10023 (9991) 527 (536) 4.9 (5.1) 5.0 (5.1) July 10560 10035 525 4.6 5.0 Aug. 10597 10067 530 4.8 5.0 Sep. 10563 (10573) 10023 (10042) 539 (531) 5.1 (4.8) 5.1 (5.0) Oct. 10551 10002 548 4.9 5.2 Nov. 10569 10030 538 4.7 5.1 Dec. 10582 (10567) 10035 (10022) 546 (544) 5.1 (4.9) 5.2 (5.2) 2006 Jan. 10590 10032 558 5.8 5.3 Feb. 10612 10058 554 5.9 5.2 March 10620 (10607) 10088 (10059) 532 (548) 5.3 (5.7) 5.0 (5.2) April 10628 10086 542 5.2 5.1 May 10664 10142 521 4.9 4.9 June 10725 (10672) 10196 (10141) 529 (531) 4.8 (5.0) 4.9 (5.0) July 10756 10242 514 4.4 4.8 Aug. 10789 10265 524 4.6 4.9 Sep. 10799 (10781) 10285 (10264) 513 (517) 4.8 (4.6) 4.8 (4.8) Oct. 10749 10253 496 4.3 4.6 Nov. 10788 10289 499 4.3 4.6 Dec. 10842 (10793) 10341 (10294) 502 (499) 4.5 (4.4) 4.6 (4.6)
Average calculated for previous three months; *Seasonally adjusted figures.

A.B.N. 91 007 092 944 I Head Office: Tonic House: 386 Flinders Lane, Melbourne Vic 3000 I Telephone: +61 (3) 9629 6888 I www.roymorgan.com
FO
R I
MM
ED
IAT
E R
EL
EA
SE
ABS Employment Estimates – Detailed
% of Workforce Unemployed
Total Workforce*
Total Employed*
Total looking for work*
Trend/ Original
Adjusted*
2007 (‘000) (‘000) (‘000) (‘000) (‘000) (‘000) % % % % Jan. 10828 10336 493 5.0 4.5 Feb. 10859 10358 502 5.2 4.6 March 10864 (10850) 10380 (10358) 485 (493) 4.7 (5.0) 4.5 (4.5) April 10889 10414 475 4.5 4.4 May 10917 10453 463 4.3 4.2 June 10934 (10913) 10462 (10443) 472 (470) 4.2 (4.3) 4.3 (4.3) July 10952 10484 468 3.9 4.3 Aug. 10985 10513 472 4.1 4.3 Sep. 10988 (10975) 10528 (10508) 461 (467) 4.2 (4.1) 4.2 (4.3) Oct. 11011 10531 480 4.1 4.4 Nov. 11082 10583 499 4.1 4.5 Dec. 11076 (11056) 10607 (10574) 468 (482) 4.2 (4.1) 4.2 (4.4) 2008 Jan. 11087 10629 458 4.5 4.1 Feb. 11106 10666 441 4.5 4.0 March 11142 (11112) 10686 (10660) 455 (451) 4.1 (4.4) 4.1 (4.1) April 11188 10711 477 4.1 4.3 May 11168 10691 477 4.2 4.3 June 11187 (11181) 10711 (10704) 476 (477) 4.3 (4.2) 4.3 (4.2) July 11210 10730 480 4.2 4.3 Aug. 11201 10744 457 4.2 4.1 Sep. 11222 (11211) 10744 (10739) 478 (472) 4.3 (4.2) 4.3 (4.2) Oct. 11234 10749 485 4.3 4.3 Nov. 11242 10744 498 4.4 4.4 Dec. 11243 (11240) 10742 (10745) 501 (495) 4.4 (4.4) 4.5 (4.4) 2009 Jan. 11282 10742 544 4.8 4.8 Feb. 11401 10810 591 4.9 5.2 March 11423 (11369) 10772 (10774) 651 (595) 5.4 (5.0) 5.7 (5.2) April 11413 10799 615 5.5 5.4 May 11444 10793 651 5.7 5.7 June 11425 (11428) 10763 (10785) 663 (643) 5.8 (5.7) 5.8 (5.6) July 11458 10794 664 5.9 5.8 Aug. 11427 10763 664 5.8 5.8 Sep. 11464 (11450) 10806 (10788) 659 (662) 5.8 (5.8) 5.7 (5.8) Oct. 11502 10832 670 5.8 5.8 Nov. 11521 10868 653 5.7 5.7 Dec. 11545 (11523) 10906 (10869) 639 (654) 5.6 (5.7) 5.5 (5.7) 2010 Jan. 11578 10966 612 5.4 5.3 Feb. 11587 10971 616 5.3 5.3 March 11607 (11591) 10988 (10975) 619 (616) 5.3 (5.3) 5.3 (5.3) April 11654 11026 628 5.3 5.4 May 11658 11057 601 5.2 5.2 June 11699 (11670) 11100 (11061) 598 (609) 5.2 (5.2) 5.1 (5.2) July 11868 11236 632 5.2 5.3 Aug. 11880 11272 608 5.2 5.1 Sep. 11936 (11895) 11325 (11278) 611 (617) 5.1 (5.2) 5.1 (5.2) Oct. 12002 11356 647 5.2 5.4 Nov. 12045 11417 628 5.3 5.2 Dec. 12016 (12021) 11417 (11397) 599 (625) 5.1 (5.2) 5.0 (5.2)
Average calculated for previous three months; *Seasonally adjusted figures.
A.B.N. 91 007 092 944 I Head Office: Tonic House: 386 Flinders Lane, Melbourne Vic 3000 I Telephone: +61 (3) 9629 6888 I www.roymorgan.com
FO
R I
MM
ED
IAT
E R
EL
EA
SE
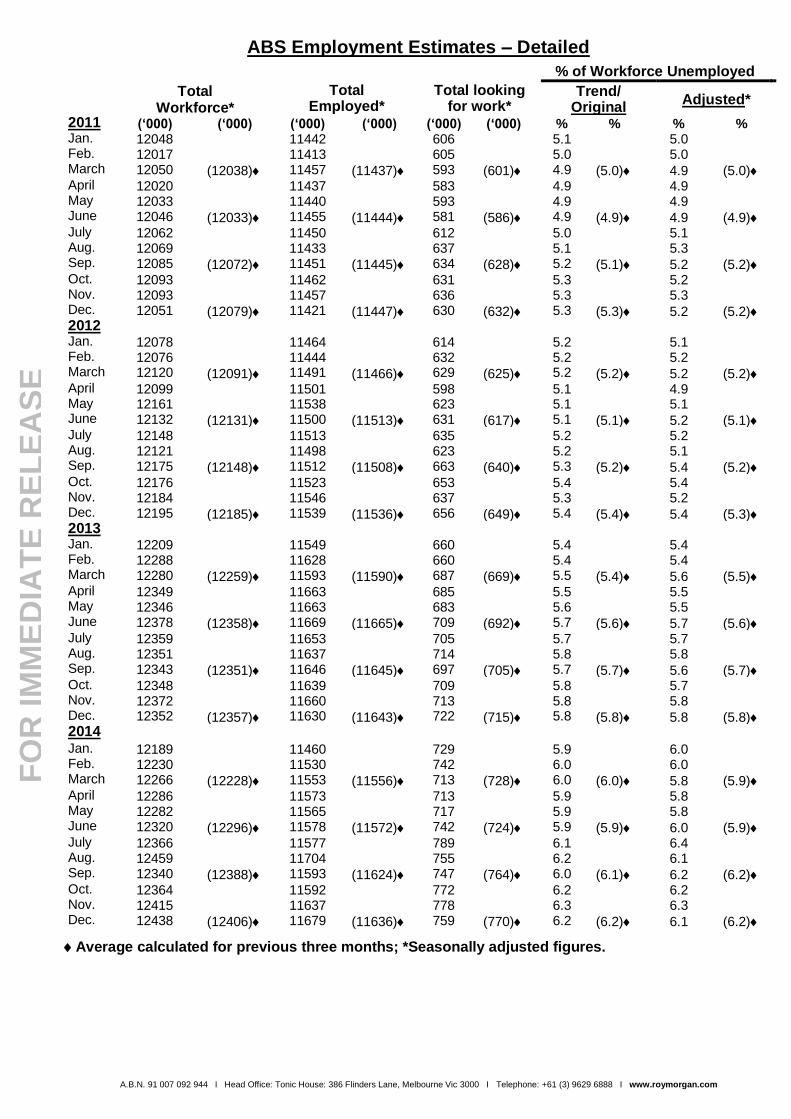
ABS Employment Estimates – Detailed
% of Workforce Unemployed
Total Workforce*
Total Employed*
Total looking for work*
Trend/ Original
Adjusted*
2011 (‘000) (‘000) (‘000) (‘000) (‘000) (‘000) % % % % Jan. 12048 11442 606 5.1 5.0 Feb. 12017 11413 605 5.0 5.0 March 12050 (12038) 11457 (11437) 593 (601) 4.9 (5.0) 4.9 (5.0) April 12020 11437 583 4.9 4.9 May 12033 11440 593 4.9 4.9 June 12046 (12033) 11455 (11444) 581 (586) 4.9 (4.9) 4.9 (4.9) July 12062 11450 612 5.0 5.1 Aug. 12069 11433 637 5.1 5.3 Sep. 12085 (12072) 11451 (11445) 634 (628) 5.2 (5.1) 5.2 (5.2) Oct. 12093 11462 631 5.3 5.2 Nov. 12093 11457 636 5.3 5.3 Dec. 12051 (12079) 11421 (11447) 630 (632) 5.3 (5.3) 5.2 (5.2) 2012 Jan. 12078 11464 614 5.2 5.1 Feb. 12076 11444 632 5.2 5.2 March 12120 (12091) 11491 (11466) 629 (625) 5.2 (5.2) 5.2 (5.2) April 12099 11501 598 5.1 4.9 May 12161 11538 623 5.1 5.1 June 12132 (12131) 11500 (11513) 631 (617) 5.1 (5.1) 5.2 (5.1) July 12148 11513 635 5.2 5.2 Aug. 12121 11498 623 5.2 5.1 Sep. 12175 (12148) 11512 (11508) 663 (640) 5.3 (5.2) 5.4 (5.2) Oct. 12176 11523 653 5.4 5.4 Nov. 12184 11546 637 5.3 5.2 Dec. 12195 (12185) 11539 (11536) 656 (649) 5.4 (5.4) 5.4 (5.3) 2013 Jan. 12209 11549 660 5.4 5.4 Feb. 12288 11628 660 5.4 5.4 March 12280 (12259) 11593 (11590) 687 (669) 5.5 (5.4) 5.6 (5.5) April 12349 11663 685 5.5 5.5 May 12346 11663 683 5.6 5.5 June 12378 (12358) 11669 (11665) 709 (692) 5.7 (5.6) 5.7 (5.6) July 12359 11653 705 5.7 5.7 Aug. 12351 11637 714 5.8 5.8 Sep. 12343 (12351) 11646 (11645) 697 (705) 5.7 (5.7) 5.6 (5.7) Oct. 12348 11639 709 5.8 5.7 Nov. 12372 11660 713 5.8 5.8 Dec. 12352 (12357) 11630 (11643) 722 (715) 5.8 (5.8) 5.8 (5.8) 2014 Jan. 12189 11460 729 5.9 6.0 Feb. 12230 11530 742 6.0 6.0 March 12266 (12228) 11553 (11556) 713 (728) 6.0 (6.0) 5.8 (5.9) April 12286 11573 713 5.9 5.8 May 12282 11565 717 5.9 5.8 June 12320 (12296) 11578 (11572) 742 (724) 5.9 (5.9) 6.0 (5.9) July 12366 11577 789 6.1 6.4 Aug. 12459 11704 755 6.2 6.1 Sep. 12340 (12388) 11593 (11624) 747 (764) 6.0 (6.1) 6.2 (6.2) Oct. 12364 11592 772 6.2 6.2 Nov. 12415 11637 778 6.3 6.3 Dec. 12438 (12406) 11679 (11636) 759 (770) 6.2 (6.2) 6.1 (6.2)
Average calculated for previous three months; *Seasonally adjusted figures.
A.B.N. 91 007 092 944 I Head Office: Tonic House: 386 Flinders Lane, Melbourne Vic 3000 I Telephone: +61 (3) 9629 6888 I www.roymorgan.com
FO
R I
MM
ED
IAT
E R
EL
EA
SE
ABS Employment Estimates – Detailed
% of Workforce Unemployed
Total Workforce*
Total Employed*
Total looking for work*
Trend/ Original
Adjusted*
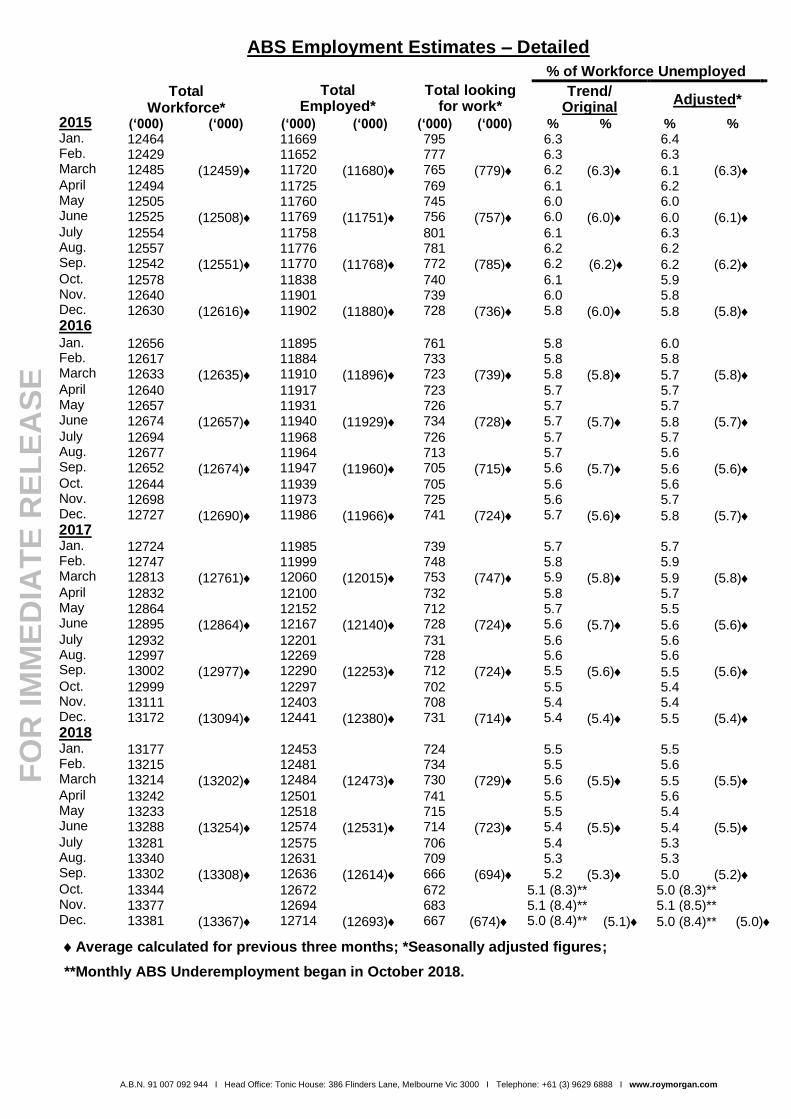
2015 (‘000) (‘000) (‘000) (‘000) (‘000) (‘000) % % % % Jan. 12464 11669 795 6.3 6.4 Feb. 12429 11652 777 6.3 6.3 March 12485 (12459) 11720 (11680) 765 (779) 6.2 (6.3) 6.1 (6.3) April 12494 11725 769 6.1 6.2 May 12505 11760 745 6.0 6.0 June 12525 (12508) 11769 (11751) 756 (757) 6.0 (6.0) 6.0 (6.1) July 12554 11758 801 6.1 6.3 Aug. 12557 11776 781 6.2 6.2 Sep. 12542 (12551) 11770 (11768) 772 (785) 6.2 (6.2) 6.2 (6.2) Oct. 12578 11838 740 6.1 5.9 Nov. 12640 11901 739 6.0 5.8 Dec. 12630 (12616) 11902 (11880) 728 (736) 5.8 (6.0) 5.8 (5.8) 2016 Jan. 12656 11895 761 5.8 6.0 Feb. 12617 11884 733 5.8 5.8 March 12633 (12635) 11910 (11896) 723 (739) 5.8 (5.8) 5.7 (5.8) April 12640 11917 723 5.7 5.7 May 12657 11931 726 5.7 5.7 June 12674 (12657) 11940 (11929) 734 (728) 5.7 (5.7) 5.8 (5.7) July 12694 11968 726 5.7 5.7 Aug. 12677 11964 713 5.7 5.6 Sep. 12652 (12674) 11947 (11960) 705 (715) 5.6 (5.7) 5.6 (5.6) Oct. 12644 11939 705 5.6 5.6 Nov. 12698 11973 725 5.6 5.7 Dec. 12727 (12690) 11986 (11966) 741 (724) 5.7 (5.6) 5.8 (5.7) 2017 Jan. 12724 11985 739 5.7 5.7 Feb. 12747 11999 748 5.8 5.9 March 12813 (12761) 12060 (12015) 753 (747) 5.9 (5.8) 5.9 (5.8) April 12832 12100 732 5.8 5.7 May 12864 12152 712 5.7 5.5 June 12895 (12864) 12167 (12140) 728 (724) 5.6 (5.7) 5.6 (5.6) July 12932 12201 731 5.6 5.6 Aug. 12997 12269 728 5.6 5.6 Sep. 13002 (12977) 12290 (12253) 712 (724) 5.5 (5.6) 5.5 (5.6) Oct. 12999 12297 702 5.5 5.4 Nov. 13111 12403 708 5.4 5.4 Dec. 13172 (13094) 12441 (12380) 731 (714) 5.4 (5.4) 5.5 (5.4) 2018 Jan. 13177 12453 724 5.5 5.5 Feb. 13215 12481 734 5.5 5.6 March 13214 (13202) 12484 (12473) 730 (729) 5.6 (5.5) 5.5 (5.5) April 13242 12501 741 5.5 5.6 May 13233 12518 715 5.5 5.4 June 13288 (13254) 12574 (12531) 714 (723) 5.4 (5.5) 5.4 (5.5) July 13281 12575 706 5.4 5.3 Aug. 13340 12631 709 5.3 5.3 Sep. 13302 (13308) 12636 (12614) 666 (694) 5.2 (5.3) 5.0 (5.2) Oct. 13344 12672 672 5.1 (8.3)** 5.0 (8.3)** Nov. 13377 12694 683 5.1 (8.4)** 5.1 (8.5)** Dec. 13381 (13367) 12714 (12693) 667 (674) 5.0 (8.4)** (5.1) 5.0 (8.4)** (5.0)
Average calculated for previous three months; *Seasonally adjusted figures;
**Monthly ABS Underemployment began in October 2018.
ABS Employment Estimates – Detailed
Workforce Unemployed Underemployed Un & Under
Total Employed Full-time Part-time Total Quarterly Trend/
Original
Seas.
Adjusted
Seas. Adj.
Quarterly Total Quarterly
Seas.
Adjusted Total
Seas.
Adjusted
Hours
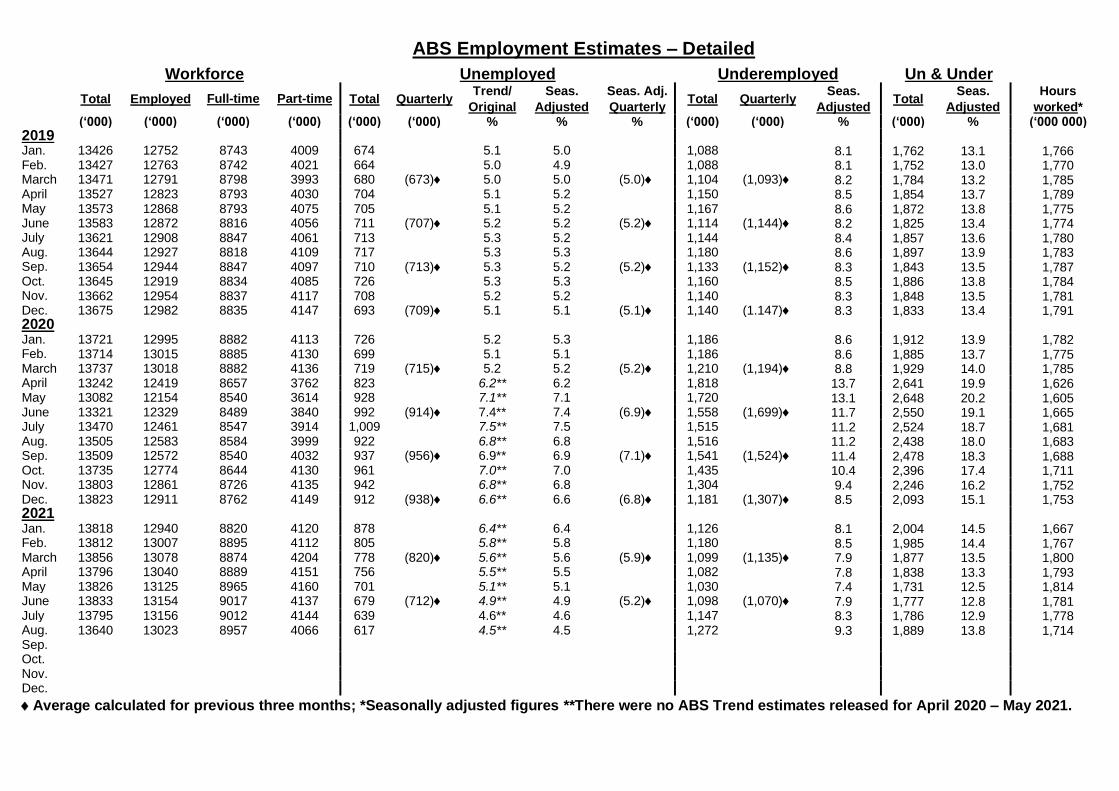
worked* (‘000) (‘000) (‘000) (‘000) (‘000) (‘000) % % % (‘000) (‘000) % (‘000) % (‘000 000) 2019 Jan. 13426 12752 8743 4009 674 5.1 5.0 1,088 8.1 1,762 13.1 1,766 Feb. 13427 12763 8742 4021 664 5.0 4.9 1,088 8.1 1,752 13.0 1,770 March 13471 12791 8798 3993 680 (673) 5.0 5.0 (5.0) 1,104 (1,093) 8.2 1,784 13.2 1,785 April 13527 12823 8793 4030 704 5.1 5.2 1,150 8.5 1,854 13.7 1,789 May 13573 12868 8793 4075 705 5.1 5.2 1,167 8.6 1,872 13.8 1,775 June 13583 12872 8816 4056 711 (707) 5.2 5.2 (5.2) 1,114 (1,144) 8.2 1,825 13.4 1,774 July 13621 12908 8847 4061 713 5.3 5.2 1,144 8.4 1,857 13.6 1,780 Aug. 13644 12927 8818 4109 717 5.3 5.3 1,180 8.6 1,897 13.9 1,783 Sep. 13654 12944 8847 4097 710 (713) 5.3 5.2 (5.2) 1,133 (1,152) 8.3 1,843 13.5 1,787 Oct. 13645 12919 8834 4085 726 5.3 5.3 1,160 8.5 1,886 13.8 1,784 Nov. 13662 12954 8837 4117 708 5.2 5.2 1,140 8.3 1,848 13.5 1,781 Dec. 13675 12982 8835 4147 693 (709) 5.1 5.1 (5.1) 1,140 (1.147) 8.3 1,833 13.4 1,791 2020 Jan. 13721 12995 8882 4113 726 5.2 5.3 1,186 8.6 1,912 13.9 1,782 Feb. 13714 13015 8885 4130 699 5.1 5.1 1,186 8.6 1,885 13.7 1,775 March 13737 13018 8882 4136 719 (715) 5.2 5.2 (5.2) 1,210 (1,194) 8.8 1,929 14.0 1,785 April 13242 12419 8657 3762 823 6.2** 6.2 1,818 13.7 2,641 19.9 1,626 May 13082 12154 8540 3614 928 7.1** 7.1 1,720 13.1 2,648 20.2 1,605 June 13321 12329 8489 3840 992 (914) 7.4** 7.4 (6.9) 1,558 (1,699) 11.7 2,550 19.1 1,665 July 13470 12461 8547 3914 1,009 7.5** 7.5 1,515 11.2 2,524 18.7 1,681 Aug. 13505 12583 8584 3999 922 6.8** 6.8 1,516 11.2 2,438 18.0 1,683 Sep. 13509 12572 8540 4032 937 (956) 6.9** 6.9 (7.1) 1,541 (1,524) 11.4 2,478 18.3 1,688 Oct. 13735 12774 8644 4130 961 7.0** 7.0 1,435 10.4 2,396 17.4 1,711 Nov. 13803 12861 8726 4135 942 6.8** 6.8 1,304 9.4 2,246 16.2 1,752 Dec. 13823 12911 8762 4149 912 (938) 6.6** 6.6 (6.8) 1,181 (1,307) 8.5 2,093 15.1 1,753 2021 Jan. 13818 12940 8820 4120 878 6.4** 6.4 1,126 8.1 2,004 14.5 1,667 Feb. 13812 13007 8895 4112 805 5.8** 5.8 1,180 8.5 1,985 14.4 1,767 March 13856 13078 8874 4204 778 (820) 5.6** 5.6 (5.9) 1,099 (1,135) 7.9 1,877 13.5 1,800 April 13796 13040 8889 4151 756 5.5** 5.5 1,082 7.8 1,838 13.3 1,793 May 13826 13125 8965 4160 701 5.1** 5.1 1,030 7.4 1,731 12.5 1,814 June 13833 13154 9017 4137 679 (712) 4.9** 4.9 (5.2) 1,098 (1,070) 7.9 1,777 12.8 1,781 July 13795 13156 9012 4144 639 4.6** 4.6 1,147 8.3 1,786 12.9 1,778 Aug. 13640 13023 8957 4066 617 4.5** 4.5 1,272 9.3 1,889 13.8 1,714 Sep. Oct. Nov. Dec.
Average calculated for previous three months; *Seasonally adjusted figures **There were no ABS Trend estimates released for April 2020 – May 2021.

Roy Morgan Employment Estimates – Detailed
Workforce Employed % of Workforce Unemployed & Looking for work Total Quarterly Full-time Part-time Total Quarterly Full-time Part-time Unemployed Quarterly For work Quarterly Full-time Part-time (‘000) (‘000) (‘000) (‘000) (‘000) (‘000) (‘000) (‘000) % % (‘000) (‘000) (‘000) % (‘000) % 1999 Jan. 9165 6489 2676 8159 5838 2321 11.0 1,006 651 10.0 355 13.3 Feb. 9271 6500 2771 8335 5941 2394 10.1 936 559 8.6 377 13.6 March 9175 (9204) 6381 2794 8357 (8284) 5851 2506 8.9 (10.0) 818 (920) 530 8.3 288 10.3 April 9103 6437 2666 8227 5857 2370 9.6 876 580 9.0 296 11.1 May 9021 6374 2647 8222 5873 2349 8.9 799 501 7.9 298 11.3 June 9110 (9078) 6317 2793 8244 (8231) 5769 2475 9.5 (9.3) 866 (847) 548 8.7 318 11.4 July 9231 6539 2692 8408 6020 2388 8.9 823 519 7.9 304 11.3 Aug. 9277 6477 2800 8449 5986 2463 8.9 828 491 7.6 337 12.0 Sep. 9323 (9277) 6403 2920 8492 (8450) 5968 2524 8.9 (8.9) 831 (827) 435 6.8 396 13.6 Oct. 9057 6275 2782 8193 5728 2465 9.5 864 547 8.7 317 11.4 Nov. 9317 6337 2980 8485 5850 2635 8.9 832 487 7.7 345 11.6 Dec. 9159 (9178) 6339 2820 8297 (8325) 5802 2495 9.4 (9.3) 862 (853) 537 8.5 325 11.5 2000 Jan. 9312 6627 2685 8329 5984 2345 10.6 983 643 9.7 340 12.7 Feb. 9271 6513 2758 8418 5970 2448 9.2 853 543 8.3 310 11.2 March 9226 (9270) 6478 2748 8359 (8369) 5932 2427 9.4 (9.7) 867 (901) 546 8.4 321 11.7 April 9166 6221 2945 8240 5702 2538 10.1 926 519 8.3 407 13.8 May 9267 6504 2766 8355 5948 2407 9.8 912 553 8.5 359 13.0 June 9277 (9237) 6370 2907 8451 (8349) 5848 2603 8.9 (9.6) 826 (888) 522 8.2 304 10.5 July 9341 6535 2806 8471 5958 2513 9.3 870 577 8.8 293 10.4 Aug. 9454 6724 2730 8598 6143 2455 9.1 856 581 8.6 275 10.1 Sep. 9211 (9335) 6491 2720 8342 (8470) 5965 2377 9.4 (9.3) 869 (865) 526 8.1 343 12.6 Oct. 9251 6388 2863 8414 5868 2546 9.0 837 520 8.1 317 11.1 Nov. 9439 6635 2804 8530 6033 2497 9.6 909 602 9.1 307 10.9 Dec. 9314 (9335) 6414 2900 8361 (8435) 5753 2608 10.2 (9.6) 953 (900) 661 10.3 292 10.1 2001 Jan. 9408 6596 2812 8434 5983 2451 10.4 974 613 9.3 361 12.8 Feb. 9280 6466 2814 8313 5793 2520 10.4 967 672 10.4 295 10.5 March 9320 (9336) 6358 2962 8331 (8359) 5762 2569 10.6 (10.5) 989 (977) 596 9.4 393 13.3 April 9466 6506 2960 8496 5877 2619 10.2 970 628 9.7 342 11.6 May 9323 6324 2999 8375 5726 2649 10.2 948 597 9.4 351 11.7 June 9344 (9377) 6565 2779 8436 (8435) 5943 2493 9.7 (10.0) 908 (942) 621 9.5 287 10.3 July 9548 6649 2899 8711 6143 2568 8.8 837 506 7.6 331 11.4 Aug. 9466 6689 2777 8548 6107 2441 9.7 918 582 8.7 336 12.1 Sep. 9414 (9475) 6402 3012 8408 (8555) 5797 2611 10.7 (9.7) 1,006 (920) 605 9.5 401 13.3 Oct. 9438 6513 2925 8524 5878 2646 9.6 914 636 9.8 278 9.5 Nov. 9768 6474 3294 8879 5969 2910 9.1 889 504 7.8 385 11.7 Dec. 9529 (9578) 6538 2991 8526 (8643) 5901 2625 10.5 (9.8) 1,003 (935) 636 9.7 367 12.3
Average calculated for previous three months.

Roy Morgan Employment Estimates – Detailed
Workforce Employed % of Workforce Unemployed & Looking for work Total Quarterly Full-time Part-time Total Quarterly Full-time Part-time Unemployed Quarterly For work Quarterly Full-time Part-time (‘000) (‘000) (‘000) (‘000) (‘000) (‘000) (‘000) (‘000) % % (‘000) (‘000) (‘000) % (‘000) %
2002 Jan. 9819 6704 3115 8744 6067 2677 10.9 1,075 636 9.5 439 14.1 Feb. 9801 6658 3143 8875 6092 2783 9.4 926 567 8.5 359 11.4 March 9470 (9696) 6622 2848 8629 (8749) 6109 2520 8.9 (9.8) 841 (947) 513 7.7 328 11.5 April 9692 6484 3208 8880 6020 2860 8.4 812 465 7.2 347 10.8 May 9557 6607 2950 8813 6098 2715 7.8 744 508 7.7 236 8.0 June 9563 (9604) 6610 2953 8769 (8821) 6096 2673 8.3 (8.2) 794 (783) 514 7.8 280 9.5 July 9842 6690 3152 9092 6242 2850 7.6 750 447 6.7 303 9.6 Aug. 9484 6418 3066 8794 5979 2815 7.3 690 438 6.8 252 8.2 Sep. 9637 (9654) 6586 3051 8934 (8939) 6177 2757 7.3 (7.4) 703 (715) 408 6.2 295 9.7 Oct. 9614 6451 3163 8867 6046 2821 7.8 747 405 6.3 342 10.8 Nov. 9623 6578 3045 8907 6144 2763 7.4 716 435 6.6 281 9.2 Dec. 9429 (9555) 6432 2997 8699 (8824) 5965 2734 7.7 (7.7) 730 (731) 468 7.3 262 8.7 2003 Jan. 9637 6715 2922 8964 6297 2667 7.0 673 417 6.2 256 8.8 Feb. 9625 6634 2991 8817 6123 2694 8.4 808 510 7.7 298 10.0 March 9565 (9609) 6415 3150 8796 (8859) 5964 2832 8.0 (7.8) 769 (750) 453 7.1 316 10.0 April 9681 6546 3135 8936 6136 2800 7.7 744 410 6.3 334 10.7 May 9606 6489 3117 8815 6038 2777 8.2 791 451 7.0 340 10.9 June 9551 (9612) 6471 3080 8787 (8846) 6003 2784 8.0 (8.0) 764 (766) 468 7.2 296 9.6 July 9847 6695 3152 9052 6245 2807 8.1 795 495 7.4 300 9.5 Aug. 9582 6467 3115 8808 6165 2643 8.1 774 479 7.4 295 9.5 Sep. 9729 (9719) 6654 3075 8968 (8943) 6187 2781 7.8 (8.0) 761 (776) 471 7.1 290 9.4 Oct. 9972 6775 3197 9261 6336 2925 7.1 711 440 6.5 271 8.5 Nov. 9870 6815 3055 9100 6364 2736 7.8 769 450 6.6 319 10.4 Dec. 9799 (9880) 6638 3161 8936 (9099) 6152 2784 8.8 (7.9) 863 (781) 486 7.3 377 11.9 2004 Jan. 10212 6978 3234 9240 6417 2823 9.5 973 561 8.0 412 12.7 Feb. 9939 6873 3066 9108 6380 2728 8.4 832 504 7.3 328 10.7 March 10089 (10080) 6880 3209 9197 (9181) 6335 2862 8.8 (8.9) 892 (899) 531 7.7 361 11.2 April 10040 6860 3180 9194 6342 2852 8.4 846 519 7.6 327 10.3 May 9954 6669 3285 9167 6215 2952 7.9 786 453 6.8 333 10.1 June 9701 (9898) 6555 3146 8875 (9079) 6072 2803 8.5 (8.3) 826 (819) 483 7.4 343 10.9 July 10219 7052 3167 9463 6607 2856 7.4 757 447 6.3 310 9.8 Aug. 9896 6643 3253 9217 6242 2975 6.9 679 398 6.0 281 8.6 Sep. 9791 (9969) 6721 3070 9094 (9258) 6326 2768 7.1 (7.1) 698 (711) 396 5.9 302 9.8 Oct. 10027 6670 3357 9334 6297 3037 6.9 694 372 5.6 322 9.6 Nov. 9936 6734 3202 9304 6381 2923 6.4 632 352 5.2 280 8.7 Dec. 10120 (10028) 6784 3336 9432 (9357) 6378 3054 6.8 (6.7) 688 (671) 404 6.0 284 8.5
Average calculated for previous three months.
Roy Morgan Employment Estimates – Detailed
Workforce Employed % of Workforce Unemployed & Looking for work Total Quarterly Full-time Part-time Total Quarterly Full-time Part-time Unemployed Quarterly For work Quarterly Full-time Part-time (‘000) (‘000) (‘000) (‘000) (‘000) (‘000) (‘000) (‘000) % % (‘000) (‘000) (‘000) % (‘000) %
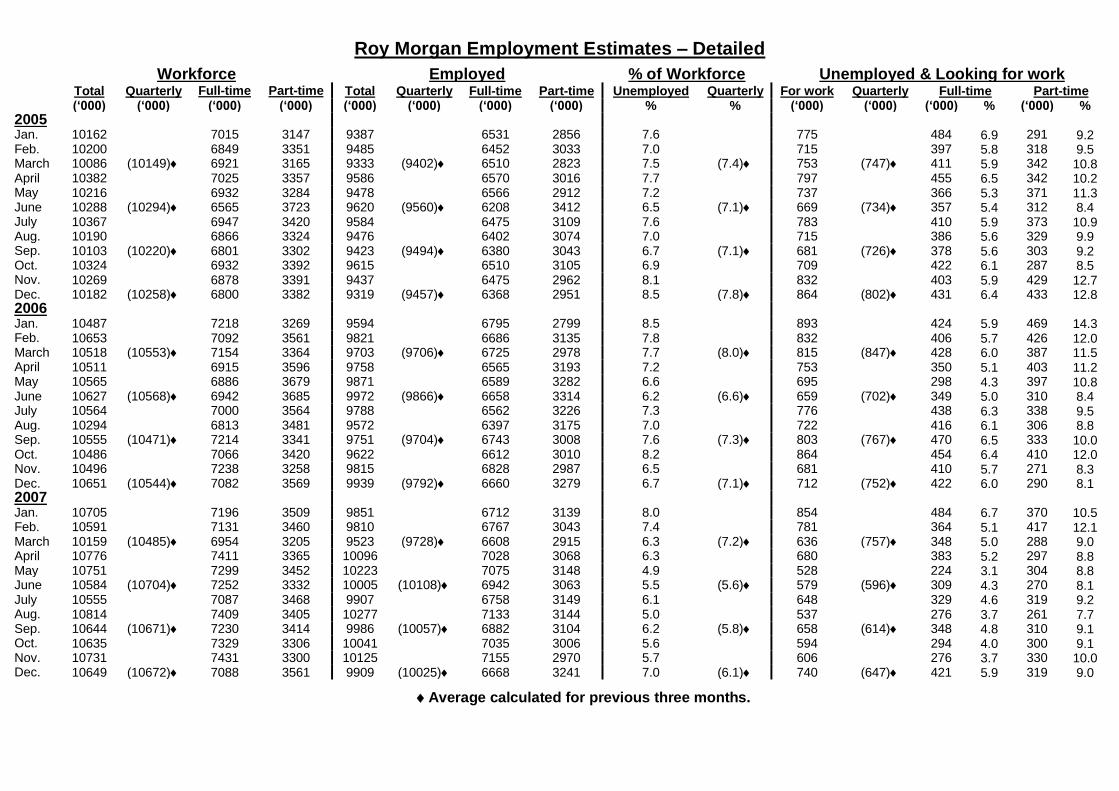
2005 Jan. 10162 7015 3147 9387 6531 2856 7.6 775 484 6.9 291 9.2 Feb. 10200 6849 3351 9485 6452 3033 7.0 715 397 5.8 318 9.5 March 10086 (10149) 6921 3165 9333 (9402) 6510 2823 7.5 (7.4) 753 (747) 411 5.9 342 10.8 April 10382 7025 3357 9586 6570 3016 7.7 797 455 6.5 342 10.2 May 10216 6932 3284 9478 6566 2912 7.2 737 366 5.3 371 11.3 June 10288 (10294) 6565 3723 9620 (9560) 6208 3412 6.5 (7.1) 669 (734) 357 5.4 312 8.4 July 10367 6947 3420 9584 6475 3109 7.6 783 410 5.9 373 10.9 Aug. 10190 6866 3324 9476 6402 3074 7.0 715 386 5.6 329 9.9 Sep. 10103 (10220) 6801 3302 9423 (9494) 6380 3043 6.7 (7.1) 681 (726) 378 5.6 303 9.2 Oct. 10324 6932 3392 9615 6510 3105 6.9 709 422 6.1 287 8.5 Nov. 10269 6878 3391 9437 6475 2962 8.1 832 403 5.9 429 12.7 Dec. 10182 (10258) 6800 3382 9319 (9457) 6368 2951 8.5 (7.8) 864 (802) 431 6.4 433 12.8 2006 Jan. 10487 7218 3269 9594 6795 2799 8.5 893 424 5.9 469 14.3 Feb. 10653 7092 3561 9821 6686 3135 7.8 832 406 5.7 426 12.0 March 10518 (10553) 7154 3364 9703 (9706) 6725 2978 7.7 (8.0) 815 (847) 428 6.0 387 11.5 April 10511 6915 3596 9758 6565 3193 7.2 753 350 5.1 403 11.2 May 10565 6886 3679 9871 6589 3282 6.6 695 298 4.3 397 10.8 June 10627 (10568) 6942 3685 9972 (9866) 6658 3314 6.2 (6.6) 659 (702) 349 5.0 310 8.4 July 10564 7000 3564 9788 6562 3226 7.3 776 438 6.3 338 9.5 Aug. 10294 6813 3481 9572 6397 3175 7.0 722 416 6.1 306 8.8 Sep. 10555 (10471) 7214 3341 9751 (9704) 6743 3008 7.6 (7.3) 803 (767) 470 6.5 333 10.0 Oct. 10486 7066 3420 9622 6612 3010 8.2 864 454 6.4 410 12.0 Nov. 10496 7238 3258 9815 6828 2987 6.5 681 410 5.7 271 8.3 Dec. 10651 (10544) 7082 3569 9939 (9792) 6660 3279 6.7 (7.1) 712 (752) 422 6.0 290 8.1 2007 Jan. 10705 7196 3509 9851 6712 3139 8.0 854 484 6.7 370 10.5 Feb. 10591 7131 3460 9810 6767 3043 7.4 781 364 5.1 417 12.1 March 10159 (10485) 6954 3205 9523 (9728) 6608 2915 6.3 (7.2) 636 (757) 348 5.0 288 9.0 April 10776 7411 3365 10096 7028 3068 6.3 680 383 5.2 297 8.8 May 10751 7299 3452 10223 7075 3148 4.9 528 224 3.1 304 8.8 June 10584 (10704) 7252 3332 10005 (10108) 6942 3063 5.5 (5.6) 579 (596) 309 4.3 270 8.1 July 10555 7087 3468 9907 6758 3149 6.1 648 329 4.6 319 9.2 Aug. 10814 7409 3405 10277 7133 3144 5.0 537 276 3.7 261 7.7 Sep. 10644 (10671) 7230 3414 9986 (10057) 6882 3104 6.2 (5.8) 658 (614) 348 4.8 310 9.1 Oct. 10635 7329 3306 10041 7035 3006 5.6 594 294 4.0 300 9.1 Nov. 10731 7431 3300 10125 7155 2970 5.7 606 276 3.7 330 10.0 Dec. 10649 (10672) 7088 3561 9909 (10025) 6668 3241 7.0 (6.1) 740 (647) 421 5.9 319 9.0
Average calculated for previous three months.
Roy Morgan Employment Estimates – Detailed
Workforce Employed % of Workforce Unemployed & Looking for work Total Quarterly Full-time Part-time Total Quarterly Full-time Part-time Unemployed Quarterly For work Quarterly Full-time Part-time (‘000) (‘000) (‘000) (‘000) (‘000) (‘000) (‘000) (‘000) % % (‘000) (‘000) (‘000) % (‘000) %
2008 Jan. 10710 7446 3264 10086 7041 3045 5.8 624 405 5.4 219 6.7 Feb. 10743 7318 3425 10081 6974 3107 6.2 662 344 4.7 318 9.3 March 10633 (10696) 7218 3415 9982 (10050) 6867 3115 6.1 (6.0) 651 (646) 350 4.8 301 8.8 April 10802 7218 3584 10193 6956 3237 5.6 608 261 3.6 347 9.7 May 10690 7163 3527 10033 6838 3195 6.1 657 325 4.5 332 9.4 June 10782 (10758) 7167 3615 10159 (10127) 6822 3337 5.8 (5.9) 629 (632) 344 4.8 285 7.9 July 11101 7732 3369 10494 7400 3094 5.5 607 332 4.3 275 8.2 Aug. 10846 7305 3541 10240 6984 3256 5.6 606 317 4.3 289 8.2 Sep. 10916 (10955) 7538 3378 10378 (10371) 7245 3133 4.9 (5.3) 538 (584) 293 3.9 245 7.3 Oct. 11025 7388 3637 10400 7035 3365 5.7 625 352 4.8 273 7.5 Nov. 10906 7255 3651 10210 6922 3288 6.4 696 333 4.6 363 9.9 Dec. 10868 (10933) 7413 3455 10167 (10259) 7043 3124 6.4 (6.2) 700 (674) 370 5.0 330 9.6 2009 Jan. 11135 7610 3525 10368 7195 3173 6.9 767 415 5.5 352 10.0
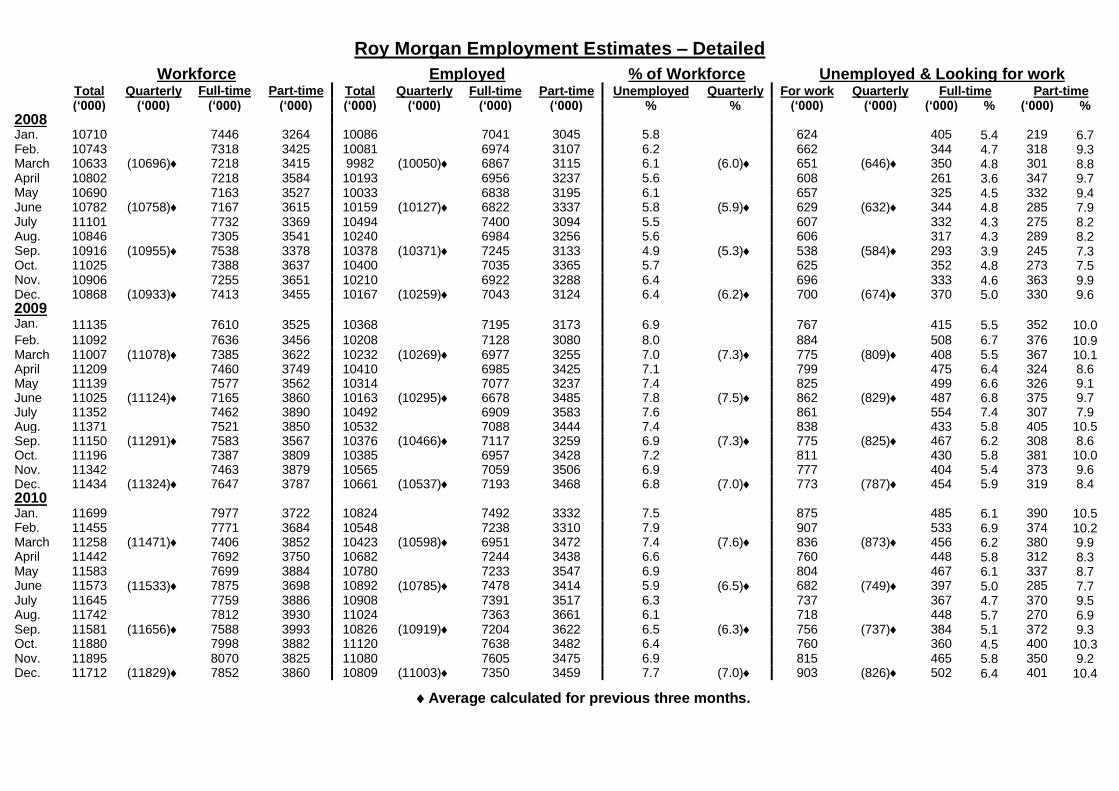
Feb. 11092 7636 3456 10208 7128 3080 8.0 884 508 6.7 376 10.9 March 11007 (11078) 7385 3622 10232 (10269) 6977 3255 7.0 (7.3) 775 (809) 408 5.5 367 10.1 April 11209 7460 3749 10410 6985 3425 7.1 799 475 6.4 324 8.6 May 11139 7577 3562 10314 7077 3237 7.4 825 499 6.6 326 9.1 June 11025 (11124) 7165 3860 10163 (10295) 6678 3485 7.8 (7.5) 862 (829) 487 6.8 375 9.7 July 11352 7462 3890 10492 6909 3583 7.6 861 554 7.4 307 7.9 Aug. 11371 7521 3850 10532 7088 3444 7.4 838 433 5.8 405 10.5 Sep. 11150 (11291) 7583 3567 10376 (10466) 7117 3259 6.9 (7.3) 775 (825) 467 6.2 308 8.6 Oct. 11196 7387 3809 10385 6957 3428 7.2 811 430 5.8 381 10.0 Nov. 11342 7463 3879 10565 7059 3506 6.9 777 404 5.4 373 9.6 Dec. 11434 (11324) 7647 3787 10661 (10537) 7193 3468 6.8 (7.0) 773 (787) 454 5.9 319 8.4 2010 Jan. 11699 7977 3722 10824 7492 3332 7.5 875 485 6.1 390 10.5 Feb. 11455 7771 3684 10548 7238 3310 7.9 907 533 6.9 374 10.2 March 11258 (11471) 7406 3852 10423 (10598) 6951 3472 7.4 (7.6) 836 (873) 456 6.2 380 9.9 April 11442 7692 3750 10682 7244 3438 6.6 760 448 5.8 312 8.3 May 11583 7699 3884 10780 7233 3547 6.9 804 467 6.1 337 8.7 June 11573 (11533) 7875 3698 10892 (10785) 7478 3414 5.9 (6.5) 682 (749) 397 5.0 285 7.7 July 11645 7759 3886 10908 7391 3517 6.3 737 367 4.7 370 9.5 Aug. 11742 7812 3930 11024 7363 3661 6.1 718 448 5.7 270 6.9 Sep. 11581 (11656) 7588 3993 10826 (10919) 7204 3622 6.5 (6.3) 756 (737) 384 5.1 372 9.3 Oct. 11880 7998 3882 11120 7638 3482 6.4 760 360 4.5 400 10.3 Nov. 11895 8070 3825 11080 7605 3475 6.9 815 465 5.8 350 9.2 Dec. 11712 (11829) 7852 3860 10809 (11003) 7350 3459 7.7 (7.0) 903 (826) 502 6.4 401 10.4
Average calculated for previous three months.

Roy Morgan Employment Estimates – Detailed
Workforce Employed % of Workforce Unemployed & Looking for work Total Quarterly Full-time Part-time Total Quarterly Full-time Part-time Unemployed Quarterly For work Quarterly Full-time Part-time (‘000) (‘000) (‘000) (‘000) (‘000) (‘000) (‘000) (‘000) % % (‘000) (‘000) (‘000) % (‘000) %
2011 Jan. 12046 8034 4012 11098 7575 3523 7.9 948 459 5.7 489 12.2 Feb. 11697 7992 3705 10770 7468 3302 7.9 927 524 6.6 403 10.9 March 11664 (11802) 7950 3714 10800 (10889) 7482 3318 7.4 (7.7) 863 (913) 468 5.9 395 10.6 April 11792 7799 3993 10945 7314 3631 7.2 847 485 6.2 362 9.1 May 11882 7951 3931 11064 7509 3555 6.9 818 442 5.6 376 9.6 June 12065 (11913) 8107 3958 11220 (11076) 7640 3580 7.0 (7.0) 846 (837) 467 5.8 379 9.6 July 11687 7916 3771 10802 7421 3381 7.6 885 495 6.3 390 10.3 Aug. 11868 8032 3836 10929 7548 3381 7.9 939 484 6.0 455 11.9 Sep. 11875 (11810) 8008 3867 10956 (10896) 7543 3413 7.7 (7.7) 919 (914) 465 5.8 454 11.7 Oct. 11909 7695 4214 10883 7131 3752 8.6 1,026 564 7.3 462 11.0 Nov. 12195 8226 3969 11151 7666 3485 8.6 1,044 560 6.8 484 12.2 Dec. 12005 (12036) 7933 4072 10971 (11002) 7389 3582 8.6 (8.6) 1,034 (1,035) 544 6.9 490 12.0 2012 Jan. 12429 8386 4043 11151 7681 3470 10.3 1,278 705 8.4 573 14.2
Feb. 12228 8000 4228 11046 7408 3638 9.7 1,177 591 7.4 586 13.9 March 12093 (12249) 7890 4203 10973 (11057) 7391 3582 9.3 (9.7) 1,120 (1,192) 499 6.3 621 14.8 April 12307 8131 4176 11158 7525 3633 9.3 1,149 606 7.5 543 13.0 May 12213 7801 4412 11216 7357 3859 8.2 997 444 5.7 553 12.5 June 12009 (12177) 7940 4069 10840 (11072) 7351 3489 9.7 (9.1) 1,169 (1,105) 589 7.4 580 14.3 July 12119 7954 4165 10948 7432 3516 9.7 1,171 522 6.6 649 15.6 Aug. 12279 7897 4382 11074 7263 3811 9.8 1,205 634 8.0 571 13.0 Sep. 12150 (12183) 7942 4208 10937 (10986) 7345 3592 10.0 (9.8) 1,214 (1,197) 597 7.5 617 14.7 Oct. 12009 7892 4117 10846 7313 3533 9.7 1,163 579 7.3 584 14.2 Nov. 12251 7930 4321 11022 7377 3645 10.0 1,229 553 7.0 676 15.6 Dec. 12260 (12095) 7828 4432 11084 (10913) 7242 3842 9.6 (9.8) 1,175 (1,189) 585 7.5 590 13.3 2013 Jan. 12139 7940 4199 10812 7196 3616 10.9 1,327 744 9.4 583 13.9 Feb. 12511 8146 4365 11151 7497 3654 10.9 1,360 649 8.0 711 16.3 March 12644 (12431) 8386 4258 11275 (11079) 7671 3604 10.8 (10.9) 1,369 (1,352) 715 8.5 654 15.4 April 12437 7981 4456 11283 7473 3810 9.3 1,154 508 6.4 646 14.5 May 12328 8226 4102 11160 7597 3563 9.5 1,168 629 7.6 539 13.1 June 12453 (12406) 8168 4285 11248 (11230) 7540 3708 9.7 (9.5) 1,205 (1,176) 628 7.7 577 13.5 July 12563 8030 4533 11296 7414 3882 10.1 1,267 616 7.7 651 14.4 Aug. 12377 8071 4306 11126 7440 3686 10.1 1,251 631 7.8 620 14.4 Sep. 12467 (12469) 8020 4447 11170 (11197) 7413 3757 10.4 (10.2) 1,297 (1,272) 607 7.6 690 15.5 Oct. 12465 8143 4322 11132 7417 3715 10.7 1,333 726 8.9 607 14.0 Nov. 12454 8170 4284 11186 7470 3716 10.2 1,268 700 8.6 568 13.3 Dec. 12635 (12518) 8172 4463 11224 (11181) 7395 3829 11.2 (10.7) 1,411 (1,337) 777 9.5 634 14.2
Average calculated for previous three months.
Roy Morgan Employment Estimates – Detailed
Workforce Employed % of Workforce Unemployed & Looking for work Total Quarterly Full-time Part-time Total Quarterly Full-time Part-time Unemployed Quarterly For work Quarterly Full-time Part-time (‘000) (‘000) (‘000) (‘000) (‘000) (‘000) (‘000) (‘000) % % (‘000) (‘000) (‘000) % (‘000) %
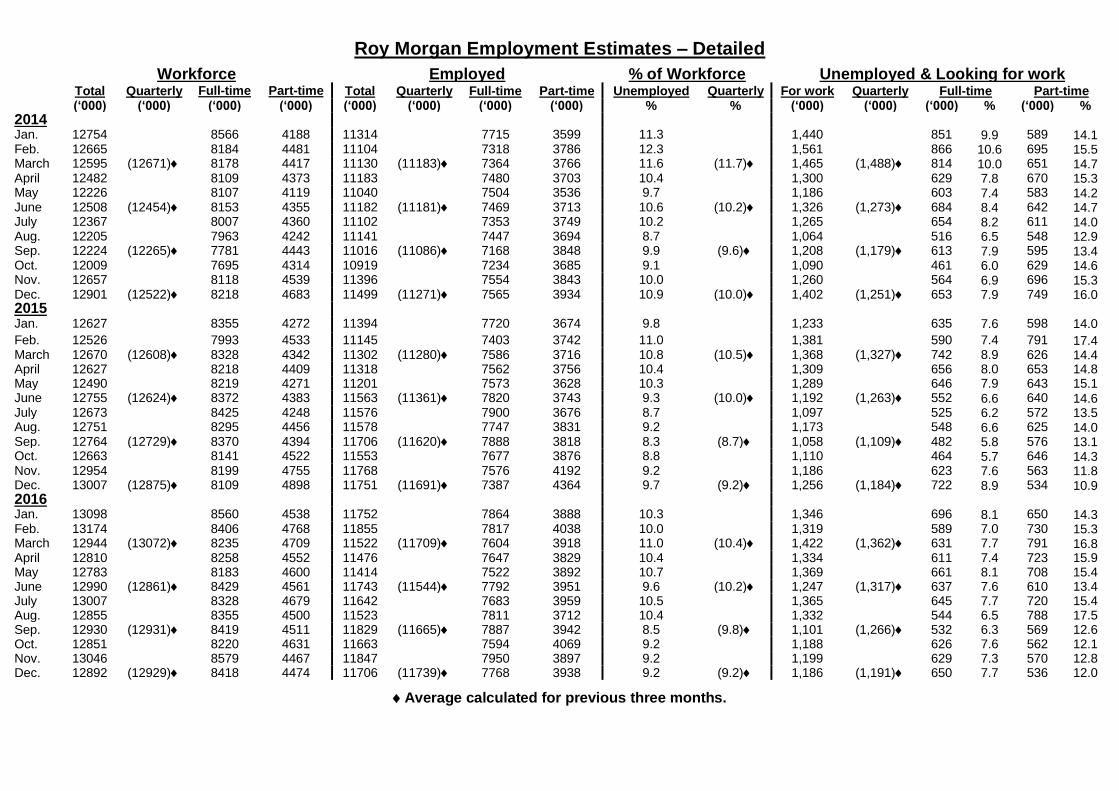
2014 Jan. 12754 8566 4188 11314 7715 3599 11.3 1,440 851 9.9 589 14.1 Feb. 12665 8184 4481 11104 7318 3786 12.3 1,561 866 10.6 695 15.5 March 12595 (12671) 8178 4417 11130 (11183) 7364 3766 11.6 (11.7) 1,465 (1,488) 814 10.0 651 14.7 April 12482 8109 4373 11183 7480 3703 10.4 1,300 629 7.8 670 15.3 May 12226 8107 4119 11040 7504 3536 9.7 1,186 603 7.4 583 14.2 June 12508 (12454) 8153 4355 11182 (11181) 7469 3713 10.6 (10.2) 1,326 (1,273) 684 8.4 642 14.7 July 12367 8007 4360 11102 7353 3749 10.2 1,265 654 8.2 611 14.0 Aug. 12205 7963 4242 11141 7447 3694 8.7 1,064 516 6.5 548 12.9 Sep. 12224 (12265) 7781 4443 11016 (11086) 7168 3848 9.9 (9.6) 1,208 (1,179) 613 7.9 595 13.4 Oct. 12009 7695 4314 10919 7234 3685 9.1 1,090 461 6.0 629 14.6 Nov. 12657 8118 4539 11396 7554 3843 10.0 1,260 564 6.9 696 15.3 Dec. 12901 (12522) 8218 4683 11499 (11271) 7565 3934 10.9 (10.0) 1,402 (1,251) 653 7.9 749 16.0 2015 Jan. 12627 8355 4272 11394 7720 3674 9.8 1,233 635 7.6 598 14.0
Feb. 12526 7993 4533 11145 7403 3742 11.0 1,381 590 7.4 791 17.4 March 12670 (12608) 8328 4342 11302 (11280) 7586 3716 10.8 (10.5) 1,368 (1,327) 742 8.9 626 14.4 April 12627 8218 4409 11318 7562 3756 10.4 1,309 656 8.0 653 14.8 May 12490 8219 4271 11201 7573 3628 10.3 1,289 646 7.9 643 15.1 June 12755 (12624) 8372 4383 11563 (11361) 7820 3743 9.3 (10.0) 1,192 (1,263) 552 6.6 640 14.6 July 12673 8425 4248 11576 7900 3676 8.7 1,097 525 6.2 572 13.5 Aug. 12751 8295 4456 11578 7747 3831 9.2 1,173 548 6.6 625 14.0 Sep. 12764 (12729) 8370 4394 11706 (11620) 7888 3818 8.3 (8.7) 1,058 (1,109) 482 5.8 576 13.1 Oct. 12663 8141 4522 11553 7677 3876 8.8 1,110 464 5.7 646 14.3 Nov. 12954 8199 4755 11768 7576 4192 9.2 1,186 623 7.6 563 11.8 Dec. 13007 (12875) 8109 4898 11751 (11691) 7387 4364 9.7 (9.2) 1,256 (1,184) 722 8.9 534 10.9 2016 Jan. 13098 8560 4538 11752 7864 3888 10.3 1,346 696 8.1 650 14.3 Feb. 13174 8406 4768 11855 7817 4038 10.0 1,319 589 7.0 730 15.3 March 12944 (13072) 8235 4709 11522 (11709) 7604 3918 11.0 (10.4) 1,422 (1,362) 631 7.7 791 16.8 April 12810 8258 4552 11476 7647 3829 10.4 1,334 611 7.4 723 15.9 May 12783 8183 4600 11414 7522 3892 10.7 1,369 661 8.1 708 15.4 June 12990 (12861) 8429 4561 11743 (11544) 7792 3951 9.6 (10.2) 1,247 (1,317) 637 7.6 610 13.4 July 13007 8328 4679 11642 7683 3959 10.5 1,365 645 7.7 720 15.4 Aug. 12855 8355 4500 11523 7811 3712 10.4 1,332 544 6.5 788 17.5 Sep. 12930 (12931) 8419 4511 11829 (11665) 7887 3942 8.5 (9.8) 1,101 (1,266) 532 6.3 569 12.6 Oct. 12851 8220 4631 11663 7594 4069 9.2 1,188 626 7.6 562 12.1 Nov. 13046 8579 4467 11847 7950 3897 9.2 1,199 629 7.3 570 12.8 Dec. 12892 (12929) 8418 4474 11706 (11739) 7768 3938 9.2 (9.2) 1,186 (1,191) 650 7.7 536 12.0
Average calculated for previous three months.

Roy Morgan Employment Estimates – Detailed
Workforce Employed % of Workforce Unemployed & Looking for work Total Quarterly Full-time Part-time Total Quarterly Full-time Part-time Unemployed Quarterly For work Quarterly Full-time Part-time (‘000) (‘000) (‘000) (‘000) (‘000) (‘000) (‘000) (‘000) % % (‘000) (‘000) (‘000) % (‘000) %
2017 Jan. 13414 8719 4695 12120 8085 4035 9.7 1,295 634 7.3 661 14.1 Feb. 13348 8480 4868 12095 7904 4191 9.4 1,253 576 6.8 677 13.9 March 13211 (13324) 8431 4780 11975 (12063) 7868 4107 9.3 (9.5) 1,236 (1,261) 563 6.7 673 14.1 April 13133 8228 4905 11916 7616 4300 9.3 1,217 612 7.4 605 12.3 May 13074 8211 4863 11790 7552 4238 9.8 1,284 659 8.0 625 12.9 June 13530 (13246) 8650 4880 12330 (12012) 8100 4230 8.9 (9.3) 1,200 (1,234) 550 6.4 650 13.3 July 13090 8267 4823 11854 7699 4155 9.4 1,236 568 6.9 668 13.9 Aug. 13009 8077 4932 11685 7438 4247 10.2 1,324 639 7.9 685 13.9 Sep. 13174 (13091) 8183 4991 11972 (11837) 7597 4375 9.1 (9.6) 1,202 (1,254) 586 7.2 616 12.3 Oct. 12993 8372 4621 11767 7714 4053 9.5 1,226 658 7.9 568 12.3 Nov. 13174 8543 4631 11886 7919 3967 9.8 1,288 624 7.3 664 14.3 Dec. 13410 (13192) 8590 4820 12098 (11917) 7894 4204 9.8 (9.7) 1,312 (1,275) 696 8.1 616 12.8 2018 Jan. 13455 8687 4768 12236 8045 4191 9.1 1,219 642 7.4 577 12.1
Feb. 13538 8811 4727 12228 8153 4075 9.7 1,310 658 7.5 652 13.8 March 13584 (13526) 8521 5063 12374 (12279) 7943 4431 8.9 (9.2) 1,210 (1,246) 578 6.8 632 12.5 April 13158 8069 5089 11962 7508 4454 9.1 1,196 561 7.0 635 12.5 May 13461 8486 4975 12145 7859 4286 9.8 1,316 627 7.4 689 13.8 June 13416 (13345) 8378 5038 12245 (12117) 7800 4445 8.7 (9.2) 1,171 (1,228) 578 6.9 593 11.8 July 13350 8346 5004 12021 7765 4256 10.0 1,329 581 7.0 748 14.9 Aug. 13416 8461 4955 11940 7761 4179 11.0 1,476 700 8.3 776 15.7 Sep. 13420 (13395) 8305 5115 12164 (12042) 7694 4470 9.4 (10.1) 1,256 (1,354) 611 7.4 645 12.6 Oct. 13459 8388 5071 12194 7887 4307 9.4 1,265 501 6.0 764 15.1 Nov. 13585 8688 4897 12294 8110 4184 9.5 1,291 578 6.7 713 14.6 Dec. 13376 (13473) 8558 4818 12074 (12187) 7959 4115 9.7 (9.5) 1,302 (1,286) 599 7.0 703 14.6 2019 Jan. 13650 8854 4796 12397 8257 4140 9.2 1,253 597 6.7 656 13.7 Feb. 13466 8765 4701 12174 8159 4015 9.6 1,292 606 6.9 686 14.6 March 13649 (13588) 8661 4988 12158 (12243) 7930 4228 10.9 (9.9) 1,491 (1,345) 731 8.4 760 15.2 April 13453 8631 4822 12251 8032 4219 8.9 1,202 599 6.9 603 12.5 May 13927 9130 4797 12602 8456 4146 9.5 1,325 674 7.4 651 13.6 June 13617 (13666) 8884 4733 12363 (12405) 8279 4084 9.2 (9.2) 1,254 (1,260) 605 6.8 649 13.7 July 13564 8916 4648 12382 8390 3992 8.7 1,182 526 5.9 656 14.1 Aug. 13473 8839 4634 12294 8385 3909 8.7 1,179 454 5.1 725 15.6 Sep. 13836 (13624) 9048 4788 12634 (12437) 8467 4167 8.7 (8.7) 1,202 (1,188) 581 6.4 621 13.0 Oct. 13789 9023 4766 12714 8582 4132 7.8 1,075 441 4.9 634 13.3 Nov. 13817 9267 4550 12695 8718 3977 8.1 1,122 549 5.9 573 12.6 Dec. 13896 (13834) 8945 4952 12691 (12700) 8326 4365 8.7 (8.2) 1,205 (1,134) 619 6.9 587 11.9
Average calculated for previous three months.

Roy Morgan Employment Estimates – Detailed
Workforce Employed % of Workforce Unemployed & Looking for work Total Quarterly Full-time Part-time Total Quarterly Full-time Part-time Unemployed Quarterly For work Quarterly Full-time Part-time (‘000) (‘000) (‘000) (‘000) (‘000) (‘000) (‘000) (‘000) % % (‘000) (‘000) (‘000) % (‘000) %
2020 Jan. 14067 9314 4753 12706 8601 4105 9.7 1,361 713 7.7 648 13.6 Feb. 14087 9190 4897 12913 8673 4240 8.3 1,174 517 5.6 657 13.4 Mar. (Total)
14096 (14083) 8798 5298 12382 (12667) 8114 4268 12.2 (10.1) 1,715 (1,417) 684 7.8 1030 19.4
Mar. (Early)
13891 8884 5007 12872 8482 4390 7.3 1,019 402 4.5 617 12.3
Mar. (Late)
14302 8697 5605 11895 7737 4158 16.8 2,407 960 11.0 1,447 25.8
April 14150 8827 5323 11991 7826 4165 15.3 2,159 1,001 11.3 1,158 21.8 May 14128 8815 5313 12038 7908 4130 14.8 2,090 907 10.3 1,183 22.3 June 14106 (14128) 8838 5268 12058 (12029) 7934 4124 14.5 (14.9) 2,048 (2,099) 904 10.2 1,144 21.7 July 14251 8820 5431 12465 8013 4452 12.5 1,786 807 9.1 979 18.0 Aug. 14356 8919 5437 12376 8151 4225 13.8 1,980 768 8.6 1,212 22.3 Sep. 14148 (14252) 8723 5425 12320 (12387) 7991 4329 12.9 (13.1) 1,828 (1,865) 732 8.4 1,096 20.2 Oct. 14158 8750 5408 12348 7960 4388 12.8 1,810 790 9.0 1,020 18.9 Nov. 14119 8877 5242 12439 8098 4341 11.9 1,680 779 8.8 901 17.2 Dec. 14373 (14217) 8948 5425 12649 (12479) 8151 4498 12.0 (12.2) 1,724 (1,738) 797 8.9 927 17.1 2021 Jan. 14355 8889 5466 12675 8197 4478 11.7 1,680 692 7.8 988 18.1
Feb. 14633 9112 5521 12703 8322 4381 13.2 1,930 790 8.7 1,140 20.6 March 14388 (14459) 9073 5315 12749 (12709) 8405 4344 11.4 (12.1) 1,639 (1,750) 668 7.4 971 18.3 April 14598 9127 5471 13291 8534 4757 9.0 1,307 593 6.5 714 13.0 May 14562 9237 5325 13069 8679 4390 10.2 1,493 558 6.0 935 17.6 June 14768 (14643) 9396 5372 13374 (13245) 8826 4548 9.4 (9.5) 1,394 (1,398) 570 6.1 824 15.3 July 14620 9384 5236 13198 8765 4433 9.7 1,422 619 6.6 803 15.3 Aug. 14403 9146 5257 13041 8654 4387 9.5 1,362 492 5.4 870 16.5 Sep. 14573 (14532) 9178 5395 13308 (13182) 8648 4660 8.7 (9.3) 1,265 (1,350) 530 5.8 735 13.6 Oct. Nov. Dec. 2022 Jan. Feb. March April May June July Aug. Sep. Oct.
Average calculated for previous three months.