

Australian Cerebral Palsy Register Report 2009
52
Australian Cerebral Palsy Register Report 2009 Birth Years 1993-2003 www.CPInstitute.com.au https://secure.cpregister-aus.com.au
Transcript of Australian Cerebral Palsy Register Report 2009

Australian Cerebral Palsy Register
Report 2009Birth Years 1993-2003
www.CPInstitute.com.auhttps://secure.cpregister-aus.com.au

The Australian Cerebral Palsy Register Group consists of representatives from each state and territory register.
Australian Capital TerritoryRebecca Kippen
New South Wales Nadia Badawi, Shona Goldsmith, Sarah McIntyre, Iona Novak, Paul Novak, Hayley Smithers-Sheedy, Katherine Swinburn
Northern Territory Keith Edwards, Carmen Ewens, Cheryl Ingham
QueenslandMichael deLacy, Christalla Louca
South AustraliaCatherine Gibson, Eric Haan, Rosie Rice, Heather Scott, Phillipa van Essen
TasmaniaJulie Bunyard, Peter Flett, Alison Venn
VictoriaAnna Lanigan, Tess Lionti, Dinah Reddihough, Sue Reid
Western AustraliaEve Blair, Jan De Groot, Noula Gibson, Sarah Love, Linda Watson
Recommended Citation: ACPR Group, Report of the Australian Cerebral Palsy Register, Birth Years 1993-2003, Dec 2009.
AUTHORS
Australian Cerebral Palsy Register Report | 2009

The ACPR group would like to sincerely thank all the families and health professionals who are involved in this Australia wide effort. The ACPR Group is committed to collect the most accurate and complete data possible in order to monitor cerebral palsy in Australia, identify causal pathways, and evaluate prevention and management strategies for the benefit of those with cerebral palsy and their families.
The ACPR Group would like to both acknowledge and thank Shelly Healey at The Spastic Centre for the design of this report. The ACPR Group would also like to thank Hayley Smithers-Sheedy, Research Officer for the ACPR, particularly for her integral role in the development and completion of this report.
The Australian Cerebral Palsy Register (ACPR) is hosted at the Cerebral Palsy Institute in Sydney. The Cerebral Palsy Institute is grateful to the Cerebral Palsy Foundation for its ongoing financial support of the ACPR. Sincere thanks also to the team at Hostworks for their on-going support of the ACPR and for their professionalism and efficiency.
The staff at the Cerebral Palsy Institute would like to thank all members of the ACPR Policy Group for their expertise, time and commitment shown over the last twelve months while uploading
data, attending meetings, participating in working groups and writing this report. The ACPR exists as a result of collaborative partnerships between all the Australian state and territory cerebral palsy registers, and the organisations which support each register. The contributing registers and their organisations are as follows:
• Australian Capital Territory and New South Wales Cerebral Palsy Register - Cerebral Palsy Institute, The Spastic Centre of NSW, The Australian National University
• Northern Territory Cerebral Palsy Register - Department of Health and Families
• Queensland Cerebral Palsy Register - Cerebral Palsy League of Queensland
• The South Australian Cerebral Palsy Register - Children, Youth and Women’s Health Service
• Tasmanian Cerebral Palsy Register - Menzies Research Institute
• Victorian Cerebral Palsy Register - Murdoch Children’s Research Institute, Royal Children’s Hospital, Melbourne
• Western Australia Cerebral Palsy Register - Telethon Institute for Child Health Research.
ACKNOWLEDGEMENTS
Australian Cerebral Palsy Register Report | 2009

If you look up ‘cerebral palsy register’ on PubMed, as I did, you will discover that the first entry is the 1981 paper of Fiona Stanley, from Western Australia. In the following year came a paper from Fiona and Eve Blair, and thereafter others from Western Australia, the UK, and then - as the value of cerebral palsy registers became more generally understood - from a variety of other countries and regions. Now we see the happy development of the Australian CP Register, incorporating information from the whole of Australia.
What are cerebral palsy registers good for? Descriptive epidemiology, with information on prevalence and changes in prevalence over time, and in different regions (metropolitan and rural WA, e.g.), and for studies of natural history. Analytic epidemiology, with studies of etiology and, in the future, studies of interventions, preventive and therapeutic.
The original registry founded by Fiona, joined by Eve and others, has already contributed hugely to our knowledge that the old assumptions needed revising, that acute asphyxial incidents were more common in the births of babies with later-recognized CP than in other infants, but did not account for most CP. Papers from the WA registry, and subsequently registries in other states, notably from Victoria and
South Australia, have used analytic epidemiology in combination with other methodologies, to teach the world more about what really does cause CP. The first controlled and population-based study of Neonatal Encephalopathy, a hugely important pathway to CP that remains - still, to this day - amazingly under-researched, came from WA; relating encephalopathy in the term neonate to long-term outcome depended on the use of registry data.
With the coming-together of data on CP from all the states of Australia, the All-Australia CP Registry will be a magnificent resource for the future, largely eliminating the need for expensive and potentially biased clinical follow-up studies. With the advent of computerized medical record systems - on maternal, pregnancy and birth histories, placental findings, genetic data, etc. - the registry will make it possible to connect the dots in ways they have not been connected before, enabling new research that can tackle questions that no single institution or plausible collaboration has yet touched. Congratulations to those who have worked so hard to accomplish this.
Professor Karin Nelson
FOREWORD
Karin B. Nelson, MD is a child neurologist, scientist emeritus at the US National Institute of Neurological Disorders and Stroke and works part-time at the Children’s Hospital National Medical Centre, Washington DC.
Australian Cerebral Palsy Register Report | 2009

Fact Sheet for Consumers and Media
What is cerebral palsy?Cerebral palsy is a life-long physical disability due to damage of the developing brain. Movement and posture are affected. It shows itself first in early childhood.
For 94% of people with cerebral palsy, the brain injury occurs before 1 month of age.
The most common presentation of cerebral palsy is known as spastic hemiplegia, where one half of the body has difficulty with voluntary movement. Approximately 40% have hemiplegia.
How common is cerebral palsy?Cerebral palsy is the most common physical disability in childhood affecting approximately one in 500 children. A child is born with cerebral palsy every 15 hours.
In 13 out of every 14 cases in Australia the brain injury leading to cerebral palsy occurs either in the uterus or before 1 month of age. Another 1 in 14 children acquire cerebral palsy after 1 month of age.
What are the causes?At present the cause is not well understood for most children who acquire cerebral palsy before 1 month of age.
Stroke is the most common cause in children who acquire cerebral palsy
after 1 month of age. Stroke can occur spontaneously or arise from surgical or heart complications.
What are the effects?Spasticity is the term used to describe the very tight muscles that are a problem in 86% of children with cerebral palsy. Spasticity makes movement more difficult and sometimes painful.
Over 28% of Australian children with cerebral palsy cannot walk. Another, 11% require a walking frame or sticks to walk.
Children with cerebral palsy are likely to also have other impairments in addition to their motor disability. 60% have a speech impairment; 45% have an intellectual impairment; 31% have epilepsy; 37% have a vision impairment and 12% have a hearing impairment.
The rate of birth defects (congenital abnormalities) is at least 5 times higher in children with cerebral palsy than the general population. Between 20% and 40% have a birth defect.
Who is at greater risk?
1. Males Males are at greater risk of having cerebral palsy.
2. Premature babies Prematurity is associated with higher rates of cerebral palsy.
42% of children with cerebral palsy are born prematurely, compared to 8% of the Australian population.
3. Small babies Low birth weight is associated with higher rates of cerebral palsy. This may be a result of prematurity or slow intrauterine growth.
43% of children with cerebral palsy had low birth weight, compared to just over 6% of the Australian population.
4. Twins, triplets and higher multiple births. Multiple births are associated with higher rates of cerebral palsy.
11% of children with cerebral palsy were from a multiple birth, whereas the rates of multiple births are only 1.7% in the Australian population.
The Australian Cerebral Palsy RegisterThe Australian Cerebral Palsy Register is a major tool that will help identify causes of cerebral palsy and look at the effectiveness of current and future interventions aimed at treatment or prevention.
AUSTRALIAN CEREBRAL PALSY REGISTER REPORT PLAIN ENGLISH FACT SHEET
Australian Cerebral Palsy Register Report | 2009

The Australian Cerebral Palsy Register (ACPR) is a research database to facilitate the study of: the distribution, frequency and severity of cerebral palsy; the causes and determinants of cerebral palsy; the effectiveness of prevention strategies; and to help plan and evaluate services. The data stored in the database is de-identified and is securely uploaded from each state and territory cerebral palsy register in Australia. This is the inaugural report of combined state dataset. The data pertains to birth years 1993-2003. For this report, data was uploaded to the ACPR database in August 2009. Any cases notified to state/territory registers after this date are not included in this report.
Data ascertainment varies between states, reflecting differences in both the time of establishment and the governance of each register. Three states of Australia - Western Australia, Victoria and South Australia have long established cerebral palsy registers. They are considered ‘population registers’ as they have registered all (or very nearly all) eligible persons. All these registers report cerebral palsy rates exceeding 1.5/1000 live births per year. The population registers’ data have been combined in this report for the first time. For data integrity, if there were fields from these registers in which more than 20% was missing/unknown, the data was not combined. Cerebral palsy registries have been established more recently in the Australian Capital Territory, New South Wales, Northern Territory, Queensland and Tasmania. Pleasingly the numbers of persons ascertained is increasing rapidly in these states and territories, but they
cannot yet be considered to represent population registers. Data from these states and territories are not combined with the population registers and are presented throughout the report in tables only.
From the data of the 3 established population registers there were a total of 2391 individuals with cerebral palsy; an Australian cerebral palsy prevalence of 2.0/1000 live births (95%CI 1.9-2.1). For 5.3% their brain injury was acquired during a recognised event occurring more than 28 days after birth. For the remaining 94.7%, the brain injury responsible for cerebral palsy is believed to have occurred during the prenatal and perinatal period of infant development and the prevalence of this group was 1.9/1000 (95%CI 1.8-2.0).
The following key findings pertain to this latter cohort of pre and perinatally acquired cerebral palsy born 1993-2003 inclusive, excluding the 5.3% post neonatally acquired.
The cause of brain injury is not well understood for the great majority (97.7%) of these infants but up to 37% also had an identified birth defect suggesting some anomaly in prenatal development. There was an excess of males (56.4%) compared to the Australian birth population in which 51.5% were male. Aboriginal and or Torres Strait Islander mothers were over represented with 3.4% compared to 0.9% in the three combined states.
Compared with the Australian birth population in which 7.9% were born before 37 weeks gestation (premature), 41.5% of this cerebral palsy cohort
were born premature. In the general population, the rate of premature birth is slowly rising over time and survival following birth after very short gestations is also increasing in developed countries. This is a concern because the risk of cerebral palsy increases exponentially with increasing prematurity. Similarly, compared with the Australian birth population in which 6.3% are born with weights below 2500g (low birth weight), 42.5% of infants with cerebral palsy were born with a low birth weight. Prematurity and low birth weight are associated with multiple births; 11% of this cerebral palsy cohort were part of a multiple birth compared with 1.7% of the Australian birth population.
Spasticity was the predominant motor type of cerebral palsy (85%) with unilateral spasticity (hemiplegia/monoplegia) making up 38% and bilateral spasticity (diplegia, triplegia and quadriplegia) predominant with 62%. Associated impairments occurred frequently in children with cerebral palsy: 30% had epilepsy; 45% an intellectual impairment; 60% a speech impairment; 37% a vision impairment and 12% had a hearing impairment with 50% having more than one associated impairment.
Based on 127 individuals, the prevalence of post-neonatally acquired cerebral palsy was estimated to be 1.08/10,000 live births. The predominant post-neonatal cause was a cerebro-vascular accident (35%) being either spontaneous, associated with surgery or with complications of cardiac defects.
EXECUTIVE SUMMARY
Australian Cerebral Palsy Register Report | 2009


About cerebral palsy .............................................................................................................................................. 10
What is the Australian Cerebral Palsy Register (ACPR)? ................................................................................... 11
Aims of the ACPR ................................................................................................................................................... 12 Ethics ...................................................................................................................................................................... 12 Current projects ...................................................................................................................................................... 12
Methods .................................................................................................................................................................... 13 Cohort ..................................................................................................................................................................... 13 Inclusion/exclusion criteria ...................................................................................................................................... 13 Denominator data ................................................................................................................................................... 13 Eligibility criteria for combining datasets ................................................................................................................ 13 Results .................................................................................................................................................................... 13
Results Results Part 1: All cerebral palsy cases ................................................................................................................ 15Number and percentage pre/perinatally acquired vs postneonatally acquired cases ............................................... 16Results Part 2: Pre/perinatally acquired cerebral palsy ..................................................................................... 17Cohort of cases of cerebral palsy .............................................................................................................................. 19Prevalence................................................................................................................................................................. 20Sex ............................................................................................................................................................................ 22Maternal age at time of delivery ................................................................................................................................ 23 Maternal country of birth ............................................................................................................................................ 24Indigenous status of mother ..................................................................................................................................... 25Gestational age at delivery ........................................................................................................................................ 26 Birth weight ................................................................................................................................................................ 27 Plurality ...................................................................................................................................................................... 28 Assisted conception................................................................................................................................................... 29Pre/perinatal causes of cerebral palsy ...................................................................................................................... 30Predominant motor type ............................................................................................................................................ 31Topographical pattern of spasticity ............................................................................................................................ 32Gross motor function ................................................................................................................................................. 33Birth defects............................................................................................................................................................... 34Associated disorders or impairments at 5 years of age............................................................................................. 35 Vision ...................................................................................................................................................................... 35 Hearing ................................................................................................................................................................... 36 Speech ................................................................................................................................................................... 37 Epilepsy .................................................................................................................................................................. 38 Intellectual impairment ............................................................................................................................................ 39Results Part 3: Post-neonatally acquired cerebral palsy .................................................................................... 40Prevalence................................................................................................................................................................. 41Cases by identified post-neonatal cause ................................................................................................................... 42
References ............................................................................................................................................................... 43
Appendices .............................................................................................................................................................. 44 Appendix A Information and contact details of the contributing state and territory cerebral palsy registers ............ 44Appendix B Gross Motor Function Classification System descriptors and illustrations 6-12 years ......................... 47Appendix C References generated by contributing state and territory cerebral palsy registers .............................. 48
INDEX
Australian Cerebral Palsy Register Report | 2009
ABOUT CEREBRAL PALSY
Cerebral palsy is the most common physical disability in childhood. Cerebral palsy occurs at a rate of 2-2.5 per 1000 live births in developed countries [1, 2].
There has been considerable debate in recent times as to how to best define cerebral palsy [3]. Both internationally and in Australia, cerebral palsy registers have drawn on a range of references and perspectives when considering the best definition [4]. The ACPR has adopted the approach used by the Surveillance of cerebral palsy in Europe [5], allowing the use of any definition that includes the following five key elements, common to the definitions published by Bax [6], Rosenbaum [3] and Mutch [7].
Cerebral palsy: 1 is an umbrella term for a group of disorders;
2 is a condition that is permanent but not unchanging;
3 involves a disorder of movement and/ or posture and of motor function; 4 is due to a non-progressive interference, lesion, or abnormality; and 5 the interference, lesion, or abnormality originates in the immature brain [5].
For the majority of individuals with cerebral palsy the cause is not well understood. Cerebral palsy is associated with numerous perinatal factors e.g., rubella or cytomegalovirus infections, preterm birth, intrauterine growth restriction, perinatal asphyxia and multiple pregnancy and with post-neonatal factors such as head trauma or cerebral infections [8].
Motor disability ranges from minimal to profound, and the risks of epilepsy and intellectual, speech, visual, hearing, and gastro-intestinal impairments increase as motor impairment increases, which can greatly contribute
to overall disability [9].
Care is costly, particularly for those with multiple associated disabilities and the expenditure for cerebral palsy care has been estimated at an average of $43,431 per person p.a. of which approximately 37% is borne by the individual and/or their family [9]. When a value for lost well-being is included, this cost estimate increases to $115,000 per person p.a. [9]. It is estimated that 34,000 people are living with cerebral palsy in Australia with an estimated expenditure of $1.47 billion per year [9]. It is expected that this number of people with cerebral palsy will increase to 47,601 by 2050 as the population increases and life expectancies of those with cerebral palsy increase.
There is no specific pre-birth test for cerebral palsy and there is no cure, therefore it is a life long disability.
10 Australian Cerebral Palsy Register Report | 2009

WHAT IS THE AUSTRALIAN CEREBRAL PALSY REGISTER?
The ACPR is an electronic database of data uploaded from the cerebral palsy registers in each state and territory of Australia, from which client identifiers have been removed and replaced by a unique code in order to ensure privacy of data.
The ACPR exists as a result of collaborative partnerships between all the Australian state and territory cerebral palsy registers, and the organisations which support each register. The contributing registers and their organisations are as follows:
• Australian Capital Territory (ACT) and New South Wales Cerebral Palsy Register (NSW) - Cerebral Palsy Institute, The Spastic Centre of NSW
• Northern Territory (NT) Cerebral Palsy Register - Department of Health and Families
• Queensland (QLD) Cerebral Palsy Register - Cerebral Palsy League of Queensland
• The South Australian (SA) Cerebral Palsy Register - Children, Youth and Women’s Health Service
• Tasmanian (TAS) Cerebral Palsy Register - Menzies Research Institute
• Victorian (VIC) Cerebral Palsy Register - Murdoch Children’s Research Institute, Royal Children’s Hospital, Melbourne
• Western Australia (WA) Cerebral Palsy Register - Telethon Institute for Child Health Research
A map showing the states and territories and the percentage of total population has been provided below. Australia has a total population of approximately 22 million people [10] with the bulk of the population living along the eastern seaboard. For a more detailed description of each of the state and territory cerebral palsy registers, including contact details, please see Appendix A.
Figure 1: Population proportions for the states and territories of Australia [10]
WA: 10.2%
NT: 1%
QLD: 20.1%
SA: 7.4%
NSW: 32.5%
ACT: 1.6%
VIC: 24.8%
TAS: 2.3%
Australian Cerebral Palsy Register Report | 2009 11
The overarching vision for the ACPR, is that the register should exist to assist in efforts to both reduce the incidence of cerebral palsy and significantly enhance the quality of life of those living with cerebral palsy.
Specifically, the aim of the ACPR is to be a source of data that will support research relating to:
a) monitoring of cerebral palsy
b) identifying interventions that effectively improve quality of life
c) identifying causal pathways to enable prevention
d) evaluation of future prevention strategies
The ACPR Research and Policy Group includes a representative from each state and territory cerebral palsy register. This group is able to provide consultation to researchers who are seeking advice regarding cerebral palsy research and accessing identified and non-identified cerebral palsy register data within Australia. For further information, please contact: [email protected]
EthicsContribution of data to the ACPR has been approved by the relevant Human Research Ethics Committee (HREC) overseeing each state and territory register. Additionally, both the management of ACPR data and the activities of, and work related to, the ACPR is reviewed regularly by a National Health and Medical Research Council (NH&MRC) approved HREC.
The Cerebral Palsy Institute (CPI) is the custodian organisation for the ACPR. Both the CPI and the ACPR are funded by the Cerebral Palsy Foundation which is a wholly owned company of The Spastic Centre of NSW.
Current projectsIn addition to their state and territory register responsibilities, ACPR Policy Group members have worked, and continue to work, with their international colleagues on a number of projects including the:
• Development of the Report of the international survey of cerebral palsy registers and surveillance systems, 2009 which is available at: http://www.cpinstitute.com.au publications/index.html
• Hosting of the World Register Congress as part of the International Cerebral Palsy Conference in Sydney 2009.
This congress provided researchers and clinicians from around the world with a dedicated period of time at this event to present the latest available cerebral palsy surveillance data, share information and discuss register and surveillance issues. A summary document of the discussion forum has been prepared and can be requested by contacting: [email protected]
• Development of the Intersect Forum site as a place where clinicians and researchers involved in registers
and surveillance can pose questions and share both information and their expertise with others. Membership is free and available to any interested parties. For further information please access the website http://intersect.cpinstitute.org.au
The work of cerebral palsy registers in Australia has added to our understanding of cerebral palsy and contributed significantly to research in this field. Please see Appendix C for a list of publications that have been generated by state cerebral palsy registers in Australia.
12 Australian Cerebral Palsy Register Report | 2009
AIMS OF THE ACPR

METHODS
CohortThe cohort selected for this report was the birth years 1993-2003. In order to ensure that duplicate cases were not included in the dataset, each state and territory group contributed cases that were born in their state or territory within this time frame. A de-duplication algorithm designed to highlight potential duplicates was also run as a further measure to avoid reporting duplicate records. Cases born outside of Australia but currently living in Australia were not included in this report, but it is intended that these cases will be included in future reports.
Inclusion/exclusion criteria In order to be included in the dataset, a case must fulfil the criteria contained in the five definitional elements [5] as outlined above. Where a case has met these criteria and there is evidence of a chromosomal anomaly, genetic syndrome or metabolic disease the principles provided by Badawi et al [11]
were used by contributing registers to guide decisions regarding whether the case should be included.
Contributing registers consider cases to be confirmed when the individual reaches 5 years of age. In the event that new information becomes available a case entry may be updated, included or excluded at any time.
Denominator dataData on live births for the years 1993-2003 (the denominator) was obtained from a variety of sources including the Australian Institute of Health and Welfare - Consultative Council on Obstetric and Paediatric Mortality and Morbidity Annual Reports, the Australian Bureau of Statistics and Annual Reports of the Pregnancy Outcome Unit (SA).
Eligibility criteria for combining datasetsThere is considerable variation across each state and territory in relation to the level of ascertainment of cases achieved for each year in the 1993-2003 period. This is due to a number of factors, including significant variation in the length of time registers have been in existence (see description of cerebral palsy registers in the Appendix A), and also reflects differences in registrant consent requirements across the states and territories.
Where a prevalence of at least 1.5/1000 live births across the cohort period has been established (see Figure 3, page 18) by a state or territory, data have been combined where appropriate and reported in comparison charts. State or territory cohort data that do not meet this criterion have been included in data tables only. Where more than 20% of data are missing or unknown, these data have been included in data tables only.
Results The results of this report have been divided into three sections. Part 1 refers to all cerebral palsy cases, Part 2 refers to cerebral palsy arising from an injury to the developing brain during the pre/perinatal period (throughout pregnancy and the first 28 completed days after birth) and Part 3 refers to all cerebral palsy cases where a known post-neonatal (occurring after 28 days of life and before 2 years of age) cause has been identified [12]. The results have been presented in this format as the majority of pre/perinatal causes of cerebral palsy are unknown, whereas the likely cause has been identified in post-neonatally acquired cases.
The ACPR began collecting Manual Ability Classification System (MACS) data in recent years, and as such data is limited and has not been included in this report. It is expected that data pertaining to this classification scale will be provided in future ACPR reports.
Australian Cerebral Palsy Register Report | 2009 13

RESULTS Part 1: All cerebral palsy cases

Table 1. Pre/perinatally and post-neonatally acquired cerebral palsy (CP) by state/territory of birth (1993-2003).
Live births(1993-2003)
n
Pre/perinatally acquired CP
n (%)
Post-neonatally acquired CP
n (%)
TOTAL n
Prevalence (per 1000 live births)
All CP cases
ACT 46372 42 (85.7) 7 (14.3) 49 -
NSW 955471 570 (91.6) 52 (8.4) 622 -
NT 40383 * (100.0) * (0.0) 2 -
QLD 518563 137 (93.8) 9 (6.2) 146 -
SA 204204 367 (96.6) 13 (3.4) 380 1.9 (95% CI 1.7-2.1)
TAS 67747 38 (97.4) * (2.6) 39 -
VIC 689802 1195 (95.4) 58(4.6) 1253 1.8 (95% CI 1.7-1.9)
WA 276318 702 (92.6) 56 (7.4) 758 2.7 (95% CI 2.5-2.9)
TOTAL 3053 196 3249
COMBINEDSA, VIC, WA 1,170,324 2264 (94.7) 127 (5.3) 2391 2.0 (95% CI 1.9, 2.1)
* < 5 cases
For this first report of the ACPR, data pertaining to 3249 individuals with cerebral palsy are reported. In this cohort the total prevalence for cerebral palsy, is 2.0 per 1000 live births (95% CI 1.9-2.1)
Figure 2. Percentages of pre/perinatally and post-neonatally acquired cerebral palsy by state of birth (1993-2003).
% cases within each state
Pre/perinatally acquired cerebral palsy Postneonatally acquired cerebral palsy
10090
80
70
60
50
SA VIC WA COMBINED
40
30
20
10
0
In this cohort the combined data indicate that the brain injury responsible for cerebral palsy primarily arises during the pre/perinatal period (94.7%). For a small group (5.3%) the brain injury occurred post-neonatally.
16 Australian Cerebral Palsy Register Report | 2009
RESULTS Part 2: Prenatally or perinatally acquired cerebral palsy cases
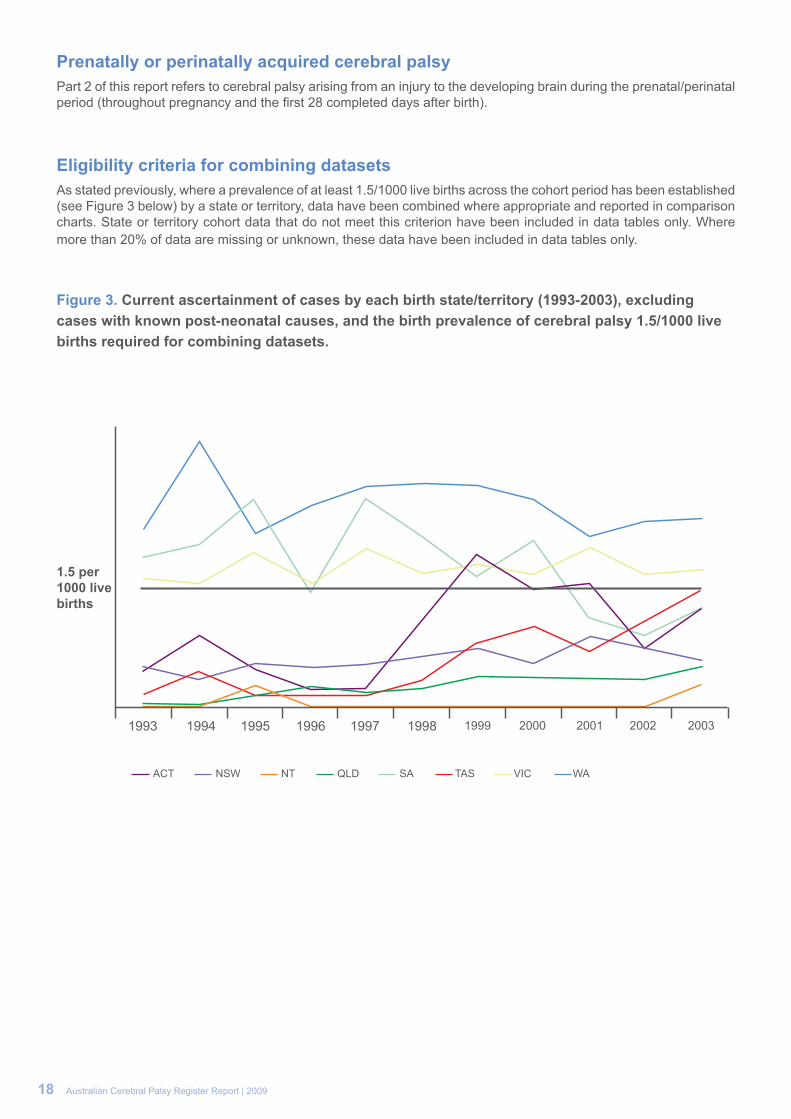
Prenatally or perinatally acquired cerebral palsyPart 2 of this report refers to cerebral palsy arising from an injury to the developing brain during the prenatal/perinatal period (throughout pregnancy and the first 28 completed days after birth).
Eligibility criteria for combining datasetsAs stated previously, where a prevalence of at least 1.5/1000 live births across the cohort period has been established (see Figure 3 below) by a state or territory, data have been combined where appropriate and reported in comparison charts. State or territory cohort data that do not meet this criterion have been included in data tables only. Where more than 20% of data are missing or unknown, these data have been included in data tables only.
Figure 3. Current ascertainment of cases by each birth state/territory (1993-2003), excluding cases with known post-neonatal causes, and the birth prevalence of cerebral palsy 1.5/1000 live births required for combining datasets.
1993 1994 1995 1996 1997 1998 1999 2000 2001 2002 2003
1.5 per 1000 live births
ACT NSW NT QLD SA TAS VIC WA
18 Australian Cerebral Palsy Register Report | 2009
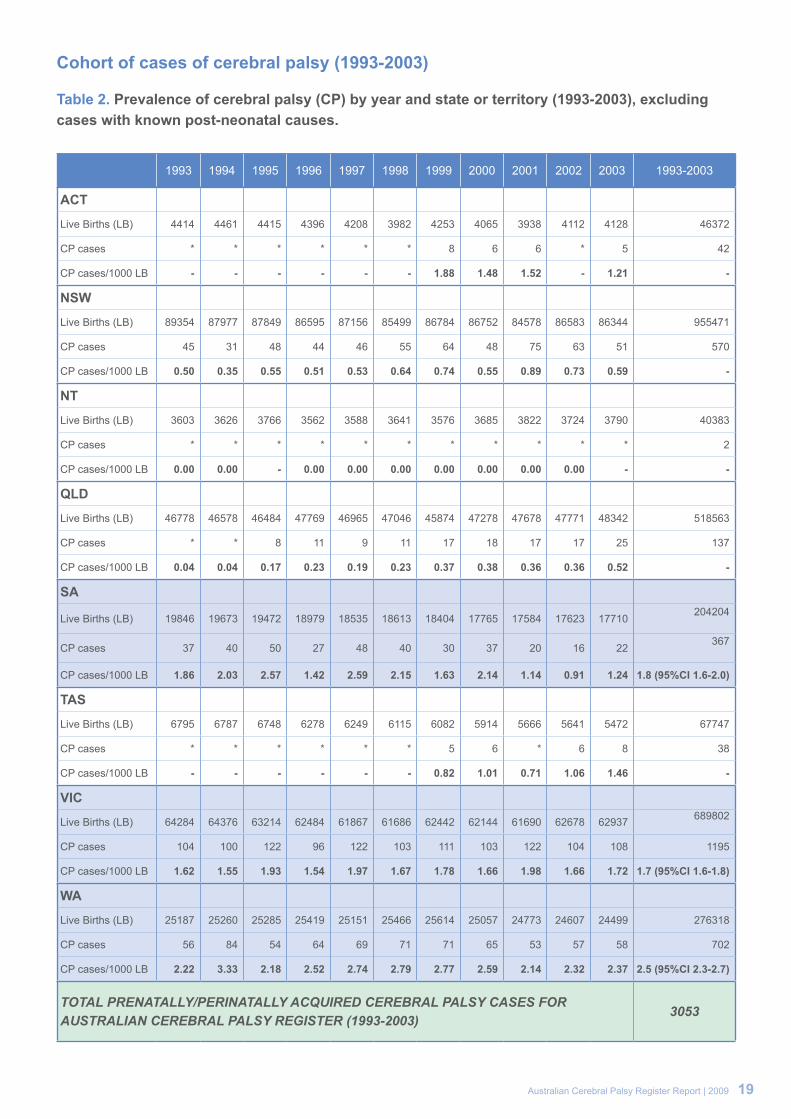
Cohort of cases of cerebral palsy (1993-2003)
Table 2. Prevalence of cerebral palsy (CP) by year and state or territory (1993-2003), excluding cases with known post-neonatal causes.
1993 1994 1995 1996 1997 1998 1999 2000 2001 2002 2003 1993-2003
ACT
Live Births (LB) 4414 4461 4415 4396 4208 3982 4253 4065 3938 4112 4128 46372
CP cases * * * * * * 8 6 6 * 5 42
CP cases/1000 LB - - - - - - 1.88 1.48 1.52 - 1.21 -
NSW
Live Births (LB) 89354 87977 87849 86595 87156 85499 86784 86752 84578 86583 86344 955471
CP cases 45 31 48 44 46 55 64 48 75 63 51 570
CP cases/1000 LB 0.50 0.35 0.55 0.51 0.53 0.64 0.74 0.55 0.89 0.73 0.59 -
NT
Live Births (LB) 3603 3626 3766 3562 3588 3641 3576 3685 3822 3724 3790 40383
CP cases * * * * * * * * * * * 2
CP cases/1000 LB 0.00 0.00 - 0.00 0.00 0.00 0.00 0.00 0.00 0.00 - -
QLD
Live Births (LB) 46778 46578 46484 47769 46965 47046 45874 47278 47678 47771 48342 518563
CP cases * * 8 11 9 11 17 18 17 17 25 137
CP cases/1000 LB 0.04 0.04 0.17 0.23 0.19 0.23 0.37 0.38 0.36 0.36 0.52 -
SA
Live Births (LB) 19846 19673 19472 18979 18535 18613 18404 17765 17584 17623 17710 204204
CP cases 37 40 50 27 48 40 30 37 20 16 22 367
CP cases/1000 LB 1.86 2.03 2.57 1.42 2.59 2.15 1.63 2.14 1.14 0.91 1.24 1.8 (95%CI 1.6-2.0)
TAS
Live Births (LB) 6795 6787 6748 6278 6249 6115 6082 5914 5666 5641 5472 67747
CP cases * * * * * * 5 6 * 6 8 38
CP cases/1000 LB - - - - - - 0.82 1.01 0.71 1.06 1.46 -
VIC
Live Births (LB) 64284 64376 63214 62484 61867 61686 62442 62144 61690 62678 62937 689802
CP cases 104 100 122 96 122 103 111 103 122 104 108 1195
CP cases/1000 LB 1.62 1.55 1.93 1.54 1.97 1.67 1.78 1.66 1.98 1.66 1.72 1.7 (95%CI 1.6-1.8)
WA
Live Births (LB) 25187 25260 25285 25419 25151 25466 25614 25057 24773 24607 24499 276318
CP cases 56 84 54 64 69 71 71 65 53 57 58 702
CP cases/1000 LB 2.22 3.33 2.18 2.52 2.74 2.79 2.77 2.59 2.14 2.32 2.37 2.5 (95%CI 2.3-2.7)
TOTAL PRENATALLY/PERINATALLY ACQUIRED CEREBRAL PALSY CASES FOR AUSTRALIAN CEREBRAL PALSY REGISTER (1993-2003)
3053
Australian Cerebral Palsy Register Report | 2009 19

Birth prevalence of cerebral palsy (excluding cases with known post-neonatal causes)
Figure 4. Birth prevalence of cerebral palsy per 1000 live births (LB) by state and year of birth (1993-2003), excluding cases with known post-neonatal causes.
19930.0
0.5
1.0
1.5
2.0
2.5
3.0
3.5
1994 1995 1996 1997 1998 1999 2000 2001 2002 2003
SA VIC WA
cases per 1000 LB
Year
Figure 5. Total prevalence (95% confidence intervals) of cerebral palsy per 1000 live births by state (1993-2003), excluding cases with known post-neonatal causes.
0.0
0.5
1.0
1.5
2.0
2.5
3.0
3.5
SA VIC WA TOTAL
20 Australian Cerebral Palsy Register Report | 2009

Table 3. Total prevalence of cerebral palsy (CP) per 1000 live births by state (1993 - 2003), excluding cases with known post-neonatal causes.
CP CASES LIVE BIRTHS PREVALENCE
SA 367 204204 1.8 (95%CI 1.6-2.0)
VIC 1195 689802 1.7 (95%CI 1.6-1.8)
WA 702 276318 2.5 (95% CI 2.3-2.7)
COMBINED TOTAL 2265 1170324 1.9 (95% CI 1.8-2.0)
In this cohort the total birth prevalence for cerebral palsy, excluding cases where a post-neonatal cause has been identified, is 1.9 per 1000 live births (95% CI 1.8-2.0).
Australian Cerebral Palsy Register Report | 2009 21

Sex
Table 4. Number and percentage of cerebral palsy cases by sex and state/territory of birth (1993-2003), excluding cases with known post-neonatal causes.
Female n (%)
Malen (%)
TOTAL n
ACT 12 (28.6) 30 (71.4) 42
NSW 223(39.0) 347(61.0) 570
NT * (100.0) *
QLD 60 (43.8) 77 (56.2) 137
SA 159 (43.3) 208 (56.7) 367
TAS 10 (26.3) 28 (73.7) 38
VIC 510 (42.7) 685 (57.3) 1195
WA 318 (45.2) 384 (54.8) 702
TOTAL 1291 1761 3053
COMBINEDSA, VIC, WA 987 (43.6) 1277 (56.4) 2264
* < 5 cases
Figure 6. Percentages of cerebral palsy cases by sex and state/territory of birth (1993-2003), excluding cases with known post-neonatal causes.
% of cases within
state of birth
State Female Male
70
60
50
SA VIC WA COMBINED
40
30
20
10
0
In this cohort the combined data demonstrate that males are at a higher risk of developing cerebral palsy. 56.4% of the cohort were male compared to the Australian population where 51.5% of all births were male [13]
22 Australian Cerebral Palsy Register Report | 2009
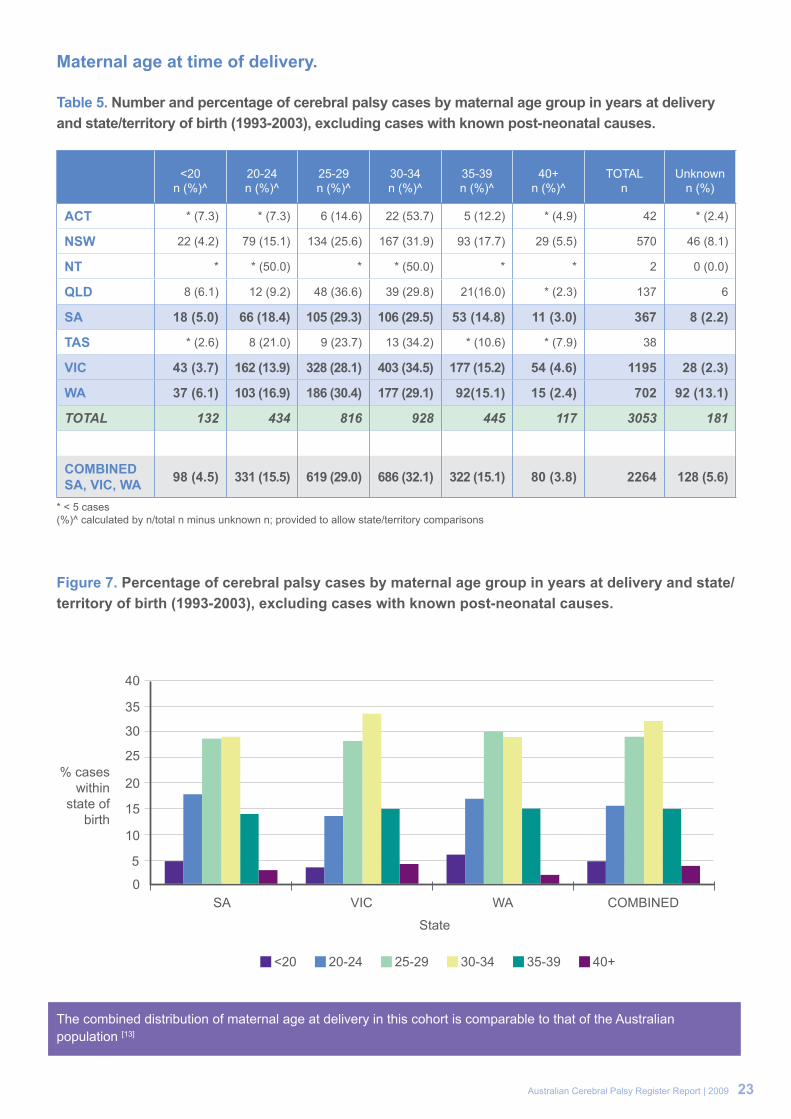
Maternal age at time of delivery.
Table 5. Number and percentage of cerebral palsy cases by maternal age group in years at delivery and state/territory of birth (1993-2003), excluding cases with known post-neonatal causes.
<20n (%)^
20-24n (%)^
25-29n (%)^
30-34n (%)^
35-39n (%)^
40+n (%)^
TOTALn
Unknownn (%)
ACT * (7.3) * (7.3) 6 (14.6) 22 (53.7) 5 (12.2) * (4.9) 42 * (2.4)
NSW 22 (4.2) 79 (15.1) 134 (25.6) 167 (31.9) 93 (17.7) 29 (5.5) 570 46 (8.1)
NT * * (50.0) * * (50.0) * * 2 0 (0.0)
QLD 8 (6.1) 12 (9.2) 48 (36.6) 39 (29.8) 21(16.0) * (2.3) 137 6
SA 18 (5.0) 66 (18.4) 105 (29.3) 106 (29.5) 53 (14.8) 11 (3.0) 367 8 (2.2)
TAS * (2.6) 8 (21.0) 9 (23.7) 13 (34.2) * (10.6) * (7.9) 38
VIC 43 (3.7) 162 (13.9) 328 (28.1) 403 (34.5) 177 (15.2) 54 (4.6) 1195 28 (2.3)
WA 37 (6.1) 103 (16.9) 186 (30.4) 177 (29.1) 92(15.1) 15 (2.4) 702 92 (13.1)
TOTAL 132 434 816 928 445 117 3053 181
COMBINEDSA, VIC, WA 98 (4.5) 331 (15.5) 619 (29.0) 686 (32.1) 322 (15.1) 80 (3.8) 2264 128 (5.6)
* < 5 cases(%)^ calculated by n/total n minus unknown n; provided to allow state/territory comparisons
Figure 7. Percentage of cerebral palsy cases by maternal age group in years at delivery and state/territory of birth (1993-2003), excluding cases with known post-neonatal causes.
% cases within
state of birth
<20 20-24 25-29 30-34 35-39 40+
40
35
30
25
SA
State
VIC WA COMBINED
20
15
10
5
0
The combined distribution of maternal age at delivery in this cohort is comparable to that of the Australian population [13]
Australian Cerebral Palsy Register Report | 2009 23
Maternal country of birth
O
cean
ia a
nd
Ant
artic
an
(%)^
Nor
th
and
Wes
t E
urop
en
(%)^
Sou
ther
nan
d E
aste
rnE
urop
en
(%)^
Nor
th
Afri
ca a
nd
Mid
dle
Eas
tn
(%)^
Sou
th
Eas
t A
sia
n (%
)^
Nor
th
Eas
t A
sia
n (%
)^
Sou
ther
n an
d C
entra
l A
sia
n (%
)^
Am
eric
asn
(%)^
Sub
saha
ran
Afri
can
(%)^
TOTA
Ln
Unk
now
nn
(%)^
AC
T36
(87.
9)*
(4.9
)*
(2.4
)0
(0.0
)*
(2.4
)*
(2.4
)0
(0.0
)0
(0.0
)0
(0.0
)42
* (2
.4)
NSW
446
(82.
5)32
(5.9
)6
(1.1
)19
(3.5
)16
(3.0
)6
(1.1
)*
(0.7
)*
(0.7
)8
(1.5
)57
029
(5.1
)
NT
* (1
00.0
)0
(0.0
)0
(0.0
)0
(0.0
)0
(0.0
)0
(0.0
)0
(0.0
)0
(0.0
)0
(0.0
)2
0 (0
.0)
QLD
119
(88.
9)7
(5.2
)0
(0.0
)0
(0.0
)*
(0.7
)*
(0.7
)*
(1.5
)*
(3.0
)0
(0.0
)13
7*
(2.2
)
SA32
2 (9
5.5)
* (0.
9)* (
0.3)
* (0.
9)* (
1.2)
0 (0
.0)
* (0.
3)0
(0.0
)* (
0.9)
367
30 (8
.2)
TAS
36 (9
4.8)
* (2
.6)
0 (0
.0)
0(0.
0)0
(0.0
)0
(0.0
)0
(0.0
)0
(0.0
)*
(2.6
)38
(0.0
)
VIC
956
(80.
8)64
(5.4
)43
(3.6
)41
(3.5
)31
(2
.6)
15
(1.3
)15
(1.3
)5
(0.4
)13
(1.1
)11
9512
(1.0
)
WA
517
(80.
0)79
(1
2.2)
7 (1
.1)
6 (0
.9)
10
(1.5
)* (
0.5)
6 (0
.9)
6 (0
.9)
12 (1
.9)
702
56 (8
.0)
TOTA
L24
3318
858
6963
2628
1937
3053
132
CO
MB
INED
SA, V
IC, W
A17
95 (8
3.0)
146
(6.7
)51
(2.3
)50
(2.3
)45
(2.1
)18
(0.8
)22
(1.0
)11
(0.5
)28
(1.3
)22
64
98 (4
.3)
* <
5 ca
ses
(%)^
cal
cula
ted
by n
/tota
l n m
inus
unk
now
n n;
pro
vide
d to
allo
w s
tate
/terr
itory
com
paris
ons
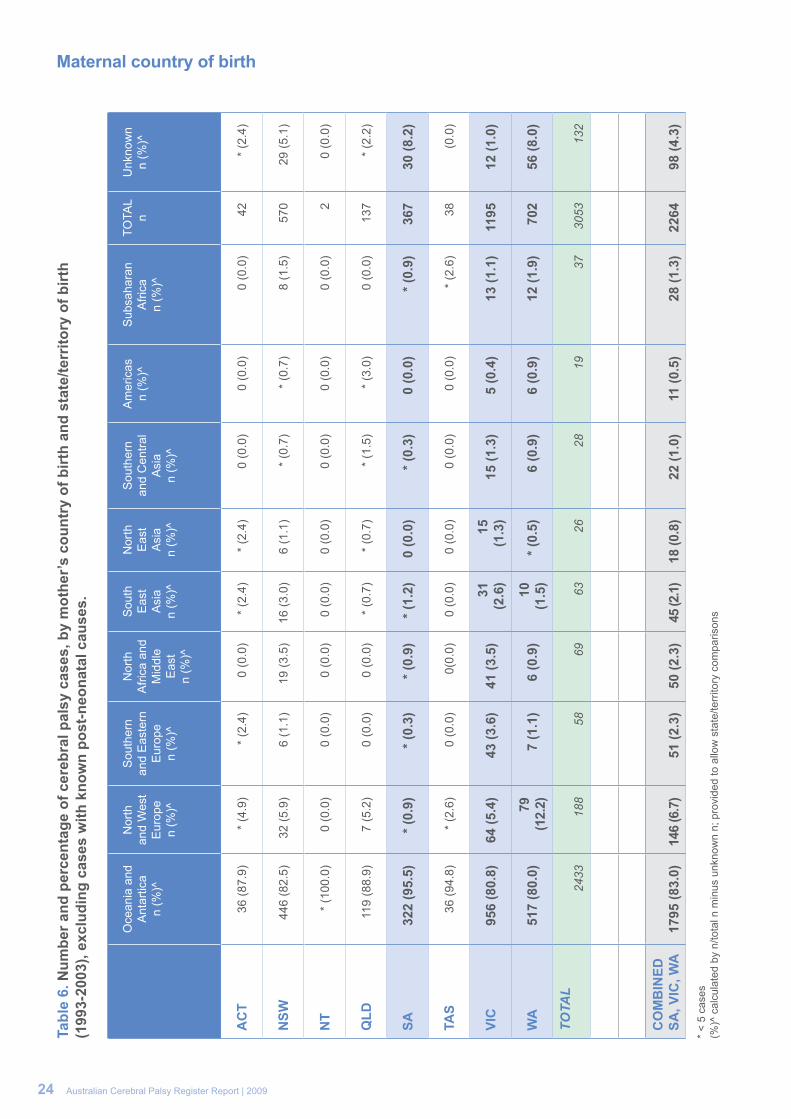
24 Australian Cerebral Palsy Register Report | 2009
Tabl
e 6.
Num
ber a
nd p
erce
ntag
e of
cer
ebra
l pal
sy c
ases
, by
mot
her’s
cou
ntry
of b
irth
and
stat
e/te
rrito
ry o
f birt
h (1
993-
2003
), ex
clud
ing
case
s w
ith k
now
n po
st-n
eona
tal c
ause
s.

Indigenous status of mother
Table 7. Number and percentage of cerebral palsy cases by Indigenous status of mother and state/territory of birth (1993-2003), excluding cases with known post-neonatal causes.
Aboriginaln (%)^
Aboriginal and Torres Strait
Islandern (%)^
Torres Strait Islandern (%)^
Non-indigenous
n (%)^
TOTALn (%)
Unknown n (%)
ACT * (9.7) 0 (0.0) 0 (0.0) 28 (90.3) 42 11 (26.2)
NSW 26 (6.1) 0 (0.0) 0 (0.0) 398 (93.9) 570 146 (25.6)
NT 0 (0.0) 0 (0.0) 0 (0.0) * (100.0) 2 0 (0.00)
QLD * (2.8) * (0.9) *(0.9) 103 (95.4) 137 29 (21.2)
SA 11 (3.0) 0 (0.0) 0 (0.0) 350 (97.0) 367 6 (1.6)
TAS * (5.6) 0 (0.0) 0 (0.0) 34 (94.4) 38 * (5.3)
VIC 7 (0.6) 0 (0.0) 0 (0.0) 1173 (99.4) 1195 15 (1.3)
WA 56 (8.3) 0 (0.0) 0 (0.0) 616 (91.7) 702 30 (4.3)
TOTAL 108 * * 2704 3053 239
COMBINEDSA, VIC, WA 74 (3.4) 0 (0.0) 0 (0.0) 2139 (96.6) 2264 51 (2.2)
*< 5 cases(%)^ calculated by n/total n minus unknown n; provided to allow state/territory comparisons
Figure 8. Percentage of cerebral palsy cases by Indigenous status of mother and state/territory of birth (1993-2003), excluding cases with known post-neonatal causes.
Indigenous Non-Indigenous
SA
VIC
WA
COMBINED
% of cases within state of birth
0% 20% 40% 60% 80% 100%
The combined data indicate that Aboriginal and or Torres Strait Islander mothers are over represented in this cohort of cerebral palsy cases. They comprised 3.4% of the cohort compared to 0.9% of the total population in these states [13].
Australian Cerebral Palsy Register Report | 2009 25

Gestational age at delivery
Table 8. Number and percentage of cerebral palsy cases by gestational age in weeks at delivery and state/territory of birth (1993-2003), excluding cases with known post-neonatal causes.
20-27 n (%)^
28-31 n (%)^
32-36 n (%)^
37-41 n(%)^
>41 n (%)^
TOTALn
Unknownn (%)
ACT * (4.8) 11 (26.2) 6 (14.3) 22 (52.3) * (2.4) 42 0 (0.0)
NSW 85 (15.2) 65 (11.6) 92 (16.4) 289 (51.5) 30 (5.3) 570 9 (1.6)
NT 0 (0.0) 0 (0.0) 0 (0.0) * (100.0) 0 (0.0) 2 0 (0.0)
QLD 16 (11.9) 29 (21.6) 29 (21.6) 58 (43.4) * (1.5) 137 3 (2.2)
SA 57 (15.8) 69 (19.1) 63 (17.4) 170 (47.1) * (0.6) 367 6 (1.6)
TAS 6 (15.8) 6 (15.8) * (10.5) 21 (55.3) * (2.6) 38 0 (0.0)
VIC 152 (12.8) 167 (14.0) 163 (13.7) 685 (57.4) 25 (2.1) 1195 * (0.3)
WA 84 (12.1) 82 (11.8) 96 (13.8) 413 (59.7) 18 (2.6) 702 9 (1.3)
TOTAL 402 429 453 1660 79 3053 30
COMBINEDSA, VIC, WA 293 (13.1) 318 (14.1) 322 (14.3) 1268 (56.5) 45 (2.0) 2264 18(0.8)
* < 5 cases (%)^ calculated by n/total n minus unknown n; provided to allow state/territory comparisons
Figure 9. Percentage of cerebral palsy cases by gestational age in weeks at delivery and state/territory of birth (1993-2003), excluding cases with known post-neonatal causes.
% cases within
state of birth
20-27 28-31 32-36 37-41 >41
40
50
60
30
SA VIC WA COMBINED
20
10
0
In this cohort the combined data indicate that 41.5% of cerebral palsy births were premature (< 37weeks gestation). This is in contrast to the Australian population where 7.9% of all births were premature [12].
26 Australian Cerebral Palsy Register Report | 2009

Birth weight
Table 9. Number and percentage of cerebral palsy cases by birth weight in grams and state/territory of birth (1993-2003), excluding cases with known post-neonatal causes.
<1500 n (%)^
1500-2499n (%)^
2500-3499n (%)^
3500-4499n (%)^
4500+n (%)^
TOTALN
Unknownn (%)
ACT 12 (29.3) 5 (12.2) 14 (34.1) 8 (19.5) * (4.9) 42 * (2.4)
NSW 143 (26.0) 106 (19.3) 188 (34.3) 106 (19.3) 6 (1.1) 570 21 (3.7)
NT 0 (0.0) 0 (0.0) * (100.0) 0 (0.0) 0 (0.0) 2 0 (0.0)
QLD 39 (29.1) 32 (23.9) 47 (35.1) 15 (11.2) * (0.7) 137 * (2.2)
SA 108 (30.1) 71 (19.8) 109 (30.4) 64 (17.8) 7 (1.9) 367 8 (2.2)
TAS 8 (23.5) 6 (17.6) 13 (38.3) 7 (20.6) 0 (0.0) 38 * (10.5)
VIC 282 (23.8) 229 (19.3) 413 (35.0) 237 (20.0) 23 (1.9) 1195 11 (0.9)
WA 152 (22.1) 105 (15.3) 299 (43.5) 123 (17.9) 8 (1.2) 702 15 (2.1)
TOTAL 744 554 1085 560 47 3053 63
COMBINEDSA, VIC, WA 542 (24.3) 405 (18.2) 821(36.8) 424 (19.0) 38 (1.7) 2264 34(1.5)
* < 5 cases (%)^ calculated by n/total n minus unknown n; provided to allow state/territory comparisons
Figure 10. Percentage of cerebral palsy cases by birth weight in grams and state/territory of birth (1993-2003), excluding cases with known post-neonatal causes.
% cases within
state of birth
<1500 1500-2499 2500-3499 3500-4499 4500+
2530354045
20
SA VIC WA COMBINED
1510
50
In this cohort the combined data show that 42.5% of infants with cerebral palsy were born at a low birth weight (< 2500 grams). In comparison, low birthweight in the Australian population was present in 6.3% of live births [13].
Australian Cerebral Palsy Register Report | 2009 27

Plurality
Table 10. Number and percentage of cerebral palsy cases by birth plurality and state/territory of birth (1993-2003), excluding cases with known post-neonatal causes.
Birth Plurality Singletons n (%)^
Multiples n (%)^
TOTALn
Unknown n (%)
ACT 31 (83.8) 6 (16.2) 42 5 (11.9)
NSW 476(86.8) 72 (13.2) 570 22 (3.9)
NT * (100.0) 0 (0.0) 2 0 (0.0)
QLD 112 (84.8) 20 (15.2) 137 5 (3.6)
SA 321 (87.9) 44 (12.1) 367 * (0.5)
TAS 32 (84.2) 6 (15.8) 38 0 (0.0)
VIC 1045 (88.8) 132 (11.2) 1195 18 (1.5)
WA 620 (89.6) 72 (10.4) 702 10 (1.4)
TOTAL 2639 352 3053 62
COMBINEDSA, VIC, WA 1986 (88.9) 248 (11.1) 2264 30 (1.3)
* < 5 cases (%)^ calculated by n/total n minus unknown n; provided to allow state/territory comparisons
Figure 11. Percentage of cerebral palsy cases by birth plurality and state/territory of birth (1993-2003), excluding cases with known post-neonatal causes.
% cases within
state of birth
Singleton Multiple
1009080706050
SA VIC WA COMBINED
40302010
0
In this cohort the combined data indicate that 11.1% of those with cerebral palsy were from a multiple birth. In the Australian population multiple births account for 1.7% of all births [12].
28 Australian Cerebral Palsy Register Report | 2009

Assisted conception
Table 11: Number and percentage of cerebral palsy cases by type of assisted conception and state/territory of birth (1993-2003), excluding cases with known post-neonatal causes.
UnassistedConception
n (%)^
Fertility drugsonly
n (%)^
ArtificialInsemination
n (%)̂
IVFn (%)^
ICSIn (%)^
GIFTn (%)^
Assisted conception
NOSn (%)^
TOTAL n
Unknownn (%)
ACT 39 (97.5) 0 (0.0) 0 (0.0) 0 (0.0) 0 (0.0) 0 (0.0) * (2.5) 42 * (4.8)
NSW 499 (90.4) 13 (2.4) 0 (0.0) 0 (0.0) 0 (0.0) 0 (0.0) 40 (7.2) 570 18 (3.2)
NT * (100.0) 0 (0.0) 0 (0.0) 0 (0.0) 0 (0.0) 0 (0.0) 0 (0.0) 2 0 (0.0)
QLD 121 (90.3) 6 (4.5) 0 (0.0) 0 (0.0) 0 (0.0) 0 (0.0) 7 (5.2) 137 * (2.2)
SA 239 (89.8) * (1.5) * (1.1) 14 (5.3) 0 (0.0) * (0.8) * (1.5) 367 101 (27.5)
TAS 36 (94.8) * (2.6) 0 (0.0) 0 (0.0) 0 (0.0) 0 (0.0) * (2.6) 38 0 (0.0)
VIC 938 (95.6) * (0.2) * (0.3) 26 (2.7) 6 (0.6) * (0.4) * (0.2) 1195 214 (17.9)
TOTAL 1874 26 6 40 6 6 55 2351 338
Note: WA data not included at this time.
* < 5 cases (%)^ calculated by n/total n minus unknown n; provided to allow state/territory comparisons
There is presently too much missing and unknown data in this field of the ACPR to allow combining of data; however, data obtained from Victoria suggests that 3.9% of cerebral palsy cases were conceived using assisted reproductive technologies between 1993 and 2003 compared with 0.03% of live births in Australia in 2003 [14].
Australian Cerebral Palsy Register Report | 2009 29

Prenatal/perinatal causes of cerebral palsy
Table 12. Number and percentage of cerebral palsy cases by pre/perinatal cause and state/territory of birth (1993-2003).
Birth State Genetic / Chromosomal
n (%)
Intrauterine CMVn (%)
Other Intrauterine
TORCHInfection
n (%)
Other Prenatal Cause
Unspecifiedn (%)
TOTALn
UnknownN (%)
COMBINEDSA, VIC, WA 13 (0.5) 19 (0.8) 22 (0.9) * (0.1) 2405 2348 (97.7)
Note: ACT, NSW, NT, QLD, TAS data not included at this time. * <5 cases
Figure 12. Percentage of cerebral palsy cases by pre/perinatal cause, South Australia, Victoria and Western Australia combined (1993-2003).
In this cohort the combined data indicate that for the majority (97.7%) of cases the pre/perinatal causes are not completely understood.
Unknown97.7%
IntrauterineCMV
Genetic /Chromosomal
Other
InfectionOther Intrauterine
TORCH
Known2.3%
30 Australian Cerebral Palsy Register Report | 2009

Predominant motor type
Table 13. Number and percentage of cerebral palsy cases by predominant motor type and state/territory of birth (1993-2003), excluding cases with known post-neonatal causes.
Spastic n (%)^
Ataxic n (%)^
Dyskineticn (%)^
Hypotonic n (%)^
TOTALn
Unknownn (%)
ACT 28 (87.4) * (6.3) * (6.3) 0 (0.0) 42 10 (23.8)
NSW 452 (85.3) 28 (5.3) 33 (6.2) 17 (3.2) 570 40 (7.0)
NT * (100.0) 0 (0.0) 0 (0.0) 0 (0.0) 2 0 (0.0)
QLD 91 (92.9) * (1.0) * (4.1) * (2.0) 137 39 (28.5)
SA 342 (94.0) 11 (3.0) 11 (3.0) 0 (0.0) 367 3 (0.8)
TAS 24 (96.0) * (4.0) 0 (0.0) 0 (0.0) 38 13 (34.2)
VIC 1035 (87.9) 61 (5.2) 54 (4.6) 27 (2.3) 1195 18 (1.5)
WA 551 (78.5) 64 (9.1) 71 (10.1) 16 (2.3) 702 0 (0.0)
TOTAL 2525 168 175 62 3053 123
COMBINEDSA, VIC, WA 1928 (85.9) 136 (6.1) 136 (6.1) 43 (1.9) 2264 21 (1.6)
* < 5 cases (%)^ calculated by n/total n minus unknown n; provided to allow state/territory comparisons
Figure 13. Percentage of cerebral palsy cases by predominant motor type and state/territory of birth (1993-2003), excluding cases with known post-neonatal causes.
% cases within
state of birth
Spastic Ataxic Dyskinetic Hypotonic
100
90
80
7060
50
SA VIC WA COMBINED
40
30
20
10
0
In this cohort the combined data indicate that spasticity was the most predominant motor type of cerebral palsy (85.9%)
Australian Cerebral Palsy Register Report | 2009 31

Topographical pattern of spasticity
Table 14. Number and percentage of cerebral palsy cases by topographical pattern of spasticity where spasticity is the predominant motor type and state/territory of birth (1993-2003), excluding cases with known post-neonatal causes.
Monoplegia /Hemiplegia
n (%)
Diplegian (%)
Triplegia n (%)
Quadriplegia n (%)
TOTALn
ACT 10 (35.7) 6 (21.4) 0 (0.0) 12 (42.9) 28
NSW 184 (40.7) 120 (26.5) 10 (2.2) 138 (30.5) 452
NT * (50.0) * (50.0) 0 (0.0) 0 (0.0) 2
QLD 38 (41.7) 32 (35.2) * (2.2) 19 (20.9) 91
SA 123 (35.9) 129 (37.8) 13 (3.8) 77 (22.5) 342
TAS 9 (37.5) 6 (25.0) * (8.3) 7 (29.2) 24
VIC 381 (36.8) 329 (31.8) 33 (3.2) 292 (28.2) 1035
WA 229 (41.7) 235 (42.6) 21 (3.8) 66 (12.0) 551
TOTAL 975 858 81 611 2525
COMBINEDSA, VIC, WA 733 (38.0) 693 (36.0) 67 (3.5) 435 (22.5) 1928
* < 5 cases
Figure 14. Percentage of cerebral palsy cases by topographical pattern of spasticity where spasticity is the predominant motor type and state/territory of birth (1993-2003), excluding cases with known post-neonatal causes.
% cases within
state of birth
Hemi / Mono Diplegia Triplegia Quadriplegia
45
40
35
30
25
20
15
10
5
SA VIC WA COMBINED0
In this cohort the combined data indicate that hemiplegia (including monoplegia) or unilateral spastic cerebral palsy (38%) is the most common topographical pattern of spasticity. However if diplegia, triplegia and quadriplegia are grouped as bilateral spastic cerebral palsy [15], this pattern was predominant (62%) [15].
32 Australian Cerebral Palsy Register Report | 2009

Gross motor function
Table 15. Number and percentage of cerebral palsy cases by Gross Motor Function Classification System (GMFCS) levels and state/territory of birth (1993-2003), excluding cases with known post-neonatal causes.
In (%)^
IIn (%)^
IIIn (%)^
IVn (%)^
Vn (%)^
TOTALn
Unknownn(%)
ACT 10 (31.2) 6 (18.8) 5 (15.6) 5 (15.6) 6 (18.8) 42 10 (23.8)
NSW 161 (33.5) 90 (18.8) 62 (12.9) 71 (14.8) 96 (20.0) 570 90 (15.8)
NT * (50.0) 0 (0.0) 0 (0.0) 0 (0.0) 0 (0.0) 2 * (50.0)
QLD 44 (50.0) 20 (22.7) 10 (11.4) * (4.5) 10 (11.4) 137 49 (35.8)
SA 142 (49.7) 49 (17.1) 25 (8.7) 31 (10.8) 39 (13.6) 367 81 (22.1)
TAS * (28.6) * (14.3) 0 (0.0) * (42.8) * (14.3) 38 31 (81.6)
VIC 355 (31.9) 300 (26.9) 129 (11.6) 158 (14.2) 172 (15.4) 1195 81 (6.8)
TOTAL 715 466 231 272 324 2351 343
Note 1: WA data not included at this time. Note 2: An example of the Gross Motor Function Classification System descriptors have been provided in Appendix B*< 5 cases(%)^ calculated by n/total n minus unknown n; provided to allow state/territory comparisons
In this cohort the data from Victoria indicate that at the age of 5 years the most predominant levels of gross motor function are GMFCS I and II (58.8%). This indicates that more than half the children with cerebral palsy are able to walk indoors and on level surfaces outdoors at age 5 years without needing an assistive mobility device.
Australian Cerebral Palsy Register Report | 2009 33
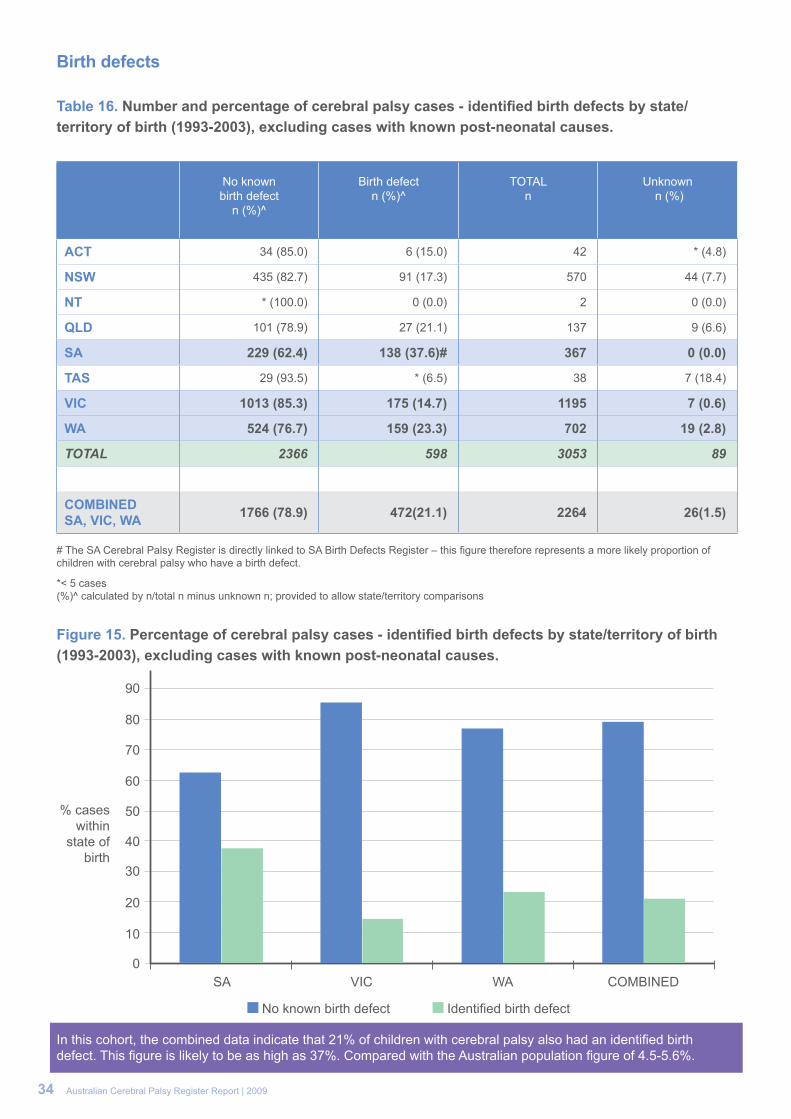
Birth defects
Table 16. Number and percentage of cerebral palsy cases - identified birth defects by state/territory of birth (1993-2003), excluding cases with known post-neonatal causes.
No known birth defect
n (%)^
Birth defectn (%)^
TOTALn
Unknown n (%)
ACT 34 (85.0) 6 (15.0) 42 * (4.8)
NSW 435 (82.7) 91 (17.3) 570 44 (7.7)
NT * (100.0) 0 (0.0) 2 0 (0.0)
QLD 101 (78.9) 27 (21.1) 137 9 (6.6)
SA 229 (62.4) 138 (37.6)# 367 0 (0.0)
TAS 29 (93.5) * (6.5) 38 7 (18.4)
VIC 1013 (85.3) 175 (14.7) 1195 7 (0.6)
WA 524 (76.7) 159 (23.3) 702 19 (2.8)
TOTAL 2366 598 3053 89
COMBINEDSA, VIC, WA 1766 (78.9) 472(21.1) 2264 26(1.5)
# The SA Cerebral Palsy Register is directly linked to SA Birth Defects Register – this figure therefore represents a more likely proportion of children with cerebral palsy who have a birth defect.
*< 5 cases (%)^ calculated by n/total n minus unknown n; provided to allow state/territory comparisons
Figure 15. Percentage of cerebral palsy cases - identified birth defects by state/territory of birth (1993-2003), excluding cases with known post-neonatal causes.
% cases within
state of birth
No known birth defect Identified birth defect
90
80
70
60
50
SA VIC WA COMBINED
40
30
20
10
0
In this cohort, the combined data indicate that 21% of children with cerebral palsy also had an identified birth defect. This figure is likely to be as high as 37%. Compared with the Australian population figure of 4.5-5.6%.
34 Australian Cerebral Palsy Register Report | 2009
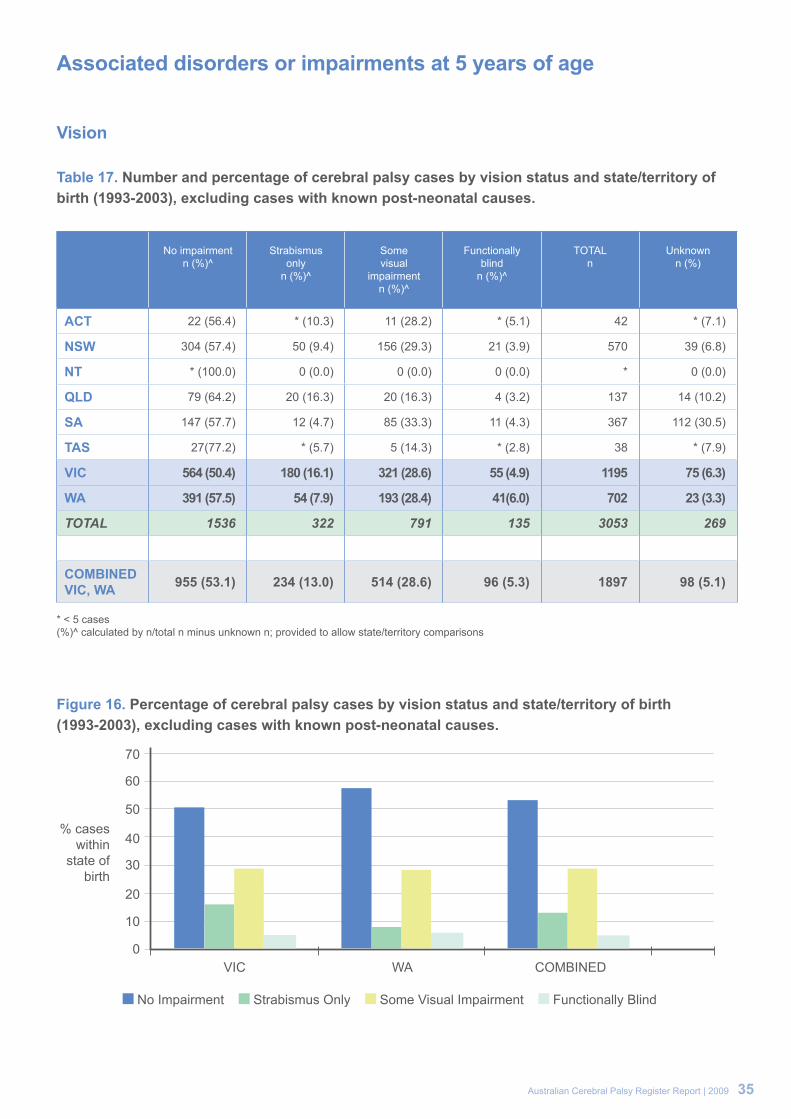
Associated disorders or impairments at 5 years of age
Vision
Table 17. Number and percentage of cerebral palsy cases by vision status and state/territory of birth (1993-2003), excluding cases with known post-neonatal causes.
No impairmentn (%)^
Strabismusonly
n (%)^
Somevisual
impairmentn (%)^
Functionallyblind
n (%)^
TOTALn
Unknownn (%)
ACT 22 (56.4) * (10.3) 11 (28.2) * (5.1) 42 * (7.1)
NSW 304 (57.4) 50 (9.4) 156 (29.3) 21 (3.9) 570 39 (6.8)
NT * (100.0) 0 (0.0) 0 (0.0) 0 (0.0) * 0 (0.0)
QLD 79 (64.2) 20 (16.3) 20 (16.3) 4 (3.2) 137 14 (10.2)
SA 147 (57.7) 12 (4.7) 85 (33.3) 11 (4.3) 367 112 (30.5)
TAS 27(77.2) * (5.7) 5 (14.3) * (2.8) 38 * (7.9)
VIC 564 (50.4) 180 (16.1) 321 (28.6) 55 (4.9) 1195 75 (6.3)
WA 391 (57.5) 54 (7.9) 193 (28.4) 41(6.0) 702 23 (3.3)
TOTAL 1536 322 791 135 3053 269
COMBINEDVIC, WA 955 (53.1) 234 (13.0) 514 (28.6) 96 (5.3) 1897 98 (5.1)
* < 5 cases(%)^ calculated by n/total n minus unknown n; provided to allow state/territory comparisons
Figure 16. Percentage of cerebral palsy cases by vision status and state/territory of birth (1993-2003), excluding cases with known post-neonatal causes.
% cases within
state of birth
No Impairment Strabismus Only Some Visual Impairment Functionally Blind
70
60
50
VIC WA COMBINED
40
30
20
10
0
Australian Cerebral Palsy Register Report | 2009 35

Hearing
Table 18. Number and percentage of cerebral palsy cases by hearing status and state/territory of birth (1993-2003), excluding cases with known post-neonatal causes.
No impairment
n (%)^
Some impairment
n (%)^
Bilateral deafness
n (%)^
TOTALn
Unknownn (%)
ACT 37 (92.5) * (5.0) * (2.5) 42 * (4.8)
NSW 473 (89.1) 38 (7.0) 21 (3.9) 570 38 (6.3)
NT * (100.0) 0 (0.0) 0 (0.0) 2 * (0.0)
QLD 114 (89.1) 11 (8.6) * (2.3) 137 9 (6.6)
SA 226 (86.3) 29 (11.1) 7 (2.7) 367 105 (28.6)
TAS 36 (97.3) * (2.7) *0 (0.0) 38 * (2.6)
VIC 946 (85.7) 120 (10.9) 38 (3.4) 1195 91 (7.6)
WA 613 (91.9) 42 (6.3) 12 (1.8) 702 35 (5.0)
TOTAL 2449 243 82 3053 279
COMBINED VIC, WA 1559 (88.1) 162 (9.1) 50 (2.8) 1897 126 (6.6)
* < 5 cases(%)^ calculated by n/total n minus unknown n; provided to allow state/territory comparisons
Figure 17. Percentage of cerebral palsy cases by hearing status and state/territory of birth (1993-2003), excluding cases with known post-neonatal causes.
% cases within
state of birth
No Impairment Some Impairment Bilateral Deafness
10090
506070
80
VIC WA COMBINED
40302010
0
36 Australian Cerebral Palsy Register Report | 2009

Speech
Table 19. Number and percentage of cerebral palsy cases by speech status and state/territory of birth (1993-2003), excluding cases with known post-neonatal causes.
No impairmentn (%)^
Some impairmentn (%)^
Non-verbaln (%)^
TOTALn
Status unknownn (%)
ACT 16 (40.0) 19 (47.5) 5 (12.5) 42 * (4.8)
NSW 199 (36.3) 221 (40.3) 128 (23.4) 570 22 (3.9)
NT *(50) *(50) 0 (0.0) 2 0 (0.0)
QLD 65 (50.4) 41 (31.8) 23 (17.8) 137 8 (5.8)
SA 135 (47.7) 112 (39.6) 36 (12.7) 367 84 (22.9)
TAS 23 (62.2) 11 (29.7) * (8.1) 38 *(2.6)
VIC 435 (39.4) 360 (32.6) 310 (28.0) 1195 90 (7.5)
WA 266 (40.7) 228 (35.0) 159 (24.3) 702 49 (7.0)
TOTAL 1140 993 664 3053 261
COMBINED VIC, WA 701 (39.9) 588 (33.4) 469 (26.7) 1897 139 (7.3)
* < 5 cases (%)^ calculated by n/total n minus unknown n; provided to allow state/territory comparisons
Figure 18. Percentage of cerebral palsy cases by speech status and state/territory of birth (1993-2003), excluding cases with known post-neonatal causes.
% cases within
state of birth
No Impairment Some Impairment Non-verbal
45
40
35
30
25
VIC WA COMBINED
20
10
5
15
0
Australian Cerebral Palsy Register Report | 2009 37

Epilepsy
Table 20. Number and percentage of cerebral palsy cases by presence/absence of epilepsy~ and state/territory of birth (1993-2003), excluding cases with known post-neonatal causes.
No epilepsyn (%)^
Resolved#n (%)^
Epilepsyn (%)^
TOTALn
Unknown n (%)
ACT 32 (80.0) * (5.0) 6 (15.0) 42 * (4.7)
NSW 380 (69.9) 31 (5.7) 133 (24.4) 570 26 (4.6)
NT * (50.0) 0 (0.0) * (50.0) 2 0 (0.0)
QLD 96 (72.8) * (3.0) 32 (24.2) 137 5 (3.6)
SA 177 (68.3) 24 (9.3) 58 (22.4) 367 108(29.4)
TAS 28 (75.7) * (10.8) 5 (13.5) 38 *
VIC 791 (67.6) 15 (1.3) 364 (31.1) 1195 25 (2.1)
WA 459 (67.8) 14 (2.1) 204 (30.1) 702 25 (3.6)
TOTAL 1964 92 803 3053 194
COMBINED VIC, WA 1250 (67.7) 29 (1.6) 568 (30.7) 1897 50 (2.6)
* < 5 casesResolved # = Resolved by 5 years of age (seizure free for two or more years without medication)~Epilepsy is defined as two or more afebrile seizures before age 5 years; does not include neonatal seizures. (%)^ calculated by n/total n minus unknown n; provided to allow state/territory comparisons
Figure 19. Percentage of cerebral palsy cases by presence/absence of epilepsy~ and state/territory of birth (1993-2003), excluding cases with known post-neonatal causes.
% cases within
state of birth
No Epilepsy Resolved Epilepsy
80
70
30
40
50
60
VIC WA COMBINED
20
10
0
38 Australian Cerebral Palsy Register Report | 2009

Intellectual impairment
Table 21. Number and percentage of cerebral palsy cases by level of intellectual impairment and state/territory of birth (1993-2003), excluding cases with known post-neonatal causes.
No impairment
n (%) ^
Probably greater
than borderline
impairment:severity
uncertainn (%)^
Mildimpairment
n (%)^
Moderateimpairment
n (%)^
Severe-profound
impairmentn (%)^
TOTALn
Unknownn (%)
ACT 20 (52.6) 5 (13.2) 6 (15.8) 5 (13.2) * (5.3) 42 * (9.5)
NSW 248 (48.8) 64 (12.6) 64 (12.6) 76 (15.0) 56 (11.0) 570 62 (10.9)
NT * (50.0) 0 (0.0) * (50.0) 0 (0.0) 0 (0.0) 2 0 (0.0)
QLD 78 (63.4) 13 (10.6) 13 (10.6) 11 (8.9) 8 (6.5) 137 14 (10.2)
SA 165 (63.7) 7 (2.7) 39 (15.1) 22 (8.5) 26 (10.0) 367 108 (29.4)
TAS 20 (57.1) * (2.9) 7 (20.0) 6 (17.1) * (2.9) 38 * (7.9)
VIC 559 (50.9) 163 (14.9) 137 (12.5) 98 (8.9) 140 (12.8) 1195 98 (8.2)
WA 401 (59.5) 59 (8.9) 59 (8.8) 66 (9.8) 88 (13.1) 702 29 (4.1)
TOTAL 1492 312 326 284 321 3053 318
COMBINED VIC, WA 960 (54.3) 222 (12.5) 196 (11.0) 164 (9.3) 228 (12.9) 1897 127 (6.7)
* < 5 cases(%)^ calculated by n/total n minus unknown n; provided to allow state/territory comparisons
Figure 20. Percentage of cerebral palsy cases by level of intellectual impairment and state/territory of birth (1993-2003), excluding cases with known post-neonatal causes.
% cases within
state of birth
No Impairment Some Impairment
70
30
40
50
60
VIC WA COMBINED
20
10
0
In this cohort the combined data indicate that associated impairments were common for children with cerebral palsy. At the age of five: 30.7% had epilepsy; 45% had an intellectual impairment; 60% had a speech impairment; 37% had a vision impairment and 12% had a hearing impairment. More than 50% had more than one associated impairment.
Australian Cerebral Palsy Register Report | 2009 39

RESULTS Part 3: Post-neonatally acquired cerebral palsy

Prevalence of cerebral palsy for cases where there is an identified post-neonatal cause
Table 22. Cerebral palsy cases by identified post-neonatal (PNN) cause and state/territory of birth (1993-2003).
PNN acquired casesn (%)
All CP cases Live births Prevalence OF PNN casesper 10,000 live births
ACT 7 (14.3) 49 46372 -
NSW 52 (8.4) 622 955471 -
NT * (0.0) 2 40383 -
QLD 9 (6.2) 146 518563 -
TAS * (2.6) 39 67747 -
SA 13 (3.4) 380 204204 0.64
VIC 58 (4.6) 1253 689802 0.84
WA 56 (7.4) 758 276318 2.02
TOTALS SA, VIC, WA 127 (5.3) 2391 1170324 Combined Prevalence: 1.08
* < 5 cases
In this cohort the combined data indicate the prevalence for post-neonatally acquired cerebral palsy was estimated to be 1.08 per 10,000 live births.
Australian Cerebral Palsy Register Report | 2009 41

Post-neonatal cause
Table 23. Number and percentage of cerebral palsy cases by identified post-neonatal cause, born in South Australia, Victoria and Western Australian (1993-2003).
Post-Neonatal causeTOTAL CASES
SA, VIC, WA COMBINED n (%)
Viral/bacterial infection unspecified 33 (26.0)
CVA# associated with surgery 8 (6.3)
CVA# associated with cardiac complications 7 (5.5)
Spontaneous/other CVA# 30 (23.6)
Fall 4 (3.1)
Non-accidental Injury 11 (8.7)
Other head injury 2 (1.6)
Near drowning 3 (2.4)
Apparent life threatening event 3 (2.4)
Post-immunisation 3 (2.4)
Post-seizure 5 (3.9)
Peri-operative hypoxia 2 (1.6)
Other post-natal event 11 (8.7)
Motor vehicle accident 5 (3.9)
TOTAL 127
* < 5 casesCVA# Cerebro-vascular accident
Figure 21. Percentage of cerebral palsy cases by identified post-neonatal cause, born in South Australia, Victoria and Western Australian (1993-2003).
In this cohort the combined data indicate the predominant post-neonatal cause of cerebral palsy is a CVA being either spontaneous, associated with surgery or with cardiac complications.
42 Australian Cerebral Palsy Register Report | 2009
Viral/bacterial infection26%
CVA36%
Head injury/fall/ non-accidental
13%
MVA4%
Other21%

1. Stanley F, Blair E, Alberman E. How common are the cerebral palsies? , in Cerebral Palsies: Epidemiology and Causal Pathways. London: MacKeith Press, 2000:22-29.
2. Reddihough D, Collins K. The epidemiology and causes of cerebral palsy. Aust J Physiother 2003;49(1):7-12.
3. Rosenbaum P, Paneth N, Leviton A, Goldstein M, Bax M, Damiano D, Dan B, Jacobsson B. A report: the definition and classification of cerebral palsy April 2006. Dev Med Child Neurol Suppl 2007;109:8-14.
4. Smithers-Sheedy H, McIntyre, S, Watson, L, Yeargin-Allsop, M, Blair, E, Cans, C. Report of the international survey of cerebral palsy registers and surveillance systems: Cerebral Palsy Institute, 2009
5. Surveillance of cerebral palsy in Europe: a collaboration of cerebral palsy surveys and registers. Surveillance of Cerebral Palsy in Europe (SCPE). Dev Med Child Neurol 2000;42(12):816-24.
6. Bax M, Flodmark O, Tydeman C. Definition and classification of cerebral palsy. From syndrome toward disease. Dev Med Child Neurol Suppl 2007;109:39-41.
7. Mutch L, Alberman E, Hagberg B, Kodama K, Perat M. Cerebral palsy epidemiology: where are we now and where are we going? Dev Med Child Neurol 1992;34(6):547-51.
8. Stanley F, Blair E, Alberman E. Epidemiological issues in evaluating the management of cerebral palsy, in Cerebral Palsies: Epidemiology and Causal Pathways. London: MacKeith Press, 2000:176-94.
9. The Economic Impact of Cerebral Palsy in Australia in 2007, Cerebral Palsy Australia, Access Economics, 2007
10. Australian Bureau of Statistics Population Clock, December 2009, Australian Bureau of Statistics, 2009
11. Badawi N, Watson L, Petterson B, Blair E, Slee J, Haan E, Stanley F. What constitutes cerebral palsy? Dev Med Child Neurol 1998;40(8):520-7.
12. National Perinatal Data Development Committee. Perinatal period 2005, Australian Institute of Health and Welfare, 2005.
13. Laws P, Sullivan E. Australia’s mothers and babies 2003, Perinatal Statistics Series Sydney, 2005.
14. Waters A, Dean J, Sullivan E. Assisted reproduction technology in Australia and New Zealand 2003, Assisted reproduction technology series, Australian Institute of Health and Welfare, 2006:68
15. SCPE. Surveillance of cerebral palsy in Europe: a collaboration of cerebral palsy surveys and registers. Dev Med Child Neurol 2000;42:818-24.
Australian Cerebral Palsy Register Report | 2009 43
REFERENCES

Table 1. State and territory establishment dates and consent types.
Name Date of Establishment
Custodian Organisation Type of Consent Required
Contactable for Future Research
NSW and ACT Cerebral Palsy Register 2005
The Cerebral Palsy Institute, a wholly owned subsidiary of The Spastic of New South Wales
IC Yes
Northern Territory Cerebral Palsy Register 2008 Department of Health and
Families IC Yes
Queensland Cerebral Palsy Register 2006 Cerebral Palsy League of
Queensland IC Yes
The South Australian Cerebral Palsy Register 1998 Children, Youth and Women’s
Health Service L, IC Yes
Tasmanian Cerebral Palsy Register 2008 Menzies Research Institute IC Yes
Victorian Cerebral Palsy Register 1986
Murdoch Childrens Research Institute / Royal Children’sHospital, Melbourne
E, IC,OYes
(Approximately 80%)
Western Australia Cerebral Palsy Register 1977
Telethon Institute for Child Health Research
E No
IC Registration after gaining individual consent, L Legislation allowing collection of data, E Ethics approval to collect data without informed consent, O Other e.g. combination or alternative
New South Wales and Australian Capital Territory Cerebral Palsy RegistersThe Cerebral Palsy Institute, a wholly owned subsidiary of The Spastic of New South Wales
Target population: Individuals who have acquired cerebral palsy before age 5 years who were born or currently live in New South Wales or the Australian Capital Territory
Sarah McIntyre Cerebral Palsy Institute The University of Notre Dame Australia PO Box 560Darlinghurst 1300 E [email protected] T 02 8204 4492
Purpose: The main aims of the register are to monitor incidence and prevalence of cerebral palsy, gain further understanding about the causes of cerebral palsy, evaluate preventative strategies and assist in planning services for children and adults who have cerebral palsy. These goals represent the aims of the NSW and ACT Cerebral Palsy Register and are aligned with this register’s partnership with the Australian Cerebral Palsy Register.
44 Australian Cerebral Palsy Register Report | 2009
APPENDIX A -INFORMATION AND CONTACT DETAILS OF THE CONTRIBUTING STATE AND TERRITORY CEREBRAL PALSY REGISTERS

Northern Territory Cerebral Palsy Register Department of Health and Families
Target population: All individuals who have cerebral palsy, who were born in, or live in, the Northern Territory
Carmen Ewens Royal Darwin Hospital Rocklands Dr PO Box 41326 Casuarina, 0811 Tiwi NT 0810 Australia E [email protected] 08 8922 8338
Purpose: The main aims of the cerebral palsy register are to determine the number, location and abilities of people in the Northern Territory who have cerebral palsy. Also to use this information to assist in the planning, development and provision of services, and to provide a resource for research into cerebral palsy
Queensland Cerebral Palsy RegisterCerebral Palsy League of Queensland
Target population: All people who live in or were born in Queensland who have cerebral palsy.
Michael deLacy QCPR PO Box 386 Fortitude Valley Brisbane Qld 4006 Australia E [email protected] T 07 3358 8002
Purpose: Determine the number, locations and general abilities of the population of people with cerebral palsy in QLD for use by government and non-government agencies in service planning. Provide a population resource for intervention trials. Contribute to investigations into causes and prevention of cerebral palsy.
The South Australian Cerebral Palsy Register (part of the South Australian Birth Defects Register) Children, Youth and Women’s Health Service
Target population: All children who live in or were born in South Australia who have been diagnosed with cerebral palsy, including post-neonatally acquired cerebral palsy up to 2 years of age.
Phillipa van Essen / Catherine GibsonChildren, Youth and Women’s Health Service 72 King William Road North Adelaide Adelaide SA 5006 Australia E [email protected] T 08 8161 7368
Purpose: The main aims of the South Australian Cerebral Palsy Register are to:• determine and monitor the prevalence of cerebral palsy in South Australia. • gather information about affected children that may provide clues to the causes of cerebral palsy. • document the severity and range of disabilities experienced by children with cerebral palsy. • use the information collected to plan facilities for affected children. • act as a source of information about cerebral palsy, for both families and the community.• improve community and professional awareness of cerebral palsy, including its causes and outcomes. • provide a resource for research into cerebral palsy. • contribute to mortality and morbidity studies of cerebral palsy.
Australian Cerebral Palsy Register Report | 2009 45

Tasmanian Cerebral Palsy RegisterMenzies Research Institute
Target population: The Register only collects information on cerebral palsy. The main focus is on young children, but accepts registrations from all Tasmanians with cerebral palsy.
Julie Bunyard Menzies Research Institute Private Bag 23 Hobart Tasmania 7001 Australia E [email protected] T 03 6226 4717
Purpose: To monitor how many people are living in Tasmania with cerebral palsy, in which areas they live and whether there are any changing trends in the incidence or severity of cerebral palsy in the state. The register also aims to facilitate research into the causes, prevention and treatment of cerebral palsy.
The Victorian Cerebral Palsy Register Murdoch Childrens Research Institute/Royal Children’s Hospital, Melbourne
Target population: Individuals with cerebral palsy born since 1970.
Sue Reid Murdoch Childrens Research Institute Royal Children’s Hospital Flemington Road Parkville Victoria 3052 Australia E [email protected] T 03 9345 4807
Purpose: (1) To determine the frequency and describe the characteristics of cerebral palsy in Victoria (2) To enable research into aetiology (3) To select cohorts for intervention and other studies.
Western Australian Cerebral Palsy RegisterTelethon Institute for Child Health Research
Target population: All individuals from birth-year 1956 who have cerebral palsy acquired before age 5 years and were born or currently live in WA.
Linda Watson Telethon Institute for Child Health Research PO Box 855 West Perth WA 6872 Australia E [email protected] T 08 9489 7766
Purpose: (1) To monitor trends in cerebral palsy and identify areas of concern for future investigation (2) To conduct population based epidemiological studies of the various cerebral palsy subgroups, particularly to elucidate causes (3) To evaluate changes in antenatal, obstetric and neonatal care in relation to cerebral palsy as an index of neurological outcome (4) To identify cerebral palsy as an outcome in other study populations (5) To aid in the planning of services for individuals with cerebral palsy by providing distribution of cerebral palsy in WA by age, severity, geographical area, etc to service organisations (6) To contribute WA cerebral palsy data to the Australian Cerebral Palsy Register
46 Australian Cerebral Palsy Register Report | 2009

APPENDIX B -GROSS MOTOR FUNCTION SCALE - DESCRIPTORS AND ILLUSTRATIONS
Australian Cerebral Palsy Register Report | 2009 47

yy Amor DJ, Craig JE, Delaycki MB, Reddihough DS. Genetic factors in athetoid cerebral palsy. Journal of Child Neurology. 2001;16:793-797.
yy Atkinson S, Stanley FJ. Spastic diplegia in children of low and normal birthweight. Developmental Medicine and Child Neurology 1983; 25: 693-708.
yy Badawi N, Watson L, Lake B, Alessandri L. Intellectual disability and cerebral palsy. In Banerjee SR (ed), Community and Social Pediatrics. New Delhi: Jaypee Brothers Medical Publishers, 1995: 1-13.
yy Badawi N, Watson L, Petterson B, Blair E, Slee J, Haan E, Stanley F. What constitutes cerebral palsy?. Developmental Medicine and Child Neurology. 1998; 40(8):520-7
yy Badawi N. The international consensus statement on cerebral palsy causation. Medical Journal of Australia. 2000; 172(5):199-200
yy Badawi N, Keogh J, Dixon G, Kurinczuk J, Developmental outcomes of newborn encephalopathy in the term infant. Indian Journal of Pediatrics. 2001; 68(6):527-30
yy Badawi N, Felix J, Kurinczuk J, Dixon G, Watson L, Keogh J, Valentine J, Stanley F, Cerebral palsy following term newborn encephalopathy: a population-based study. Developmental Medicine & Child Neurology. 2005; 47(5):293-8
yy Badawi N, Dixon G, Felix J, Keogh J, Petterson B, Stanley F, Kurrinczuk J. Autism following a history of newborn encephalopathy: more than a coincidence? Developmental Medicine & Child Neurology. 2006; 48(2):85-9
yy Badawi N, Novak I, McIntyre S, Edwards K, Raye S, deLacy M, Bevis E, Flett P, van Essen P, Scott H, Tungaraza K, Sealy M, McCann V, Reddihough D, Reid S, Lanigan A, Blair E, de Groot J, Watson L. Proposed new definition of cerebral palsy does not solve any of the problems of existing definitions. Letter to the Editor. Developmental Medicine and Child Neurology 2006;48:78-80.
yy Baikie G, South MJ, Reddihough DS, Cook DJ, Cameron DJS, Olinsky A, Ferguson E. B. Agreement between tests of aspiration in children with severe cerebral palsy using barium video-fluoroscopy, milk scan and salivagram. Developmental Medicine and Child Neurology. 2005,47:86-93.
yy Blair E, Stanley FJ. An epidemiological study of cerebral palsy in Western Australia, 1956-1975. III: Cerebral palsy of postnatal aetiology. Developmental Medicine and Child Neurology 1982; 24: 575-585.
yy Blair E, Stanley FJ. Interobserver agreement in the classification of cerebral palsy. Developmental Medicine and Child Neurology 1985; 27: 615-622.
yy Blair EM, Stanley FJ. Intrapartum asphyxia: A rare cause of cerebral palsy. Journal of Pediatrics 1988; 112: 515-519.
yy Blair EM, Stanley FJ. Intrauterine growth and spastic cerebral palsy. I: The association of birthweight for gestational age. American Journal of Obstetrics and Gynecology 1990; 162: 229-237
yy Blair E, Stanley FJ, Hockey A. Intrapartum asphyxia and cerebral palsy [letter]. Journal of Pediatrics 1992; 121: 170-171.
yy Blair EM, Stanley FJ. Intrauterine growth and spastic cerebral palsy. II: The association with morphology at birth. Early Human Development 1992; 28: 91-103.
yy Blair E, Stanley FJ. When can spastic cerebral palsy be prevented? The generation of causal hypotheses by multivariate analysis of a case-control study. Paediatric and Perinatal Epidemiology 1993; 7: 272-301.
yy Blair E, Stanley FJ. Aetiological pathways to spastic cerebral palsy. Paediatric and Perinatal Epidemiology 1993; 7: 302-317.
yy Blair E, Palmer L, Stanley FJ. Cerebral palsy in very low birthweight infants, pre-eclampsia and magnesium sulphate [letter]. Pediatrics 1996; 97: 780-781.
yy Blair E, Shean R. Trends in childhood disability. Med.J.Aust. 1996:165;206-208.
yy Blair E. Obstetric antecedents of cerebral palsy. Fetal and Maternal Medicine Review 1996; 8: 199-215.
yy Blair E, Stanley FJ. Issues in the classification and epidemiology of cerebral palsy [invited review]. Mental Retardation and Developmental Disabilities Research Reviews 1997; 3: 184-193.
yy Blair E. Paediatric implications of intrauterine growth restriction with special reference to cerebral palsy. In P Baker, J Kingdom (eds), Intrauterine Growth Restriction. London: Springer-Verlag, 2000.
yy Blair E, Wallman A. Changing rates of severity of cerebral palsy and implications for practice. Action Packed 2000, 5(3): 18-20.
yy Blair E. Trends in cerebral palsy. Indian Journal of Paediatrics 2001; 68: 433-438.
yy Blair E, Watson L, Badawi N, Stanley FJ. Life expectancy among people with cerebral palsy in Western Australia. Developmental Medicine and Child Neurology 2001; 43: 508-515.
yy Blair E, Stanley F. The epidemiology of the cerebral palsies. In Levene MI, Cherenak FA, Whittle M (eds), Fetal and Neonatal Neurology and Neurosurgery, Third Edition. London: Churchill Livingstone, 2001: 791-798.
yy Blair E, Stanley F. Causal pathways to cerebral palsy. Current Paediatrics 2002; 12(3): 179-185.
yy Blair E, Stanley F. New thoughts on the aetiology of cerebral palsy. In Sturdee D, Olah K, Purdie D, Keane D (eds), The Yearbook of Obstetrics and Gynecology, Volume 10. London: RCOG Press, 2002: 357-367.
yy Blair E, Watson L. Epidemiology of cerebral palsy. In Doyle L (ed), Perinatal and Neonatal Epidemiology, Seminars in Fetal and Neonatal Medicine 2006; 11: 117-1125
48 Australian Cerebral Palsy Register Report | 2009
APPENDIX C -REFERENCES GENERATED BY REGISTERS IN AUSTRALIA

yy Blair E, Bower C, Badawi N, Al Asedy F. 2007 Are non-cerebral birth defects associated with cerebral palsy? Developmental Medicine and Child Neurology 2007;49(4).252-258.
yy Bryce RL, Stanley FJ, Blair EM. The effects of intrapartum care on handicap. In M Enkin, M Keirse, I Chalmers (eds), Effective Care in Pregnancy and Childbirth. Oxford: OUP, 1988.
yy Camfield CS, Camfield P, Watson L. Cerebral palsy in children with epilepsy. In Devinsky O, Westbrook LE (eds), Epilepsy and Developmental Disabilities. Boston: Butterworth-Heinemann, 2002.
yy Catanese A., Coleman GJ, King JA, Reddihough DS. Evaluation of an early childhood programme based on principles of Conductive Education: The Yooralla Project. Journal of Paediatrics and Child Health 1995;31:418-422.
yy Cathels BA, Reddihough DS. The health care of young adults with cerebral palsy. Medical Journal of Australia. 1993;159:444-446.
yy Dale A, Stanley FJ. An epidemiological study of cerebral palsy in Western Australia, 1956-1975. II: Spastic cerebral palsy and perinatal factors. Developmental Medicine and Child Neurology 1980; 22: 13-25
yy Davis, E., Waters, E., Mackinnon, A., Reddihough, D., Graham, H.K., Mehmet-Radji, O., & Boyd, R. Paediatric quality of life instruments: a review of the impact of the conceptual framework on outcomes. Developmental Medicine and Child Neurology 2006;48:311-318
yy Davis E, Shelly A, Waters E, Boyd R, Cook K, Casey E, Reddihough D. The impact of caring for a child with cerebral palsy: Quality of life for mothers and fathers. Accepted for publication in Child: Care, Health and Development, January 2008.
yy Davis E, Shelly A, Waters E, Boyd R, Cook K, Casey E, Reddihough D. The impact of caring for a child with cerebral palsy: Quality of life for mothers and fathers. Accepted for publication in Child: Care, Health and Development, January 2008.
yy Davis E, Shelly A, Waters E, Mackinnon A, Reddihough D, Boyd R, Graham HK. Quality of life for adolescents with cerebral palsy: Perspectives of adolescents and parents. Developmental Medicine and Child Neurology, Accepted for publication January 2008.
yy Dite GS, Reddihough DS, Robert LA (1994) Report of the Victorian Cerebral Palsy Register. Royal Children’s Hospital, Melbourne.
yy Dite GS, Reddihough DS, Robert LA (1995) Second Report of the Victorian Cerebral Palsy Register. Royal Children’s Hospital, Melbourne.
yy Dite GS, Bell R, Reddihough DS, Bessell C, Brennecke S, Sheedy M. Antenatal and perinatal antecedents of moderate and severe spastic cerebral palsy. Australian and New Zealand Journal of Obstetrics and Gynaecology. 1998;38:1-7.
yy Dite GS, Reddihough DS, Robert LA (2005) Second Report of the Victorian Cerebral Palsy Register. Royal Children’s Hospital, Melbourne.
yy Dixon G, Badawi N, Kurinczuk J, Keogh J, Silburn S, Zubrick S, Stanley, F. Early developmental outcomes after newborn encephalopathy. Pediatrics. 2002; 109(1):26-33
yy Djukic M, Gibson CS, MacLennan AH, Goldwater PN, Haan EA, McMichael GL, Priest K, Dekker GA, Hague, WM, Chan A, Rudzki Z, van Essen PB, Khong TY, Morton MR, Ranieri E, Scott H, Tapp H, Casey G. Genetic susceptibility to viral exposure may increase the risk of cerebral palsy. Australian and New Zealand Journal of Obstetrics and Gynaecology 2009; 49: 247-253.
yy Gibson CS, MacLennan AH, Goldwater PN, Dekker GA. Antenatal causes of cerebral palsy: associations between inherited thrombophilias, viral and bacterial infection, and inherited susceptibility to infection. Obstet Gynecol Surv 2003; 58:209-20.
yy Gibson CS, MacLennan AH, Rudzki Z, Hague WM, Haan EA, Sharpe P, Priest K, Chan A, Dekker GA for the South Australian Cerebral Palsy Research Group. The prevalence of inherited thrombophilias in a Caucasian Australian population. Pathology 2005; 37:160-163.
yy Gibson CS, MacLennan AH, Hague WM, Haan EA, Priest K, Chan A, Dekker GA for the South Australian Cerebral Palsy Research Group. Associations between inherited thrombophilias, gestational age, and cerebral palsy. Am J Obstet Gynecol 2005; 193:1437.
yy Gibson CS, MacLennan AH, Janssen NG, Kist WJ, Hague WM, Haan EA, Goldwater PN, Priest K, Dekker GA for the South Australian Cerebral Palsy Research Group. Associations between fetal inherited thrombophilia and adverse pregnancy outcomes. Am J Obstet Gynecol 2006; 194: 947.e1–947.e10.
yy Gibson CS, MacLennan AH, Goldwater PN, Haan EA, Priest K, Dekker GA for the South Australian Cerebral Palsy Research Group. Neurotropic viruses and cerebral palsy: population based case-control study. BMJ 2006; 332(7533):76-80.
yy Gibson CS, MacLennan AH, Goldwater PN, Haan EA, Priest K, Dekker GA for the South Australian Cerebral Palsy Research Group. The association between inherited cytokine polymorphisms and cerebral palsy. Am J Obstet Gynecol 2006; 194:674 e1-11.
yy Gibson CS, MacLennan AH, Dekker GA, Goldwater PN, Dambrosia JM, Munroe DJ, Tsang S, Stewart C, Nelson KB. Genetic polymorphisms and spontaneous preterm birth. Obstet Gynecol 2007; 109 (2 pt 1): 384-391.
yy Gibson CS, MacLennan AH, Dekker GA, Goldwater PN, Sullivan TR, Munroe DJ, Tsang S, Stewart C, Nelson KB. Candidate genes and cerebral palsy: a population-based study. Pediatrics 2008; 122: 1079-1085.
yy Gibson CS, MacLennan AH, Goldwater PN, Dekker GA. The antenatal origins of cerebral palsy – genetic and viral associations. Fetal and Maternal Medicine Review 2008; 19: 181-201.
yy Gibson CS, MacLennan AH, Goldwater PN, Haan EA, Priest K, Dekker GA. Mannose-binding lectin haplotypes may be associated with cerebral palsy only after perinatal viral exposure. Am J Obstet Gynecol 2008; 198: 509e1-509e8.
yy Gibson CS, Goldwater PN, MacLennan AH, Haan EA, Priest K, Dekker GA. Fetal exposure to herpesviruses may be associated with pregnancy-induced hypertensive disorders and preterm birth in a Caucasian population. BJOG 2008; 115: 492-500.
yy Gilles MT, Blair E, Watson L, Badawi N, Alessandri L, Dawes V, Plant AJ, Stanley FJ. Trauma in pregnancy and cerebral palsy: Is there a link? Med J Aust 1996; 164: 500-501.
yy Hallett KB, Lucas JO, Johnston T, Reddihough DS, Hall R. Dental health of children with cerebral palsy following sialochodochoplasty. Journal of Special Care in Dentistry. 1995;15:234-238.
yy Halliday JL, Reddihough D, Byron K, Ekert H, Ditchfield M. Hemiplegic cerebral palsy and the factor V Leiden mutation (Letter to the Editor). Journal of Medical Genetics. 2000;37:787-789
yy Howard J, Soo B, Graham H K, Boyd R, Reid S, Lanigan A, Wolfe R, Reddihough. Cerebral Palsy in Victoria: Motor Types, Topography and Gross Motor Function. Accepted for publication in the Journal of Paediatrics and Child Health, February 2005.
Australian Cerebral Palsy Register Report | 2009 49
yy Imms C, Reilly S, Carlin J, Dodd K. Diversity of participation in children with cerebral palsy. Dev Med Child Neurol 2008; 50: 363-9.
yy Jongeling B, Badawi N, Kurinczuk J, Thonell S, Watson L, Dixon G, Stanley F. Cranial ultrasound as a predictor of outcome in term newborn encephalopathy. Pediatric Neurology. 2002; 26(1):37-42
yy Lawson RD, Badawi N. Etiology of cerebral palsy. Hand Clinics. 2003; 19(4):547-56
yy McMichael GL, Gibson CS, Goldwater PN, Haan EA, Priest K, Dekker GA, MacLennan AH. Association between Apolipoprotein E genotype and cerebral palsy is not confirmed in a Caucasian population. Human Genetics 2008; 124: 411-416.
yy Palmer L, Petterson B, Blair E, Burton P. Family patterns of gestational age at delivery and growth in utero in moderate and severe cerebral palsy. Developmental Medicine and Child Neurology 1994; 36: 1108-1119.
yy Palmer L, Petterson B, Blair E, Burton P. Antenatal antecedents of moderate and severe cerebral palsy. Paediatric and Perinatal Epidemiology 1995; 9: 171-184.
yy Peek A, van Essen P, Gibson CS, Scott H, Chan A, Haan E. 2007 Annual Report of The South Australian Cerebral Palsy Register. Adelaide: South Australian Cerebral Palsy Register, Children, Youth and Women’s Health Service, 2008.
yy Petterson B, Stanley FJ, Henderson D. Cerebral palsy in multiple births in Western Australia, 1956-80. American Journal of Medical Genetics 1990; 37: 346-351.
yy Petterson B, Stanley FJ. Spastic quadriplegia in Western Australia: A genetic epidemiological study. II. Pedigrees and family patterns of birth weight and gestational age. Developmental Medicine and Child Neurology 1993; 35: 202-215.
yy Petterson B, Nelson KB, Watson L, Stanley FJ. Twins, triplets and cerebral palsy in births in Western Australia in the 1980s. British Medical Journal 1993; 307: 1239-1243.
yy Petterson B, Blair E, Watson L, Stanley F. Adverse outcome after multiple pregnancy. Bailliere’s Clinical Obstetrics and Gynaecology 1998; 12: 1-17.
yy Reddihough DS, Baikie G, Walstab J. Cerebral palsy in Victoria: mortality and causes of death. Journal of Paediatrics and Child Health. 2001; 37:183-186.
yy Reddihough DS, Collins KJ. The epidemiology and causes of cerebral palsy. Australian Journal of Physiotherapy. 2003:49:7-12.
yy Reid SM, Lanigan A, Walstab JE, Reddihough DS. The Victorian Cerebral Palsy Register: Third Report 2005. Murdoch Childrens Research Institute, Melbourne.
yy Reid SM, Lanigan A, Reddihough D Postneonatally-acquired cerebral palsy in Victoria, Australia, 1970-1999. Accepted for publication in the Journal of Paediatrics and Child Health. March 2006
yy Reid S, Halliday J, Ditchfield M, Ekert H, Byron K, Glynn A, Petrou V, Reddihough, D. Factor V Leiden mutation – a contributory factor for cerebral palsy? Developmental Medicine and Child Neurology, 2006; 48:14-19.
yy Rice J, Russo R, Halbert J, van Essen P, Haan E. Motor function in five-year-old children with cerebral palsy in the South Australian population. Dev Med Child Neurol 2009; 57(7): 551-556.
yy Robinson M, Peake L, Ditchfield M, Reid S, Lanigan A, Reddihough D. Magnetic resonance imaging findings in a population-based cohort of children with cerebral palsy. Accepted for publication in Developmental Medicine & Child Neurology, April 2008
yy Russo RN, Crotty M, Miller MD, Murchland S, Flett P, Haan E. Upper limb botulinum toxin A injection and occupational therapy in children with hemiplegic cerebral palsy identified from a population register: a single blind randomised controlled trial. Pediatrics 2007; 119(5): e1149-58.
yy Scher AI, Petterson B, Blair E, Ellenberg JH, Grether JK, Haan E, Reddihough DS, Yeargin-Allsopp M, Nelson KB. The risk of mortality or cerebral palsy in twin: a collaborative population-based study. Pediatric Research,2002;52:671-681
yy Scott H, Tungaraza K, van Essen P, Chan A, Haan E. 2003 Annual Report of The South Australian Cerebral Palsy Register. Adelaide: South Australian Cerebral Palsy Register, Women’s and Children’s Hospital, 2004.
yy Scott H, Davies AM, van Essen P, Chan A, Haan E. 2005 Annual Report of The South Australian Cerebral Palsy Register. Adelaide: South Australian Cerebral Palsy Register, Children, Youth and Women’s Health Service, 2006.
yy Sharpe P, Gilbert M, Scott H, Chan A, Haan E. 2001 Annual Report of The South Australian Cerebral Palsy Register. Adelaide: South Australian Cerebral Palsy Register, Women’s and Children’s Hospital, 2002.
yy Sharpe P, Tungaraza K, Scott H, Chan A, Haan E. 2002 Annual Report of The South Australian Cerebral Palsy Register. Adelaide: South Australian Cerebral Palsy Register, Women’s and Children’s Hospital, 2003.
yy Shelly A, Davis E, Waters E, Mackinnon A, Reddihough D, Boyd R, Reid S, Graham HK. The relationship between quality of life (QOL) and functioning for children with cerebral palsy. Developmental Medicine and Child Neurology 2008;50:199-203.
yy Skok A, Harvey D, Reddihough D. Perceived stress, perceived social support, and wellbeing among mothers of school-aged children with cerebral palsy: a brief report. Journal of Intellectual & Developmental Disability. 2006;31(1):53-57.
yy Soo B, Howard J, Boyd R, Reid S, Lanigan A, Wolfe R, Reddihough D, Graham H K Hip displacement in cerebral palsy: Hip displacement in cerebral palsy. Journal of Bone and Joint Surgery 2006; 88:121-129.
yy Stanley FJ. An epidemiological study of cerebral palsy in Western Australia, 1956-1975. I: Changes in total incidence of cerebral palsy and associated factors. Developmental Medicine and Child Neurology 1979; 21: 701-713.
yy Stanley FJ. Neonatal mortality and cerebral palsy: The impact of neonatal intensive care. Australian Paediatric Journal 1980; 16: 35-39.
yy Stanley FJ. The epidemiology of cerebral palsy. In Araujo L (ed), Cerebral Palsy. Rio de Janeiro: Livra Editora S.A.
yy Stanley FJ. Spastic cerebral palsy: Changes in birthweight and gestational age. Early Human Development 1981; 5: 167-178.
yy Stanley FJ. The use of a register in assessing the level of handicap in the community: The WA Cerebral Palsy Register. Community Health Studies 1982; 6: 135-143.
50 Australian Cerebral Palsy Register Report | 2009
yy Stanley FJ, Watson L, Mauger S. The First Report of the Western Australian Cerebral Palsy Register. Perth: NHMRC Research Unit in Epidemiology and Preventive Medicine, 1984.
yy Stanley FJ, Watson LD. Methodology of a cerebral palsy register: The Western Australian experience. Neuroepidemiology 1985; 4: 146.
yy Stanley FJ, English DR. Prevalence of and risk factors for cerebral palsy in a total population cohort of low birthweight (<2000g) infants. Developmental Medicine and Child Neurology 1986; 28: 559.
yy Stanley FJ, Watson L, Mauger S. The Second Report of the Western Australian Cerebral Palsy Register. Perth: NHMRC Research Unit in Epidemiology and Preventive Medicine, 1987.
yy Stanley FJ. The changing face of cerebral palsy. Developmental Medicine and Child Neurology 1987; 29: 258-270.
yy Stanley FJ, Watson LD. The cerebral palsies in Western Australia: Trends, 1968 to 1981. American Journal of Obstetrics and Gynecology 1988; 158: 89-93.
yy Stanley FJ, Blair E. Why have we failed to reduce the frequency of cerebral palsy? Medical Journal of Australia 1991; 154: 623-626.
yy Stanley FJ, Watson LW. Trends in perinatal mortality and cerebral palsy in Western Australia. British Medical Journal 1992; 304: 1658-1663.
yy Stanley FJ. Trends in cerebral palsy in Western Australia [letter]. British Medical Journal 1992; 305: 525-526.
yy Stanley FJ, Blair E. Cerebral palsy and the quality of obstetric care. Cerebral Palsy Today 1992; 1(4): 1-3.
yy Stanley FJ. Survival and cerebral palsy in low birth weight infants: implications for perinatal care. Paediatric and Perinatal Epidemiology 1992; 6: 298-310.
yy Stanley FJ, Blair E, Petterson B, Hockey A, Watson L. Spastic quadriplegia in Western Australia: A genetic epidemiological study. I. The case population and perinatal risk factors. Developmental Medicine and Child Neurology 1993; 35: 191-201.
yy Stanley FJ, Blair E. Cerebral palsy. In: Pless IB (ed), The Epidemiology of Childhood Disorders. New York: Oxford University Press, 1994.
yy Stanley FJ. The aetiology of cerebral palsy. Early Human Development 1994; 36: 81-88.
yy Stanley FJ. Cerebral palsy trends. Implications for perinatal care. Acta Obstetricia et Gynecologica Scandinavica 1994; 73: 5-9.
yy Stanley FJ. Obstetrical responsibility for abnormal fetal outcome. In Chamberlain G (ed), Turnbull’s Obstetrics, 2nd Edition. London: Churchill Livingstone, 1995: 833-844.
yy Stanley FJ, Petterson B. Cerebral palsy in multiple births: the changing epidemiological patterns. In Ward RH and Whittle M (eds), Multiple Pregnancy. London: RCOG Press, 1995: 309-325.
yy Stanley FJ, Blair E, Westaway J. Cerebral palsy. The role of obstetric care in pregnancy and delivery. A monograph for lawyers, parents and doctors. Perth: United Medical Defence, 1995.
yy Stanley FJ. Prenatal determinants of motor disorders. Acta Paediatr Suppl 1997; 422: 92-102
yy Stanley FJ, Alberman ED, Blair E. The Cerebral Palsies: Epidemiology and Causal Pathways. Spastics International Medical Publications, Clinics in Developmental Medicine. London: Blackwells, 2000.
yy Strijbis EMM, Oudman I, van Essen P, MacLennan AH. Cerebral palsy and the application of the international criteria for acute intrapartum hypoxia. Obstet Gynecol 2006; 107:1357.
yy van Essen P, Tungaraza K, Scott H, Chan A, Haan E. 2004 Annual Report of The South Australian Cerebral Palsy Register. Adelaide: South Australian Cerebral Palsy Register, Children, Youth and Women’s Health Service, 2005.
yy van Essen P, Peek A, Scott H, Chan A, Haan E. 2006 Annual Report of The South Australian Cerebral Palsy Register. Adelaide: South Australian Cerebral Palsy Register, Children, Youth and Women’s Health Service, 2007.
yy Walstab J, Bell R, Reddihough D, Brennecke S, Bessell C, Beischer N. Antenatal and intrapartum antecedents of cerebral palsy – a case-control study. Aust NZ J Obstet Gynaecol 2002;42:2:138-146.
yy Walstab J, Bell R, Reddihough D, Brennecke S, Bessell C, Beischer N. Maternal antecedents to cerebral palsy in preterm infants. Letter to the Editor. Developmental Medicine and Child Neurology. 2002;44:498.
yy Walstab JE, Bell RJ, Reddihough DS, Brennecke SP, Bessel CK and Beischer NA. Factors identified during the neonatal period associated with the risk of cerebral palsy. Australian and New Zealand Journal of Obstetrics and Gynaecology 44: 342-346 (2004)
yy Waters E, Davis E, Reddihough D, Graham HK, Mackinnon, A, Wolfe, R, Stevenson, R, Bjornsen, K, Blair, E, Hoare, P, Ravens-Sieberer, U, Boyd, R. A new condition-specific quality of life scale for children with cerebral palsy. PRO Newsletter, 2005; 35: 10-12.
yy Waters E, Maher E, Salmon L, Reddihough D, Boyd R. Development of a condition-specific measure of quality of life for children with cerebral palsy: empirical thematic data reported by parents and children. Child: Care, Health and Development 2005;31(2):127-135
yy Waters, E, Davis E, Mackinnon A, Boyd R, Graham H, Lo S, Wolfe R, Stevenson R, Bjornson K, Blair E, Hoare P, RavensSieberer U. Reddihough D, Cerebral Palsy Quality of Life Questionnaire for Children (CP QOL- Child): Psychometric properties of the quality of life questionnaire for children with CP. Developmental Medicine and Child Neurology. 2007;49:-55.
yy Watson L, Stanley F, Blair E. Report of the Western Australian Cerebral Palsy Register to Birth Year 1994. Perth: TVW Telethon Institute for Child Health Research, Dec 1999.
yy Watson L, Stanley F, Blair E. Report of the Western Australian Cerebral Palsy Register to Birth Year 1999. Perth: TICHR, 2006.
yy Yin R, Reddihough DS, Ditchfield MR, Collins KJ. MRI findings in cerebral palsy. Journal of Paediatrics and Child Health 2000;36:139-144
Australian Cerebral Palsy Register Report | 2009 51


