Australian and global HFC, PFC, Sulfur Hexafluoride ... · PFC, Sulfur Hexafluoride, Nitrogen...
36
OCEANS & ATMOSPHERE FLAGSHIP Australian and global HFC, PFC, Sulfur Hexafluoride, Nitrogen Trifluoride and Sulfuryl Fluoride Emissions B. L. Dunse, P. J. Fraser, P. B. Krummel, L. P. Steele and N. Derek June 2015 Report prepared for Australian Government Department of the Environment
Transcript of Australian and global HFC, PFC, Sulfur Hexafluoride ... · PFC, Sulfur Hexafluoride, Nitrogen...
OCEANS & ATMOSPHERE FLAGSHIP
Australian and global HFC,
PFC, Sulfur Hexafluoride,
Nitrogen Trifluoride and Sulfuryl Fluoride Emissions
B. L. Dunse, P. J. Fraser, P. B. Krummel, L. P. Steele and N. Derek June 2015 Report prepared for Australian Government Department of the Environment
CSIRO Oceans and Atmosphere Flagship / Collaboration for Australian Weather and Climate Research
Citation
Dunse, B. L., P. J. Fraser, P. B. Krummel, L. P. Steele and N. Derek, Australian HFC, PFC, sulfur hexafluoride and sulfuryl fluoride emissions, Report prepared for Australian Government Department of the Environment, by the Collaboration for Australian Weather and Climate Research, CSIRO Oceans and Atmosphere Flagship, Aspendale, Australia, iv, 28 pp., 2015.
Copyright and disclaimer
© 2015 CSIRO To the extent permitted by law, all rights are reserved and no part of this publication covered by copyright may be reproduced or copied in any form or by any means except with the written permission of CSIRO.
Important disclaimer
CSIRO advises that the information contained in this publication comprises general statements based on scientific research. The reader is advised and needs to be aware that such information may be incomplete or unable to be used in any specific situation. No reliance or actions must therefore be made on that information without seeking prior expert professional, scientific and technical advice. To the extent permitted by law, CSIRO (including its employees and consultants) excludes all liability to any person for any consequences, including but not limited to all losses, damages, costs, expenses and any other compensation, arising directly or indirectly from using this publication (in part or in whole) and any information or material contained in it.
Australian PFC, HFC, SF6 and SO2F2 emissions | i
Contents
Figures ` ............................................................................................................................................................................ ii
Tables .............................................................................................................................................................................iii
Acknowledgments ..............................................................................................................................................................iv
1 Introduction ......................................................................................................................................................... 1
2 Measurements of HFCs, PFCs, sulfur hexafluoride, nitrogen trifluoride, sulfuryl fluoride and trifluromethyl sulfur pentafluoride at Cape Grim, Tasmania ...................................................................................................... 2
3 Global HFC, PFC, sulphur hexafluoride, nitrogen trifluoride and sulfuryl fluoride emissions .............................. 5
4 Australian HFC, PFC and sulfur hexafluoride imports, banks and emissions ....................................................... 6
5 Australian HFC, PFC, sulfur hexafluoride and sulfuryl fluoride emissions from atmospheric data .................... 10
5.1 PFC-14 emissions .................................................................................................................................... 10
5.2 Other PFC emissions ............................................................................................................................... 13
5.3 HFC, sulfur hexafluoride and sulfuryl fluoride emissions ....................................................................... 14
6 Comparisons of NGA, ISC & NAME emission estimates ..................................................................................... 17
6.1 HFC-134a ................................................................................................................................................. 17
6.2 HFC-125................................................................................................................................................... 17
6.3 HFC-143a ................................................................................................................................................. 17
6.4 HFC-32..................................................................................................................................................... 18
6.5 HFC-152a ................................................................................................................................................. 18
6.6 HFC-23..................................................................................................................................................... 18
6.7 HFC-227ea ............................................................................................................................................... 19
6.8 HFC-236fa, HFC-245fa, HFC-365mfc ....................................................................................................... 19
6.9 HFC-134 & HFC-4310mee ....................................................................................................................... 19
6.10 Total HFCs ............................................................................................................................................... 19
6.11 Sulfur hexafluoride ................................................................................................................................. 20
6.12 Sulfuryl fluoride ...................................................................................................................................... 21
6.13 Total HFCs, PFC and sulfur hexafluoride emissions ................................................................................ 21
Summary ........................................................................................................................................................................... 23
References ........................................................................................................................................................................ 25
ii | Fraser et al., 2015
Figures
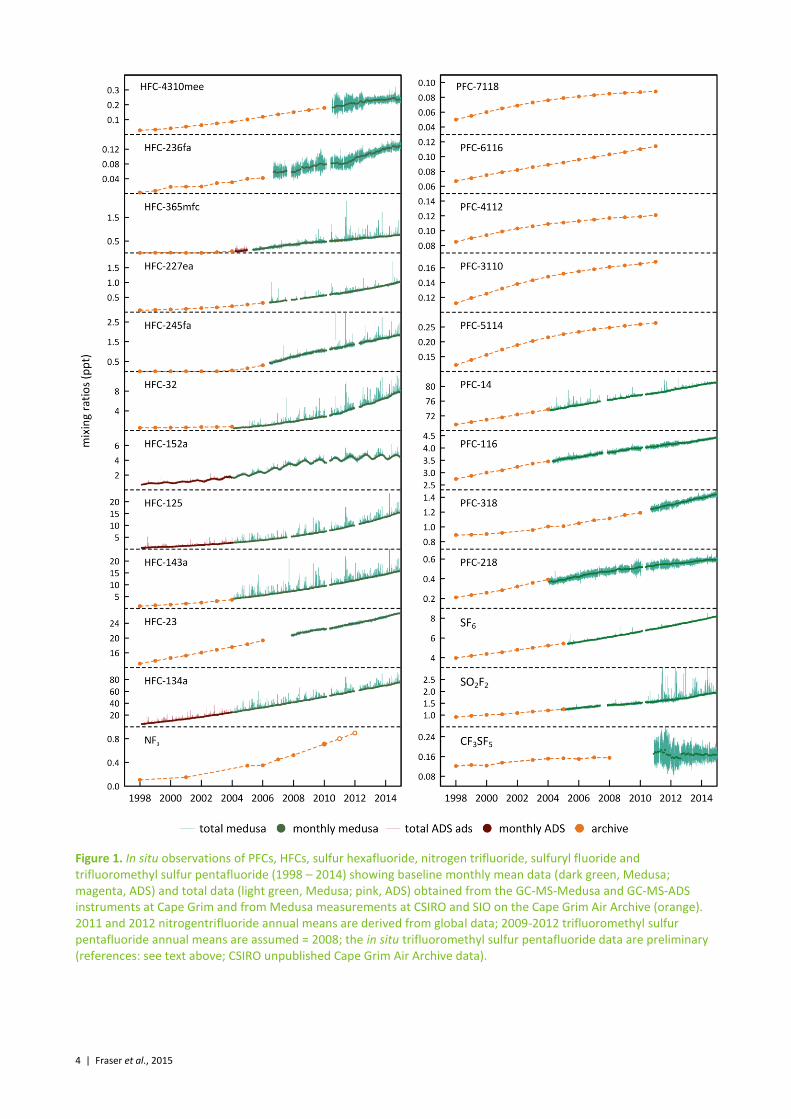
Figure 1. In situ observations of PFCs, HFCs, sulfur hexafluoride, nitrogen trifluoride, sulfuryl fluoride and trifluoromethyl sulfur pentafluoride (1998 – 2014) showing baseline monthly mean data (dark green, Medusa; magenta, ADS) and total data (light green, Medusa; pink, ADS) obtained from the GC-MS-Medusa and GC-MS-ADS instruments at Cape Grim and from Medusa measurements at CSIRO and SIO on the Cape Grim Air Archive (orange). 2011 and 2012 nitrogentrifluoride annual means are derived from global data; 2009-2012 trifluoromethyl sulfur pentafluoride annual means are assumed = 2008; the in situ trifluoromethyl sulfur pentafluoride data are preliminary (references: see text above; CSIRO unpublished Cape Grim Air Archive data). .............................. 4
Figure 2. Global HFC, PFC, sulphur hexafluoride and nitrogen trifluoride emissions (left: k tonnes; right: M tonnes CO2-e) from global AGAGE atmospheric measurements (Rigby et al., 2014). ....................................................................................................................... 5
Figure 3. Australian HFC, PFC and sulfur hexafluoride emissions (M tonne CO2-e) (DoE, 2015). Note the impact on the reduction in emissions due to the refurbishment of potline #1 at the Kurri Kurri aluminium smelter in 2005-2006. Dashed lines are exponential best fits. ................................................................................................................................................................................................. 10
Figure 4. Monthly-mean PFC-14 concentrations observed in situ at Cape Grim (dark blue), 2004-2014. PFC-14 pollution episodes (light blue), typically lasting up to 12 hours in duration, are also seen at Cape Grim (Mühle et al., 2010). .......................................... 10
Figure 5. Australian PFC-14 emission factors as reported in the National Inventory Report 2013 (NGA: DoE, 2015) and as derived from atmospheric measurements at Cape Grim using NAME/TAPM (to 2011) and TAPM (to 2013) modelling. The grey band is the average (±1 sd) emission factor derived from NAME/TAPM. The Kurri Kurri emission factor is based on direct PFC-14 measurements made at the Kurri Kurri smelter in 2009 (Fraser et al., 2013). ............................................................................................................... 11
Figure 6. Australian emissions of PFC-14 as recorded in the National Inventory Report 2013 (NGA: DoE, 2015; uncertainty 27%: DIICCSRTE, 2013) and as obtained from TAPM (scaled from Vic/Tas emissions) and NAME-InTEM (scaled from Vic/Tas/NSW emissions) modelling. ............................................................................................................................................................................ 11
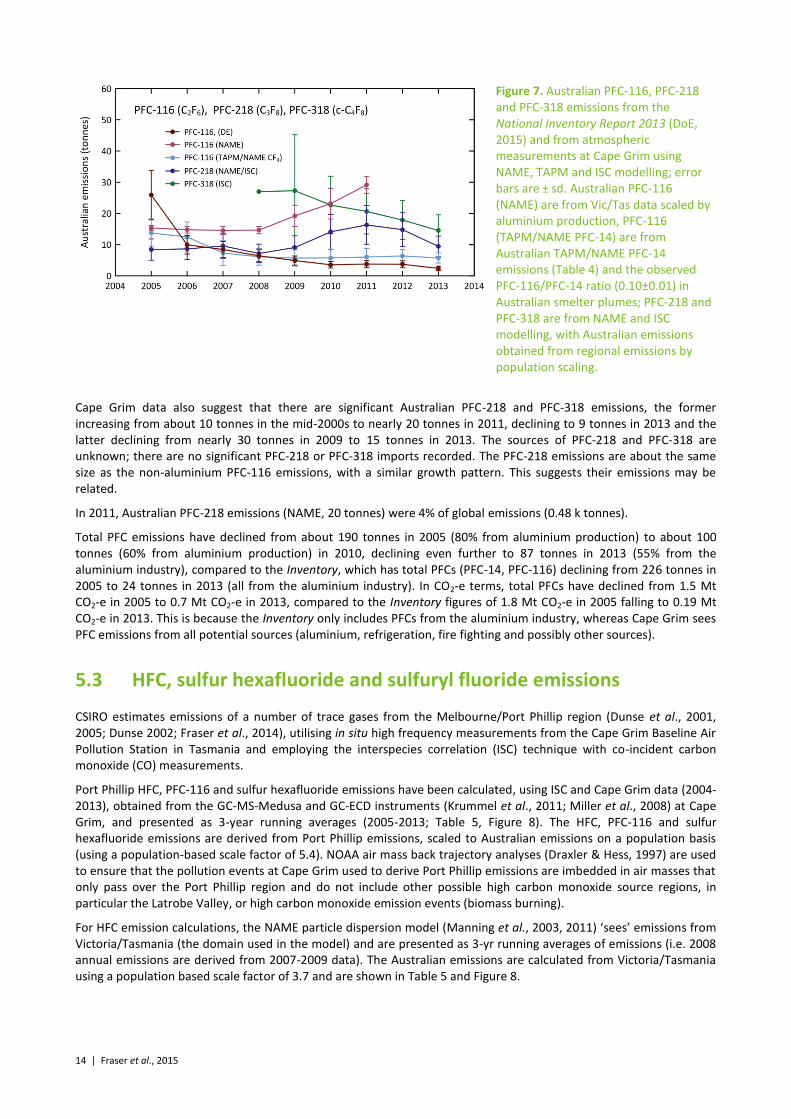
Figure 7. Australian PFC-116, PFC-218 and PFC-318 emissions from the National Inventory Report 2013 (DoE, 2015) and from atmospheric measurements at Cape Grim using NAME, TAPM and ISC modelling; error bars are ± sd. Australian PFC-116 (NAME) are from Vic/Tas data scaled by aluminium production, PFC-116 (TAPM/NAME PFC-14) are from Australian TAPM/NAME PFC-14 emissions (Table 4) and the observed PFC-116/PFC-14 ratio (0.10±0.01) in Australian smelter plumes; PFC-218 and PFC-318 are from NAME and ISC modelling, with Australian emissions obtained from regional emissions by population scaling. ......................... 14
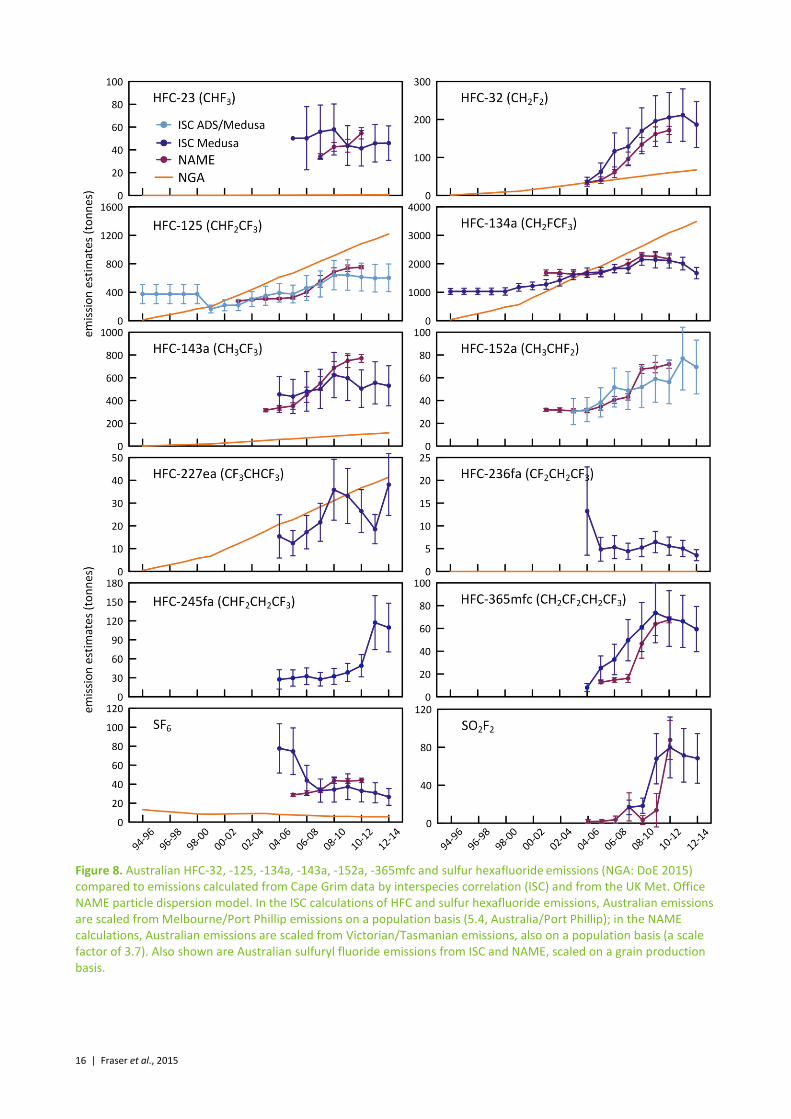
Figure 8. Australian HFC-32, -125, -134a, -143a, -152a, -365mfc and sulfur hexafluoride emissions (NGA: DoE 2015) compared to emissions calculated from Cape Grim data by interspecies correlation (ISC) and from the UK Met. Office NAME particle dispersion model. In the ISC calculations of HFC and sulfur hexafluoride emissions, Australian emissions are scaled from Melbourne/Port Phillip emissions on a population basis (5.4, Australia/Port Phillip); in the NAME calculations, Australian emissions are scaled from Victorian/Tasmanian emissions, also on a population basis (a scale factor of 3.7). Also shown are Australian sulfuryl fluoride emissions from ISC and NAME, scaled on a grain production basis. ..................................................................................................... 16
Figure 9. Australian emissions of HFCs -125, -134a, -143a, -32) and other HFCs (-23, -152a, -227ea, -236fa, -365mfc) estimated from atmospheric data (ISC/NAME) measured at Cape Grim, and in the Inventory (DoE, 2015), expressed in units of M tonne CO2-e. ..... 20
Figure 10. Australian sulfur hexafluoride imports and emissions (tonnes) from Cape Grim data using ISC and NAME (Ganesan et al., 2014; Rigby et al., 2014) and from the Inventory (NGA: DoE, 2015). ................................................................................................... 21
Figure 11. Australian sulfuryl fluoride emissions (tonnes), scaled from SE Australian emissions based on grain production, derived from Cape Grim in situ data, using ISC and NAME techniques; global emissions (tonnes) are from Rigby et al., 2014. ....................... 21
Figure 12. Australian HFC, PFC, sulfur hexafluoride emissions calculated from Cape Grim observations and in the Inventory (NGGI/NGA, ageis.climatechange.gov.au) in M tonne CO2-e. ............................................................................................................... 22
Australian PFC, HFC, SF6 and SO2F2 emissions | iii
Tables
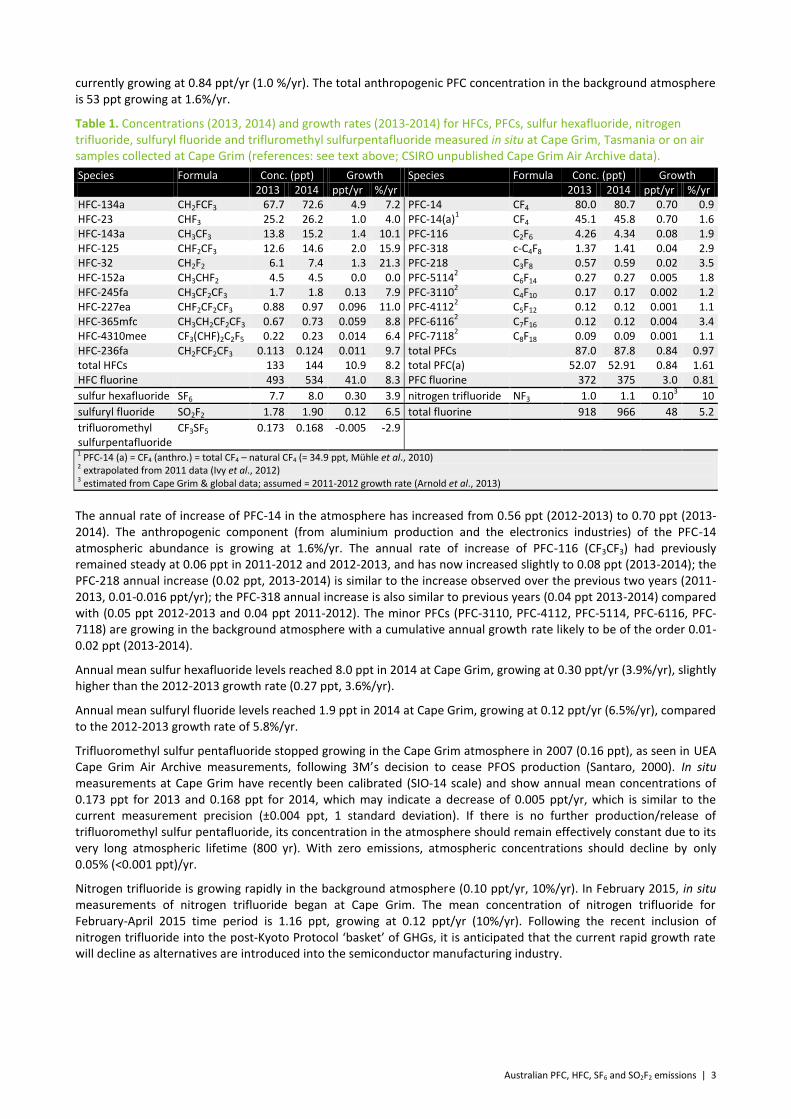
Table 1. Concentrations (2013, 2014) and growth rates (2013-2014) for HFCs, PFCs, sulfur hexafluoride, nitrogen trifluoride, sulfuryl fluoride and trifluromethyl sulfurpentafluoride measured in situ at Cape Grim, Tasmania or on air samples collected at Cape Grim (references: see text above; CSIRO unpublished Cape Grim Air Archive data). ...................................................................................... 3
Table 2. Australian HFC, PFC, sulfur hexafluoride imports (2013, 2014, tonnes; A. Gabriel, Department of Environment, 2014), HFC bank (2013, tonnes; Brodribb & McCann, 2013, 2014), total HFC imports in Mt CO2-e (DoE, 2015) and sulphur hexafluoride bank (2013, tonnes; A. Gabriel, Department of Environment, 2014 ); PCE = pre-charged equipment. ........................................................... 6
Table 3. Australian HFC, PFC and sulfur hexafluoride emissions (http://unfccc.int/national_reports/ annex_i_ghg_inventories/national_inventories_submissions/items/8812.php). HFC-23 emissions in 1995 from HCFC-22 production in Sydney. Not shown are small HFC-236fa emissions (0.004 tonnes in 2012). Note GWPs used are AR4. ............................................ 8
Table 4. Australian aluminium production (kt: 103 tonnes), Australian PFC-14, PFC-116, PFC-218, PFC-318 emissions (t: tonnes) and
PFC-14, PFC-116 emission factors (g/t aluminium, 2005-2013)derived from atmospheric observations – remote (Portland, Pt Henry, Bell Bay) (3 yr averages, e.g. 2010 = average of 2009, 2010, 2011), using the TAPM and NAME models, directly, at Kurri Kurri, and as reported in the National Inventory Report 2013 (DoE, 2015). .............................................................................................................. 12
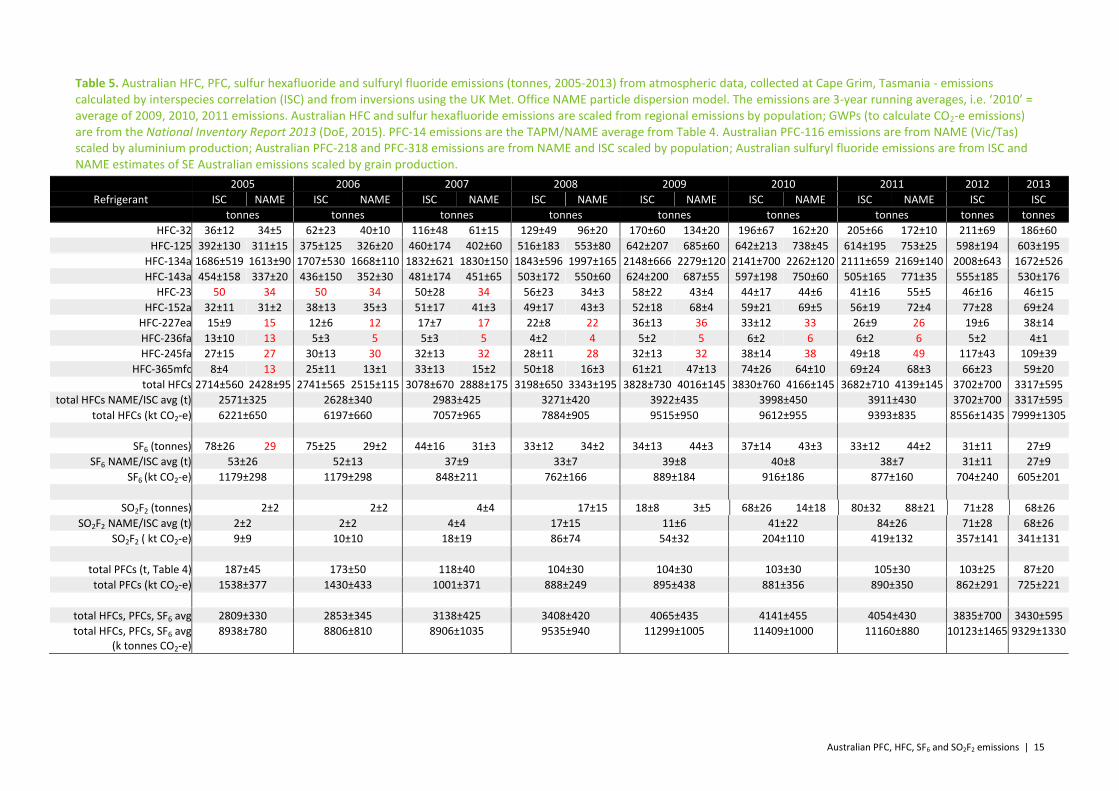
Table 5. Australian HFC, PFC, sulfur hexafluoride and sulfuryl fluoride emissions (tonnes, 2005-2013) from atmospheric data, collected at Cape Grim, Tasmania - emissions calculated by interspecies correlation (ISC) and from inversions using the UK Met. Office NAME particle dispersion model. The emissions are 3-year running averages, i.e. ‘2010’ = average of 2009, 2010, 2011 emissions. Australian HFC and sulfur hexafluoride emissions are scaled from regional emissions by population; GWPs (to calculate CO2-e emissions) are from the National Inventory Report 2013 (DoE, 2015). PFC-14 emissions are the TAPM/NAME average from Table 4. Australian PFC-116 emissions are from NAME (Vic/Tas) scaled by aluminium production; Australian PFC-218 and PFC-318 emissions are from NAME and ISC scaled by population; Australian sulfuryl fluoride emissions are from ISC and NAME estimates of SE Australian emissions scaled by grain production. ............................................................................................................................. 15
iv | Fraser et al., 2015
Acknowledgments
The authors would like to thank the Cape Grim staff for the maintenance and operation of the AGAGE (Advanced Global Atmospheric Gases Experiment) instruments at Cape Grim and for the collection of the Cape Grim Air Archive; Dr D. J. Ivy (MIT USA), Dr B. R. Miller (SIO USA and NOAA USA), Dr D. E. Oram (UEA UK) and the late Mr L. W. Porter (BoM) for gas chromatography-mass spectrometry analyses of the Cape Grim Air Archive; Dr A. J. Manning (UKMO) for synthetic greenhouse gas (SGG) emissions calculations (NAME-InTEM); Dr H. Wang (Georgia Institute of Tachnology, USA) and Dr M. Rigby (U. Bristol UK) for SGG emissions calculations (AGAGE 12-box model); Mr M. Hunstone and Ms. A. Gabriel (Department of the Environment) for SGG import and emissions data; Mr S. Walsh (EPA Victoria) for Port Phillip carbon monoxide emission and concentration data; CSIRO, BoM, NASA/Massachusetts Institute of Technology, Department of the Environment and RRA (Refrigerant Reclaim Australia) for funding in support of the Cape Grim AGAGE program.
Australian PFC, HFC, SF6 and SO2F2 emissions | 1
1 Introduction
Hydrofluorocarbons (HFCs), perfluorocarbons (PFCs), sulfur hexafluoride (SF6) and nitrogen trifluoride (NF3) are potent greenhouse gases (GHGs), which can be collectively described as Kyoto Protocol synthetic GHGs (SGGs). HFCs are used extensively in Australia, largely in air conditioning and refrigeration, initially as ‘ozone-friendly’ replacements for chlorofluorocarbons (CFCs) and hydrochlorofluorocarbons (HCFCs). Minor uses of HFCs in Australia are as aerosol propellants, including metered dose inhalers (MDIs), as foam blowing agents and in fire extinguishers. Perfluorocarbons are a by-product of the production of aluminium in Australia and overseas and, in addition, are used overseas in the electronics industry during the manufacture of integrated circuits and plasma screens. Refrigeration represents a minor use of PFCs in Australia and overseas. Sulfur hexafluoride is used extensively in the electricity distribution industry, both in Australia and overseas, for dielectric insulation and current interruption in circuit breakers, switchgear, and other electrical equipment, and as a cover gas in metal production, for example magnesium. There does not appear to be any significant use of nitrogen trifluoride in Australia, which is used internationally in the semi-conductor production industry, initially as a replacement for PFCs.
Sulfuryl fluoride (SO2F2) and trifluoromethyl sulfur pentafluoride (CF3SF5) are potent synthetic greenhouse gases that are not part of the Kyoto Protocol suite of SGGs. Sulfuryl fluoride use in Australia is growing rapidly, as a replacement for phosphine (PH3) and possibly methyl bromide (CH3Br), in grain fumigation. It is unlikely that trifluoromethyl sulfur pentafluoride is used in Australia. Its occurrence in the atmosphere is largely as a by-product of the production of perfluorooctanesulfonic acid (PFOS: CF3(CF2)7SO3H), which has never been manufactured in Australia, but is a key
ingredient in fabric stain repellants (e.g. 3M’s Scotchguard) and fire-fighting foams. A major fire-fighting training facility in Victoria (Fiskville) was closed in early-2015 due to unacceptably-high levels of PFOS contamination. However, it is unlikely that there are significant trifluoromethyl sulphur pentafluoride emissions in Australia associated with PFOS use.
Rapidly growing HFC emissions are seen as a significant driver of climate change over the next 50 years (Velders et al., 2007, 2009, 2012; Estrada et al., 2013; Harris, Wuebbles et al., 2014; Myhre et al., 2014; Rigby et al., 2014) and projections suggest that unmitigated HFC growth could result in Global Warming Potential (GWP)-weighted emissions approaching 9 Gt CO2-e (carbon dioxide equivalent) per year by 2050 (Daniel & Velders, 2011) and a HFC radiative forcing component as high as 0.4 W/m
2 by 2050 (Harris, Wuebbles et al., 2014). It has been suggested that an
amended Montreal Protocol could phase-down the production and consumption of HFCs (with high GWPs) sooner than possible emission mitigation under a revised Kyoto Protocol or similar agreement (Molina et al., 2009).
The US Environmental Protection Agency (EPA) has proposed delisting or putting controls on a number of high GWP HFCs by end use which were previously considered acceptable alternatives to ozone depleting substances (ODSs). The European Union (EU) also has an HFC phase-down in place. There are no mandated global or Australian targets to phase-down Kyoto Protocol SGG emissions at present, except as contributors to the ‘basket’ of GHGs (CO2, methane – CH4, nitrous oxide – N2O, HFCs, PFCs, sulphur hexafluoride, nitrogen trifluoride) whose total emissions from most developed countries were regulated under the Kyoto Protocol and are currently regulated under post-Kyoto agreements. In early 2010, the Australian Government made a post Kyoto Protocol committment to reduce its total GHG emissions by 5 per cent below 2000 levels by 2020. New GHG emission reduction targets for implementation post-2020 have just been announced by the Australian government: 26%-28% reduction in 2005 emissions by 2030, for submission at the UN Climate Change Conference in Paris late November 2015. This includes a commitment to look at phasing down Australian HFC emissions by 85% by 2036. There are no global or Australian targets to phase-down sulfuryl fluoride or trifluoromethyl sulfur pentafluoride emissions.
Australia reported a total of 542 million tonnes (Mt) CO2-e emitted from all GHG sources in 2013 (not including land-use change), which was a decrease from 2012 emissions (550 Mt) of 1.5%. HFC emissions were 10.0 Mt (9965 k tonnes) CO2-e in 2013, 6.5% above 2012 emissions, while the sum of HFC, PFC and sulphur hexafluoride emissions was 10.3 Mt (10285 k tonnes, Table 3) CO2-e, 5% above 2012 emissions, and 1.9% of total Australian greenhouse gas emissions (DoE, 2015). The total emission of Kyoto Protocol SGGs is the fastest growing emissions sector in the Australian National GHG Inventory (referred to subsequently as the Inventory).
In this Report, we estimate Australian emissions of HFCs, PFCs, sulfur hexafluoride and sulfuryl fluoride derived by inter-species correlation (ISC), inverse and forward atmospheric modelling techniques, using Cape Grim atmospheric observations. These so-called ‘top-down’ estimates are compared to estimates of HFCs, PFCs and sulfur hexafluoride emissions submitted by the Australian government to the United Nations Framework Convention on Climate Change (UNFCCC) (DoE 2015), based on Intergovernmental Panel on Climate Change (IPCC)-recommended ‘bottom-up’ methodologies for estimating national GHG emissions. Australian HFC, PFC and sulphur hexafluoride emissions are compared to global emissions estimated from AGAGE (Advanced Global Atmospheric Gases Experiment; Prinn et al., 2000) atmospheric observations.
2 | Fraser et al., 2015
Cape Grim in situ measurements of nitrogen trifluoride commenced in February 2015 and trifluoromethyl sulfur pentafluoride in late 2010. Preliminary inspections of the data suggest that there are no significant Australian emissions of these species.
2 Measurements of HFCs, PFCs, sulfur hexafluoride, nitrogen trifluoride, sulfuryl fluoride and trifluromethyl sulfur pentafluoride at Cape Grim, Tasmania
Concentrations of HFCs, PFCs, sulfur hexafluoride, nitrogen trifluoride, sulfuryl fluoride and trifluromethyl sulfur pentafluoride have been measured in situ in the Southern Hemisphere atmosphere at Cape Grim, Tasmania, as part of the AGAGE program (Prinn et al., 2000), and/or in the Cape Grim Air Archive (1978-2014) at CSIRO (Aspendale), at the Scripps Institution for Oceanography (SIO, USA), and on a sub-set of the Cape Grim Air Archive at the University of East Anglia (UEA, UK). Other flask air samples from Cape Grim have been analysed at CSIRO, at SIO, at UEA and at the University of Heidelberg (Germany). The SGGs have been measured by CSIRO in situ in the atmosphere (baseline and non-baseline) at Cape Grim, Tasmania, since the late-1990s (HFCs, PFC-116: CF3CF3) and the mid-2000s (other PFCs, sulfur hexafluoride, sulfuryl fluoride). Nitrogen trifluoride (up to 2013) and trifluromethyl sulfurpentafluoride (up to 2008) have been measured on the Cape Grim Air Archive. In situ measurements of nitrogen trifluoride and trifluoromethyl sulfur pentafluoride have recently become available (February 2015 for nitrogen trifluoride and recently calibrated trifluoromethyl sulfur pentafluoride going back to late 2010). These data are used, in conjunction with similar data collected from other Northern and Southern Hemispheric sites, to estimate global and regional concentration trends, atmospheric lifetimes, emissions and radiative forcings for these species:
HFCs Oram et al., 1996, 1998; Oram, 1999; Prinn et al., 2000; O’Doherty et al., 2004, 2009, 2014; Greally et al., 2007; Stohl et al.,2009; Miller et al., 2010; Vollmer et al., 2011; Fortems-Cheney et al., 2013; Arnold et al., 2014; Fraser et al., 2014a; Krummel et al., 2014; Rigby et al., 2014; Lunt et al., 2015; Simmonds et al., 2015a
PFCs Oram, 1999; Fraser et al., 2007, 2011, 2013; Mühle et al., 2010; Ivy, 2012; Ivy et al., 2012; Laube et al., 2012; Oram et al., 2012; Kim et al., 2014; Krummel et al., 2014; Rigby et al., 2014; Wong et al., 2015
SF6 Maiss et al., 1996; Oram, 1999; Fraser et al., 2004, 2014a; Levin et al., 2010; Rigby et al., 2010, 2014; Ganesan et al., 2014; Krummel et al., 2014
NF3 Weiss et al., 2008; Arnold et al., 2013; Rigby et al., 2014 SO2F2 Muhle et al., 2009; Krummel et al., 2014 CF3SF5 Sturges et al., 2012
The abundances and trends of HFCs, PFCs, sulfur hexafluoride, nitrogen trifluoride, sulfuryl fluoride and trifluoromethyl sulfur pentafluoride in the global background atmosphere, as measured at Cape Grim, Tasmania, or in the Cape Grim air archive, are shown in Table 1 (2013-2014) and Figure 1 (1978-2014).
The major HFC in the background atmosphere at Cape Grim (and around the globe) is HFC-134a (73 ppt in 2014), followed by HFC-23 (26 ppt), HFC-125 (15 ppt), HFC-143a (15 ppt), HFC-32 (7.4 ppt) and HFC-152a (4.5 ppt). The cumulative concentration of the minor HFCs (HFC-245fa, HFC-227ea, HFC-236fa, HFC-365mfc, HFC-4310mee) is 3.9 ppt (2014). The total HFC concentration in the background atmosphere is 144 ppt (2014).
The global annual rate of increase of HFC-134a has increased from 4.2 ppt (2012-2013) to 4.9 ppt (2013-2014); the HFC-23 growth rate (0.8 ppt, 2011-2012 & 2012-2013) has increased slightly to 1.0 ppt (2013-2014); the HFC-143a annual increase (1.1 ppt, 2012-2013) has increased to 1.4 ppt (2013-2014); the HFC-125 annual increase (1.3, 2012-2013) has increased to 2.0 ppt/yr (2013-2014); the HFC-152a annual increase has remained steady (0.0 ppt, 2012-2013, 2013-2014) such that HFC-152a is no longer growing in the background atmosphere; the HFC-32 increase (0.9 ppt, 2012-2013) has increased to 1.3 ppt (2013-2014). The minor HFCs (HFC-227ea, HFC-236fa, HFC-365mfc, HFC-4310mee) are growing in the background atmosphere with a cumulative annual growth rate of 0.18 ppt (2013-2014). The annual growth in total HFCs (11 ppt, 2013-2014) has increased from 9 ppt (2012-2013), returning to the annual increase of 11 ppt seen in 2011-2012. Total HFCs in the atmosphere are growing currently (2013-2014) at 8%/yr.
The major PFC in the background atmosphere at Cape Grim (and around the globe) is PFC-14 (CF4: 81 ppt in 2014, about half of which is naturally-occurring), followed by PFC-116 (4.3 ppt), PFC-318 (1.4 ppt) and PFC-218 (0.59 ppt). The cumulative concentration of five minor PFCs (PFC-3110, PFC-4112, PFC-5114, PFC-6116, PFC-7118) observed at Cape Grim is 0.8 ppt (2013, 2014). The total PFC concentration in the background atmosphere is 88 ppt (2014),
Australian PFC, HFC, SF6 and SO2F2 emissions | 3
currently growing at 0.84 ppt/yr (1.0 %/yr). The total anthropogenic PFC concentration in the background atmosphere is 53 ppt growing at 1.6%/yr.
Table 1. Concentrations (2013, 2014) and growth rates (2013-2014) for HFCs, PFCs, sulfur hexafluoride, nitrogen trifluoride, sulfuryl fluoride and trifluromethyl sulfurpentafluoride measured in situ at Cape Grim, Tasmania or on air samples collected at Cape Grim (references: see text above; CSIRO unpublished Cape Grim Air Archive data).
Species Formula Conc. (ppt) Growth Species Formula Conc. (ppt) Growth 2013 2014 ppt/yr %/yr 2013 2014 ppt/yr %/yr
HFC-134a CH2FCF3 67.7 72.6 4.9 7.2 PFC-14 CF4 80.0 80.7 0.70 0.9 HFC-23 CHF3 25.2 26.2 1.0 4.0 PFC-14(a)
1 CF4 45.1 45.8 0.70 1.6
HFC-143a CH3CF3 13.8 15.2 1.4 10.1 PFC-116 C2F6 4.26 4.34 0.08 1.9 HFC-125 CHF2CF3 12.6 14.6 2.0 15.9 PFC-318 c-C4F8 1.37 1.41 0.04 2.9 HFC-32 CH2F2 6.1 7.4 1.3 21.3 PFC-218 C3F8 0.57 0.59 0.02 3.5 HFC-152a CH3CHF2 4.5 4.5 0.0 0.0 PFC-5114
2 C6F14 0.27 0.27 0.005 1.8
HFC-245fa CH3CF2CF3 1.7 1.8 0.13 7.9 PFC-31102 C4F10 0.17 0.17 0.002 1.2
HFC-227ea CHF2CF2CF3 0.88 0.97 0.096 11.0 PFC-41122 C5F12 0.12 0.12 0.001 1.1
HFC-365mfc CH3CH2CF2CF3 0.67 0.73 0.059 8.8 PFC-61162 C7F16 0.12 0.12 0.004 3.4
HFC-4310mee CF3(CHF)2C2F5 0.22 0.23 0.014 6.4 PFC-71182 C8F18 0.09 0.09 0.001 1.1
HFC-236fa CH2FCF2CF3 0.113 0.124 0.011 9.7 total PFCs 87.0 87.8 0.84 0.97 total HFCs 133 144 10.9 8.2 total PFC(a) 52.07 52.91 0.84 1.61 HFC fluorine 493 534 41.0 8.3 PFC fluorine 372 375 3.0 0.81
sulfur hexafluoride SF6 7.7 8.0 0.30 3.9 nitrogen trifluoride NF3 1.0 1.1 0.103 10
sulfuryl fluoride SO2F2 1.78 1.90 0.12 6.5 total fluorine 918 966 48 5.2
trifluoromethyl sulfurpentafluoride
CF3SF5 0.173 0.168 -0.005 -2.9
1 PFC-14 (a) = CF4 (anthro.) = total CF4 – natural CF4 (= 34.9 ppt, Mühle et al., 2010) 2 extrapolated from 2011 data (Ivy et al., 2012) 3 estimated from Cape Grim & global data; assumed = 2011-2012 growth rate (Arnold et al., 2013)
The annual rate of increase of PFC-14 in the atmosphere has increased from 0.56 ppt (2012-2013) to 0.70 ppt (2013-2014). The anthropogenic component (from aluminium production and the electronics industries) of the PFC-14 atmospheric abundance is growing at 1.6%/yr. The annual rate of increase of PFC-116 (CF3CF3) had previously remained steady at 0.06 ppt in 2011-2012 and 2012-2013, and has now increased slightly to 0.08 ppt (2013-2014); the PFC-218 annual increase (0.02 ppt, 2013-2014) is similar to the increase observed over the previous two years (2011-2013, 0.01-0.016 ppt/yr); the PFC-318 annual increase is also similar to previous years (0.04 ppt 2013-2014) compared with (0.05 ppt 2012-2013 and 0.04 ppt 2011-2012). The minor PFCs (PFC-3110, PFC-4112, PFC-5114, PFC-6116, PFC-7118) are growing in the background atmosphere with a cumulative annual growth rate likely to be of the order 0.01-0.02 ppt (2013-2014).
Annual mean sulfur hexafluoride levels reached 8.0 ppt in 2014 at Cape Grim, growing at 0.30 ppt/yr (3.9%/yr), slightly higher than the 2012-2013 growth rate (0.27 ppt, 3.6%/yr).
Annual mean sulfuryl fluoride levels reached 1.9 ppt in 2014 at Cape Grim, growing at 0.12 ppt/yr (6.5%/yr), compared to the 2012-2013 growth rate of 5.8%/yr.
Trifluoromethyl sulfur pentafluoride stopped growing in the Cape Grim atmosphere in 2007 (0.16 ppt), as seen in UEA Cape Grim Air Archive measurements, following 3M’s decision to cease PFOS production (Santaro, 2000). In situ measurements at Cape Grim have recently been calibrated (SIO-14 scale) and show annual mean concentrations of 0.173 ppt for 2013 and 0.168 ppt for 2014, which may indicate a decrease of 0.005 ppt/yr, which is similar to the current measurement precision (±0.004 ppt, 1 standard deviation). If there is no further production/release of trifluoromethyl sulfur pentafluoride, its concentration in the atmosphere should remain effectively constant due to its very long atmospheric lifetime (800 yr). With zero emissions, atmospheric concentrations should decline by only 0.05% (<0.001 ppt)/yr.
Nitrogen trifluoride is growing rapidly in the background atmosphere (0.10 ppt/yr, 10%/yr). In February 2015, in situ measurements of nitrogen trifluoride began at Cape Grim. The mean concentration of nitrogen trifluoride for February-April 2015 time period is 1.16 ppt, growing at 0.12 ppt/yr (10%/yr). Following the recent inclusion of nitrogen trifluoride into the post-Kyoto Protocol ‘basket’ of GHGs, it is anticipated that the current rapid growth rate will decline as alternatives are introduced into the semiconductor manufacturing industry.
4 | Fraser et al., 2015
Figure 1. In situ observations of PFCs, HFCs, sulfur hexafluoride, nitrogen trifluoride, sulfuryl fluoride and trifluoromethyl sulfur pentafluoride (1998 – 2014) showing baseline monthly mean data (dark green, Medusa; magenta, ADS) and total data (light green, Medusa; pink, ADS) obtained from the GC-MS-Medusa and GC-MS-ADS instruments at Cape Grim and from Medusa measurements at CSIRO and SIO on the Cape Grim Air Archive (orange). 2011 and 2012 nitrogentrifluoride annual means are derived from global data; 2009-2012 trifluoromethyl sulfur pentafluoride annual means are assumed = 2008; the in situ trifluoromethyl sulfur pentafluoride data are preliminary (references: see text above; CSIRO unpublished Cape Grim Air Archive data).
Australian PFC, HFC, SF6 and SO2F2 emissions | 5
3 Global HFC, PFC, sulphur hexafluoride, nitrogen trifluoride and sulfuryl fluoride emissions
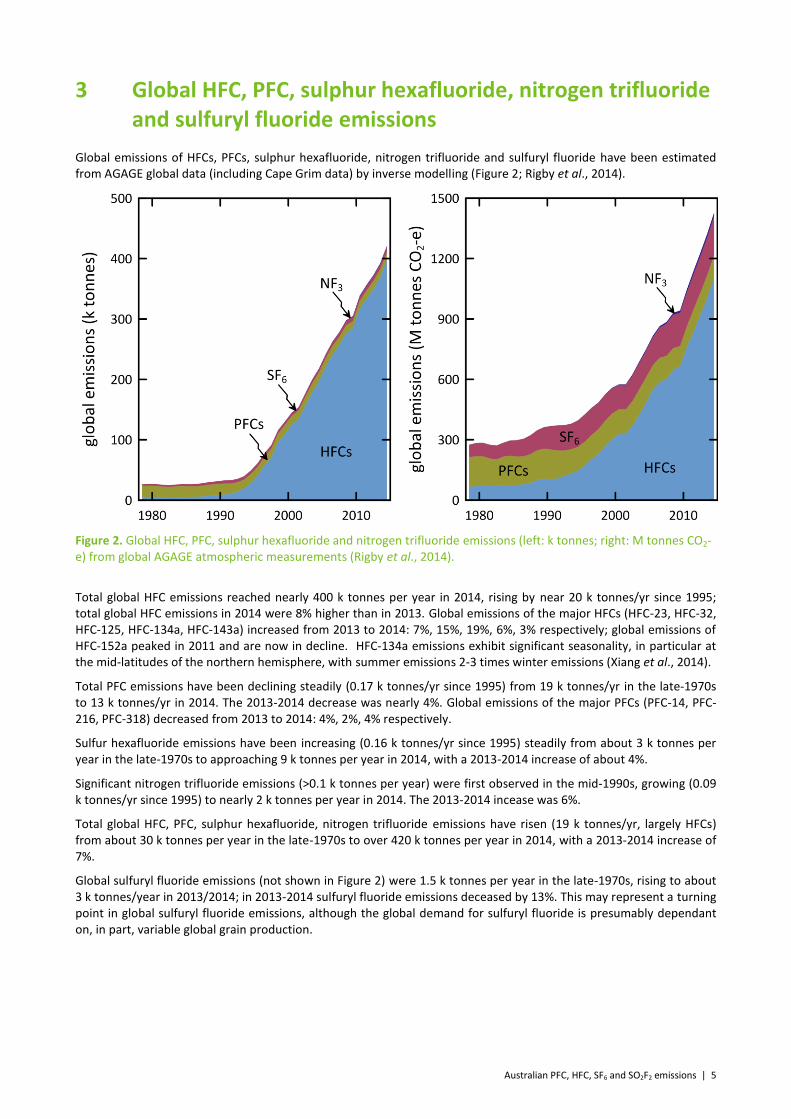
Global emissions of HFCs, PFCs, sulphur hexafluoride, nitrogen trifluoride and sulfuryl fluoride have been estimated from AGAGE global data (including Cape Grim data) by inverse modelling (Figure 2; Rigby et al., 2014).
Figure 2. Global HFC, PFC, sulphur hexafluoride and nitrogen trifluoride emissions (left: k tonnes; right: M tonnes CO2-e) from global AGAGE atmospheric measurements (Rigby et al., 2014).
Total global HFC emissions reached nearly 400 k tonnes per year in 2014, rising by near 20 k tonnes/yr since 1995; total global HFC emissions in 2014 were 8% higher than in 2013. Global emissions of the major HFCs (HFC-23, HFC-32, HFC-125, HFC-134a, HFC-143a) increased from 2013 to 2014: 7%, 15%, 19%, 6%, 3% respectively; global emissions of HFC-152a peaked in 2011 and are now in decline. HFC-134a emissions exhibit significant seasonality, in particular at the mid-latitudes of the northern hemisphere, with summer emissions 2-3 times winter emissions (Xiang et al., 2014).
Total PFC emissions have been declining steadily (0.17 k tonnes/yr since 1995) from 19 k tonnes/yr in the late-1970s to 13 k tonnes/yr in 2014. The 2013-2014 decrease was nearly 4%. Global emissions of the major PFCs (PFC-14, PFC-216, PFC-318) decreased from 2013 to 2014: 4%, 2%, 4% respectively.
Sulfur hexafluoride emissions have been increasing (0.16 k tonnes/yr since 1995) steadily from about 3 k tonnes per year in the late-1970s to approaching 9 k tonnes per year in 2014, with a 2013-2014 increase of about 4%.
Significant nitrogen trifluoride emissions (>0.1 k tonnes per year) were first observed in the mid-1990s, growing (0.09 k tonnes/yr since 1995) to nearly 2 k tonnes per year in 2014. The 2013-2014 incease was 6%.
Total global HFC, PFC, sulphur hexafluoride, nitrogen trifluoride emissions have risen (19 k tonnes/yr, largely HFCs) from about 30 k tonnes per year in the late-1970s to over 420 k tonnes per year in 2014, with a 2013-2014 increase of 7%.
Global sulfuryl fluoride emissions (not shown in Figure 2) were 1.5 k tonnes per year in the late-1970s, rising to about 3 k tonnes/year in 2013/2014; in 2013-2014 sulfuryl fluoride emissions deceased by 13%. This may represent a turning point in global sulfuryl fluoride emissions, although the global demand for sulfuryl fluoride is presumably dependant on, in part, variable global grain production.
6 | Fraser et al., 2015
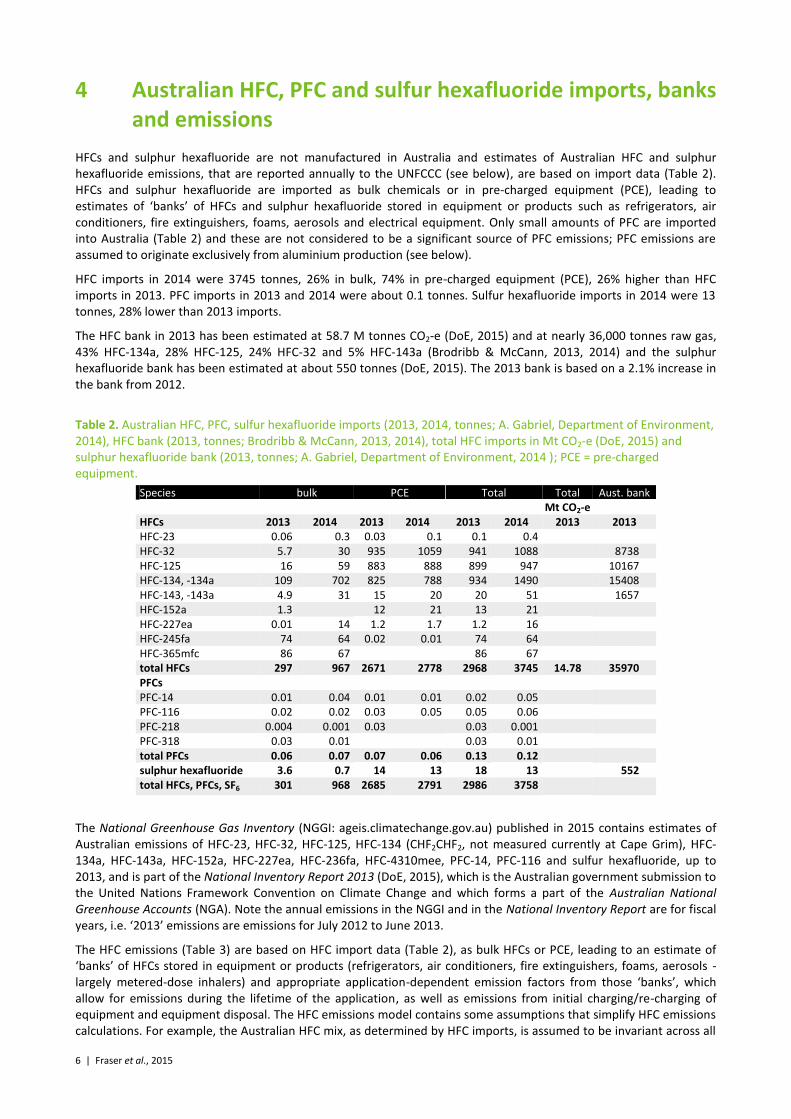
4 Australian HFC, PFC and sulfur hexafluoride imports, banks and emissions
HFCs and sulphur hexafluoride are not manufactured in Australia and estimates of Australian HFC and sulphur hexafluoride emissions, that are reported annually to the UNFCCC (see below), are based on import data (Table 2). HFCs and sulphur hexafluoride are imported as bulk chemicals or in pre-charged equipment (PCE), leading to estimates of ‘banks’ of HFCs and sulphur hexafluoride stored in equipment or products such as refrigerators, air conditioners, fire extinguishers, foams, aerosols and electrical equipment. Only small amounts of PFC are imported into Australia (Table 2) and these are not considered to be a significant source of PFC emissions; PFC emissions are assumed to originate exclusively from aluminium production (see below).
HFC imports in 2014 were 3745 tonnes, 26% in bulk, 74% in pre-charged equipment (PCE), 26% higher than HFC imports in 2013. PFC imports in 2013 and 2014 were about 0.1 tonnes. Sulfur hexafluoride imports in 2014 were 13 tonnes, 28% lower than 2013 imports.
The HFC bank in 2013 has been estimated at 58.7 M tonnes CO2-e (DoE, 2015) and at nearly 36,000 tonnes raw gas, 43% HFC-134a, 28% HFC-125, 24% HFC-32 and 5% HFC-143a (Brodribb & McCann, 2013, 2014) and the sulphur hexafluoride bank has been estimated at about 550 tonnes (DoE, 2015). The 2013 bank is based on a 2.1% increase in the bank from 2012.
Table 2. Australian HFC, PFC, sulfur hexafluoride imports (2013, 2014, tonnes; A. Gabriel, Department of Environment, 2014), HFC bank (2013, tonnes; Brodribb & McCann, 2013, 2014), total HFC imports in Mt CO2-e (DoE, 2015) and sulphur hexafluoride bank (2013, tonnes; A. Gabriel, Department of Environment, 2014 ); PCE = pre-charged equipment.
Species bulk PCE Total Total Aust. bank Mt CO2-e HFCs 2013 2014 2013 2014 2013 2014 2013 2013 HFC-23 0.06 0.3 0.03 0.1 0.1 0.4 HFC-32 5.7 30 935 1059 941 1088 8738 HFC-125 16 59 883 888 899 947 10167 HFC-134, -134a 109 702 825 788 934 1490 15408 HFC-143, -143a 4.9 31 15 20 20 51 1657 HFC-152a 1.3 12 21 13 21 HFC-227ea 0.01 14 1.2 1.7 1.2 16 HFC-245fa 74 64 0.02 0.01 74 64 HFC-365mfc 86 67 86 67 total HFCs 297 967 2671 2778 2968 3745 14.78 35970 PFCs PFC-14 0.01 0.04 0.01 0.01 0.02 0.05 PFC-116 0.02 0.02 0.03 0.05 0.05 0.06 PFC-218 0.004 0.001 0.03 0.03 0.001 PFC-318 0.03 0.01 0.03 0.01 total PFCs 0.06 0.07 0.07 0.06 0.13 0.12 sulphur hexafluoride 3.6 0.7 14 13 18 13 552 total HFCs, PFCs, SF6 301 968 2685 2791 2986 3758
The National Greenhouse Gas Inventory (NGGI: ageis.climatechange.gov.au) published in 2015 contains estimates of Australian emissions of HFC-23, HFC-32, HFC-125, HFC-134 (CHF2CHF2, not measured currently at Cape Grim), HFC-134a, HFC-143a, HFC-152a, HFC-227ea, HFC-236fa, HFC-4310mee, PFC-14, PFC-116 and sulfur hexafluoride, up to 2013, and is part of the National Inventory Report 2013 (DoE, 2015), which is the Australian government submission to the United Nations Framework Convention on Climate Change and which forms a part of the Australian National Greenhouse Accounts (NGA). Note the annual emissions in the NGGI and in the National Inventory Report are for fiscal years, i.e. ‘2013’ emissions are emissions for July 2012 to June 2013.
The HFC emissions (Table 3) are based on HFC import data (Table 2), as bulk HFCs or PCE, leading to an estimate of ‘banks’ of HFCs stored in equipment or products (refrigerators, air conditioners, fire extinguishers, foams, aerosols - largely metered-dose inhalers) and appropriate application-dependent emission factors from those ‘banks’, which allow for emissions during the lifetime of the application, as well as emissions from initial charging/re-charging of equipment and equipment disposal. The HFC emissions model contains some assumptions that simplify HFC emissions calculations. For example, the Australian HFC mix, as determined by HFC imports, is assumed to be invariant across all
Australian PFC, HFC, SF6 and SO2F2 emissions | 7
HFC use categories and the application-specific emission factors are time-invariant. This means that the emissions model is likely to be more representative for total HFC emissions than for individual HFC emissions.
8 | Fraser et al., 2015
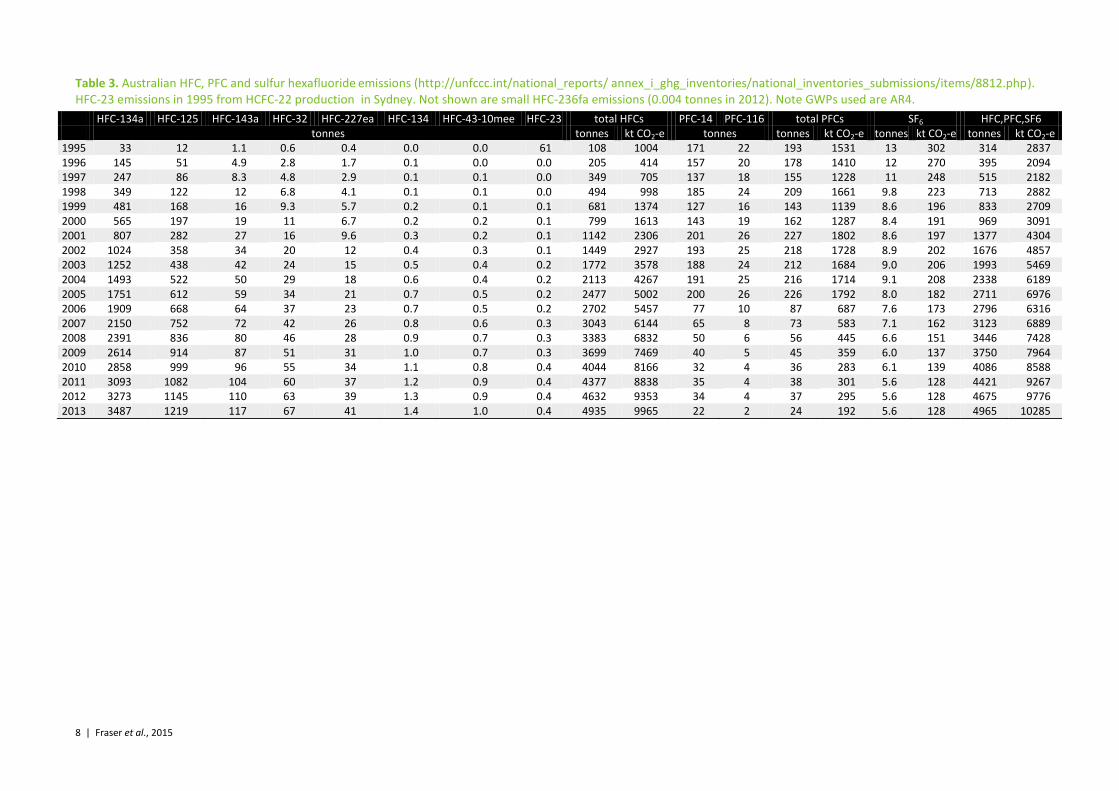
Table 3. Australian HFC, PFC and sulfur hexafluoride emissions (http://unfccc.int/national_reports/ annex_i_ghg_inventories/national_inventories_submissions/items/8812.php). HFC-23 emissions in 1995 from HCFC-22 production in Sydney. Not shown are small HFC-236fa emissions (0.004 tonnes in 2012). Note GWPs used are AR4.
HFC-134a HFC-125 HFC-143a HFC-32 HFC-227ea HFC-134 HFC-43-10mee HFC-23 total HFCs PFC-14 PFC-116 total PFCs SF6 HFC,PFC,SF6 tonnes tonnes kt CO2-e tonnes tonnes kt CO2-e tonnes kt CO2-e tonnes kt CO2-e
1995 33 12 1.1 0.6 0.4 0.0 0.0 61 108 1004 171 22 193 1531 13 302 314 2837 1996 145 51 4.9 2.8 1.7 0.1 0.0 0.0 205 414 157 20 178 1410 12 270 395 2094 1997 247 86 8.3 4.8 2.9 0.1 0.1 0.0 349 705 137 18 155 1228 11 248 515 2182 1998 349 122 12 6.8 4.1 0.1 0.1 0.0 494 998 185 24 209 1661 9.8 223 713 2882 1999 481 168 16 9.3 5.7 0.2 0.1 0.1 681 1374 127 16 143 1139 8.6 196 833 2709 2000 565 197 19 11 6.7 0.2 0.2 0.1 799 1613 143 19 162 1287 8.4 191 969 3091 2001 807 282 27 16 9.6 0.3 0.2 0.1 1142 2306 201 26 227 1802 8.6 197 1377 4304 2002 1024 358 34 20 12 0.4 0.3 0.1 1449 2927 193 25 218 1728 8.9 202 1676 4857 2003 1252 438 42 24 15 0.5 0.4 0.2 1772 3578 188 24 212 1684 9.0 206 1993 5469 2004 1493 522 50 29 18 0.6 0.4 0.2 2113 4267 191 25 216 1714 9.1 208 2338 6189 2005 1751 612 59 34 21 0.7 0.5 0.2 2477 5002 200 26 226 1792 8.0 182 2711 6976 2006 1909 668 64 37 23 0.7 0.5 0.2 2702 5457 77 10 87 687 7.6 173 2796 6316 2007 2150 752 72 42 26 0.8 0.6 0.3 3043 6144 65 8 73 583 7.1 162 3123 6889 2008 2391 836 80 46 28 0.9 0.7 0.3 3383 6832 50 6 56 445 6.6 151 3446 7428 2009 2614 914 87 51 31 1.0 0.7 0.3 3699 7469 40 5 45 359 6.0 137 3750 7964 2010 2858 999 96 55 34 1.1 0.8 0.4 4044 8166 32 4 36 283 6.1 139 4086 8588 2011 3093 1082 104 60 37 1.2 0.9 0.4 4377 8838 35 4 38 301 5.6 128 4421 9267 2012 3273 1145 110 63 39 1.3 0.9 0.4 4632 9353 34 4 37 295 5.6 128 4675 9776 2013 3487 1219 117 67 41 1.4 1.0 0.4 4935 9965 22 2 24 192 5.6 128 4965 10285
Australian PFC, HFC, SF6 and SO2F2 emissions | 9
The Australian HFC mix in the emissions model is 50% HFC-134a, 43% HFC-125, 5.2% HFC-143a, 0.5% HFC-32 and 1.3% HFC-227ea. The HFC mix in the 2013 import data (Table 2) is 31% HFC-134a, 30% HFC-125, 1% HFC-143a, 32% HFC-32, 2.5% HFC-245fa and 3% HFC-365mfc. The HFC mix in the Australian bank in 2013 is 43% HFC-134a, 28% HFC-125, 5% HFC-143a and 24% HFC-32 (Brodribb & McCann, 2014).
There have been a number of refinements to the HFC emissions model used for the 2014 submission:
(i) use of country-specific (Australian) annual leakage rates for commercial refrigeration and air-conditioning, transport refrigeration and heavy vehicle air rather than default leakage rates;
(ii) quality control checks on bulk import data showed that the previous version of the emissions model was not allocating 100% of bulk gas imports to domestic production or replenishment, leading to a minor systematic under-estimation of emissions from all equipment types; this has been corrected for the current submission to UNFCCC;
(iii) a revision to the quantities of bulk gas allocated to foams, aerosols and fire protection equipment; and (iv) a minor revision to the calculation of emissions from initial charging of new equipment.
The relationship between HFC imports and emissions is not necessarily linear. For example there was a surge of HFC and sulfur hexafluoride imports into Australia in 2012 in anticipation of the imposition of the carbon tax; this presumably did not lead to a significant surge in emissions, as the HFC and sulfur hexafluoride imports, surplus to demand, presumably went into storage with minimal emissions.
In the Australian GHG emission inventory, PFC (PFC-14, PFC-116) emissions only arise from aluminium production, with total PFC emissions in 2013 of 0.19 Mt CO2-e (DoE, 2015). About 0.1 tonnes of PFCs (PFC-14, PFC-116) were imported into Australia in 2013 and 2014 as refrigerant blends in bulk and PCE (Table 2). It is not clear whether these PFC imports are used to calculate corresponding contributions to PFC emissions – if they are, they are very small compared to PFC emissions from the aluminium industry.
Australian sulfur hexafluoride emissions are largely from the electricity supply and distribution network. Emissions (1975-2013) are estimated as leakages from sulfur hexafluoride ‘banks’ and from Australian manufacture of electricity supply equipment, using a combination of default IPCC and Australian-specific emissions factors. There are three years (2012, 2013, 2014) of sulfur hexafluoride import data available, which could potentially be used to verify the calculations of sulfur hexafluoride in banks and used in manufacture. However the 2012-2013 import data suggest sulfur hexafluoride may have been stock-piled in these years in anticipation of an impending carbon tax impost on the sulfur hexafluoride price.
Australian emission factors for electrical equipment stock are global IPCC default factors: 0.05 t/t (1975-1995), 0.02 t/t (2000); an Australian-specific factor (0.0089 t/t) has been estimated for 2009 and assumed constant thereafter. For 1995-2000-2009 periods, emission factors are interpolated. The 2009-2012 emission factor is based on emission estimates from 15 utilities using their own data on sulfur hexafluoride consumption (consumption = emissions, not defaulting to the IPCC method). The emission factors assumed for Australian equipment manufacture (0.15 t/t, 1975-1995; 0.06 t/t, 1996-2012) are IPCC default factors for Europe. The original global IPCC default factor for manufacturing (0.74 t/t) was significantly higher and currently IPCC recommends 0.30-0.35 t/t (prior to 1995) and 0.12 t/t after 1995, both significantly higher than the assumed Australian emission factor for equipment manufacture. These IPCC factors are for so-called gas insulated switchgear (GIS); significantly higher factors are recommended for circuit breakers (0.55 t/t prior to 1995, 0.29 t/t after 1995). Circuit breakers are used extensively in the USA, GIS in Europe. The Australian inventory assumed GIS values, presumably because Australia uses largely GIS equipment in its electricity distribution networks.
Australian sulfur hexafluoride emissions from magnesium casting, tracer gas studies, eye surgery etc. have been estimated at 0.034 g/capita/yr (M. Hunstone, DoE, 2014, personal communication).
There are no import data available for sulfuryl fluoride.
The HFC, PFC and sulphur hexafluoride emissions data (1995 to 2013) are detailed in Table 3. Australian HFC emissions were about 100 tonnes in 1995, rising to 4935 tonnes (9965 CO2-e tonnes) in 2013. HFCs are the dominant emissions in CO2-e terms in this sector (97%, 2013). HFC-134a emissions increased by about 214 tonnes (6%) from 2012 to 2013, all other HFCs by about 88 tonnes (6%). Emissions of total HFCs (in CO2-e terms) in 2013 were 6% higher than in 2012. Australian PFC emissions were 190 tonnes in the mid-1990s, rising to 230 tonnes in the mid-2000s, before dropping to 24 tonnes in 2013. Total PFC emissions (in CO2-e terms) decreased by 42% from 2012 to 2013. Sulfur hexafluoride emissions are estimated to have been 13 tonnes in 1995 falling to 6 tonnes in 2013. Total HFC, PFC and sulfur hexafluoride emissions in CO2-e in 2013 (10285 k tonnes) were 5% higher than in 2012; this compares to a 7%/yr increase from 2007 to 2012. The overall uncertainty on the PFC/HFC/sulfur hexafluoride emissions category in the NGGI is 25-30% (DCCEE, 2011).
10 | Fraser et al., 2015
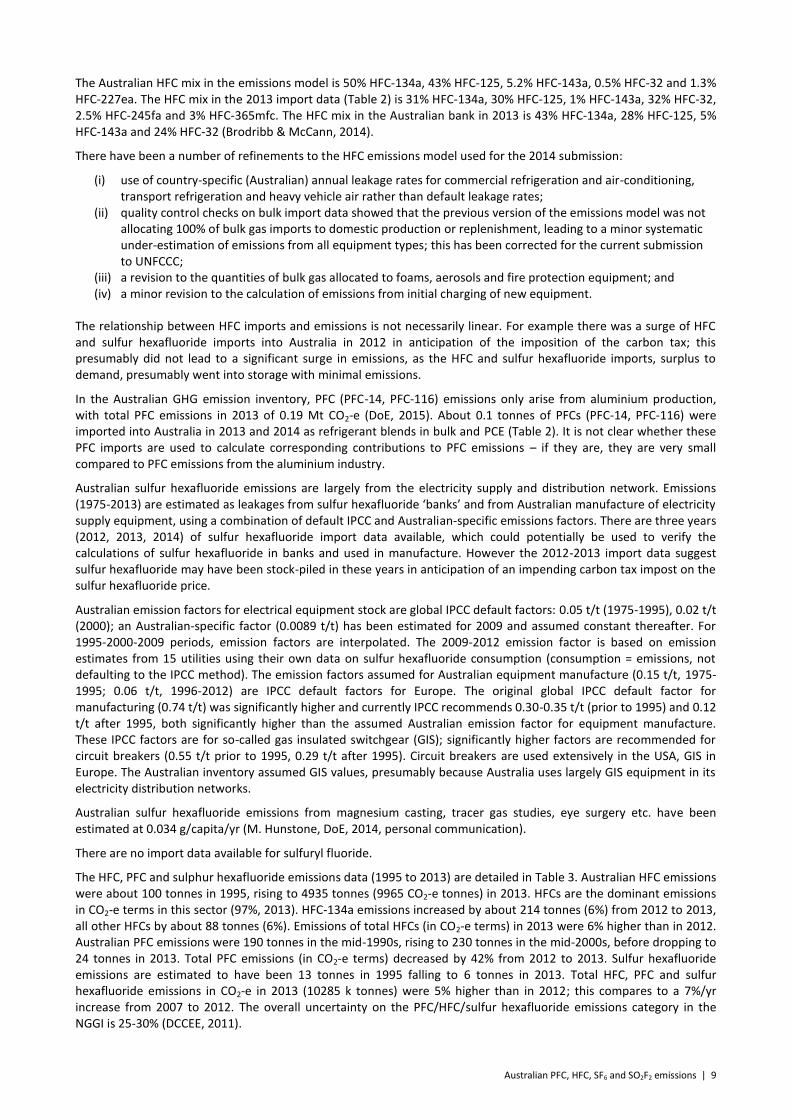
The HFC, PFC and sulfur hexafluoride contributions to total emissions from this sector are shown in Figure 3. The significant impact on total emissions in 2005-2006 due to reduced PFC emissions (the Kurri Kurri aluminium smelter upgrade) can be clearly seen. Prior to the significant reduction in PFC emissions at Kurri Kurri in 2005, Australian HFC/PFC/sulfur hexafluoride emissions grew at about 13%/yr (Figure 3). After the Kurri Kurri upgrade, these combined emissions grew at about 7%/yr. The Australian KP-SGG emissions are 95% HFCs, 3% PFCs and 2% sulfur hexafluoride.
Figure 3. Australian HFC, PFC and sulfur hexafluoride emissions (M tonne CO2-e) (DoE, 2015). Note the impact on the reduction in emissions due to the refurbishment of potline #1 at the Kurri Kurri aluminium smelter in 2005-2006. Dashed lines are exponential best fits.
5 Australian HFC, PFC, sulfur hexafluoride and sulfuryl fluoride emissions from atmospheric data
5.1 PFC-14 emissions
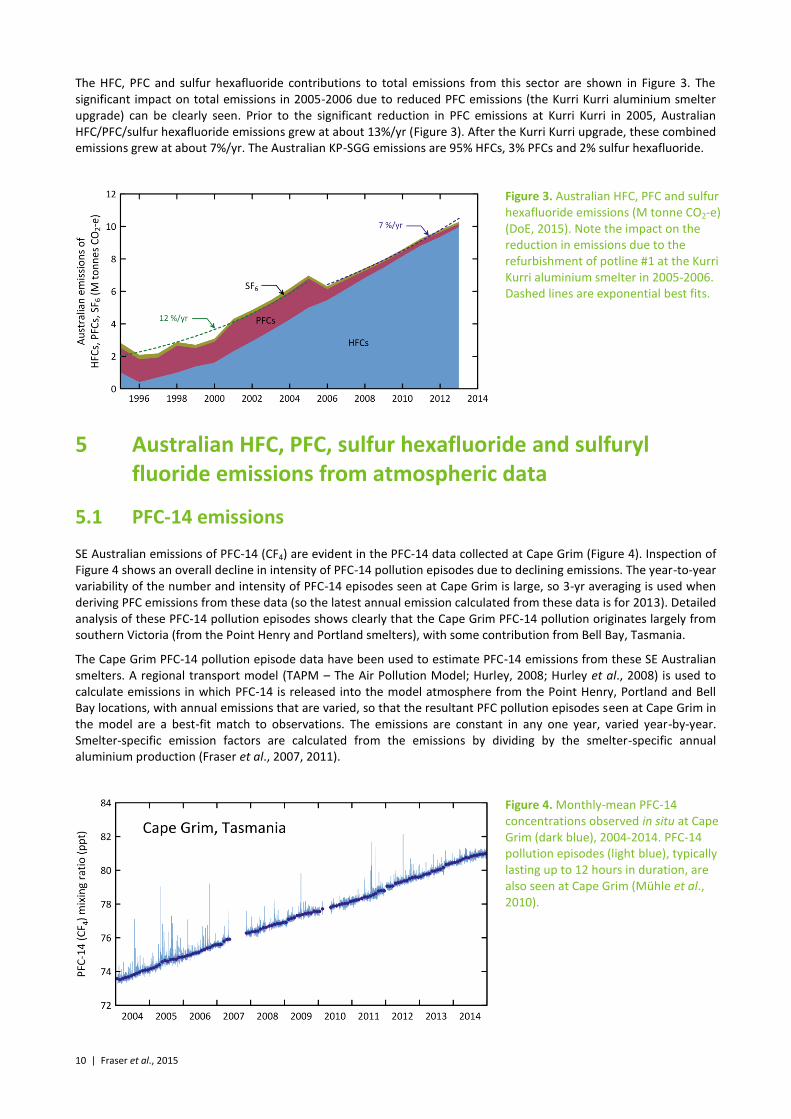
SE Australian emissions of PFC-14 (CF4) are evident in the PFC-14 data collected at Cape Grim (Figure 4). Inspection of Figure 4 shows an overall decline in intensity of PFC-14 pollution episodes due to declining emissions. The year-to-year variability of the number and intensity of PFC-14 episodes seen at Cape Grim is large, so 3-yr averaging is used when deriving PFC emissions from these data (so the latest annual emission calculated from these data is for 2013). Detailed analysis of these PFC-14 pollution episodes shows clearly that the Cape Grim PFC-14 pollution originates largely from southern Victoria (from the Point Henry and Portland smelters), with some contribution from Bell Bay, Tasmania.
The Cape Grim PFC-14 pollution episode data have been used to estimate PFC-14 emissions from these SE Australian smelters. A regional transport model (TAPM – The Air Pollution Model; Hurley, 2008; Hurley et al., 2008) is used to calculate emissions in which PFC-14 is released into the model atmosphere from the Point Henry, Portland and Bell Bay locations, with annual emissions that are varied, so that the resultant PFC pollution episodes seen at Cape Grim in the model are a best-fit match to observations. The emissions are constant in any one year, varied year-by-year. Smelter-specific emission factors are calculated from the emissions by dividing by the smelter-specific annual aluminium production (Fraser et al., 2007, 2011).
Figure 4. Monthly-mean PFC-14 concentrations observed in situ at Cape Grim (dark blue), 2004-2014. PFC-14 pollution episodes (light blue), typically lasting up to 12 hours in duration, are also seen at Cape Grim (Mühle et al., 2010).
Australian PFC, HFC, SF6 and SO2F2 emissions | 11
The NAME particle dispersion model (O’Doherty et al., 2009; Manning et al., 2003, 2011) is also used to calculate PFC-14 emissions from Victoria/Tasmania/NSW (Portland/Pt Henry/Bell Bay/Kurri Kurri/Tomago smelters). NAME (Numerical Atmospheric Dispersion Modelling Environment) is a Lagrangian particle dispersion model driven by 3-dimensional wind fields from numerical weather predictions models. NAME has a horizontal resolution (grid boxes 40 km x 40 km) and a minimum boundary layer height of 100 m. NAME operates in a backward mode, so, for example, it identifies, within a 3 hr period at Cape Grim, which grid boxes in the prescribed domain impact on Cape Grim in the previous 12 days. NAME releases 33,000 particles at Cape Grim over the 3 hr period and the resultant 12-day integrated concentrations in each of the domain boxes are calculated. Operating NAME in the backward mode is numerically very efficient and is a very close approximation to the forward running mode, which is what is used to identify emission sources impacting on Cape Grim. In the inverse calculation, NAME identifies pollution episode data at Cape Grim, and starts with randomly-generated emission maps and searches for the emission map that leads to a modelled pollution time series that most accurately mimics the observations. The inversion method assumes that baseline air enters the inversion domain regardless of direction i.e. it assume that sources outside the specified domain do not impact significantly on Cape Grim. One of the major advantages of the NAME method, especially when using Cape Grim data, is that it does not require a prior estimate of emissions. Other inversion methods used to estimate regional emissions using Cape Grim data often derive emissions that are not significantly different than the prior estimates.
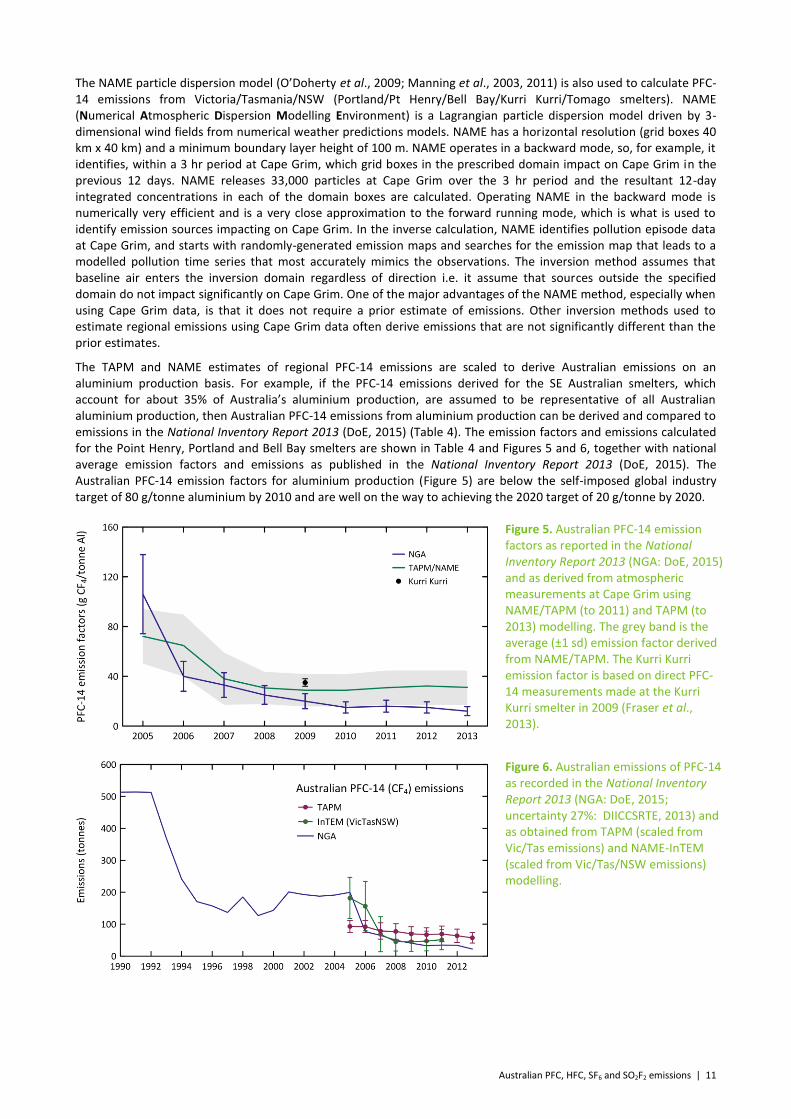
The TAPM and NAME estimates of regional PFC-14 emissions are scaled to derive Australian emissions on an aluminium production basis. For example, if the PFC-14 emissions derived for the SE Australian smelters, which account for about 35% of Australia’s aluminium production, are assumed to be representative of all Australian aluminium production, then Australian PFC-14 emissions from aluminium production can be derived and compared to emissions in the National Inventory Report 2013 (DoE, 2015) (Table 4). The emission factors and emissions calculated for the Point Henry, Portland and Bell Bay smelters are shown in Table 4 and Figures 5 and 6, together with national average emission factors and emissions as published in the National Inventory Report 2013 (DoE, 2015). The Australian PFC-14 emission factors for aluminium production (Figure 5) are below the self-imposed global industry target of 80 g/tonne aluminium by 2010 and are well on the way to achieving the 2020 target of 20 g/tonne by 2020.
Figure 5. Australian PFC-14 emission factors as reported in the National Inventory Report 2013 (NGA: DoE, 2015) and as derived from atmospheric measurements at Cape Grim using NAME/TAPM (to 2011) and TAPM (to 2013) modelling. The grey band is the average (±1 sd) emission factor derived from NAME/TAPM. The Kurri Kurri emission factor is based on direct PFC-14 measurements made at the Kurri Kurri smelter in 2009 (Fraser et al., 2013).
Figure 6. Australian emissions of PFC-14 as recorded in the National Inventory Report 2013 (NGA: DoE, 2015; uncertainty 27%: DIICCSRTE, 2013) and as obtained from TAPM (scaled from Vic/Tas emissions) and NAME-InTEM (scaled from Vic/Tas/NSW emissions) modelling.
12 | Fraser et al., 2015
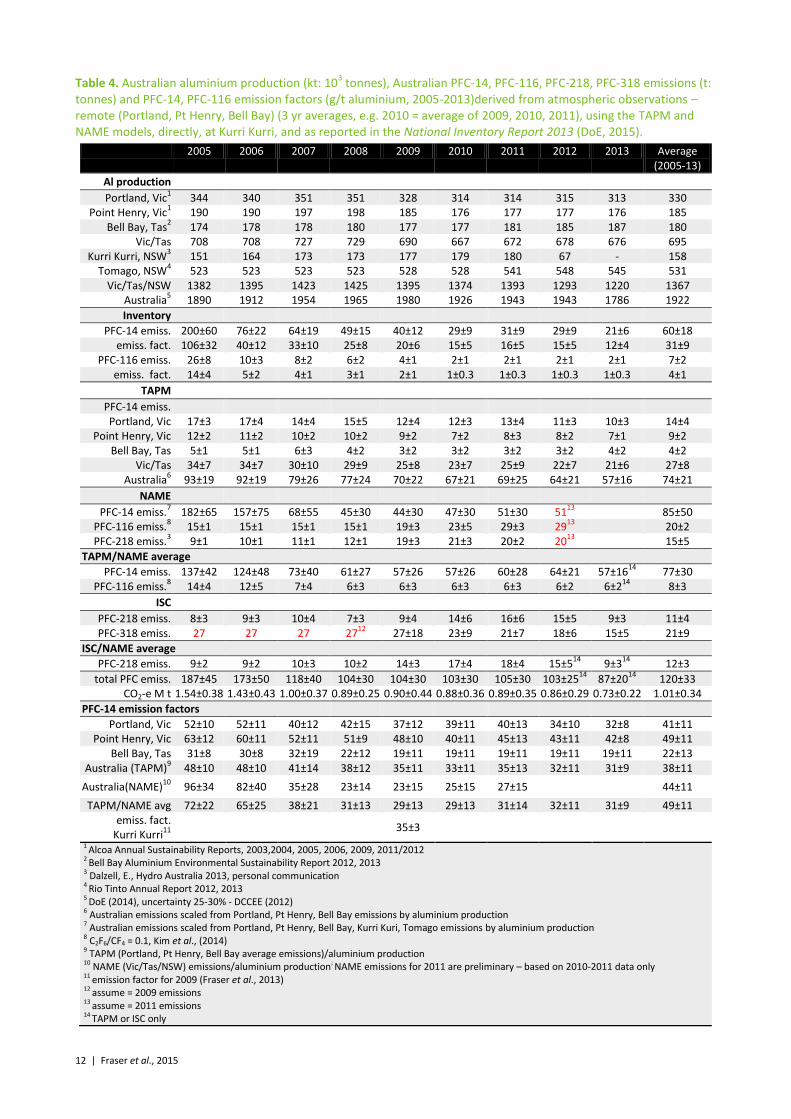
Table 4. Australian aluminium production (kt: 103 tonnes), Australian PFC-14, PFC-116, PFC-218, PFC-318 emissions (t:
tonnes) and PFC-14, PFC-116 emission factors (g/t aluminium, 2005-2013)derived from atmospheric observations – remote (Portland, Pt Henry, Bell Bay) (3 yr averages, e.g. 2010 = average of 2009, 2010, 2011), using the TAPM and NAME models, directly, at Kurri Kurri, and as reported in the National Inventory Report 2013 (DoE, 2015).
2005 2006 2007 2008 2009 2010 2011 2012 2013 Average (2005-13)
Al production
Portland, Vic1 344 340 351 351 328 314 314 315 313 330
Point Henry, Vic1 190 190 197 198 185 176 177 177 176 185
Bell Bay, Tas2 174 178 178 180 177 177 181 185 187 180
Vic/Tas 708 708 727 729 690 667 672 678 676 695 Kurri Kurri, NSW
3 151 164 173 173 177 179 180 67 - 158
Tomago, NSW4 523 523 523 523 528 528 541 548 545 531
Vic/Tas/NSW 1382 1395 1423 1425 1395 1374 1393 1293 1220 1367 Australia
5 1890 1912 1954 1965 1980 1926 1943 1943 1786 1922
Inventory
PFC-14 emiss. 200±60 76±22 64±19 49±15 40±12 29±9 31±9 29±9 21±6 60±18 emiss. fact. 106±32 40±12 33±10 25±8 20±6 15±5 16±5 15±5 12±4 31±9
PFC-116 emiss. 26±8 10±3 8±2 6±2 4±1 2±1 2±1 2±1 2±1 7±2
emiss. fact. 14±4 5±2 4±1 3±1 2±1 1±0.3 1±0.3 1±0.3 1±0.3 4±1
TAPM PFC-14 emiss. Portland, Vic 17±3 17±4 14±4 15±5 12±4 12±3 13±4 11±3 10±3 14±4
Point Henry, Vic 12±2 11±2 10±2 10±2 9±2 7±2 8±3 8±2 7±1 9±2 Bell Bay, Tas 5±1 5±1 6±3 4±2 3±2 3±2 3±2 3±2 4±2 4±2
Vic/Tas 34±7 34±7 30±10 29±9 25±8 23±7 25±9 22±7 21±6 27±8 Australia
6 93±19 92±19 79±26 77±24 70±22 67±21 69±25 64±21 57±16 74±21
NAME PFC-14 emiss.
7 182±65 157±75 68±55 45±30 44±30 47±30 51±30 51
13 85±50
PFC-116 emiss.8 15±1 15±1 15±1 15±1 19±3 23±5 29±3 29
13 20±2
PFC-218 emiss.3 9±1 10±1 11±1 12±1 19±3 21±3 20±2 20
13 15±5
TAPM/NAME average
PFC-14 emiss. 137±42 124±48 73±40 61±27 57±26 57±26 60±28 64±21 57±1614
77±30 PFC-116 emiss.
8 14±4 12±5 7±4 6±3 6±3 6±3 6±3 6±2 6±2
14 8±3
ISC PFC-218 emiss. 8±3 9±3 10±4 7±3 9±4 14±6 16±6 15±5 9±3 11±4 PFC-318 emiss. 27 27 27 27
12 27±18 23±9 21±7 18±6 15±5 21±9
ISC/NAME average
PFC-218 emiss. 9±2 9±2 10±3 10±2 14±3 17±4 18±4 15±514
9±314
12±3
total PFC emiss. 187±45 173±50 118±40 104±30 104±30 103±30 105±30 103±2514
87±2014
120±33 CO2-e M t 1.54±0.38 1.43±0.43 1.00±0.37 0.89±0.25 0.90±0.44 0.88±0.36 0.89±0.35 0.86±0.29 0.73±0.22 1.01±0.34
PFC-14 emission factors
Portland, Vic 52±10 52±11 40±12 42±15 37±12 39±11 40±13 34±10 32±8 41±11 Point Henry, Vic 63±12 60±11 52±11 51±9 48±10 40±11 45±13 43±11 42±8 49±11
Bell Bay, Tas 31±8 30±8 32±19 22±12 19±11 19±11 19±11 19±11 19±11 22±13 Australia (TAPM)
9 48±10 48±10 41±14 38±12 35±11 33±11 35±13 32±11 31±9 38±11
Australia(NAME)10
96±34 82±40 35±28 23±14 23±15 25±15 27±15 44±11
TAPM/NAME avg 72±22 65±25 38±21 31±13 29±13 29±13 31±14 32±11 31±9 49±11 emiss. fact.
Kurri Kurri11
35±3
1 Alcoa Annual Sustainability Reports, 2003,2004, 2005, 2006, 2009, 2011/2012 2 Bell Bay Aluminium Environmental Sustainability Report 2012, 2013 3 Dalzell, E., Hydro Australia 2013, personal communication 4 Rio Tinto Annual Report 2012, 2013 5 DoE (2014), uncertainty 25-30% - DCCEE (2012) 6 Australian emissions scaled from Portland, Pt Henry, Bell Bay emissions by aluminium production 7 Australian emissions scaled from Portland, Pt Henry, Bell Bay, Kurri Kuri, Tomago emissions by aluminium production 8 C2F6/CF4 = 0.1, Kim et al., (2014) 9 TAPM (Portland, Pt Henry, Bell Bay average emissions)/aluminium production
10 NAME (Vic/Tas/NSW) emissions/aluminium production; NAME emissions for 2011 are preliminary – based on 2010-2011 data only 11 emission factor for 2009 (Fraser et al., 2013) 12 assume = 2009 emissions 13 assume = 2011 emissions 14 TAPM or ISC only
Australian PFC, HFC, SF6 and SO2F2 emissions | 13
The Australian emissions derived from atmospheric data prior to 2006, using TAPM or NAME (Vic/Tas) are likely to be underestimated due to the very significant PFC-14 emissions from a single pot-line (#1) at Kurri Kurri, which accounted for nearly half of all Australian PFC emissions from aluminium smelting in 2005. The pot-line was upgraded in 2006 and this accounts for the dramatic drop in PFC-14 emissions from 2005 to 2006 in the National Inventory Report. The large PFC emissions prior to 2006 are not seen in the TAPM estimates of emissions, as they are based on Bell Bay/Pt Henry/Portland data. The NAME inversion, based on the Vic/Tas/NSW domain, uses all pollution episode data, including any Kurri Kurri- or Tomago-affected data that may have impacted on Cape Grim (the Kurri Kurri and Tomago smelters are located in the Hunter Valley, NSW). This is why the Australian PFC-14 estimates in 2005 (182 tonnes) based on the NAME (Vic/Tas/NSW) emissions are significantly greater than the TAPM estimates for 2005 (95 tonnes).
The average Australian PFC-14 emissions for 2005-2011 based on atmospheric data are similar: TAPM - 78 tonnes and NAME (Vic/Tas/NSW) - 85 tonnes, about 13% higher than reported in the National Inventory Report 2012 (DoE, 2014; 72 tonnes). The average Australian 2008-2011 PFC-14 emissions derived from atmospheric data using NAME (Vic/Tas/NSW) are 47 tonnes, 20% higher than in the National Inventory Report 2011 (39 tonnes). The TAPM average for the same period is 69 tonnes and 66 tonnes for 2008-2012. Arguably the NAME estimate is more accurate as it is based on 72% of Australian aluminium production (Portland, Pt Henry, Bell Bay, Kurri Kurri, Tomago), whereas the TAPM estimate is based on 35% of Australian aluminium production (Portland, Pt Henry, Bell Bay). These SE Australian smelters could have higher average PFC-14 emission factors than the Australian average (see below).
The overall agreement between the PFC emission factors in the National Inventory Report 2013 (DE, 2015) and as derived from atmospheric data using TAPM/NAME over the period 2005-2011 is good (Table 4, Figure 5, TAPM: 41 g CF4/tonne aluminium; NAME: 44 g/tonne; NGA: 37 g/tonne), with uncertainties overlapping throughout the record. For the period 2005-2013 the TAPM average CF4 emission factor is 38 g/tonne compared to the NGA: 31 g/tonne.
The atmospheric data (NAME) show a factor of 3.5 decline in the emission factors over the period 2005-2011, whereas the NGA show a factor of 6.2 decline over the same period. This decline is dominated by the influence that Kurri Kurri had on national average emissions factors between 2006 and 2007; this decline is not captured in the TAPM data which do not ‘see’ Kurri Kurri emissions. Given the overlapping uncertainties on both NAME and the NGA estimates of PFC-14 emissions, this difference in emissions decline over the period 2005-2011 may not be significant. However, the difference could be due, in part, to a larger than average decline in the emission factor at Boyne Island, which is not seen in the atmospheric data at Cape Grim, by either NAME or TAPM.
In 2013, Australian PFC-14 emissions (TAPM, 57 tonnes) were 0.5% of global emissions (11.3 k tonnes). The only significant PFC-14 source in Australia is aluminium production, whereas globally both aluminium production and the electronics industry are significant soures of PFC-14 emissions.
5.2 Other PFC emissions
Australian PFC emissions are dominated by the aluminium industry – only aluminium production-derived emissions of PFC-14 and PFC-116 are currently listed in the National Inventory Report (Table 3). PFC imports in 2013 are small (Table 2 - PFC-14: 0.02 tonne, PFC-116: 0.05 tonne, PFC-318: 0.03 tonne). These imports are presumably for minor refrigeration and fire-fighting applications, and the corresponding emissions from these non-aluminium sources are likely to be well below 1 tonne/yr.
Figure 7 shows the Australian PFC-116 emissions from the National inventory Report, from PFC-14 emissions (TAPM/NAME) assuming a PFC-116/PFC-14 mass emission factor of 0.10±0.01, based on atmospheric observation at Aspendale on the Pt Henry/Portland PFC plumes and on direct measurements on the Kurri Kurri exhaust stack (Fraser et al., 2013; Kim et al., 2014). The overall agreement is good as expected, as the emissions are from the aluminium industry only, with current emissions (since 2009) of about 6 tonnes/yr. However the PFC-116 emissions for Australia based on measurements at Cape Grim, again assuming coming from the aluminium industry only, show significant differences in emissions after 2007, with NAME PFC-116 emissions rising to approaching 30 tonnes in 2011.
Since Cape Grim largely ‘sees’ PFC emissions from the Victorian smelters and any other emissions from the Melbourne/Port Phillip region, the data would suggest that a significant, post -2007, non-aluminium PFC-116 source is in operation, and this PFC-116 is not captured in the import data. Australia-wide, this source could be currently approaching 20 tonnes/yr. The source of this additional PFC-116 is unknown. Further analysis of past and future Aspendale and Sydney PFC-116 data could help identify this source.
In 2011, Australian PFC-116 emissions (NAME, 29 tonnes) were 1.5% of global emissions (1.9 k tonnes).
14 | Fraser et al., 2015
Figure 7. Australian PFC-116, PFC-218 and PFC-318 emissions from the National Inventory Report 2013 (DoE, 2015) and from atmospheric measurements at Cape Grim using NAME, TAPM and ISC modelling; error bars are ± sd. Australian PFC-116 (NAME) are from Vic/Tas data scaled by aluminium production, PFC-116 (TAPM/NAME PFC-14) are from Australian TAPM/NAME PFC-14 emissions (Table 4) and the observed PFC-116/PFC-14 ratio (0.10±0.01) in Australian smelter plumes; PFC-218 and PFC-318 are from NAME and ISC modelling, with Australian emissions obtained from regional emissions by population scaling.
Cape Grim data also suggest that there are significant Australian PFC-218 and PFC-318 emissions, the former increasing from about 10 tonnes in the mid-2000s to nearly 20 tonnes in 2011, declining to 9 tonnes in 2013 and the latter declining from nearly 30 tonnes in 2009 to 15 tonnes in 2013. The sources of PFC-218 and PFC-318 are unknown; there are no significant PFC-218 or PFC-318 imports recorded. The PFC-218 emissions are about the same size as the non-aluminium PFC-116 emissions, with a similar growth pattern. This suggests their emissions may be related.
In 2011, Australian PFC-218 emissions (NAME, 20 tonnes) were 4% of global emissions (0.48 k tonnes).
Total PFC emissions have declined from about 190 tonnes in 2005 (80% from aluminium production) to about 100 tonnes (60% from aluminium production) in 2010, declining even further to 87 tonnes in 2013 (55% from the aluminium industry), compared to the Inventory, which has total PFCs (PFC-14, PFC-116) declining from 226 tonnes in 2005 to 24 tonnes in 2013 (all from the aluminium industry). In CO2-e terms, total PFCs have declined from 1.5 Mt CO2-e in 2005 to 0.7 Mt CO2-e in 2013, compared to the Inventory figures of 1.8 Mt CO2-e in 2005 falling to 0.19 Mt CO2-e in 2013. This is because the Inventory only includes PFCs from the aluminium industry, whereas Cape Grim sees PFC emissions from all potential sources (aluminium, refrigeration, fire fighting and possibly other sources).
5.3 HFC, sulfur hexafluoride and sulfuryl fluoride emissions
CSIRO estimates emissions of a number of trace gases from the Melbourne/Port Phillip region (Dunse et al., 2001, 2005; Dunse 2002; Fraser et al., 2014), utilising in situ high frequency measurements from the Cape Grim Baseline Air Pollution Station in Tasmania and employing the interspecies correlation (ISC) technique with co-incident carbon monoxide (CO) measurements.
Port Phillip HFC, PFC-116 and sulfur hexafluoride emissions have been calculated, using ISC and Cape Grim data (2004-2013), obtained from the GC-MS-Medusa and GC-ECD instruments (Krummel et al., 2011; Miller et al., 2008) at Cape Grim, and presented as 3-year running averages (2005-2013; Table 5, Figure 8). The HFC, PFC-116 and sulfur hexafluoride emissions are derived from Port Phillip emissions, scaled to Australian emissions on a population basis (using a population-based scale factor of 5.4). NOAA air mass back trajectory analyses (Draxler & Hess, 1997) are used to ensure that the pollution events at Cape Grim used to derive Port Phillip emissions are imbedded in air masses that only pass over the Port Phillip region and do not include other possible high carbon monoxide source regions, in particular the Latrobe Valley, or high carbon monoxide emission events (biomass burning).
For HFC emission calculations, the NAME particle dispersion model (Manning et al., 2003, 2011) ‘sees’ emissions from Victoria/Tasmania (the domain used in the model) and are presented as 3-yr running averages of emissions (i.e. 2008 annual emissions are derived from 2007-2009 data). The Australian emissions are calculated from Victoria/Tasmania using a population based scale factor of 3.7 and are shown in Table 5 and Figure 8.
Australian PFC, HFC, SF6 and SO2F2 emissions | 15
Table 5. Australian HFC, PFC, sulfur hexafluoride and sulfuryl fluoride emissions (tonnes, 2005-2013) from atmospheric data, collected at Cape Grim, Tasmania - emissions calculated by interspecies correlation (ISC) and from inversions using the UK Met. Office NAME particle dispersion model. The emissions are 3-year running averages, i.e. ‘2010’ = average of 2009, 2010, 2011 emissions. Australian HFC and sulfur hexafluoride emissions are scaled from regional emissions by population; GWPs (to calculate CO2-e emissions) are from the National Inventory Report 2013 (DoE, 2015). PFC-14 emissions are the TAPM/NAME average from Table 4. Australian PFC-116 emissions are from NAME (Vic/Tas) scaled by aluminium production; Australian PFC-218 and PFC-318 emissions are from NAME and ISC scaled by population; Australian sulfuryl fluoride emissions are from ISC and NAME estimates of SE Australian emissions scaled by grain production.
2005 2006 2007 2008 2009 2010 2011 2012 2013
Refrigerant ISC NAME ISC NAME ISC NAME ISC NAME ISC NAME ISC NAME ISC NAME ISC ISC
tonnes tonnes tonnes tonnes tonnes tonnes tonnes tonnes tonnes
HFC-32 36±12 34±5 62±23 40±10 116±48 61±15 129±49 96±20 170±60 134±20 196±67 162±20 205±66 172±10 211±69 186±60
HFC-125 392±130 311±15 375±125 326±20 460±174 402±60 516±183 553±80 642±207 685±60 642±213 738±45 614±195 753±25 598±194 603±195
HFC-134a 1686±519 1613±90 1707±530 1668±110 1832±621 1830±150 1843±596 1997±165 2148±666 2279±120 2141±700 2262±120 2111±659 2169±140 2008±643 1672±526
HFC-143a 454±158 337±20 436±150 352±30 481±174 451±65 503±172 550±60 624±200 687±55 597±198 750±60 505±165 771±35 555±185 530±176
HFC-23 50 34 50 34 50±28 34 56±23 34±3 58±22 43±4 44±17 44±6 41±16 55±5 46±16 46±15
HFC-152a 32±11 31±2 38±13 35±3 51±17 41±3 49±17 43±3 52±18 68±4 59±21 69±5 56±19 72±4 77±28 69±24
HFC-227ea 15±9 15 12±6 12 17±7 17 22±8 22 36±13 36 33±12 33 26±9 26 19±6 38±14
HFC-236fa 13±10 13 5±3 5 5±3 5 4±2 4 5±2 5 6±2 6 6±2 6 5±2 4±1
HFC-245fa 27±15 27 30±13 30 32±13 32 28±11 28 32±13 32 38±14 38 49±18 49 117±43 109±39
HFC-365mfc 8±4 13 25±11 13±1 33±13 15±2 50±18 16±3 61±21 47±13 74±26 64±10 69±24 68±3 66±23 59±20
total HFCs 2714±560 2428±95 2741±565 2515±115 3078±670 2888±175 3198±650 3343±195 3828±730 4016±145 3830±760 4166±145 3682±710 4139±145 3702±700 3317±595
total HFCs NAME/ISC avg (t) 2571±325 2628±340 2983±425 3271±420 3922±435 3998±450 3911±430 3702±700 3317±595
total HFCs (kt CO2-e) 6221±650 6197±660 7057±965 7884±905 9515±950 9612±955 9393±835 8556±1435 7999±1305
SF6 (tonnes) 78±26 29 75±25 29±2 44±16 31±3 33±12 34±2 34±13 44±3 37±14 43±3 33±12 44±2 31±11 27±9
SF6 NAME/ISC avg (t) 53±26 52±13 37±9 33±7 39±8 40±8 38±7 31±11 27±9
SF6 (kt CO2-e) 1179±298 1179±298 848±211 762±166 889±184 916±186 877±160 704±240 605±201
SO2F2 (tonnes) 2±2 2±2 4±4 17±15 18±8 3±5 68±26 14±18 80±32 88±21 71±28 68±26
SO2F2 NAME/ISC avg (t) 2±2 2±2 4±4 17±15 11±6 41±22 84±26 71±28 68±26
SO2F2 ( kt CO2-e) 9±9 10±10 18±19 86±74 54±32 204±110 419±132 357±141 341±131
total PFCs (t, Table 4) 187±45 173±50 118±40 104±30 104±30 103±30 105±30 103±25 87±20
total PFCs (kt CO2-e) 1538±377 1430±433 1001±371 888±249 895±438 881±356 890±350 862±291 725±221
total HFCs, PFCs, SF6 avg 2809±330 2853±345 3138±425 3408±420 4065±435 4141±455 4054±430 3835±700 3430±595
total HFCs, PFCs, SF6 avg (k tonnes CO2-e)
8938±780 8806±810 8906±1035 9535±940 11299±1005 11409±1000 11160±880 10123±1465 9329±1330
16 | Fraser et al., 2015
Figure 8. Australian HFC-32, -125, -134a, -143a, -152a, -365mfc and sulfur hexafluoride emissions (NGA: DoE 2015) compared to emissions calculated from Cape Grim data by interspecies correlation (ISC) and from the UK Met. Office NAME particle dispersion model. In the ISC calculations of HFC and sulfur hexafluoride emissions, Australian emissions are scaled from Melbourne/Port Phillip emissions on a population basis (5.4, Australia/Port Phillip); in the NAME calculations, Australian emissions are scaled from Victorian/Tasmanian emissions, also on a population basis (a scale factor of 3.7). Also shown are Australian sulfuryl fluoride emissions from ISC and NAME, scaled on a grain production basis.
Australian PFC, HFC, SF6 and SO2F2 emissions | 17
Cape Grim ‘sees’ sulfuryl fluoride emissions from SE Australia. Cape Grim sulfuryl fluoride measurements commenced in 2004, but significant pollution episodes (as selected for ISC calculations) were not observed at Cape Grim until 2010. These pollution episodes are used to calculate SE Australian (largely Victorian) sulfuryl fluoride emissions by ISC. Grain exported from Victorian grain terminals, or produced in Victoria, accounts for about 15-20% of Australia’s grain production/exports (National Transport Commission, 2008) and thus possibly 15-20% of Australia’s emissions of sulfuryl fluoride. SE Australian sulfuryl fluoride emissions calculated from Cape Grim data by ISC are scaled to Australian emissions by this factor (i.e. multiplied by 6.2±0.6) (Table 5, Figure 8). The NAME model domain used to derive sulfuryl fluoride emissions is Victoria/Tasmania/New South Wales, and the scale factor used to derive Australian emissions, based on grain production, is 2.1±0.2. Australian emissions of sulfuryl fluoride averaged about 74 tonnes/yr (372 k tonnes CO2-e) over the period 2011-2013, some 2%-3% of global emissions (see above), similar to Australia’s fraction of global grain production (~2%). Data on Australian sulfuryl fluoride imports are not available.
6 Comparisons of NGA, ISC & NAME emission estimates
6.1 HFC-134a
The major HFC in the National Inventory (ageis.climatechange.gov.au; DoE 2015) is HFC-134a, with emissions in 2013 of 3487 tonnes (Table 3). Based on Cape Grim data, Australian emissions of HFC-134a in 2013 were 1672 tonnes (ISC), ~52% lower than reported in the Inventory (Table 5, Figure 8). For the 9-year period 2005-2013, the average Australian emissions of HFC-134a calculated from Cape Grim data (ISC/NAME) are about 26% lower than in the Inventory. From 2002 to 2011, the ISC and NAME emissions estimates agree to within 2% (NAME higher). For the period 1999-2004, Australian emissions based on Cape Grim data are higher than the inventory, and, for 2006-2013, lower than the inventory. As discussed in Section 4 above, the Inventory best represents total HFC emissions, not individual HFC emissions.
Cape Grim data suggest that Australian emissions of HFC-134a have been in decline since 2009, whereas the Inventory reports growing emissions through 2013 (Figure 8), as are global emissions (see above). The Inventory assumes time-invariant emission factors, whereas the Cape Grim data may be seeing reduced emissions due to, for example, improved equipment maintenance practices, with better management of HFC emissions. Based on atmospheric data, global emissions of HFC-134a were 174 k tonnes in 2012 (Rigby et al., 2014). Australian emissions are about 1.1% of global emissions based on ISC/NAME data, and 1.8% based on Inventory data.
USA HFC-134a emissions as reported to UNFCCC are in decline, having peaked in 2010 at 69 k tonnes; however an analysis of air masses impacted by USA emissions arriving on the west coast of Ireland (Mace Head) suggest USA HFC-134a emissions continue to increase, reaching 70 k tonnes in 2012, increasing from 62 k tonnes in 2010. The USA HFC-134a emissions exhibit seasonal behaviour, with annual emissions about 20% higher than winter emissions, attributed to seasonal automobile ac emissions (Simmonds et al., 2015).
Cape Grim ‘sees’ largely winter emissions of HFC-134a emissions from the Melbourne/Port Phillip region; this could offer a partial explanation of the large difference between Australian emissions of HFC-134a calculated from Cape Grim data and as reported in the Inventory. This is being investigated further.
6.2 HFC-125
The next major HFC emitted into the Australian environment is HFC-125 with current (2013) emissions estimated to be about 1226 tonnes in the Inventory. Based on Cape Grim data, Australian emissions of HFC-125 in 2013 were 603 tonnes (ISC), about 50% lower than the Inventory data. For the period 2005-2013, the Inventory average emissions are 60% higher than emission estimates based on Cape Grim data (ISC/NAME). Over the period 2002-2011, NAME and ISC emission estimates agree to within 2% (NAME lower). ISC/NAME estimates of HFC-125 emissions have grown from 350 tonnes in 2005 to 600 tonnes in 2013. Like HFC-134a, the Cape Grim HFC-125 data suggest near constant or perhaps declining emissions, whereas in the Inventory the emissions continue to grow through 2013 (Figure 8). Based on atmospheric data, global emissions of HFC-125 were 41 k tonnes in 2012 (Rigby et al., 2014). Australian emissions are about 1.5% of global emissions based on ISC/NAME data, and 2.6% based on Inventory data.
6.3 HFC-143a
18 | Fraser et al., 2015
According to the Inventory (Table 3), the next major HFC emitted into the Australian environment is HFC-143a with current (2013) emissions at about 117 tonnes. Based on Cape Grim data, Australian emissions of HFC-143a in 2013 were about 530 tonnes (ISC), almost a factor of 5 higher than Inventory estimates. NAME and ISC data agree to within 1% for the period 2005-2011 (NAME higher). Like HFC-134a and HFC-125, the Cape Grim HFC-143a data suggest near constant or perhaps declining emissions, whereas in the Inventory the emissions continue to grow through 2013 (Figure 8). Based on atmospheric data, global emissions of HFC-143a were 23 k tonnes in 2012 (Rigby et al., 2014). Australian emissions are about 2.4% of global emissions based on ISC/NAME data, and 0.5% based on Inventory data. The Australian HFC-143a emissions based on Cape Grim data seem unusually high.
Simmonds et al. (2015b) report growing USA HFC-143a emissions through 2012 (8.5 k tonnes), with no obvious seasonality.
6.4 HFC-32
HFC-32 emission estimates are estimated in the Inventory to be 68 tonnes in 2013. The emissions based on Cape Grim data (186 tonnes in 2013) are significantly higher than in the Inventory. Over the period 2006-2011, ISC and NAME emission estimates agree to within 36% (NAME lower). Unlike HFC-134a, HFC-125 and HFC-143a, the Cape Grim data and the Inventory both suggest increasing emissions of HFC-32 through 2012, then in 2013 ISC estimates suggest a decline (Figure 8). Based on atmospheric data, global emissions of HFC-32 were 20 k tonnes in 2012 (Rigby et al., 2014). Australian emissions are about 1.1% of global emissions based on ISC/NAME data, and 0.3% based on Inventory data.
Simmonds et al. (2015b) report that USA HFC-32 emissions have stabilized through 2011-2012 (5-6 k tonnes), following strong growth in emissions during 2005-2010; there is no obvious seasonality in USA HFC-32 emissions.
6.5 HFC-152a
HFC-152a emissions are not listed in the Inventory. The 2013 emissions have been estimated from Cape Grim data at 69 tonnes (ISC). Over the period 2002-2011, ISC and NAME estimates of Australian emissions agree to within 1% (NAME higher). Imports of HFC-152a into Australia were 13 tonnes in 2013 and 21 tonnes in 2014. Like HFC-32, the Cape Grim data show that HFC-152a emissions continue to grow through 2012, then decline in 2013.
Simmonds et al. (2015b) report that USA HFC-152a emissions have grown through 2012 (52-53 k tonnes); there is a suggestion of seasonality in USA HFC-152a emissions, with summer emissions lower than winter; however derivation of possible seasonality in the HFC-152a source is uncertain because HFC-152a is relatively short-lived in the atmosphere and there is a strong summer sink for HFC-152a.
Based on atmospheric data, global emissions of HFC-152a were 54 k tonnes in 2012 (Rigby et al., 2014). Australian emissions are about 0.1% of global emissions based on ISC/NAME data. It would be unusual for Australian emissions of an industrial chemical to be less than 0.1% of global emissions. The possible reasons for the low Australian emission (low use in Australia compared to rest of world) are being investigated. One suggestion (M. Bennett, RRA, personal communication, 2011) is that a significant major-volume use in other parts of the world for HFC-152a is as an aerosol propellant, a use not taken up in Australia.
6.6 HFC-23
HFC-23 emission estimates are estimated in the Inventory to be 0.4 tonnes in 2012 and 2013. In the 1990s, Australian emissions were estimated as fugitive emissions from Sydney-based Australian HCFC-22 production. HCFC-22 production ceased in Australia in 1995. Imports are currently recorded at about 1 tonne in 2012, 0.1 tonnes in 2013 and 0.31 in 2014. The 2012 and 2013 emissions have been estimated from Cape Grim data at 46 tonnes (ISC). Over the period 2002-2011, ISC and NAME estimates of Australian emissions agree to within 18% (NAME lower). HFC-23 emissions have remained relatively constant since 2007. In CO2-e terms, HFC-23 is currently the 4
th largest HFC
emitted in Australia (after HFC-134a, HFC-143a and HFC-125), larger than HFC-32. This is because the GWP (Global Warming Potential) of HFC-23, at 14,800, is about 3.3 times larger than the next most potent HFC (HFC-143a, GWP 4470). Based on atmospheric data, global emissions of HFC-23 were 12 k tonnes in 2012 (Rigby et al., 2014). Current Australian emissions are about 0.4% of global emissions based on ISC/NAME data, 0% based on the Inventory.
The origin of these Australian HFC-23 emissions is unknown. HFC-23 is a component of the R-508 series of refrigerants, but significant imports of R-508 refrigerants into Australia have not been recorded. The other component of the R-508
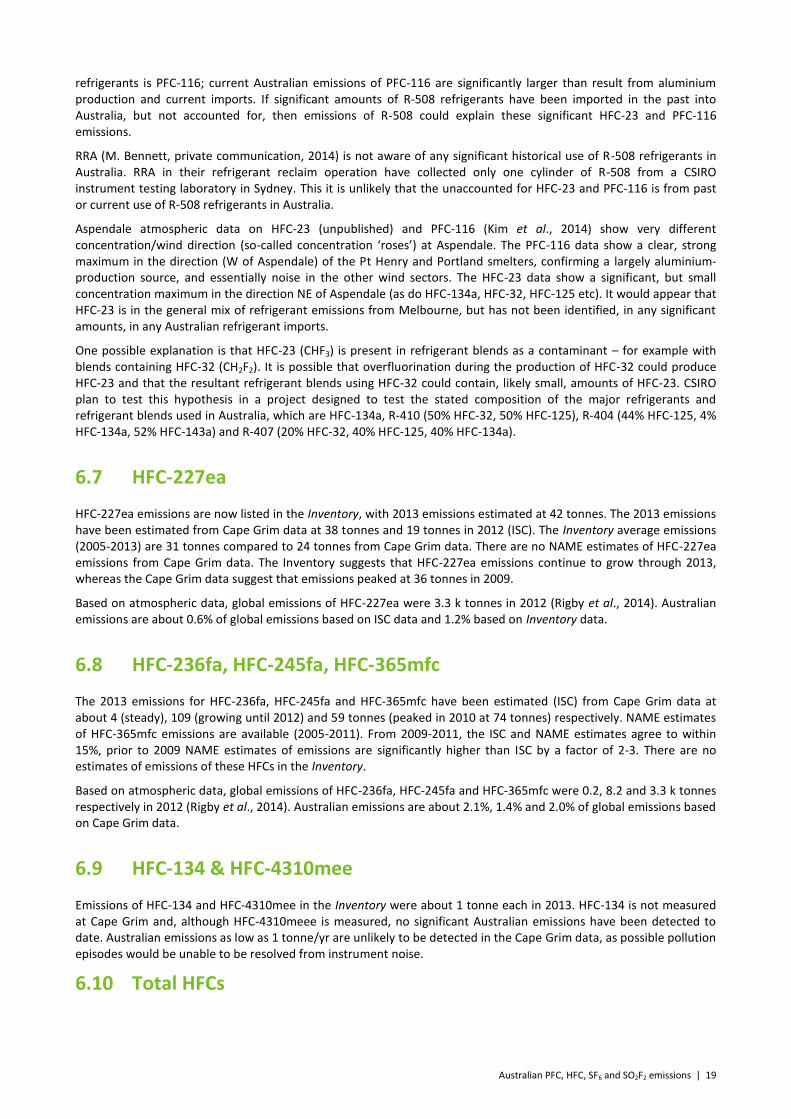
Australian PFC, HFC, SF6 and SO2F2 emissions | 19
refrigerants is PFC-116; current Australian emissions of PFC-116 are significantly larger than result from aluminium production and current imports. If significant amounts of R-508 refrigerants have been imported in the past into Australia, but not accounted for, then emissions of R-508 could explain these significant HFC-23 and PFC-116 emissions.
RRA (M. Bennett, private communication, 2014) is not aware of any significant historical use of R-508 refrigerants in Australia. RRA in their refrigerant reclaim operation have collected only one cylinder of R-508 from a CSIRO instrument testing laboratory in Sydney. This it is unlikely that the unaccounted for HFC-23 and PFC-116 is from past or current use of R-508 refrigerants in Australia.
Aspendale atmospheric data on HFC-23 (unpublished) and PFC-116 (Kim et al., 2014) show very different concentration/wind direction (so-called concentration ‘roses’) at Aspendale. The PFC-116 data show a clear, strong maximum in the direction (W of Aspendale) of the Pt Henry and Portland smelters, confirming a largely aluminium-production source, and essentially noise in the other wind sectors. The HFC-23 data show a significant, but small concentration maximum in the direction NE of Aspendale (as do HFC-134a, HFC-32, HFC-125 etc). It would appear that HFC-23 is in the general mix of refrigerant emissions from Melbourne, but has not been identified, in any significant amounts, in any Australian refrigerant imports.
One possible explanation is that HFC-23 (CHF3) is present in refrigerant blends as a contaminant – for example with blends containing HFC-32 (CH2F2). It is possible that overfluorination during the production of HFC-32 could produce HFC-23 and that the resultant refrigerant blends using HFC-32 could contain, likely small, amounts of HFC-23. CSIRO plan to test this hypothesis in a project designed to test the stated composition of the major refrigerants and refrigerant blends used in Australia, which are HFC-134a, R-410 (50% HFC-32, 50% HFC-125), R-404 (44% HFC-125, 4% HFC-134a, 52% HFC-143a) and R-407 (20% HFC-32, 40% HFC-125, 40% HFC-134a).
6.7 HFC-227ea
HFC-227ea emissions are now listed in the Inventory, with 2013 emissions estimated at 42 tonnes. The 2013 emissions have been estimated from Cape Grim data at 38 tonnes and 19 tonnes in 2012 (ISC). The Inventory average emissions (2005-2013) are 31 tonnes compared to 24 tonnes from Cape Grim data. There are no NAME estimates of HFC-227ea emissions from Cape Grim data. The Inventory suggests that HFC-227ea emissions continue to grow through 2013, whereas the Cape Grim data suggest that emissions peaked at 36 tonnes in 2009.
Based on atmospheric data, global emissions of HFC-227ea were 3.3 k tonnes in 2012 (Rigby et al., 2014). Australian emissions are about 0.6% of global emissions based on ISC data and 1.2% based on Inventory data.
6.8 HFC-236fa, HFC-245fa, HFC-365mfc
The 2013 emissions for HFC-236fa, HFC-245fa and HFC-365mfc have been estimated (ISC) from Cape Grim data at about 4 (steady), 109 (growing until 2012) and 59 tonnes (peaked in 2010 at 74 tonnes) respectively. NAME estimates of HFC-365mfc emissions are available (2005-2011). From 2009-2011, the ISC and NAME estimates agree to within 15%, prior to 2009 NAME estimates of emissions are significantly higher than ISC by a factor of 2-3. There are no estimates of emissions of these HFCs in the Inventory.
Based on atmospheric data, global emissions of HFC-236fa, HFC-245fa and HFC-365mfc were 0.2, 8.2 and 3.3 k tonnes respectively in 2012 (Rigby et al., 2014). Australian emissions are about 2.1%, 1.4% and 2.0% of global emissions based on Cape Grim data.
6.9 HFC-134 & HFC-4310mee
Emissions of HFC-134 and HFC-4310mee in the Inventory were about 1 tonne each in 2013. HFC-134 is not measured at Cape Grim and, although HFC-4310meee is measured, no significant Australian emissions have been detected to date. Australian emissions as low as 1 tonne/yr are unlikely to be detected in the Cape Grim data, as possible pollution episodes would be unable to be resolved from instrument noise.
6.10 Total HFCs
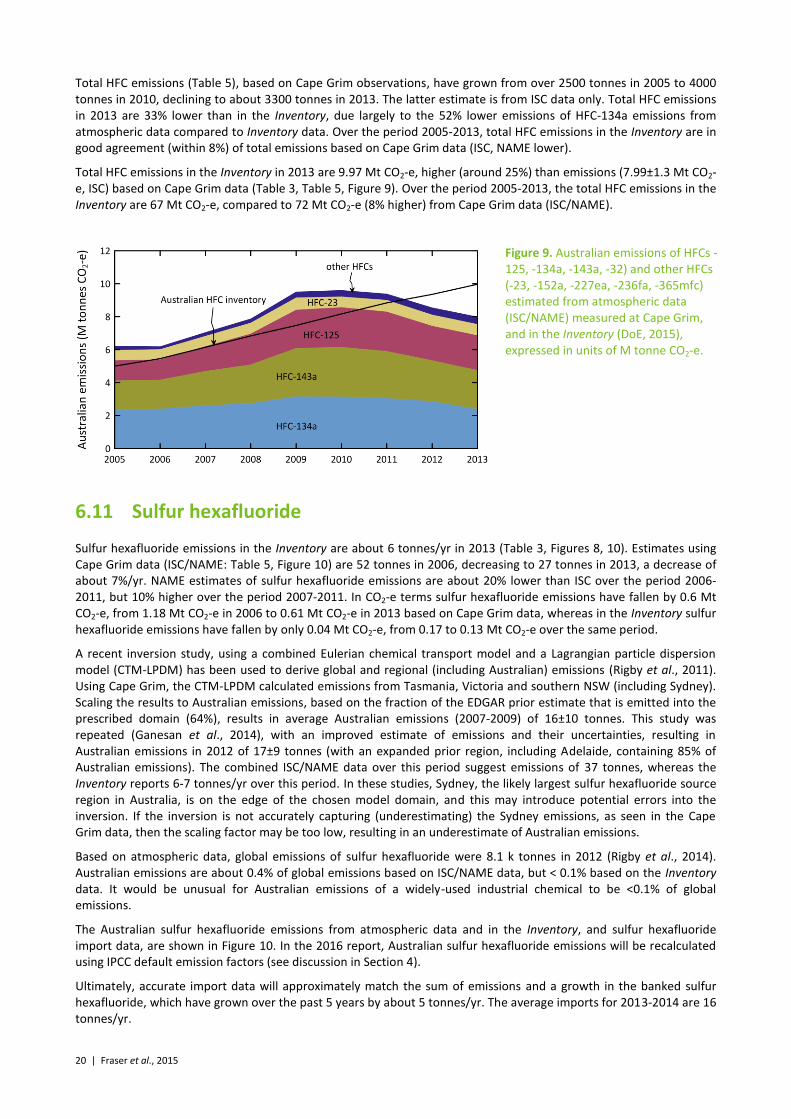
20 | Fraser et al., 2015
Total HFC emissions (Table 5), based on Cape Grim observations, have grown from over 2500 tonnes in 2005 to 4000 tonnes in 2010, declining to about 3300 tonnes in 2013. The latter estimate is from ISC data only. Total HFC emissions in 2013 are 33% lower than in the Inventory, due largely to the 52% lower emissions of HFC-134a emissions from atmospheric data compared to Inventory data. Over the period 2005-2013, total HFC emissions in the Inventory are in good agreement (within 8%) of total emissions based on Cape Grim data (ISC, NAME lower).
Total HFC emissions in the Inventory in 2013 are 9.97 Mt CO2-e, higher (around 25%) than emissions (7.99±1.3 Mt CO2-e, ISC) based on Cape Grim data (Table 3, Table 5, Figure 9). Over the period 2005-2013, the total HFC emissions in the Inventory are 67 Mt CO2-e, compared to 72 Mt CO2-e (8% higher) from Cape Grim data (ISC/NAME).
Figure 9. Australian emissions of HFCs -125, -134a, -143a, -32) and other HFCs (-23, -152a, -227ea, -236fa, -365mfc) estimated from atmospheric data (ISC/NAME) measured at Cape Grim, and in the Inventory (DoE, 2015), expressed in units of M tonne CO2-e.
6.11 Sulfur hexafluoride
Sulfur hexafluoride emissions in the Inventory are about 6 tonnes/yr in 2013 (Table 3, Figures 8, 10). Estimates using Cape Grim data (ISC/NAME: Table 5, Figure 10) are 52 tonnes in 2006, decreasing to 27 tonnes in 2013, a decrease of about 7%/yr. NAME estimates of sulfur hexafluoride emissions are about 20% lower than ISC over the period 2006-2011, but 10% higher over the period 2007-2011. In CO2-e terms sulfur hexafluoride emissions have fallen by 0.6 Mt CO2-e, from 1.18 Mt CO2-e in 2006 to 0.61 Mt CO2-e in 2013 based on Cape Grim data, whereas in the Inventory sulfur hexafluoride emissions have fallen by only 0.04 Mt CO2-e, from 0.17 to 0.13 Mt CO2-e over the same period.
A recent inversion study, using a combined Eulerian chemical transport model and a Lagrangian particle dispersion model (CTM-LPDM) has been used to derive global and regional (including Australian) emissions (Rigby et al., 2011). Using Cape Grim, the CTM-LPDM calculated emissions from Tasmania, Victoria and southern NSW (including Sydney). Scaling the results to Australian emissions, based on the fraction of the EDGAR prior estimate that is emitted into the prescribed domain (64%), results in average Australian emissions (2007-2009) of 16±10 tonnes. This study was repeated (Ganesan et al., 2014), with an improved estimate of emissions and their uncertainties, resulting in Australian emissions in 2012 of 17±9 tonnes (with an expanded prior region, including Adelaide, containing 85% of Australian emissions). The combined ISC/NAME data over this period suggest emissions of 37 tonnes, whereas the Inventory reports 6-7 tonnes/yr over this period. In these studies, Sydney, the likely largest sulfur hexafluoride source region in Australia, is on the edge of the chosen model domain, and this may introduce potential errors into the inversion. If the inversion is not accurately capturing (underestimating) the Sydney emissions, as seen in the Cape Grim data, then the scaling factor may be too low, resulting in an underestimate of Australian emissions.
Based on atmospheric data, global emissions of sulfur hexafluoride were 8.1 k tonnes in 2012 (Rigby et al., 2014). Australian emissions are about 0.4% of global emissions based on ISC/NAME data, but < 0.1% based on the Inventory data. It would be unusual for Australian emissions of a widely-used industrial chemical to be <0.1% of global emissions.
The Australian sulfur hexafluoride emissions from atmospheric data and in the Inventory, and sulfur hexafluoride import data, are shown in Figure 10. In the 2016 report, Australian sulfur hexafluoride emissions will be recalculated using IPCC default emission factors (see discussion in Section 4).
Ultimately, accurate import data will approximately match the sum of emissions and a growth in the banked sulfur hexafluoride, which have grown over the past 5 years by about 5 tonnes/yr. The average imports for 2013-2014 are 16 tonnes/yr.
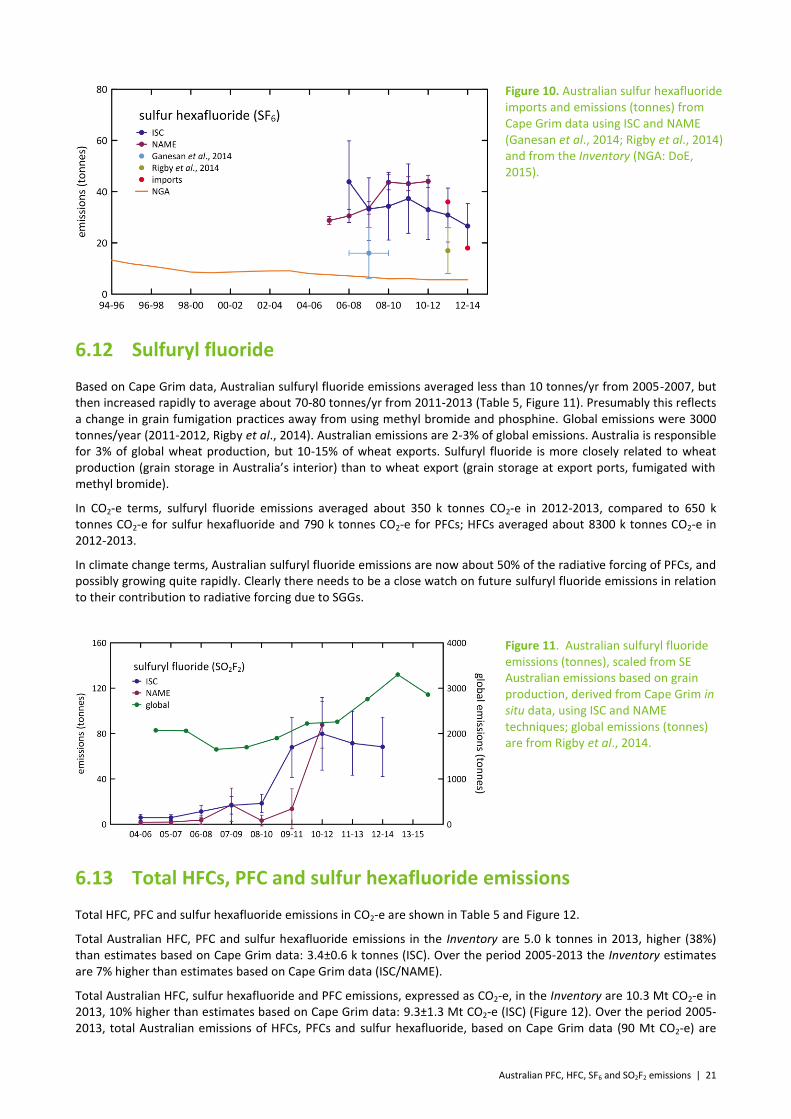
Australian PFC, HFC, SF6 and SO2F2 emissions | 21
Figure 10. Australian sulfur hexafluoride imports and emissions (tonnes) from Cape Grim data using ISC and NAME (Ganesan et al., 2014; Rigby et al., 2014) and from the Inventory (NGA: DoE, 2015).
6.12 Sulfuryl fluoride
Based on Cape Grim data, Australian sulfuryl fluoride emissions averaged less than 10 tonnes/yr from 2005-2007, but then increased rapidly to average about 70-80 tonnes/yr from 2011-2013 (Table 5, Figure 11). Presumably this reflects a change in grain fumigation practices away from using methyl bromide and phosphine. Global emissions were 3000 tonnes/year (2011-2012, Rigby et al., 2014). Australian emissions are 2-3% of global emissions. Australia is responsible for 3% of global wheat production, but 10-15% of wheat exports. Sulfuryl fluoride is more closely related to wheat production (grain storage in Australia’s interior) than to wheat export (grain storage at export ports, fumigated with methyl bromide).
In CO2-e terms, sulfuryl fluoride emissions averaged about 350 k tonnes CO2-e in 2012-2013, compared to 650 k tonnes CO2-e for sulfur hexafluoride and 790 k tonnes CO2-e for PFCs; HFCs averaged about 8300 k tonnes CO2-e in 2012-2013.
In climate change terms, Australian sulfuryl fluoride emissions are now about 50% of the radiative forcing of PFCs, and possibly growing quite rapidly. Clearly there needs to be a close watch on future sulfuryl fluoride emissions in relation to their contribution to radiative forcing due to SGGs.
Figure 11. Australian sulfuryl fluoride emissions (tonnes), scaled from SE Australian emissions based on grain production, derived from Cape Grim in situ data, using ISC and NAME techniques; global emissions (tonnes) are from Rigby et al., 2014.
6.13 Total HFCs, PFC and sulfur hexafluoride emissions
Total HFC, PFC and sulfur hexafluoride emissions in CO2-e are shown in Table 5 and Figure 12.
Total Australian HFC, PFC and sulfur hexafluoride emissions in the Inventory are 5.0 k tonnes in 2013, higher (38%) than estimates based on Cape Grim data: 3.4±0.6 k tonnes (ISC). Over the period 2005-2013 the Inventory estimates are 7% higher than estimates based on Cape Grim data (ISC/NAME).
Total Australian HFC, sulfur hexafluoride and PFC emissions, expressed as CO2-e, in the Inventory are 10.3 Mt CO2-e in 2013, 10% higher than estimates based on Cape Grim data: 9.3±1.3 Mt CO2-e (ISC) (Figure 12). Over the period 2005-2013, total Australian emissions of HFCs, PFCs and sulfur hexafluoride, based on Cape Grim data (90 Mt CO2-e) are
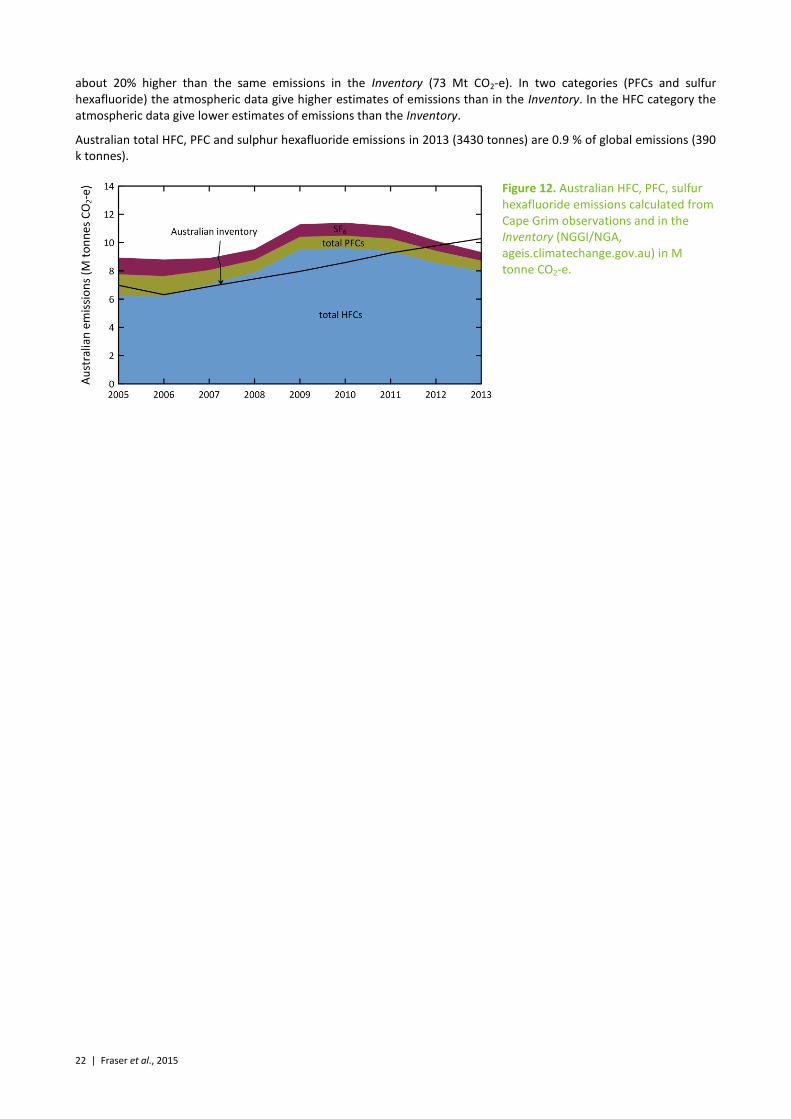
22 | Fraser et al., 2015
about 20% higher than the same emissions in the Inventory (73 Mt CO2-e). In two categories (PFCs and sulfur hexafluoride) the atmospheric data give higher estimates of emissions than in the Inventory. In the HFC category the atmospheric data give lower estimates of emissions than the Inventory.
Australian total HFC, PFC and sulphur hexafluoride emissions in 2013 (3430 tonnes) are 0.9 % of global emissions (390 k tonnes).
Figure 12. Australian HFC, PFC, sulfur hexafluoride emissions calculated from Cape Grim observations and in the Inventory (NGGI/NGA, ageis.climatechange.gov.au) in M tonne CO2-e.
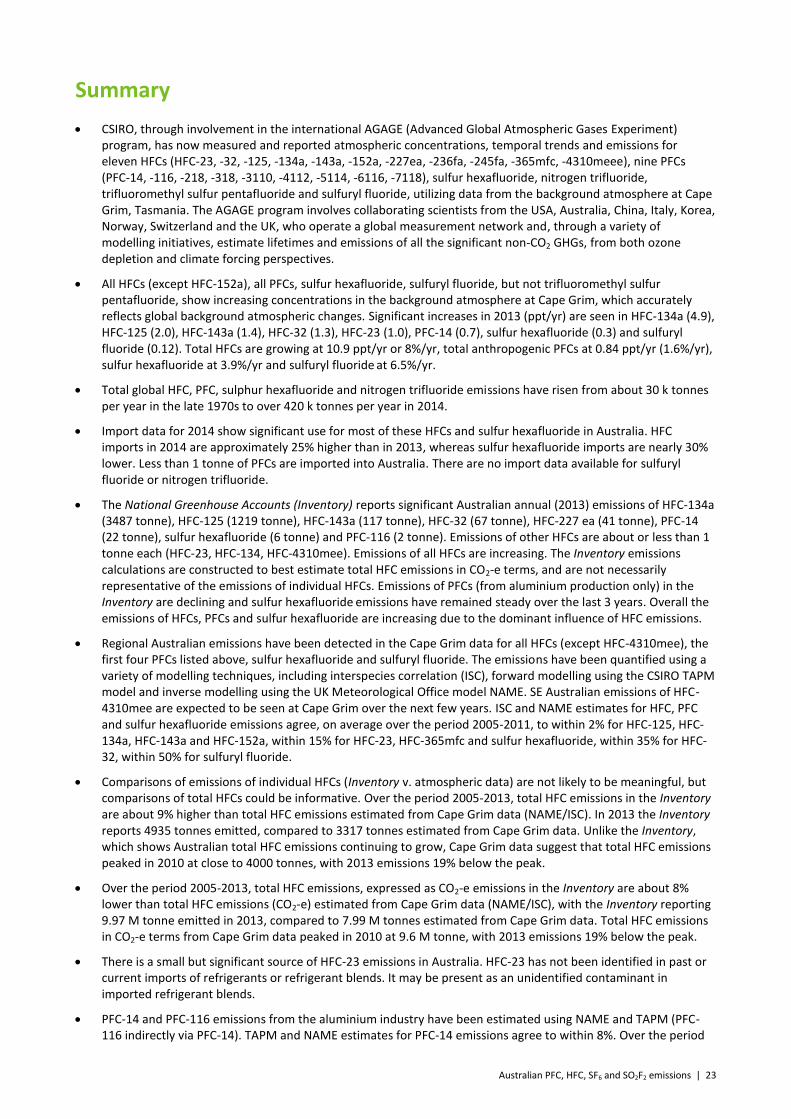
Australian PFC, HFC, SF6 and SO2F2 emissions | 23
Summary
CSIRO, through involvement in the international AGAGE (Advanced Global Atmospheric Gases Experiment) program, has now measured and reported atmospheric concentrations, temporal trends and emissions for eleven HFCs (HFC-23, -32, -125, -134a, -143a, -152a, -227ea, -236fa, -245fa, -365mfc, -4310meee), nine PFCs (PFC-14, -116, -218, -318, -3110, -4112, -5114, -6116, -7118), sulfur hexafluoride, nitrogen trifluoride, trifluoromethyl sulfur pentafluoride and sulfuryl fluoride, utilizing data from the background atmosphere at Cape Grim, Tasmania. The AGAGE program involves collaborating scientists from the USA, Australia, China, Italy, Korea, Norway, Switzerland and the UK, who operate a global measurement network and, through a variety of modelling initiatives, estimate lifetimes and emissions of all the significant non-CO2 GHGs, from both ozone depletion and climate forcing perspectives.
All HFCs (except HFC-152a), all PFCs, sulfur hexafluoride, sulfuryl fluoride, but not trifluoromethyl sulfur pentafluoride, show increasing concentrations in the background atmosphere at Cape Grim, which accurately reflects global background atmospheric changes. Significant increases in 2013 (ppt/yr) are seen in HFC-134a (4.9), HFC-125 (2.0), HFC-143a (1.4), HFC-32 (1.3), HFC-23 (1.0), PFC-14 (0.7), sulfur hexafluoride (0.3) and sulfuryl fluoride (0.12). Total HFCs are growing at 10.9 ppt/yr or 8%/yr, total anthropogenic PFCs at 0.84 ppt/yr (1.6%/yr), sulfur hexafluoride at 3.9%/yr and sulfuryl fluoride at 6.5%/yr.
Total global HFC, PFC, sulphur hexafluoride and nitrogen trifluoride emissions have risen from about 30 k tonnes per year in the late 1970s to over 420 k tonnes per year in 2014.
Import data for 2014 show significant use for most of these HFCs and sulfur hexafluoride in Australia. HFC imports in 2014 are approximately 25% higher than in 2013, whereas sulfur hexafluoride imports are nearly 30% lower. Less than 1 tonne of PFCs are imported into Australia. There are no import data available for sulfuryl fluoride or nitrogen trifluoride.
The National Greenhouse Accounts (Inventory) reports significant Australian annual (2013) emissions of HFC-134a (3487 tonne), HFC-125 (1219 tonne), HFC-143a (117 tonne), HFC-32 (67 tonne), HFC-227 ea (41 tonne), PFC-14 (22 tonne), sulfur hexafluoride (6 tonne) and PFC-116 (2 tonne). Emissions of other HFCs are about or less than 1 tonne each (HFC-23, HFC-134, HFC-4310mee). Emissions of all HFCs are increasing. The Inventory emissions calculations are constructed to best estimate total HFC emissions in CO2-e terms, and are not necessarily representative of the emissions of individual HFCs. Emissions of PFCs (from aluminium production only) in the Inventory are declining and sulfur hexafluoride emissions have remained steady over the last 3 years. Overall the emissions of HFCs, PFCs and sulfur hexafluoride are increasing due to the dominant influence of HFC emissions.
Regional Australian emissions have been detected in the Cape Grim data for all HFCs (except HFC-4310mee), the first four PFCs listed above, sulfur hexafluoride and sulfuryl fluoride. The emissions have been quantified using a variety of modelling techniques, including interspecies correlation (ISC), forward modelling using the CSIRO TAPM model and inverse modelling using the UK Meteorological Office model NAME. SE Australian emissions of HFC-4310mee are expected to be seen at Cape Grim over the next few years. ISC and NAME estimates for HFC, PFC and sulfur hexafluoride emissions agree, on average over the period 2005-2011, to within 2% for HFC-125, HFC-134a, HFC-143a and HFC-152a, within 15% for HFC-23, HFC-365mfc and sulfur hexafluoride, within 35% for HFC-32, within 50% for sulfuryl fluoride.
Comparisons of emissions of individual HFCs (Inventory v. atmospheric data) are not likely to be meaningful, but comparisons of total HFCs could be informative. Over the period 2005-2013, total HFC emissions in the Inventory are about 9% higher than total HFC emissions estimated from Cape Grim data (NAME/ISC). In 2013 the Inventory reports 4935 tonnes emitted, compared to 3317 tonnes estimated from Cape Grim data. Unlike the Inventory, which shows Australian total HFC emissions continuing to grow, Cape Grim data suggest that total HFC emissions peaked in 2010 at close to 4000 tonnes, with 2013 emissions 19% below the peak.
Over the period 2005-2013, total HFC emissions, expressed as CO2-e emissions in the Inventory are about 8% lower than total HFC emissions (CO2-e) estimated from Cape Grim data (NAME/ISC), with the Inventory reporting 9.97 M tonne emitted in 2013, compared to 7.99 M tonnes estimated from Cape Grim data. Total HFC emissions in CO2-e terms from Cape Grim data peaked in 2010 at 9.6 M tonne, with 2013 emissions 19% below the peak.
There is a small but significant source of HFC-23 emissions in Australia. HFC-23 has not been identified in past or current imports of refrigerants or refrigerant blends. It may be present as an unidentified contaminant in imported refrigerant blends.
PFC-14 and PFC-116 emissions from the aluminium industry have been estimated using NAME and TAPM (PFC-116 indirectly via PFC-14). TAPM and NAME estimates for PFC-14 emissions agree to within 8%. Over the period
24 | Fraser et al., 2015
2005-2013, PFC-14 emissions in the Inventory are in decline and are about 25% lower than PFC-14 emissions estimated from Cape Grim data (NAME/ISC). In 2013 the Inventory reports 22 tonnes emitted, compared to 57 tonnes estimated from Cape Grim data. The Inventory data show PFC-14 emissions from the aluminium industry have declined at 10%/yr since 2006. The PFC-14 emissions from Cape Grim data have declined at 8%/yr since 2006.
Total Australian PFC-116 emissions and PFC-116 emissions specifically from the aluminium industry have been estimated from atmospheric data using NAME and TAPM. Over the period 2005-2013, PFC-116 emissions in the Inventory (assumed only from the aluminium industry) and as seen at Cape Grim are in decline. The Inventory emissions averaged over the period 2005-2013 are equal to emissions derived from Cape Grim data (TAPM NAME PFC-14) for the aluminium industry and have declined by close to 80% since 2006.
Total PFC-116 emissions as seen at Cape Grim (NAME) are increasing, approximately doubling since 2006, currently at 29 tonnes/yr. The data suggest that a significant, post-2007, non-aluminium PFC-116 source is in operation in Australia, and this is not captured in the import data. The source of this additional PFC-116 is unknown. Globally, the primary non-aluminium source of PFC-116 is from etching processes used in the electronics industry. Further analysis of past and future Aspendale and Sydney PFC-116 data could help identify this source.
Cape Grim observations show that Australian emissions of PFC-218 were growing until 2011, but are now declining and PFC-318 emissions are declining, with current (2013) emissions for PFC-218 about 9 tonnes and PFC-318 about 15 tonnes. There are no significant Australian imports identified for these PFCs. Globally PFC-218 and PFC-318 are used in the electronics industry (etching), in refrigeration, in fire suppression and in medical applications. As with PFC-116, further analysis of past and future Aspendale and Sydney PFC-218 and PFC-318 data could help identify source(s) of these PFCs.
Not surprisingly, total Australian PFCs (from Cape Grim data) declined from 2005 to 2008, largely driven by emissions from the aluminium industry. From 2008 to 2012 emissions were steady at around 100 tonnes per year and then declined further to 87 tonnes in 2013.
Over the period 2006 – 2013, both the Inventory and Cape Grim data show that Australian sulfur hexafluoride emissions are in decline (26% decline in the Inventory, 46% seen at Cape Grim). However the Inventory sulfur hexafluoride emissions are significantly lower than emissions estimated from Cape Grim data; over the period 2006 to 2013 the sulfur hexafluoride emissions in the inventory average 6 tonnes/yr, about a factor of 6 lower than estimates from Cape Grim over the same period (37 tonnes/yr). This is a major discrepancy and is currently under investigation.
Australian sulfur hexafluoride emissions in the Inventory are less <0.1% of global emissions. It would be unusual for Australian emissions of a widely-used industrial chemical like sulfur hexafluoride to be <0.1% of global emissions. A number approaching 1% would be consistent with several other widely used HFCs and HCFCs. The Cape Grim data indicate that Australian emissions of sulfur hexafluoride were 0.4% of global emissions in 2012.
Total Australian HFC, PFC and sulfur hexafluoride emissions, expressed as CO2-e emissions, over the period 2005-2013 estimated from atmospheric data (Cape Grim, ISC, NAME, TAPM ) are about 20% higher than in the Inventory, although in 2013 the agreement is much closer (10%, Inventory lower). As indicated above, this comes about due to a reasonable agreement over the period 2005-2013 between the Inventory and atmospheric data for HFCs (8%, Inventory lower), whereas, for PFCs and sulfur hexafluoride, the Inventory emissions are substantially lower than those derived from Cape Grim data. In 2013, the combined PFC and sulfur hexafluoride emissions calculated from Cape Grim data were 114 tonnes, almost a factor of 4 higher than combined PFC and sulfur hexafluoride emissions in the Inventory (30 tonnes).
Importantly, Cape Grim data suggest that the combined Australian emissions of HFCs, PFCs and sulfur hexafluoride peaked in 2010 and are now in decline, whereas the Inventory shows that emissions have continued to grow through 2013.
Australian PFC, HFC, SF6 and SO2F2 emissions | 25
References
Arnold, T., C. M. Harth, J. Mühle, A. J. Manning, P. K. Salameh, J. Kim, D. J. Ivy, L. P. Steele, V. V. Petrenko, J. P. Severinghaus, D. Baggenstos & R. F. Weiss, Nitrogen trifluoride global emissions estimated from updated atmospheric measurements, PNAS, 110(6), 2029-2034, doi:10.1073/pnas.1212346110, 2013.
Arnold, T., D. J. Ivy, C. M. Harth, M. K. ollmer, J. M hle, P. K. Salameh, L. P. Steele, P. B. Krummel, R. H. J. Wang, D.
Young, C. R. Lunder, O. Hermansen, T. S. Rhee, J. Kim, S. Reimann, S. O’Doherty, P. J. Fraser, P. G. Simmonds, R. G. Prinn & R. F. Weiss, HFC-43-10mee atmospheric abundances and global emission estimates, Geophys. Res. Lett., 41(6), 2228-2235, doi:10.1002/2013GL059143, 2014.
Brodribb, P. & M. McCann, Cold Hard Facts 2: a study of the refrigeration and air conditioning industry in Australia, Expert Group/Thinkwell Australia, for DSEWPAC, Commonwealth of Australia, 134 pp., 2013.
Brodribb, P. & M. McCann, HFC Consumption in Australia in 2013 and an Assessment of the Capacity of Industry to Transition to Nil and Lower GWP alternatives, Expert Group/Thinkwell Australia, for the Department of the Environment, Commonwealth of Australia, 129 pp., 2014.
Daniel, J. & G. Velders, A Focus on Information and Options for Policymakers, Chapter 5 in Scientific Assessment of Ozone Depletion: 2010, WMO Global Ozone Research and Monitoring Project – Report No. 52, 5.1-5.56, 2011.
DCCEE 2012, National Inventory Report 2010, Volume 1, Australian Government, Department of Climate Change and Energy Efficiency, April 2012, 292 pp.
DIICCSRTE 2013, National Inventory Report 2011, Volume 1, Australian Government Department of Industry, Innovation, Climate Change, Science, Research and Tertiary Education, April 2013, 299 pp.
DoE 2014, National Inventory Report 2012, Volume 1, Australian Government Department of the Environment, April 2014, 351 pp.
DoE 2015, National Inventory Report 2013, Volume 1, Australian Government Department of the Environment, May 2015, 347 pp.
Dunse, B. L., L. P. Steele, P. J. Fraser & S. R. Wilson, An analysis of Melbourne pollution episodes observed at Cape Grim from 1995-1998, Baseline Atmospheric Program (Australia) 1997-98, N. W. Tindale, N. Derek & R. J. Francey (eds.), Bureau of Meteorology and CSIRO Atmospheric Research, Melbourne, Australia, 34-42, 2001.
Dunse, B. L., Investigation of urban emissions of trace gases by use of atmospheric measurements and a high-resolution atmospheric transport model, PhD thesis, University of Wollongong, Wollongong, NSW, Australia, 2002.
Dunse, B.L., L.P. Steele, S.R. Wilson, P.J. Fraser &, P. B. Krummel, Trace gas emissions from Melbourne, Australia, based on AGAGE observations at Cape Grim, Tasmania, 1995-2000, Atmos. Environ., 39(34), 6334-6344, doi:10.1016/j.atmosenv.2005.07.014, 2005.
Draxler, R. & D. Hess, Description of the HYSPLIT_4 Modeling 389 System, NOAA Technical Memorandum ERL ARL-224, 24 pp, NOAA, 1997.
Estrada, F., P. Perron & B. Martínez-López, Statistically derived contributions of diverse human influences to twentieth-century temperature changes, Nature Geosci., 6(11), 1050-1055, doi:10.1038/ngeo1999, 2013.
Fortems-Cheiney, A., M. Saunois, I, Pison, F. Chevallier, P. Bousquet, C. Cressot, S. Montzka, P. Fraser, M. Vollmer, P. Simmonds, D. Young, S. O'Doherty, F. Artuso, B. Barletta, D. Blake, S. Li, C. Lunder, B. Miller, S. Park, R. Prinn, T. Saito, P. Steele & Y. Yokouchi, Increase in HFC-134a emissions in response to the success of the Montreal Protocol, J. Geophys. Res., re-submitted (Jun 2015).
Fraser, P. J., L. W. Porter, S. B. Baly, P. B. Krummel, B. L. Dunse, L. P. Steele, N. Derek, R. L. Langenfelds, I. Levin, D. E. Oram, J. W., Elkins, M. K., Vollmer & R. F. Weiss, Sulfur hexafluoride at Cape Grim: long term trends and regional emissions, Baseline Atmospheric Program (Australia) 2001-2002, J. M. Cainey, N. Derek and P. B. Krummel (eds.), Bureau of Meteorology and CSIRO Atmospheric Research, Melbourne, Australia, 18-23, 2004.
Fraser, P., C. Trudinger, B. Dunse, P. Krummel, P. Steele, D. Etheridge, N. Derek, L. Porter & B. Miller, PFC emissions from global and Australian aluminium production, Proceedings of the 9
th Australasian Aluminium Smelting
Technology Conference and Workshops, Skyllas-Kazacos, M. & B. Welch (eds.), 4-9 November 2007, Terrigal, Australia, School of Chemical Engineering, UNSW, Sydney, ISBN:9780733425561,
©2007.
Fraser, P., B. Dunse, L. P. Steele, P. B. Krummel & N. Derek, Perfluorocarbon (PFC) emissions from Australian aluminium smelters, 2005-2009, Proceedings of the 10
th Australasian Aluminium Smelting Technology Conference,
26 | Fraser et al., 2015
9-14 October, 2011, Launceston, Australia, B. Welch, G. Stephens, J. Metson & M. Skyllos-Kazacos (eds.), School of Chemical Engineering, UNSW, Sydney, ISBN:978-0-7334-3054-1, 14 pp.,
©2011
Fraser. P., P. Steele & M. A. Cooksey, PFC and CO2 emissions from an aluminium smelter measured using integrated stack sampling, GC-MS and GC-FID, Light Metals 2013, B. Sadler (ed.), Wiley/TMS 2013, 871-876, 2013.
Fraser, P. J., P. B. Krummel, L. P. Steele, C. M. Trudinger, D. M. Etheridge, N. Derek, S. O’Doherty, P. G. Simmonds, B. R. Miller, J. Mühle, R. F. Weiss, D. E. Oram, R. G. Prinn & R. H. J. Wang, Equivalent effective stratospheric chlorine from Cape Grim Air Archive, Antarctic firn and AGAGE global measurements of ozone depleting substances, Baseline Atmospheric Program (Australia) 2009-2010, N. Derek P. B. Krummel & S. J. Cleland (eds.), Australian Bureau of Meteorology and CSIRO Marine and Atmospheric Research, Melbourne, Australia, 17-23, 2014a
Fraser, P. J., B. L. Dunse, A. J. Manning, R. H. J. Wang, P. B. Krummel, L. P. Steele, L. W. Porter, C. Allison. S. O’Doherty, P. G. Simmonds, J. Mühle & R. G. Prinn, Australian carbon tetrachloride (CCl4) emissions in a global context, Environ. Chem., 11, 77-88, doi:10.1071/EN13171, 2014b.
Ganesan, A. L., M. Rigby, A. Zammit-Mangion, A. J. Manning, R. G. Prinn, P. J. Fraser, C. M. Harth, K.-R. Kim, P. B. Krummel, S. Li, J. Mühle, S. J. O'Doherty, S. Park, P. K. Salameh, L. P. Steele & R. F. Weiss, Characterization of uncertainties in trace gas inversions using hierarchical Bayesian methods, Atmos. Chem. Phys., 14(8), 3855-3864, doi:10.5194/acp-14-3855-2014, 2014.
Greally, B. R., A. J. Manning, S. Reimann, A. McCulloch, J. Huang, B. L. Dunse, P. G. Simmonds, R. G. Prinn, P. J. Fraser, D. M. Cunnold, S. O'Doherty, L. W. Porter, K. Stemmler, M. K. Vollmer, C. R. Lunder, N. Schmidbauer, O. Hermansen, J. Arduini, P. K. Salameh, P. B. Krummel, R. H. J. Wang, D. Folini, R. F. Weiss, M. Maione, G. Nickless, F. Stordal & R. G. Derwent, Observations of 1,1-difluoroethane (HFC-152a) at AGAGE and SOGE monitoring stations in 1994-2004 and derived global and regional emission estimates, J. Geophys. Res., 112, D06308, doi:10.1029/2006JD007527, 2007.
Harris, N., D. Wuebbles (Lead Authors), J. Daniel, J. Hu, L. Kuijpers, K. Law, M. Prather & R. Schofield, Scenarios and Information for Policy Makers, Chapter 5 in Scientific Assessment of Ozone Depletion: 2014, Global Ozone and Monitoring Project – Report no. 55, 5.1-5.58, WMO, Geneva, Switzerland, 2014.
Ivy, D. J., Trends and inferred emissions of atmospheric high molecular weight perfluorcarbons, PhD thesis, MIT, Cambridge, Massachusetts, USA, 2012.
Ivy, D. J., T. Arnold, C. M. Harth,L. P. Steele, J. Mühle, M. Rigby, P. K. Salameh, M. Leist, P. B. Krummel, P. J. Fraser, R. F. Weiss & R. G. Prinn, Atmospheric histories and growth trends of the high molecular weight perfluorocarbons: C4F10, C5F12, C6F14, C7F16 and C8F18, Atmos. Chem. Phys., 12(9), 4313-4325, doi:10.5194/acp-12-4313-2012, 2012.
Kim, J., P. J. Fraser, S. Li, J. Mühle, A. L. Ganesan, P. B. Krummel, L. P. Steele, S. Park, S.-K. Kim, M.-K. Park, T. Arnold, C. M. Harth, P. K. Salameh, R. G. Prinn, R. F. Weiss & K.-R. Kim, Quantifying aluminium and semiconductor industry perfluorocarbon emissions from atmospheric measurements, Geophys. Res. Lett., 41(13), 4787-4794, doi:10.1002/2014GL059783, 2014.
Krummel, P. B., P. J. Fraser, L. P. Steele, L. W. Porter, N. Derek, C. Rickard, J. Ward, B. L. Dunse, R. L. Langenfelds, S. Baly, M. Leist and S. McEwan, The AGAGE in situ program for non-CO2 greenhouse gases at Cape Grim, 2007–2008: methane, nitrous oxide, carbon monoxide, hydrogen, CFCs, HCFCs, HFCs, PFCs, halons, chlorocarbons, hydrocarbons and sulfur hexafluoride, Baseline Atmospheric Program (Australia) 2007-2008, N. Derek and P. B. Krummel (eds.), Australian Bureau of Meteorology and CSIRO Marine and Atmospheric Research, Melbourne, Australia, 67-80, 2011.
Krummel, P. B., P. J. Fraser, L. P. Steele, N. Derek, C. Rickard, J. Ward, N. T. Somerville, S. J. Cleland, B. L. Dunse, R. L. Langenfelds, S. B. Baly & M. Leist, The AGAGE in situ program for non-CO2 greenhouse gases at Cape Grim, 2009-2010, Baseline Atmospheric Program (Australia) 2009-2010, N. Derek P. Krummel & S. Cleland (eds.), Australian Bureau of Meteorology and CSIRO Marine and Atmospheric Research, Melbourne, Australia, 55-70, 2014
Laube, J. C., C. Hogan, M. J. Newland, F. S. Mani, P. J. Fraser, C. A. M. Brenninkmeijer, P. Martinerie, D. E. Oram, T. Röckmann, J. Schwander, E. Witrant, G. P. Mills, C. E. Reeves & W. T. Sturges, Distributions, long term trends and emissions of four perfluorocarbons in remote parts of the atmosphere and firn air, Atmos. Chem. Phys., 12, 4081-4090, doi:10.5194/acp-12-4081-2012, 2012.
Lunt, M. F., M. Rigby, A. L. Ganesan, A. J. Manning, R. G. Prinn, S. O'Doherty, J. Mühle, C. M. Harth, P. K. Salameh, T. Arnold, R. F. Weiss, T. Saito, Y. Yokouchi, P. B. Krummel, L. P. Steele, P. J. Fraser, S. Li, S. Park, S. Reimann, M. K. Vollmer, C. Lunder, O. Hermansen, N. Schmidbauer, M. Maione, J. Arduini, D. Young & P. G. Simmonds, Reconciling reported and unreported HFC emissions with atmospheric observations, PNAS, 112(19), 5927-5931, doi:10.1073/pnas.1420247112, 2015.
Australian PFC, HFC, SF6 and SO2F2 emissions | 27
Maiss, M., L. P. Steele, R. J. Francey, P. J. Fraser, R. L. Langenfelds, N. B. A. Trivett & I. Levin, Sulfur hexafluoride: a powerful new atmospheric tracer, Atmos. Environ., 30 (10/11), 1621-1629, doi:10.1016/1352-2310(95)00425-4, 1996.
Manning, A. J., D. B. Ryall, R. G. Derwent, P. G. Simmonds & S. O'Doherty, Estimating European od ozone depleting and greenhouse gases using observations and a modelling back-attribution technique, J. Geophys. Res., 108(D14), 4405, doi:10.1029/2002JD002312, 2003.
Manning, A. J., S. O'Doherty, A. R. Jones, P. G. Simmonds & R. G. Derwent, Estimating UK methane and nitrous oxide emissions from 1990 to 2007 using an inversion modeling approach, J. Geophys. Res., 116, D02305, doi:10.1029/2010JD014763, 2011.
Miller, B. R., R. F. Weiss, P. K. Salameh, T. Tanhua, B. R. Greally, J. Mühle & P. G. Simmonds, Medusa: a sample preconcentration and GC/MS detector system for in situ measurements of atmospheric trace halocarbons, hydrocarbons and sulfur compounds, Anal. Chem., 80(5), 1536-1545, doi:10.1021/ac702084k, 2008.
Miller, B. R., M. Rigby, L. J. M. Kuijpers, P. B. Krummel, L. P. Steele, M. Leist, P. J. Fraser, A. McCulloch, C. Harth, P. Salameh, J. Mühle, R. F. Weiss, R. G. Prinn, R. H. J. Wang, S. O'Doherty, B. R. Greally & P. G. Simmonds, CHF3 (HFC-23) emission trend response to CHClF2 (HCFC-22) production and recent CHF3 emissions abatement measures, Atmos. Chem. Phys., 10(16), 7875-7890, doi:10.5194/acp-10-7875-2010, 2010.
Molina, M., D. Zaelke, K. Sharma, S. O. Andersen, V. Ramanathan & D. Kaniaru, Reducing abrupt climate change risk using the Montreal Protocol and other regulatory actions to complement cuts in CO2 emissions, PNAS, 106(49), 20615-20621, doi:10.1073/pnas.0902568106, 2009.
Mühle, J., J. Huang, R. F. Weiss, R. G. Prinn, B. R. Miller, P. K. Salameh, C. M. Harth, P. J. Fraser, L. W. Porter, B. R. Greally, S. O'Doherty, P. G. Simmonds, P. B. Krummel & L. P. Steele, Sulfuryl fluoride in the global atmosphere, J. Geophys. Res., 114, D05306, doi:10.1029/2008JD011162, 2009.
Mühle, J., A. L. Ganesan, B. R. Miller, P. K. Salameh, C. M. Harth, B. R. Greally, M. Rigby, L. W. Porter, L. P. Steele, C. M. Trudinger, P. B. Krummel, S. O'Doherty, P. J. Fraser, P. G. Simmonds, R. G. Prinn & R. F. Weiss, Perfluorocarbons in the global atmosphere: tetrafluoromethane, hexafluoroethane and octofluoropropane, Atmos. Chem. Phys., 10(11), 5145-5164, doi:10.5194/acp-10-5145-2010, 2010.
Myhre, G., D. Schindell, F.-M. Breon, W. Collins, J. Fuglestvedt, J. Huang, D. Koch, J.-F. Lamarque, D. Lee, B. Mendoza, T. Nakajima, A. Robock, G. Stephens, T. Takemura, & H. Zhang, Anthropogenic and Natural Radiative Forcing, Chapter 8 in Climate Change 2013 – The Physical Science Basis, Working Group I Contribution to the Fifth Assessment Report of the Intergovernmental Panel on Climate Change, Stocker, T., D. Qin, G.-K. Plattner, M. Tignor, S. Allen, J. Boschung, A. Nauels, Y. Xia, V. Bex & P. Midgley (eds.), Cambridge University Press, Cambridge, UK & New York, NY, USA, 659-740, 2014.
O'Doherty, S., D. M. Cunnold, A. Manning, B. R. Miller, R. H. J. Wang, P. B. Krummel, P. J. Fraser, P. G. Simmonds, A. McCulloch, R. F. Weiss, P. Salameh, L. W. Porter, R. G. Prinn, J. Huang, G. Sturrock, D. Ryall, R. G. Derwent and S. A. Montzka, Rapid growth of hydrofluorocarbon-134a and hydrochlorofluorocarbons-141b, -142b, and -22 from Advanced Global Atmospheric Gases Experiment (AGAGE) observations at Cape Grim, Tasmania, and Mace Head, Ireland, J. Geophys. Res., 109, D06310, doi:10.1029/2003JD004277, 2004.
O'Doherty, S., D. M. Cunnold, B. R. Miller, J. Mühle, A. McCulloch, P. G. Simmonds, A. J. Manning, S. Reimann, M. K. Vollmer, B. R. Greally, R. G. Prinn, P. J. Fraser, L. P. Steele, P. B. Krummel, B. L. Dunse, L. W. Porter, C. R. Lunder, N. Schmidbauer, O. Hermansen, P. K. Salameh, C. M. Harth, R. H. J. Wang and R. F. Weiss, Global and regional emissions of HFC-125 (CHF2CF3) from in situ and air archive observations at AGAGE and SOGE observatories, J. Geophys. Res., 114, D23304, doi:10.1029/2009JD012184, 2009.
O'Doherty, S., M. Rigby, J. Mühle, D. J. Ivy, B. R. Miller, D. Young, P. G. Simmonds, S. Reimann, M. K. Vollmer, P. B. Krummel, P. J. Fraser, L. P. Steele, B. Dunse, P. K. Salameh, C. M. Harth, T. Arnold, R. F. Weiss, J. Kim, S. Park, S. Li, C. Lunder, O. Hermansen, N. Schmidbauer, L. X. Zhou, B. Yao, R. H. J. Wang, A. J. Manning & R. G. Prinn, Global emissions of HFC-143a (CH3CF3) and HFC-32 (CH2F2) from in situ and air archive atmospheric observations, Atmos. Chem. Phys., 14(17), 9249-9258, doi:10.5194/acp-14-9249-2014, 2014.
Oram, D. E., C. E. Reeves, W. T. Sturges, S. A. Penkett, P. J. Fraser & R. L. Langenfelds, Recent tropospheric growth rate and distribution of HFC-134a (CF3CH2F), Geophys. Res. Lett., 23(15), 1949-1952, doi:10.1029/96GL0186, 1996.
Oram, D. E., W. T. Sturges, S. A. Penkett, A. McCulloch & P. J. Fraser, Growth of fluoroform (CHF3, HFC-23) in the background atmosphere, Geophys. Res. Lett., 25(1), 35-38, doi:10.1029/97GL03483, 1998.
28 | Fraser et al., 2015
Oram, D. E., Trends in long-lived anthropogenic halocarbons in the Southern Hemisphere and model calculations of global emissions, PhD thesis, University of East Anglia, Norwich, UK, 1999.
Oram, D. E., F. S. Mani, J. C. Laube, M. J. Newland, C. E. Reeves, W. T. Sturges, S. A. Penkett, C. A. M. Brenninkmeijer, T. Röckmann & P. J. Fraser, Long-term tropospheric trend of octafluorocyclobutane (c-C4F8 or PFC-318), Atmos. Chem. Phys., 12(1), 261-269, doi:10.5194/acp-12-261-2012, 2012.
Prinn, R. G., R. F. Weiss, P. J. Fraser, P. G. Simmonds, D. M. Cunnold, F. N. Alyea, S. O'Doherty, P. Salameh, B. R. Miller, J. Huang, R. H. J. Wang, D. E. Hartley, C. Harth, L. P. Steele, G. Sturrock, P. M. Midgley & A. McCulloch, A history of chemically and radiatively important gases in air deduced from ALE/GAGE/AGAGE, J. Geophys. Res.,105(D14), 17751-17792, doi:10.1029/2000JD900141, 2000.
Rigby, M., J. Mühle, B. R. Miller, R. G. Prinn, P. B. Krummel, L. P. Steele, P. J. Fraser, P. K. Salameh, C. M. Harth, R. F. Weiss, B. R. Greally, S. O'Doherty, P. G. Simmonds, M. K. Vollmer, S. Reimann, J. Kim, K.-R. Kim, H. J. Wang, J. G. J. Olivier, E. J. Dlugokencky, G. S. Dutton, B. D. Hall & J. W. Elkins, History of atmospheric SF6 from 1973 to 2008, Atmos. Chem. Phys., 10(21), 10305-10320, doi:10.5194/acp-10-10305-2010, 2010.
Rigby, M., R. G. Prinn, S. O'Doherty, B. R. Miller, D. Ivy, J. Mühle, C. M. Harth, P. K. Salameh, T. Arnold, R. F. Weiss, P. B. Krummel, L. P. Steele, P. J. Fraser, D. Young & P. G. Simmonds, Recent and future trends in synthetic greenhouse gas radiative forcing, Geophys. Res. Letts., 41(7), 2623-2630, doi:10.1002/2013GL059099, 2014.
Santoro, M. A., Clarifying the SF5CF3 record, Science, 290(5493), 935-936, doi: 10.1126/science.290.5493.935, 2000.
Simmonds, P., M. Rigby, A. Manning, M. Lunt, S. O’Doherty, D. Young, A. McCulloch, P. Fraser, S. Henne, M. ollmer, S. Reimann, A. Wegner, J. Mühle, C. Harth, P. Salameh, T. Arnold, R. Weiss, P. Krummel, P. Steele, B. Dunse, B. Miller, C. Lunde, O. Hermansen, N. Schmidbauer, T. Saito, Y. Yokouchi, S. Li, S. Park, S. Li, B. Yao, L. Zhou, J. Arduini, M. Maione, R. Wang & R. Prinn, Global and regional emissions estimates of 1,1-difluoroethane (HFC-152a, CH3CHF2) from in situ and air archive observations, Atmos. Chem. Phys., submitted (July 2015a).
Simmonds, P. G., R. G. Derwent, A. J. Manning, A. McCulloch & S. O’Doherty, USA emissions estimates of HFC-152a, HFC-134a, HFC-143a and HFC-32 based on in situ observations at Mace Head, Atmos. Environ., 104, 27-38, doi:10.1016/j.atmosenv.2015.01.010, 2015b.
Stohl, A., P. Seibert, J. Arduini, S. Eckhardt, P. Fraser, B. Greally, C. Lunder, M. Miaone, J. Mühle, S. O’Doherty, R. Prinn S. Reimann, T. Saito, N. Schmidbauer, P. Simmonds, M. Vollmer, R. Weiss & Y. Yokouchi, An analytical inversion method for determining regional and global emissions of greenhouse gases: sensitivity studies and application to halocarbons, Atmos. Chem. Phys., 9(5), 1597-1620, doi:10.5194/acp-9-1597-2009, 2009.
Sturges, W. T., D. E. Oram, J. C. Laube, C. E. Reeves, M. J. Newland, C. Hogan, P. Martinerie, E. Witrant, C. A. M. Brenninkmeijer, T. J. Schuck & P. J. Fraser, Emissions halted of the potent greenhouse gas CF3SF5, Atmos. Chem. Phys., 12(8), 3653-3658, doi:10.5194/acp-12-3653-2012, 2012.
Velders, G. J. M., S. O. Anderson J. S. Daniel, D. W. Fahey & M. McFarland, The importance of the Montreal Protocol in protecting climate, PNAS, 104(12), 4814-4819, doi:10.1073/pnas.0610328104, 2007
Velders, G. J. M., D. W. Fahey, J. S. Daniel, M. McFarland & S. O. Anderson, The large contribution of projected HFC emissions to future climate forcing, PNAS, 106, 10949-10954, doi:10.1073/pnas.0902817106, 2009
Velders, G. J. M., A. R. Ravishankara, M. K. Miller, M. J. Molina, J. Alcamo, J. S. Daniel, D. W. Fahey, S. A. Montzka & S. Reimann, Preserving Montreal Protocol climate benefits by limiting HFCs, Science, 335(6071), 922–923, doi:10.1126/science.1216414, 2012.
Vollmer, M. K., B. R. Miller, M. Rigby, S. Reimann, J. Mühle, P. B. Krummel, S. O’Doherty, J. Kim, T.-S. Rhee, R. F. Weiss, P. J. Fraser, P. G. Simmonds, P.K. Salameh, C. M. Harth, R. H. J. Wang, L. P. Steele, D. Young, C. R. Lunder, O. Hermansen, D. Ivy, T. Arnold, N. Schmidbauer, K.-R. Kim, B. R. Greally, M. Hill, M. Leist, A. Wenger & R. G. Prinn, Atmospheric histories and global emissions of the anthropogenic hydrofluorocarbons (HFCs) HFC-365mfc, HFC-245fa, HFC-227ea and HFC-236fa, J. Geophys. Res., 116, D08304, doi:10.1029/2010JD015309, 2011.
Weiss, R. F., J. Mühle, P. K. Salameh, & C. M. Harth, Nitrogen trifluoride in the global atmosphere, Geophys. Res. Lett., 35, L20821, doi:10.1029/2008GL035913, 2008.
Wong, D., P. Fraser, P. Lavoie & J. Kim, PFC emissions from detected versus nondetected anode effects in the aluminum industry, JOM, 67(2), 342-353, doi:10.1007/s11837-014-1265-8, 2015.
Xiang, B., P. K. Patra, S. A. Montzka, S. M. Miller, J. W. Elkins, F. L. Moore, E. L. Atlas, B. R. Miller, R. F. Weiss, R. G. Prinn & S. C. Wofsy, Global emissions of refrigerants HCFC-22 and HFC-134a: unforeseen seasonal contributions, PNAS, 111, 17379-17384, doi:10.1073/pnas.1417372111, 2014.

Australian PFC, HFC, SF6 and SO2F2 emissions | 29
R., J. MUHLE, P. SALAMEH, & C. HARTH, NITROGEN TRIFLUORIDE IN THE GLOBAL ATMOSPHERE, GEOPHYS. RES. LETT., 35, L20821, 200 WEISS, R., J. MUHLE, P. SALAMEH, & C. HARTH, NITROGEN TRIFLUORIDE IN THE GLOBAL ATMOSPHERE, GEOPHYS. RES. LETT5, L20821, 20088
30 | Fraser et al., 2015
CONTACT US
t 1300 363 400 +61 3 9545 2176 e [email protected] w www.csiro.au
YOUR CSIRO
Australia is founding its future on science and innovation. Its national science agency, CSIRO, is a powerhouse of ideas, technologies and skills for building prosperity, growth, health and sustainability. It serves governments, industries, business and communities across the nation.
FOR FURTHER INFORMATION
CSIRO Oceans & Atmosphere Flagship Paul Fraser t +61 3 9239 4526 e [email protected] w http://www.csiro.au/en/Research/OandA CSIRO Oceans & Atmosphere Flagship Bronwyn Dunse t +61 3 9239 4617 e [email protected] w http://www.csiro.au/en/Research/OandA