Evolutionary and biogeographical significance of refugia for

ARTICLE
Received 12 Feb 2014 | Accepted 29 Apr 2014 | Published 30 May 2014
Australia’s arid-adapted butcherbirds experiencedrange expansions during Pleistocene glacialmaximaAnna M. Kearns1,2,3, Leo Joseph4, Alicia Toon1 & Lyn G. Cook1
A model of range expansions during glacial maxima (GM) for cold-adapted species is
generally accepted for the Northern Hemisphere. Given that GM in Australia largely resulted
in the expansion of arid zones, rather than glaciation, it could be expected that arid-adapted
species might have had expanded ranges at GM, as cold-adapted species did in the Northern
Hemisphere. For Australian biota, however, it remains paradigmatic that arid-adapted species
contracted to refugia at GM. Here we use multilocus data and ecological niche models
(ENMs) to test alternative GM models for butcherbirds. ENMs, mtDNA and estimates
of nuclear introgression and past population sizes support a model of GM expansion in the
arid-tolerant Grey Butcherbird that resulted in secondary contact with its close relative—the
savanna-inhabiting Silver-backed Butcherbird—whose contemporary distribution is widely
separated. Together, these data reject the universal use of a GM contraction model for
Australia’s dry woodland and arid biota.
DOI: 10.1038/ncomms4994
1 School of Biological Sciences, The University of Queensland, Brisbane, Queensland 4072, Australia. 2 Department of Biological Sciences, University ofMaryland, Baltimore County, 1000 Hilltop Circle, Baltimore, Maryland 21250, USA. 3 Natural History Museum, University of Oslo, PO Box 1172, Blindern, OsloNO-0318, Norway. 4 Australian National Wildlife Collection, CSIRO Ecosystem Sciences, GPO Box 1700, Canberra ACT 2601, Australia. Correspondence andrequests for materials should be addressed to A.M.K. (email: [email protected]).
NATURE COMMUNICATIONS | 5:3994 | DOI: 10.1038/ncomms4994 | www.nature.com/naturecommunications 1
& 2014 Macmillan Publishers Limited. All rights reserved.

Global cooling during Pleistocene glacial maxima (GM) isrecognized as having had an important influence on thestructure of current biodiversity1. The widely accepted
GM contraction model of Pleistocene biogeography1 grewfrom initial examples of temperate species in the NorthernHemisphere. These exhibited substantial range contractions anddifferentiation in one or few refugia during GM, followed byrange expansions, secondary contact and gene flow duringwarmer interglacials (glacial minima). However, the GMcontraction model is not universally applicable to biota fromunglaciated regions such as those in Africa, Australia, SouthAmerica and the Northern Hemisphere2–9, or cold-adapted taxain the Northern Hemisphere10,11. Indeed, an inverse model ofGM expansion has been proposed for cold-adapted taxa in theNorthern Hemisphere1,10, wherein populations underwent rangeexpansions and gene flow during GM, followed by rangecontractions to cooler higher latitudes or higher elevationsduring interglacials.
The response of Australia’s arid-tolerant biota to increasingaridity during GM should be analogous to that of NorthernHemisphere cold-tolerant biota1,10. That is, arid-tolerant biotatracked the expansion of dry woodland, semi-arid and aridhabitats during cooler and drier GM, and contracted duringwarmer and wetter interglacials, such as at present. This GMexpansion model is supported by palaeoclimatic reconstructions(Fig. 1)7,8, palaeo-ENMs from Northern Australia12,13 andphylogeographic structure14,15, which suggest that manywidespread arid-tolerant taxa could have maintained largepopulations throughout the Pleistocene as a result of the long-term availability of suitable arid habitats7. However, despite thisevidence, the dominant assumption in the literature relating toAustralian biota remains one of range contraction and populationpersistence in refugia during GM14,15. Given an assumption ofGM contraction, the lack of congruence among phylogeographicpatterns and evidence for large population sizes through time inmany species have been attributed to populations persisting inmultiple, ‘idiosyncratic’ (species-specific), GM refugia that weredispersed across the continent14,16 rather than the few, mostlycoastal, GM refugia hypothesized for Australia’s mesic-adaptedbiota17. These dispersed GM refugia are functionally similar tothe ‘cryptic refugia’ and ‘pockets of favourable microclimates’
invoked for New Zealand temperate trees and some taxa incentral Europe5,18–21. However, these implicitly involvereductions in population size, while Australian examples areinvoked to explain the maintenance of large population sizesthroughout the Pleistocene14.
Our goal is to evaluate GM expansion–contraction models forAustralia’s arid-tolerant biota using the white-throated butcher-bird group (Artamidae, Cracticus subgenus Bulestes). This groupcomprises three species that together occur across most ofAustralia’s woodland, semi-arid and arid habitats (Fig. 1). TheGrey Butcherbird (C. torquatus) is found across southernAustralia in temperate, dry, semi-arid and arid woodland habitatsbut is absent from the deserts of central Australia and themonsoon tropics of northern Australia. The Silver-backedButcherbird (C. argenteus) occurs in the drier savanna habitatsof monsoonal northwestern Australia. The Black-backed Butcher-bird (C. mentalis) occurs in the higher rainfall savanna habitats ofnortheastern Australia and southern New Guinea. The threespecies are currently geographically isolated from each other—Silver-backed and Grey, in particular, by at least 900 km of aridand savanna habitat and large tracts of sand-dune dominateddeserts—and have distinctive plumage traits that differentiatethe species boundaries22. However, none are reciprocallymonophyletic with respect to another at either mtDNA ornuclear loci23. The pattern of mtDNA paraphyly23 is bestexplained by a historical range expansion that resulted insecondary contact and introgression of either Grey or Black-backed Butcherbirds into Silver-backed Butcherbirds. However,this pattern could also originate from incomplete lineage sortingor incorrect taxonomy.
We propose that, for a species response to fit a GM contractionmodel, the species must have undergone a substantial reductionin range and population size (that is, a demographic bottleneck)compared with the current interglacial. This interpretationfollows the dominant assumption in the literature that GMclimates were less suitable for arid-tolerant biota than at present,and thus caused species to retreat to, and persist in, refugia.However, we emphasize that, if the GM range or population sizeof a species is greater than, equal to or only slightly reducedcompared with interglacials, then this species response cannot beviewed as a contraction to a refuge. In contrast, a substantial
Species ranges
Western
Eastern
Kimberley
Top end
New GuineaCape York
Black-backed Butcherbird
Silver-backed Butcherbird
Grey Butcherbird
PRESENT
Palaeo climates
Rainforest
Arid and semi-arid
Dry woodland and savannaTemperate Steppe
LGM ~ 21,000 ya
Pleistocene sand dunes
Figure 1 | Expansion of dry habitats inhabited by white-throated butcherbirds during the last glacial maximum. (a) Major habitat types in Australia and
New Guinea at present (data from Schodde68) and during the LGM (data from Hope et al.8) when sea levels were lower, the arid zone expanded and
extensive sand-dunes were active. The approximate extent of Pleistocene sand-dunes is shown in dark orange (data from Williams et al.69 and Byrne
et al.14). (b) Geographic range of white-throated butcherbirds (data from Schodde and Mason22) overlays occurrence records for each species from the
Birds Australia Birdata Project (www.birdata.com.au) and the Australian National Wildlife Collection. Cartoons show the major plumage differences
between the three species: (i) back colour, (ii) presence or absence of white lores (eye-spots), (iii) presence or absence of black chin spot, (iv) pure-white
versus off-white/grey ventrum and (v) amount of white on wing. The range of each species is divided into two geographic groups that correspond to
phenotypically or genetically differentiated forms that are often treated as subspecies (Kimberley: C. a. argenteus; Top End: C. a. colletti; New Guinea:
C. m. mentalis; Cape York: C. m. kempi; western Grey: C. t. leucopterus sens. strict.; eastern Grey: C. t. colei, C. t. torquatus, C. t. cinereus22). Figure
reproduced with permission from Elsevier23.
ARTICLE NATURE COMMUNICATIONS | DOI: 10.1038/ncomms4994
2 NATURE COMMUNICATIONS | 5:3994 | DOI: 10.1038/ncomms4994 | www.nature.com/naturecommunications
& 2014 Macmillan Publishers Limited. All rights reserved.

range and population size expansion at GM compared with thecurrent interglacial would fit a GM expansion model, while littleor no change in range or population size would fit either a GMrange stability or range shift model depending on whether therange of the species underwent a latitudinal shift5.
To assess alternative GM models we use ecological nichemodelling (ENM) under the current interglacial and the lastglacial maximum (LGM: 18–23 kya), and multilocus coalescentanalyses. Under a GM expansion model, there should be(1) coalescent evidence for introgression of either Grey orBlack-backed Butcherbirds into Silver-backed Butcherbirds,(2) ENM predictions of range expansion and secondary contactat LGM and (3) coalescent evidence of demographic expansionsthat are congruent with ENMs. Species-ecology and palaeo-climatic reconstructions predict two GM expansion scenarios thatinvolve either secondary contact following an expansion of GreyButcherbirds into the Silver-backed Butcherbird range as theytracked expanding dry habitats, or secondary contact following anorthward range shift on the exposed Arafura shelf in either, orboth, Silver-backed and Black-backed Butcherbirds as theytracked savanna habitats (Fig. 1). Under a GM contractionmodel, there should be (1) no coalescent evidence of introgression(that is, mtDNA paraphyly results from incomplete lineagesorting or incorrect taxonomy), (2) ENM predictions of rangecontraction at LGM (whether to multiple dispersed refugia sensuByrne et al.14 or large stable refugia sensu Keast24) and (3)coalescent evidence of demographic bottlenecks that arecongruent with ENMs.
We find that all lines of evidence support a model of GMexpansion for the arid-tolerant Grey Butcherbird. Specifically,eastern populations of the Grey Butcherbird underwent rangeexpansion, resulting in nuclear and mitochondrial introgressionwith the Silver-backed Butcherbird in northwestern Australia.These findings go against the current paradigm for Australianfauna of universal GM contraction to refugia, and we call forcareful testing of alternative GM models across co-distributed taxa.
ResultsPhylogeography. This study expands on the systematic study ofKearns et al.23 by adding 54 individuals to the mtDNA ND2 dataset and three nuclear introns (ACTB-3, FN1-31 and RPL37A-3)to the four introns previously sequenced (BF-7, BRM-15,GAPDH-11 and ODC-6&7). Bayesian phylogenetic analysis of138 white-throated butcherbird mitochondrial, ND2, sequencesprovided strong support (posterior probability 40.9) for twodivergent clades (uncorrected P distance: 4.8%; Dxy: 4.3%; seeSupplementary Table 1) (Fig. 2; Supplementary Fig. 1). Of the 36Silver-backed Butcherbirds sequenced for ND2, 23 were groupedinto Clade 1 with Grey Butcherbirds (n¼ 86) and 13 weregrouped into Clade 2 with Black-backed Butcherbirds (n¼ 13;Fig. 2). Unrooted parsimony networks and measures of net-sequence divergence (Dxy) showed that Clade 1 Silver-backedButcherbird haplotypes were more closely related to those ofeastern Grey Butcherbirds (Dxy: 1.0%) than those of eastern andwestern Grey Butcherbirds are to each other (Dxy: 1.9%), andthan Clade 2 Silver-backed Butcherbird haplotypes are to those ofBlack-backed Butcherbirds (Dxy: 1.7%). Analysis of molecularvariance indicated that mtDNA was differentiated across speciesboundaries despite the lack of reciprocal monophyly (Fst 0.59,Po0.0001; Supplementary Table 2). MtDNA also showed stronggeographic structuring across barriers to dispersal that have beenpreviously postulated for other butcherbirds25–27 and other arid-tolerant biota14,15 (for example, Eyrean Barrier, CarpentarianBarrier, Ord and Victoria River arid intrusions; Fig. 2;Supplementary Table 2). Notably, Clade 2 Silver-backed
haplotypes are restricted to west of the Ord River arid intrusionin the Kimberley (sensu Ford28), whereas Clade 1 Silver-backedhaplotypes are restricted to east of the Ord River with theexception of five individuals (Fig. 2). One BRM-15 allele wasrestricted to populations west of the Victoria River in theKimberley (Fig. 3). ODC-6&7 and GAPDH-11 each had an allelefound only in Silver-backed Butcherbirds that was almostexclusively sampled in individuals from the Kimberley (Fig. 3).
Tests of species boundaries using nuclear loci. To assess whe-ther the mtDNA phylogeny accurately reflected the speciationhistory of white-throated butcherbirds, we used seven nuclearintrons to delimit species boundaries and estimate a multilocusspecies tree. Each locus showed low to moderate structuring byspecies (Supplementary Table 2: Fst 0.05–0.43, Po0.01) despiteextensive sharing of alleles among species (Fig. 3). Two approa-ches were used to delimit species boundaries: (1) multispeciescoalescent species tree algorithm in *BEAST29 using the six majorgeographic groups indicated by mtDNA and subspecies asa priori ‘species boundaries’ (that is, western and easternGrey Butcherbirds, Top End and Kimberley Silver-backedButcherbirds, New Guinea and Cape York Black-backedButcherbirds; Figs 1 and 2) and (2) Bayesian clusteringalgorithm in STRUCTURE30 that determines the number ofgenetic groups without a priori information about speciesboundaries. The *BEAST species tree strongly supports themonophyly of each of the three species (posterior probability40.99); however, there was no well-supported relationshipamong them (Fig. 3). STRUCTURE analyses using a subset of51 individuals sampled for all seven nuclear loci were broadlyconsistent with morphology-based species boundaries (Fig. 3).Log-likelihoods peaked at K¼ 3 and then plateaued, remainingsimilar up to K¼ 8. The three genetic clusters identified at K¼ 3corresponded to the three species. However, the delta K methodsupported K¼ 4 as the best-fit number of genetic clusters for thedata set (Fig. 3). The assignment of nine Grey, one Silver-backedand one Black-backed individuals to a fourth genetic cluster couldbe the result of gene flow.
Tests for nuclear introgression. Owing to uncertainty inrelationships of the three species of Butcherbirds (Fig. 3),demographic parameters (divergence time (t), effective popula-tion size (Ne) and population migration rate (2NM)) were esti-mated in the Isolation with Migration (IMa2)31 programme fortwo different three-population models that reflected the twoplausible species trees indicated by the mtDNA phylogeny(Fig. 2)—Tree 1: where Silver-backed and Black-backed aresisters, and Tree 2: where Silver-backed and Grey are sisters. IMa2estimates for these two alternative species trees overlappedsubstantially and neither analysis had closed posterior densitiesfor the divergence time parameters (t), and the upper bound ofboth t1 and t0 had to be constrained in order to obtain adequatemixing and convergence (Supplementary Fig. 2; SupplementaryTable 3). In both analyses, posterior probabilities for t1 and t0
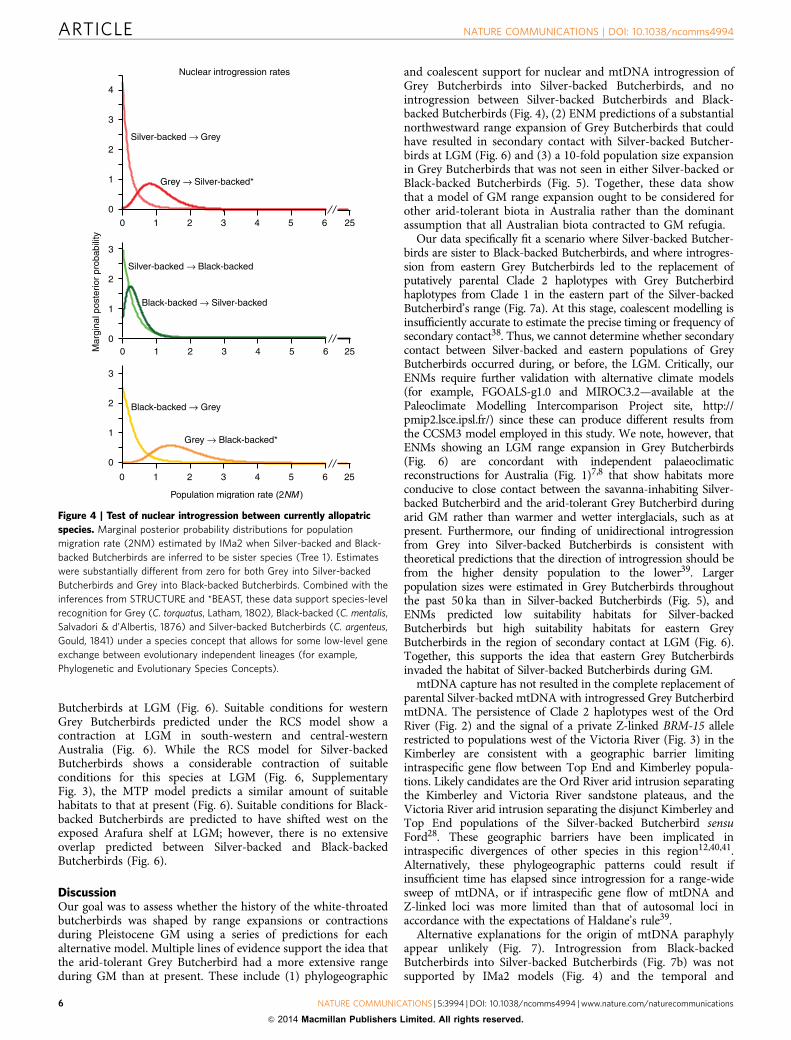
were highest within the past one million years, and 95% highestposterior density credibility intervals encompassed a broad rangeof dates (B3,000–5,821,000 ya; Supplementary Table 3 andSupplementary Fig. 2). Effective population size estimates werelargest for Grey (B57,000–396,000) and similar for Black-backed (B6,000–147,000) and Silver-backed (B3,000–88,000)Butcherbirds (Supplementary Table 3; Supplementary Fig. 2).Irrespective of the species tree used, an assumption of no nuclearintrogression (m¼ 0) was rejected for both Grey into Silver-backed Butcherbirds and Grey into Black-backed Butcherbirds(Fig. 4; Supplementary Fig. 2; Supplementary Table 3).
NATURE COMMUNICATIONS | DOI: 10.1038/ncomms4994 ARTICLE
NATURE COMMUNICATIONS | 5:3994 | DOI: 10.1038/ncomms4994 | www.nature.com/naturecommunications 3
& 2014 Macmillan Publishers Limited. All rights reserved.

In contrast, m¼ 0 could not be rejected for Silver-backed to GreyButcherbirds, for Black-backed to Grey Butcherbirds and in bothdirections between Black-backed and Silver-backed Butcherbirds(that is, peak probabilities were close to and included zero; Fig. 4;Supplementary Fig. 2; Supplementary Table 3).
Tests for population size change. Demographic history wasinferred using the extended Bayesian skyline model, EBSP32 inBEAST v1.7.5 (ref. 33) and Tajima’s D, R2 and Fu’s Fs tests fordeviations from neutrality for each locus in DnaSP v5 (ref. 34).Grey Butcherbirds were the only species that showed significantdeviations from neutrality and assumptions of constantpopulation size (Tajima’s D, Po0.05: BF-7; Fu’s Fs, Po0.02:ND2, ACTB-3-3, BF-7 BRM-15; Supplementary Table 4). Whenanalysed separately, eastern and western populations of GreyButcherbirds also showed significant deviations from constant
population size (that is, ND2, ACTB-3, ODC-6&7; SupplementaryTable 4). EBSP of the combined mtDNA and nuclear data setshowed a 10-fold population size expansion in Grey Butcherbirds(Fig. 5). When analysed separately, each of the eastern andwestern Grey Butcherbirds showed a signal of populationincrease, although the pattern differed. The signal of populationexpansion in the western Grey Butcherbirds increased sharplyaround 30–25 kya, whereas there was a steady increase inpopulation size in the eastern Grey Butcherbirds from 50 kya topresent. There was no demographic change in either Silver-backed or Black-backed Butcherbirds in the past 50 ka (Fig. 5).
Tests for LGM range expansion and contraction. ENMs for thecurrent interglacial and the LGM were estimated using maximumentropy species distribution modelling in MAXENT version3.3 (ref. 35) from detailed species occurrence records and nine
Grey Butcherbird
0.80.6
0.6
0.5
*
*
*
*
*
*
Clade 1
Clade 2
Silver-backed Butcherbird
Silver-backedButcherbird
Black-backedButcherbird
*
*
Clade 2
Clade 1
Yorke Peninsula
“Carpentarian Barrier”
Ord River
Victoria River
“Eyrean Barrier”
Tasmania
Torres Strait
Arafura Shelf
Bass Strait
Eyre Peninsula
Figure 2 | Phylogeographic structure of paraphyletic mtDNA lineages. (a) Bayesian inference places mitochondrial ND2 haplotypes from Silver-backed
Butcherbirds in two deeply divergent clades (Dxy¼4.34%; uncorrected P distance¼4.8%) that are grouped with either Grey Butcherbirds (Clade 1)
or Black-backed Butcherbirds (Clade 2). Colours indicate nine major haplotype groups. Asterisks indicate key nodes with 40.90 posterior
probability. Numbers above branches indicate posterior probability values for key nodes with o0.9 posterior probability. (b) Geographic structuring
of mtDNA haplotype groups. Contours on the map show extent of land exposed at various times in the Pleistocene (10 m (dark grey), 40 m
(medium grey) and 120 m (light grey) below present—data from Voris70). (c) Unrooted network of ND2 haplotypes. Black circles in the haplotype
networks represent inferred, but unsampled, haplotypes. In both the map and the haplotype networks the size of the circles are proportional to
sampling frequency.
ARTICLE NATURE COMMUNICATIONS | DOI: 10.1038/ncomms4994
4 NATURE COMMUNICATIONS | 5:3994 | DOI: 10.1038/ncomms4994 | www.nature.com/naturecommunications
& 2014 Macmillan Publishers Limited. All rights reserved.

abiotic climatic variables (present-day: WorldClim database36;LGM: Community Climate System Model, CCSM3 (ref. 37)).Present-day ENMs had high area under the receiveroperating characteristic curve scores (AUC: Silver-backed, 0.97;Black-backed, 0.98; Grey, 0.71; west Grey, 0.84; east Grey, 0.77;Kimberley, 0.99; Top End, 0.99) suggesting that they have goodpredictive power and performed significantly better than a randommodel (AUC: 0.5). Present-day ENMs conformed to the speciesrange of Grey Butcherbirds and the Australian range of Black-backed Butcherbirds but predicted a broader range of suitableconditions for Silver-backed Butcherbirds (probability of
occurrence 40.1) and a more limited range for Black-backedButcherbirds in New Guinea (Fig. 6). Despite the broad range ofsuitable conditions predicted for Silver-backed Butcherbirds, theregions with the highest predicted probability of occurrence(0.4–0.6) fell within the species range (Fig. 6; Supplementary Fig. 3).
ENMs predict that suitable conditions for Grey Butcherbirdsexpanded at LGM (Fig. 6). Specifically, both the conservativeminimum training presence (MTP) and the more stringentrelative climatic suitability (RCS) models predict a northwestexpansion of suitable conditions for eastern Grey Butcherbirds,whereas no northward expansion is predicted for western Grey
Structure
*BEAST species tree
4.0E–5
1.0
1.0
0.99
0.51
Kimberley
Top end
Western Grey
Eastern Grey
New Guinea
Cape York
KIMTE WESTERNEASTERNCYP NG
2
3
4
6
Grey Butcherbird
Silver-backed Butcherbird
Black-backed Butcherbird
GreySilver-backed Black-backed
RPL37A-3ACTB-3
BF-7
FN1-31
GAPDH-11ODC-6&7BRM-15
Unrooted intron networks
No.
of p
opul
atio
ns (K
)
Figure 3 | Test of species boundaries using nuclear loci. (a) Phased allele networks for seven nuclear loci scaled by sample size, and coloured according
to the six geographic groups used as a priori taxonomic units in *BEAST. Small black circles represent inferred unsampled haplotypes, and white boxes
indicate the positions of indels. (b) STRUCTURE plots depicting population assignment of 51 white-throated butcherbirds estimated under two, three, four
and six putative populations (K). Each vertical bar represents the proportion of assignment of a single indivual to each population considered at that value
of K. Individuals are sorted by geographic group and species—Top End (TE), Kimberley (KIM), Cape York (CYP), New Guinea (NG), eastern Grey
Butcherbird (EASTERN), western Grey Butcherbird (WESTERN). (c) *BEAST multilocus species tree supporting the monophyly of the three white-throated
butcherbird species. Figure reproduced with permission from Elsevier23.
NATURE COMMUNICATIONS | DOI: 10.1038/ncomms4994 ARTICLE
NATURE COMMUNICATIONS | 5:3994 | DOI: 10.1038/ncomms4994 | www.nature.com/naturecommunications 5
& 2014 Macmillan Publishers Limited. All rights reserved.
Butcherbirds at LGM (Fig. 6). Suitable conditions for westernGrey Butcherbirds predicted under the RCS model show acontraction at LGM in south-western and central-westernAustralia (Fig. 6). While the RCS model for Silver-backedButcherbirds shows a considerable contraction of suitableconditions for this species at LGM (Fig. 6, SupplementaryFig. 3), the MTP model predicts a similar amount of suitablehabitats to that at present (Fig. 6). Suitable conditions for Black-backed Butcherbirds are predicted to have shifted west on theexposed Arafura shelf at LGM; however, there is no extensiveoverlap predicted between Silver-backed and Black-backedButcherbirds (Fig. 6).
DiscussionOur goal was to assess whether the history of the white-throatedbutcherbirds was shaped by range expansions or contractionsduring Pleistocene GM using a series of predictions for eachalternative model. Multiple lines of evidence support the idea thatthe arid-tolerant Grey Butcherbird had a more extensive rangeduring GM than at present. These include (1) phylogeographic
and coalescent support for nuclear and mtDNA introgression ofGrey Butcherbirds into Silver-backed Butcherbirds, and nointrogression between Silver-backed Butcherbirds and Black-backed Butcherbirds (Fig. 4), (2) ENM predictions of a substantialnorthwestward range expansion of Grey Butcherbirds that couldhave resulted in secondary contact with Silver-backed Butcher-birds at LGM (Fig. 6) and (3) a 10-fold population size expansionin Grey Butcherbirds that was not seen in either Silver-backed orBlack-backed Butcherbirds (Fig. 5). Together, these data showthat a model of GM range expansion ought to be considered forother arid-tolerant biota in Australia rather than the dominantassumption that all Australian biota contracted to GM refugia.
Our data specifically fit a scenario where Silver-backed Butcher-birds are sister to Black-backed Butcherbirds, and where introgres-sion from eastern Grey Butcherbirds led to the replacement ofputatively parental Clade 2 haplotypes with Grey Butcherbirdhaplotypes from Clade 1 in the eastern part of the Silver-backedButcherbird’s range (Fig. 7a). At this stage, coalescent modelling isinsufficiently accurate to estimate the precise timing or frequency ofsecondary contact38. Thus, we cannot determine whether secondarycontact between Silver-backed and eastern populations of GreyButcherbirds occurred during, or before, the LGM. Critically, ourENMs require further validation with alternative climate models(for example, FGOALS-g1.0 and MIROC3.2—available at thePaleoclimate Modelling Intercomparison Project site, http://pmip2.lsce.ipsl.fr/) since these can produce different results fromthe CCSM3 model employed in this study. We note, however, thatENMs showing an LGM range expansion in Grey Butcherbirds(Fig. 6) are concordant with independent palaeoclimaticreconstructions for Australia (Fig. 1)7,8 that show habitats moreconducive to close contact between the savanna-inhabiting Silver-backed Butcherbird and the arid-tolerant Grey Butcherbird duringarid GM rather than warmer and wetter interglacials, such as atpresent. Furthermore, our finding of unidirectional introgressionfrom Grey into Silver-backed Butcherbirds is consistent withtheoretical predictions that the direction of introgression should befrom the higher density population to the lower39. Largerpopulation sizes were estimated in Grey Butcherbirds throughoutthe past 50 ka than in Silver-backed Butcherbirds (Fig. 5), andENMs predicted low suitability habitats for Silver-backedButcherbirds but high suitability habitats for eastern GreyButcherbirds in the region of secondary contact at LGM (Fig. 6).Together, this supports the idea that eastern Grey Butcherbirdsinvaded the habitat of Silver-backed Butcherbirds during GM.
mtDNA capture has not resulted in the complete replacement ofparental Silver-backed mtDNA with introgressed Grey ButcherbirdmtDNA. The persistence of Clade 2 haplotypes west of the OrdRiver (Fig. 2) and the signal of a private Z-linked BRM-15 allelerestricted to populations west of the Victoria River (Fig. 3) in theKimberley are consistent with a geographic barrier limitingintraspecific gene flow between Top End and Kimberley popula-tions. Likely candidates are the Ord River arid intrusion separatingthe Kimberley and Victoria River sandstone plateaus, and theVictoria River arid intrusion separating the disjunct Kimberley andTop End populations of the Silver-backed Butcherbird sensuFord28. These geographic barriers have been implicated inintraspecific divergences of other species in this region12,40,41.Alternatively, these phylogeographic patterns could result ifinsufficient time has elapsed since introgression for a range-widesweep of mtDNA, or if intraspecific gene flow of mtDNA andZ-linked loci was more limited than that of autosomal loci inaccordance with the expectations of Haldane’s rule39.
Alternative explanations for the origin of mtDNA paraphylyappear unlikely (Fig. 7). Introgression from Black-backedButcherbirds into Silver-backed Butcherbirds (Fig. 7b) was notsupported by IMa2 models (Fig. 4) and the temporal and
Nuclear introgression rates
Black-backed → Silver-backed
Silver-backed → Black-backed
Black-backed → Grey
Grey → Black-backed*
Grey → Silver-backed*
Silver-backed → Grey
0
1
2
3
0 1 2 3 4 5 6
Population migration rate (2NM )
25
0
1
2
3
0 1 2 3 4 5 6 25
0
1
2
3
4
0 1 2 3 4 5 6
Mar
gina
l pos
terio
r pr
obab
ility
25
Figure 4 | Test of nuclear introgression between currently allopatric
species. Marginal posterior probability distributions for population
migration rate (2NM) estimated by IMa2 when Silver-backed and Black-
backed Butcherbirds are inferred to be sister species (Tree 1). Estimates
were substantially different from zero for both Grey into Silver-backed
Butcherbirds and Grey into Black-backed Butcherbirds. Combined with the
inferences from STRUCTURE and *BEAST, these data support species-level
recognition for Grey (C. torquatus, Latham, 1802), Black-backed (C. mentalis,
Salvadori & d’Albertis, 1876) and Silver-backed Butcherbirds (C. argenteus,
Gould, 1841) under a species concept that allows for some low-level gene
exchange between evolutionary independent lineages (for example,
Phylogenetic and Evolutionary Species Concepts).
ARTICLE NATURE COMMUNICATIONS | DOI: 10.1038/ncomms4994
6 NATURE COMMUNICATIONS | 5:3994 | DOI: 10.1038/ncomms4994 | www.nature.com/naturecommunications
& 2014 Macmillan Publishers Limited. All rights reserved.

spatial structuring of mtDNA diversity invokes an unlikelybiogeographic scenario requiring either that (1) secondarycontact ‘leap-frogged’ the more geographically proximate TopEnd populations or (2) more recent gene flow between Top Endpopulations and eastern Grey Butcherbirds ‘erased’ the signal ofearlier introgression from Black-backed Butcherbirds in the TopEnd. Incomplete lineage sorting (Fig. 7c) can be rejected owing tonuclear coalescent models that do not exclusively fit an allopatricmodel of divergence (Fig. 4; Supplementary Fig. 2). Incorrecttaxonomy (Fig. 7d) can be rejected owing to congruence betweenphenotype and the nuclear species tree and STRUCTUREanalyses (Fig. 3), which clearly support the Top End andKimberley populations as each other’s closest relatives to theexclusion of Black-backed and Grey Butcherbirds.
Many other species from Australia’s drier habitats havephylogeographic histories that could fit models of GM expansion,range shift or, at least, the maintenance of large populationsrather than contraction to isolated GM refugia. For example, largeGM range or population sizes are predicted for Callitris trees insouthern Australia42 and Uperoleia toadlets12 and Estrilidfinches13 in northern Australia, as well as several bird specieswith nearly continent-wide distributions15. These patterns haveall been interpreted within the context of GM contractions,conceivably because of the refugia-centric legacy of ourtraditional ‘one-model-fits-all’ approach that focused on findingcongruent GM refugia across all taxa. This failed paradigm led toconclusions of ‘multiple, idiosyncratic (species-specific), GMrefugia’ for arid zone taxa in order to explain molecularevidence that large populations persisted throughout thePleistocene14,43,44.
Our data reinforce the idea that, rather than responses being‘idiosyncratic’, different species ecologies and environmentalheterogeneity produce discordant, but predictable, species
responses to GM aridity25,44. mtDNA (Fig. 2), palaeo-ENMs(Fig. 6) and palaeoclimatic reconstructions (Fig. 1a) suggestclimates that were largely hospitable for eastern GreyButcherbirds and allowed their GM range expansions, whereasextreme aridity and extensive, treeless, sand-dunes in central andwestern Australia7 likely caused GM range contractions inwestern Grey Butcherbirds and limited their northward rangeexpansion. Similar patterns of increased population structure inwestern Australia and unstructured, star-shaped polytomies ineastern Australia have been documented in other widespreadspecies43,45 suggesting that their histories have been shaped bysimilar processes.
There is also growing evidence that, in northern Australia,species with different ecologies have undergone discordant, butpredictable, responses to GM aridity25,26,40,44,46. Weakermonsoons and increased GM aridity appear to have causedrange disjunctions on either side of the Carpentarian Barrier (seeFig. 2 for location) in species of monsoonal savannawoodlands40,46 and mesic rainforests and mangroves25 but tohave facilitated range expansion in the arid-tolerant GreyButcherbird (Fig. 6). Notably, despite predictions of GM rangedisjunctions40,46 or range contractions/shifts (butcherbirds;Fig. 6), savanna woodland species likely do not fit a model ofGM contraction to refugia, since these species appear to havemaintained large effective population sizes throughout thePleistocene. However, a shift from panmixia to multiplesubdivided populations (for example, dispersed GM refugia orrange disjunction) could theoretically cause an increase ineffective population size (Ne) without a marked change inpopulation size (abundance). This argues for the combined use ofENMs, phylogeography and multilocus coalescent estimates ofdemographic change (Ne) when evaluating the fit of alternativeGM models rather than relying on a single line of evidence.
10a b
c d
1
0.1
0.010 10 20 30 40 50
10
1
0.1
0 10 20 30 40 500.00001
0.0001
0.001
0.01
10
1
0.1
0.0010 10 20 30 40 50
1
0.1
0.00010 10 20 30 40 50
0.01 0.001
0.01
Silver-backed Butcherbird Black-backed Butcherbird
Western Grey Butcherbird Eastern Grey Butcherbird
Thousands of years ago Thousands of years ago
Thousands of years ago Thousands of years ago
Effe
ctiv
e po
pula
tion
size
(lo
g sc
ale)
Effe
ctiv
e po
pula
tion
size
(lo
g sc
ale)
Effe
ctiv
e po
pula
tion
size
(lo
g sc
ale)
Effe
ctiv
e po
pula
tion
size
(lo
g sc
ale)
Figure 5 | Test of population expansion using EBSP. Extended Bayesian skyline plots estimated using combined mitochondrial and nuclear DNA sequence
data of (a) Silver-backed Butcherbirds, (b) Black-backed Butcherbirds, (c) western Grey Butcherbirds and (d) eastern Grey Butcherbirds. The median
posterior estimates of demographic change over the past 50,000 years are graphed with the shaded area indicating the 95% HPD.
NATURE COMMUNICATIONS | DOI: 10.1038/ncomms4994 ARTICLE
NATURE COMMUNICATIONS | 5:3994 | DOI: 10.1038/ncomms4994 | www.nature.com/naturecommunications 7
& 2014 Macmillan Publishers Limited. All rights reserved.

The lack of consideration of the different effects that ecologycan have on population history in Australia is surprising, giventhat such ecology-driven models exist for species from othercontinents whose responses likely parallel those of Australia’sdrier habitats—for example, species of savanna habitats inAfrica9, tropical Amazonia2, unglaciated regions in the
northern hemisphere3 and cold-adapted species (arctic andalpine habitats) in glaciated regions in the northernhemisphere10. Our next step ought to focus on developing astrong theoretical foundation against which ideas of speciesresponses to GM aridity in Australia can be tested. This willrequire the development of explicit predictions of the genetic
Silver-backedGrey
Pre
sent
LGM
Black-backed
Western Grey Eastern Grey
Typical
Low
High
0.10.30.40.60.9P
roba
bilit
y of
occu
rren
ce
Relative climatic suitability
Minimum trainingpresence threshold
Unsuitable
Suitable
Pre
sent
LGM
Wes
tE
ast
Bla
ckG
rey
Silv
er
Figure 6 | Test of range expansions using ENM. Present day and last glacial maximum (21,000 ya) ENMs for white-throated butcherbirds. ENMs
predict a northwest expansion of suitable habitats for eastern Grey Butcherbirds that could have resulted in secondary contact with Silver-backed
Butcherbirds at LGM. Colours show the relative climatic suitability scores for each taxon. Regions with low suitability fall between 0.1 and 0.4 probability
of occurrence, regions that are ‘typical’ of the abiotic niche of the species per taxon are 0.4–0.9, and regions that have high suitability are above
0.9 probability of occurrence. Black shows regions with suitable conditions under the less over-fit MTP threshold.
Introgression from Greys
a b c d
EW T K C NE WTKC N EW T K C N E WTKC N
Incomplete lineage sorting
Incorrecttaxonomy
Introgression from Black-backeds
Figure 7 | Four alternative hypotheses to explain the origin of mtDNA paraphyly in Silver-backed Butcherbirds. (a) Introgression from eastern Grey
Butcherbirds into Silver-backed Butcherbirds, (b) introgression from Black-backed Butcherbirds into Silver-backed Butcherbirds, (c) incomplete lineage
sorting, and (d) incorrect taxonomy. Green lines represent the mtDNA gene tree embedded within four alternative species trees that are scaled by time.
C, Cape York Peninsula (CYP); N, New Guinea (NG); K, Kimberley (KIM); T, Top End (TE); E, eastern Grey Butcherbirds; W, western Grey Butcherbirds.
ARTICLE NATURE COMMUNICATIONS | DOI: 10.1038/ncomms4994
8 NATURE COMMUNICATIONS | 5:3994 | DOI: 10.1038/ncomms4994 | www.nature.com/naturecommunications
& 2014 Macmillan Publishers Limited. All rights reserved.

consequences and range dynamics under each alternative GMmodel and for different species ecologies5, as well as thedevelopment of tools that are able to differentiate between thesimilar demographic signatures produced under differentprocesses (for example, expansion versus populationsubdivision). Testing of explicitly defined GM models within acomparative framework might reveal congruent responses amongco-distributed species or those with similar ecologies that haveotherwise been attributed to ‘discordant patterns resulting fromidiosyncratic responses’16,44.
MethodsMolecular sampling approach. All specimens used in this study were collectedunder the appropriate ethics and collecting permits from the relevant AustralianStates and Territories over a number of years by the Australian National WildlifeCollection (ANWC, CSIRO, Ecosystem Sciences, Canberra, Australia), WesternAustralian Museum (Perth, Australia), Museum Victoria (Melbourne, Australia)and the Australian Biological Tissue Collection (South Australian Museum,Adelaide Australia; see Supplementary Data 1). Specimens collected by the ANWCspecifically for this project were obtained under CSIRO Ecosystem Sciences AnimalEthics Committee Permit 10-04 Systematic Avifaunal Surveys in Western Australiaand the Northern Territory; CSIRO Sustainable Ecosystems Animal EthicsCommittee Permit 07-04 Avifaunal Surveys of the Great Victoria Desert; CSIROHuman Nutrition Animal Ethics Committee Permit no. 713-08/08; PermitsSF006336 and SF 007359 from the Western Australian Department of Environ-ment and Conservation; Permit 37355 from the Northern Territory Department ofNatural Resources, Environment, the Arts and Sport and Permit Y25496-1 fromthe South Australian Department for Environment and Heritage.
The mitochondrial ND2 locus was sampled for 138 white-throated butcherbirdsrepresenting all named species (Silver-backed, n¼ 36; Black-backed, n¼ 13; Grey,n¼ 89; Supplementary Data 1 for sample details). Seven nuclear introns (ACTB-3,BF-7, FN1-31, GAPDH-11, ODC-6&7, RPL37A-3 and BRM-15) were sampled for asubset of individuals (Supplementary Data 1 for sample sizes at each locus). Thisstudy adds to the data set of the previously published systematic study of Kearnset al.23 comprising five nuclear introns (BF-7, BRM-15, GAPDH-11, ODC-6&7 andCHDZ-18) and one mtDNA locus (ND2) sampled for 81 white-throatedbutcherbirds (Silver-backed, n¼ 32; Black-backed, n¼ 13; Grey, n¼ 36). CHDZ-18was omitted from this study as it was invariable in white-throated butcherbirds.Introns ACTB-3, FN1-31 and RPL37A-3 were sequenced specifically for this study.Cryofrozen tissue samples were available from the ranges of all three species;however, there were limited samples available for Silver-backed and Black-backedButcherbirds, and so the study of these species relied heavily on toe-pad tissuesfrom museum specimens. ND2 sequences from five species, includingrepresentatives from Cracticus and other Artamidae, were obtained from GenBankand included as outgroups for the mtDNA data set (Supplementary Data 1).
DNA amplification and sequencing. Frozen tissues were digested for 24 h usingproteinase K and lysis buffer, and then genomic DNA was extracted usingammonium acetate and ethanol precipitation (see Kearns et al.26 for furtherdetails). Toe-pad samples were extracted using a DNeasy Tissue Kit (Qiagen,Valencia, CA, USA) with modifications to the manufacturer’s protocol to improvethe yield for degraded samples including manually abrading the toe-pad sample toincrease the surface area that is being digested, increasing the digestion time,increasing the volume of proteinase K and reducing the volume of elution buffer(see Kearns et al.25 for further details). To minimize the risk of contamination,DNA extraction and PCR of toe-pad samples were performed in a separatelaboratory that had no contact with bird tissues or PCR products. To increase thechance of detecting contamination, all samples were extracted and sequenced withtoe-pad samples from other Cracticus species, DNA extraction- and PCR-negativeswere sequenced, and both frozen tissue and toe-pad tissues from one C. quoyi25
and two C. mentalis specimens were extracted and sequenced for ND2 and BRM.PCR amplification used 1.5 ml of MgCl2 (50 mM), 5 ml of 5� buffer, 2 ml of
dNTPs (2 mM), 0.5 ml of each primer (10 mM), 0.2 ml of MangoTaq and templateDNA and thermocycle conditions calibrated for tissue type and locus (seeSupplementary Table 5 for details). Toe-pad samples were purified using ExoSAP.Frozen tissues were purified using ammonium acetate (7.5 M) precipitation.Sequencing was performed by Macrogen (Seoul, Korea). CodonCode Aligner 3.0.1(CodonCode Corporation, 2002–2009) was used to edit and align sequences.PHASE v2.1 (ref. 47) was used to infer the gametic phase of individuals withmultiple heterozygous sites from five independent runs (-x5 algorithm) with a 0.70posterior probability threshold. The subtraction method was used to infer phase forindividuals that were heterozygous for indels (length-variant heterozygotes)48.The four-gamete test implemented in DnaSP v5 (ref. 34) was used to test forrecombination, and the longest independently segregating (non-recombining)block of sequence data from each locus was used in subsequent analyses.
Single-locus phylogenies and networks. Bayesian inference was used to estimatethe mtDNA gene tree in MrBayes 3.1.2 (ref. 49). Two analyses were run for 10million generations, each using codon position partitions and the GTRþ IþGsubstitution model and with four chains, default heating values and sampling every100,000 generations. Convergence and the appropriate burnin were determined bycomparing harmonic means and trend plots from the two runs. Unrooted allelenetworks for the nuclear and mtDNA loci were constructed using the union ofmaximum parsimony trees method in the programme CombineTrees50 using thefollowing steps for each locus: (a) identical sequences were merged using MacClade4.06 (ref. 51), (b) multinucleotide indels were reduced to 1 bp to take advantage ofthe ‘gap as fifth base’ option in PAUP* 4.0b10 (ref. 52), (c) maximum parsimonytrees were estimated in PAUP* using tree-bisection-reconnection branch-swappingalgorithm and simple sequence addition, (d) the maximum parsimony trees wereinput into CombineTrees and combined into a single reticulated network usingdefault settings. Measures of net-sequence divergence (Dxy) and descriptivestatistics were calculated for each locus in DnaSP v5 (ref. 34). The degree ofpopulation structure was investigated using analysis of molecular variance inArlequin v3.11 (ref. 53; permutations¼ 10,000; significance level¼ 0.05).
Multilocus tests of species boundaries. *BEAST32 analyses used a Yulespeciation prior on the species tree and applied a strict clock for all nuclear lociafter preliminary runs rejected a relaxed clock for these loci (s.d. of the substitutionrate parameter included zero). The best-fit substitution model for each locus asselected in MrModeltest 2.2 (ref. 54) under the Akaike information criterion wasused in *BEAST analyses: ACTB-3: HKYþ I, BF-7: HKY, BRM-15: GTR, FN1-31:HKY, GAPDH-11: HKYþ I, ODC-6&7: HKY, RPL37A-3: GTRþ I. *BEAST wasrun twice for 8� 108 generations, sampling every 5,000 generations and with aburnin of 8� 107 generations. Convergence was assessed using TRACER v1.5(ref. 55) by ensuring that effective sample size (ESS) values were above 200 andthat independent runs had converged on the same stationary distribution.LOGCOMBINER v1.6.1 (ref. 55) was used to combine the two runs, and thenTREEANNOTATOR v1.6.1 (ref. 55) was used to generate a maximum-clade-credibility tree from the 288,000 post-stationarity trees.
STRUCTURE30 analyses used a subset of 51 individuals that had near completesampling for all seven nuclear loci (see Supplementary Data 1 for sampling details).Twenty runs of one million generations with 100,000 generations discarded asburnin were performed for each value between K¼ 1 and K¼ 8 using theadmixture model and with allele frequencies correlated among populations.STRUCTURE HARVESTER v0.6.8 (ref. 56) was used to implement the delta Kmethod, which examines the rate of change in the log probabilities of each value ofK in order to determine the best value of K for the data57. CLUMPP58 was used tocombine independent results from the 20 replicated runs for K¼ 2, 3, 4 and 6 usingthe ‘Full Search’ option (M¼ 1) and default settings.
Tests for introgression. Demographic parameters (divergence time (t), effectivepopulation size (Ne) and population migration rate (2NM)) were estimated fromthe nuclear intron data set using the ‘Isolation-with-Migration-analytic model formore than two populations’ (IMa2)31. mtDNA data were not included in IMa2models. Owing to ambiguity in the sequence of divergence of the white-throatedbutcherbirds (see Results), separate IMa2 models were run for the two mostplausible species trees: ‘Tree 1 ((Silver-backed, Black-backed) Grey)’ and ‘Tree 2((Silver-backed, Grey) Black-backed)’. Several preliminary runs were performedwith wide priors (for example, population size (q)¼ 30, migration rate (m)¼ 100,divergence time (t)¼ 20) in order to identify appropriate upper bounds thatencompassed the posterior distribution of each parameter59. Preliminary runsimplementing the full IMa2 model failed to converge and mix adequately, thus‘ancestral migration’ (gene flow after t1 and before t0) was eliminated from finalanalyses (-j3 option) to reduce the complexity of the model. For both species trees,estimates for t and ancestral population size did not have closed posteriordensities—posterior densities either (a) extended indefinitely at low probabilities(ancestral population size) or (b) peaked early, dropped and plateaued at lowprobabilities (t). Following the recommendations of Won & Hey59 and Hey60, theupper bound of the prior for these two parameters was constrained to a lower,more biologically meaningful, value.
Final IMa2 analyses used 80 independent Markov-coupled chains with ageometric heating scheme (g1¼ 0.96, g2¼ 0.5). The infinite-site mutation modelwas applied to each locus. After an initial run using a burnin of 2,000,000 steps anda run length of 2,000,000 steps, several independent runs (burnin¼ 100,000–2,000,000 steps; run length¼ 2,000,000–15,000,000 steps) were started from theMarkov chain state files of previous runs using different random number seeds. Foreach species tree model, final demographic parameter estimates were recordedfrom two independent runs initiated from identical Markov chain state files withdifferent random number seeds (Guide tree 1: 100,000 burnin, 6,000,000 runlength; Guide tree 2: 100,000 burnin, 10,000,000 run length). Parameterconvergence and chain mixing were assessed using the following criteria: (a) lowautocorrelation of parameters (o0.1), (b) absence of discernible trends in plots forL[P] and t parameters, (c) ESSs above at least 70 (typically 4100–1,000) and (d)consistency of results across replicated runs60. Model parameters were convertedinto biologically meaningful demographic parameters (that is, divergence time inyears, effective population size (Ne) and population migration rate (2NM)) using a
NATURE COMMUNICATIONS | DOI: 10.1038/ncomms4994 ARTICLE
NATURE COMMUNICATIONS | 5:3994 | DOI: 10.1038/ncomms4994 | www.nature.com/naturecommunications 9
& 2014 Macmillan Publishers Limited. All rights reserved.

generation time of two years (based on the age of first breeding of GreyButcherbirds61), a neutral mutation rate of 1.35� 10� 9 substitutions per site peryear (estimated for nuclear introns for birds62), and inheritance scalars of 1.0 forautosomal and 0.75 for Z-linked loci.
Tests for population size change. Demographic history was inferred using theextended Bayesian skyline model, EBSP32 in BEAST v1.7.5 (ref. 33), and tests fordeviations from neutrality and assumptions of constant population size using theTajima’s D, Fu’s Fs and R2 statistics in DnaSP v5 (ref. 34) for each locus.Independent EBSP analyses partitioned by loci were run for Grey Butcherbirds,Silver-backed Butcherbirds and Black-backed Butcherbirds. The Bayesian skylinemodel assumes sampling from a panmictic population and sampling fromstructured populations can lead to false inferences of population decline63. Toaccount for potential problems arising from mtDNA structure identified for GreyButcherbirds, we also ran EBSP separately for eastern and western populations ofGrey Butcherbirds. For each locus partition, evolutionary models were selectedusing MrModeltest54 (see Supplementary Table 6). We selected a strict clock foreach analysis based on population-level structure within each species. Analyseswere run starting with a random tree. We specified a substitution rate of2.9� 10� 2 substitutions per site per million years64 for ND2 and estimatedsubstitution rates for all nuclear loci. A normal prior was selected for the ND2substitution rate with a s.d. of 0.003, which was estimated from the 95% HPD(2.4–3.3� 10� 2 substitutions per site per million years) in Lerner et al.64 For allother loci, we selected a gamma prior distribution (shape 1.0, scale 0.01) on theclock rate to reflect prior knowledge of a slower rate for the nuclear loci than ND2.BEAST runs were sampled every 2,000 generations for a total of 100 milliongenerations to ensure effective sample size (ESS) posterior parameter estimateswere greater than 100 and that stationarity of parameters was reached within thedefault EBSP burnin of 10%.
Tests for LGM range expansion or contraction. Present-day ENMs were esti-mated using maximum entropy species distribution modelling in MAXENT ver-sion 3.3 (ref. 35) from nine abiotic climatic variables (2.5-min resolution) from theWorldClim database36 and georeferenced occurrence records (see Fig. 1b) from theBirds Australia Birdata Project (www.birdata.com.au) accessed through the Atlas ofLiving Australia website (www.ala.org.au) and the Australian National WildlifeCollection (429 records of Silver-backed, 618 records of Black-backed Butcherbirdsand 24,295 records of Greys (18,595 records from the east and 5,700 from thewest)). Occurrence records were verified and refined according to species ranges inSchodde and Mason22. To avoid overfitting the model, ENMtools65 was used toremove occurrence records within one-grid cell of each other, and to test for strongcorrelations among bioclimatic variables (Pearson’s correlation: R40.90). Thisresulted in a final data set of nine bioclimatic variables without strong correlations(Ro0.90): Annual Mean Temperature (Bio1), Temperature Seasonality (Bio4),Mean Temperature of Wettest Quarter (Bio8), Mean Temperature of DriestQuarter (Bio9), Mean Temperature of Warmest Quarter (Bio10), PrecipitationSeasonality (coefficient of variation) (Bio15), Precipitation of Wettest Quarter(Bio16), Precipitation of Warmest Quarter (Bio18) and Precipitation of ColdestQuarter (Bio19). ENMs were generated using the recommended default settings:regularization¼ 1, iterations¼ 500, convergence threshold¼ 0.00001 (ref. 35). Theaccuracy of the present-day ENMs (continuous RCS models) were evaluated usingthe AUC (random test percentage¼ 25%, threshold¼ 0.70) and by visuallyassessing the fit of ENMs to published range limits of each species66. LGM ENMswere obtained by projecting present-day ENMs on bioclimatic variables predictedfor the LGM under the Community Climate System Model and with ‘fade-by-clamping’67. RCS predictions were converted into binary distributions depicting‘suitable’ and ‘unsuitable’ conditions using the MTP threshold (lowest presencethreshold) to provide a less over-fit interpretation of suitable climatic conditions67.
References1. Hewitt, G. Genetic consequences of climatic oscillations in the Quaternary.
Philos. Trans. R. Soc. B Biol. Sci. 359, 183–195 (2004).2. Lessa, E. P., Cook, J. A. & Patton, J. L. Genetic footprints of demographic
expansion in North America, but not Amazonia, during the Late Quaternary.Proc. Natl Acad. Sci. USA 100, 10331–10334 (2003).
3. Soltis, D. E., Morris, A. B., McLachlan, J. S., Manos, P. S. & Soltis, P. S.Comparative phylogeography of unglaciated eastern North America. Mol. Ecol.15, 4261–4293 (2006).
4. Willis, K. & Vanandel, T. Trees or no trees? The environments of central andeastern Europe during the Last Glaciation. Quat. Sci. Rev. 23, 2369–2387(2004).
5. Bennett, K. & Provan, J. What do we mean by ‘refugia’? Quat. Sci. Rev. 27,2449–2455 (2008).
6. Pennington, R. T., Prado, D. E. & Pendry, C. A. Neotropical seasonally dryforests and quaternary vegetation changes. J. Biogeogr. 27, 261–273 (2000).
7. Williams, M. et al. Glacial and deglacial climatic patterns in Australia andsurrounding regions from 35,000 to 10,000 years ago reconstructed fromterrestrial and near-shore proxy data. Quat. Sci. Rev. 28, 2398–2419 (2009).
8. Hope, G. et al. History of vegetation and habitat change in the Austral-Asianregion. Quat. Int. 118–119, 103–126 (2004).
9. Allal, F. et al. Past climate changes explain the phylogeography of Vitellariaparadoxa over Africa. Heredity 107, 174–186 (2011).
10. Galbreath, K., Hafner, D. & Zamudio, K. When cold is better: climate-drivenelevation shifts yield complex patterns of diversification and demography in analpine specialist (American Pika, Ochotona princeps). Evolution 63, 2848–2863(2009).
11. Schoville, S. D. & Roderick, G. K. Evolutionary diversification of cryophilicGrylloblatta species (Grylloblattodea: Grylloblattidae) in alpine habitats ofCalifornia. BMC Evol. Biol. 10, 163 (2010).
12. Catullo, R. A., Lanfear, R., Doughty, P. & Keogh, J. S. The biogeographicalboundaries of northern Australia: evidence from ecological niche models and amulti-locus phylogeny of Uperoleia toadlets (Anura: Myobatrachidae).J. Biogeogr. 41, 659–672 (2014).
13. Schidelko, K., Wustenhagen, N., Stiels, D., van den Elzen, R. & Rodder, D.Continental shelf as potential retreat areas for Austral-Asian estrildid finches(Passeriformes: Estrildidae) during the Pleistocene. J. Avian Biol. 43, 001–012(2012).
14. Byrne, M. et al. Birth of a biome: insights into the assembly and maintenance ofthe Australian arid zone biota. Mol. Ecol. 17, 4398–4417 (2008).
15. Joseph, L. & Omland, K. Phylogeography: its development and impact inAustralo-Papuan ornithology with special reference to paraphyly in Australianbirds. Emu 109, 1–23 (2009).
16. Byrne, M. Evidence for multiple refugia at different time scales duringPleistocene climatic oscillations in southern Australia inferred fromphylogeography. Quat. Sci. Rev. 27, 2576–2585 (2008).
17. Moritz, C., Patton, J., Schneider, C. & Smith, T. Diversification of rainforestfaunas: an integrated molecular approach. Annu. Rev. Ecol. Syst. 31, 533–563(2000).
18. Provan, J. & Bennett, K. Phylogeographic insights into cryptic glacial refugia.Trends Ecol. Evol. 23, 564–571 (2008).
19. Kotlık, P. et al. A northern glacial refugium for bank voles (Clethrionomysglareolus). Proc. Natl Acad. Sci. USA 103, 14860–14864 (2006).
20. Stewart, J. R. & Lister, A. M. Cryptic northern refugia and the origins of themodern biota. Trends Ecol. Evol. 16, 608–613 (2001).
21. Fedorov, V. B. & Stenseth, N. C. Multiple glacial refugia in the North AmericanArctic: inference from phylogeography of the collared lemming (Dicrostonyxgroenlandicus). Proc. R. Soc. B Biol. Sci. 269, 2071–2077 (2002).
22. Schodde, R. & Mason, I. The Directory of Australian Birds: Passerines (CSIROPublishing, 1999).
23. Kearns, A. M., Joseph, L. & Cook, L. G. A multilocus coalescent analysis of thespeciational history of the Australo-Papuan butcherbirds and their allies. Mol.Phylogenet. Evol. 66, 941–952 (2013).
24. Keast, A. Bird speciation on the Australian continent. Bull. Mus. Comp. Zool.123, 307–495 (1961).
25. Kearns, A. M., Joseph, L., Omland, K. & Cook, L. Testing the effect of transientPlio-Pleistocene barriers in monsoonal Australo-Papua: did mangrove habitatsmaintain genetic connectivity in the Black Butcherbird? Mol. Ecol. 20,5042–5059 (2011).
26. Kearns, A. M., Joseph, L. & Cook, L. The impact of Pleistocene changes ofclimate and landscape on Australian birds: a test using the Pied Butcherbird(Cracticus nigrogularis). Emu 110, 285–295 (2010).
27. Toon, A., Mather, P., Baker, A., Durrant, K. & Hughes, J. Pleistocene refugia inan arid landscape: analysis of a widely distributed Australian passerine. Mol.Ecol. 16, 2525–2541 (2007).
28. Ford, J. Geographical isolation and morphological and habitat differentiationbetween birds of the Kimberley and the Northern Territory. Emu 78, 25–35(1978).
29. Heled, J. & Drummond, A. Bayesian inference of species trees from multilocusdata. Mol. Biol. Evol. 27, 570–580 (2010).
30. Pritchard, J., Stephens, M. & Donnelly, P. Inference of population structureusing multilocus genotype data. Genetics 155, 945–959 (2000).
31. Hey, J. Isolation with migration models for more than two populations.Mol. Biol. Evol. 27, 905–920 (2009).
32. Heled, J. & Drummond, A. J. Bayesian inference of population size history frommultiple loci. BMC Evol. Biol. 8, 289 (2008).
33. Drummond, A. J., Suchard, M. A., Xie, D. & Rambaut, A. Bayesianphylogenetics with BEAUti and the BEAST 1.7. Mol. Biol. Evol. 29, 1969–1973(2012).
34. Rozas, J., Sanchez-DelBarrio, J., Messeguer, X. & Rozas, R. DnaSP, DNApolymorphism analyses by the coalescent and other methods. Bioinformatics19, 2496–2497 (2003).
35. Phillips, S., Anderson, R. & Schapire, R. Maximum entropy modeling of speciesgeographic distributions. Ecol. Model 190, 231–259 (2006).
36. Hijmans, R., Cameron, S., Parra, J., Jones, P. & Jarvis, A. Very high resolutioninterpolated climate surfaces for global land areas. Int. J. Climatol. 25,1965–1978 (2005).
ARTICLE NATURE COMMUNICATIONS | DOI: 10.1038/ncomms4994
10 NATURE COMMUNICATIONS | 5:3994 | DOI: 10.1038/ncomms4994 | www.nature.com/naturecommunications
& 2014 Macmillan Publishers Limited. All rights reserved.

37. Otto-Bliesner, B. & Brady, E. Last glacial maximum and holocene climate inCCSM3. J. Clim. 19, 2526–2544 (2006).
38. Strasburg, J. & Rieseberg, L. Interpreting the estimated timing of migrationevents between hybridizing species. Mol. Ecol. 20, 2353–2366 (2011).
39. Petit, R. J. & Excoffier, L. Gene flow and species delimitation. Trends Ecol. Evol.24, 386–393 (2009).
40. Jennings, W. & Edwards, S. Speciational history of Australian grass finches(Poephila) inferred from thirty gene trees. Evolution 59, 2033–2047 (2005).
41. Potter, S., Eldridge, M., Taggart, D. & Cooper, S. Multiple biogeographicalbarriers identified across the monsoon tropics of northern Australia:phylogeographic analysis of the brachyotis group of rock-wallabies. Mol. Ecol.21, 2254–2269 (2012).
42. Sakaguchi, S. et al. Climate, not Aboriginal landscape burning, controlled thehistorical demography and distribution of fire-sensitive conifer populationsacross Australia. Proc. R. Soc. B Biol. Sci. 280, 20132182 (2013).
43. Neaves, L., Zenger, K., Prince, R. & Eldridge, M. Impact of Pleistocene aridityoscillations on the population history of a widespread, vagile Australianmammal Macropus fuliginosus.. J. Biogeogr. 1545–1563 (2012).
44. Eldridge, M. D. B., Potter, S., Johnson, C. N. & Ritchie, E. G. Differingimpact of a major biogeographic barrier on genetic structure in two largekangaroos from the monsoon tropics of Northern Australia. Ecol. Evol. 4,554–567 (2014).
45. Kearns, A. M., Joseph, L., Edwards, S. & Double, M. Inferring thephylogeography and evolutionary history of the splendid fairy-wren Malurussplendens from mitochondrial DNA and spectrophotometry. J. Avian Biol. 40,7–17 (2009).
46. Lee, J. & Edwards, S. Divergence across Australia’s Carpentarian barrier:statistical phylogeography of the red-backed fairy wren (Malurusmelanocephalus). Evolution 62, 3117–3134 (2008).
47. Stephens, M. & Donnelly, P. A comparison of bayesian methods for haplotypereconstruction from population genotype data. Am. J. Hum. Genet. 73,1162–1169 (2003).
48. Dolman, G. & Moritz, C. A multilocus perspective on refugial isolation anddivergence in rainforest skinks (Carlia). Evolution 60, 573–582 (2006).
49. Huelsenbeck, J. Bayesian inference of phylogeny and its impact on evolutionarybiology. Science 294, 2310–2314 (2001).
50. Cassens, I., Mardulyn, P. & Milinkovitch, M. Evaluating intraspecific ‘network’construction methods using simulated sequence data: do existing algorithmsoutperform the global maximum parsimony approach? Syst. Biol. 54, 363–372(2005).
51. Maddison, D. & Maddison, W. MACCLADE (Sinauer & Associates, 2003).52. Swofford, D. PAUP*. Phylogenetic Analysis Using Parsimony (*and Other
Methods). Version 4, ISBN 978-0-87893-806-3 (2002).53. Excoffier, L., Laval, G. & Schneider, S. Arlequin ver. 3.0: An integrated software
package for population genetics data analysis. Evol. Bioinform. Online 1, 47–50(2005).
54. Posada, D. & Crandall, K. A. MODELTEST: testing the model of DNAsubstitution. Bioinformatics 14, 817–818 (1998).
55. Drummond, A. & Rambaut, A. BEAST: Bayesian evolutionary analysis bysampling trees. BMC Evol. Biol. 7, 214–214 (2007).
56. Earl, D. & vonHoldt, B. STRUCTURE HARVESTER: a website and programfor visualizing STRUCTURE output and implementing the Evanno method.Conserv. Genet. Res. 4, 1–3 (2011).
57. Evanno, G., Regnaut, S. & Goudet, J. Detecting the number of clusters ofindividuals using the software structure: a simulation study. Mol. Ecol. 14,2611–2620 (2005).
58. Jakobsson, M. & Rosenberg, N. CLUMPP: a cluster matching and permutationprogram for dealing with label switching and multimodality in analysis ofpopulation structure. Bioinformatics 23, 1801–1806 (2007).
59. Won, Y. & Hey, J. Divergence population genetics of chimpanzees. Mol. Biol.Evol. 22, 297–307 (2005).
60. Hey, J. On the number of new world founders: a population genetic portrait ofthe peopling of the Americas. PLoS Biol. 3, e193 (2005).
61. Johnson, G. Vocalisations in the Grey Butcherbird Cracticus Torquatus withEmphasis on Structure in Male Breeding Song: Implications for the Function andEvolution of Song from a Study of a Southern Hemisphere species. PhD Thesis,
Faculty of Environmental Sciences, Griffith University Brisbane, Australia.(2003).
62. Ellegren, H. Molecular evolutionary genomics of birds. Cytogenet. Genome Res.117, 120–130 (2007).
63. Heller, R., Chikhi, L. & Siegismund, H. R. The confounding effect of populationstructure on Bayesian Skyline plot inferences of demographic history. PLoSONE 8, e62992 (2013).
64. Lerner, H. R. L., Meyer, M., James, H. F., Hofreiter, M. & Fleischer, R. C.Multilocus resolution of phylogeny and timescale in the extant adaptiveradiation of Hawaiian honeycreepers. Curr. Biol. 21, 1838–1844 (2011).
65. Warren, D., Glor, R. & Turelli, M. ENMTools: a toolbox for comparativestudies of environmental niche models. Ecography 33, 607–611 (2010).
66. Lobo, J., Jimenez-Valverde, A. & Real, R. AUC: a misleading measure of theperformance of predictive distribution models. Global Ecol. Biogeogr. 17,145–151 (2008).
67. Richmond, O., McEntee, J., Hijmans, R. & Brashares, J. Is the climate right forpleistocene rewilding? Using species distribution models to extrapolate climaticsuitability for mammals across continents. PLoS ONE 5, e12899 (2010).
68. Schodde, R. Origins, radiations and sifting in the Australasian biota: changingconcepts from new data and old. Aust. Syst. Bot. Soc. Newslett. 60, 2–11 (1989).
69. Williams, M. et al. The enigma of a late Pleistocene wetland in the FlindersRanges, South Australia. Quat. Int. 83-85, 129–144 (2001).
70. Voris, H. Maps of Pleistocene sea levels in Southeast Asia: shorelines, riversystems and time durations. J. Biogeogr. 27, 1153–1167 (2000).
AcknowledgementsWe thank the following collectors, collection managers and curators for the use ofspecimens: R. Schodde, R. Palmer, A. Drew, L. Pedler and I. Mason (Australian NationalWildlife Collection), C. Stevenson and R. Johnstone (Western Australian Museum),V. Thompson, J. Sumner and L. Christidis (Museum of Victoria), and S. Donnellan(Australian Biological Tissue Collection/South Australian Museum). We particular thankAlex Drew, Lynn Pedler and Robert Palmer for their efforts to collect Silver-backedButcherbirds from the Pinkerton Ranges, Northern Territory, Australia—this researchwould not have been possible without these specimens. We thank Corinna Lange forproviding laboratory space for DNA extractions and sequencing of toe-pad specimens.We thank Robb Brumfield, Darren Irwin, Mike Crisp and the members of the Cook labat The University of Queensland for helpful discussion. Computationally intensiveBayesian analyses were performed on The University of Queensland High PerformanceComputing Unit. Research funding was provided by the Frank M. Chapman MemorialFund of the American Museum of Natural History, the Stuart Leslie Bird ResearchAward of Birds Australia, The University of Queensland and a UQ Graduate SchoolResearch Travel Grant to A.M.K.
Author contributionsA.M.K., L.J. and L.G.C. conceived the idea for the study. A.M.K. collected and analysedall data except for the Extended Bayesian Skyline analyses performed by A.T. A.M.K.wrote the manuscript in collaboration with L.G.C. and L.J. All authors contributed to thestudy design, interpretation of results and commented on the manuscript.
Additional informationAccession Codes: ND2 and intron sequences have been deposited in GenBank nucleotidedatabase under the accession codes KC533176 to KC533433 and KC545224 toKC545225.
Supplementary Information accompanies this paper at http://www.nature.com/naturecommunications
Competing financial interests: The authors declare no competing financial interests.
Reprints and permission information is available online at http://npg.nature.com/reprintsandpermissions/
How to cite this article: Kearns, A. M. et al. Australia’s arid-adapted butcherbirdsexperienced range expansions during Pleistocene glacial maxima. Nat. Commun. 5:3994doi: 10.1038/ncomms4994 (2014).
NATURE COMMUNICATIONS | DOI: 10.1038/ncomms4994 ARTICLE
NATURE COMMUNICATIONS | 5:3994 | DOI: 10.1038/ncomms4994 | www.nature.com/naturecommunications 11
& 2014 Macmillan Publishers Limited. All rights reserved.