Australia benchmark-report
62
WHY AUSTRALIA BENCHMARK REPORT 2015
-
Upload
cerule-consulting -
Category
Documents
-
view
46 -
download
2
Transcript of Australia benchmark-report

WHY AUSTRALIABENCHMARKREPORT 2015
AUSTRALIA: OPEN FOR BUSINESS
WHY AUSTRALIA
GROWTH > INNOVATION > TALENT > LOCATION > B
USIN
ESS >
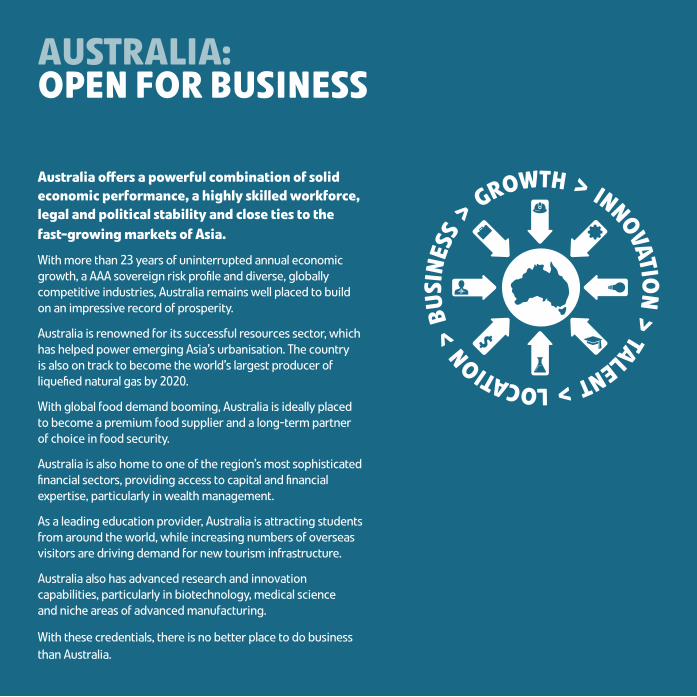
Australia offers a powerful combination of solid economic performance, a highly skilled workforce, legal and political stability and close ties to the fast-growing markets of Asia. With more than 23 years of uninterrupted annual economic growth, a AAA sovereign risk profile and diverse, globally competitive industries, Australia remains well placed to build on an impressive record of prosperity.
Australia is renowned for its successful resources sector, which has helped power emerging Asia’s urbanisation. The country is also on track to become the world’s largest producer of liquefied natural gas by 2020.
With global food demand booming, Australia is ideally placed to become a premium food supplier and a long-term partner of choice in food security.
Australia is also home to one of the region’s most sophisticated financial sectors, providing access to capital and financial expertise, particularly in wealth management.
As a leading education provider, Australia is attracting students from around the world, while increasing numbers of overseas visitors are driving demand for new tourism infrastructure.
Australia also has advanced research and innovation capabilities, particularly in biotechnology, medical science and niche areas of advanced manufacturing.
With these credentials, there is no better place to do business than Australia.

GROWTH
01. GROWTHWorld’s 20 Largest Economies – 2015 4
Economic Resilience – Real GDP Growth 5
Real GDP Growth by Economic Grouping 6
Asian Economic Growth 7
Productivity of Australian Industry Sectors Compared with Global Competitors 8
Australia’s Real Gross Value Added by Industry 9
Growth by Industry in Australia’s Real Gross Value Added 10
General Government Net Debt – 2015 11
Australia’s Globally Significant Industries 12
Australia’s Energy and Resources Sector 13
Top 10 Export Destinations for Australian Agrifood 14
Australia’s International Visitor Expenditure by Market 15
Distribution of Foreign Students in Tertiary Education By Country of Destination – 2012 16
Global Significance of Australia’s Investment Fund Assets Pool 17
Engineering Construction Pipeline Activity in Australia 18

GROWTHAustralia’s economic resilience and sustained growth provide an attractive, safe and low-risk environment in which to do business.
Over the past 23 years, Australia’s economy has achieved a real GDP average growth rate of 3.3 per cent per annum. Its forecast economic growth rate between 2015 and 2019 is the highest among major advanced economies.
This growth is underpinned by Australia’s location in the booming Asia-Pacific region. Its globally significant industries are known worldwide for the high quality of their goods and services.
Mining continues to be a major contributor to Australia’s international trade profile, but it is the country’s services sector that generates more than 80 per cent of its economic output. This sector is growing faster than any other industry, reflecting the deep pool of professional expertise available in Australia.
GDP – US$1.5 trillion

SECTION 1 GROWTH > 4
Australia: an economy of scaleThe Australian economy is forecast to be the 13th largest in the world in 2015, despite the fact the country is home to only 0.3 per cent of the world’s population. Australia’s nominal GDP is estimated at US$1.5 trillion and accounts for two per cent of the global economy. Australia has more than doubled the value of its total production from a decade ago.
WORLD’S 20 LARGEST ECONOMIES – 2015F
Percentage share of total world nominal GDP in US$
1. USA 22.5%
2. China 13.9%
3. Japan 6.0%
4. Germany 4.8%
5. UK 3.7%
6. France 3.6%
7 . Brazil 2.9%
9. Italy 2.6%
8. India 2.8%
10. Russia 2.6%
11. Canada 2.3%
13. Australia 1.9%
20. Switzerland 0.8%19. Saudi Arabia 1.0%18. Turkey 1.1%17. Netherlands 1.1%16. Indonesia 1.1%15. Mexico 1.7%14. Spain 1.7%
Rest of World 19.9%
8.5%
12. South Korea 1.9%
F = Forecast GDP of the world’s 189 economies: US$81,274 billionGDP of Asia-Pacific Economic Cooperation’s 21 member economies: US$47,036 billion (57.9% of world’s GDP)GDP of 20 largest economies: US$65,067 billion (80.1% of world’s GDP)Source: International Monetary Fund, World Economic Outlook Database, October 2014; Austrade

SECTION 1 GROWTH > 5
ECONOMIC RESILIENCE – REAL GDP GROWTH1992–2014
Over two decades of uninterrupted annual economic growthThe Australian economy remains resilient; sustained by sound macroeconomic policies, strong institutions and continued demand for hard and soft commodities from Asia. Australia is the only developed economy to have recorded no annual recessions during the past 23 years, placing it alongside high-growth economies such as China and India.
2.4
1.4
44
0.8
6.6
6.1
7.0
5.7
3.3
7
0.6
10.1
3.8
2.9
4.0
Note: Colour circles represent the number of years in recession
Source: International Monetary Fund, World Economic Outlook Database, October 2014; Austrade

SECTION 1 GROWTH > 6
F = Forecast1. ASEAN-5 = Indonesia, Malaysia, Philippines, Thailand and Vietnam2. Composed of 18 economies in Europe
Source: International Monetary Fund, World Economic Outlook Database, October 2014; Austrade
REAL GDP GROWTH BY ECONOMIC GROUPING Average annual growth rate: 2010–14 and 2015F–19F
0.0
1.0
2.0
3.0
4.0
5.0
6.0
7.0
8.0
9.0
Aver
age
annu
al g
row
th ra
te (%
)
0.9
1.6
2.7
World Average ASEAN-51 IndiaJapan Australia USAChina UK Euro Area2
2010 to 2014
2015F to 2019F
3.9 4.0
5.5 5.5
6.5 6.6 6.7
8.5
3.0
2.2
2.9
1.6
2.5
0.7
1.6
Australia’s growth outlook is higher than major advanced economiesAustralia’s economy is entering its 24th year of uninterrupted annual economic growth. And the fundamentals are in place for this trend to continue. According to IMF forecasts released in October 2014, Australia is expected to realise average annual real GDP growth of three per cent between 2015 and 2019, up from an average growth rate of 2.7 per cent between 2010 and 2014 – the highest among major advanced economies.

SECTION 1 GROWTH > 7
ASIAN ECONOMIC GROWTH GDP based on Purchasing Power Parity valuation (current international dollar billion)1
0
5,000
10,000
15,000
20,000
25,000
30,000
35,000
40,000
45,000
50,000
55,000
60,000
19851980 1990 1995 2000 2005 2010 2015F 2019F
Asia % of World GDP (right-hand axis)
China and IndiaJapan, Australia and New ZealandASEAN-52
NIEs3 (Singapore, Hong Kong, Taiwan and South Korea)Other Developing Asia
Cur
rent
inte
rnat
iona
l $ b
illio
n
% o
f wor
ld G
DP
0
5
10
15
20
25
30
35
40
45
F = Forecast1. An international dollar would buy in the cited country a comparable amount of goods and services a US dollar would buy in the United States. Local currency values are converted into international dollars using Purchasing Power Parity exchange rates2. Composed of 5 countries: Indonesia, Malaysia, Philippines, Thailand and Vietnam3. Newly Industrialised Economies
Source: International Monetary Fund, World Economic Outlook Database, October 2014; Austrade
The Asian region will account for over 40 per cent of global GDP by 2019Australia’s recent and forecast economic growth reflects its unique position within, and increasingly strong ties to, the rapidly growing Asian region. By 2019, the regional economy is expected to account for 42 per cent of global output, double the ratio in 1980. Over the same period, the combined economies of China and India will likely represent over one quarter of the world’s GDP, significantly up from around five per cent in 1980.

SECTION 1 GROWTH > 8
PRODUCTIVITY OF AUSTRALIAN INDUSTRY SECTORS COMPARED WITH GLOBAL COMPETITORS
0
20
40
60
80
100
120
140
160
Man
ufac
turin
g
Reta
il an
d W
hole
sale
Busi
ness
and
Pro
pert
y Se
rvic
es
Tran
spor
t and
Log
istic
s
ICT
Bank
ing
Wea
lth M
anag
emen
t
Tele
com
mun
icat
ion
Med
ia
Wat
er a
nd W
aste
Ser
vice
s
Publ
ic A
dmin
istr
atio
n
Con
stru
ctio
n
Gas
Inte
rnat
iona
l Edu
catio
n
Oth
er E
duca
tion
and
Trai
ning
Hea
lth
Tour
ism
Agrib
usin
ess
Oil
Min
ing
75.080.0
97.7 98.7105.6105.6105.6105.6105.6 107.0
112.0117.0 120.0 122.5 122.5
126.2 126.2
140.9146.1 148.5
Prod
uctiv
ity in
dex
(%)
Note: A score of 110 means Australia is 10% more productive than the average productivity of global competitors in the industry.
Source: Deloitte, Positioning for prosperity? Catching the next wave, October Preview 2013, Figure 42, page 88; Deloitte Access Economics based on data provided in The Conference Board, Total Economy Database; Austrade
Australian productivity is highly rated in key future growth sectorsThe productivity levels of 16 out of 20 Australian industries rate above the average productivity of global competitors in the same sector. Australia is performing more than 20 per cent above this global average in five key growth sectors including gas, education, health and tourism, and over 40 per cent in agribusiness, oil and mining.

SECTION 1 GROWTH > 9
AUSTRALIA’S REAL GROSS VALUE ADDED BY INDUSTRYAnnual total ending June 2013–14, as a percentage of total industry
Note: Gross value added measures the contribution to the economy of each individual producer, industry or sector.1. Including: Ownership of Dwellings (9.0%), Arts and Recreation Services (0.8%) and other (1.9%)
Source: Australian Bureau of Statistics Cat. No. 5204.0 Australian System of National Accounts, 2013–14 (released 31 October 2014), Table 5. Gross Value Added by Industry; Austrade
Construction 8.5%
Financial and Insurance 9.0%
Professional, Scientific and Technical 6.9%
Public Administration and Safety 5.7%
Health Care and Social Assistance 6.9%
Transport, Postal and Warehousing 5.1%
Wholesale Trade 4.2%
Education and Training 4.9%
Retail Trade 4.8%
Electricity, Gas, Water and Waste Services 2.9%
Accommodation and Food Services 2.5%
Administrative and Support Services 3.0%
Rental, Hiring and Real Estate 2.9%
Information Media and Telecommunications 3.0%
Mining 8.8%
Other Services1 11.7%
Manufacturing 6.8%
Agriculture, Forestry and Fishing 2.4%
Australia: a diversified, services-based economyAustralia is a services-based economy, with the sector accounting for around 82 per cent of real gross value added (GVA). The country’s sophisticated financial services industry is the largest contributor to its economy, generating nine per cent of its total GVA. Professional, scientific and technical services, education and training, and information media and telecommunications make up almost 15 per cent of total output, demonstrating Australia’s highly skilled, well-educated and innovative workforce.

SECTION 1 GROWTH > 10
GROWTH BY INDUSTRY IN AUSTRALIA’S REAL GROSS VALUE ADDED1
Average annual % growth rate 1991–92 to 2013–14
0 1 2 3 4 5 6 7
Manufacturing
Public Administration and Safety
Education and TrainingOther Services
Electricity, Gas, Water and Waste Services
Rental, Hiring and Real Estate Services
Accommodation and Food ServicesOwnership of Dwellings
Mining
Arts and Recreation ServicesAdministrative and Support Services
Retail Trade
Agriculture, Forestry and Fishing
Wholesale Trade
Health Care and Social Assistance
Information Media and Telecommunications
Transport, Postal and Warehousing
Professional, Scientific and Technical Services
Construction
Financial and Insurance Services
All-Industries Average Growth: 3.3% Per AnnumServices: 3.5% Per Annum
Non-Services: 2.5% Per Annum
5.0
5.0
4.8
5.1
4.2
4.2
3.5
3.7
3.8
3.4
3.4
3.2
3.0
2.8
2.7
2.6
2.2
1.4
1.0
% growth rate
2.1
1. Annual total to June quarter each yearNote: Mining sector GVA measures the production side of national accounts. This data does not capture the full value of output related to mining production. Expenditure-based estimates, which combine exports and investment by the mining sector (minus the imported component of mining investment), suggest the sector realised real-term annual growth for the period from 1981 to 2011 of 5.5 per cent as compared with three per cent for the non-mining sector. (Source: Reserve Bank of Australia, Statement of Monetary Policy, August 2011, page 49).
Source: Australian Bureau of Statistics, Cat. No. 5204.0 – Australian System of National Accounts, 2013–14 (released 31 October 2014), Table 5. Gross Value Added by Industry; Austrade
Services growth faster than economy as a wholeAustralia’s services sector has seen strong growth over the past two decades. Information media and telecommunications has recorded the highest average annual growth rate since 1992, followed by financial and insurance services, and professional, scientific and technical services. Overall, Australia’s services sector has expanded by an average of 3.5 per cent per annum, outpacing the all-industries average of 3.3 per cent.

SECTION 1 GROWTH > 11
0
20
40
60
80
100
120
140
160
180
Gre
ece
Japa
n
Port
ugal
Italy
Irela
nd
Fran
ce
USA
3
Belg
ium
Spai
n
UK
Ger
man
y
Sout
h Af
rica
Mex
ico
Can
ada3
Net
herla
nds
Braz
il
Sout
h Ko
rea
New
Zea
land
Switz
erla
nd
Turk
ey
Aust
ralia
3
Den
mar
k
Peru
166.6
140.1
123.6
114.0
93.1 90.685.1 85.0
80.9
68.8
51.646.5 43.2
39.1 35.9 35.6 32.927.2 26.7 24.5
16.69.6
3.2
% o
f GDP
GENERAL GOVERNMENT NET DEBT1 – 2015F
As a percentage of GDP
F = Forecast1. IMF staff estimates and projections. Projections are based on staff assessment of current policies2. Gross debt as a percentage of GDP3. For cross-country comparability, gross and net debt levels reported by national statistical agencies for countries that have adopted the 2008 System of National Accounts (Australia, Canada and USA) are adjusted to exclude unfunded pension liabilities of government employees’ defined benefit pension plans
Source: International Monetary Fund, Fiscal Monitor October 2014, Statistical Tables 8 and 16; Austrade
Advanced Economies Average: 74.1 G20 Advanced 81.8 Euro Area 74.0 G7 86.5Emerging Economies Average: 18.0 Asia 43.92
Europe 24.5 Latin America 31.6 G20 Emerging 23.0
Australian government debt is one of the world’s lowestIn its October 2014 Fiscal Monitor, the International Monetary Fund estimated that the Australian Government’s net debt would be 16.6 per cent of GDP in 2015, well below the 74.1 per cent forecast for advanced economies. The low public sector debt reinforces Australia’s healthy financial position and sound economic credentials, and underpins its strong ratings.

SECTION 1 GROWTH > 12
AUSTRALIA’S GLOBALLY SIGNIFICANT INDUSTRIES
AUSTRALIA’S INVESTMENT FUND ASSETS (US$1.8 trillion, June 2014) – THIRD LARGEST IN THE WORLD
Source: Investment Company Institute, Worldwide Mutual Fund Assets and Flows
MERCHANDISE EXPORT – FUELS AND MINING (US$161.6 billion, 2013)
– TOP 4 IN THE WORLD
Source: World Trade Organization Statistics Database
FOREIGN STUDENTS IN TERTIARY EDUCATION (7.1% of the world’s total, 2012)
– FOURTH LARGEST IN THE WORLD
Source: UNESCO, Institute for Statistics
Australia: an important contributor to the global growth sectors of the futureAustralia is a global leader in five significant and diverse sectors: agribusiness, education, tourism, mining and wealth management. Ongoing demand across these sectors is expected to drive trade and investment in Australia and globally.
INTERNATIONAL TOURISM EXPENDITURE (US$28.4 billion, 2013)
– EIGHTH LARGEST IN THE WORLD
Source: UNWTO Tourism Highlights 2014 Edition
MERCHANDISE EXPORT – AGRICULTURAL PRODUCTS (US$37.6 billion, 2013)
– TOP 15 IN THE WORLD AGRICULTURAL PRODUCT CATEGORIES
Source: World Trade Organization Statistics Database

SECTION 1 GROWTH > 13
A global leader in resources and energy Australia’s abundant resources and proximity to Asia underpin its position as a major global exporter of minerals and energy resources and products. In 2012–13, the country’s total resources and energy exports exceeded A$170 billion, with around 85 per cent of these exports (A$145 billion) going to Asian countries, including China, Japan and South Korea. Australia has the world’s largest share of iron ore, uranium, gold, zinc and nickel reserves.
AUSTRALIA’S ENERGY AND RESOURCES SECTOR
1. US Energy Information Administration, data is 2013, other data is 2012 from Geoscience Australia, Australia’s Mineral Resource Assessment 2013
Source: Bureau of Resources and Energy Economics (BREE), Resources and Energy Quarterly, September Quarter 2014, Table 1.3; Data Files and Previous Data Files, Tables 15a and 15b; Austrade
0
20
40
60
80
100
120
140
160
A$ b
illio
n, fo
b
EnergyResources
F = BREE forecastZ = BREE projection
2000
–01
2001
–02
2002
–03
2003
–04
2004
–05
2005
–06
2006
–07
2007
–08
2008
–09
2009
–10
2010
–11
2011
–12
2012
–13
2013
–14
2014
–15F
2015
–16Z
2016
–17Z
2017
–18Z
2018
–19Z
Commodity Reserves World Ranking Iron ore 44,650 Mt 1Uranium 1,174 Kt 1 Gold 9,909 t 1 Zinc 64.1 Mt 1Nickel 17.7 Mt 1Copper 91.1 Mt 2 Bauxite 6,281 Mt 2Coal (black) 61,082 Mt 5 Shale oil1 18 bn barrels 6Shale gas1 437tn cubic ft 7

SECTION 1 GROWTH > 14
Clean, green and safe source of agricultural and food exports Australian agrifood exports for 2012–13 reached A$39 billion, with nine of the top 10 destination markets (more than 50 per cent of exports) in Asia. Global food consumption is expected to grow 75 per cent between 2007 and 2050, with 40 per cent of the increased demand to come from China. Australia’s proximity to Asia and reputation as a safe and secure source of quality produce and premium products ensure the country is well placed to capitalise on this growth.
TOP 10 EXPORT DESTINATIONS FOR AUSTRALIAN AGRIFOOD
$2.3b5. US
1. CHINA
4. KOREA2. JAPAN
9. HONG KONG
10. TAIWAN
6. NEW ZEALAND
7. MALAYSIA
8. SINGAPORE
3. INDONESIA
$719.0%
.3b
$2.4b
$0.7b
$4.1b
$0.9b
4b$1.
$1.0b
$2.6b
$1.0b
10.2%-0.2% -1.8%
2.3%
7.1%
1.3%
7.4%
2.6%
13.4%
Compound Annual Growth Rate from 2007–08 to 2012–13
TURNOVER(A$ billion)
EXPORTS(A$ billion)
TOTAL : $163.4b1
$63.0b$95.2b
TOTAL : $38.5b$17.2b$21.8b unprocessed
processed
1. Including agriculture, forestry and fishing support services (A$5.2 billion)
Sources: Exports based on DFAT publication Trade in Primary and Manufactured Products 2012–13; Turnover based on ABS Catalogue 8155 Australian Industry 2012–13 (released 28 May 2014); Austrade

SECTION 1 GROWTH > 15
International tourism expenditure surgedAustralia experienced record tourism expenditure in 2013–14, driven by strong growth from Asian markets such as China, Hong Kong, Malaysia and Singapore. Traditional markets such as the UK and the USA also performed well, up 12.9 per cent and 7 per cent respectively. The forecast to 2017–18 remains robust, with international visitor spending expected to rise by 4.6 per cent to reach A$37 billion (in real terms). China, India and other Asian nations are anticipated to account for the majority of this growth. Total visitor spending (including domestic overnight and day trips) is projected to increase to A$111 billion by 2017–18.
AUSTRALIA’S INTERNATIONAL VISITOR EXPENDITURE BY MARKET
0
1,000
2,000
3,000
4,000
5,000
6,000
7,000
8,000
9,000
Chi
na UK
USA
New
Zea
land
Sout
h Ko
rea
Japa
n
Sing
apor
e
Ger
man
y
Mal
aysi
a
Hon
g Ko
ng
Indi
a
Can
ada
Indo
nesi
a
Fran
ce
Thai
land
Expe
nditu
re (A
$ m
illio
n)
CAG
R (%
)
2013–14 (actual, Left-hand axis)
2017–18 (forecast, Left-hand axis)1
Compound annual growth rate (2012–13 to 2017–18F, Right-hand axis)
0
1
2
3
4
5
6
7
8
9
10
F = Forecast
1. Real term, base = Q1 2014
Source: Tourism Research Australia; Austrade
FORECAST INTERNATIONAL VISITOR EXPENDITURE
A$36.9 billion TOTAL FORECAST TOURISM EXPENDITURE
A$110.8 billion 4.6%1.8% (2012–13 to 2017–18)(2012–13 to 2017–18)

SECTION 1 GROWTH > 16
Australia is one of the top destinations for international studentsAustralia is the fourth most popular destination for students choosing to study overseas, attracting more international students than much larger economies like Germany and Japan. Education services are now one of Australia’s leading exports.
DISTRIBUTION OF FOREIGN STUDENTS IN TERTIARY EDUCATION BY COUNTRY OF DESTINATION – 2012
1. USA 21.1%
Other countries 19.6%
2. UK2 12.2%3. France 7.7%
4. Australia 7.1%
7. Japan 4.3%
6. Russia 5.0%
5. Germany 5.9%
16. Saudi Arabia 1.3%15. Singapore 1.5%
13. Spain 1.6%
8. China 2.5%
12. Netherlands 1.6%
14. UAE1 1.5%
9. Italy 2.2%
10. South Korea 1.7%
11. Austria 1.7%
17. Switzerland 1.3%
1. United Arab Emirates2. United Kingdom of Great Britain and Northern Ireland
Source: United Nations Educational, Scientific and Cultural Organization (UNESCO), Institute for Statistics, Education, Total inbound internationally mobile students, both sexes (data extracted on 11 June 2014); Austrade

SECTION 1 GROWTH > 17
The world’s third largest pool of funds under management – set for growthAustralia’s pool of funds under management (FUM) is the third largest in the world and the largest in the Asian region, according to the Investment Company Institute’s Worldwide Mutual Fund Assets and Flows data. The global significance of Australia’s FUM and the maturity of its funds industry underscore its potential to further develop as a regional funds management centre.
GLOBAL SIGNIFICANCE OF AUSTRALIA’S INVESTMENT FUND ASSETS POOLInvestment fund assets1, US$ billion, June quarter, 2014
342
235157
1,7882AUSTRALIA
ASIAN REGION
CurrentValue
Largestin Asianregion
Australia
66
Taiwan
127
India
41
NewZealand
309
SouthKorea
561
China HongKong
1,453
Singapore
825
Japan
19901995
2000
700
2005
1,456
2010
$1,473bn
GLOBAL
Australia
825
Japan Brazil Ireland
1,030
Canada
1,252
UK
1,580$967bn1,686
1,137
France
1,453
1,686
Singapore
3,313
Luxembourg
15,665
USAHong Kong
3rd largestin theworld1,559
Note: Circles are not to scale. Data between countries is not strictly comparable.1. Refers to home domiciled funds, except Hong Kong and New Zealand, which include home and foreign-domiciled funds. Funds of funds are not included, except for France, Germany, Italy and Luxembourg. In this statistical release, ‘investment fund’ refers to a publicly offered, open-end fund investing in transferable securities and money market funds. It is equivalent to ‘mutual fund’ in the US and ‘UCITS’ (Undertakings for the Collective Investment of Transferable Securities) in the European Fund and Asset Management Association’s statistics on the European investment fund industry.2. Australia’s investment funds in the Investment Company Institute survey only include consolidated assets of collective investment institutions.Sources: Investment Company Institute, Worldwide Mutual Fund Assets and Flows, Second Quarter 2014 (released 2 October 2014); Hong Kong’s data (Non-REIT fund management business – the sum of asset management business and fund advisory business of licensed corporations), sourced from Securities and Futures Commission, Fund Management Activities Survey 2013 (released July 2014); Singapore’s data sourced from Monetary Authority of Singapore, 2013 Singapore Asset Management Industry Survey (released July 2014); Austrade
Australia’s Total Funds under Management: A$2.4 Trillion

SECTION 1 GROWTH > 18
0
20
40
60
80
100
120
140
160
Jun 2005Jun 2004 Jun 2006 Jun 2007 Jun 2008 Jun 2009 Jun 2010 Jun 2011 Jun 2012 Jun 2013 Jun 2014
12.5
20.9 23.030.2
48.544.2
80.2
142.6
134.1
103.8
Oil, Gas, Coal and Other Minerals (70.7%)Bridges, Railways and Harbours (6.8%)Road, Highways and Subdivisions (6.2%)Electricity Generation, Transmission and Distribution (4.5%)Other2 (11.8%)
Construction % Share in June 2014
A$ b
illio
n
118.4
1. Value of work yet to be done by private sector. Rise and fall and other cost variations can lead to increases or decreases in the value of work yet to be done2. Includes water storage supply, sewerage and drainage, pipelines, recreation, telecom, and other heavy industry
Source: Australian Bureau of Statistics, Cat. No. 8762.0, Engineering Construction Activity, Australia, June 2014, Table 09 (released 01 October 2014); Austrade
ENGINEERING CONSTRUCTION PIPELINE ACTIVITY IN AUSTRALIA Forward forecast activity as at June each year1
A strong infrastructure pipelineThe total value of engineering construction projects outstanding is estimated at almost A$104 billion in the June 2014 quarter. Though falling by 23 per cent in 2013–14, the latest value is still eight times the size of the value a decade earlier. The engineering construction sector recorded a compound annual growth rate of about 36 per cent over the decade to 2014.

INNOVATION
02. INNOVATIONHow Australia Compares with Leading OECD Countries: Key Innovation Indicators 21
Australia’s Gross Expenditure on Research and Development 22
World of Research and Development 23
Gross Domestic Expenditure on Research and Development – 2000–2010 24
Relative Impacts of Australian Scientific Publications by Research Field 25
Australian Universities’ World Rankings – 2014 26

Australia is renowned globally as an innovative country, with world-class scientific and academic institutions, high levels of investment in research and development (R&D), modern ICT infrastructure and strong intellectual property protection.
Australia is home to 20 of the world’s top 400 universities. Australian researchers are also driving or collaborating on cutting-edge research and regularly publish their findings in many of the world’s most cited publications.
There is strong support for R&D in Australia, with significant funding from public and private sector organisations and a generous R&D tax incentive.
International partners will find many opportunities to participate in research projects with Australia’s leading universities and science organisations.
Australia’s CSIRO ranks in the Top 1% of the world’s scientific institutions
in 14 of 22 research fields
INNOVATION

SECTION 2 INNOVATION > 21
HOW AUSTRALIA COMPARES WITH LEADING OECD COUNTRIES: KEY INNOVATION INDICATORS
Note: Countries ranked are selected as having the best reputation for innovation according to the GE 2012 Global Innovation Barometer.1. As a percentage of GDP. 2. Published in the most influential 25% of the world’s scholarly journals as ranked by SCImago Journal (2009). 3. Percentage of businesses with ten or more employees; 2011 or latest available year. 4. Percentage of non-residential gross fixed capital formation, total economy.
Sources: (a) OECD, Main Science and Technology Indicators (data extracted 4 June 2014), except Australia which is found in ABS Cat.8111 and 8104; (b) OECD, Science, Technology and Industry Scoreboard 2011; (c) WEF, Global Competitiveness Report 2014–15; (d) OECD, Education at a Glance 2012; (e) Global Innovation Index 2014; (f) InCites™, Thomson Reuters (2014), Benchmarking Report generated August 2014; (g) The Global Innovation Policy Index (2012); (h) Academic Ranking of World Universities (Shanghai Index 2014); (i) OECD Science, Technology and Industry Outlook 2012; (j) OECD Science Technology and Industry Scoreboard 2013
South Australia Canada France UK Germany Japan Korea Sweden USA
High levels of innovation investment (% of GDP) (a) Gross Domestic Expenditure on R&D (GERD)1 2.13 1.69 2.29 1.73 2.98 3.35 4.36 3.41 2.79(a) Higher Education Expenditure on R&D (HERD)1 0.63 0.65 0.47 0.46 0.53 0.45 0.41 0.92 0.39(a) Business Expenditure on R&D (BERD)1 1.24 0.88 1.48 1.10 2.02 2.57 3.40 2.31 1.95
Skilled workforce(d) Proportion of population aged 25–64 attaining 38.3 51.3 29.8 39.4 27.6 46.4 40.4 35.2 42.5
tertiary education(e) Employment in knowledge-intensive services 42.9 43.8 44.8 47.2 43.5 24.9 21.5 47.6 36.3
(% of workforce) (i) S&T occupations as a % of total employment 36.7 30 37 28.1 37.3 14.9 19.3 41.5 35.4
World-class research(b) Publications in top-quartile journals per 1000 inhabitants2 1.3 1.2 0.7 1.2 0.7 0.4 0.4 1.6 0.9(f) Share of world’s top 1% highly cited publications, 6.2 7.4 8.3 14.5 12.7 5.3 3.5 3.2 46.2
natural sciences and engineering(c) Quality of scientific institutions scores 5.8 5.5 5.6 6.3 5.8 5.8 5.0 5.5 6.1(h) Number of universities in Top 100 4 4 4 8 4 3 0 3 52
Entrepreneurship(g) Administrative burden on start-ups (0 = best) 0.25 0.28 0.43 0.19 0.16 0.24 0.52 0.28 0.33(i) Ease of entrepreneurship index 4.9 4.9 4.7 5.2 4.7 4.6 4.9 5.1 4.8
World-class ICT infrastructure (b) Business access to broadband3 97.1 94.9 97.6 93.4 90.6 84.0 98.6 96.8 n/a(b) ICT investment4 13.8 17.0 16.3 23.8 12.7 13.5 11.1 24.7 31.5
A strong record of innovationAustralia’s research institutions have a solid reputation for quality and rank favourably with other leading innovative countries. Australian researchers produce 6.2 per cent of the world’s most cited publications and the country ranks as one of the top in terms of the number of publications in highly influential journals as a percentage of population. Australia has a higher percentage of employed persons in knowledge-intensive services than the USA, Japan and South Korea. Australia also offers quality-enabling ICT infrastructure, high levels of government and private sector research and development (R&D) investment, and a generous R&D tax incentive.

SECTION 2 INNOVATION > 22
0
5
10
15
20
25
30
35
2000–01 2002–03 2004–05 2006–07 2008–09 2011–12
Gro
ss re
sour
ces
devo
ted
to R
&D (A
$ bi
llion
)
BERDGOVERDHERDPrivate non-profit
5.0
2.4
2.80.3
6.9
2.5
3.40.4
8.7
2.5
4.3
0.5
12.6
3.1
5.4
0.6
17.3
3.4
6.8
0.7
18.3
3.5
9.6
0.9
AUSTRALIA’S GROSS EXPENDITURE ON RESEARCH AND DEVELOPMENTA$ billion by category
BERD = Business Expenditure on Research & DevelopmentGOVERD = Government Expenditure on Research & DevelopmentHERD = Higher Education Expenditure on Research & Development
Sources: Australian Bureau of Statistics (ABS), 81040DO001_201112 Research and Experimental Development, Businesses, Australia, 2011–12 (released 6 Sep 2013); ABS Cat No. Research and Experimental Development, Australia, Government and Private Non-Profit Organisations (released 14 June 2013); ABS Cat. N. 8111.0 – Research and Experimental Development, Higher Education Organisations, Australia, 2012 (released 20 May 2014); Austrade
Australian industry: a rapidly growing source of R&D expenditureAustralia’s annual gross R&D expenditure rose by 11 per cent per annum between 2000–01 and 2011–12 to reach A$32 billion. Business Expenditure on R&D (BERD) makes up the largest portion of this figure, rapidly expanding from A$5 billion in 2000–01 to A$18.3 billion in 2011–12. This represents a compound annual growth rate of 12.6 per cent, well above Australia’s nominal GDP growth rate of 6.4 per cent.

SECTION 2 INNOVATION > 23
WORLD OF RESEARCH AND DEVELOPMENTSize of circle reflects the relative amount of annual R&D spending (in 2005 US$ in constant prices and Purchasing Power Parity terms)
Sources: OECD, Main Science and Technology Indicators Database, Brazil’s Ministry of Science, Technology and Innovation and UNESCO Institute for Statistics, June 2013; Austrade
Indonesia India
SouthAfrica Brazil China
Turkey
Mexico
Italy
Russia Spain
New Zealand
Canada
UK
Netherlands
AUSTRALIA
Belgium
Norway
FranceUSA
Germany
Japan
Sweden
SouthKorea
Finland
Denmark
0.0 1.0 1.50.5 2.0 2.5 3.0 3.5 4.0 4.5
Rese
arch
ers
per t
hous
and
peop
le e
mpl
oyed
Gross domestic expenditure on R&D as a percentage of GDP
BRICS
North America
EU
Other OECD
Australia is well placed among leading innovative economiesWith strong R&D expenditure as a percentage of GDP in Purchasing Power Parity terms and a high proportion of researchers, Australia is placed among the leading innovative countries in the world, including the USA, Japan, France and Germany.
8
0
2
4
6
10
12
14
16
18

SECTION 2 INNOVATION > 24
0
3
6
9
12
15
18
21
% C
ompo
und
annu
al g
row
th ra
te: 2
000–
2010
Chi
na18
.1
Turk
ey9.
9
Sout
h Ko
rea
9.4
Taiw
an
Aust
ralia
6.8
Irela
nd
6.87.
2
Sing
apor
e
6.5
Mex
ico
Spai
n
Russ
ia5.
6
Aust
ria5.
3
Finl
and
5.1
3.3
EU (2
8)2.
5
Luxe
mbo
urg
2.3
Italy
2.2
OEC
D –
Aver
age
2.6
Belg
ium
Ger
man
y
2.1
2.1
Fran
ce
1.6
1.6
1.6
1.6
USA
Can
ada
Japa
n
Net
herla
nds
1.5
UK
0.9
8.2
1. Based on gross domestic expenditure on R&D (GERD) at 2005 prices and Purchasing Power Parity terms
Source: OECD, Main Science and Technology Indicators Volume 2014 Issue 1, OECD Publishing, Table 3; Austrade
GROSS DOMESTIC EXPENDITURE ON RESEARCH AND DEVELOPMENT1 – 2000–2010
Australia is one of the fastest-growing R&D spending economiesGross R&D expenditure in Australia has increased on average by seven per cent a year in real terms between 2000 and 2010, almost three times the OECD average of 2.6 per cent. Australia’s expenditure on R&D is one of the fastest growing in the world, reflecting the country’s ongoing commitment to innovation.

SECTION 2 INNOVATION > 25
RELATIVE IMPACTS OF AUSTRALIAN SCIENTIFIC PUBLICATIONS BY RESEARCH FIELD
0.0 0.2 0.4 0.6 0.8 1.0 1.2 1.4 1.6
Global Average: 1.0
Social Sciences, General
Psychiatry/PsychologyNeuroscience and Behaviour
Computer ScienceMathematics
Biology and BiochemistryPharmacology and Toxicology
Molecular Biology and GeneticsImmunology
ChemistryEnvironment/Ecology
EngineeringGeosciences
Clinical MedicineMicrobiology
Agricultural SciencesSpace Science
PhysicsMultidisciplinary
Materials SciencePlant & Animal Science 1.43
1.42
1.42
1.37
1.36
1.34
1.33
1.33
1.31
1.30
1.30
1.28
1.26
1.23
1.23
1.18
1.14
1.12
1.07
1.06
1.05
Source: InCitesTM, Thomson Reuters, data as at 31 March 2014; Austrade
Australian scientific research has a major impactAcross 21 scientific research fields, more than 70 per cent of Australia’s major scientific research publications have a relative impact of at least 20 per cent above the global average. Among Australia’s strongest categories of published research are plant and animal science; materials science; physics; agricultural sciences; and space science.

SECTION 2 INNOVATION > 26
AUSTRALIAN UNIVERSITIES’ WORLD RANKINGS – 2014
Australia’s academic and research institutions are among the best in the worldAustralia ranks fourth behind the USA, UK and Germany for the number of universities in the Times Higher Education World University Rankings 2014–15. Australia is home to 20 of the top 400 universities according to the Times. More than half of the country’s universities are listed in the 2014 Academic Ranking of World Universities top 500, with four in the top 100.
1. The Academic Ranking of World Universities (ARWU) uses six indicators to rank world universities, including the number of alumni and staff winning Nobel Prizes and Fields Medals, number of highly cited researchers selected by Thomson Scientific, number of articles published in journals of Nature and Science, number of articles indexed in Science Citation Index – Expanded and Social Sciences Citation Index, and per capita performance with respect to the size of an institution. More than 1000 universities are ranked by ARWU every year.
2. The Times Higher Education World University Rankings 2014–2015, judge world-class universities across teaching, research, knowledge transfer and international outlook. The rankings employ 13 performance indicators.
Sources: The Academic Ranking of World Universities (Shanghai Index 2014); Times Higher Education World University Rankings 2014–2015; Austrade
The Academic Ranking of World Universities1 – 2014 Institution World Rank
University of Melbourne 44
Australian National University 74
University of Queensland 85
University of Western Australia 88
Monash University 101–150
University of New South Wales 101–150
University of Sydney 101–150
University of Adelaide 151–200
Macquarie University 201–300
Curtin University 301–400
Flinders University 301–400
Griffith University 301–400
James Cook University 301–400
Swinburne University of Technology 301–400
University of Newcastle 301–400
University of Tasmania 301–400
University of Technology, Sydney 301–400
University of Wollongong 301–400
Deakin University 401–500
Times Higher Education World University Rankings2 – 2014–2015Institution World Rank
University of Melbourne 33
Australian National University 45
University of Sydney 60
University of Queensland 65
Monash University 83
University of New South Wales 109
University of Western Australia 157
University of Adelaide 164
University of Technology, Sydney 226–250
University of Newcastle 251–275
Queensland University of Technology 276–300
University of South Australia 276–300
University of Wollongong 276–300
Charles Darwin University 301–350
Deakin University 301–350
Macquarie University 301–350
Curtin University 351–400
Murdoch University 351–400
Swinburne University of Technology 351–400
University of Western Sydney 351–400

TALENT
03. TALENTWorkforce Skill Base Comparisons – 2014 29
Percentage Employed Persons with Tertiary Education by Industry – 2013 30
Australia’s Employed Persons by Industry – 2014 31
Labour Productivity Growth (GDP per Person Employed, % Increase) 32
Australia’s Labour Productivity and Costs – 1991–2014 33
Entry Rates into Tertiary (Theory-Based) Education – 2012 34
International Student Enrolments in Australia by Sector – 2004–13 35
All Overseas Students by Regional Grouping 36
Australia’s Labour Force by Birthplace – 2014 37
Foreign-Born Population 38
Major Languages Spoken in Australian Homes – 2011 39

The Australian labour force is one of the most educated, multicultural and multilingual in the world.
Australia offers a workforce that is equally at home in both Western and Asian cultures. Almost 30 per cent of Australia’s workers were born overseas. Around 2.1 million Australians speak an Asian language and 1.3 million speak a European language in addition to English.
Australia’s higher education enrolment rate ranks in the world’s top 10. The nation’s high-quality education system also makes it the fourth most popular destination for international students. Almost 75 per cent of these students are enrolled in business and technology-related courses.
With a ready supply of smart, skilled and culturally aware workers, companies can build an Australian labour force with ease.
Almost 40 per cent of Australia’s workforce holds
a tertiary qualification
40%
TALENT

SECTION 3 TALENT > 29
WORKFORCE SKILL BASE COMPARISONS – 2014
1. Awarded in physics, physiology and medicine or economics per million people (updated May 2014)
Sources: (a) World Economic Forum, Switzerland and Harvard University, Global Competitiveness Report 2014–15 (updated September 2014, 144 economies); (b) International Institute for Management Development (IMD), Switzerland, IMD World Competitiveness Online 1995–2014 (updated May 2014, 60 economies); (c) The United Nations Development Programme (UNDP), Human Development Report 2014 (published 24 July 2014, 187 economies), Table 1; Austrade
South Hong Australia USA UK China Japan Korea India Kong Singapore
Global Competitiveness Report 2014–15 Ranking(a) in:
Secondary Education Enrolment Rate 1 59 54 72 25 48 106 73 16
Tertiary Education Enrolment Rate 6 3 36 85 39 2 87 43 10
Quality of Scientific Research Institutions 9 4 2 39 7 27 52 32 11
Higher Education and Training 11 7 19 65 21 23 93 22 2
Reliance on Professional Management 13 12 10 43 18 49 77 27 6
World Competitiveness Yearbook 2014 Ranking(b) in:
Education System 10 21 23 48 27 29 35 16 3
Foreign High-skilled People 11 2 8 18 48 43 39 9 3
Ethical Practices 12 15 13 33 8 54 52 24 18
Nobel Prizes per Capita1 12 6 5 25 19 =27 26 17 =27
UNDP’s Human Development Report 2014 Ranking(c) in:
Human Development Index 2 5 14 91 17 15 135 15 9
World’s highest secondary education enrolment rate International studies recognise the high levels of skill and education that make up Australia’s workforce. According to the World Economic Forum’s Global Competitiveness Report 2014–15, Australia’s secondary education enrolment rate is the world’s highest. Australia also ranks second in the United Nations Development Programme’s Human Development Report 2014, which measures a country’s investment in its people.

SECTION 3 TALENT > 30
0 10 20 30 40 50 60 70 80
Construction
Accommodation and Food Services
Retail Trade
Agriculture, Forestry and Fishing
Other Services
Manufacturing
Transport, Postal and Warehousing
Mining
Wholesale Trade
Administrative and Support Services
Rental, Hiring and Real Estate Services
Arts and Recreation Services
Electricity, Gas, Water and Waste Services
Public Administration and Safety
Information Media and Telecommunications
Financial and Insurance Services
Health Care and Social Assistance
Professional, Scientific and Technical Services
Education and Training
All-Industries Average: 39%
73.1
69.6
59.5
58.4
53.6
47.7
37.7
36.4
34.8
28.4
27.5
26.9
26.2
25.9
23.1
21.9
21.1
20.5
14.3
PERCENTAGE EMPLOYED PERSONS WITH TERTIARY EDUCATION BY INDUSTRY1 – 2013
1. In this statistical release, tertiary education refers to Advanced Diploma/Diploma or higher
Source: Australian Bureau of Statistics, Cat. No. 62270 DO 001-201205, Education and Work, Australia, May 2013, Table 11 (released 29 November 2013); Austrade
Australia offers smart, skilled workersAustralia has one of the most highly educated workforces in the world, with almost 40 per cent of workers on average holding a tertiary qualification or advanced diploma. In five major sectors, including education and training; professional, scientific and technical services; financial and insurance services; healthcare; and public administration, over half the workforce has a tertiary qualification or higher.

SECTION 3 TALENT > 31
A highly diverse workforceMore than 85 per cent of Australians are employed in the services sector. Almost 40 per cent of people work in sectors with a higher than industry average tertiary education, such as education and training; professional, scientific and technical services; financial and insurance services; healthcare; and public administration.
AUSTRALIA’S EMPLOYED PERSONS BY INDUSTRY – 2014Total employed persons (11,634,500, August 2014, trend terms)
1. Including Administrative and Support Services (3.3%); Rental, Hiring and Real Estate Services (1.9%), Arts and Recreation Services (1.7%), Electricity, Gas, Water and Waste Services (1.2%) and Other (4.3%)
Source: Australian Bureau of Statistics, Cat. No. 6291.0.55.003 Labour Force, Australia, Detailed, Quarterly, Table 04. Employed persons by Industry – Trend, Seasonally Adjusted, Original, Time Series Workbook (released 18 Sep 2014); Austrade
Retail Trade 10.7%
Construction 9.0%
Health Care and Social Assistance 12.2%
Professional, Scientificand Technical 8.1%
Accommodation and Food Services 6.6% Education and Training 8.0%
Financial and Insurance Services 3.6%
Wholesale Trade 3.4%
Information Media andTelecommunications 1.8%
Public Administration and Safety 6.2%
Transport, Postal and Warehousing 5.2%
Mining 2.1%
Other Services1 12.4%
Manufacturing 7.9%
Agriculture, Forestry and Fishing 2.8%

SECTION 3 TALENT > 32
LABOUR PRODUCTIVITY GROWTH (GDP PER PERSON EMPLOYED, % INCREASE)
A strong platform for increased productivity levelsAustralia’s labour productivity growth in terms of GDP per person employed is expected to outperform many other developed economies in 2014, according to the latest OECD Economic Outlook. Australia’s labour productivity is supported by a highly skilled, innovative, multilingual workforce and long-term investment in education and training.
F = Forecast
Source: OECD Economic Outlook, Volume 2014 Issue 1, Annex Table 12. Labour productivity in the total economy, version 1 (last updated: 28 April 2014); Austrade
2014FTen-Year Average 2004 to 2013
Sout
h Ko
rea
Aust
ralia
Tota
l OEC
D
Mex
ico
Italy
Pola
nd
New
Zea
land
Ger
man
y
Swed
en UK
Turk
ey
Japa
n
Den
mar
k
Nor
way
Can
ada
Euro
Are
a
Icel
and
Fran
ce
Finl
and
Belg
ium
USA
Spai
n
Aust
ria
Switz
erla
nd
Gre
ece
Net
herla
nds
Luxe
mbo
urg
Port
ugal
Irela
nd
-0.6
-0.3
-0.0
0.3
0.6
0.9
1.2
1.5
1.8
2.1
2.4
2.7
Aver
age
annu
al g
row
th ra
te %

SECTION 3 TALENT > 33
AUSTRALIA’S LABOUR PRODUCTIVITY AND COSTS – 1991–2014As at 30 June each year, trend terms
80
90
100
110
120
130
140
150
160
Inde
x, J
une
1991
= 1
00
Labour Productivity – GDP per Hour Worked
Real Unit Labour Costs
1991
1992
1993
1994
1995
1996
1997
1998
1999
2000
2001
2002
2003
2004
2005
2006
2007
2008
2009
2010
2011
2012
2013
2014
Source: Australian Bureau of Statistics, Cat. No. 5206.0 – Australian National Accounts: National Income, Expenditure and Product, Table 1. Key National Accounts Aggregates, Time Series Workbook (released 3 September 2014); Austrade
Growth in productivity outpacing labour costsAustralia has enjoyed a sustained period of labour productivity growth exceeding growth in real wages. Over Australia’s 23 years of consecutive economic growth, labour productivity has recorded a compound annual growth rate of 1.8 per cent per annum, while real unit labour costs have fallen by 0.5 per cent each year. Australia has experienced particularly strong labour productivity growth over the past two years, with growth of 1.9 per cent in 2012–13 and 2.6 per cent in 2013–14. During this same period, real unit labour costs have broadly remained stable, indicating that effective cost of labour has remained in line with productivity improvements.

SECTION 3 TALENT > 34
ENTRY RATES INTO TERTIARY (THEORY-BASED) EDUCATION – 2012Tertiary education in largely theory-based programs
0
10
20
30
40
50
60
70
80
90
100
110
Expe
cted
% o
f pop
ulat
ion
Domestic StudentsInternational Students
Aust
ralia
New
Zea
land
Nor
way
Den
mar
k
USA
1,2 UK
Russ
ia1,3
Sout
h Ko
rea1
Finl
and1
Net
herla
nds
Port
ugal
Swed
en
OEC
D av
erag
e
Spai
n
Japa
n1,3
Italy
1
Irela
nd
Ger
man
y
Aust
ria
Switz
erla
nd
Fran
ce1
Belg
ium
1
Indo
nesi
a1
Luxe
mbo
urg1
Chi
na1,3
76.0
26.1
60.9
17.4 4.9
65.2
8.9
23.69.3
58.31.8
47.2
33.1
11.3
19.0
71.8 71.2 69.0 68.5
43.9
66.0
56.0
8.0
55.8 55.2
5.1
52.1
45.9
40.7
49.7 51.67.3 12.0 2.3
40.8
33.6
27.6 27.0
18.3
Note: Entry rates represent the percentage of an age cohort that is expected to enter a tertiary program over a lifetime.1. New entrants data for international students is not specified2. The entry rates for tertiary type-A programs include the entry rates for tertiary type-B programs. Type-A refers to largely theory-based programs designed to provide qualifications for entry to advanced research programs and professions with high skill requirements, such as medicine, dentistry or architecture. Duration >3 years full-time and not exclusively offered at universities. Type-B refers to shorter programs focused on practical, technical or occupational skills for direct entry into the labour market, although some theoretical foundations may be covered. Minimum 2 years full-time equivalent at the tertiary level3. New entrants data by age is not specifiedSource: OECD, Education at a Glance 2014, Table C3.1, (last updated 4 September 2014); Austrade
Global leader for tertiary education entry ratesAustralia has one of the highest entry rates into tertiary type-A education in the world at 102 per cent, including international students. This is well above the OECD average (58 per cent), the USA (71 per cent) and the UK (68 per cent). Australia’s tertiary education entry rate is also much higher than Asian countries such as South Korea (69 per cent), Japan (52 per cent) and China (18 per cent).

SECTION 3 TALENT > 35
A broad and growing international education sectorAustralia’s international education sector experienced strong increases in student enrolments across all sub-sectors, including higher education. The total number of enrolled students in Australia reached almost half a million in the year to July 2014, a 5.5 per cent annual growth rate since 2004. About half of all foreign students attended universities and other higher education institutions in 2014.
INTERNATIONAL STUDENT ENROLMENTS IN AUSTRALIA BY SECTOR – 2004–13In the year to July
1. English Language Intensive Courses for Overseas Students2. Vocational Education and Training
Source: Department of Education, International Student Data (www.aei.gov.au/research/International-Student-Data/Pages/default.aspx); Austrade
0
100,000
200,000
300,000
400,000
500,000
600,000
2004 2005 2006 2007 2008 2009 2010 2011 2012 2013 2014
Gro
ss re
sour
ces
devo
ted
to R
&D (A
$ bi
llion
)
Non-awardELICOS1
SchoolsVET2
Higher Education
Compound Annual Growth Rate Since 2004 = 5.5%

SECTION 3 TALENT > 36
ALL OVERSEAS STUDENTS BY REGIONAL GROUPING1
Enrolled in Australian Higher Education Courses2 – Onshore and Offshore, Full-Year 2013
0
20,000
40,000
60,000
80,000
100,000
120,000
140,000
North-EastAsia
South-EastAsia
Southern and
Central Asia
North Africaand
Middle East
Americas Sub-SaharanAfrica
North-WestEurope
Southernand
Eastern Europe
Oceaniaand
Antarctica
Other
Total Overseas Students: 328,402Onshore students 243,617Offshore students 84,785% change of all students – 2012–13 1.5%% share of top 20 sources 85.5%% share of Asian students in top 20 81.3%% of students from China 28.6%
Top Five Enrolled Courses: 272,665Management & Commerce 164,425Engineering & Related Technology 31,680Society & Culture 26,879Information Technology 24,843Health 24,838
121,001
104,494
17,282 16,81910,906 10,304
2,998 2,973 2,451
39,167
Num
ber o
f enr
olm
ents
1. All Overseas Students by Country of Permanent Home Residence are all students not classified as Domestic.2. This series – ‘Students: Selected Higher Education Statistics’ – contains statistics relating to students enrolled in higher education courses in each Australian Higher Education Provider.
Source: Department of Industry, Student 2013 Full Year: Selected Higher Education Statistics Publication, Tables 7.2, 7.4 and 7.5; Austrade
A first choice higher education destinationAustralia is a ‘first choice’ education destination across the Asian region. With around three-quarters of the 328,000 international students in Australia studying management, commerce, engineering or information technology, the country is a hub for business and technology-related education in the region.

SECTION 3 TALENT > 37
AUSTRALIA’S LABOUR FORCE BY BIRTHPLACE – 2014Total labour force as at August 2014: 12,352,700
AustralianBorn71.2%
OverseasBorn28.8%
Americas 1.4%
Sub-Saharan Africa 1.8%
North-West Europe1 1.2%
North Africa & The Middle East 1.3%
Southern & Central Asia 4.0%
North-East Asia 2.9%
Southern & Eastern Europe 2.2%
South-East Asia 4.1%
Oceania & The Antarctic 3.8%
UK & Ireland 6.2%
1. Excluding UK and Ireland
Source: Australian Bureau of Statistics, Cat. No. 6291.055.001 – Labour Force, Australia, Detailed – Electronic Delivery, September 2014, data cubes LM6 (released 16 October 2014); Austrade
A culturally diverse labour forceMore than a quarter of Australia’s labour force of 12.4 million people was born overseas. Many foreign-born workers are from Asia or Europe, enriching Australia’s reputation for multilingual, multicultural workplaces.

SECTION 3 TALENT > 38
FOREIGN-BORN POPULATIONAs a percentage of total population – 2011 or latest available year
Source: The Organisation for Economic Co-operation and Development (OECD), Key statistics on migration in OECD countries, Stocks and flows of immigrants, 2001–2011, Table A.4. Stocks of foreign-born population in OECD countries and the Russian Federation; Austrade
0 5 10 15 20 25 30 35 40 45
42.127.3
23.926.7
23.620.1
16.816.0
15.114.9
14.613.113.0
12.412.0
11.611.4
9.08.3
7.97.9
6.64.9
4.72.2
1.80.9Mexico
PolandChile
HungaryFinlandGreeceRussia
DenmarkPortugal
ItalyNetherlands
FranceUK
NorwayUSA
GermanySpain
BelgiumSwedenAustriaIreland
CanadaNew Zealand
IsraelAustralia
SwitzerlandLuxembourg
Most culturally diverse country in the OECDAustralia is one of the most culturally diverse countries in the OECD. The availability of multilingual, culturally diverse and highly skilled personnel means Australia offers access to a workforce well equipped with the cultural understanding and language capabilities to service international businesses in their own languages.

SECTION 3 TALENT > 39
MAJOR LANGUAGES SPOKEN IN AUSTRALIAN HOMES1 – 2011
1. This list of languages consists of the ‘Most common languages spoken at home’ responses reported in the 2006 Census. The count is based on place of usual residence 2. Excluding languages not identified individually, ‘Inadequately described’ and ‘Non-verbal, so described’. Total includes other languages not in the tableSource: Australian Bureau of Statistics, Cat. No. 2001, Census of Population and Housing, Basic Community Profiles (released 21 June 2012); Austrade
Major Asian Languages2 2,164,235
Chinese 651,328
Indo-Aryan 382,844
Arabic 287,178
Vietnamese 233,388
Tagalog and Filipino 136,860
Dravidian (including Tamil) 100,375
Korean 79,786
Iranic languages 71,933
Indonesian 55,869
Japanese 43,692
Thai 36,680
Assyrian 31,323
Major European Languages2 1,273,420
Italian 299,833
Greek 252,217
Spanish 117,497
German 80,370
Macedonian 68,846
Croatian 61,548
Turkish 59,624
French 57,740
Serbian 55,116
Polish 50,692
Russian 44,059
Dutch 37,249
One in 10 Australians speak an Asian language at homeAustralia’s linguistic diversity is nationwide, ensuring a ready supply of personnel with foreign language skills in all major centres. More than 2.1 million Australians speak an Asian language at home – almost 10 per cent of the total population – and more than 650,000 Australians speak a Chinese language. Almost 1.3 million Australians speak a European language in addition to English at home, with Italian, Greek and Spanish the most common languages spoken.

LOCATION
04. LOCATIONAustralia’s Trade by Broad Sector and Top Five Commodities 42
Australia’s Exports and Imports of Goods and Services 43
Australia: A Partner for Growth in Asia 44
Total Foreign Investment Stock in Australia – 1994–2014 45
Australia’s Share of Global Foreign Direct Investment Stock – 2003–13 46
Main Sources of Foreign Direct Investment Stock in Australia – 2008–13 47
Australia’s International Visitors and Total Trip Expenditure by Country of Residence – 2013–14 48

LOCATIONAustralia has developed strong commercial ties with its Asian neighbours. Ten of Australia’s top 12 export markets are within the region. Australian businesses understand these markets, offering the benefits of experience and established connections. At the same time, Australia maintains well-established links with traditional trading partner nations in Europe and North America.
Existing and new bilateral trade agreements are also set to support the flow of goods, services and investments between Australia and its major Asian trading partners, particularly Japan, South Korea and China.
Australia remains a leading destination for international investment and tourism, with Asia now a fast-growing source of foreign direct investment and overseas visitors.
Australia’s location also bridges the world’s major time zones, offering 24-hour access for global organisations with round-the-clock operations.
Top trading partners – China, Japan, USA, South Korea, Singapore
SECTION 4 LOCATION > 42
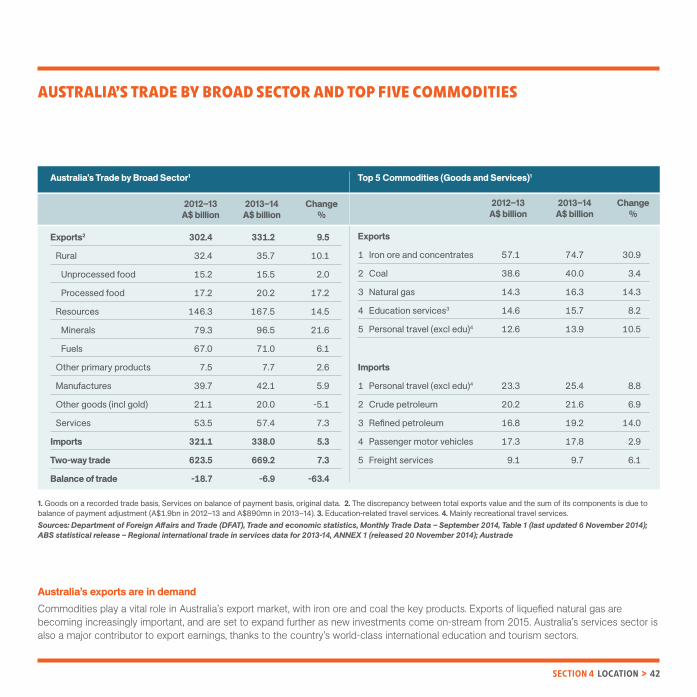
Australia’s exports are in demandCommodities play a vital role in Australia’s export market, with iron ore and coal the key products. Exports of liquefied natural gas are becoming increasingly important, and are set to expand further as new investments come on-stream from 2015. Australia’s services sector is also a major contributor to export earnings, thanks to the country’s world-class international education and tourism sectors.
AUSTRALIA’S TRADE BY BROAD SECTOR AND TOP FIVE COMMODITIES
Australia’s Trade by Broad Sector1
2012–13 2013–14 Change A$ billion A$ billion %
Exports2 302.4 331.2 9.5
Rural 32.4 35.7 10.1
Unprocessed food 15.2 15.5 2.0
Processed food 17.2 20.2 17.2
Resources 146.3 167.5 14.5
Minerals 79.3 96.5 21.6
Fuels 67.0 71.0 6.1
Other primary products 7.5 7.7 2.6
Manufactures 39.7 42.1 5.9
Other goods (incl gold) 21.1 20.0 -5.1
Services 53.5 57.4 7.3
Imports 321.1 338.0 5.3
Two-way trade 623.5 669.2 7.3
Balance of trade -18.7 -6.9 -63.4
Top 5 Commodities (Goods and Services)1
2012–13 2013–14 Change A$ billion A$ billion %
Exports
1 Iron ore and concentrates 57.1 74.7 30.9
2 Coal 38.6 40.0 3.4
3 Natural gas 14.3 16.3 14.3
4 Education services3 14.6 15.7 8.2
5 Personal travel (excl edu)4 12.6 13.9 10.5
Imports
1 Personal travel (excl edu)4 23.3 25.4 8.8
2 Crude petroleum 20.2 21.6 6.9
3 Refined petroleum 16.8 19.2 14.0
4 Passenger motor vehicles 17.3 17.8 2.9
5 Freight services 9.1 9.7 6.1
1. Goods on a recorded trade basis, Services on balance of payment basis, original data. 2. The discrepancy between total exports value and the sum of its components is due to balance of payment adjustment (A$1.9bn in 2012–13 and A$890mn in 2013–14). 3. Education-related travel services. 4. Mainly recreational travel services. Sources: Department of Foreign Affairs and Trade (DFAT), Trade and economic statistics, Monthly Trade Data – September 2014, Table 1 (last updated 6 November 2014); ABS statistical release – Regional international trade in services data for 2013-14, ANNEX 1 (released 20 November 2014); Austrade

SECTION 4 LOCATION > 43
AUSTRALIA’S EXPORTS AND IMPORTS OF GOODS AND SERVICES1, 2
1. Trade in goods is on a recorded trade basis. 2. Excludes selected confidential export (June 2013 onwards) and import commodities (September 2008 onwards) from partner country totals. Therefore movements in the confidential country totals may not reflect the true pattern of trade. 3. CAGR = Compound annual growth rate. 4. UAE = United Arab Emirates. 5. Country group totals include actual partner country export totals for 2013 and imports from September 2008 onwards for selected countries only. 6. Services data EU15 from 1986–87 to 2003–04, EU25 from 2004–05 to 2005–06, EU27 from 2006–07 to Aug 2013, EU28 from Sep 2013 onwards.Source: Australian Bureau of Statistics (ABS) trade data on DFAT STARS database, ABS catalogue 5368.0.55.003 and unpublished ABS data (released 20 November 2014); Austrade
Cumulative % Change CAGR %3
Selected A$ billion % Share Share % 2012–13 2008–09 Rank Economies 2008–09 2009–10 2010–11 2011–12 2012–13 2013–14 2013–14 2013–14 to 2013–14 to 2013–14
1 China 83.0 90.1 113.7 128.2 131.1 159.7 23.9 23.9 21.8 14.02 Japan 75.7 59.1 68.0 75.9 69.4 72.2 10.8 34.7 4.0 -0.93 USA 54.4 48.3 50.5 57.6 54.8 58.2 8.7 43.3 6.1 1.44 South Korea 28.2 25.8 31.9 33.3 30.5 34.6 5.2 48.5 13.5 4.25 Singapore 26.7 22.1 23.5 28.9 29.0 29.5 4.4 52.9 1.6 2.16 New Zealand 21.9 20.9 21.1 21.6 21.0 22.7 3.4 56.3 8.0 0.77 UK 29.9 21.6 21.9 24.4 21.9 20.3 3.0 59.3 -7.3 -7.58 Malaysia 14.7 14.2 15.7 17.2 17.1 19.9 3.0 62.3 17.0 6.39 Thailand 18.7 20.3 19.0 17.7 19.4 18.8 2.8 65.1 -3.0 0.110 Germany 15.5 14.7 14.8 15.8 15.6 16.8 2.5 67.7 7.8 1.611 Indonesia 11.7 11.8 13.8 14.9 14.3 16.0 2.4 70.0 12.0 6.412 India 21.5 22.0 21.5 18.7 17.0 14.8 2.2 72.2 -13.2 -7.313 Taiwan 13.1 11.1 13.5 13.3 12.4 12.6 1.9 74.1 1.1 -0.814 Vietnam 7.0 6.0 6.1 6.5 7.1 9.2 1.4 75.5 29.2 5.815 UAE4 7.5 6.6 7.8 8.6 8.5 8.7 1.3 76.8 1.5 2.8 Other 136.2 122.1 138.7 153.8 154.3 155.3 23.2 100.0 0.6 2.7
All Economies 565.6 516.9 581.4 636.5 623.5 669.2 100.0 – 7.3 3.4 (BOP Basis) APEC5 384.2 356.9 407.3 448.0 438.6 486.1 72.6 – 10.8 4.8 G20 390.1 352.7 399.8 437.1 419.0 460.1 68.8 – 9.8 3.4 East Asia5 291.1 271.7 317.9 348.7 343.4 386.4 57.7 – 12.5 5.8 OECD5 290.4 246.3 268.8 294.6 276.1 290.0 43.3 – 5.0 -0.0 ASEAN5 83.0 78.3 82.6 90.1 92.1 99.0 14.8 – 7.5 3.6 EU285,6 92.6 77.1 80.4 86.7 81.2 83.3 12.5 – 2.6 -2.1
Australia: an open trading economyAustralia’s two-way trade in goods and services in 2013–14 totalled A$669 billion, making up about 42 per cent of GDP – this is more than double the figure recorded a decade earlier at A$316 billion. Australia’s trade with Asia-Pacific Economic Cooperation countries remained strong, with a total value of more than A$486 billion, or 73 per cent of Australia’s total trade.

SECTION 4 LOCATION > 44
Australia
MalaysiaA$7.2Bn
Indonesia
IndiaA$10.5Bn A$5.6Bn
TaiwanA$8.2Bn
ChinaA$107.6Bn
SouthKoreaA$22.5Bn
EuropeA$26.0Bn
(Incl. UK:A$7.9Bn)
AmericaA$22.7Bn
(Incl. USA:A$17.0Bn)Japan
A$51.0Bn
SingaporeA$10.9Bn
NZA$11.5Bn
A$6.9Bn
Source: Country ceiling for foreign currencybonds (Moody’s, 14 November 2014)
A (A1, A2)Baa (Baa2)
AaaAa (Aa1, Aa2, Aa3)
AUSTRALIA: A PARTNER FOR GROWTH IN ASIATen of Australia’s top 12 goods and services export markets were in the Asian region in 2013–14
Note: Country ceiling for Europe and North America only reflect the UK and the USA.
Sources: Australian Bureau of Statistics (ABS) trade data on DFAT STARS database, ABS Cat. No. 5368.0.55.003 and ABS unpublished data (released 20 November 2014); Austrade
Asian demand driving trade growthAustralia’s integration with the dynamic Asian region is driving wealth creation and overall growth. Australia’s goods and services exports totalled A$331 billion in 2013. Of the top 12 export markets in 2013, 10 were in the Asian region and all were rated above investment-grade. Their combined value was around A$242 billion, making up over 73 per cent of Australia’s total export earnings in 2013–14.

SECTION 4 LOCATION > 45
TOTAL FOREIGN INVESTMENT STOCK IN AUSTRALIA – 1994–2014
0
300
600
900
1,200
1,500
1,800
2,100
2,400
2,700
0
30
60
90
120
150
180
210
240
270
A$ b
illio
n
% o
f GDP
Total Investment % of GDP (right-hand axis)
Direct Investment (left-hand axis)
Other Investment1 (left-hand axis)
Jun
1994
Jun
1995
Jun
1996
Jun
1997
Jun
1998
Jun
1999
Jun
2000
Jun
2001
Jun
2002
Jun
2003
Jun
2004
Jun
2005
Jun
2006
Jun
2007
Jun
2008
Jun
2009
Jun
2010
Jun
2011
Jun
2012
Jun
2013
Jun
2014
164.5
89.1
1. Other investment includes portfolio investment and financial derivatives.
Source: Australian Bureau of Statistics, Cat. No. 5302.0 Balance of Payments and International Investment Position, Australia, Table 79. International Investment: Levels of Foreign Liabilities – Financial Year (latest issue released 2 September 2014); Austrade
A high-growth destination for foreign investmentAustralia presently hosts about A$2.6 trillion of foreign investment stock. Both foreign direct investment and portfolio investment have recorded strong growth, up 7.4 per cent and 9.0 per cent each year respectively since 1994. As a percentage of GDP, Australia’s total value of foreign investment stock reached 165 per cent in June 2014, an impressive rise from less than 90 per cent two decades ago.

SECTION 4 LOCATION > 46
AUSTRALIA’S SHARE OF GLOBAL FOREIGN DIRECT INVESTMENT STOCK – 2003–13
1. CAGR = Compound Annual Growth RateSource: United Nations Conference Trade and Development (UNCTAD), UNCTAD Statistics (www.unctad.org/en/pages/Statistics.aspx); Austrade
FDI Stock (US$ billion) FDI as % of GDP FDI Stock – % Market Share % CAGR1
2003 to 13 Economy 2003 2008 2013 2003 2008 2013 2003 2008 2013
World 9,563 15,680 25,464 25.1 25.3 34.2 100.0 100.0 100.0 62.4 10.3Developed economies 7,332 10,857 16,053 24.8 25.9 36.6 76.7 69.2 63.0 47.9 8.2Developing economies 2,085 4,424 8,483 26.3 24.9 30.9 21.8 28.2 33.3 91.8 15.1Transition economies 145 399 928 23.8 17.6 31.7 1.5 2.5 3.6 132.8 20.4 USA 2,455 2,486 4,935 21.2 16.8 29.2 25.7 15.9 19.4 98.5 7.2 UK 635 963 1,606 33.8 35.8 63.4 6.6 6.1 6.3 66.8 9.7 Hong Kong 432 873 1,444 267.4 398.3 523.6 4.5 5.6 5.7 65.3 12.8 France 653 905 1,081 36.4 31.9 39.5 6.8 5.8 4.2 19.5 5.2 China 228 378 957 13.8 8.3 10.3 2.4 2.4 3.8 153.1 15.4 Belgium 351 854 924 112.8 168.2 182.4 3.7 5.4 3.6 8.3 10.1 Germany 395 668 852 16.3 18.4 23.5 4.1 4.3 3.3 27.5 8.0 Singapore 184 455 838 191.4 238.7 294.2 1.9 2.9 3.3 84.1 16.4 Switzerland 162 448 747 48.0 84.5 114.1 1.7 2.9 2.9 67.0 16.5 Brazil 133 288 725 24.0 17.4 32.2 1.4 1.8 2.8 151.9 18.5 Spain 340 589 716 38.4 37.0 52.8 3.6 3.8 2.8 21.6 7.7 Netherlands 458 646 670 85.1 74.1 83.9 4.8 4.1 2.6 3.8 3.9 Canada 289 450 645 32.6 29.1 35.4 3.0 2.9 2.5 43.5 8.4 Australia 237 339 592 42.6 32.2 39.1 2.5 2.2 2.3 74.4 9.6 Russia 97 216 576 22.5 13.0 26.8 1.0 1.4 2.3 166.8 19.5 Italy 188 328 404 12.4 14.2 19.5 2.0 2.1 1.6 23.1 7.9 Indonesia 10 72 230 4.4 14.2 26.5 0.1 0.5 0.9 218.9 36.4 India 33 125 227 5.5 9.7 11.8 0.3 0.8 0.9 81.1 21.4 Thailand 51 97 185 33.7 33.3 45.4 0.5 0.6 0.7 91.9 13.7 Japan 90 203 171 2.1 4.2 3.5 0.9 1.3 0.7 -16.0 6.7 South Korea 66 95 167 10.3 10.2 13.7 0.7 0.6 0.7 76.8 9.7 Malaysia 41 74 145 35.9 31.9 46.6 0.4 0.5 0.6 96.6 13.4 UAE 7 68 105 5.3 21.6 26.9 0.1 0.4 0.4 54.6 31.9 New Zealand 44 52 84 52.4 40.0 46.0 0.5 0.3 0.3 60.9 6.8 Vietnam 19 41 82 47.8 41.7 47.8 0.2 0.3 0.3 97.8 15.8 Taiwan 37 45 63 12.0 11.4 13.0 0.4 0.3 0.2 39.6 5.5 Philippines 11 22 33 13.6 12.5 12.0 0.1 0.1 0.1 49.7 11.1
An attractive destination for FDIAustralia’s global share of foreign direct investment (FDI), measured in US$, was 2.3 per cent in 2013. FDI into Australia was US$592 billion in 2013, up from US$237 billion in 2003. As a percentage of GDP, FDI in Australia remained strong at 39 per cent in 2013 on the back of continued economic expansion and integration with trading partners, particularly the Asian region. Australia’s 74 per cent growth in FDI over the five years to 2013 is well above the 48 per cent growth achieved by other developed economies.
% Change2008 to 13

SECTION 4 LOCATION > 47
MAIN SOURCES OF FOREIGN DIRECT INVESTMENT STOCK IN AUSTRALIA – 2008–13
1. Total FDI for British Virgin Islands (BVI) is confidential in ABS statistics for 2013. However, the ABS has published data for 2012 (levels at A$19.2bn) and net inflows of A$393 million in 2013. DFAT estimates that the BVI direct investment levels for 2013 would be valued at around A$19.5bn and would rank 7th. 2. For rankings after No. 16, the impact of confidential items may change the ordering.CAGR = Compound Annual Growth Rate from 2008 to 2013. NP = not available for publication but included in totals where applicable, unless otherwise indicated. NA = not applicable.
Source: Australian Bureau of Statistics Cat. No. 5352.0 – International Investment Position, Australia: Supplementary Statistics, 2013 (released 1 May 2014); Table 2. Foreign Investment in Australia: Level of Investment by Country and Country Groups by type of investment and year; Austrade
A$ billion % Change % CAGR Economy1 2008 2009 2010 2011 2012 2013 % Share 2012–13 2008–13
1 USA 99.9 98.2 112.0 117.8 131.9 149.5 23.7 13.3 8.4
2 UK 59.6 61.0 53.7 68.8 78.9 86.7 13.8 9.9 7.8
3 Japan 36.7 45.6 51.1 54.1 62.0 63.3 10.0 2.0 11.5
4 Netherlands 19.2 31.4 27.7 29.7 29.7 29.4 4.7 -0.9 8.9
5 Singapore 10.4 16.7 18.8 20.0 23.9 25.2 4.0 5.3 19.3
6 China 3.6 9.1 12.9 14.4 16.1 20.8 3.3 29.0 41.7
7 Switzerland 19.5 17.8 20.9 22.9 22.5 19.1 3.0 -15.3 -0.4
8 Canada 7.3 12.2 14.9 19.0 21.0 16.6 2.6 -21.1 17.9
9 Germany 15.5 18.1 16.8 14.1 13.6 13.8 2.2 1.3 -2.3
10 Bermuda 5.8 9.5 7.5 5.8 6.3 9.6 1.5 52.5 10.6
11 Malaysia NP 4.5 3.7 NP 5.7 7.7 1.2 36.1 NA
12 Hong Kong 9.1 5.4 6.6 7.6 7.3 7.4 1.2 1.3 -4.1
13 France 12.9 13.0 13.0 7.2 6.9 5.5 0.9 -20.0 -15.6
14 Belgium 5.2 5.6 6.2 5.7 4.8 5.4 0.8 11.5 0.5
15 New Zealand 5.6 6.2 6.4 5.3 4.3 5.1 0.8 18.3 -2.0
16 Thailand NP NP NP NP NP 4.6 0.7 NA NA
17 Luxembourg2 NP 3.2 1.5 3.4 4.2 2.4 0.4 -43.4 NA
18 South Korea 1.0 1.3 2.1 NP 2.1 2.0 0.3 -4.5 15.5
19 Sweden 1.7 1.3 1.7 1.5 1.6 1.5 0.2 -7.7 -2.9
20 India 0.1 NP NP NP 1.3 1.2 0.2 -13.3 75.8
Total (all countries) 444.2 489.9 519.7 549.4 591.3 629.9 100.0 6.5 7.2
Traditional markets still strongest, but investment from Asia is increasing Australia’s inward FDI stock reached A$630 billion in 2013, up 40 per cent from 2008 figures. The European Union (including the UK) and the USA remain dominant sources of FDI, with totals of A$156 billion and A$150 billion respectively. Major Asian nations are fast-growing sources of FDI, with China FDI stock recording a compound annual growth rate over the past five years of 42 per cent, followed by Singapore (19 per cent), South Korea (16 per cent) and Japan (12 per cent).

SECTION 4 LOCATION > 48
Record number of visitors provides greater opportunity for investmentOver 6.1 million visitors arrived in Australia in 2013–14, representing an annual growth rate of 7.6 per cent. Of Australia’s top 10 inbound tourist markets, eight are in the Asian region. Visitors from this region account for more than 70 per cent of Australia’s total number of tourists. China is Australia’s second largest inbound tourist market, with over 700,000 visitors in 2013–14. Other Asian markets that recorded double-digit percentage growth in 2013–14 included Singapore, Malaysia, Hong Kong and India. Australia’s traditional tourist markets – the UK and the USA – also performed well, up six per cent and nine per cent to 624,000 and 500,000 arrivals respectively.
AUSTRALIA’S INTERNATIONAL VISITORS AND TOTAL TRIP EXPENDITURE BY COUNTRY OF RESIDENCE1 – 2013–14
1. Estimates are for international visitors aged 15 years and over. 2. Individual percentages may not add to 100 due to rounding.Source: Tourism Research Australia: International Visitors Survey; Austrade
Country of Residence
TotalNew ZealandChinaUKUSASingaporeJapanMalaysiaSouth KoreaHong KongIndiaGermanyIndonesiaCanadaTaiwanFranceScandinaviaThailandItalySwitzerlandNetherlandsOther EuropeOther AsiaOther countries
Year ending Change Year June 2014 % ending Visitors (‘000) % of Visitors2 June 2013–June 2014
6,147 100.0 7.6 1,115 18.1 4.2 708 11.5 10.5 624 10.1 5.8 500 8.1 9.0 319 5.2 15.0 298 4.8 -2.4 277 4.5 23.0 184 3.0 -0.1 181 2.9 17.2 173 2.8 14.7 172 2.8 9.0 133 2.2 8.6 127 2.1 7.5 108 1.8 10.5 108 1.8 5.4 93 1.5 4.8 72 1.2 8.0 70 1.1 7.5 47 0.8 2.8 45 0.7 3.5 207 3.4 4.5 184 3.0 12.9 403 6.5 3.5
Year ending Change Year June 2014 Total % of % ending Trip Expenditure (A$m) Expenditure2 June 2013–June 2014
30,101 100.0 7.4 2,361 7.8 3.2 5,255 17.5 16.3 3,548 11.8 12.9 2,641 8.8 7.0 1,081 3.6 6.8 1,355 4.5 -7.2 1,018 3.4 10.0 1,107 3.7 -9.6 938 3.1 14.2 752 2.5 -2.9 1,023 3.4 11.5 638 2.1 5.4 767 2.5 7.1 618 2.1 1.7 707 2.3 10.3 540 1.8 2.6 378 1.3 17.1 506 1.7 18.5 313 1.0 -1.4 263 0.9 10.4 1,293 4.3 -5.6 973 3.2 12.1 2,025 6.7 11.0

BUSINESS
05. BUSINESSIndex of Economic Freedom World Ranking – 2014 51
Key Indicators of Ease of Doing Business – 2015 52
Business Efficiency and Environment – 2014 53
Worldwide Governance Indicators – 2013 54
Assets of Australian Financial Institutions 55
Australia’s Projected Superannuation Assets, 2012–2033 56
Australian Financial Markets Annual Turnover – 2014 57
Size of Key Stock Markets in Asia – 2014 58
International and Domestic Debt Securities in Asia Pacific – 2014 59

BUSINESSDoing business in Australia is easy.
The country’s efficient and transparent regulatory system provides a safe environment. Its political stability and sound legal and governance frameworks offer a stable and secure setting for business. For six years in a row, Australia has ranked third on the Index of Economic Freedom.
Australia has a sophisticated financial sector that offers access to one of the Asia-Pacific region’s largest pools of bank assets, as well as the world’s fourth largest pension assets pool.
These credentials attract some of the world’s largest organisations to Australia. Eighteen of the Top 20 FT Global 500 companies and eight of the Top 10 Fortune 100 have operations in Australia. One in five businesses in Australia with more than 200 employees is at least 50 per cent foreign-owned.
18,000 foreign companies registered in Australia

SECTION 5 BUSINESS > 51
INDEX OF ECONOMIC FREEDOM WORLD RANKING – 20141
Economic Freedom Score 80 to 100 Free 70 to 79.9 Mostly Free 60 to 69.9 Moderately Free 50 to 59.9 Mostly Unfree 0 to 49.9 Repressed
0 20 40 60 80 100
90.189.4
82.081.6
81.280.2
78.776.576.276.1
75.574.9
74.273.9
73.472.4
71.471.2
69.667.2
63.563.3
60.960.1
58.556.9
55.752.5
51.950.8Vietnam (147)
Russia (140)China (137)India (120)Brazil (114)
Indonesia (100)Philippines (89)
Italy (86)Thailand (72)
France (70)Spain (49)
Malaysia (37)South Korea (31)
UAE (28)Japan (25)
Germany (18)Taiwan (17)
Netherlands (15)UK (14)
USA (12)Denmark (10)
Ireland (9)Mauritius (8)
Chile (7)Canada (6)
New Zealand (5)Switzerland (4)
Australia (3)Singapore (2)Hong Kong (1)
1. The 2014 Index of Economic Freedom covers 186 economies and measures 10 components of economic freedom (Business Freedom, Trade Freedom, Fiscal Freedom, Government Spending, Monetary Freedom, Investment Freedom, Financial Freedom, Property Rights, Freedom from Corruption and Labour Freedom). The 10 component scores are equally weighted and averaged to get an overall economic freedom score for each economy. The number in brackets in the chart indicates the country’s world ranking.
Sources: The Wall Street Journal and The Heritage Foundation, 2014 Index of Economic Freedom; Austrade
Australia’s policies create an environment of economic freedomAustralia ranks third in the 2014 Index of Economic Freedom, a position held for the past six years. The survey states that ‘openness to global trade and investment is firmly institutionalised, supported by a relatively efficient entrepreneurial framework and a well-functioning independent judiciary. Australia has a strong tradition of reliable property rights protection, and the legal system is transparent and evenly applied’. It also states that Australia continues to benefit significantly from its transparent and efficient business environment, and open-market policies.
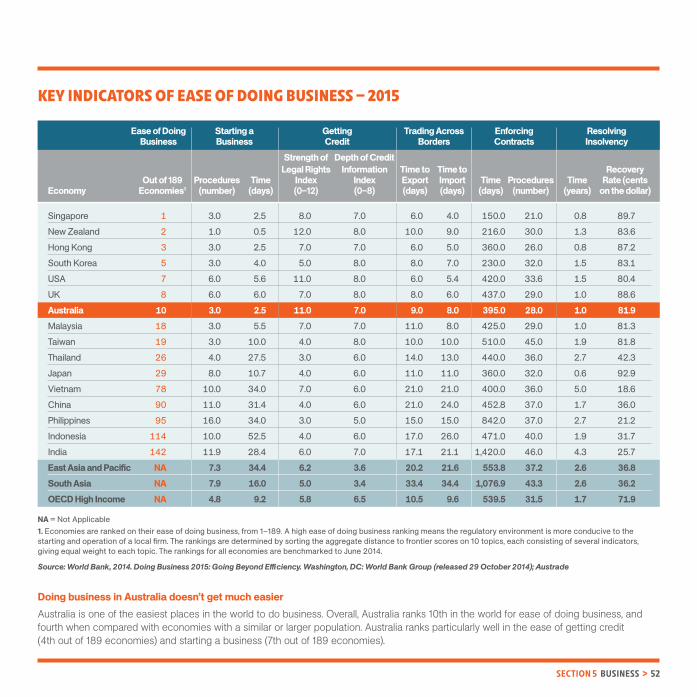
SECTION 5 BUSINESS > 52
KEY INDICATORS OF EASE OF DOING BUSINESS – 2015
NA = Not Applicable 1. Economies are ranked on their ease of doing business, from 1–189. A high ease of doing business ranking means the regulatory environment is more conducive to the starting and operation of a local firm. The rankings are determined by sorting the aggregate distance to frontier scores on 10 topics, each consisting of several indicators, giving equal weight to each topic. The rankings for all economies are benchmarked to June 2014.
Source: World Bank, 2014. Doing Business 2015: Going Beyond Effi ciency. Washington, DC: World Bank Group (released 29 October 2014); Austrade
Ease of Doing Business
Starting a Business
Getting Credit
Trading Across Borders
Enforcing Contracts
Resolving Insolvency
Strength of Depth of Credit Legal Rights Information Time to Time to Recovery Out of 189 Procedures Time Index Index Export Import Time Procedures Time Rate (cents Economy Economies1 (number) (days) (0–12) (0–8) (days) (days) (days) (number) (years) on the dollar)
Singapore 1 3.0 2.5 8.0 7.0 6.0 4.0 150.0 21.0 0.8 89.7
New Zealand 2 1.0 0.5 12.0 8.0 10.0 9.0 216.0 30.0 1.3 83.6
Hong Kong 3 3.0 2.5 7.0 7.0 6.0 5.0 360.0 26.0 0.8 87.2
South Korea 5 3.0 4.0 5.0 8.0 8.0 7.0 230.0 32.0 1.5 83.1
USA 7 6.0 5.6 11.0 8.0 6.0 5.4 420.0 33.6 1.5 80.4
UK 8 6.0 6.0 7.0 8.0 8.0 6.0 437.0 29.0 1.0 88.6
Australia 10 3.0 2.5 11.0 7.0 9.0 8.0 395.0 28.0 1.0 81.9Malaysia 18 3.0 5.5 7.0 7.0 11.0 8.0 425.0 29.0 1.0 81.3
Taiwan 19 3.0 10.0 4.0 8.0 10.0 10.0 510.0 45.0 1.9 81.8
Thailand 26 4.0 27.5 3.0 6.0 14.0 13.0 440.0 36.0 2.7 42.3
Japan 29 8.0 10.7 4.0 6.0 11.0 11.0 360.0 32.0 0.6 92.9
Vietnam 78 10.0 34.0 7.0 6.0 21.0 21.0 400.0 36.0 5.0 18.6
China 90 11.0 31.4 4.0 6.0 21.0 24.0 452.8 37.0 1.7 36.0
Philippines 95 16.0 34.0 3.0 5.0 15.0 15.0 842.0 37.0 2.7 21.2
Indonesia 114 10.0 52.5 4.0 6.0 17.0 26.0 471.0 40.0 1.9 31.7
India 142 11.9 28.4 6.0 7.0 17.1 21.1 1,420.0 46.0 4.3 25.7
East Asia and Pacific NA 7.3 34.4 6.2 3.6 20.2 21.6 553.8 37.2 2.6 36.8South Asia NA 7.9 16.0 5.0 3.4 33.4 34.4 1,076.9 43.3 2.6 36.2OECD High Income NA 4.8 9.2 5.8 6.5 10.5 9.6 539.5 31.5 1.7 71.9
Doing business in Australia doesn’t get much easierAustralia is one of the easiest places in the world to do business. Overall, Australia ranks 10th in the world for ease of doing business, and fourth when compared with economies with a similar or larger population. Australia ranks particularly well in the ease of getting credit (4th out of 189 economies) and starting a business (7th out of 189 economies).

SECTION 5 BUSINESS > 53
BUSINESS EFFICIENCY AND ENVIRONMENT – 2014
Sources: (a) World Economic Forum, Switzerland and Harvard University, Global Competitiveness Report 2014–15 (updated September 2014, 144 economies); (b) Institute for Management Development (IMD), Switzerland, World Competitiveness Online (1995–2014) (updated May 2014, 60 economies); Austrade
South Hong Australia USA UK China Japan Korea India Kong Singapore
Global Competitiveness Report 2014–15 Ranking(a) in:
Legal Rights Index =1 11 =1 85 43 =29 =29 =1 =1
Inflation, Annual % Change =1 =1 =1 =1 62 =1 133 86 =1
Soundness of Banks 3 49 89 63 33 122 101 7 4
Time Required to Start a Business 5 14 62 116 98 18 106 =5 =5
Efficacy of Corporate Boards 8 16 17 78 18 126 94 20 5
Intensity of Local Competition 8 10 5 44 1 13 91 4 20
No. of Procedures to Start a Business =10 =57 =57 135 93 32 131 =10 =10
Regulation of Securities Exchanges 11 30 22 58 15 89 62 3 5
Prevalence of Foreign Ownership 11 41 4 71 27 99 98 5 2
World Competitiveness Yearbook 2014 Ranking(b) in:
Finance – Finance and Banking Regulation 4 21 37 40 29 55 26 6 3
Finance – Financial Risk Factor 4 27 43 48 19 52 44 6 5
Business Legislation – Protectionism 5 17 8 47 22 48 41 10 21
Management Practice – Auditing and Accounting Practices 7 10 21 55 33 59 43 16 4
Management Practice – Corporate Boards 8 26 22 34 41 58 40 15 3
Business Legislation – Competition Legislation 7 14 8 47 6 32 36 29 12
Finance – Corporate Debt 7 8 15 43 20 53 30 10 12
Finance – Shareholders’ Rights 9 10 16 54 =43 56 =43 18 15
A stable, friendly and efficient environment for doing businessAustralia has one of the world’s strongest and most efficient regulatory environments and is rated among the most business-friendly economies. The country ranks highly in terms of legal rights, ease of setting up a business and the soundness of its banks. Australia also has one of the lowest financial risk factors in the world and the fourth highest-ranked finance and banking regulatory system.

SECTION 5 BUSINESS > 54
WORLDWIDE GOVERNANCE INDICATORS1 – 2013
1. Country scores are reported as percentile ranks, with higher values indicating better governance ratings. Percentile ranks indicate the percentage of countries worldwide that score below that country. There are 215 economies surveyed in the report. The six aggregate indicators are based on 31 underlying data sources reporting the governance perceptions of survey respondents and expert assessments worldwide.
Source: The World Bank, Worldwide Governance Indicators, 2014 Update (released 26 September 2014); Austrade
Political Stability 2013 Rank Regulatory Rule of Government Voice and Control of & Absence of by Economy Quality Law Effectiveness Accountability Corruption Violence/Terrorism
Finland 98.6 99.1 100.0 97.2 98.1 97.2New Zealand 98.1 98.1 96.2 98.1 99.5 98.6Norway 94.7 100.0 98.1 100.0 98.6 94.8Sweden 99.0 99.5 98.6 99.1 99.0 90.5Switzerland 94.3 96.7 97.6 98.6 97.6 97.6Luxembourg 95.7 96.2 94.3 97.6 97.1 95.3Denmark 97.6 98.6 99.0 99.5 100.0 78.2Netherlands 96.7 97.2 96.7 96.7 96.2 89.6Canada 95.2 94.8 97.1 95.3 95.2 83.9Australia 97.1 95.7 94.7 94.3 93.8 83.4Germany 92.8 91.9 91.4 93.8 94.3 76.8Singapore 100.0 95.3 99.5 52.1 96.7 95.7Ireland 93.8 94.3 89.0 91.9 90.9 73.9UK 96.2 92.9 90.0 92.4 93.3 63.0Japan 83.3 89.6 93.8 85.3 92.8 81.5Hong Kong 99.5 91.0 95.7 69.2 92.3 74.4USA 86.6 90.5 90.9 83.9 85.2 65.9France 85.2 88.2 89.5 88.6 88.0 61.6Taiwan 84.7 83.9 83.7 73.5 72.7 72.0Spain 78.9 81.0 82.8 77.3 75.1 46.9South Korea 79.9 78.7 82.3 68.2 70.3 56.9UAE 75.1 70.6 83.3 18.5 87.6 75.8Italy 74.6 62.1 67.5 75.8 57.4 64.5Malaysia 72.2 64.5 81.8 37.4 68.4 47.9Brazil 54.5 52.1 51.2 58.8 55.0 37.0Thailand 57.9 51.7 61.2 34.1 49.3 9.0Philippines 51.7 41.7 56.9 47.9 43.5 16.6India 34.0 52.6 47.4 61.1 35.9 12.3Indonesia 46.4 36.5 45.5 48.8 31.6 28.9Vietnam 28.2 39.3 44.0 11.8 36.8 55.9China 42.6 39.8 54.1 5.2 46.9 27.0
Strong governance is attractive for operating regional headquartersThe quality of governance in Australia ranks among the best in the world. Strong governance is key to economic growth and security, providing a drawcard for multinationals expanding their businesses or considering Australia as a base in the Asian region.

SECTION 5 BUSINESS > 55
ASSETS OF AUSTRALIAN FINANCIAL INSTITUTIONS A$ billion
Managed Fund Sources – Consolidated Authorised Deposit-taking Reserve Bank Institutions2 and Total Total Life Other Domestic Other All Financial of Australia Registered Financial Managed Offices and Managed FinancialYear ending June Systems (AFS)1 (RBA) Corporations Funds Industry Superannuation Funds3 Institutions4
Jun–1994 914 34 520 318 227 91 41
Jun–1999 1,577 49 812 611 399 212 105
Jun–2004 2,747 72 1,435 984 570 414 257
Jun–2009 4,891 112 2,873 1,580 935 645 326
Jun–2014 6,386 147 3,537 2,405 1,600 806 297
% of AFS assets 100.0 2.3 55.4 37.7 25.1 12.6 4.7
% of nominal GDP 402.6 9.3 223.0 151.6 100.9 50.8 18.7
% CAGR since 1994 10.2 7.5 10.1 10.6 10.3 11.5 10.4
CAGR = Compound Annual Growth RateNote: The US$/A$ exchange rate was US$0.942 as at 30 June 2014 (sourced from RBA statistics, Table F11); the nominal value of Australia’s GDP in the year to June quarter 2014 was A$1,586 billion. .1. The sum may not be accurate due to rounding errors 2. The combined assets of banks, building societies and credit unions 3. The combined assets of public unit trusts, cash management trusts, common funds, friendly societies and funds managed by Australian investment managers on behalf of Australian entities other than collective investment institutions, and overseas investors 4. The combined assets of general insurance offices and securitisation vehicles
Sources: Reserve Bank of Australia Statistics, B1 Assets of Financial Institutions (updated 1 October 2014); RBA Statistics, B18 Managed Funds (updated 29 August 2014); Australian Bureau of Statistics Cat. No. 5206.0 – Australian National Accounts: National Income, Expenditure and Product, June 2014 (released 3 September 2014), Table 30; Austrade
A sophisticated and substantial finance sector provides access to capitalAustralia’s sophisticated financial services sector has significant depth with assets of around A$6.4 trillion – over four times the country’s nominal GDP. The sector has grown 10 per cent a year over the past two decades, making it Australia’s largest contributor to Gross Value Added and one of its highest growth sectors.

SECTION 5 BUSINESS > 56
AUSTRALIA’S PROJECTED SUPERANNUATION ASSETS, 2012–2033
0
1,000
2,000
3,000
4,000
5,000
6,000
7,000
8,000
2012 2013 2014 2015 2016 2017 2018 2019 2020 2021 2022 2023 2024 2025 2026 2027 2028 2029 2030 2031 2032 2033
Pre-Retirement Assets Post-Retirement Assets
A$ b
illio
n
Source: Deloitte Actuaries & Consultants, September 2013, Dynamics of the Australian Superannuation System: The next 20 years: 2013–2033, Figure 5, Page 12; Austrade
Long-term pension pool growth supports future investment opportunitiesAustralia’s A$1.6 trillion superannuation system is the fourth largest in the world and is a major driver behind Australia’s globally significant funds management industry. This pool of assets is expected to grow to A$7.6 trillion or 180 per cent of GDP over the next two decades.

SECTION 5 BUSINESS > 57
AUSTRALIAN FINANCIAL MARKETS ANNUAL TURNOVER – 2014
0
20
40
60
80
100
120
140
2003–04 2004–05 2005–06 2006–07 2007–08 2008–09 2009–10 2010–11 2011–12 2012–13 2013–14
OTC Markets – Foreign Exchange OTC Markets – Other
Exchange-Traded Markets
34
19
18
34
26
24
42
19
29
47
24
40
46
26
44
44
26
29
41
26
35
45
33
48
40
40
47
42 43
35
47
41
51
A$ tr
illio
n
Australia’s financial markets are among the most sophisticated in the Asian regionOver the five years to June 2014, Australia’s financial markets have expanded, with total annual turnover (over-the-counter and exchange-traded) rising 27 per cent to A$125 trillion. The latest figure is 79 times the size of Australia’s nominal GDP, reflecting the depth of the country’s financial markets.
Source: Australian Financial Markets Association, 2014 Australian Financial Markets Report; Austrade

SECTION 5 BUSINESS > 58
SIZE OF KEY STOCK MARKETS IN ASIA – 2014Market capitalisation of free-floating stocks (US$ billion, 30 September 2014)
Note: The number in brackets is the world ranking of each country or economy (out of 48). Standard & Poor’s capitalisation-weighted indices are float adjusted. Under float adjustment, the share counts used in calculating the indices reflect only those shares available to investors rather than all of a company’s outstanding shares. Float adjustment excludes shares that are closely held by control groups, other publicly traded companies or government agencies.
Source: Standard & Poor’s, S&P Dow Jones Indices World-By-Numbers: September 2014; Austrade
0
200
400
600
800
1,000
1,200
1,400
Australia(8)
China(9)
South Korea (10)
Taiwan(11)
Hong Kong(13)
India(16)
Singapore(20)
Malaysia(25)
Indonesia(29)
Thailand(28)
Philippines(34)
New Zealand (40)
US$
billi
on
USA (1) 21,717 Japan (2) 3,655 UK (3) 3,179 Canada (4) 1,675 France (5) 1,408 Germany (6) 1,305 Switzerland (7) 1,247 Australia (8) 1,123 Global 44,352
1,1231,055
770
631
528
459
261
177144 128
8042
Australia has the second largest stock market in the Asian regionAustralia is home to the largest liquid stock market in the Asian region outside Japan. It is the eighth largest in the world with total capital exceeding US$1.12 trillion in September 2014. Australia’s market capitalisation of free-floating shares is greater than China’s US$1.06 trillion, double Hong Kong’s US$528 billion and around four times the market capital of Singapore’s at US$261 billion.
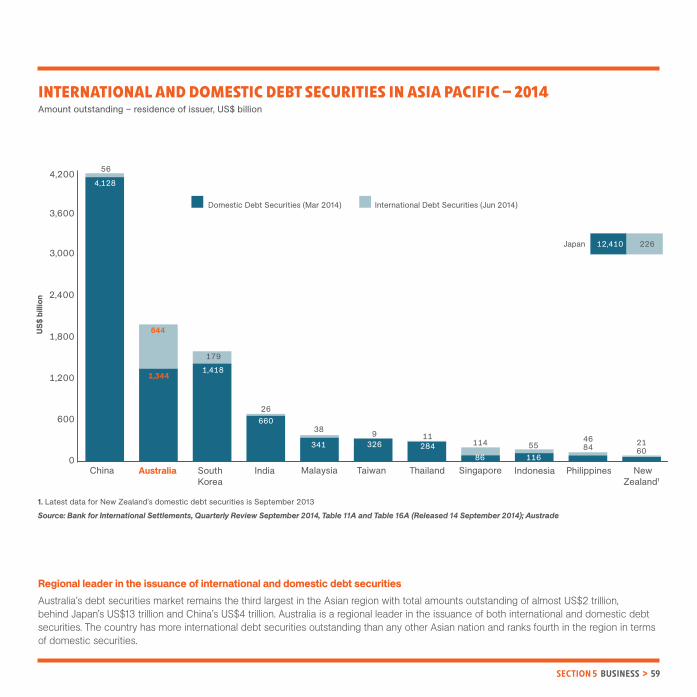
SECTION 5 BUSINESS > 59
INTERNATIONAL AND DOMESTIC DEBT SECURITIES IN ASIA PACIFIC – 2014Amount outstanding – residence of issuer, US$ billion
0
600
1,200
1,800
2,400
3,000
3,600
4,200
China Australia SouthKorea
India TaiwanMalaysia SingaporeThailand Indonesia Philippines NewZealand1
4,128
56
1,344
644
1,418
179
66026
341
38
3189 11
326 28486
114
11655 84
466021
Domestic Debt Securities (Mar 2014) International Debt Securities (Jun 2014)
Japan 12,410 226
US$
billi
on
Regional leader in the issuance of international and domestic debt securitiesAustralia’s debt securities market remains the third largest in the Asian region with total amounts outstanding of almost US$2 trillion, behind Japan’s US$13 trillion and China’s US$4 trillion. Australia is a regional leader in the issuance of both international and domestic debt securities. The country has more international debt securities outstanding than any other Asian nation and ranks fourth in the region in terms of domestic securities.
1. Latest data for New Zealand’s domestic debt securities is September 2013
Source: Bank for International Settlements, Quarterly Review September 2014, Table 11A and Table 16A (Released 14 September 2014); Austrade

AUSTRALIA
AdelaideBrisbaneCanberraDarwinHobart Melbourne Newcastle Perth Sydney Townsville Wollongong
EAST ASIAN GROWTH MARKETS
Bandar Seri BegawanBangkokBeijingChengduGuangzhouHangzhouHanoiHo Chi Minh CityHong KongJakartaKaohsiungKuala LumpurKunming Manila Nanjing Qingdao Seoul Shanghai Shenyang Shenzhen Singapore TaipeiWuhan Yangon
ESTABLISHEDMARKETS
Auckland Chicago Frankfurt FukuokaHouston* Istanbul London Madrid Milan New York Osaka Paris Port Moresby PragueSan Francisco Sapporo Stockholm SuvaTel Aviv Tokyo Toronto Vancouver Warsaw Washington DC
GROWTH AND EMERGING MARKETS
Abu Dhabi Accra Ahmedabad Bangalore Bogota Buenos Aires Chandigarh Chennai Colombo DhakaDubai Hyderabad Islamabad Jaipur Jeddah Johannesburg KarachiKochi Kolkata Kuwait Lahore Lima Mexico City Moscow Mumbai Nairobi New Delhi Port Louis PuneRabat Riyadh Santiago Sao Paulo Tripoli Ulaanbaatar Vladivostok
*Opening in 2015
ABN 11 764 698 227 Date: January 2015 ISBN: 978-0-9925090-8-8
DISCLAIMERThis report has been prepared as a general overview. It is not intended to provide an exhaustive coverage of the topic. The information is made available on the understanding that the Australian Trade Commission (Austrade) is not providing professional advice. Therefore, while all care has been taken in the preparation of this report, Austrade does not accept responsibility for any losses suffered by persons relying on the information contained in this report or arising from any error or omission in the report. Any person relying on this information does so entirely at their own discretion and Austrade strongly recommends the reader obtain independent professional advice prior to acting on this information.Austrade assumes no responsibility for any company, product or service mentioned in this document, for any materials provided in relation to such products, nor for any act or omission of any business connected with such products. Investors should always consider whether an investment is appropriate for their needs and seek out independent advice as appropriate.
AUSTRALIAN TRADE COMMISSION LOCATIONS

The Australian Trade Commission – Austrade – contributes to Australia’s economic prosperity by helping Australian businesses, education institutions, tourism operators, governments and citizens as they:
› develop international markets
› win productive foreign direct investment
› promote international education
› strengthen Australia’s tourism industry
› seek consular and passport services.
Austrade helps companies around the world to identify and take up investment opportunities in Australia as well as to source Australian goods and services. Our assistance includes:
› providing insight on Australian capabilities
› identifying potential investment projects and strategic alliance partners
› helping you to identify and contact Australian suppliers.
www.austrade.gov.au