Australia after the Terms of Trade Boom after the Terms of Trade Boom Tim Atkin, Mark Caputo, Tim...
8
55 BULLETIN | MARCH QUARTER 2014 Australia after the Terms of Trade Boom Tim Atkin, Mark Caputo, Tim Robinson and Hao Wang* The Australian economy has in recent years experienced the longest terms of trade boom in its history. This boom has had important macroeconomic outcomes – such as an elevated real exchange rate, large-scale investment in the resources sector and higher national income. The terms of trade have declined since their peak in September 2011 and are expected to ease further in coming years. This article draws extensively on Atkin et al (2014) and compares recent macroeconomic developments to those that occurred historically around major peaks in the terms of trade, while also highlighting key differences in the nature of the current cycle and the macroeconomic policy framework compared with those in the past. Introduction Australia’s terms of trade – the ratio of export prices to import prices – have increased significantly over the past two decades, with particularly large increases in export prices occurring from 2004 onwards (Graph 1). The terms of trade reached their highest level in history at their most recent peak – nearly 85 per cent above the average of the preceding century. This was also the longest terms of trade boom in Australia’s history and the terms of trade today remain at a very high level by historical standards. Australia has experienced five major terms of trade episodes over the past 150 years. Upswings in the terms of trade typically have been triggered by the industrialisation of overseas economies, supply disruptions (such as drought) or major conflicts, resulting in surges in the prices of some export commodities. Prior to the most recent episode, terms of trade booms had been relatively short-lived and driven largely by wool prices. Wool accounted for more than half of Australia’s goods exports at its peak in the early 1950s, and Australia was the largest supplier to the global market. Today, resource exports account for over 60 per cent of goods exports and Australia is the largest supplier to the traded market 50 75 100 125 150 175 50 75 100 125 150 175 Terms of Trade* 1900/1901–1999/2000 average = 100 2013 Index Index 1913 1933 1953 1973 1993 1893 1873 Post-war reconstruction and Korean war 1920s Late 60s and early 70s Federation Current * Dates correspond to December quarter of calendar year; annual data up to 1958/59, quarterly data thereafter; shaded regions represent major expansions in the terms of trade as defined by Atkin et al (2014); smoothed line is a five-year centred moving average Sources: ABS; Atkin et al (2014); Gillitzer and Kearns (2005) Graph 1 of iron ore and coking coal, the two key inputs for the production of crude steel. The most recent terms of trade episode is unique in several aspects. It has been driven by strong demand for steel and energy from China, which has a much larger population relative to previous industrialising economies. Uncertainty about the boom’s duration appears to have held back investment in additional capacity in the resources sector initially. Together with the long lead times until this investment * The authors are from Economic Analysis Department.
Transcript of Australia after the Terms of Trade Boom after the Terms of Trade Boom Tim Atkin, Mark Caputo, Tim...

55Bulletin | m a r c h Q ua r t e r 2014
Australia after the Terms of Trade BoomTim Atkin, Mark Caputo, Tim Robinson and Hao Wang*
The Australian economy has in recent years experienced the longest terms of trade boom in its history. This boom has had important macroeconomic outcomes – such as an elevated real exchange rate, large-scale investment in the resources sector and higher national income. The terms of trade have declined since their peak in September 2011 and are expected to ease further in coming years. This article draws extensively on Atkin et al (2014) and compares recent macroeconomic developments to those that occurred historically around major peaks in the terms of trade, while also highlighting key differences in the nature of the current cycle and the macroeconomic policy framework compared with those in the past.
IntroductionAustralia’s terms of trade – the ratio of export prices to import prices – have increased significantly over the past two decades, with particularly large increases in export prices occurring from 2004 onwards (Graph 1). The terms of trade reached their highest level in history at their most recent peak – nearly 85 per cent above the average of the preceding century. This was also the longest terms of trade boom in Australia’s history and the terms of trade today remain at a very high level by historical standards.
Australia has experienced five major terms of trade episodes over the past 150 years. Upswings in the terms of trade typically have been triggered by the industrialisation of overseas economies, supply disruptions (such as drought) or major conflicts, resulting in surges in the prices of some export commodities. Prior to the most recent episode, terms of trade booms had been relatively short-lived and driven largely by wool prices. Wool accounted for more than half of Australia’s goods exports at its peak in the early 1950s, and Australia was the largest supplier to the global market. Today, resource exports account for over 60 per cent of goods exports and Australia is the largest supplier to the traded market
50
75
100
125
150
175
50
75
100
125
150
175
Terms of Trade*1900/1901–1999/2000 average = 100
2013
IndexIndex
1913 1933 1953 1973 199318931873
Post-war reconstructionand Korean war
1920s
Late 60sand early 70s
Federation Current
* Dates correspond to December quarter of calendar year; annual data upto 1958/59, quarterly data thereafter; shaded regions represent majorexpansions in the terms of trade as defined by Atkin et al (2014);smoothed line is a five-year centred moving average
Sources: ABS; Atkin et al (2014); Gillitzer and Kearns (2005)
Graph 1
of iron ore and coking coal, the two key inputs for the production of crude steel.
The most recent terms of trade episode is unique in several aspects. It has been driven by strong demand for steel and energy from China, which has a much larger population relative to previous industrialising economies. Uncertainty about the boom’s duration appears to have held back investment in additional capacity in the resources sector initially. Together with the long lead times until this investment * The authors are from Economic Analysis Department.

56 ReseRve bank of austRalia
austRalia afteR the teRms of tRade boom
considerably, in part reflecting factors other than the terms of trade. The most severe downturn in economic activity since Federation occurred following the 1920s boom, with the onset of the Great Depression worldwide. The unemployment rate reached close to 20 per cent by the early 1930s, with conditions in Australia only worse during the 1890s depression. In contrast, the decline in GDP per capita in the 1950s was short-lived. In part, this reflected strong global growth and policy responses to the transitory boom in wool prices. In the mid 1970s, the decline in the terms of trade, reflecting subdued global economic conditions associated with the global oil price shock, contributed to below-average growth in output per capita. A tightening in domestic monetary policy, rigidities in the labour market and an overvalued exchange rate also contributed to this outcome.
As during other terms of trade cycles, in the two years following the most recent peak, GDP per capita grew at a below-average pace (Graph 2). However, growth has been relatively stable compared with past episodes. In part, this is due to the global financial crisis and weak multifactor productivity tempering output growth prior to the peak, as well as the greater flexibility in the macroeconomic policy framework. Following the peak, growth has continued to be
became productive, this delay prolonged the supply response, and therefore helped to sustain the upswing in commodity prices (see Garnaut (2012) and Plumb, Kent and Bishop (2013)). Relatedly, the terms of trade have remained at a high level two years after the peak, which is in contrast to some past episodes when they declined sharply. For example, over the two years after the peak of the Korean War wool boom, the terms of trade fell by around one-third to be less than 20 per cent above their average level of the 20th century. Another distinguishing feature of the recent episode is the high degree of foreign-funded investment in the resources sector, which has important consequences for the distribution of subsequent income gains (see Connolly and Orsmond (2011)). Finally, the policy settings and institutional framework in the most recent episode have enabled the Australian economy to respond to the boom in a relatively flexible way compared with those in the past.
Terms of Trade Swings and the Australian EconomyMovements in the terms of trade can have a significant impact on the Australian economy. Upswings in the terms of trade increase the real purchasing power of domestic output. Historically, upswings have tended to coincide with above-average growth rates of GDP per capita and have boosted national income considerably (Graph 2).1 In addition, falls in the terms of trade generally have coincided with a two-year period of below-average growth in GDP per capita and lower national income (with the notable exception of the outcome after the 1904/05 peak, which partly reflected the recovery in domestic growth following the severe recession of the 1890s in which real GDP had declined by almost 20 per cent).
Historically, the macroeconomic outcomes during downswings in the terms of trade have varied
1 Growth in national incomes includes changes in output as well as changes in the purchasing power of exports and net primary income receivable from non-residents. For more information, see Sheehan and Gregory (2013).
1904/05 1924/25 1950/51 1974:Q1 2011:Q3-2
0
2
4
6
-2
0
2
4
6
Per Capita GDP Growth*Average annual percentage change
* Dates are terms of trade peaks defined in Atkin et al (2014)Sources: ABS; Atkin et al (2014); Butlin MW (1977); Butlin NG (1962)
Average in decade before peak
%%
n Five yearsn Two years n Two yearsn Five yearsTo peak: After peak:
Graph 2

57Bulletin | m a r c h Q ua r t e r 2014
AustrAliA After the terms of trAde Boom
supported by the ongoing large-scale investment in liquefied natural gas (LNG) projects, an increase of resource exports and stimulatory monetary policy.
Cycles in the terms of trade affect all of the major expenditure components of GDP. However, in the current episode, business investment and trade have been of particular importance (Graph 3).2
Investment
Cycles in private business investment have often coincided with large movements in the terms of trade. When the terms of trade are increasing, investment typically contributes to GDP per capita growth as capacity is expanded in response to higher prices (Graph 3). Private business investment then generally declines in the two years following the peak in the terms of trade. This is likely to reflect
2 See Atkin et al (2014) for a discussion of other expenditure components.
-4
-2
0
2
4
-4
-2
0
2
4
Per Capita GDP GrowthContribution before and after terms of trade peaks*
* Selected average annual contributions to growth five years before andtwo years after terms of trade peaks
** Before peak based on data between 1900/01 and 1904/05Sources: ABS; Atkin et al (2014); Butlin MW (1977)
Per capita GDP growth%
1
-1
0 0
0 0
-1
1
2
2
2
2
44
6 6
ppt
ppt
ppt
ppt Business investment
Net exports
1904/05** 1924/25 1950/51 1974:Q1 2011:Q3
Before
After
%
Graph 3
lower investment in the booming sector as prices fall partly due to the increase in supply resulting from past investment becoming productive. Investment in some of the other sectors of the economy may also be subdued, reflecting the weakening in national income and possibly confidence, and may subsequently take some time to improve.
In the recent upswing in the terms of trade, resource investment increased significantly, reaching a historically high share of GDP in 2012/13. Reflecting this, the contribution to growth from private business investment in the five-year period preceding the terms of trade peak was large compared with most previous booms (Graph 3). Initially, this was driven by large-scale investment in both iron ore and coal. More recently, there has also been significant investment in the production of LNG, which has been facilitated by Asia’s growing energy demand and the development of more economical means of extraction. While for most investment, including in the agricultural sector, there are delays until it becomes productive, these delays are particularly pronounced in the resources sector.3
Resource investment is expected to continue to decline over coming years, with the current level of iron ore and coal prices less conducive to investment in new projects. Investment in LNG projects has continued to be high in the two years following the peak in the terms of trade, with investment generally supported by long-term supply contracts. However, resource investment is expected to decline significantly in the next few years as current projects are completed. Meanwhile, non-resource business investment has been subdued following the peak, with domestic demand growing at a below-average rate.
Trade
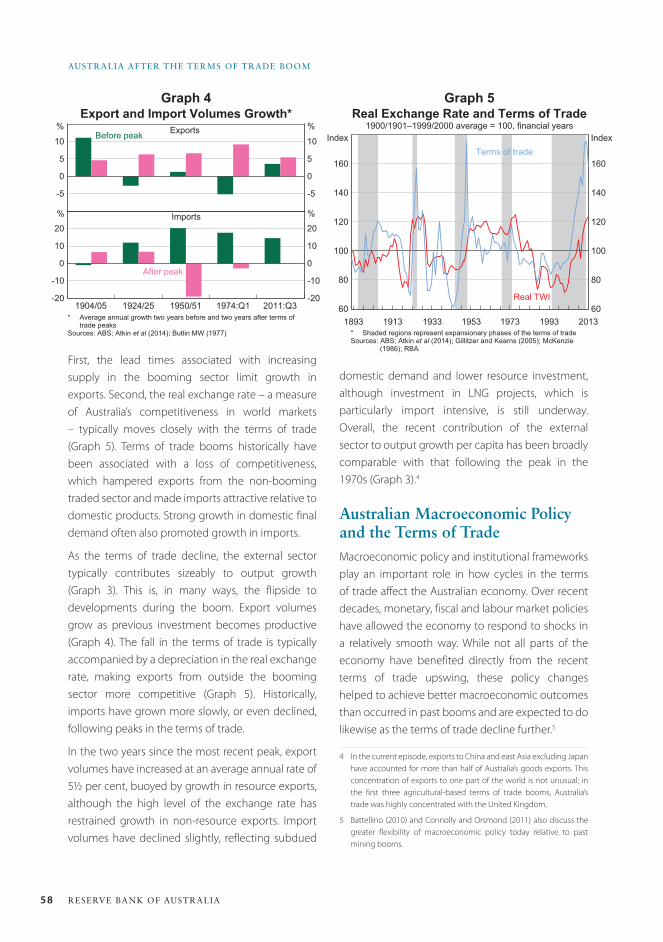
Prior to peaks in the terms of trade, export volumes growth has typically been weak and import volumes growth strong (Graph 4). This reflects several factors.
3 See Cordon and Neary (1982) and Plumb et al (2013) for descriptions of the phases of a mining boom.
58 ReseRve bank of austRalia
austRalia afteR the teRms of tRade boom
domestic demand and lower resource investment, although investment in LNG projects, which is particularly import intensive, is still underway. Overall, the recent contribution of the external sector to output growth per capita has been broadly comparable with that following the peak in the 1970s (Graph 3).4
Australian Macroeconomic Policy and the Terms of TradeMacroeconomic policy and institutional frameworks play an important role in how cycles in the terms of trade affect the Australian economy. Over recent decades, monetary, fiscal and labour market policies have allowed the economy to respond to shocks in a relatively smooth way. While not all parts of the economy have benefited directly from the recent terms of trade upswing, these policy changes helped to achieve better macroeconomic outcomes than occurred in past booms and are expected to do likewise as the terms of trade decline further.5
4 In the current episode, exports to China and east Asia excluding Japan have accounted for more than half of Australia’s goods exports. This concentration of exports to one part of the world is not unusual; in the first three agricultural-based terms of trade booms, Australia’s trade was highly concentrated with the United Kingdom.
5 Battellino (2010) and Connolly and Orsmond (2011) also discuss the greater flexibility of macroeconomic policy today relative to past mining booms.
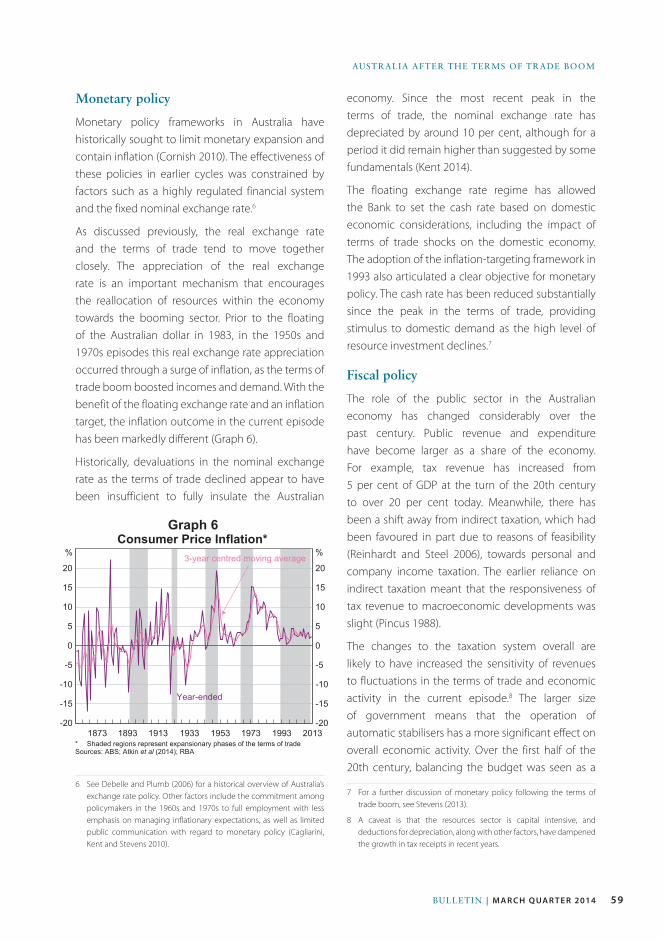
First, the lead times associated with increasing supply in the booming sector limit growth in exports. Second, the real exchange rate – a measure of Australia’s competitiveness in world markets – typically moves closely with the terms of trade (Graph 5). Terms of trade booms historically have been associated with a loss of competitiveness, which hampered exports from the non-booming traded sector and made imports attractive relative to domestic products. Strong growth in domestic final demand often also promoted growth in imports.
As the terms of trade decline, the external sector typically contributes sizeably to output growth (Graph 3). This is, in many ways, the flipside to developments during the boom. Export volumes grow as previous investment becomes productive (Graph 4). The fall in the terms of trade is typically accompanied by a depreciation in the real exchange rate, making exports from outside the booming sector more competitive (Graph 5). Historically, imports have grown more slowly, or even declined, following peaks in the terms of trade.
In the two years since the most recent peak, export volumes have increased at an average annual rate of 5½ per cent, buoyed by growth in resource exports, although the high level of the exchange rate has restrained growth in non-resource exports. Import volumes have declined slightly, reflecting subdued
Export and Import Volumes Growth*
* Average annual growth two years before and two years after terms oftrade peaks
Sources: ABS; Atkin et al (2014); Butlin MW (1977)
2011:Q3
Before peak%Exports
-5
0
5
10
-5
0
5
10
-20
-10
0
10
20
-20
-10
0
10
20
1974:Q11950/511924/251904/05
%
% %
After peak
Imports
Graph 4
60
80
100
120
140
160
60
80
100
120
140
160
Real Exchange Rate and Terms of Trade1900/1901–1999/2000 average = 100, financial years
* Shaded regions represent expansionary phases of the terms of tradeSources: ABS; Atkin et al (2014); Gillitzer and Kearns (2005); McKenzie
(1986); RBA
1893
Terms of tradeIndexIndex
Real TWI
1913 1933 1953 1973 1993 2013
Graph 5
59Bulletin | m a r c h Q ua r t e r 2014
AustrAliA After the terms of trAde Boom
economy. Since the most recent peak in the terms of trade, the nominal exchange rate has depreciated by around 10 per cent, although for a period it did remain higher than suggested by some fundamentals (Kent 2014).
The floating exchange rate regime has allowed the Bank to set the cash rate based on domestic economic considerations, including the impact of terms of trade shocks on the domestic economy. The adoption of the inflation-targeting framework in 1993 also articulated a clear objective for monetary policy. The cash rate has been reduced substantially since the peak in the terms of trade, providing stimulus to domestic demand as the high level of resource investment declines.7
Fiscal policy
The role of the public sector in the Australian economy has changed considerably over the past century. Public revenue and expenditure have become larger as a share of the economy. For example, tax revenue has increased from 5 per cent of GDP at the turn of the 20th century to over 20 per cent today. Meanwhile, there has been a shift away from indirect taxation, which had been favoured in part due to reasons of feasibility (Reinhardt and Steel 2006), towards personal and company income taxation. The earlier reliance on indirect taxation meant that the responsiveness of tax revenue to macroeconomic developments was slight (Pincus 1988).
The changes to the taxation system overall are likely to have increased the sensitivity of revenues to fluctuations in the terms of trade and economic activity in the current episode.8 The larger size of government means that the operation of automatic stabilisers has a more significant effect on overall economic activity. Over the first half of the 20th century, balancing the budget was seen as a
7 For a further discussion of monetary policy following the terms of trade boom, see Stevens (2013).
8 A caveat is that the resources sector is capital intensive, and deductions for depreciation, along with other factors, have dampened the growth in tax receipts in recent years.
Monetary policy
Monetary policy frameworks in Australia have historically sought to limit monetary expansion and contain inflation (Cornish 2010). The effectiveness of these policies in earlier cycles was constrained by factors such as a highly regulated financial system and the fixed nominal exchange rate.6
As discussed previously, the real exchange rate and the terms of trade tend to move together closely. The appreciation of the real exchange rate is an important mechanism that encourages the reallocation of resources within the economy towards the booming sector. Prior to the floating of the Australian dollar in 1983, in the 1950s and 1970s episodes this real exchange rate appreciation occurred through a surge of inflation, as the terms of trade boom boosted incomes and demand. With the benefit of the floating exchange rate and an inflation target, the inflation outcome in the current episode has been markedly different (Graph 6).
Historically, devaluations in the nominal exchange rate as the terms of trade declined appear to have been insufficient to fully insulate the Australian
6 See Debelle and Plumb (2006) for a historical overview of Australia’s exchange rate policy. Other factors include the commitment among policymakers in the 1960s and 1970s to full employment with less emphasis on managing inflationary expectations, as well as limited public communication with regard to monetary policy (Cagliarini, Kent and Stevens 2010).
-20
-15
-10
-5
0
5
10
15
20
-20
-15
-10
-5
0
5
10
15
20
Consumer Price Inflation*
* Shaded regions represent expansionary phases of the terms of tradeSources: ABS; Atkin et al (2014); RBA
1873
Year-ended
%3-year centred moving average
1893 1913 1933 1953 1973 1993
%
2013
Graph 6

60 ReseRve bank of austRalia
austRalia afteR the teRms of tRade boom
importance given the geographically isolated nature of many mining projects.9
OutlookHistory suggests that growth of output per capita is typically slower for several years following a terms of trade boom compared with the period before, and that the weakness in national income is even more protracted. Past episodes suggest that per capita growth tends to return to an around-average rate within five years. While the current episode has parallels with those in the past – for example, being largely driven by a narrow range of commodities – the most recent terms of trade boom has lasted much longer than those in the past and the lag from investment to production in the resources sector has been considerable, particularly for LNG investment.
The transition from the investment to production phase of the resources boom has been underway for some time in the iron ore and coal sectors (Graph 8); coupled with increased supply from elsewhere in the world, it is likely to weigh on global prices. Indeed, an easing in prices is likely despite some estimates suggesting that Chinese steel demand will
9 Another example of the increased flexibility of the labour market is that during the global financial crisis considerable adjustment occurred as a decline in average hours worked, mitigating the increase in unemployment.
priority for policymakers, and countercyclical fiscal policy was limited. Also, in some previous episodes when the terms of trade declined, the government’s ability to respond to weaker economic conditions was constrained by a high level of public debt limiting further borrowing (Graph 7).
-60
0
60
120
180
-60
0
60
120
180
Public Debt in Australia*Per cent of GDP
* Federal, state and local governments; financial years; shaded regionsrepresent expansionary phases of the terms of trade
Sources: ABS; Atkin et al (2014); Australian Government budget papers; Australian Office of Financial Management; Australian Treasury; RBA; Vamplew (1987)
1853
Gross debt(total)
%%
Gross debt(general government)
Net debt
1873 1893 1913 1933 1953 1973 1993 2013
Graph 7
0
20
40
60
80
0
200
400
600
800
Bulk Commodity Exports Projections*Annual
Iron oreLHS
CoalLHS
LNGRHS
02/03 17/18
MtMt
17/18 17/1802/03 02/03* BREE projections for 2013/14–2017/18 as at September 2013Source: Bureau of Resources and Energy Economics
Graph 8
Labour market policy
The institutional structure of the labour market in the current episode has been the most flexible during any terms of trade episode since Federation. Higher export prices tend to increase the demand for labour in the booming sector. This places upward pressure on wages in that sector relative to those in the rest of the economy, which provides an important signal for labour to shift across sectors. Historically, Australia had a highly centralised wage-setting system that limited the development of sectoral wage differentials (Freebairn and Withers 1977). This lack of flexibility also meant that wage pressures could spread across the economy.
Greater flexibility in the wage-setting framework enabled considerable wage differentials between the mining sector and the rest of the economy to arise in the most recent episode (Plumb et al 2013). These wage differentials were of particular

61Bulletin | m a r c h Q ua r t e r 2014
AustrAliA After the terms of trAde Boom
not peak until the mid 2020s (Berkelmans and Wang 2012). Nevertheless, while long-run commodity price forecasts are inherently highly uncertain, it seems unlikely that the prices of these commodities will return to their levels prior to the boom, reflecting the relatively high cost of the new global supply that has come online over recent years. Consequently, the terms of trade are expected to decline more gradually than in some episodes in the past.
A large part of the run-up in investment in the current episode was in the LNG sector. The delays between investment and production for LNG are long, and consequently strong growth in production is only expected from 2015/16 onwards (Graph 8). This is likely to contribute sizeably to GDP per capita growth. The high degree of foreign ownership in the resources sector, however, will mute the income gains retained domestically as production increases. It also means that foreigners are sharing the risks associated with any downswing in commodity prices.
As the real exchange rate and the terms of trade tend to move closely together, further declines in the terms of trade could also be accompanied by a further real depreciation. This increase in competitiveness is important in facilitating the transition in the sectors that contribute to output growth, as it promotes growth in the tradable sector outside of resources. A nominal depreciation is one way such an increase in competitiveness may occur; higher productivity growth and real wage restraint would also support Australia’s competitiveness. In coming years, measured national productivity will be boosted by the growth of production in the resources sector; however, productivity growth in the rest of the tradable sector will also be of importance in increasing Australia’s competitiveness.
In addition, there is likely to be a considerable reduction in demand for labour from the resources sector as the shift to the production phase continues. Wages in the resources sector, relative to those elsewhere in the economy, may decline (Plumb et al 2013). Such a change in relative wages
would be a signal to assist the reallocation of labour and would have been less likely to occur under the more centralised wage-setting systems of the past.
Overall, the expected decline in the terms of trade over coming years will pose challenges for both firms and policymakers. Nevertheless, the greater flexibility present in the economy today – such as the wages system and the floating exchange rate – should help to facilitate the necessary adjustments. R
ReferencesAtkin T, M Caputo, T Robinson and H Wang (2014), ‘Macroeconomic Consequences of Terms of Trade
Episodes, Past and Present’, RBA Research Discussion Paper
No 2014-01.
Battellino R (2010), ‘Mining Booms and the Australian
Economy’, RBA Bulletin, March, pp 63–69.
Berkelmans L and H Wang (2012), ‘Chinese Urban
Residential Construction to 2040’, RBA Research Discussion
Paper No 2012-04.
Butlin MW (1977), ‘A Preliminary Annual Database 1900/01
to 1973/74’, RBA Research Discussion Paper No 7701.
Butlin NG (1962), Australian Domestic Product, Investment
and Foreign Borrowing, 1861–1938/39, Cambridge University
Press, Cambridge.
Cagliarini A, C Kent and G Stevens (2010), ‘Fifty Years of
Monetary Policy: What Have We Learned?’, in C Kent and
M Robson (eds), Reserve Bank of Australia 50th Anniversary
Symposium, Proceedings of a Conference, Reserve Bank of
Australia, Sydney, pp 9–37.
Connolly E and D Orsmond (2011), ‘The Mining Industry:
From Bust to Boom’, in H Gerard and J Kearns (eds),
The Australian Economy in the 2000s, Proceedings of a
Conference, Reserve Bank of Australia, Sydney, pp 111–156.
Corden WM and JP Neary (1982), ‘Booming Sector
and De-Industrialisation in a Small Open Economy’, The
Economic Journal, 92(368), pp 825–848.
Cornish S (2010), The Evolution of Central Banking in
Australia, Reserve Bank of Australia, Sydney.
Debelle G and M Plumb (2006), ‘The Evolution of
Exchange Rate Policy and Capital Controls in Australia’,
Asian Economic Papers, 5(2), pp 7–29.

62 ReseRve bank of austRalia
austRalia afteR the teRms of tRade boom
Plumb M, C Kent and J Bishop (2013), ‘Implications for
the Australian Economy of Strong Growth in Asia’, RBA
Research Discussion Paper No 2013-03.
Reinhardt S and L Steel (2006), ‘A Brief History of
Australia’s Tax System’, Economic Roundup, Winter, pp 1–26.
Sheehan P and RG Gregory (2013), ‘The Resources Boom
and Economic Policy in the Long Run’, Australian Economic
Review, 46(2), pp 121–139.
Stevens G (2013), ‘Economic Policy after the Booms’,
Address to The Anika Foundation Luncheon, Sydney,
30 July.
Vamplew W (ed) (1987), Australians: Historical Statistics,
Australians: A Historical Library, Volume 10, Fairfax, Syme &
Weldon Associates, Sydney.
Freebairn J and G Withers (1977), ‘The Performance of
Manpower Forecasting Techniques in Australian Labour
Markets’, Australian Bulletin of Labour, 4(1), pp 13–31.
Garnaut R (2012), ‘The Contemporary China Resources
Boom’, The Australian Journal of Agricultural and Resource
Economics, 56(2), pp 222–243.
Gillitzer C and J Kearns (2005), ‘Long-term Patterns in
Australia’s Terms of Trade’, RBA Research Discussion Paper
No 2005-01.
Kent C (2014), ‘The Resources Boom and the Australian
Dollar’, Address to the Committee for Economic
Development of Australia (CEDA) Economic and Political
Overview, Sydney, 14 February.
McKenzie IM (1986), ‘Australia’s Real Exchange Rate during
the Twentieth Century’, The Economic Record, Supplement,
pp 69–78.
Pincus JJ (1988), ‘Australian Budgetary Policies in the
1930s’, in RG Gregory and NG Butlin (eds), Recovery from the
Depression: Australia and the World Economy in the 1930s,
Cambridge University Press, Melbourne, pp 173–192.