Aust t r Mobilit P lan Scenar G uide - austintexas.gov · 1 1.3 million by 2040 Aust t r Mobilit P...
5
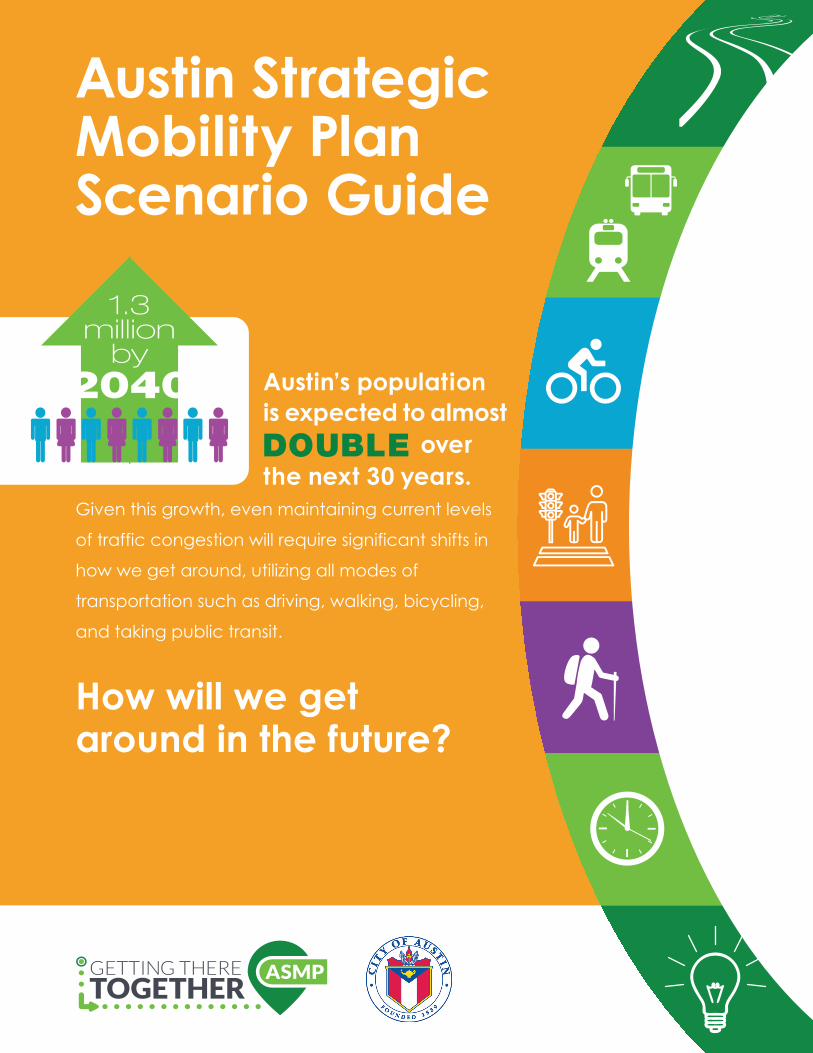
1 1.3 million by 2040 Austin Strategic Mobility Plan Scenario Guide DOUBLE Austin’s population is expected to almost over the next 30 years. Given this growth, even maintaining current levels of traffic congestion will require significant shifts in how we get around, utilizing all modes of transportation such as driving, walking, bicycling, and taking public transit. How will we get around in the future?
Transcript of Aust t r Mobilit P lan Scenar G uide - austintexas.gov · 1 1.3 million by 2040 Aust t r Mobilit P...
1
1.3million
by2040
Austin Strategic Mobility PlanScenario Guide
DOUBLE
Austin’s population is expected to almost over the next 30 years. Given this growth, even maintaining current levels
of traffic congestion will require significant shifts in
how we get around, utilizing all modes of
transportation such as driving, walking, bicycling,
and taking public transit.
How will we get around in the future?
2
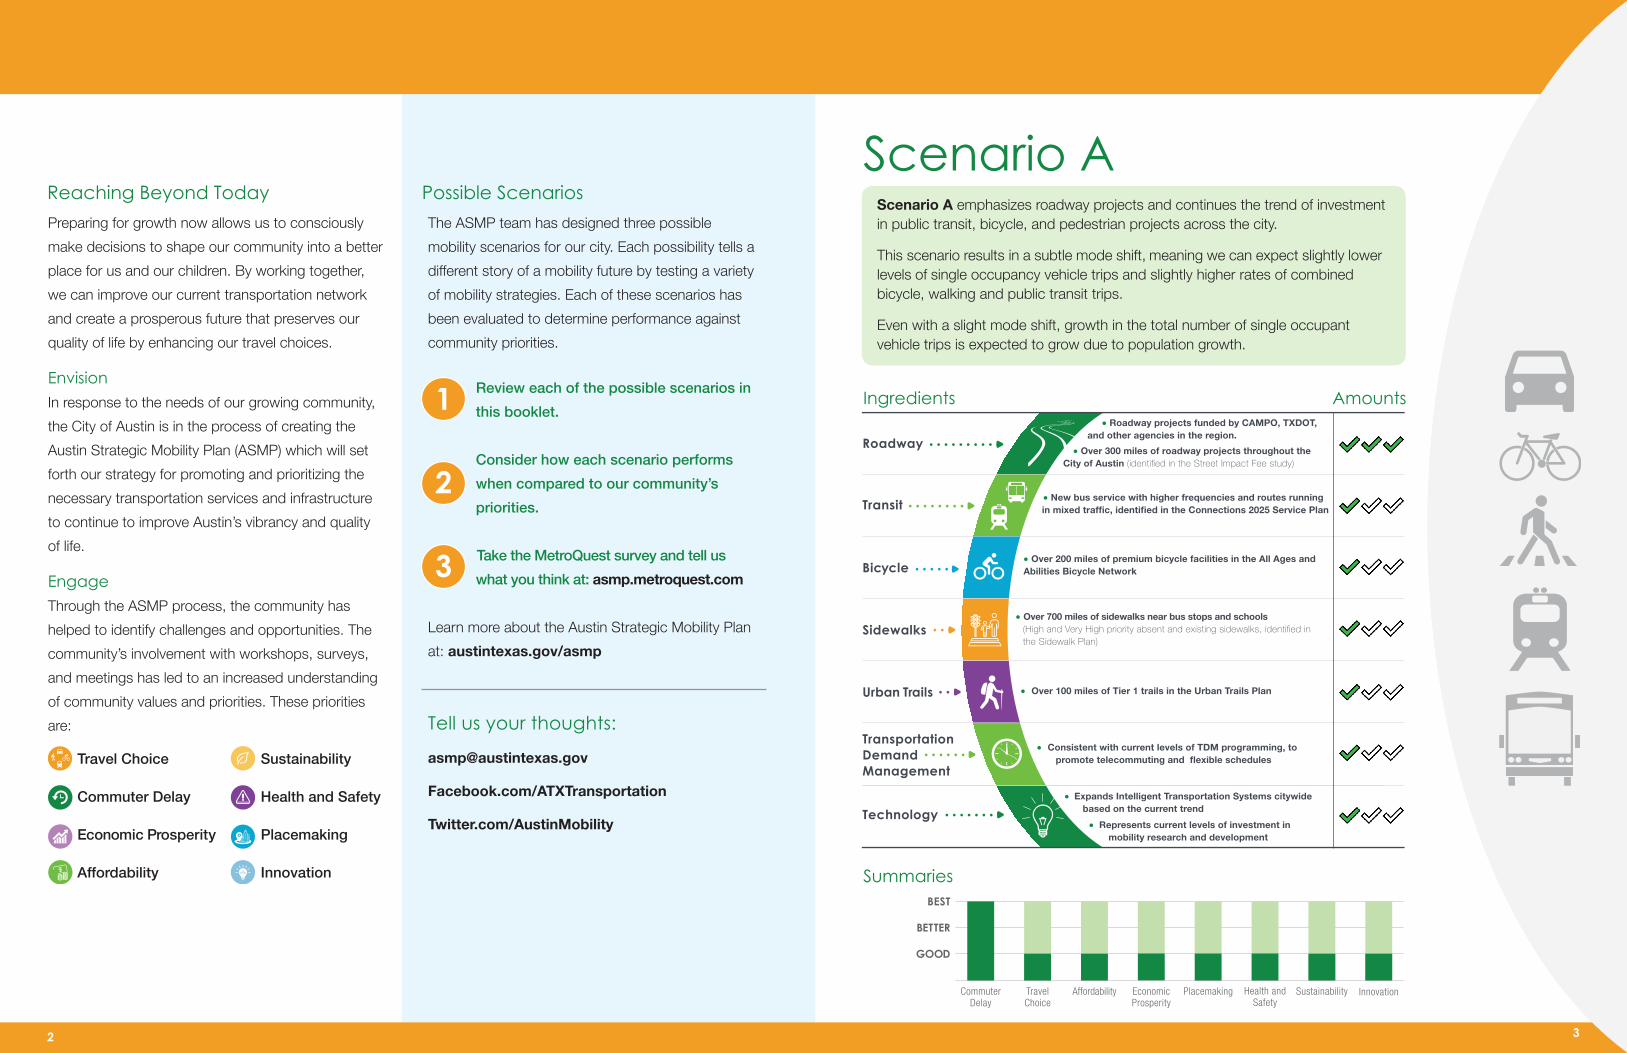
Scenario A emphasizes roadway projects and continues the trend of investment in public transit, bicycle, and pedestrian projects across the city.
This scenario results in a subtle mode shift, meaning we can expect slightly lower levels of single occupancy vehicle trips and slightly higher rates of combined bicycle, walking and public transit trips.
Even with a slight mode shift, growth in the total number of single occupant vehicle trips is expected to grow due to population growth.
Scenario A
1
2
3
Ingredients Amounts
Summaries
Reaching Beyond TodayPreparing for growth now allows us to consciously
make decisions to shape our community into a better
place for us and our children. By working together,
we can improve our current transportation network
and create a prosperous future that preserves our
quality of life by enhancing our travel choices.
EnvisionIn response to the needs of our growing community,
the City of Austin is in the process of creating the
Austin Strategic Mobility Plan (ASMP) which will set
forth our strategy for promoting and prioritizing the
necessary transportation services and infrastructure
to continue to improve Austin’s vibrancy and quality
of life.
EngageThrough the ASMP process, the community has
helped to identify challenges and opportunities. The
community’s involvement with workshops, surveys,
and meetings has led to an increased understanding
of community values and priorities. These priorities
are:
l Travel Choice l Sustainability
l Commuter Delay l Health and Safety
l Economic Prosperity l Placemaking
l Affordability l Innovation
The ASMP team has designed three possible
mobility scenarios for our city. Each possibility tells a
different story of a mobility future by testing a variety
of mobility strategies. Each of these scenarios has
been evaluated to determine performance against
community priorities.
Review each of the possible scenarios in
this booklet.
Consider how each scenario performs
when compared to our community’s
priorities.
Take the MetroQuest survey and tell us
what you think at: asmp.metroquest.com
Learn more about the Austin Strategic Mobility Plan
at: austintexas.gov/asmp
Tell us your thoughts:
Facebook.com/ATXTransportation
Twitter.com/AustinMobility
Roadway
Transit
Bicycle
Sidewalks
Urban Trails
Transportation DemandManagement
Technology
..........
......
...
...
.........
.......
........
Roadway projects funded by CAMPO, TXDOT, and other agencies in the region.
Over 300 miles of roadway projects throughout the City of Austin (identified in the Street Impact Fee study)
New bus service with higher frequencies and routes running in mixed traffic, identified in the Connections 2025 Service Plan
Over 100 miles of Tier 1 trails in the Urban Trails Plan
Over 200 miles of premium bicycle facilities in the All Ages and Abilities Bicycle Network
Over 700 miles of sidewalks near bus stops and schools (High and Very High priority absent and existing sidewalks, identified in the Sidewalk Plan)
Consistent with current levels of TDM programming, to promote telecommuting and flexible schedules
Expands Intelligent Transportation Systems citywide based on the current trend
Represents current levels of investment in mobility research and development
Reaching Beyond Today Possible Scenarios
BEST
BETTER
GOOD
AffordabilityTravelChoice
EconomicProsperity
Placemaking InnovationCommuterDelay
Health andSafety
Sustainability
BEST
BETTER
GOOD
AffordabilityTravelChoice
EconomicProsperity
Placemaking InnovationCommuterDelay
Health andSafety
Sustainability
BEST
BETTER
GOOD
AffordabilityTravelChoice
EconomicProsperity
Placemaking InnovationCommuterDelay
Health andSafety
Sustainability
3
4 5
Ingredients AmountsAmountsIngredients
4
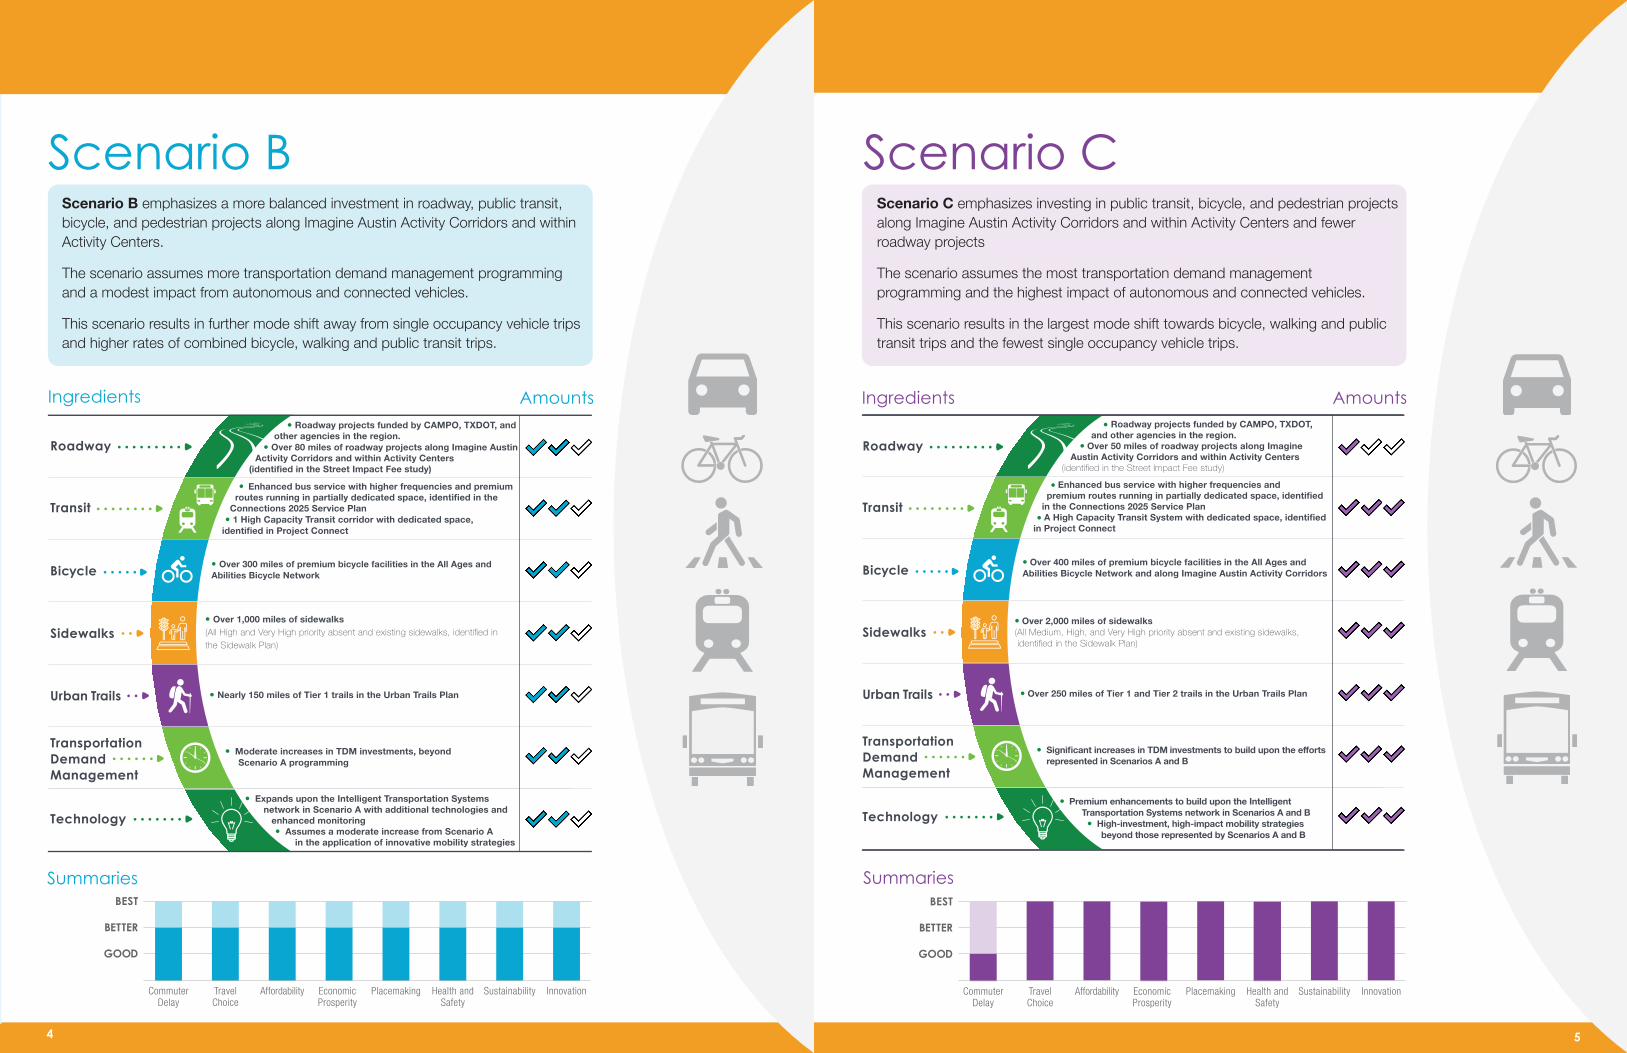
Scenario CScenario BScenario C emphasizes investing in public transit, bicycle, and pedestrian projects along Imagine Austin Activity Corridors and within Activity Centers and fewer roadway projects
The scenario assumes the most transportation demand management programming and the highest impact of autonomous and connected vehicles.
This scenario results in the largest mode shift towards bicycle, walking and public transit trips and the fewest single occupancy vehicle trips.
Scenario B emphasizes a more balanced investment in roadway, public transit, bicycle, and pedestrian projects along Imagine Austin Activity Corridors and within Activity Centers.
The scenario assumes more transportation demand management programming and a modest impact from autonomous and connected vehicles.
This scenario results in further mode shift away from single occupancy vehicle trips and higher rates of combined bicycle, walking and public transit trips.
Roadway
Transit
Bicycle
Sidewalks
Urban Trails
Transportation DemandManagement
Technology
..........
......
...
...
.........
.......
........
Nearly 150 miles of Tier 1 trails in the Urban Trails Plan
Moderate increases in TDM investments, beyond Scenario A programming
Expands upon the Intelligent Transportation Systems network in Scenario A with additional technologies and enhanced monitoring Assumes a moderate increase from Scenario A in the application of innovative mobility strategies
Roadway projects funded by CAMPO, TXDOT, and other agencies in the region. Over 80 miles of roadway projects along Imagine Austin Activity Corridors and within Activity Centers(identified in the Street Impact Fee study)
Enhanced bus service with higher frequencies and premium routes running in partially dedicated space, identified in the Connections 2025 Service Plan 1 High Capacity Transit corridor with dedicated space,
identified in Project Connect
Over 300 miles of premium bicycle facilities in the All Ages and Abilities Bicycle Network
Over 1,000 miles of sidewalks(All High and Very High priority absent and existing sidewalks, identified in the Sidewalk Plan)
Roadway
Transit
Bicycle
Sidewalks
Urban Trails
Transportation DemandManagement
Technology
..........
......
...
...
.........
.......
........
Roadway projects funded by CAMPO, TXDOT, and other agencies in the region. Over 50 miles of roadway projects along Imagine Austin Activity Corridors and within Activity Centers(identified in the Street Impact Fee study)
Enhanced bus service with higher frequencies and premium routes running in partially dedicated space, identified in the Connections 2025 Service Plan A High Capacity Transit System with dedicated space, identified in Project Connect
Over 400 miles of premium bicycle facilities in the All Ages and Abilities Bicycle Network and along Imagine Austin Activity Corridors
Over 2,000 miles of sidewalks(All Medium, High, and Very High priority absent and existing sidewalks, identified in the Sidewalk Plan)
Over 250 miles of Tier 1 and Tier 2 trails in the Urban Trails Plan
Significant increases in TDM investments to build upon the efforts represented in Scenarios A and B
Premium enhancements to build upon the Intelligent Transportation Systems network in Scenarios A and B High-investment, high-impact mobility strategies beyond those represented by Scenarios A and B
SummariesSummaries
BEST
BETTER
GOOD
AffordabilityTravelChoice
EconomicProsperity
Placemaking InnovationCommuterDelay
Health andSafety
Sustainability
BEST
BETTER
GOOD
AffordabilityTravelChoice
EconomicProsperity
Placemaking InnovationCommuterDelay
Health andSafety
Sustainability
BEST
BETTER
GOOD
AffordabilityTravelChoice
EconomicProsperity
Placemaking InnovationCommuterDelay
Health andSafety
Sustainability
BEST
BETTER
GOOD
AffordabilityTravelChoice
EconomicProsperity
Placemaking InnovationCommuterDelay
Health andSafety
Sustainability
BEST
BETTER
GOOD
AffordabilityTravelChoice
EconomicProsperity
Placemaking InnovationCommuterDelay
Health andSafety
Sustainability
BEST
BETTER
GOOD
AffordabilityTravelChoice
EconomicProsperity
Placemaking InnovationCommuterDelay
Health andSafety
Sustainability
7
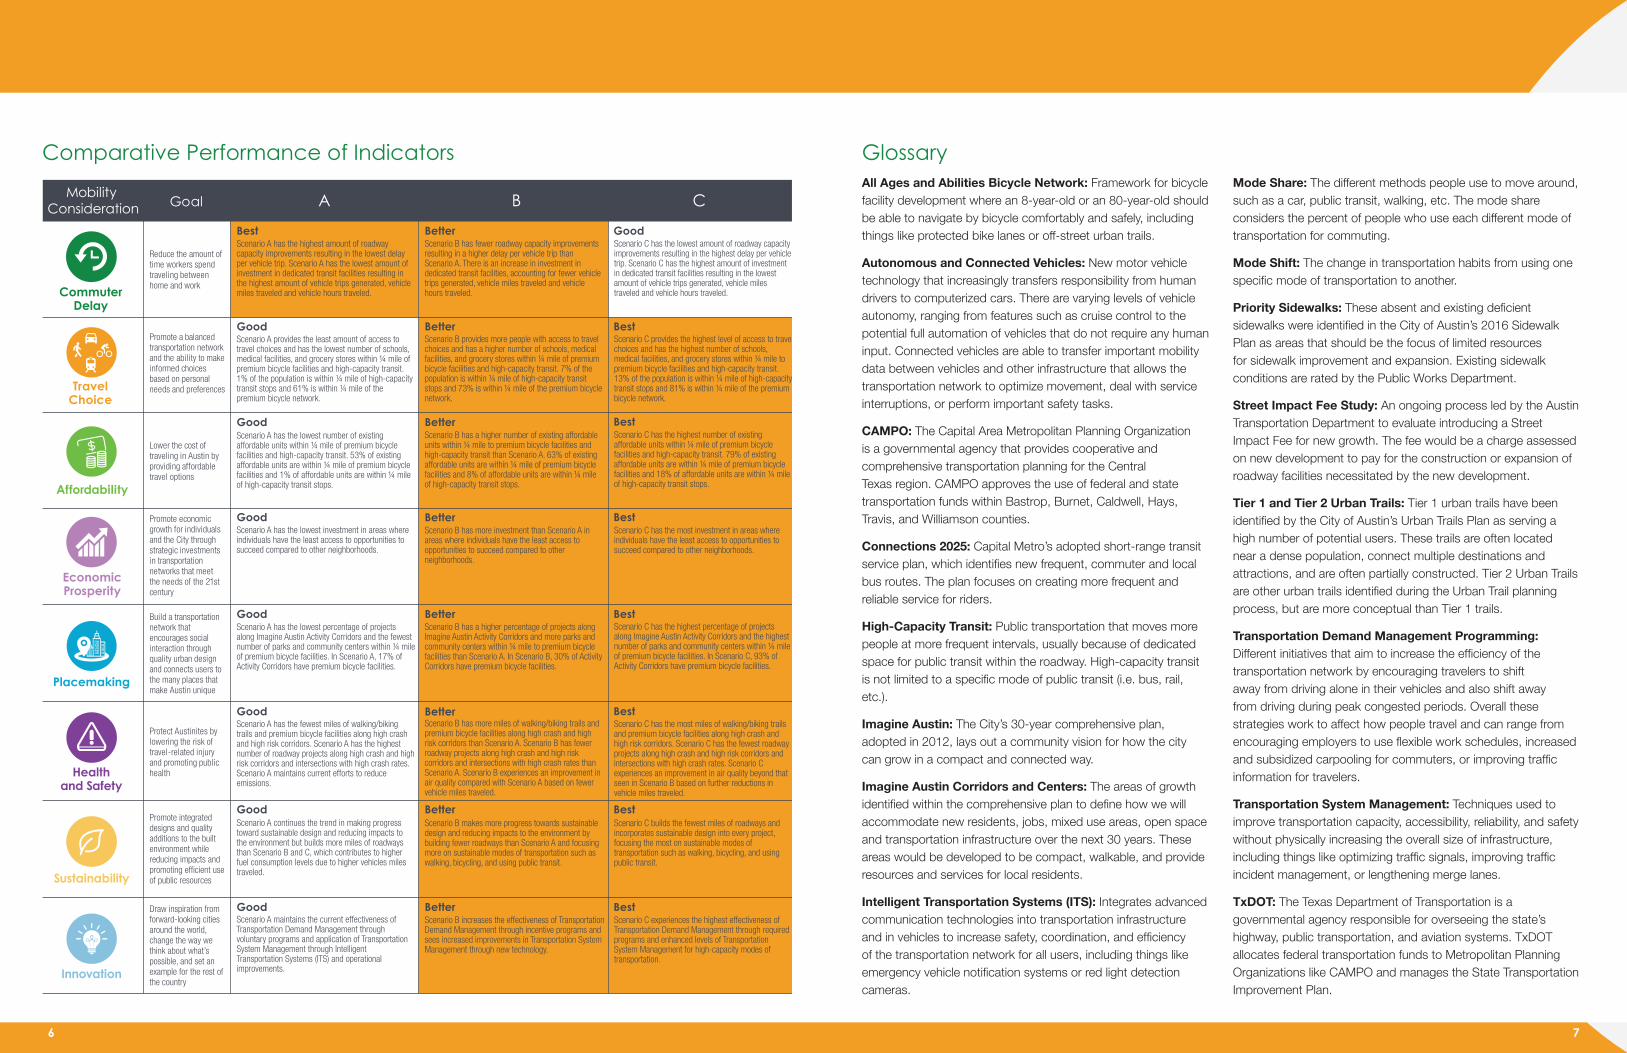
Comparative Performance of Indicators Glossary
Goal A B CMobility Consideration
Reduce the amount of time workers spend traveling between home and work
Promote a balanced transportation network and the ability to make informed choices based on personal needs and preferences
Lower the cost of traveling in Austin by providing affordable travel options
Promote economic growth for individuals and the City through strategic investments in transportation networks that meet the needs of the 21st century
Build a transportation network that encourages social interaction through quality urban design and connects users to the many places that make Austin unique
Protect Austinites by lowering the risk of travel-related injury and promoting public health
Scenario C has the most miles of walking/biking trails and premium bicycle facilities along high crash and high risk corridors. Scenario C has the fewest roadway projects along high crash and high risk corridors and intersections with high crash rates. Scenario C experiences an improvement in air quality beyond that seen in Scenario B based on further reductions in vehicle miles traveled.
Scenario B has more miles of walking/biking trails and premium bicycle facilities along high crash and high risk corridors than Scenario A. Scenario B has fewer roadway projects along high crash and high risk corridors and intersections with high crash rates than Scenario A. Scenario B experiences an improvement in air quality compared with Scenario A based on fewer vehicle miles traveled.
Scenario A has the fewest miles of walking/biking trails and premium bicycle facilities along high crash and high risk corridors. Scenario A has the highest number of roadway projects along high crash and high risk corridors and intersections with high crash rates. Scenario A maintains current efforts to reduce emissions.
Scenario C has the lowest amount of roadway capacity improvements resulting in the highest delay per vehicle trip. Scenario C has the highest amount of investment in dedicated transit facilities resulting in the lowest amount of vehicle trips generated, vehicle miles traveled and vehicle hours traveled.
Scenario B has fewer roadway capacity improvements resulting in a higher delay per vehicle trip than Scenario A. There is an increase in investment in dedicated transit facilities, accounting for fewer vehicle trips generated, vehicle miles traveled and vehicle hours traveled.
Scenario A has the highest amount of roadway capacity improvements resulting in the lowest delay per vehicle trip. Scenario A has the lowest amount of investment in dedicated transit facilities resulting in the highest amount of vehicle trips generated, vehicle miles traveled and vehicle hours traveled.
Scenario C provides the highest level of access to travel choices and has the highest number of schools, medical facilities, and grocery stores within ¼ mile to premium bicycle facilities and high-capacity transit. 13% of the population is within ¼ mile of high-capacity transit stops and 81% is within ¼ mile of the premium bicycle network.
Scenario B provides more people with access to travel choices and has a higher number of schools, medical facilities, and grocery stores within ¼ mile of premium bicycle facilities and high-capacity transit. 7% of the population is within ¼ mile of high-capacity transit stops and 73% is within ¼ mile of the premium bicycle network.
Scenario A provides the least amount of access to travel choices and has the lowest number of schools, medical facilities, and grocery stores within ¼ mile of premium bicycle facilities and high-capacity transit. 1% of the population is within ¼ mile of high-capacity transit stops and 61% is within ¼ mile of the premium bicycle network.
Scenario C has the highest number of existing affordable units within ¼ mile of premium bicycle facilities and high-capacity transit. 79% of existing affordable units are within ¼ mile of premium bicycle facilities and 18% of affordable units are within ¼ mile of high-capacity transit stops.
Scenario B has a higher number of existing affordable units within ¼ mile to premium bicycle facilities and high-capacity transit than Scenario A. 63% of existing affordable units are within ¼ mile of premium bicycle facilities and 8% of affordable units are within ¼ mile of high-capacity transit stops.
Scenario A has the lowest number of existing affordable units within ¼ mile of premium bicycle facilities and high-capacity transit. 53% of existing affordable units are within ¼ mile of premium bicycle facilities and 1% of affordable units are within ¼ mile of high-capacity transit stops.
Scenario C has the most investment in areas where individuals have the least access to opportunities to succeed compared to other neighborhoods.
Scenario B has more investment than Scenario A in areas where individuals have the least access to opportunities to succeed compared to other neighborhoods.
Scenario A has the lowest investment in areas where individuals have the least access to opportunities to succeed compared to other neighborhoods.
Scenario C has the highest percentage of projects along Imagine Austin Activity Corridors and the highest number of parks and community centers within ¼ mile of premium bicycle facilities. In Scenario C, 93% of Activity Corridors have premium bicycle facilities.
Scenario B has a higher percentage of projects along Imagine Austin Activity Corridors and more parks and community centers within ¼ mile to premium bicycle facilities than Scenario A. In Scenario B, 30% of Activity Corridors have premium bicycle facilities.
Scenario A has the lowest percentage of projects along Imagine Austin Activity Corridors and the fewest number of parks and community centers within ¼ mile of premium bicycle facilities. In Scenario A, 17% of Activity Corridors have premium bicycle facilities.
Scenario C builds the fewest miles of roadways and incorporates sustainable design into every project, focusing the most on sustainable modes of transportation such as walking, bicycling, and using public transit.
Scenario B makes more progress towards sustainable design and reducing impacts to the environment by building fewer roadways than Scenario A and focusing more on sustainable modes of transportation such as walking, bicycling, and using public transit.
Scenario A continues the trend in making progress toward sustainable design and reducing impacts to the environment but builds more miles of roadways than Scenario B and C, which contributes to higher fuel consumption levels due to higher vehicles miles traveled.
Scenario C experiences the highest effectiveness of Transportation Demand Management through required programs and enhanced levels of Transportation System Management for high-capacity modes of transportation.
Scenario B increases the effectiveness of Transportation Demand Management through incentive programs and sees increased improvements in Transportation System Management through new technology.
Scenario A maintains the current effectiveness of Transportation Demand Management through voluntary programs and application of Transportation System Management through Intelligent Transportation Systems (ITS) and operational improvements.
Promote integrated designs and quality additions to the built environment while reducing impacts and promoting efficient use of public resources
Draw inspiration from forward-looking cities around the world, change the way we think about what’s possible, and set an example for the rest of the country
Commuter Delay
Travel Choice
Affordability
EconomicProsperity
Placemaking
Healthand Safety
Sustainability
Better
Better
GoodBetterBest
Good Better Best
Good Better Best
Good
Good
Good
Better Best
Best
Best
Good Better Best
Good Better Best
Innovation
6 7
All Ages and Abilities Bicycle Network: Framework for bicycle facility development where an 8-year-old or an 80-year-old should be able to navigate by bicycle comfortably and safely, including things like protected bike lanes or off-street urban trails.
Autonomous and Connected Vehicles: New motor vehicle technology that increasingly transfers responsibility from human drivers to computerized cars. There are varying levels of vehicle autonomy, ranging from features such as cruise control to the potential full automation of vehicles that do not require any human input. Connected vehicles are able to transfer important mobility data between vehicles and other infrastructure that allows the transportation network to optimize movement, deal with service interruptions, or perform important safety tasks.
CAMPO: The Capital Area Metropolitan Planning Organization is a governmental agency that provides cooperative and comprehensive transportation planning for the Central Texas region. CAMPO approves the use of federal and state transportation funds within Bastrop, Burnet, Caldwell, Hays, Travis, and Williamson counties.
Connections 2025: Capital Metro’s adopted short-range transit service plan, which identifies new frequent, commuter and local bus routes. The plan focuses on creating more frequent and reliable service for riders.
High-Capacity Transit: Public transportation that moves more people at more frequent intervals, usually because of dedicated space for public transit within the roadway. High-capacity transit is not limited to a specific mode of public transit (i.e. bus, rail, etc.).
Imagine Austin: The City’s 30-year comprehensive plan, adopted in 2012, lays out a community vision for how the city can grow in a compact and connected way.
Imagine Austin Corridors and Centers: The areas of growth identified within the comprehensive plan to define how we will accommodate new residents, jobs, mixed use areas, open space and transportation infrastructure over the next 30 years. These areas would be developed to be compact, walkable, and provide resources and services for local residents.
Intelligent Transportation Systems (ITS): Integrates advanced communication technologies into transportation infrastructure and in vehicles to increase safety, coordination, and efficiency of the transportation network for all users, including things like emergency vehicle notification systems or red light detection cameras.
Mode Share: The different methods people use to move around, such as a car, public transit, walking, etc. The mode share considers the percent of people who use each different mode of transportation for commuting.
Mode Shift: The change in transportation habits from using one specific mode of transportation to another.
Priority Sidewalks: These absent and existing deficient sidewalks were identified in the City of Austin’s 2016 Sidewalk Plan as areas that should be the focus of limited resources for sidewalk improvement and expansion. Existing sidewalk conditions are rated by the Public Works Department.
Street Impact Fee Study: An ongoing process led by the Austin Transportation Department to evaluate introducing a Street Impact Fee for new growth. The fee would be a charge assessed on new development to pay for the construction or expansion of roadway facilities necessitated by the new development.
Tier 1 and Tier 2 Urban Trails: Tier 1 urban trails have been identified by the City of Austin’s Urban Trails Plan as serving a high number of potential users. These trails are often located near a dense population, connect multiple destinations and attractions, and are often partially constructed. Tier 2 Urban Trails are other urban trails identified during the Urban Trail planning process, but are more conceptual than Tier 1 trails.
Transportation Demand Management Programming: Different initiatives that aim to increase the efficiency of the transportation network by encouraging travelers to shift away from driving alone in their vehicles and also shift away from driving during peak congested periods. Overall these strategies work to affect how people travel and can range from encouraging employers to use flexible work schedules, increased and subsidized carpooling for commuters, or improving traffic information for travelers.
Transportation System Management: Techniques used to improve transportation capacity, accessibility, reliability, and safety without physically increasing the overall size of infrastructure, including things like optimizing traffic signals, improving traffic incident management, or lengthening merge lanes.
TxDOT: The Texas Department of Transportation is a governmental agency responsible for overseeing the state’s highway, public transportation, and aviation systems. TxDOT allocates federal transportation funds to Metropolitan Planning Organizations like CAMPO and manages the State Transportation Improvement Plan.