AUSIA Framework to Improve On-Site Communication in the ...
297
University of Calgary PRISM: University of Calgary's Digital Repository Graduate Studies The Vault: Electronic Theses and Dissertations 2014-01-17 AUSIA Framework to Improve On-Site Communication in the Commercial Construction Industry Silva, Andarage Silva, A. (2014). AUSIA Framework to Improve On-Site Communication in the Commercial Construction Industry (Unpublished doctoral thesis). University of Calgary, Calgary, AB. doi:10.11575/PRISM/25069 http://hdl.handle.net/11023/1271 doctoral thesis University of Calgary graduate students retain copyright ownership and moral rights for their thesis. You may use this material in any way that is permitted by the Copyright Act or through licensing that has been assigned to the document. For uses that are not allowable under copyright legislation or licensing, you are required to seek permission. Downloaded from PRISM: https://prism.ucalgary.ca
Transcript of AUSIA Framework to Improve On-Site Communication in the ...

University of Calgary
PRISM: University of Calgary's Digital Repository
Graduate Studies The Vault: Electronic Theses and Dissertations
2014-01-17
AUSIA Framework to Improve On-Site Communication
in the Commercial Construction Industry
Silva, Andarage
Silva, A. (2014). AUSIA Framework to Improve On-Site Communication in the Commercial
Construction Industry (Unpublished doctoral thesis). University of Calgary, Calgary, AB.
doi:10.11575/PRISM/25069
http://hdl.handle.net/11023/1271
doctoral thesis
University of Calgary graduate students retain copyright ownership and moral rights for their
thesis. You may use this material in any way that is permitted by the Copyright Act or through
licensing that has been assigned to the document. For uses that are not allowable under
copyright legislation or licensing, you are required to seek permission.
Downloaded from PRISM: https://prism.ucalgary.ca

UNIVERSITY OF CALGARY
AUSIA Framework to Improve On-Site Communication in Commercial Construction
Industry
by
Andarage Lahiru Purna Silva
A THESIS
SUBMITTED TO THE FACULTY OF GRADUATE STUDIES
IN PARTIAL FULFILMENT OF THE REQUIREMENTS FOR THE
DEGREE OF DOCTOR OF PHILOSOPHY
DEPARTMENT OF CIVIL ENGINEERING
CALGARY, ALBERTA
NOVEMBER, 2013
© ANDARAGE LAHIRU PURNA SILVA 2013

iv
Abstract
Information has the best value when it is delivered to the correct place at the
correct time in the required format. Many scholars have noted information and
communication chaos in the construction industry. Inadequate communication and non-
availability of information were well observed in almost all construction projects
reviewed in this study, which caused low productivity. Further, workers also emphasized
inadequate communication in their working environment as a cause for low productivity.
Construction companies, with the help of technology developers, are trying to incorporate
numerous software/hardware systems to improve on-site communication. However, these
isolated systems may create more confusion in construction projects, due to the mismatch
of the software and hardware systems. Site observations reveal that supervisory staff lose
more than two hours a day as a result of ineffective information management.
The AUSIA framework discussed in this PhD thesis is a communication platform
based on information integration and field automation with an information hub called the
i-Booth. This framework integrates several other information/communication
technologies. There have been extensive pilot site implementation for prolonged periods
in commercial construction settings with very satisfactory results. The AUSIA
framework has been developed to improve accessibility of information while enhancing
the end user satisfaction and usefulness of the data through information integration. This
automated system ensures that the site and office can communicate in real time to
minimise time wastage and productivity loss due to ineffective information management.
The framework was implemented in a commercial construction project for one
year and the level of communication was measured before and after implementation.

v
Field staff judged improvement in communication through a survey instrument.
Statistical analysis was performed to determine enhancements in communication.
Communication was judged according to ten information categories and analysis revealed
that research subjects overall perception on communication was improved compared to
the earlier state, while increasing their perception on information integration and field
automation significantly. Field staff appreciated that virtual design and construction were
integrated with the field level through an infrastructure to interact with models, with
minimal training. With the conclusion of the research the AUSIA framework was
successfully commercialized and the first kiosk was sold in early 2013 to a general
contractor.

vi
Acknowledgements
I would like express my gratitude for the guidance given to me by my supervisor,
Prof. Janaka Ruwanpura. I have been extremely lucky to have a supervisor who has
provided me with motivation, enthusiasm, and invaluable advice. I'd like to thank him for
allowing me the space and freedom I needed to work. I would also like to thank my co-
supervisor, Dr. Kasun Hewage, who guided me from the very beginning of my research
and who has been a source of inspiration to me. I'm very grateful for the numerous
discussions and arguments to reshape the research.
I would also like acknowledge Prof. George Jergeas and Prof. Frank Maurer of
my supervisory committee for providing me with insightful comments. A special thank
you to my fellow graduate students Gamini Weerasinghe, Jamal Siadat, Sulochana
Madanayake, and Tharindu Weerasinghe, and the technical staff of the Department of
Civil Engineering, especially Terry Quinn, Daniel Larson, and Mirsad Berbic for their
support. I would like to recognise the efforts of Dr. Kamal Ranaweera for his help in
developing the software platform. My sincere gratitude to members of CCA and
FIATECH, especially to Dave Smith, Dr. Richard Jackson, and Nicole Testa Boston for
the support and feedback provided throughout the research.
I'm grateful for the funding and support provided for this research project by Ellis
Don, Graham, PCL, and Ledcor companies, the Construction Research Institute of
Canada, the Canadian Construction Research Board, the Calgary Construction
Association, and the Natural Sciences Engineering Research Council (NSERC). My
sincere gratitude to Bruce White, Bruce Sonnenberg, and staff members of PCL
Construction, especially Derek Pearce, Ron Patterson, and Bob Genee.

vii
I would like to express my earnest gratitude to my parents for providing me with
an excellent foundation for life and for their unconditional support throughout my
studies. And last but not least I would love to thank my wife and daughter for believing in
me, and for the help and support they provided. The best outcome from these past seven
years is finding my best friend, soul mate, and wife. I married the best person out there
for me.

viii
Dedication
This thesis is dedicated to my parents, my wife, and my daughter for their endless love,
guidance, and encouragement.

ix
Table of Contents
Approval Page ..................................................................................................................... ii Abstract .............................................................................................................................. ivAcknowledgements ............................................................................................................ viDedication ........................................................................................................................ viiiTable of Contents ............................................................................................................... ixList of Tables ................................................................................................................... xivList of Figures and Illustrations ....................................................................................... xviList of Symbols, Abbreviations and Nomenclature ......................................................... xxi
CHAPTER ONE: INTRODUCTION ..................................................................................11.1 Background ................................................................................................................11.2 Problem Definition ....................................................................................................31.3 Research Question .....................................................................................................41.4 Research Goal and Objectives ...................................................................................41.5 Research Approach ....................................................................................................51.6 Thesis Structure .........................................................................................................6
1.6.1 Chapter One: Introduction .................................................................................61.6.2 Chapter Two: Literature Review .......................................................................61.6.3 Chapter Three: Conceptual Framework and Research Methodology ...............71.6.4 Chapter Four: Data Collection, Analysis, and System Development (Pre-
Implementation) .................................................................................................71.6.5 Chapter Five: Site Implementation and Testing ................................................71.6.6 Chapter Six: Data Collection and Analysis (During Implementation) ..............71.6.7 Chapter Seven: Data Collection, Analysis, Validation of Results, and
System Development (Post-Implementation) ....................................................71.6.8 Chapter Eight: Conclusion, Recommendations, and Future Research ..............8
CHAPTER TWO: LITERATURE REVIEW ......................................................................92.1 Construction Productivity ..........................................................................................92.2 Factors Affecting Construction Labour Productivity ..............................................112.3 Current Information Management and Drawbacks .................................................172.4 Classification and Design Guidelines for Information Kiosk Systems ...................19
2.4.1 Information Kiosks ..........................................................................................192.4.2 Advertising Kiosks ..........................................................................................192.4.3 Service Kiosks .................................................................................................192.4.4 Entertainment Kiosks ......................................................................................202.4.5 Information Dissemination & Advertising Kiosks ..........................................202.4.6 Interactive Information Kiosks ........................................................................202.4.7 Transaction Kiosks ..........................................................................................21
2.5 Information Integration, Field Level Automation, and Technology Usage in Construction ...........................................................................................................22
2.5.1 IT Automation .................................................................................................222.5.2 IT Integration ...................................................................................................23
2.6 Technology Readiness Level (TRL) and System Readiness Level (SRL) ..............272.7 Technology Readiness Index (TRI) .........................................................................27

x
2.8 Touch Screen Systems (Single Touch and Human Touch) .....................................292.9 Investments on Technology and Productivity .........................................................342.10 Supervision in Construction ...................................................................................352.11 User Acceptance of Mobile Technology in the Construction Industry .................362.12 Discussion and Conclusion ....................................................................................43
CHAPTER THREE: CONCEPTUAL FRAMEWORK AND RESEARCH METHODOLOGY ...................................................................................................46
3.1 Conceptual Framework of AUSIA ..........................................................................463.2 AUSIA Framework Mind Map ................................................................................483.3 Hypothesis ...............................................................................................................493.4 Research Methodology ............................................................................................52
3.4.1 Research Phases ...............................................................................................543.4.1.1 Phase I (Objectives I & II) .....................................................................543.4.1.2 Phase II (Objectives I, II & III) ..............................................................563.4.1.3 Phase III (Objectives III and IV) ...........................................................573.4.1.4 Phase IV (Objective IV) ........................................................................59
3.5 Sample Size Selection ..............................................................................................603.6 Techniques and Tools Utilized in the Research Study ............................................62
3.6.1 Literature Review ............................................................................................623.6.2 Questionnaire Survey ......................................................................................633.6.3 Interviews ........................................................................................................633.6.4 Document Analysis .........................................................................................643.6.5 Workshops .......................................................................................................643.6.6 Site Observations .............................................................................................643.6.7 Data Analysis ...................................................................................................65
3.7 Validation and Verification of Results ....................................................................653.8 Bias Associated with the Research ..........................................................................673.9 Limitations of the Study ..........................................................................................683.10 Problems Encountered and Solutions Provided .....................................................693.11 Conclusion .............................................................................................................70
CHAPTER FOUR: DATA COLLECTION, ANALYSIS AND SYSTEM DEVELOPMENT (PRE-IMPLEMENTATION) .....................................................72
4.1 State of Information Management in the Construction Industry in North America ..................................................................................................................72
4.2 AUSIA System Development ..................................................................................894.2.1 Zero Generation (Information Booth) .............................................................894.2.2 First Generation (i-Booth) ...............................................................................90
4.2.2.1 Shop Drawings .......................................................................................954.2.2.2 Changes ..................................................................................................98
4.2.3 First Generation AUSIA Framework System Architecture ...........................1004.3 Software Developers Contribution ........................................................................1064.4 Conclusion .............................................................................................................106
CHAPTER FIVE: SITE IMPLEMENTATION AND TESTING ...................................1085.1 Site Selection .........................................................................................................109
xi
5.2 Existing Information Handling ..............................................................................1115.3 Activity Monitoring ...............................................................................................1135.4 Integrating AUSIA Framework with Operational Level .......................................115
5.4.1 Location Selection .........................................................................................1155.4.2 Information & Communication Management ...............................................1165.4.3 Feedback Received & Modifications ............................................................118
5.5 Project Success ......................................................................................................1185.6 Main Objectives Satisfied By Site Implementation ...............................................1205.7 Conclusion .............................................................................................................120
CHAPTER SIX: DATA COLLECTION AND ANALYSIS (DURING IMPLEMENTATION) ...........................................................................................122
6.1 Hypothesis Testing ................................................................................................1226.2 Comparing the Site Group with the Online Group ................................................1376.3 Conclusion .............................................................................................................146
CHAPTER SEVEN: DATA COLLECTION, ANALYSIS, VALIDATION OF RESULTS, AND SYSTEM DEVELOPMENT (POST-IMPLEMENTATION) ...147
7.1 User Acceptance of AUSIA Framework ...............................................................1497.2 Validation of Site Implementation Results ............................................................1567.3 Modified AUSIA Framework (Second Generation i-Booth) ................................159
7.3.1 Types of Kiosks .............................................................................................1617.3.2 Hardware Components for the Kiosk ............................................................163
7.3.2.1 Touch Screen .......................................................................................1637.3.2.2 Key Board & Track Ball ......................................................................1637.3.2.3 Ruggedized Printer ..............................................................................1647.3.2.4 Capture Pen ..........................................................................................1647.3.2.5 BIM 3D Mouse ....................................................................................1657.3.2.6 Document Scanner ...............................................................................1657.3.2.7 GPS Tracking Device ..........................................................................165
7.3.3 Access Control Methods ................................................................................1667.3.4 Mobile Handheld Devices to Integrate with Kiosk .......................................1667.3.5 Software Components for the Kiosk .............................................................168
7.3.5.1 PDF Editor and Viewer ........................................................................1687.3.5.2 BIM Viewer/Autodesk Navisworks Freedom .....................................1707.3.5.3 DWF and DWG Viewers .....................................................................170
7.3.6 Information Arrangement in The System ......................................................1717.3.6.1 Design Drawings ..................................................................................1717.3.6.2 Shop Drawings .....................................................................................1727.3.6.3 Specifications .......................................................................................1737.3.6.4 Quality .................................................................................................174
7.4 Distribution Matrix ................................................................................................1747.5 Commercial AUSIA Framework (2nd Generation i-Booth) ...................................1757.6 Final Acceptance Testing .......................................................................................1787.7 BVG Sessions ........................................................................................................1817.8 Software Developers Contribution ........................................................................1817.9 Conclusion .............................................................................................................182

xii
CHAPTER EIGHT: CONCLUSIONS, RECOMMENDATIONS, AND FUTURE RESEARCH ............................................................................................................184
8.1 Research Summary ................................................................................................1848.2 Research Outcome/Findings ..................................................................................1858.3 Research Contribution ...........................................................................................1888.4 Research Limitations .............................................................................................1908.5 Future Research and Recommendations ................................................................191
REFERENCES ................................................................................................................193
APPENDIX I – COMBINED SUMMARY OF PRODUCTIVITY FACTORS .............204
APPENDIX II - SUMMARY OF HUMAN ASPECTS IN KIOSK DESIGN ................206
APPENDIX III – COMPLETE LIST OF HYPOTHESIS FOR AUSIA FRAMEWORK.......................................................................................................210
APPENDIX IV - CONFIDENTIALITY AGREEMENT................................................220
APPENDIX V - INFORMATION MANAGEMENT QUESTIONNAIRE (ONLINE) .227
APPENDIX VI - TECHNOLOGY READINESS INDEX (TRI) QUESTIONNAIRE ..230
APPENDIX VII – TIME WASTE DATA ENTRY SHEET ...........................................235
APPENDIX VIII - PRESENT STATE OF INFORMATION MANAGEMENT ...........236
APPENDIX IX – ERROR MARGIN CALCULATION FOR SAMPLE SIZE ..............240
APPENDIX X – TOOL TIME OBSERVATION SHEET ..............................................241
APPENDIX XI – DEMO SOFTWARE OVERVIEW ....................................................242
APPENDIX XII – PRESENT INFORMATION FLOW.................................................245
APPENDIX XIII - EVALUATION OF FIELD MANAGEMENT PERSONNEL ........249
APPENDIX XIV - INFORMATION MANAGEMENT AFTER IMPLEMENTATION .............................................................................................251
APPENDIX XV – KOLMOGOROV–SMIRNOV TEST STATISTICS ........................255
APPENDIX XVI – PREFERENCE CHANGE BEFORE AND AFTER IMPLEMENTATION .............................................................................................257
APPENDIX XVII – ACCEPTANCE TESTING WORKSHOP INSTRUMENT ..........262
APPENDIX XVIII - IMPLEMENTATION OF DIGITAL PEN ....................................263

xiii
APPENDIX XIX - COST BREAKDOWN AND RECOVERY OF INVESTMENT FOR I-BOOTH SOFTWARE DEVELOPMENT ..................................................265
APPENDIX XXI – PERMISSION TO REUSE COPYRIGHTED MATERIAL ...........272

xiv
List of Tables
Table 2.1: Normalized Values for the Factors/Parameters (Modified .............................. 13
from Moselhi and Khan 2010) .......................................................................................... 13
Table 2.2: Characteristics of Technology Segments (Adopted from Parasuraman, 2000) ......................................................................................................................... 29
Table 2.3: Summary of Available Touch Screen Technologies ....................................... 31
Table 3.1: Null Hypothesis for Drawings ......................................................................... 51
Table 3.2: Alternative Hypothesis for Drawings .............................................................. 51
Table 4.1: Time Waste Due to Inappropriate Information Management/Communication ................................................................................... 88
Table 5.1: Tool-Time Observation Intervals .................................................................. 114
Table 5.2: Summary of Information Management ......................................................... 117
Table 6.1: Wilcoxon Signed Ranked Test Statistics Table ............................................. 124
Table 6.2: Wilcoxon Signed Ranks of Drawings ............................................................ 125
Table 6.3: Mann-Whitney U-Test Statistics Table for Drawings and Changes ............. 141
Table 6.4: Mann-Whitney U Test Statistics Table for Safety and Schedule .................. 142
Table 6.5: Mann-Whitney U Test Statistics Table for Material and 3D/4D Models ...... 143
Table 6.6: Mann-Whitney U Test Statistics Table for Weather and Technical .............. 144
Table 6.7: Mann-Whitney U Test Statistics Table for Quality and Certifications ......... 145
Table 7.1: Access Control Methods ................................................................................ 166
Table 7.2: Handheld Devices .......................................................................................... 167
Table 7.3: Acceptance Testing Survey - 2nd Generation i-Booth (AUSIA Framework) 180
Table A1: Null and Alternative Hypothesis for Drawings ............................................. 210
Table A2: Null and Alternative Hypothesis for Changes ............................................... 211
Table A3: Null and Alternative Hypothesis for Safety Information ............................... 212
Table A4: Null and Alternative Hypothesis for Schedule Information .......................... 213

xv
Table A5: Null and Alternative Hypothesis for Material Information ........................... 214
Table A6: Null and Alternative Hypothesis for 3D/4D Models ..................................... 215
Table A7: Null and Alternative Hypothesis for Quality Related Information ................ 216
Table A8: Null and Alternative Hypothesis for Certifications ....................................... 217
Table A9: Null and Alternative Hypothesis for Weather Information ........................... 218
Table A10: Null and Alternative Hypothesis for Technical Information ....................... 219
Table A11: K-S Test Before Implementation ................................................................. 255
Table A12: K-S Test After Implementation ................................................................... 256
Table A13: Wilcoxon Signed Ranks of Drawings .......................................................... 257
Table A14: Wilcoxon Signed Ranks of Changes (SI, RFI, PCN) .................................. 257
Table A15: Wilcoxon Signed Ranks of Safety ............................................................... 258
Table A16: Wilcoxon Signed Ranks of Schedule ........................................................... 258
Table A17: Wilcoxon Signed Ranks of Material ............................................................ 259
Table A18: Wilcoxon Signed Ranks of 3D/4D Models ................................................. 259
Table A19: Wilcoxon Signed Ranks of Quality ............................................................. 260
Table A20: Wilcoxon Signed Ranks of Certifications ................................................... 260
Table A21: Wilcoxon Signed Ranks of Weather ............................................................ 261
Table A22: Wilcoxon Signed Ranks of Technical ......................................................... 261
Table A23: Cash Flow Forecast for Next 3 Years .......................................................... 266
Table A24: AUSIA Framework Hardware Cost ............................................................. 267

xvi
List of Figures and Illustrations
Figure 1.1: Labour Productivity Index: 2002-2011, Construction (NAICS 23) (Industry Canada, 2013) .............................................................................................. 2
Figure 2.1: Relative Contribution of Parameters in Daily Labour Productivity (Modified from Moselhi and Khan 2012) ................................................................. 12
Figure 2.2: Productivity as a Function of Individual Parameters/Factors (Moselhi and Khan 2010) ................................................................................................................ 13
Figure 2.3: Productivity as a Function of Temperature and Humidity (Moselhi and Khan 2010) ................................................................................................................ 15
Figure 2.4: Relationship Between Factors and Construction Productivity (Nasirzadeh and Nojedehi 2013) ................................................................................................... 16
Figure 2.5: Classification of Kiosk Systems ..................................................................... 21
Figure 2.6: Conceptual Diagram of Technology Readiness (Parasuraman, 2000) ........... 28
Figure 2.7: One-handed and Two-handed Interaction (Adopted from Song-Gook et al, 2007) ......................................................................................................................... 33
Figure 2.8: Total Time Distribution of a Typical Foreman (Modified from Gannoruwa 2008) ......................................................................................................................... 35
Figure 2.9: Breakdown of Survey Respondents According to Industry Sector (Modified from FIATECH, 2013) ............................................................................ 37
Figure 2.10: Value of Mobile Technologies for Design and Specifications in Field Reporting (Modified from FIATECH, 2013) ........................................................... 38
Figure 2.11: Value of Mobile Technologies for Project Control in Field Reporting (Modified from FIATECH, 2013) ............................................................................ 40
Figure 2.12: Value of Mobile Technologies for Quality in Field Reporting (Modified from FIATECH, 2013) .............................................................................................. 41
Figure 2.13: Value of Mobile Technologies for Safety in Field Reporting (Modified from FIATECH, 2013) .............................................................................................. 42
Figure 2.14: Value of Mobile Technologies for Material Management in Field Reporting (Modified from FIATECH, 2013) ........................................................... 42
Figure 2.15: Value of Mobile Technologies for Project Delivery in Field Reporting (Modified from FIATECH, 2013) ............................................................................ 43
Figure 3.1: Conceptual Framework .................................................................................. 47

xvii
Figure 3.2: AUSIA Mind Map .......................................................................................... 49
Figure 3.3: Research Flow Diagram ................................................................................. 53
Figure 4.1: Distribution of Research Subjects According to Industry Sector ................... 73
Figure 4.2: Distribution of Research Subjects According to Years of Experience .......... 73
Figure 4.3: Methods Used To Disseminate Information According to Research Subjects ..................................................................................................................... 74
Figure 4.4: Methods of Updating Information According to Research Subjects ............. 75
Figure 4.5: Issues/Problems Industry Faced with Information Integration, Updating, and Dissemination ..................................................................................................... 76
Figure 4.6: Participants’ Willingness to Deploy Soft Copies on Site ............................... 78
Figure 4.7: Reason for Deployment and Non Deployment of Soft Copies ...................... 78
Figure 4.8: Issues/Problems the Industry Faced when Deploying Soft Copies ................ 79
Figure 4.9: Organizational Expertise on 3D/4D Model Usage ......................................... 80
Figure 4.10: Methods of Using and Integrating 3D/4D Models at the Site Level ............ 81
Figure 4.11: Purposes of 3D/4D Models at Site Level ..................................................... 82
Figure 4.12: Infrastructure Available to Access 3D/4D Models at Site Level ................. 84
Figure 4.13: Issues/Problems Industry Faced with Deployment of 3D/4D Models ......... 85
Figure 4.14: Zero Generation (Information Booth) .......................................................... 90
Figure 4.15: First Generation i-Booth ............................................................................... 92
Figure 4.16: Demonstration Graphical User Interface (GUI) of First Generation i-Booth ......................................................................................................................... 93
Figure 4.17: Information Flow Chart for a Rebar Shop Drawing ..................................... 96
Figure 4.18: Information Flow Chart for a Formwork Shop Drawing ............................. 98
Figure 4.19: Information Flow Chart for a Request for Information (RFI) ...................... 99
Figure 4.20: Information Flow Chart for a Site Instruction (SI)..................................... 100
Figure 4.21: First Generation Framework (i-Booth) ....................................................... 102

xviii
Figure 4.22: Graphical User Interface (GUI) of First Generation i-Booth ..................... 103
Figure 4.23: Hierarchical Classification of First Generation i-Booth ............................. 104
Figure 4.24: Drawing Menu ............................................................................................ 105
Figure 5.1: Project Site Plan ........................................................................................... 108
Figure 5.2: Project Working Time Analysis ................................................................... 115
Figure 6.1: Research Subjects Perception Change Regarding AUSIA of Drawings Category after Implementation ............................................................................... 126
Figure 6.2: Research Subjects Perception Change Regarding AUSIA of Changes Category after Implementation ............................................................................... 127
Figure 6.3: Research Subjects Perception Change Regarding AUSIA of Safety Category after Implementation ............................................................................... 128
Figure 6.4: Research Subjects Perception Change Regarding AUSIA of Schedule Category after Implementation ............................................................................... 129
Figure 6.5: Research Subjects Perception Change Regarding AUSIA of Changes Category after Implementation ............................................................................... 130
Figure 6.6: Research Subjects Perception Change Regarding AUSIA of 3D/4D Models Category after Implementation .................................................................. 131
Figure 6.7: Research Subjects Perception Change Regarding AUSIA of Materials Category after Implementation ............................................................................... 132
Figure 6.7: Research Subjects Perception Change Regarding AUSIA Certifications Category after Implementation ............................................................................... 133
Figure 6.9: Research Subjects Perception Change Regarding AUSIA of Weather Category after Implementation ............................................................................... 134
Figure 6.10: Research Subjects Perception Change Regarding AUSIA of Technical Category after Implementation ............................................................................... 135
Figure 6.11: Research Subjects Overall Perception Change Regarding AUSIA after Implementation ....................................................................................................... 137
Figure 6.12: Distribution of Research Subjects According to Industry Sector ............... 138
Figure 6.13: Distribution of Research Subjects According to Years of Experience ...... 139
Figure 7.1: Distribution of Research Subjects According to Industry Sector ................ 147

xix
Figure 7.2: Distribution of Research Subjects According to Years of Experience ........ 148
Figure 7.3: Participants Awareness of i-Booth ............................................................... 148
Figure 7.4: Participants Willingness to Deploy i-Booth ................................................. 149
Figure 7.5: Participants preference on Best Location to Keep i-Booth .......................... 150
Figure 7.6: Methods to Encourage End-Users to Utilize i-Booth ................................... 150
Figure 7.7: Participants Preference of Access Control ................................................... 151
Figure 7.8: Participants Preference of Access Control Methods for i-Booth ................. 152
Figure 7.9: User Ratings on Value Addition from Input Devices .................................. 153
Figure 7.10: Categorization of Essential and Optional Hardware Items According to Online Participants Preference ................................................................................ 154
Figure 7.11: Categorization of Essential and Optional Hardware Items According to On-Site Participants Preference .............................................................................. 154
Figure 7.12: Online Participants Perception on Value Addition from Input Devices .... 155
Figure 7.13: On-Site Participants Perception on Value Addition from Input Devices ... 156
Figure 7.14: Online Participants Perception on Benefits of i-Booth .............................. 157
Figure 7.15: On-Site Participants Perception on Benefits of i-Booth ............................. 158
Figure 7.16: Conceptual AUSIA Framework (Second Generation i-Booth) .................. 160
Figure 7.17: Mobile Kiosk .............................................................................................. 162
Figure 7.18: Wall-mounted Kiosk .................................................................................. 162
Figure 7.19: Level 3 Concrete Beam Schedule Integrated with Site Instructions .......... 169
Figure 7.20: 3D Interactive PDF Model (Adobe, 2013) ................................................. 170
Figure 7.21: Classification of Design Drawings ............................................................. 172
Figure 7.22: Classification of Shop Drawings ................................................................ 173
Figure 7.23: Classification of Specifications .................................................................. 173
Figure 7.24: Classification of Quality ............................................................................. 174
Figure 7.25: Three 'I' Principles of AUSIA Framework ................................................. 176

xx
Figure 7.26: Integration in AUSIA Framework .............................................................. 177
Figure 7.27: GUI of Second Generation i-Booth ............................................................ 178
Figure 8.1: Digital Drawing Table .................................................................................. 192

xxi
List of Symbols, Abbreviations and Nomenclature
Abbreviation Definition AEC Architectural Engineering and Construction
ATM Automated Teller Machine
BIM Building Information Modeling
BVG Business Validation Group
CCA Calgary Construction Association
CO Change Order
CAD Computer-Aided Design
CII Construction Industry Institute
CLP Construction Labour Productivity
COAA Construction Owners Association of Alberta
CSI Construction Specifications Institute
CR Contemplated Revisions
DoD Department of Defence
D/IT Design/Information Technology
DWF Design Web Format
DWG DraWinG
EDI Electronic Data Interchange
EPC Engineering Procurement and Construction
ERP Enterprise Resource Planning
FIATECH Fully Integrated and Automated Technologies for Construction
xxii
Abbreviation Definition GUI Graphical User Interface
HID Human Interface Devices
ICT Information and Communication Technology
IT Information Technology
IPD Integrated Project Delivery
IFC Issued for Construction
LEED Leadership in Energy and Environmental Design
MSDS Material Safety Data Sheets
NASA National Aeronautics and Space
Administration
NSERC Natural Sciences and Engineering Research
Council
PDA Personal Digital Assistant
PIN Personal Identification Number
PDF Portable Document Format
PDS Portable Document Solutions
PCN Project Change Notice
QA/QC Quality Assurance/Quality Control
QR Quick Reference
RFI Request for Information
ROI Return on Investment
SI Site Instructions
xxiii
Abbreviation Definition SIM Subscriber Identity Module
SRL System Readiness Level
TRI Technology Readiness Index
TRL Technology Readiness Level
3D Three Dimensional
TFP Total Factor Productivity
UPS Uninterrupted Power Supply
UofC University of Calgary
VDC Virtual Design and Construction

1
Chapter One: Introduction
This chapter briefly explains the nature of the construction industry in Canada and
the importance of construction productivity improvement. The rest of the chapter
discusses the structure of the thesis, the research approach, and the research objectives.
1.1 Background
The Construction Sector Council's (Build Force) forecast for 2011-2019 reports a
shortage of nearly 40,000 workers in Alberta. The construction industry in Alberta
employs about 140,000 workers and the Construction Sector Council report (2012)
predicts this will increase to 200,000 by 2019. The solution to this problem is to either
bring workers from outside into Alberta’s construction market or increase the
construction labour productivity of the existing work force. Industry associations such as
the Calgary Construction Association are trying to bridge the gap by introducing
programs to attract youth, women, and aboriginal communities to the construction
industry. As construction labour amounts to an average of 20% to 50% of the direct
capital cost of a project, the industry must find a method to arrest declining productivity
(Buchan et al., 1993; Hwang et al., 2013). Many researchers have reported a decline in
construction productivity across North America since the mid-1970’s (Heale, 1993).
Research studies conducted in different parts of the world have also reported declining or
stagnant construction productivity over the past few decades (Ganesan, 1984; The
Business Roundtable, 1989; Dozzi & Abourizk, 1993; McTague & Jergeas, 2003). A
recent study conducted by the Construction Industry Institute (CII), the Construction
Owners Association of Alberta (COAA), and Alberta Finance and Enterprise revealed

2
that construction productivity of concrete and instrumentation are worse than in the US
gulf coast, while structural steel productivity is comparable. As average wage rates in
Alberta are higher than in the US, improved productivity in Alberta will enhance the
competitive edge (Construction Industry Institute, 2009). According to Industry Canada,
from 2002-2011 labour productivity in the construction sector decreased 0.7% per year
on average while labour productivity (construction labour productivity is simply the time
taken to produce a unit amount or the amount made in a unit time) for the Canadian
economy increased 1.7% per year (see Figure 1.1 below).
Figure 1.1: Labour Productivity Index: 2002-2011, Construction (NAICS 23) (Industry Canada, 2013)
There was a positive trend reported in 2009, but compared to the increase in
Canadian economy this increase was negligible (in 2011 labour productivity in the
construction sector increased by 0.4%, compared to a 3.0% increase for the Canadian
economy).
3
1.2 Problem Definition
The University of Calgary (U of C) initiated a research project in collaboration
with leading construction companies in Alberta, and the Natural Sciences and
Engineering Research Council (NSERC) to find solutions for declining construction
productivity. This research team reported inadequate communication as a primary reason
for the decline in construction productivity (Hewage and Ruwanpura, 2006b). This
research team proposed and pilot tested an interactive information kiosk to bridge the
communication gap.
Significant value may be gained by the construction industry if technology could
be leveraged more effectively to improve its productivity (Goodrum et al., 2011).
Nonetheless the construction industry is lagging behind other industries in implementing
Design/Information Technology. O’Connor and Yang (2004) have investigated the
reasons for the construction industry’s reluctance to implement new technologies. They
indicated that lack of information and understanding regarding technological benefits
have contributed to the industry’s apparent technical stagnation. Hewage and Ruwanpura
(2009) conceptualized a novel solution to improve on-site communication called
‘information booth’. In order to validate this concept an information kiosk and software
infrastructure was required. Research work related to this thesis initiated with the
challenge of designing and implementing an information kiosk to improve
communication in the construction industry. The main objective of this thesis was to
design the hardware component of the kiosk and develop a high-level system architecture
(features and functions of the software).

4
1.3 Research Question
Improving both construction labour productivity and overall performance of a
construction company is the end goal of the U of C research team. According to
published literature, communication is a critical factor for improving construction
productivity. This communication deficiency in the construction industry might be
subdued by utilizing information and communication technologies.
The research question related to this thesis can be formulated as follows:
“Can an automated and integrated information system improve on-site
communication?”
1.4 Research Goal and Objectives
The main goal of this research is to develop and implement an automated and
integrated information system (AUSIA Framework) to improve on site communication in
commercial construction. The following are the defined research objectives:
Objective 1: Investigate the information flow and the bottlenecks in the
commercial construction industry in Alberta.
Objective 2: Investigate communication needs of construction workers and
field supervisors.
Objective 3: Develop an automated and integrated information management
system to improve on site communication.
Objective 4: Test and validate the automated and integrated information
management system in the actual construction field environment.

5
1.5 Research Approach
A brief description of the research evolution and research methodology is
discussed in this section. A detailed research methodology is presented in the Chapter
3.The research work in this thesis can be divided into four main phases, i.e. Phase I to
Phase IV. Phase I of the research work concentrated on investigating construction
productivity loss due to insufficient communication. Phase II dealt with finding solutions
for the issues identified in Phase I. The solutions identified in Phase II were implemented
in the Phase III. The final phase of the research focused on validating the findings from
site implementation.
Phase I of the research consisted of a comprehensive literature review before
conducting interviews and observations on construction sites. Interviews were carried out
to find the communication deficiencies in the operational level from office managers, site
managers, foremen, and lead hands. Observations were conducted to investigate
information handling and information management at the operational level. Finally, an
online survey was carried out to reinforce the findings from the interviews and
observations. Phase I of the research study revealed the deficiencies in on-site
communication.
In Phase II emphasis was on conceptualizing a framework (kiosk and software
infrastructure) to resolve the communication deficiencies. Interviews were conducted to
find suitable human interface devices (HIDs) for the proposed kiosk and user acceptance.
The next phase emphasized on site implementation of the proposed solution. Initially a
time motion study was conducted to assess the site conditions, then workshops were
conducted to evaluate the present level of communication. Another survey was conducted

6
to determine time wasted due to poor information management. The framework was
implemented for twelve months in a commercial construction site in Calgary. After
implementation of the framework was concluded workshops were conducted to evaluate
the change in level of communication.
The final phase focused on validating the outcomes from the previous phase. Two
workshops and one acceptance test was conducted to verify the results gathered from
implementation.
1.6 Thesis Structure
The thesis consists of eight chapters and each chapter is briefly discussed below.
1.6.1 Chapter One: Introduction
Chapter One consists of a brief overview of the research, research question,
research objectives, research approach, and structure of the thesis. This chapter discusses
the nature of the Canadian construction industry and rationale behind the research.
1.6.2 Chapter Two: Literature Review
Chapter Two provides an introduction to the productivity concepts and factors
affecting productivity. This chapter also discusses current information management
practices, design guidelines and kiosk classifications, information integration and
automation, touch screen systems, technology readiness level/index, and supervision in
construction.

7
1.6.3 Chapter Three: Conceptual Framework and Research Methodology
This chapter explains the development of the research methodology, conceptual
framework, research design, associated research tools, and techniques used to analyse and
validate the result. This also includes the constraints and limitations of the research study.
1.6.4 Chapter Four: Data Collection, Analysis, and System Development (Pre-Implementation)
This consists of the current state of information management based on results
from interviews and site observations. The latter half of the chapter consists of step by
step development of the first generation information system.
1.6.5 Chapter Five: Site Implementation and Testing
This chapter describes how the AUSIA framework was implemented, tools and
techniques adopted to collect data, and how testing was carried out.
1.6.6 Chapter Six: Data Collection and Analysis (During Implementation)
This chapter describes qualitative and quantitative analysis methods used to
investigate the real impact of the implemented AUSIA framework on communication and
construction productivity.
1.6.7 Chapter Seven: Data Collection, Analysis, Validation of Results, and System Development (Post-Implementation)
User acceptance of the AUSIA framework, validation of results, and development
of the second generation AUSIA framework based on lessons learned are discussed. A

8
briefing about the cost benefit analysis of the AUSIA framework from both solution
provider perspective and client perspective is included.
1.6.8 Chapter Eight: Conclusion, Recommendations, and Future Research
This chapter provides conclusions and recommendations for future research based
on the findings from the research project.

9
Chapter Two: Literature Review
This chapter consists of literature pertaining to this thesis in the following
knowledge areas: construction productivity, information management, information
technology, information integration and field automation, technology readiness, and
readiness of workforce.
Inadequate communication and management factors are critical issues that lead to
declining construction productivity (Dozzi and Abourizk, 1993). Liberda et al (2003)
identified fifty-one factors related to the decline in construction productivity in Alberta.
Thirty-five of those factors are significantly related to poor management practices in the
construction industry. Site management is directly responsible for more than 50% of the
time wasted due to poor management practices (Haas et al., 1999). Supervisory staff
plays a key role in communicating with workers and spends a significant amount of time
with them during a work day (Gannoruwa and Ruwanpura, 2008). Therefore, better
utilization of supervision time is a critical factor to improve efficiency and productivity
of construction work.
2.1 Construction Productivity
The terms related to productivity include construction productivity, labour
productivity, and on-site productivity. Many terms are used to describe productivity in
the construction industry: performance factor, production rate, unit person hour rate, and
so on. Construction Labour Productivity (CLP) can be simply defined as output generated
per unit input. However, the meaning of “productivity” varies with its application to
different areas of the construction industry. Definitions range from industry wide

10
economic parameters to the measurement of crews and individuals. Each of these
measures has its own unique purpose (Jergeas and McTague, 2002). In the construction
business, the inputs can be comprised of labour, materials, machinery, tools, time,
information and capital, etc., whereas the output includes the finished product (e.g. a
building) in a dollar value or specific unit of measurement. Method of measuring the
output will vary depending on the activity, for example by measuring the liner meters,
square meters, and cubic members or by weight. According to Dozzi and AbouRizk
(1993), traditionally, productivity is defined as a ratio of input/output, i.e. the ratio of the
input of an associated resource to a real output in creating economic value. Even though
productivity is generally accepted as the amount of output produced by one unit of input,
the above mentioned work by Dozzi and AbouRizk (1993), Thomas et al. (1999), and
Rowings Jr. and Sonmez (1996) analyzed productivity reciprocally, as the ratio of the
input of associated resources to output. Scholars emphasized that construction labour
productivity is essentially a single factor measure of productivity and it relates to an
output to only the labour work hours expended in the generation of that output. But Noor
(1992) and Thomas et al. (1990) expressed it mathematically:
(2.1)
Many scholars have discussed Total Factor Productivity (TFP) as a concept
gaining in importance because the more popular measure of labour productivity or value
added per unit labour suffers from the shortcoming that it does not reveal why the
productivity has risen or fallen. It could be due to fluctuations of input of capital
expenditure, or labour work hours. The TFP approach attempts to go into the “why” of

11
productivity changes and thus gives deeper insight into the underlying causes and
sustainability of growth or production. Overheads are the operating expenses of the
business (or simply the running cost.)
(2.2)
2.2 Factors Affecting Construction Labour Productivity
Construction productivity is influenced by many factors, thus many researchers
have tried to identity relationships between these factors. Based on the research work
conducted by the University of Concordia, researchers Moselhi and Khan (2012)
concluded that “temperature most significantly affects daily performance and the type of
work being executed is the second most important parameter affecting the daily outputs”.
Several researchers have worked on the effect of climate on productivity and Koehn and
Brown (1985) have reported that it is difficult to achieve efficient construction operations
below -10oF (-23.3oC) and above 110oF (43.38oC). Especially in Calgary, Alberta, during
the winter season, temperature changes significantly. As a result researchers cannot
isolate the productivity change due to the technology implemented. Figure 2.1 below
represents the contribution from each factor to construction labour productivity.

12
Figure 2.1: Relative Contribution of Parameters in Daily Labour Productivity (Modified from Moselhi and Khan 2012)
Many researchers around the world have investigated the factors affecting
construction labour productivity. Recent publications by Khaled and Remon (2013)
summarise factors affecting construction labour productivity worldwide. In this thesis,
information from Canada and other countries has been included with the summary
developed by Khaled and Remon (the combined summary is in Appendix –1). Moselhi
and Khan (2010) developed a set of equations to predict the influence of six different
factors (temperature, humidity, wind speed, gang size, labour percent, and floor level) on
construction labour productivity (see Figure 2.2 below). The six variables were
normalized between zero and one in the X axis, and daily productivities were normalized
in the Y axis. The normalized values for the six variables are given in Table 2.1 below.
The same normalized values are used for Figure 2.3 below.

13
Table 2.1: Normalized Values for the Factors/Parameters (Modified
from Moselhi and Khan 2010)
Parameter Normalised value Actual value
Temperature (oC) 0 -26 1 25
Humidity (%) 0 18 1 97
Wind Speed 0 3 1 43
Gang size 0 8 1 24
Labour (%) 0 29 1 47
Height (no. of floors)
0 1 1 17
Figure 2.2: Productivity as a Function of Individual Parameters/Factors (Moselhi and Khan 2010)

14
Based on these graphs, temperature has a positive correlation, and maximum daily
productivity is reported around twenty degrees Celsius. Gang size also has a positive
correlation as daily productivity has improved with the increase of gang size. On the
other hand work crew should be increased based on the available work space. Otherwise
site work may be affected due to congestion and this in turn will negatively affect labour
productivity (Chang et al., 2007). Daily labour productivity tends to increase with the
floor level until the eighth floor and afterwards the increase is drastically reduced.
Learning curve also plays a major role in increase in productivity (Couto & Teixeira,
2005) while an increase of number of floors reduces the worker efficiency. Increase in
humidity, labour percent, and wind speed have a slight negative effect on daily labour
productivity. On the other hand excessive wind speeds completely shut down the
construction sites for safety reasons.
Moselhi and Khan (2010) also developed a 3D function of productivity with
temperature and humidity (see Figure 2.3 below). The normalized values for the
factors/parameters are given above in Table 2.1. Temperature has a significant impact on
daily labour productivity in Calgary based on Figure 2.3 below (based on the assumption
that this model is transferable to Calgary). During the winter season, temperatures can
vary from -20oC to 20oC frequently. As a result productivity can vary more than 50%.

15
Figure 2.3: Productivity as a Function of Temperature and Humidity (Moselhi and Khan 2010)
Nasirzadeh and Nojedehi (2013) also developed a set of functions to establish the
relationship between labour productivity and three key parameters authors have identified
as important (see Figure 2.4 below). These parameters are temperature, skillfulness, and
site congestion (lack of work area). According to the graph, temperature has a positive
correlation to labour productivity while congestion has a negative correlation.
Skillfulness has a positive correction as well; with the increase of skillfulness labour
productivity tends to increase. In the last graph the authors show that with the increase of
labour productivity project duration reduces drastically until a certain level (eight units of
productivity), but thereafter reduction is very minimal.
16
Figure 2.4: Relationship Between Factors and Construction Productivity (Nasirzadeh and Nojedehi 2013)
Change orders are a regular occurrence in construction industry. These changes
are inevitable and necessary. The rework associated with these changes are costly, and
frustrating to the workforce. As a result rework has an adverse effect on productivity.
Thomas & Napolitan, (1995) reported a thirty percent loss of efficiency/productivity,
when changes were performed. They also stated that lower labour performance is
strongly correlated with change work, restrictions and rework. Hanna et al., (1999)
reported a significant difference in labour efficiencies between interrupted (due to
changes) and uninterrupted projects. Scholars have also reported a negative correction
between overtime and labour productivity. Thomas & Raynar (1997) revealed that short
term overtime leads to around ten to fifteen percent productivity loss, which is consistent
with studies conducted by Business Round Table in 1980.

17
All these factors and relationships identified by researchers worldwide can be
categorized into four main areas:
Environmental Factors: Temperature, Wind Speed, etc.
Management Factors: Overtime, etc.
Human Factors: Gang Size, Skill Level, etc.
Project Factors: Floor Level, Work Method/Type, Rework, etc.
2.3 Current Information Management and Drawbacks
The U of C’s ongoing research as well as other research have identified
inadequate communication as the critical factor contributing to low productivity (Hewage
and Ruwanpura, 2006a; Bowden et al., 2006). These findings led to the development of
an Information Technology (IT) roadmap for construction by Hewage and Ruwanpura
(2006b). Inadequate communication and non-availability of information were well
observed in almost all the construction projects, which caused low productivity and tool
time around 50% in high-rise building construction projects (Hewage and Ruwanpura,
2006b). Workers emphasized that “inadequate communication” in their working
environment causes low productivity and tool time. These workers believed that the
communication lags and unavailability of information were the main reasons for low
productivity. Use of information technology to overcome communication barriers was
extremely limited at the construction site level. Construction companies typically hesitate
to adopt new technologies. However, workers expressed their willingness and ability to
use new technologies at the construction site level. The present status of technology
usage in the construction industry and current communication practices were recently

18
investigated in Alberta, Canada to develop innovative solutions to improve
communication and productivity (Hewage and Ruwanpura, 2009). One of the main
findings in this investigation was the justification of “inadequate communication”
between the various parties involved in construction projects. Almost all workers blamed
managers for the insufficient “information flow” from the site/main office to the
operational (site) levels (Hewage and Ruwanpura, 2006a). Wachira (2001) too mentioned
that 50% of construction workers usually complain about inadequacy in communication.
Two-way radios were the main communication medium between site office and
work place in the last decade. The foremen had to visit the site office regularly for
clarifications and to refer to drawings. Therefore the foremen had less time to supervise
workers and provide instructions. Workers spend about 15% to 20% of their working
time moving around the site to locate material and tools (Hewage and Ruwanpura, 2006a;
Zhang and Ruwanpura, 2008; Liu and Ruwanpura, 2007). Some workers were not even
aware of their daily schedules and targets.
Information has the best value when it is delivered to the correct place at the
correct time in the required format. It is expected that the forthcoming decade will be
governed by information management. U of C’s productivity research team proposed an
automated information kiosk system called “information booth” to overcome the above
mentioned shortcomings. The proposed system was pilot tested in a commercial
construction setting to prove that this concept is economically viable enough to build a
prototype and carry out full scale site testing.

19
2.4 Classification and Design Guidelines for Information Kiosk Systems
This subsection will focus on design guidelines and how to classify the kiosk
systems to gain an in-depth understanding. Brochers et al. (1995) proposed a
classification for information kiosk systems. There are four major categories based on the
major task.
2.4.1 Information Kiosks
Information kiosks provide information in a limited subject field, for example at
railway and bus stations. Users are not extensively motivated to use the system. They
simply use it to find information on connections to intended destinations, to buy tickets,
and to get route information.
2.4.2 Advertising Kiosks
Advertising kiosks are installed by companies to advertise services and products
to the public in an attractive and innovative way. Here, the content is presented in an
interesting and entertaining manner to motivate users to explore the system further. These
kiosks are designed in a visually attractive manner to catch the attention of potential
users.
2.4.3 Service Kiosks
Service kiosks are similar to information kiosks, with the addition of information
entry by the users: for example, airport terminals where data such as name, passport
number, and flight details have to be entered to get boarding passes.

20
2.4.4 Entertainment Kiosks
Entertainment kiosks are intended to provide entertainment to potential end users.
According to Brochers et al. (1995) most of the information kiosk systems will
belong to two or more of the above mentioned categories.
Morris et al. (1995) developed another classification for kiosk systems. In this
classification kiosks were categorized into 3 main types.
2.4.5 Information Dissemination & Advertising Kiosks
These are utilized to advertise products and services and to offer information to
end users in a one-way communication setting. The commands for information are
entered through a touch screen monitor and also make use of videos, animation, and
sound to convey the message to users. Such kiosk systems are widely used in schools,
trades shows and conferences, museums, and visitor centers.
2.4.6 Interactive Information Kiosks
The main functions of these systems are to automate information access and to
collect information. These systems are regularly used in high pedestrian traffic areas such
as airports, stores, malls, and convention centers. End users may enter data via touch
screen or less frequently through a keyboard. Hard copy printouts such as boarding
passes, tickets, maps, or coupons can be obtained if the kiosk systems are equipped with a
printer.

21
2.4.7 Transaction Kiosks
These systems are relatively more advanced compared to other kiosk systems,
because of more complex transactions and information exchange. Main data entry
mediums are touch screen, simple buttons, or keyboards. Since both privacy and money
are involved, security is a major concern for these kiosk systems. They are capable of
handling cash and credit card transactions.
Kiosk systems can be classified into two broad categories based on previous
classifications: Informative Kiosk Systems and Service Kiosk Systems (see Figure 2.5).
Informative kiosk systems can be further subdivided into three main categories:
information kiosk systems, advertising kiosk systems, and entertainment kiosk systems.
Service kiosk systems consist of two major components: interactive kiosk systems and
transaction kiosk systems.
Figure 2.5: Classification of Kiosk Systems
A literature survey was conducted on the limited literature available, to find
design guidelines for kiosk systems. The majority of kiosk system design literature deals

22
with public information kiosk systems. Kearsley (1994) listed several items such as
structure, location, material, operation, maintenance, and integration for consideration
when designing a kiosk system. Three simple guidelines were suggested to ensure
smooth and user friendly access and operation of kiosk systems. Those guidelines are as
follows:
Provide as much redundancy as possible in system operation
Allow as much user control of system as possible
Keep all screen displays and control options very simple
According to Maguire (1999), kiosk systems should be “walk up and use” based.
Maguire (1999) presented guidelines for the human aspect of kiosk design. Appendix II
summarizes design guidelines for kiosk systems based on Maguire’s work, literature, and
the researcher’s experience on kiosk prototype development.
2.5 Information Integration, Field Level Automation, and Technology Usage in Construction
Basic understanding of information integration and automation is a key to
identifying shortcomings of information management in construction. The following
definitions of integration and automation were developed by O’Connor and Yang (2004).
2.5.1 IT Automation
IT automation is the use of an electronic or computerized tool by a human being
in order to manipulate or produce a product. Hard automation, such as robotics, is not
included in this definition.

23
In order to measure the present level of integration and automation there must be
a scale or a measuring system. Kang et al. (2006) developed a five point scale to measure
the level of automation.
Automation Levels
Level 1 (none/minimal): little or no utilization beyond e-mail
Level 2 (some): “office” equivalent software, 2D CAD for detailed design
Level 3 (moderate): stand-alone electronic/automated engineering discipline
(3D CAD) and project services systems
Level 4 (nearly full): some automated input/output from multiple databases
with automated engineering discipline design and project services systems
Level 5 (full): fully or nearly fully automated systems dominate execution of
all work functions.
2.5.2 IT Integration
IT integration is the sharing of information between project participants, or the
melding of information sourced from separate systems.
Kang et al. (2006) also developed a five point scale for the Construction Industry
Institute (CII) to measure the level of integration.
Integration Levels
Level 1 (none/minimal): little or no integration of electronic
systems/applications
Level 2 (some): manual transfer of information via hardcopy of email

24
Level 3 (moderate): manual and some electronic transfer between automated
systems
Level 4 (nearly full): most systems are integrated with significant human
intervention for tracking inputs/outputs
Level 5 (full): all information is stored on a network system accessible to all
automation systems and users. All routine communications are automated.
The automated process and discipline design systems are fully integrated into
3D design, supply management, and project services systems (cost, schedule,
quality, and safety).
Griffis et al. (1995) found that 3D model usage was positively related to
improvement of cost, schedule performance, and reduction of rework. They observed
65% reduction in rework in projects that used 3D modeling. Balli (2002) demonstrated
how handheld electronics incorporated with wireless networking technologies could
provide accurate, reliable, and timely information to construction personnel (such as
foremen and lead workers). Balli (2002) concluded that handheld electronics may allow
construction personnel to access materials, tools, equipment, and drawing information,
which could reduce schedule delay and boost productivity. Back and Bell (1995)
indicated that fully exploiting electronic data management technologies to enhance
capabilities of automation and integration in the material management process resulted in
an 85% cost saving and 75% time saving respectively. Stiroh (2002) found that industries
that made largest investments in computer hardware, software, and telecommunication
equipment in the 1980’s and early 1990’s showed a larger productivity growth after 1995.
25
O’Connor and Yang (2004) established that automation and integration positively
correlated to project schedule and cost success. They also proved that schedule success
has a stronger relationship to technology than to project cost, via statistical analysis. El-
Mashaleh et al. (2006) encountered similar results when they analyzed the impact of
Information Technology (IT) on a construction firm’s performance. O’Connor & Yang
and El-Mashaleh et al. adopted a similar methodology to develop an IT index. These
analyses concluded that for every 1 unit of increase in IT index, construction companies
experienced a 5% and 3% increase in schedule and cost performance respectively. Zhai et
al. (2009) developed a similar methodology to O’Connor and Yang (2004) to measure the
IT/Automation/Integration Index.
Thomas et al. (2004) investigated the relationship between project performance
and use of Design/Information Technology (D/IT). Thomas et al. measured D/IT usage
specifically based on four technologies (Integrated databases, Electronic Data
Interchange (EDI), three dimensional (3D) and Computer-Aided Design (CAD), and bar
coding). They found that D/IT usage is positively correlated to project performance (cost
and schedule). Zhai et al. (2009) investigated the relationship between automation and
integration of construction information systems and labour productivity, observing four
trades: structural steel, electrical, piping, and concrete. These researchers concluded, via
statistical analysis, that information technology impacts construction productivity in a
positive manner and this trend is likely to continue in the future. Better construction
labour productivity is related to both automation and integration of project information
systems, but the analysis implied that a stronger relationship exists with integration. The
effectiveness of the automation and integration usage was different in the four trades.

26
Automation usage was more positively related to structural steel and electrical
productivity, but integration was more positively related to structural steel and concreting
productivity. According to the researchers, piping showed no significant impact from
either automation or integration technologies and they suggest further research to
examine this occurrence. Researchers observed average time saving per installed quantity
to be 30% and 45% when using a high versus low level of automation and integration
respectively.
Magdic et al. (2002) concluded that some important experience has already been
gained and the main building blocks for mobile computing in the construction industry
are already available in the market. Their final test showed that the efficiency of building
sites can be improved significantly even by using current, unmodified mobile computing
components (PDAs, mobile phones, and web services) for information interchange.
Despite the barriers to implementing IT at the site level, Daito Trust Construction
Company, a Japanese construction firm, developed a large-scale mobile computing
system called the DK Network. The company reported that the system made the process
of construction easier and greatly increased productivity (Daito, 2003). As projects
become more complex, the amount and detail of the information required increases. This
increase in turn makes the process of storing, retrieving, and analyzing the control
information more complicated. One commonly cited means to overcome labour shortages
and improve productivity, cost effectiveness, and competitiveness is through the use of
advanced technologies (Tatum, 1986; Johnson and Tatum, 1993).

27
2.6 Technology Readiness Level (TRL) and System Readiness Level (SRL)
TRL measures the maturity of an individual technology. The National
Aeronautics and Space Administration (NASA) has used Technology Readiness Level
(TRL), which is a nine point scale, since 1980. Level one is basic principles being
observed and reported, and level nine is actual system or “mission proven” through
successful mission operations (NASA, 2013). The Department of Defence (DoD) in 1999
adopted this concept from NASA and changed the definitions of some levels.
Sauser et al. (2006) developed a SRL to access systems based on TRL. The main
difference is that instead of focusing on the maturity of a single technology, SRL focuses
on the entire system. In this research project, acceptance testing workshops were
conducted to ensure that the system was ready for operational use. Acceptance testing is a
process to verify that the user requirements and system features and functionality are
compatible.
2.7 Technology Readiness Index (TRI)
Parasuraman and Rockbridge Associates developed the Technology Readiness
Index (TRI) to understand technology-related attitudes and behaviours of the client
companies’ customers. ‘Technology-readiness’ is a term that refers to “people’s
propensity to embrace and use new technology for accomplishing in home life and at
work” (Parasuraman, 2000). This is a good measure to find out a person’s preference
when using new technologies in terms of mental enablers and inhibitors. Parasuraman
also suggested that people could be arranged along a hypothetical technology-beliefs
continuum, which is strongly positive at one end and strongly negative at the other. The

28
position of this continuum can be correlated with people’s tendency to embrace and
employ technology. Technology-readiness consists of four components: optimism,
innovativeness, discomfort, and insecurity. Optimism and innovativeness are drivers of
technology-readiness but discomfort and insecurity are inhibitors. The definitions of
these components are as follows (Jaafar et al., 2007):
Optimism: Positive view of technology and a belief that it offers people
increased control, flexibility, and efficiency in their lives.
Innovativeness: Tendency to be a technology pioneer and thought leader.
Discomfort: Perceived lack of control over technology and a feeling of being
overwhelmed by it.
Insecurity: Distrust of technology and skepticism about its ability to work
properly.
Figure 2.6: Conceptual Diagram of Technology Readiness (Parasuraman, 2000)
Companies have the ability to utilize TRI to gain an in-depth understanding about
their employees’ and customers’ inclination to embrace computer/internet based
technologies. It is a general understanding that people with “high” TRI believe in the

29
benefits of technology and feel that they are in control of it. Employees’ technology
readiness is a critical success factor when making the right choice in terms of designing,
implementing, and managing the employee-technology link in the pyramid model. Jaafar
et al. (2007) mentioned that employees who rate high on interpersonal skills and
technology readiness are much more effective in tech support than those who are efficient
in only one of the above mentioned criteria. Table 2.2 below shows characteristics of
technology segments.
Table 2.2: Characteristics of Technology Segments (Adopted from Parasuraman, 2000)
Technology
SegmentOptimism Innovativeness Discomfort Insecurity
Explorers High High Low Low
Pioneers High High High High
Skeptics Low Low Low Low
Paranoids High Low High High
Laggards Low Low High High
2.8 Touch Screen Systems (Single Touch and Human Touch)
Touch screens became increasingly popular in other sectors such as industrial,
manufacturing, transportation, and health. Many kiosk systems have been developed in
these sectors using touch screen as the main input device. There are some challenges
when touch screen systems are adopted to the construction industry, such as weather
resistance, sunlight readability, durability, and ability to use with a gloved hand. A brief

30
summary of available touch screen technologies and advantages and disadvantages is
given below in Table 2.3. Following are the available touch screen technologies:
Resistive
Capacitive
Surface Wave
Infrared
Optical Imaging
Capacitive types of touch screens are popular in kiosk system designing
(electrostatic field-based touch screen technology), but unfortunately they can't be
operated with gloved hands or mechanical styluses. Capacitive systems are better for
applications requiring “finger touch”. Resistive technology is recommended for point of
sale systems such as in grocery stores, hotels, and restaurants. Surface-Wave technology
is utilized in ATMs, amusement parks, and financial institutions. The available touch
screen technologies are described in Table 2.3 and 2.4 below.
31
Table 2.3: Summary of Available Touch Screen Technologies
Technology Description Advantages Disadvantages
Resistive Glass is layered with a
thin metallic sheet and a
conducting sheet. When
screen is touched layers
come into contact with
each other, coordinates are
used to locate the exact
region touched.
This technology
produces durable
touch screens.
High touch
resolution.
Not affected by dirt,
grease, light or
water.
Display clarity is
compromised
because of layers of
coatings used in the
screen.
Resistive layers can
be damaged by
objects.
Capacitive
(electrostatic
field)
These systems rely on
electrical charges stored in
the screen. Touches are
computed by analyzing a
small loss of charge in the
region.
High touch
resolution.
High image clarity.
Not affected by dirt,
grease and moisture
System can’t use
other pointing
devices such as
pens, styluses, or
other pointing
objects.
Surface-
Wave (sound
waves)
Ultrasonic waves and
transducers detect touch
inputs.
High touch
resolution.
Highest image
clarity.
No coating or
layers.
Have to use the
finger.
Can be affected by
environment.

32
Technology Description Advantages Disadvantages
Infrared
(light
interruption)
There are two types: one
reacts to heat, and the
other uses coordinated
sensors around the
perimeter of the display.
Surface
contaminants can
cause false
activation.
Thick border area
around display.
Optical
Imaging
Uses scanning optical
cameras to sense two-
dimensionally which is
interrupted when touched.
High image clarity.
Light touch and
whole screen
coverage.
Robust.
System does not
rely upon surface
coating, because of
that dirt or scratch
marks in the screen
will not affect the
touch function.
Possibility of two
point touch.

33
In the last decade, the majority of the touch screen systems produced had single
touch function. Recent progress in the area of touch hardware has accelerated towards
multi-touch function (human touch function).
There are several basic functions that touch screens should perform, such as
pointing, moving, left-rotation, right-rotation, zoom-in, and zoom-out. Human touch
function consists of two basic techniques: one-handed interaction and two-handed
interaction. When using the one-hand technique, the user can perform all the above-
mentioned basic moves. But with the two-handed interactions users can perform zoom-in,
zoom-out, tilt-up, and tilt-down functions only. Figure 2.7 below illustrates one-handed
and two-handed interactions graphically.
Figure 2.7: One-handed and Two-handed Interaction (Adopted from Song-Gook et al, 2007)

34
2.9 Investments on Technology and Productivity
Bart et al. (2003) concluded that the United States has benefited not only from
production in the Information and Communication Technology (ICT) industry but also
from adopting ICT in other industries. According to those authors most European
economies invest considerably lower funds in ICT goods and software than the US and as
a result productivity growth has accelerated in the United States while European
productivity growth has slowed down since mid-1990. Although new technologies claim
to improve construction productivity, they sometimes fail to deliver. McAfee and
Brynjolfsson (2008) found a clear correlation between levels of IT investments and a new
competitive dynamic in the market. Although since the mid-1990’s spending on IT has
risen sharply, the gap between the leader and laggards in the industry has widened. The
problem in the construction industry is identifying technologies with the maximum
competitive edge. Goodrum et al. (2011) built a model to predict the impact of a
technology on construction productivity. The authors concluded that mature technologies
have better performance and low risk while they may no longer be cutting edge. On the
other hand cutting edge technologies might have the potential to generate high rewards
with higher risk due to the unproven nature of the technology. Kang et al. (2008) also
found that increased use of technology correlates to better project performance. An
interesting finding was that smaller firms experience benefits of IT more than larger
firms. This can be because IT adaptation in smaller firms is relatively simple compared to
larger firms. Finally, the success of the acquired technology largely depends on top
managers and supervisory staff's ability to understand “which processes to make
consistent and which to vary locally” (McAfee & Brynjolfsson, 2008).

35
2.10 Supervision in Construction
Supervision time consists of three major components - direct work, instructions,
and ineffective time (Gannoruwa and Ruwanpura, 2008). Direct work is the time that
supervisory staff is physically engaged in the work. Instruction time consists of many
other sub-categories such as receiving instructions from senior management,
communicating instructions to the workers, and monitoring construction activities. Time
spent idling, out of sight, walking, within site office and socializing contributes to
ineffective time. Figure 2.8 illustrates the work time distribution of an average foreman in
the form work trade, and here ineffective time contributes to more than 30% of the
workday. This shows that the workers performed work without proper supervision for
approximately one third of the day.
Figure 2.8: Total Time Distribution of a Typical Foreman (Modified from Gannoruwa 2008)

36
The time spent by the supervisor while at the site office and out of sight can be
converted into instruction time by using the concept of “Virtual Supervision” (Silva et al.,
2009). In the construction site environment, engineering supervision and instructions are
critical in improving construction productivity since work can be held up due to
discrepancies or errors of interpretation in engineering details.
2.11 User Acceptance of Mobile Technology in the Construction Industry
Success of any technology adaptation (adoptability and adaptability) in the
construction industry depends on four factors:
need
user’s acceptance of technology
readiness of the technology
readiness of the work force
FIATECH conducted a survey within North America and Europe to find out end
user acceptance of mobile technology (FIATECH, 2013). FIATECH agreed to share the
raw data of this survey with the researcher. The mobile technologies considered were
iPhones, iPads, androids, tablets and Golden-i (described in table 7.2). These are very
similar to the mobile devices considered in the AUSIA framework.
The survey was undertaken by two hundred and twenty-four professionals, mostly
from the Architectural Engineering and Construction (AEC) and Engineering
Procurement and Construction (EPC) industries. A majority of the respondents were from
the construction industry while more than sixty percent had fifteen years or more
experience (see Figure 2.9).

37
Figure 2.9: Breakdown of Survey Respondents According to Industry Sector (Modified from FIATECH, 2013)
This survey instrument tested the major areas given below:
design and specification
project controls
quality
safety
material management
project delivery
Each major category was then subdivided into smaller areas. Then participants
were asked to rate each question on five levels based on the value mobile technologies
bring into these areas.

38
The design and specification area was divided into four major areas:
Distribution of design and specifications
Distribution of shop drawings
Access to 3D/4D BIM models
Version control of design and schedule
More than seventy percent of the respondents believed that mobile technology
would bring value to design and specifications in all four areas mentioned above (see
Figure 2.10 below).
Figure 2.10: Value of Mobile Technologies for Design and Specifications in Field Reporting (Modified from FIATECH, 2013)
The project control area was divided into fifteen different areas and some of the
important areas related to AUSIA framework are given below:

39
Track Request for Information (RFI)
Track change orders
Track project submittal
Work packaging
Document exchange between field and office personnel
Track labor productivity
Daily and weekly progress
More than fifty percent of the respondents believed that mobile technology would
be very valuable for tracking RFIs. Approximately eighty percent of the participants
trusted that mobile technology would bring value to the other area mentioned above.
Around seventy percent believed that mobile technology added value to construction
photo management, which was the least favourite choice (see Figure 2.11 below).

40
Figu
re 2
.11:
Val
ue o
f Mob
ile T
echn
olog
ies f
or P
roje
ct C
ontr
ol in
Fie
ld R
epor
ting
(Mod
ified
from
FIA
TE
CH
, 201
3)

41
Quality was subdivided into six different sub-areas and more than eighty percent
agreed that mobile technology would add value to quality field reporting. Only offsite
stakeholder inspection revealed less than eighty percent likeliness to bring value through
mobile technology (see Figure 2.12 below).
Figure 2.12: Value of Mobile Technologies for Quality in Field Reporting (Modified from FIATECH, 2013)
Safety is one of the important topics in the construction industry. Real-time field
reporting is critical for accurate statistics and injury prevention. The FIATECH survey
also reported data about using smart devices for real-time safety field reporting. Safety
consisted of five sub-areas, and three sub-areas reported that more than eighty percent
believed mobile technology would bring value (see Figure 2.13 below).

42
Figure 2.13: Value of Mobile Technologies for Safety in Field Reporting (Modified from FIATECH, 2013)
The final two areas were materials management and project delivery. These were
subdivided into five and three sub-areas respectively. Majority of users’ trusted that
mobile technology would bring value to both these areas (refer figure 2.14 and 2.15
below).
Figure 2.14: Value of Mobile Technologies for Material Management in Field Reporting (Modified from FIATECH, 2013)

43
Figure 2.15: Value of Mobile Technologies for Project Delivery in Field Reporting (Modified from FIATECH, 2013)
2.12 Discussion and Conclusion
There are opportunities for further research due to gaps/needs in the research and
developments in the commercial construction industry that need to be fulfilled.
Insufficient field level automation and integration, and information leakage in the
construction industry leads to inadequate two-way communication between project
stakeholders. Information double handling between stakeholder groups (Owner, engineer,
and constructor) and within stakeholder groups is observed. Most of the time owners,
engineers, and constructors use different standalone systems for information handling
without adequate integration between stakeholders. As a result, information is fed
manually from one system to another.
Infrastructure at the field/operational level is insufficient to gain advantage from
novel technologies and concepts such as Building Information Modeling (BIM) and work

44
face planning. Investments in the technology sector in the construction industry are low
when compared with other industries such as manufacturing, insurance, and banking
(Park, 2003). The proposed framework utilizes mobile technologies to communicate with
the operational level. The success of this framework largely depends on users’
willingness to accept mobile technologies on construction sites. The recently conducted
FIATECH survey concluded that construction professionals believe mobile technologies
will enhance real-time field reporting (FIATECH, 2013). Unavailability of established
tools and techniques to measure the readiness of tech tools, as well as an inability to
better understand benefits and risks associated with these tools before field-level
implementations led to a lack of investments in the technology area by construction
companies.
Based on researchers' experience during the last six years, construction companies
that participate in research work don’t want to reveal labour productivity because that
might affect their competitive advantage in the market. As a result, researchers focused
on measuring tool time as an alternative to construction labour productivity. Tool time is
one of the three components of working time. The other two components are supporting
time and non-tool-time.
Tool time: direct effective working time.
Supporting Time: time spent on activities that support the direct work (such as
safety, preparations etc.).
Non-tool-time: the rest of the time spent on activities other than direct work
and supporting time (such as idling, socializing, extra coffee breaks, random
walking etc.).

45
Researchers from the University of Alberta are working on developing a
relationship between tool time and supporting time, and labour productivity (Fayek and
Tsehayae, 2012; Tsehayae and Fayek, 2012). There is a correlation between supporting
time and tool time to achieve maximum productivity, but the academic community is still
unable to determine a relationship between tool time and construction labour
productivity. Researchers tend to measure tool time before and after implementing new
tools and techniques to measure the impact. If a positive impact on tool time is observed
this doesn't always guarantee a positive impact on construction labour productivity. The
reason for this is that tool time is only a measure of time workers spend on producing a
tangible output but doesn't measure the quality, efficiency, and effectiveness of the
product.
Therefore based on the literature and site experience, tool time might not be a
good measure of success of implemented tools/techniques. The best possible scenario is
to measure the TFP to gauge company performance, and to use CLP with tool time
investigations to assess worker performance. This will give researchers an overall
understanding on what sort of impact the tool/technique imparts on labour productivity
and company overheads.

46
Chapter Three: Conceptual Framework and Research Methodology
The detailed research methodology, which includes the conceptual framework,
hypothesis, and rationale behind the methodology adapted in each stage of the research
with reliability and validity of these methods, are presented in this chapter.
3.1 Conceptual Framework of AUSIA
The researcher has observed that information chaos in the construction industry is
a result of isolated information systems and poor system integration (Silva et al., 2008).
Construction companies, with the help of technology vendors and software developers,
are trying to incorporate numerous software/hardware systems to achieve better
productivity and gain a competitive advantage. However, these isolated systems may
create more confusion in the workforce, due to lack of information integration and
automation of software and hardware systems. The AUSIA framework will act as the
integration platform for different types of information management systems and act as a
field portal to integrate all these systems (see Figure 3.1 below). These information
management systems include contract management systems, scheduling software,
document management systems, Building Information Modeling (BIM), and Enterprise
Resource Planning (ERP). BIM and ERP are commercially developed software packages
by Autodesk, Bentley, Oracle, and SAP. The majority of research partners in the U of C
research study utilize these systems. One of the major complaints by the field staff was
the inability to interact with these models. There are several document control and
contract management systems general contractors utilise. These systems are either in-
house developments or commercial systems. Scheduling software is either MS Project or
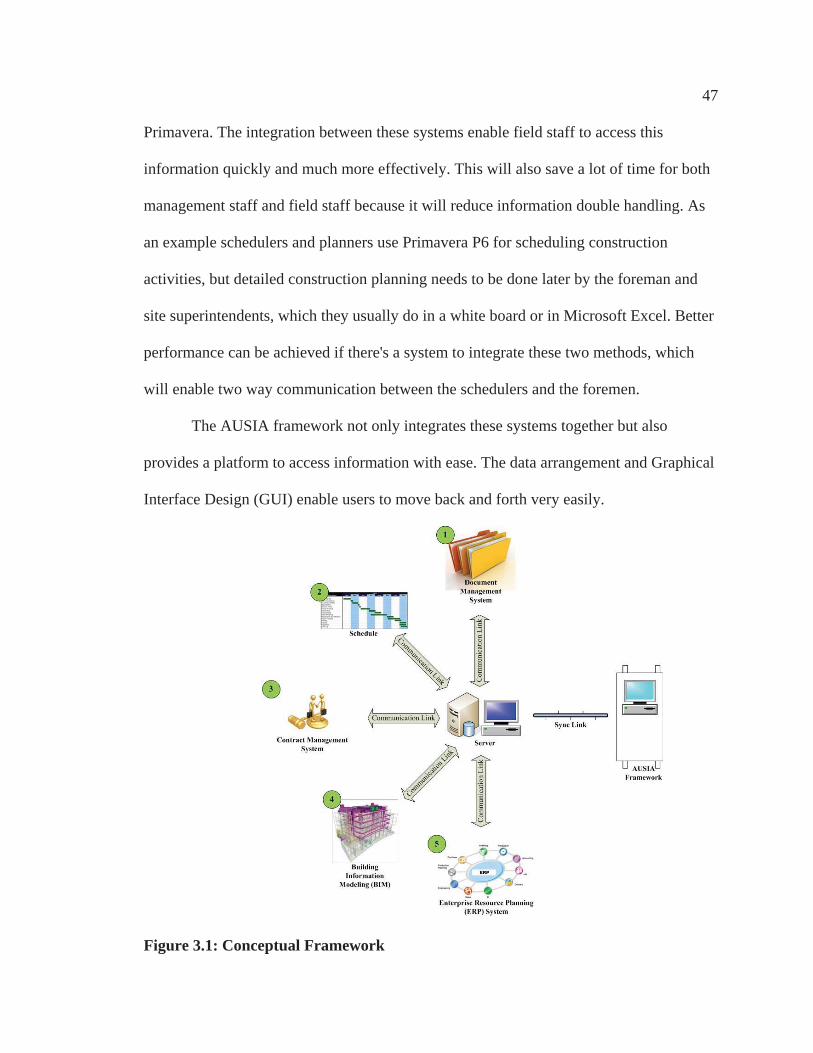
47
Primavera. The integration between these systems enable field staff to access this
information quickly and much more effectively. This will also save a lot of time for both
management staff and field staff because it will reduce information double handling. As
an example schedulers and planners use Primavera P6 for scheduling construction
activities, but detailed construction planning needs to be done later by the foreman and
site superintendents, which they usually do in a white board or in Microsoft Excel. Better
performance can be achieved if there's a system to integrate these two methods, which
will enable two way communication between the schedulers and the foremen.
The AUSIA framework not only integrates these systems together but also
provides a platform to access information with ease. The data arrangement and Graphical
Interface Design (GUI) enable users to move back and forth very easily.
Figure 3.1: Conceptual Framework

48
3.2 AUSIA Framework Mind Map
AUSIA framework was designed by producing a second-generation i-Booth (see
chapters four and seven for the evolution of i-Booth) with ten, high-level information
categories:
Drawings: structural drawings, architectural drawings, mechanical drawings,
electrical drawings, and landscape drawings.
Changes: site instructions, requests for information (RFIs), change orders.
Safety information
Schedule information: master schedule, look ahead schedule, specific
schedules (room completion schedules etc.).
Material information: material locations, availability of materials.
3D/4D models
Quality information: quality checks, deficiency lists, quality plans.
Certification: LEED related information, permits, and regulatory information.
Weather information
Technical information: training videos, productivity related news letters.
The AUSIA framework is built on five main principles: Accessibility, Usefulness,
Satisfaction, Integration, and Automation.
Accessibility: ability to access particular information at the field/site level.
Usefulness: ability to use particular information at the field/site level.
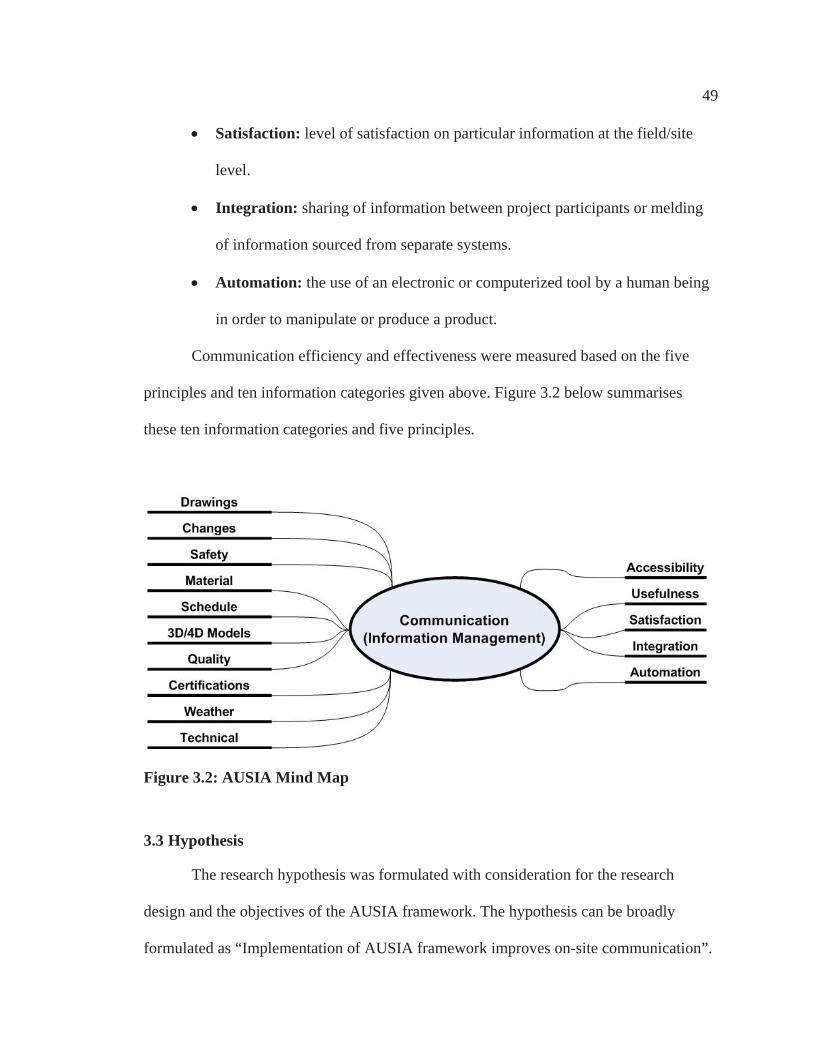
49
Satisfaction: level of satisfaction on particular information at the field/site
level.
Integration: sharing of information between project participants or melding
of information sourced from separate systems.
Automation: the use of an electronic or computerized tool by a human being
in order to manipulate or produce a product.
Communication efficiency and effectiveness were measured based on the five
principles and ten information categories given above. Figure 3.2 below summarises
these ten information categories and five principles.
Figure 3.2: AUSIA Mind Map
3.3 Hypothesis
The research hypothesis was formulated with consideration for the research
design and the objectives of the AUSIA framework. The hypothesis can be broadly
formulated as “Implementation of AUSIA framework improves on-site communication”.

50
Hence the null hypothesis against which the research hypothesis is going to be
tested can be termed as follows:
H0 : Implementation of AUSIA framework does not improve on-site
communication
The null hypothesis can be tested against the alternative hypothesis which is:
HA : Implementation of AUSIA framework improves on-site communication
Communication is judged based on five criteria and ten information categories
explained in Chapter One: Introduction. These five criteria are Accessibility, Usefulness,
Satisfaction, Integration, and Automation (AUSIA). The ten information categories are
drawings, changes, safety information, schedule information, material information,
3D/4D models, quality related information, certification, weather information, and
technical information.
This derives fifty different null sub-hypotheses and fifty different alternative sub-
hypotheses. The null sub-hypothesis and alternative sub-hypothesis for the drawing
information category for all five criteria are given below in Tables 3.1 and 3.2. These
hypotheses will be tested for conditions given below.
(Before AUSIA)
(After AUSIA)

51
Table 3.1: Null Hypothesis for Drawings
Table 3.2: Alternative Hypothesis for Drawings
Hypothesis DescriptionNull Hypothesis
H0DA Implementation of AUSIA framework does not improve accessibility of
drawings on-site
H0DU Implementation of AUSIA framework does not improve usefulness of
drawings on-site
H0DS Implementation of AUSIA framework does not improve satisfaction
with drawings on-site
H0DI Implementation of AUSIA framework does not improve integration of
drawings on-site
H0DA Implementation of AUSIA framework does not improve automation
of drawings on-site
Alternative Hypothesis
HADA Implementation of AUSIA framework improves accessibility of
drawings on-site
HADU Implementation of AUSIA framework improves usefulness of drawings
on-site
HADS Implementation of AUSIA framework improves satisfaction with
drawings on-site
HADI Implementation of AUSIA framework improves integration of
drawings on-site
HADA Implementation of AUSIA framework improves automation
of drawings on-site

52
The full list of null hypothesis and alternative hypothesis are provided in
Appendix III.
3.4 Research Methodology
Quantitative and qualitative tools were utilized to fulfill the objectives of the
research stated above. These tools included interviews, questionnaire surveys, workshops
(lunch and learns), and observations, statistical analysis, and cost benefit analysis.
A summary of the research methodology, flow of the research, and how each
objective was achieved is illustrated in Figure 3.3 below. The main objectives of the
research are listed on top (from left to right) and the five main research stages are listed
in the left-hand side (from top to bottom). The research question, goals, and objectives
were developed with the aid of a literature survey, which will be continued until the end
of the research. Other main stages of the research are site observations and interviews,
pilot testing, user acceptance testing, and system development. All other stages other than
pilot testing cover all four objectives of the research, while pilot testing covers the last
two objectives. As explained above, the main reason for initial productivity and tool time
observation was to ensure that implementing the AUSIA framework would improve
communication while improving construction productivity. If the AUSIA framework
only improves communication without improving efficiency of the workforce, the system
will become an additional overhead for the construction companies.

53
Figu
re 3
.3: R
esea
rch
Flow
Dia
gram

54
3.4.1 Research Phases
Research work was divided into four major phases:
Phase I: investigate the problem
Phase II: design the solution
Phase II: implement the solution
Phase IV: validate the results
3.4.1.1 Phase I (Objectives I & II)
Under phase-I current industry practices were investigated to find out information flow,
the bottlenecks associated with the information flow, and the information needs of construction
workers and supervisors.
Conducted twenty unstructured interviews with office managers, site managers,
foremen, and lead hands. Interviews were conducted in a discussion style using open-
ended questions. These interviews dealt with types of information management
systems contractors utilized, issues and problems faced at the operational level due to
communication deficiencies, information types needed at the operation level, and
mobile technology devices they would like to utilize, etc. The researcher ensured that
the interviewee felt comfortable expressing the problems and issues they faced in
field operations due to information management. This was very critical because
unless field staff was comfortable, they wouldn’t express the drawbacks in current
information management systems as some of the research partners were using in-
house products for information management.
55
Observed construction operations to understand work practices and information flow
in three buildings (all three building projects were part of the same ABC
Polytechnic). Observations were carried out for 3 months (1 month each) in all three
building sites.
o identified effective information dissemination methods already practiced
at site level
o identified communication needs of construction workers
Conducted online surveys (see Appendix V for the survey instrument) to verify the
findings from interviews and site observations.
Survey and observation results of phase-I of the research work are included in Chapter
Four. Furthermore, a comprehensive literature survey was carried out throughout this research so
that the researcher was familiar with other research work related to on-site communication. The
researcher realised that without developing an actual system, the work force was unable to
express the information need.
The researcher attended several conferences and trade shows related to construction
technology and presented the findings of the research in several technology conferences and
tradeshows:
FIATECH Technology conference and tradeshow from 2009 to 2012
Construction Research Congress (CRC), 2009 and 2010
Canadian Civil Engineering Society (CSCE) construction speciality conference, 2008
and 2009
The sixth International Structural Engineering and Construction Conference, 2011
BUILDEX Calgary annual tradeshow, 2012

56
Alberta Center of Excellence for Building Information Modelling (aceBIM) annual
conference, 2013
The system was fine-tuned based on the input from experienced site superintendents,
construction managers, project managers, chief information officers, systems & technology
managers, technology vendors, and information technology professionals.
3.4.1.2 Phase II (Objectives I, II & III)
The first generation i-Booth was developed based on the input from Phase-I and from the
researcher's experience in the construction industry.
Conceptualized framework for the first generation i-Booth based on data from
interviews and observations.
Conducted eighteen phone interviews with technology vendors for Human Interface
Device (HID) selection, kiosk design, and prototype development (three vendors each
from the following areas: touch screen monitors, kiosk manufacturers, access control
system developers/providers, computer hardware providers, software
providers/developers, and kiosk system software developers). The main focus of these
interviews was to gain an understanding of the reception for these products in the
construction industry, the ruggedness of these technologies, the adverse effects if
exposed to sub-zero temperatures, and the possibility of integrating with other
hardware and software.
Assembled a prototype with the help of university technical staff based on interviews,
literature on kiosk system designing guidelines (given in Appendix II), and the
researchers’ experience in the construction industry.

57
Conducted pre-user acceptance testing for first generation i-Booth in three different
building construction sites in Calgary to check the functionality and usability of the
system.
Conducted ten interviews with higher managers/decision makers (during discussions
with research partners for status updates for Construction productivity improvement
research. Majority of the participants were Project Directors and Vice Presidents of
leading construction companies in Canada). Redesigned system software based on
end-user feedback and input from these interviews. This step was conducted to ensure
that technology readiness level of the i-Booth was sufficient for site testing. The main
factors discussed during these interviews were regarding new information categories
needed, willingness to pilot test the system in one of their jobsites, and likeliness to
purchase a unit in future.
3.4.1.3 Phase III (Objectives III and IV)
This phase dealt with implementation (site testing) of the first generation i-Booth. The
researcher conducted fifteen one-on-one interviews with supervisory and management staff after
showing an overview video of the first generation i-Booth. This helped the researcher to
understand the supervisor’s perception of the new technologies and willingness to implement the
proposed technologies. Other points discussed were site specific information requirements and
logistics of implementation. The researcher conducted a Technology Readiness Index (TRI)
survey to verify the findings. (The questionnaire used to assess TRI is attached in Appendix VI.)
The researcher initially planned to investigate TFP to assess company performance, and
conduct a time-motion study and measure construction labour productivity (planned verses

58
actual) to measure the worker performance. The researcher then planned to investigate the
impact on company overheads and the influence on construction labour productivity after
implementing the AUSIA framework. Unfortunately the research partner (general contractor)
refused to reveal any data related to productivity because of the competitive nature of the
business. As a result the researcher had to find other means to measure the impact.
Time-motion study was conducted to assess the present site conditions. Tool time
observations were performed for four weeks. Both the five-minute rating method and
the thirty minute continuous observation method were utilized for observations/work
sampling. In five minute rating method workers are observed every five minutes and
in thirty minutes continuous observation method observations are done for thirty
minutes continuously. Based on these observations activity analysis is conducted to
determine direct working time, supporting time and ineffective time.
Three workshops were conducted to investigate time wasted due to ineffective
information handling within all three building projects in ABC Polytechnic (the form
is attached in Appendix VII). Forty-six supervisory staff members participated in
these workshops.
A questionnaire survey was conducted to determine the present level of
communication under the above mentioned ten categories and five criteria (mentioned
in the Hypothesis section above). A questionnaire (Appendix VIII) with a five point
Likert scale (Extremely bad, slightly bad, undecided, slightly good, and extremely
good) was used in these workshops. Three workshops were carried out to ensure
supervisory staff could attend these without hindering site work. (Forty-seven people
participated in all three workshops.)

59
Above mentioned survey was also distributed online through SurveyMonkey to
generalize the sample selected to general population. FIATECH and CCA provided
assistance to the research by distributing the survey to construction professionals in
North America (twenty-four participated).
First generation i-Booth was implemented in the construction site for twelve months.
(Detailed discussion in Chapter 5: Site Implementation and testing)
A questionnaire survey (workshop) was conducted to assess level of communication
under above mentioned ten categories and five criterions after twelve months.
Questionnaire with five point Likert scale (Extremely bad, slightly bad, undecided,
slightly good and extremely good) was used in these workshops (forty-seven
participated in this survey).
After implementation, a questionnaire survey (Online and on-site) and user
acceptance workshop on i-Booth were conducted to understand user perceptions, the
impact of i-Booth, and optional and essential hardware items of the system. (Further
details in Chapter Seven: Data Collection, Analysis, Validation of Result and System
Development.)
3.4.1.4 Phase IV (Objective IV)
In phase IV the researcher validated the results, fine-tuned the first generation i-Booth,
developed the AUSIA framework (second generation i-Booth), and did business validation.
Two workshops were conducted in two construction sites to validate results collected
from implementation. These workshops were conducted to establish benefits from the

60
AUSIA framework and user acceptance of hardware. (Forty-four supervisory staff
members participated.)
The kiosk hardware was redesigned with the input from workshop data.
The kiosk was redesigned based on reviews and feedback from the workshops
conducted after site testing.
A final user acceptance workshop was conducted for software with the Calgary
Construction Association. A minimum of three supervisory staff members (one
foreman, one superintendent, and one senior manager) from six major general
contractors in Alberta participated. The researcher and software developer presented
the system and documented the feedback.
Four Business Validation Group (BVG) sessions were conducted with the CCA board
of directors at their annual general meeting, and two sessions were held with
Productivity Alberta with construction professionals from Edmonton.
Lessons learned through site testing and feedback were documented for future
research.
3.5 Sample Size Selection
Research samples were selected based on three basic principles:
Participants were from commercial construction companies; the majority were from
research partner companies in Alberta.
Participants had the right to withdraw at any time during the research study period,
but the data collected until the point of withdrawal were used for analysis and to
derive conclusions.

61
Samples were selected on a fully voluntary basis using random sampling technique.
Sample size is governed by the error margin, confidence level, and standard deviation of
the results. Sample size must be greater than 30 based on the central limit theorem. The required
sample size (n) was determined using the equation given below.
(3.1)
n = required sample size
(1- )% = error margin of the estimation
= standard deviation for the results
d = desired error margin
The difficulty with this pilot study was to satisfy the sample size needed to find a jobsite
with a large supervisory staff. As explained in the above section, getting agreement from a
general contractor to pilot test this type of system was a challenge. Time periods for setup and
testing also took ten to twelve months, so testing in multiple jobsites wasn’t a viable option. The
only possible solution was to test in this jobsite and calculate the error between sample mean and
population mean to ensure the error margin was acceptable.
(3.2)
Based on this equation the researcher calculated error for all fifty different variables
before and after implementation, for three different confidence intervals (ninety-nine, ninety-five
and ninety percent respectively (refer Appendix – IX)). Based on the calculations in the 90%
confidence interval, the error margin was acceptable because sample means were in the same
state the majority of the time. (As an example, if the sample mean of accessibility of drawings
62
was in the slightly bad state, in 90% confidence interval the sample mean falls into the same
state).
Qualitative research instruments such as interviews were not based on the above
equation, because only qualitative constructs were derived from the data collected. As an
example in the case of interviews, the number of interviews depended on the saturation point (the
researcher conducted interviews until the researcher was getting the same answer from the
research subjects).
3.6 Techniques and Tools Utilized in the Research Study
The research techniques and tools utilised in the research studies were a combination of
quantitative and qualitative techniques. The quantitative part consisted of what could be
measured. This involved collecting and analysing data that could be organised into statistical and
quantitative studies. The qualitative part consisted of investigating subjective data, in particular,
the perceptions of the people involved. The intention was to illuminate these perceptions of the
participants to derive conclusions.
3.6.1 Literature Review
Comprehensive and continuous literature review was carried out to narrow the research
topic and to find new state of the art, cutting edge research and development. Sources of the
literature review were based on electronic data sources, journals, books, conference and
symposium proceedings, industry reports, and masters and PhD theses.

63
3.6.2 Questionnaire Survey
Questionnaire surveys were structured with both open and closed questions, depending
upon the requirements. Survey instruments were pilot tested before being distributed online and
in workshops through participating research partner companies to fine tune (stability and
comprehensiveness) the instrument. Quantitative and some of the qualitative questions were
based on the five-point ordinal Likert scale given below. The researcher assigned a numerical
value for each level when analysing the data.
Extremely Bad (0)
Slightly Bad (1)
Undecided (missing)
Slightly Good (2)
Extremely Good (3)
3.6.3 Interviews
The researcher conducted both face to face and phone interviews. Face to face interviews
were carried out in closed rooms. Participation was voluntary and participants had the freedom to
walk away anytime without any consequences. The majority of the interviews were unstructured
and used open-ended discussions to encourage users to express their ideas. According to the
researchers' experience, field supervisory staff members weren’t comfortable with structured
interviews. The researcher conducted these interviews after spending several weeks in the jobsite
to make sure that field staff was familiar with the researcher and the research study to ensure
maximum participation.

64
3.6.4 Document Analysis
Information was collected from secondary sources such as project execution documents
and contract documents. This was not conducted to derive any conclusions but to ensure that the
researcher was fully aware of project execution and other conditions before implementing the
system.
3.6.5 Workshops
Workshops were used to collect data through questionnaire surveys. The researcher
facilitated these workshops. This method was useful to collect information relatively quickly
compared to formal questionnaire surveys. This was beneficial for both the researcher and the
research subjects because the research subjects were able to get clarifications then and there and
the researcher had the ability to collect data relative quickly as mentioned above. Some of these
workshops were conducted as lunch and learns because it was easy to gather field staff and office
staff during lunch hour to ensure higher attendance. Most of the time the researcher conducted at
least two workshops for one survey because then field staff and office staff had the ability to
accommodate daily site work. This method was one of the best tools used to check user
acceptance of the i-Booth software and hardware (especially Human Interface Devices).
3.6.6 Site Observations
Observations at the construction sites were done by the researcher through direct
monitoring of construction site operations. The researcher conducted activity monitoring for
three weeks to figure out the current status of the jobsite. The research team has conducted
several activity monitoring studies in Alberta over the last several years. Activity monitoring was
conducted using observation forms and observation categories attached in Appendix X.

65
3.6.7 Data Analysis
Extensive statistical and cost-benefit analysis was carried out in the quantitative domains
of data analysis. This was performed via SPSS (Statistical Package for Social Sciences)
statistical package and excel (data analysis and data processing). Hypothesis testing was
conducted using non-parametric tests (Conover and Iman, 1981):
Wilcoxon Signed Ranked test
Mann-Whitney U test.
The reasons for selecting non parametric tests instead of the parametric T Test are:
according to the K-S test, the assumption of normality was not satisfied.
the sample size was relatively small.
the instruments used were of ordinal nature.
After completing hypothesis testing, the researcher conducted qualitative analysis of the
data before and after implementation. This enabled researcher to compute research subjects
perception change before and after implementation of the AUSIA framework.
Qualitative analysis was performed using SPSS text analytics software package because
Natural Language Processing (NLP) and linguistics built into the package helped to analyse
open-ended answers much better than simple frequency calculations. Other qualitative answers
were analyzed with simple frequency calculations.
3.7 Validation and Verification of Results
Validity of the research depends upon validation, verification of research findings, and
reliability of the research data. The reliability of the research study is based on repeatability of
the research with a similar methodology to obtain similar results or observations. According to

66
Kirk and Miller (1986) reliability is based on the stability of the measurement over time. A
mixed method approach, using two data collection methods and utilizing both qualitative and
quantitative research methods will increase the reliability of the outcome. Inter-item reliability
measures such as Cranach’s (alpha) don’t need to be calculated because no factor analysis was
performed and no interrelationship between variables was considered. One of the other issues
related to the reliability of data is the ‘Hawthorne Effect’ (Franke & Kaul, 1978). This is an
increase in worker productivity produced by the psychological stimulus of been singled out and
made to feel important due to being selected for the study. This phenomenon was proven by a
group of researchers in 1932. The researcher reduced this effect by collecting data after research
subjects were comfortable with the researcher. This was a judgement call based on experience in
the construction industry.
To improve the validity of the research, the following strategies were implemented:
triangulation, feedback, site observations, and comparisons. The researcher conducted two
workshops in two other construction sites of the same general contractor to triangulate the
findings from the pilot study (site testing). The main reason for selecting two jobsites of the same
general contractor was to ensure that the researcher wasn’t violating the agreement between the
research team and the general contractor. Based on the agreement, the research team needed to
completely erase the available data before showing the system to any other third party. The pilot
test was a very cumbersome and resource oriented exercise. The researcher let supervisory staff
of these two sites interact with the system for a week before the workshop to ensure that users
were familiar with the AUSIA framework.
External validity or establishing the domain of a study’s findings were generalised using
two methods. The research team conducted several BVG sessions with Canadian construction

67
professionals to ensure the system was acceptable within the construction industry. Also the
researcher carried out a web-based survey to ensure that the perceptions of the sample population
is similar to the perceptions of the selected sample from construction community (majority of
respondents were from construction community in Alberta and members of FIATECH).
3.8 Bias Associated with the Research
As bias is unavoidable in the research setting, the researcher's only possibility was to
attempt to minimise the associated bias. There were several potential biases associated with this
research. Selection bias (sampling bias) is when the sample selected is not representative of the
population. The researcher made an effort to ensure samples were selected randomly and
independently, but this was somewhat restricted because the researcher needed to find a
construction site first. Recall bias occurs when the answer for a survey question is affected by the
respondent's memory (such as when research subjects fail to accurately recall events in the past),
for example when research subjects can’t recall how many projects used BIM before this project.
As a solution data triangulation, which is validation of data through cross verification from more
than two sources, was used. Confounding bias occurs when the factor under consideration is
related to other factors, so more than one explanation can be given for the results, for example
comparing the relationship between use of technology and construction productivity in two
samples (population) when one sample is young workers and other is older workers (due to the
ethics guidelines of CFREB, no analysis can be performed on age, sex, etc.). So multiple studies
were conducted to eliminate this bias. Design bias occurs when part of the research study does
not fit together to answer the question of interest. The solution is to make sure the control group
and the research group have the same randomness. To avoid this bias the researcher conducted

68
the same survey for both site samples as well as for the general construction population of North
America. Non-respondent bias arises when some subjects choose not to respond to particular
questions and when the non-responders are different in some way (they are a non-random group)
from those who do respond. This was minimized in several ways: giving shorter surveys, sending
reminders, giving time to fill questionnaires during workshops, arranging workshops and
sessions during lunch hours, and holding more than one workshop when possible.
3.9 Limitations of the Study
There were certain limitations encountered by the researcher from inception to
completion of the research project. As this research is very technically advanced, several times
research partners refused to implement the AUSIA framework. One general contractor agreed to
implement the system but the site superintendent refused to implement the system stating that
they didn’t need additional technology. In another project, the construction manager wasn’t
comfortable with implementation, stating that to see benefits from tech tools we need to
implement them in a large project. Although the same general contractor agreed to pilot test the
system in a larger project, the researcher had to go through a very strict protocol before
disclosing information such as drawings, specifications, safety, quality, etc. The complete
information integration and systems integration was planned initially. The researcher and
software developer planned to directly access the contractors’ documents management system
(which was based on SharePoint) but the general contractors' Systems & Technology
Department refused the integration. So the researcher had to manually load the information to the
AUSIA framework. The agreement between the general contractor and the research team to
access information is attached in Appendix-IV. The contractor refused to reveal labour

69
productivity data and TFP data because of its confidential nature. This was purely because of the
competitive nature of the Alberta market and the research team worked with five other general
contractors in this research project. As a result, verification and validation of benefits from the
AUSIA framework was investigated empirically through a questionnaire survey and qualitative
analysis.
3.10 Problems Encountered and Solutions Provided
Issues were encountered in the early stages of implementation of the AUSIA framework.
Researchers experienced three major problem categories: human, management, and automation
issues.
Human Issues
Human issues were the most influential factor in the success of the implementation stage.
Issues encountered were difficulty in coping with the technology, changes in workload, and the
inability to understand intended benefits. The problems related to the i-Booth were tackled by the
researchers from its inception. The i-Booth was designed in such a way that anybody with a
general understanding of a computer or an automated teller machine (ATM) was able to operate
this device.
Management Issues
In general, the construction sector offers stiff resistance to IT solutions (Mak, 2001). The
success of the i-Booth was dependant on management comfort and trust in the system.
Researchers encountered some resistance from management with the proposal to change internal
systems to IT solutions for better efficiency. Researchers carried out awareness sessions with

70
management to convince them that IT tools are there to help, and systems are not intended to
replace the human brain.
Automation Issues
Automation issues came up during the early stages of the implementation of i-Booth. The
researcher and the Systems and Technology Department solved IT issues such as inter-
operability, data security, and compatibility.
The steps taken to solve the issues identified at the operational level were:
The worker or identifier of the problem immediately informed their supervisor of the
issue.
The supervisor informed the district systems administrator.
The systems administrator discussed the issue and its resolution with the
researchers/developers.
Reported issues were resolved with the help of general contractors' staff, the
researcher, and the software developer.
3.11 Conclusion
A conceptual framework was developed to enhance on-site communication based on ten
high level information categories and five main principles. The research study was divided into
four phases and initial two phases concentrated on identifying problems and proposing solutions.
Third phase dealt with site implementation of first generation i-Booth. Final phase focused on
validation of results. Observations, interviews, workshops with survey instruments were utilized
throughout the study. Statistical methods were utilised to analyse the impact from
implementation.

71
Sample size was determined by indirect methods due to restrictions with site selection.
Instead of calculating the desired sample size with given error margin, the researcher calculated
the error margin for sample size of the selected job site. Exact Z values were calculated instead
of Z value approximation from the table because the sample size was small. Validation &
verification process relied on workshops, interviews and survey instruments, as another full
implementation of the framework in a new jobsite was not possible due to funding and time
restrictions.
72
Chapter Four: Data Collection, Analysis and System Development (Pre-Implementation)
This chapter consists of data collected in phases I and II of the research project. Data
collected during these phases of the research was mostly qualitative data, which helped to
formulate the system and develop the initial version for site testing. Qualitative data was
analysed using a SPSS text analytics package and responses were summarized in frequency
tables.
4.1 State of Information Management in the Construction Industry in North America
The total number of participants in the initial stage was forty-six (both online and on-site)
but only thirty-three completed it. The demography of research subjects is given below in
Figures 4.1 and 4.2. The majority of participants (nearly two-thirds) were from the building
construction industry and close to fifty percent of the research subjects were very experienced
(more than 15 years of experience in the construction industry). The bulk of the research subjects
had both site and office experience. These qualities of research subjects enabled the researcher to
better understand the problems in communication.

73
Figure 4.1: Distribution of Research Subjects According to Industry Sector
Figure 4.2: Distribution of Research Subjects According to Years of Experience

74
These responses were based on the research subjects’ experience in the industry in 2009
and 2010 in North America. Everyone used hardcopies to disseminate information in the
construction industry, while soft copies were catching up fast. The problem was that supervisory
staff had a limited number of methods to take these soft copies to the site because a limited
number of users had smart phones or handheld devices (see Figure 4.3 below).
Figure 4.3: Methods Used To Disseminate Information According to Research Subjects
These soft-copy and hard-copy data needed to be updated regularly to ensure that
changes were incorporated into the current information. Most of the research subjects performed
this manually in hard copies or soft copies (see Figure 4.4 below). This created a bottleneck in

75
information dissemination. Supervisory staff members were inclined to update their own set of
hard copies for two reasons (usually 11x17 size set):
Can easily carry that to the work site
Don’t have to rely on someone else to update the master set (trust issue)
Figure 4.4: Methods of Updating Information According to Research Subjects
Another objective was to find out if/why the site staff didn’t trust the master set, and
whether there were any problems or issues in updating. Nearly fifty-six percent of the research
subjects complained about problems in information updating.
Based on the interviews and surveys with construction professionals, the construction
industry faces some issues/problem in information integration, updating, and dissemination.
Nearly fifty-six percent thought that there were issues that needed to be solved to improve
communication/information management. Responses were analyzed with SPSS text analytics

76
and are summarized in a frequency graph given below in Figure 4.5. The researcher further
investigated to reveal the nature of the problem. Lack of accessibility of information and a large
volume of information construction companies had to deal with were major problems. Field staff
complained about the lack of sunlight readability, ruggedness and durability, small screen sizes,
and heaviness of available devices. The management staff complained about the volume of data
they needed to handle and lack of acceptance from the field level. One of the other major
problems was dissemination barriers between the operational level and the office due to
insufficient technology and resources.
Figure 4.5: Issues/Problems Industry Faced with Information Integration, Updating, and Dissemination
77
The researcher investigated willingness to deploy soft copies or soft data at the field level
because the AUSIA framework is based on soft data at field level (see Figure 4.6). The majority
of participants were enthusiastic about deploying soft-copy information at the field level.
According to responses from participants there were three main reasons to deploy soft
information at the operational level (Figure 4.7 below summarizes all responses from
participants):
cost effectiveness
ease of navigation and accessibility
real time information transferring capability
According to them there were two main reasons for not deploying soft copies:
lack of data security
issues with equipment and technology
Based on the responses, deployment of soft copies will reduce the cost of information
dissemination at field level and ensure timely delivery (real time) of information to field level.
Ease of navigation and accessibility will improve immensely by using soft copies instead of
printed hard copies. Some of the respondents were concerned that data might be accessible by
individuals without proper authority. Lack of infrastructure and technical knowledge that
prevents them from utilizing digital information in the field was another concern.

78
Figure 4.6: Participants’ Willingness to Deploy Soft Copies on Site
Figure 4.7: Reason for Deployment and Non Deployment of Soft Copies

79
Groups that deployed softcopies revealed some issues/problems they faced during
inception and deployment of soft-copies (information and data in a digital format) in the field.
The main drawbacks were a high volume of information and accessibility problems from field
level. Other issues were low reliability, inability to timely disseminate information, lack of
resources, and acceptance at the field level (see Figure 4.8 below). Lack of interoperability also
hindered successful deployment because the commercial construction industry didn’t have a set
of guidelines or standards to help engineers, architects, general contractors, and subcontractors to
share electronic data. These issues either prevented deployment or reduced the positive impact.
As a result supervisory staff members were inclined to depend more on hard copies.
Figure 4.8: Issues/Problems the Industry Faced when Deploying Soft Copies

80
BIM is a good tool for both site and office, because it has a good potential to improve
communication (Dossick & Neff, 2011). The researcher explored the level of BIM usage within
research subjects' organizations. More than fifty percent of the research subjects believed their
organizations have a satisfactory level of BIM expertise (see Figure 4.9 below). Further inquiries
were made to these research subjects about success of BIM integration with the operational level
and any problems or issues they encountered.
Figure 4.9: Organizational Expertise on 3D/4D Model Usage
Another important aspect was methods of integrating BIM/3D models with the work site.
Initially the researcher explored the existing model dissemination approaches with the site level
(see Figure 4.10 below). The majority of the respondents didn’t integrate BIM models with the
site level and some only utilized BIM in the pre-construction stage and when estimating. An
equal number of respondents used printouts and screenshots as well as real models to integrate
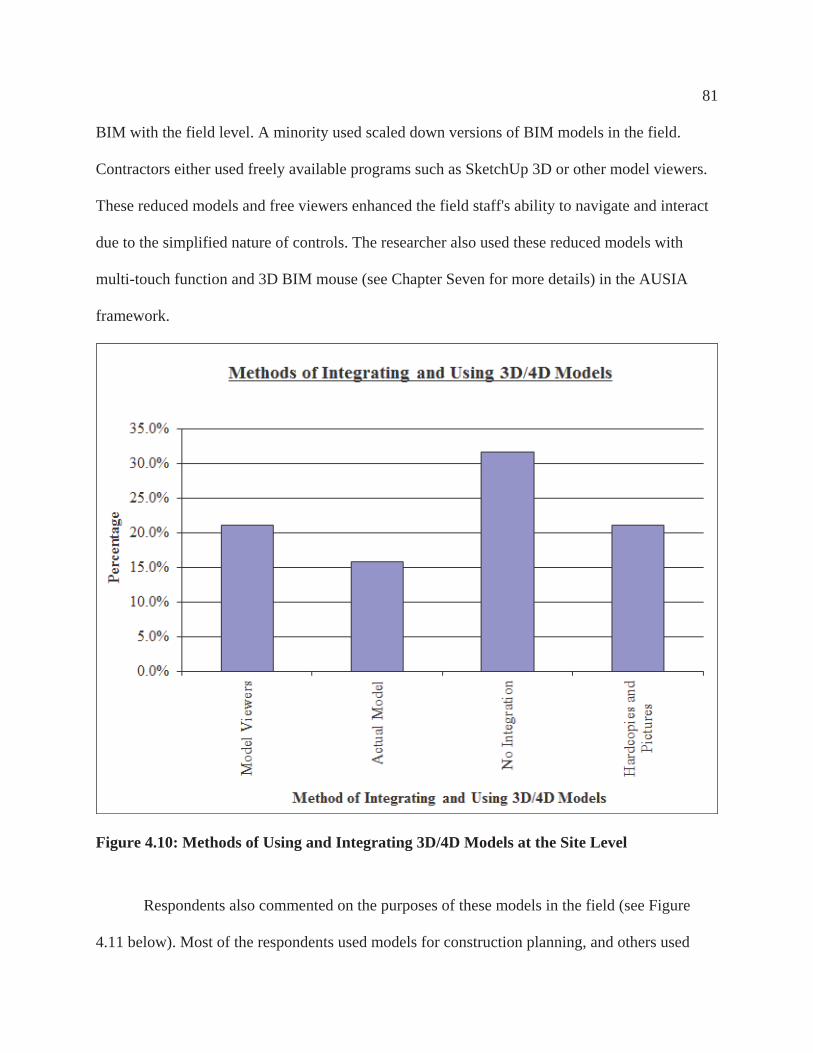
81
BIM with the field level. A minority used scaled down versions of BIM models in the field.
Contractors either used freely available programs such as SketchUp 3D or other model viewers.
These reduced models and free viewers enhanced the field staff's ability to navigate and interact
due to the simplified nature of controls. The researcher also used these reduced models with
multi-touch function and 3D BIM mouse (see Chapter Seven for more details) in the AUSIA
framework.
Figure 4.10: Methods of Using and Integrating 3D/4D Models at the Site Level
Respondents also commented on the purposes of these models in the field (see Figure
4.11 below). Most of the respondents used models for construction planning, and others used

82
models for visualization and communication purposes. Field supervision staff used these models
to better communicate with the workforce and subcontractors. Design, clash detection, and
work/activity sequencing were some other purposes of 3D/4D models. Around fifteen percent of
respondents used models for coordination of construction work. Field supervision staff expressed
that models increase effectiveness of training, scheduling crane picks, design visualization
(concrete lift drawings), and early clash detection. During implementation the researcher noted
that field staff identified some of the clashes before construction as a result of workface planning
and better integration of BIM with the operational level.
Figure 4.11: Purposes of 3D/4D Models at Site Level

83
Most of the organizations used computers in site trailers or printouts to deploy BIM
models in the field. As a result operational staff members at field level had limited access to
these models. Less than ten percent of the site staff had access to these models in an interactive
medium (see Figure 4.12 below). Even though field supervisory staff benefits from using BIM
models in the operational level, the majority of the contractors don’t have infrastructure to
support interactive models on site. There are a few reasons for this, one being no legal
framework to transfer the models to contractors. Another problem is lack of commitment from
all project participants to fully utilize BIM. So contractors create their models from 2D drawings
and as a result these models are not complete enough to properly conduct clash detection. The
researcher also observed this in the jobsite where the AUSIA framework was implemented. The
general contractor only modeled lift cores due to lack of available resources. Engineers,
architects and general contractors need to adopt either “The American Institute of Architects
(AIA) E202 BIM Protocol” or “The Associated General Contractors of America (AGC)
ConsensusDOCS 301 BIM Addendum” to facilitate the model data transfer between project
stakeholders.

84
Figure 4.12: Infrastructure Available to Access 3D/4D Models at Site Level
Finally, inquiries were made about issues and problems with BIM model integration on
site (see Figure 4.13 below). The main complaint was unavailability of a proper protocol for
updating drawings or models. Engineers sometimes update shop drawings in the field with a
pencil or pen. They sometimes forget or do not have the time to go back and update the model.
Therefore, the models do not agree with the fabrication and installation. Other problems were
similar to those in soft-copy deployment.

85
Figure 4.13: Issues/Problems Industry Faced with Deployment of 3D/4D Models
These results highlight that the construction industry needs an interactive communication
system to improve the communication between the field and the office. Supervisory staff suffers
due to the inability to take all required information with them to the field. Also there isn't a
proper procedure to update the master set of drawings, while information integration and
automation is minimal. As a result general contractors tend to have multiple copies updated in
multiple locations by several individuals. Supervisory staff tends to maintain their own copy
because of discrepancies in the information updating.

86
This led the researcher to note time wasted due to poor information management and
communication. Time wastage was categorized into seven major areas:
Searching for Drawings
Supervisory staff spent time searching for drawings in the field/office. This was time
spent due to bad information management practices, lack of meta data to categorize information,
and poor version control. Time spent on studying drawings, referring to drawings, and other
construction and management related activities were excluded and only ineffective activities
were considered.
Searching for Site Instructions (SI), Requests for Information (RFI) and Contemplated Revisions
(CR)
Time that supervisory staff spent searching for SI, RFI, and CR as a result of poor
integration between drawings and changes and ineffective database practices was considered.
Supervisory staff studying changes for constructability, construction management, and other
field related activities were excluded.
Searching for Specifications and Technical Information
Time was spent ineffectively searching for technical information and specifications due
to lack of integration with addendums, lack of metadata for categorisation (CSI codes), and lack
of integration with drawings.
Searching for Material Safety Data Sheets (MSDS)

87
Time was spent searching for MSDS, because most of the time these were available as
hardcopies in one binder.
Walking between Site and Site Office
Supervisory staff had to walk between the work site and the site office to refer to
drawings and other information, as they couldn’t carry all the information required.
Data Entry
Supervisory staff wasted time transferring information/data in paper to the computer in
the site office. Information such as near miss reports and incident reports that a foreman
completed on site needed to be entered into a system or a database by same/another staff
member.
Data Processing
Supervisory staff had to spend unnecessary time creating multiple copies of completed
forms and calculating work hours of the gang.
All above-mentioned issues led to unnecessary time waste that didn’t bring any value to
the contractor. Further, the majority of this time could be saved by better communication and
information management. A time waste summary of all forty-six respondents is given below in
Table 4.1. These values given below are based on the perceptions of field supervisors and as a
result actual values might be different.

88
Table 4.1: Time Waste Due to Inappropriate Information Management/Communication
Sear
chin
g fo
r D
raw
ings
Sear
chin
g fo
r SI
, RFI
and
CR
Sear
chin
g fo
r Sp
ecifi
catio
ns a
nd
Tec
hnic
al In
form
atio
n
Sear
chin
g fo
r M
SDS
Wal
king
bet
wee
n Si
te a
nd S
ite O
ffic
e
Dat
a E
ntry
(H
ardc
opy
to S
oftc
opy)
Dat
a Pr
oces
sing
Tot
al T
ime
Was
te
(Min
/Day
)
Mean 37 26 23 4 28 36 30 184
Average Time Waste per Day per Person 166
The researcher calculated the average time wasted per day using two methods:
calculating the simple average time waste per person, per day
calculating the mean of each category separately and then adding up all means.
These were calculated separately because during this study, the research team developed
only part of the AUSIA framework (wall mount version and mobile version of the i-Booth).
Until the complete framework is developed with handheld applications, some of these time waste
categories can’t be minimized/eliminated. These are:
data entry
data processing
If these parts are eliminated from time wastage when the AUSIA framework is
implemented, the total time saving will be 114 min/day.

89
4.2 AUSIA System Development
The AUSIA framework was developed in three generations, namely Zero generation,
First generation, and Second generation. Zero generation was the proof of concept phase and the
developed framework couldn’t be applied to the work site without further development. Because
of this, the researcher developed the first generation AUSIA framework for site testing (similar
to a beta version). This first generation framework underwent several changes before and during
site testing based on the inputs from acceptance tests and site feedback. The second generation
AUSIA framework is the final product developed after site testing and several acceptance tests
and BVG sessions.
4.2.1 Zero Generation (Information Booth)
The initial development and testing of the zero generation was conducted at Rocky View
General Hospital parkade with PQR Management Ltd, by the U of C productivity research team.
They used a LCD projector and a laptop to carry out toolbox meetings with the workforce (see
Figure 4.14 below), and then made a presentation with the aid of site supervision staff. This
presentation consisted of a few drawings, safety information, material locations, 3D renderings,
and work schedules. The foremen presented the content to the workforce. The research team
changed the presentation based on feedback from the workforce and input from supervisory staff.
Hewage and Ruwanpura (2006, 2009) developed this concept, pilot tested it for 3 weeks, and
concluded with a positive note.

90
Figure 4.14: Zero Generation (Information Booth)
4.2.2 First Generation (i-Booth)
Based on the positive responses received from the workforce and supervisory staff, the
research team assembled a kiosk called Generation One i-Booth for extensive field testing, as the
initial setup used for the zero generation proof of concept phase wasn’t a practical solution.
During the interviews and observations the researcher realized that simply designing a kiosk with
a web interface wouldn’t bridge the communication gaps between site and office. The
construction industry needs an integrated platform to communicate between various systems
while providing an interactive portal for the supervisory staff on site. Before designing the full-
blown framework, the researcher designed the kiosk, which is the main communication hub of
the framework and one of the key components. This consisted of a single point touch-screen,

91
rugged keyboard, mouse, and 3D BIM mouse. The kiosk was equipped with simple, web-based
software that communicated with the web server and the client's terminals in the construction
field and management offices. The first generation i-Booth was designed as a combination of an
information kiosk system and an interactive kiosk system. According to Maguire (1999), kiosk
systems should be “walk up and use” based, but special kiosk systems such as i-Booth need to
cater to specific end users (such as lead workers, foremen, trade and general superintendents, and
construction managers) so that minimal training is required to navigate the system.
The selection of an appropriate touch screen was a very critical aspect. Based on the
advantages/disadvantages and functionality, the best possible market-ready solution for i-Booth
is optical imaging technology. The following are advantages of the optical imaging technology:
No surface coatings, as a result no degradation in image quality and no dead areas, so
the whole screen is covered.
Gloved hands, mechanical styluses, or fingers can be used for touch function.
As they're robust systems, the screen is not affected by contaminants and scratch
marks.
System is easily sealable for dirt, moisture, and dust (environment resistant). As a
result it is ideal for demanding environments such as construction sites.

92
Figure 4.15: First Generation i-Booth
The research team carried out user acceptance testing in three construction job sites and
interviewed higher managers to determine the feasibility of both hardware and software. Initially
the researcher and another graduate student in the program designed a dummy version of the
software with simple information categories such as drawings, safety, quality, schedule, etc.
These initial information categories were selected based on the researcher's industry experience
and inputs from the principal investigator. This version only consisted of a Graphical User
Interface (GUI) and some dummy data (see Figure 4.16 below). The researcher demonstrated
this demo system in a laptop connected to an LCD screen in a FIATECH conference, and in
several workshops given by the principal investigator to construction professionals on the 'Top
Ten Targets of Improving Construction Productivity'. More information on the dummy software
is attached in Appendix XI.

93
Figure 4.16: Demonstration Graphical User Interface (GUI) of First Generation i-Booth
All the information in the demo system was in either PDF files, videos, or image files.
Based on the inputs from interviews and feedback, the researcher designed the first kiosk with a
touch screen, keyboard, and mouse with simple, web-based software (the research team hired a
graduate student from computer engineering for the software design). The researcher and
technical staff of the Department of Civil Engineering integrated a TV lift to protect the screen
during transportation. This lift enabled the screen to be lowered into the box when transporting.
Three acceptance tests were conducted to fine tune the data structure and user interface of the
kiosk. Users complained about pixel errors in the touch screen (Colle & Hiszem, 2004). The
researcher and software developer increased the button size and redesigned the software to
enhance fat finger functionality (Siek et al., 2005). Several other software features of the system

94
were modified based on the input from users, such as integrating BIM models instead of 3D
illustrations. The number of supported file types was increased from three types to any number
of file types, but the kiosk needed software to read the files. As a result files were opened in the
native software instead of in the kiosk software. The kiosk end software only consisted of
information needed for the next two/three weeks based on the look-ahead schedule. This was
done based on the input from workshops to increase the performance.
The research team initially planned to integrate the in-house SharePoint-based document
management system of the general constructor with the kiosk system. The data and information
were uploaded based on two/three week look-ahead schedules. There were several shortcomings
identified during field testing in the last three years, which are relevant to many construction
contractors:
The document management system did not have some key features needed for
integration with the kiosk system. There was no amalgamation of information,
information was just populated into a list, searching for information was time
consuming, and a protocol for information uploading was unavailable.
Staff in the operational level couldn't work with information pertaining to the
subsequent two/three weeks, due to issues and problems in the drawings and other
information.
The integration of information [Site Instructions (SI), Requests for Information (RFI),
Contemplated Revisions (CR), Project Change Notices (PCN), etc.] was done
manually and needed to be updated to soft copies to streamline the process and
improve supervisory staff’s efficiency.

95
New hardware components needed to be integrated with the kiosk to ensure better
utilization of BIM in the operational level.
The researcher conducted twenty interviews and developed tables, which are attached in
Appendix XII, to identify information flow within the construction site. This was a very
important step to understanding the current industry practice and inefficiencies in information
handling in construction sites. The general contractor receives all drawing packages as Issued for
Construction (IFC) after the project is awarded. Vital changes and other information necessary to
undertake construction are delivered as shop drawings, RFIs and SIs during the full project
duration. Timely delivery of the above-mentioned information is a critical factor for success. As
a result, the researcher focused mainly on drawings such as shop drawings, RFIs, and SIs and the
way these are handled by contractors and operational level personnel, and where the bottlenecks
occur.
4.2.2.1 Shop Drawings
As the general contractor was self-performing structural concrete, the researcher focused
mainly on rebar and formwork shop drawings. Figures 4.17 and 4.18 below illustrate the
generation and modification of this information. The blue circle represents the starting point of
the information and the green circle represents the final information. Generation of a rebar shop
drawing involves the following steps:
Architectural Consultant: Generation of architectural drawing
Structural Consultant: Generation of structural drawing (can be the same consultant)
General Contractor: Hand over the structural drawings to rebar subcontractor
Rebar Sub-Trade: Create and hand over the shop drawing to general contractor

96
General Contractor: Review the rebar shop drawings and resubmit to subcontractor
for revision and corrections (if needed) or else submit to detailing company (or in
some cases to architectural consultant) for approval
Detailing Company: Review and resubmit for corrections or else approve
General Contractor: Hand over the approved rebar shop drawing to subcontractor to
commence construction
Figure 4.17: Information Flow Chart for a Rebar Shop Drawing

97
Generation of formwork shop drawings ensues as follows:
Architectural Consultant: Generation of architectural drawing
Structural Consultant: Generation of structural drawing (can be the same consultant)
General Contractor: Hand over structural and architectural drawings to formwork
provider (or in-house engineering team) to design formworks
Formwork Provider: Create and hand over the shop drawing to general contractor
General Contractor: Review the formwork shop drawings and resubmit to formwork
provider for revisions (if needed) and corrections or else submit to structural
consultant (in some cases to architectural consultant) for approval
Structural Consultant: Review and resubmit for corrections or else approve
General Contractor: Commence construction based on approved shop drawing
Structural Consultant: Check the formwork before commencing concreting
General Contractor: Commence concreting
Structural Consultant: Give approval for stripping of formwork
General Contractor: Strip the formwork

98
Figure 4.18: Information Flow Chart for a Formwork Shop Drawing
4.2.2.2 Changes
Two other types of information (information handling) the researcher observed were
change RFIs and SIs (see Figures 4.19 and 4.20 below) because the majority of drawings
consisted of multiple RFIs and SIs. Timely delivery of changes to the operational level is critical
for successful project completion. Information contained in drawings inform the workforce of
what needs to be constructed, and changes provide what needs to be changed in the drawings and
other information to complete the project successfully. Generation of a RFI involves the steps
given below:
Subtrade: Generate a query based on requests from field level (this query may be
generated by subtrade or general contractor).

99
General Contractor: Review the query generated by field level; if general contractor
can't resolve the query, generate a RFI.
Trade Consultant: Resolve the RFI through a SI or a CO/ PCN, or else forward that to
Architectural Consultant.
Architectural Consultant: Resolve RFI through a SI or a CO/ PCN based on inputs
from Trade Consultant.
General Contractor: Distribute the SI or CO/PCN to field level/subtrade and execute
the work based on information and close the RFI.
Sub Trade: Execute the work based on information.
Figure 4.19: Information Flow Chart for a Request for Information (RFI)
Generation of a SI occurs as follows:
Trade Consultant: Generate a SI in response to a RFI or to resolve a site issue
identified by trade consultant or architectural consultant.
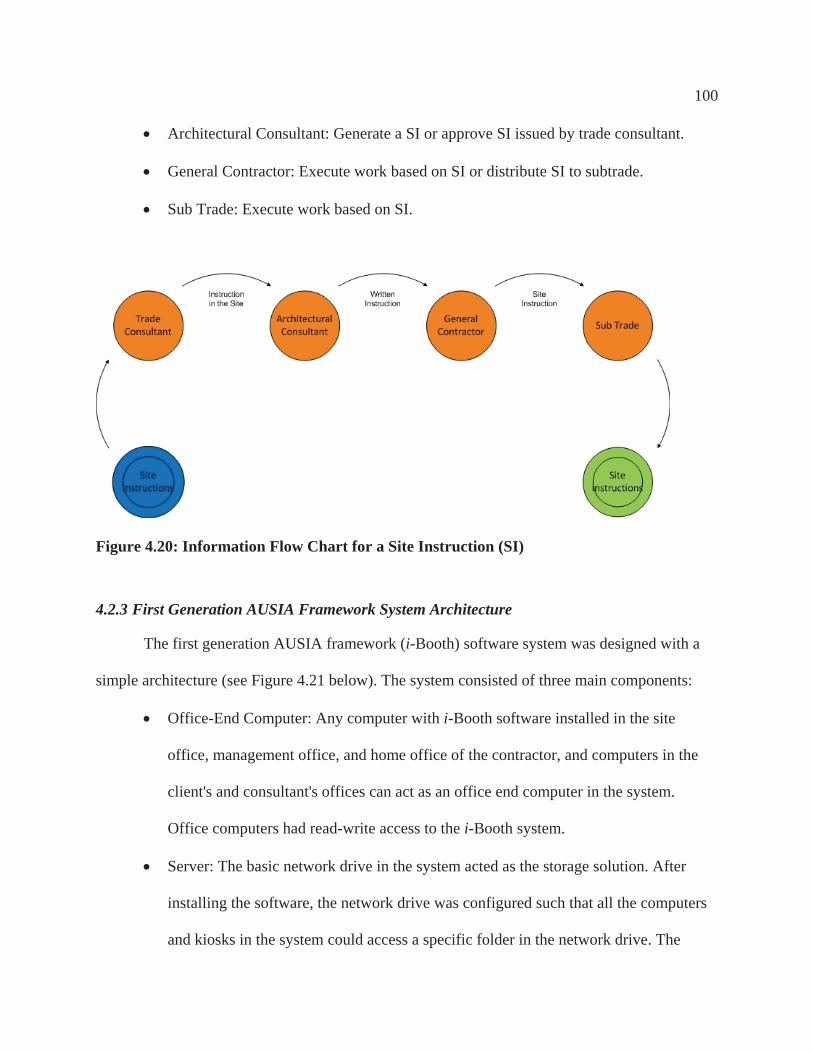
100
Architectural Consultant: Generate a SI or approve SI issued by trade consultant.
General Contractor: Execute work based on SI or distribute SI to subtrade.
Sub Trade: Execute work based on SI.
Figure 4.20: Information Flow Chart for a Site Instruction (SI)
4.2.3 First Generation AUSIA Framework System Architecture
The first generation AUSIA framework (i-Booth) software system was designed with a
simple architecture (see Figure 4.21 below). The system consisted of three main components:
Office-End Computer: Any computer with i-Booth software installed in the site
office, management office, and home office of the contractor, and computers in the
client's and consultant's offices can act as an office end computer in the system.
Office computers had read-write access to the i-Booth system.
Server: The basic network drive in the system acted as the storage solution. After
installing the software, the network drive was configured such that all the computers
and kiosks in the system could access a specific folder in the network drive. The

101
researcher and software development team utilized the web drive provided by the
University of Calgary during site implementation. There were several reasons to
select the University web drive over commercially available solutions:
o Web drive was available free of charge
o Web drive can be easily accessed by configuring any computer or kiosk
o Support and customizations are available conveniently in the university, free
of charge
Site-End Kiosk: The kiosk developed by the researcher and university technical staff
was used as the site end kiosk. This kiosk was designed with a single point touch
screen, TV lift, laptop, water resistant keyboard, and wireless mouse. These
components were assembled inside a wooden cabinet with a steel frame.

102
Figu
re 4
.21:
Fir
st G
ener
atio
n Fr
amew
ork
(i-B
ooth
)

103
The laptop was equipped with a Windows operating system, PDF professional,
DWF/DWG viewer, Autodesk Navisworks Freedom, and MS office. Software was a basic web
based database. Users accessed information through the GUI (Figure 4.22). Users had read-only
access to information through the kiosk.
Figure 4.22: Graphical User Interface (GUI) of First Generation i-Booth
Other than productivity tool box all other modules were operational during site
implementation. Information was arranged in a pre-determined hierarchical order in the first
generation i-Booth. Hierarchical browsing is called a similarity pyramid. The similarity pyramid
clusters similar information together, which allows users to view the database at varying levels
(Chen et al., 2000). The researcher and software development team decided to incorporate ten
information categories (see orange colour boxes in Figure 4.23 below). Drawings were further
categorized into 8 sub-categories (see yellow colour boxes in Figure 4.23 below). Thereafter the
users had the ability to subdivide based on their preference (for example, based on the number of

104
levels or by area). The schedule was further divided into 4 sub-categories (see yellow colour
boxes in Figure 4.23 below). Thereafter the users had the ability to subdivide based on their
preference (for example, based on the area). The detailed classification used in the first
generation i-Booth is summarized in Figure 4.23 below.
Figure 4.23: Hierarchical Classification of First Generation i-Booth
This predetermined hierarchical browsing technique had some drawbacks: when users are
deep in one folder they have to come back to the home page or go back by the same route if they
want to access other information. As an example, if users were viewing a level one structural
drawing and wanted to view a mechanical drawing in level two, they either had to go back to the
home screen (Figure 4.22) or go back two steps to mechanical (Figure 4.24 below) and go to
level two, which is time consuming.
Information was populated to the system based on the folder structure in the network/web
drive. The information needed, such as a description and version number, was determined based
on the file name. Version history was handled manually and if the file already exists in the
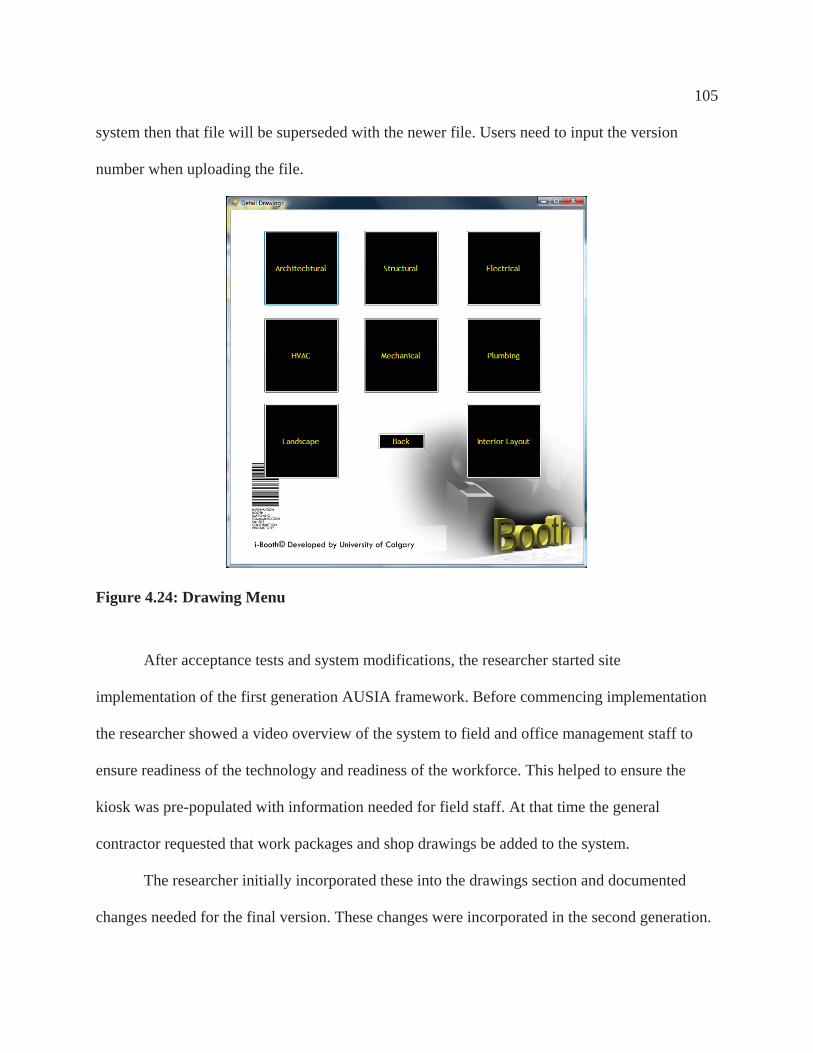
105
system then that file will be superseded with the newer file. Users need to input the version
number when uploading the file.
Figure 4.24: Drawing Menu
After acceptance tests and system modifications, the researcher started site
implementation of the first generation AUSIA framework. Before commencing implementation
the researcher showed a video overview of the system to field and office management staff to
ensure readiness of the technology and readiness of the workforce. This helped to ensure the
kiosk was pre-populated with information needed for field staff. At that time the general
contractor requested that work packages and shop drawings be added to the system.
The researcher initially incorporated these into the drawings section and documented
changes needed for the final version. These changes were incorporated in the second generation.
106
4.3 Software Developers Contribution
A graduate student from the computer science department helped researcher in software
development. The main contributions from the software developer was to develop the basic
software for first generation i-Booth. The researcher provided the complete list of requirements
for the program and functionality required for field testing. Development was done based on
web drive as a central data repository and interface to upload and download information
(Access).
4.4 Conclusion
This chapter analyses data collected from phases I and II of the research study. When
analysing current level of information management the majority of research subjects used hard
copies to disseminate information to the operational level. Updates were done manually in both
hard copies and soft copies. As a result the research subjects encountered problems such as poor
accessibility, inability to handle large volume of information and lack of reliability. Some
general contractors focused on deployment of soft copies to bridge the communication gap
between office and operational level. According to the research subjects there were reasons to
both discourage (data insecurity, lack of infrastructure, and inadequate technology) and
encourage (ease of navigation and accessibility, cost effectiveness, and real time data transferring
capabilities) contractors to deploy soft copies. BIM models have the capability to improve
communication at the field level but updating and integration problems prevented general
contractors from deploying models in the field. This ineffective information management cost
nearly two hours of each supervisory person’s time (nearly seventy dollars per head).

107
The first generation AUSIA framework was designed based on input from site
observations and interviews. Initially it consisted of a kiosk equipped with a single point touch
screen, rugged key board, mouse and 3D BIM mouse with a simple web based software. Later
the system was modified based on input from acceptance tests.

108
Chapter Five: Site Implementation and Testing
This chapter describes on-site implementation and full scale site testing of the first
generation i-Booth at the TTC complex in ABC Polytechnic, from Dec. 2010 to Dec. 2011. This
chapter also deals with site selection, existing information handling methods, activity
monitoring, feedback and modifications requested by the general contractor, and objectives
fulfilled by implementation. The TTC complex included construction of three new buildings
(South Wing, Centre Wing, and West Wing) and providing a major renovation to a fourth
building. The three new buildings added over 700,000 square feet of new class, lab, office, and
common space and consisted of four stories that were built with a self-performed concrete
structure, steel roof structure, and unitized curtain wall cladding. This was a two hundred and
fifty million dollar guaranteed maximum price contract, with a profit sharing model of forty
percent to sixty percent between the general contractor and client if total cost of the project was
less than two hundred and fifty million.
Figure 5.1: Project Site Plan

109
The organizational structure of the project consisted of a management office and a field
office. Three new building projects and a renovation project were carried out by one senior
superintendent and two superintendents. This setup enabled smooth functioning of site
supervision, contract administration, and cost and schedule control.
5.1 Site Selection
The selection of a proper location for site implementation is a critical factor for success
because pilot testing is a time and money consuming exercise. Success of field level systems
largely depends on the attitude of onsite personnel towards technology and their willingness to
try something new.
The field level management team was the most important factor considered when
selecting a site to implement the system. Site implementation can fail for two reasons:
Inadequate readiness level of technology for site testing.
This can be measured using two methods:
o Technology Readiness Level and System Readiness Level (TRL & SRL) -
TRL was developed by NASA and SRL was develop by Sauser et al. (2006)
(discussed further in Chapter Two: Literature Review).
o Acceptance Tests- The researcher conducted three acceptance testing
workshops at three different job sites before site testing, to ensure the readiness
level of the technology (further discussed in Chapter Three: Objectives and
Research Methodology).

110
Workers propensity to embrace new technology also determines successful site
implementation. This can be measured by TRI, developed by Parasuraman (2000).
(Discussed further in Chapter Two: Literature Review.)
Based on researchers’ observations and input from field and office management,
construction personnel have a tendency to resist system/procedure changes. As a result these
technologies should be tried and tested thoroughly before implementation.
The summary of the field level management teams' willingness to embrace and try new
technology is given in Appendix XIII (only the West Wing and Centre Wing were considered
because South Wing was not a feasible option to implement the system). According to this
summary, Center Wing staff had medium TRI scores and a positive attitude regarding new
communication technology.
The South Wing superstructure was completed and the finishing stage had already started
when the researcher first came to the site. The researcher preferred to implement the system with
the general contractors' crew because subtrades were not part of the collaborative research and
development project. The South Wing would have been an ideal place to implement if the
researcher had had the chance one year earlier, because it was a small, compact building. As the
West Wing superstructure was under way (only two floors were completed from a total of five
floors), the learning curve influence was minimal so it was a benefit (Wong & Cheung, 2008).
The researcher had to manage this project by himself because of the confidentiality
agreement between the general contractor and the researcher to release the information. The size
of the Center Wing was too large for this kind of implementation because the time and effort
needed for site implementation is directly proportionate to project size. Based on the researchers’
experience, technically advanced systems and tools need not be implemented in large projects to

111
reap benefits. The effort needed to implement an information management system is directly
proportionate to the project size but the benefits don’t depend on project size. So the size of the
West Wing was ideal for testing.
Another reason for selecting this site was ease of accessibility, as it was closer to the
university. Based on the above rationale the researcher decided to pilot test the system in the
West Wing.
5.2 Existing Information Handling
The researcher conducted some observations initially to understand the current
information handling practices. Also some interviews were done with the project manager, senior
superintendent, trade superintendents, document coordinator, field engineers, and foremen to
validate and reinforce the observations (see earlier chapter for details).
The general contractor used an in-house, web-based information management system
called “Portable Document Solutions (PDS)” for information/document handling, contract
administration, and construction management. This system was good for contract administration
and construction management, but using this for information management had several down
sides:
Information and data (such as drawings, specifications, RFI, SI, and CR) were
populated into a web-based database without any integration between these
information. As a result extra time was needed when searching for particular
information. This was compensated by two hardcopy drawing sets kept in the
management office and field office. These were updated manually by two separate
field engineers.

112
There was a lack of integration and automation in the document management system.
As an example, when a user wanted to find drawing number S40.00 he had to go to
the structural (IFC) section and download the PDF of the drawing, but there was no
proper procedure for finding the latest revision of the drawing. (This was a major
drawback when the researcher wanted to integrate the existing PDS with the
framework).
Constructability and accuracy of the information were not verified when uploading
information into the existing system. (Because of this the researcher was unable to
directly connect the framework with PDS.)
There were a few issues raised by field supervisory staff that needed solutions in order to
prevent productivity loss due to inadequate communication at the field level. Schedulers and
planners used Primavera P6 for scheduling construction activities, but detailed construction
planning had to be done by a foreman and site superintendents, which was usually done on a
white board or in Microsoft Excel. A solution was needed to integrate these two methods for
better performance. Field staff also complained that information delay led to rework and on some
occasions the approved shop drawing was issued only after construction was completed.
The general contractor used Workface Planning and prepared work packages beforehand,
which were either paper binders or PDF files. Workface planning is the process of organizing
and delivering all the elements necessary, before work is started, to enable craft persons to
perform quality work in a safe, effective and efficient manner (Construction Owners Association
of Alberta, 2013). The main purpose of these packages was to ensure that field staff had all the
relevant information in an easily accessible mode. As an example, a package prepared for second
floor slab concrete might consist of:

113
Grade of the concrete and mix design
Final Quality Assurance/Quality Control (QA/QC) of the formwork
Drawings for floor finishing levels, etc.
These packages needed to be updated regularly due to constant changes, but this rarely
happened and as a result field staff of the general contractor and subcontractor had to search for
all of this information in the document control system. This was a waste of resources for both the
general contractor and subcontractor.
5.3 Activity Monitoring
Activity monitoring was conducted to understand the present site condition. The research
team had conducted several activity monitoring sessions in Calgary during the last six years.
This helped the researcher to get a preliminary understanding of labour productivity. The
researcher used the following observation periods and methods for conducting tool time. These
time periods were selected based on the breaks on the site for tea (10:00am – 10:30am) and
lunch (1:30pm – 2:00pm). The researcher only concentrated on carpentry (flyer striping, flyer
placing, and wall forms) and concreting activities because the general contractor self-performed
only these two trades.
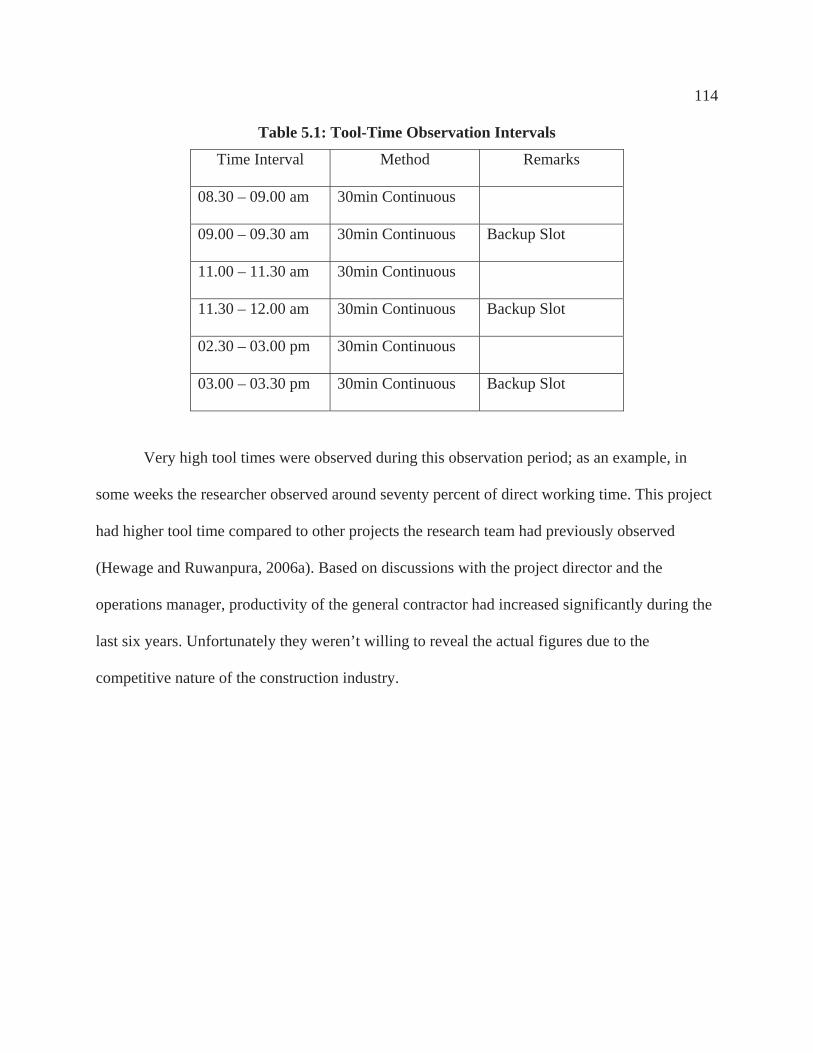
114
Table 5.1: Tool-Time Observation Intervals
Time Interval Method Remarks
08.30 – 09.00 am 30min Continuous
09.00 – 09.30 am 30min Continuous Backup Slot
11.00 – 11.30 am 30min Continuous
11.30 – 12.00 am 30min Continuous Backup Slot
02.30 – 03.00 pm 30min Continuous
03.00 – 03.30 pm 30min Continuous Backup Slot
Very high tool times were observed during this observation period; as an example, in
some weeks the researcher observed around seventy percent of direct working time. This project
had higher tool time compared to other projects the research team had previously observed
(Hewage and Ruwanpura, 2006a). Based on discussions with the project director and the
operations manager, productivity of the general contractor had increased significantly during the
last six years. Unfortunately they weren’t willing to reveal the actual figures due to the
competitive nature of the construction industry.

115
Figure 5.2: Project Working Time Analysis
5.4 Integrating AUSIA Framework with Operational Level
The researcher had to integrate the i-Booth with the operational level carefully because
there were several key steps to consider after selecting the West Wing as the location for site
testing. These steps are explained in detail below.
5.4.1 Location Selection
The researcher considered several options within the West Wing for placement of the i-
Booth. The locations considered were:
Workface/Job Site
Site Office
Lunch Room
Foremen Trailers

116
These locations were identified based on the researcher’s experience and input from the
acceptance tests. The factors considered when selecting the location were accessibility,
availability of power and data connections, and security. The main factor considered was easy
accessibility to the kiosk. Though the ideal location to easily access the i-Booth was
workface/job site, there were a few issues to consider such as security and availability of power
and data. The researcher initially positioned the kiosk in the lunch room/work trailer as requested
by the senior superintendent and West Wing superintendent, due to security issues.
Uninterrupted Power Supply (UPS) for the kiosk was also a factor because the initial first
generation version tested wasn't equipped with a UPS. For these reasons the lunch room trailer,
which was adjacent to the structure under construction, was selected as the location for the kiosk.
After three months the kiosk was moved to the first floor of the West Wing. The kiosk was
equipped with a third generation air card to provide data connection (wireless 3G connection).
5.4.2 Information & Communication Management
After the logistics were finalized, the researcher planned the rest of the implementation.
Both the researcher and the management team agreed to consider the hardcopy drawing set in the
field office as the most current and up-to-date version of the drawings for contractual purposes.
Site management and the researcher agreed that field supervisory staff and lead hands always
had to refer to the hardcopy drawing set in the morning before checking the kiosk. This protocol
was practiced to prevent discrepancies between the hard copy and soft data, as the researcher was
uploading information to the kiosk system manually. Table 5.2 below summarizes the
information management during field testing.

117
Tab
le 5
.2: S
umm
ary
of In
form
atio
n M
anag
emen
t
R
esea
rche
r M
anag
emen
t Sta
ff
Fiel
d St
aff
Upl
oadi
ng
Info
rmat
ion
Prim
arily
resp
onsi
ble
for u
ploa
ding
info
rmat
ion
Prov
ide
acce
ss to
PD
S an
d co
ordi
nate
with
field
staf
f to
prov
ide
acce
ss to
softc
opie
sPr
ovid
e ac
cess
to so
ftcop
ies
Typ
e of
Info
rmat
ion
Prov
ide
ratio
nale
beh
ind
reas
ons
for i
nclu
ding
this
info
rmat
ion,
and
purp
oses
it se
rves
Prim
arily
det
erm
ine
type
s of i
nfor
mat
ion
to
incl
ude
in th
e ki
osk
(Dra
win
gs, S
afet
y,
Mee
ting
Min
utes
, and
BIM
)
Influ
ence
rese
arch
er a
nd
man
agem
ent
Ret
riev
ing
Info
rmat
ion
Prov
ide
hard
war
e an
d so
ftwar
e to
help
retri
eval
-
Prim
arily
resp
onsi
ble
to
retri
eve
info
rmat
ion
Tra
inin
gPr
imar
ily re
spon
sibl
e fo
r tra
inin
g C
oord
inat
e w
ith re
sear
cher
and
fiel
d st
aff
-
Han
dlin
g
Issu
es
Prim
arily
resp
onsi
ble
for
docu
men
ting
the
issu
es a
nd
prov
idin
g so
lutio
ns
Coo
rdin
ate
with
rese
arch
er
Res
pons
ible
for r
epor
ting
the
issu
es a
nd te
stin
g th
e
solu
tions
pro
vide
d
118
The researcher communicated one-to-one with management office staff and field office
staff before implementing the kiosk system. Supervisory staff provided inputs, comments, and
concerns on information needed, in which format, at what level of integration, and how
frequently updates were needed. The researcher provided individual training to all the field
supervision and management staff. The researcher was present on the job site during site testing
and was able to give necessary training and information.
5.4.3 Feedback Received & Modifications
Several modifications were done to the kiosk and software based on feedback received
from site implementation. The software was modified by including the following functions and
features:
ability to integrate information
work packages
create a separate section for shop drawings
These modifications were done primarily based on requests from lead hands and
foremen. Kiosk hardware also underwent several modifications based on the input from site
staff, such as adding a forklift ready base and multi-touch display. The prototype unit consisted
of a single-touch rugged display but supervision staff wanted to perform multi-touch functions
such as pan, zoom, etc. through the screen (Song-Gook et al., 2007).
5.5 Project Success
The general contractor monitored project success every week in a systematic manner.
They performed labour cost reporting every week and foremen reported worker time sheets

119
every day. This procedure resulted in a very successful structural completion of the project (West
Wing 2.5 weeks ahead of schedule and Centre Wing 2.5 weeks behind schedule), especially
considering the project size and cost. As well, a smart contracting strategy was used and a profit-
sharing model was adopted by the client.
Another interesting factor was that everybody from the lead-hand to the senior project
manager worked as one well-oiled machine. In particular the site superintendent and assistant
superintendent of the West Wing had a lot of construction experience, which resulted in
identifying errors such as constructability, incorrect sizing before the construction of that
particular item commenced. Deployment of four field engineers and a BIM draftsman resulted in
a positive outcome. Because of that, the work force got the opportunity to benefit from cutting
edge technology such as work packaging and BIM. Field engineers were able to identify some
constructability issues through BIM modeling. Upper management of the general contracting
firm had taken smart steps in the right direction:
Integrating BIM with the field level despite some limitations due to unavailability of
infrastructure to access models.
Hiring a BIM draftsman for the project. Modeling, however, was limited to service
core and staircases due to resource scarcity.
Site management shared the BIM models in work packages but unfortunately workers
and field level supervision staff didn’t have the ability to interact with the model as it was given
to them in printed and PDF formats.
120
5.6 Main Objectives Satisfied By Site Implementation
The researcher fulfilled five objectives through field implementation (the details are
discussed in chapter six):
Improved two-way communication between operational/site level, site management,
and the management office (office management). Enhanced the efficiency and
effectiveness of the information flow between operational/site level, site
management, and management office to augment the information dissemination and
collection process.
Delivered information in a format that the field level could easily understand.
Improved information integration to enhance efficiency and effectiveness of
information dissemination to operational/site level.
Increased the field level automation to enhance information collection and
dissemination.
Selected essential hardware items and optional hardware items for the kiosk system
based on end-user input.
5.7 Conclusion
First generation i-Booth was implemented in TTC complex in Calgary for twelve months.
This complex consisted of three different buildings, which enabled the researcher to select one of
the best possible locations to implement. As systems may fail due to resistance from site staff,
site selection was one of the critical factors for success of implementation. TRI and interviews
assisted the researcher in understanding field supervisory staff’s perspective on leading edge

121
technology and willingness to implement new technology (how adaptive to change). Readiness
of technology for site implementation was tested with acceptance tests.
A major hurdle encountered during site implementation was attaining drawings, contract
documents, and other information from the general contractor. The confidentiality agreement
between the general contractor and the researcher enabled the release of information.
Information management practices of the contractor prevented the researcher from completely
integrating the document management system with the AUSIA framework, so the information
was manually updated to the kiosk by the researcher. The information was delivered in a format
which could be easily accessible through a touch screen kiosk. Implementation improved worker
satisfaction and two-way communication between site and office.

122
Chapter Six: Data Collection and Analysis (During Implementation)
This chapter consists of hypothesis testing and analysis of qualitative and quantitative
data collected during site implementation. The latter half of the chapter contains a comparison of
data collected during implementation (on-site survey) and North American perspective (online
survey).
The researcher collected both qualitative and quantitative data during site
implementation. The researcher conducted workshops to collect data to investigate the level of
communication change before and after implementing the AUSIA framework. The researcher
conducted three workshops each before and after implementation. Survey instruments, listed in
Appendix VIII and Appendix XIV, were used to measure the level of communication. Initially
the researcher conducted Kolmogorov-Smirnov tests to examine the normality of the data (see
Appendix XV for results of K-S test). Based on the results the majority of the variables rejected
the normality assumption. As a result the researcher had to use the nonparametric Wilcoxon
Signed ranked test for hypothesis testing. Other reasons for selecting this statistical method were
explained in earlier chapters.
6.1 Hypothesis Testing
The following are the null hypothesis (H0) and alternative hypothesis (HA) tested:
H0 : Implementation of AUSIA framework does not improve on-site communication
HA : Implementation of AUSIA framework improves on-site communication
Hypothesis can be subdivided into fifty different sub-hypotheses based on AUSIA and
ten information categories (full list of sub-hypotheses are in Appendix III). The researcher
conducted the Wilcoxon Signed Ranked Test for before and after implementation data sets using
123
the IBM SPSS Statistics package. The results of the Wilcoxon Signed Ranked Test are given
below in Table 6.1. As there were only forty-seven research subjects who participated, exact p
values were calculated to prevent errors in approximation. The majority (forty-seven) of sub-
hypotheses p values were less than 0.05. This enabled the researcher to conclude that the AUSIA
framework made a change in the level of on-site communication in a majority of the areas.

124
Tab
le 6
.1: W
ilcox
on S
igne
d R
anke
d T
est S
tatis
tics T
able
Info
rmat
ion
Val
ue
Acc
essi
bilit
y U
sefu
lnes
s Sa
tisfa
ctio
n In
tegr
atio
n A
utom
atio
n D
raw
ing
Z -4
.973
-4.0
82-3
.800
-4.8
42-4
.620
p (E
xact
Sig
.) .0
00.0
00.0
00.0
00.0
00C
hang
esZ
-4.4
00-4
.243
-4.5
64-4
.456
-4.5
59p
(Exa
ct S
ig.)
.000
.000
.000
.000
.000
Safe
tyZ
-3.3
57-3
.500
-3.7
42-3
.824
-4.0
56p
(Exa
ct S
ig.)
.001
.000
.000
.000
.000
Sche
dule
Z -3
.581
-3.7
49-3
.259
-3.5
50-4
.011
p (E
xact
Sig
.) .0
00.0
00.0
01.0
00.0
00M
ater
ial
Z -3
.572
-2.5
00-3
.337
-3.8
01-3
.478
p (E
xact
Sig
.) .0
00.0
12.0
01.0
00.0
013D
/4D
Mod
els
Z -3
.912
-3.3
37-3
.473
-3.8
16-3
.568
p (E
xact
Sig
.) .0
00.0
01.0
01.0
00.0
00Q
ualit
y Z
-4.2
16-4
.326
-4.1
03-4
.167
-3.9
21p
(Exa
ct S
ig.)
.000
.000
.000
.000
.000
Cer
tific
atio
ns
Z -2
.460
-1.3
42-1
.890
-2.6
40-2
.060
p (E
xact
Sig
.) .0
14.1
80.0
59.0
08.0
39W
eath
erZ
-3.0
65-1
.795
-3.2
51-3
.497
-3.5
02p
(Exa
ct S
ig.)
.002
.073
.001
.000
.000
Tech
nica
lZ
-4.3
47-3
.638
-3.5
31-3
.948
-4.0
75p
(Exa
ct S
ig.)
.000
.000
.000
.000
.000

125
The frequency tables generated by the Wilcoxon Signed Ranked test enabled the
researcher to investigate the research subjects’ change of perception on communication before
and after implementation. Each individual information types’ preference change before and after
implementation are summarized in Appendix XVI. According to these frequency tables, the
majority of the time after implementation the respondents’ statuses were either neutral or
positive. In only a few instances the preference level became negative. As an example, in the
drawings frequency table, only two responses were negative from more than forty responses
while a majority of the responses were positive (see Table 6.2 below).
Table 6.2: Wilcoxon Signed Ranks of Drawings
Research subjects’ perceptions change (positive, tie and negative responses) was
analyzed according to these ten information categories in five areas of AUSIA.
ID Information Rank
Dra
win
gs
Accessibility Negative Rank After < Before 0 Positive Rank After > Before 27
Tie After = Before 13
Usefulness Negative Rank After < Before 1 Positive Rank After > Before 20
Tie After = Before 18
Satisfaction Negative Rank After < Before 1 Positive Rank After > Before 19
Tie After = Before 13
Integration Negative Rank After < Before 0 Positive Rank After > Before 28
Tie After = Before 7
Automation Negative Rank After < Before 0 Positive Rank After > Before 27
Tie After = Before 3

126
In the drawings information category nearly seventy percent of respondents reported a
positive change in accessibility after implementing AUSIA framework, while nearly thirty
percent of respondents didn’t experience any difference. Integration and automation areas in
drawing information category imparted nearly eighty & ninety percent positive change
respectively, while usefulness and satisfaction received more than fifty percent positive change.
Cumulative negative experience was less than ten percent in all five AUSIA areas. Overall more
than fifty percent of the field supervisory staff experienced positive change in drawings
information category (see Figure 6.1 below).
Figure 6.1: Research Subjects Perception Change Regarding AUSIA of Drawings Category after Implementation
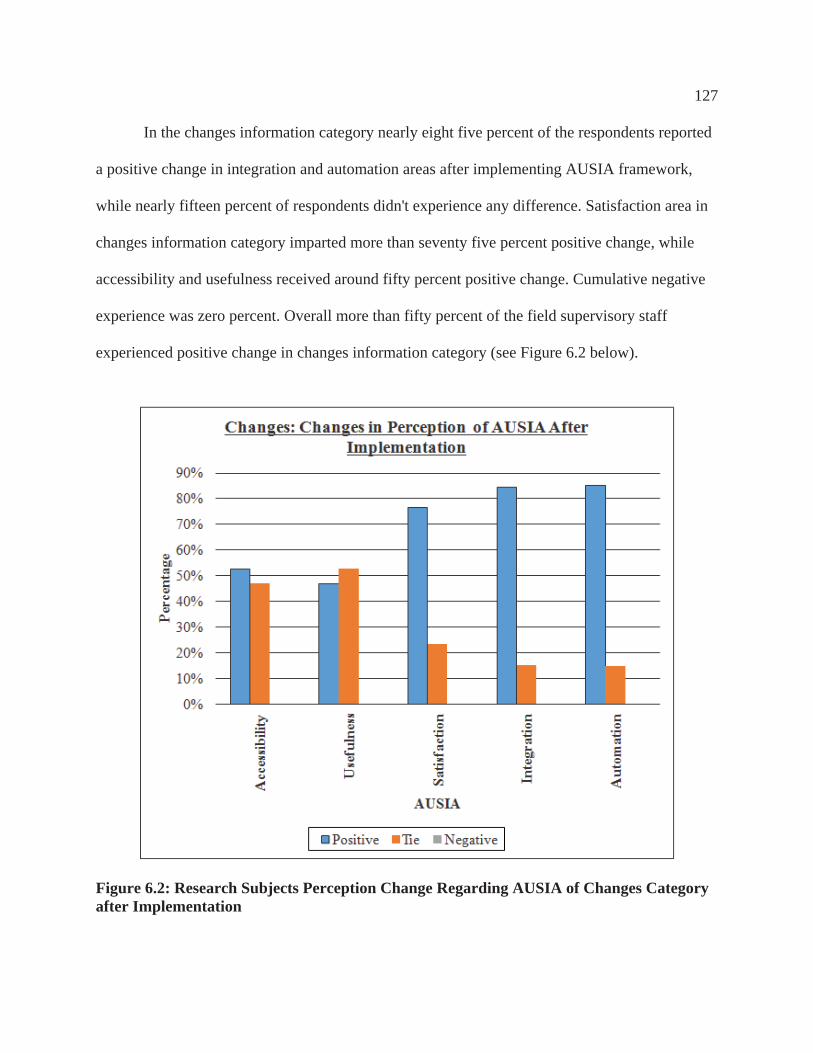
127
In the changes information category nearly eight five percent of the respondents reported
a positive change in integration and automation areas after implementing AUSIA framework,
while nearly fifteen percent of respondents didn't experience any difference. Satisfaction area in
changes information category imparted more than seventy five percent positive change, while
accessibility and usefulness received around fifty percent positive change. Cumulative negative
experience was zero percent. Overall more than fifty percent of the field supervisory staff
experienced positive change in changes information category (see Figure 6.2 below).
Figure 6.2: Research Subjects Perception Change Regarding AUSIA of Changes Category after Implementation

128
In the safety information category more than seventy percent of respondents reported a
positive change in automation area after implementing AUSIA framework, while nearly thirty
percent of the respondents didn’t experience any difference. Satisfaction and integration areas in
safety information category demonstrated nearly fifty & forty percent positive change
respectively while accessibility and usefulness received more than thirty percent positive change.
Cumulative negative experience was less than ten percent. Overall more than thirty percent of
the field supervisory staff experienced positive change in safety information category (see Figure
6.3 below). The main reason for less percentage increase in safety compared to others is due to
the great emphasis on safety in construction industry.
Figure 6.3: Research Subjects Perception Change Regarding AUSIA of Safety Category after Implementation

129
In schedule information category nearly eighty percent and seventy percent of
respondents reported a positive change in integration and automation areas after implementing
AUSIA framework, while nearly fifteen percent of respondents didn’t experience any difference.
Satisfaction, usefulness and accessibility areas in schedule information category imparted around
fifty percent positive change, while forty percent of the respondents didn’t experience any
difference in those areas. Cumulative negative experience was around eighteen percent. Overall
more than fifty percent of the field supervisory staff experienced a positive change in schedule
information category (see Figure 6.4 below).
Figure 6.4: Research Subjects Perception Change Regarding AUSIA of Schedule Category after Implementation

130
In quality information category seventy five percent of the respondents reported a
positive change in automation area after implementing AUSIA framework, while twenty five
percent of the respondents didn’t experience any difference. Satisfaction and integration area in
quality information category reported more than sixty percent positive change, while
accessibility and usefulness received more than sixty and fifty percent positive change
respectively. Cumulative negative experience was less than ten percent. Overall more than fifty
percent of the field supervisory staff experienced a positive change in changes information
category (see Figure 6.5 below).
Figure 6.5: Research Subjects Perception Change Regarding AUSIA of Changes Category after Implementation

131
In 3D/4D model information category nearly eighty five percent respondents reported a
positive change in accessibility area after implementing AUSIA framework, while nearly fifteen
percent of respondents didn’t experience any difference. Automation and integration areas in
3D/4D model information category imparted nearly eighty percent positive change, while
usefulness and satisfaction reported more than fifty and sixty percent positive change
respectively. Cumulative negative experience was less than ten percent. Overall more than fifty
percent of the field supervisory staff experienced a positive change in 3D/4D model information
category (see Figure 6.6 below).
Figure 6.6: Research Subjects Perception Change Regarding AUSIA of 3D/4D Models Category after Implementation

132
In the materials information category nearly eighty percent of the respondents reported a
positive change in integration area after implementing AUSIA framework, while nearly fifteen
percent of respondents didn’t experience any difference. Satisfaction and automation areas in
materials information category showed nearly seventy percent positive change while
accessibility and usefulness received more than sixty and forty percent positive change
respectively. Cumulative negative experience was around thirty percent. Overall more than forty
percent of the field supervisory staff experienced a positive change in 3D/4D model information
category (see Figure 6.7 below). The reason behind the more negative response was because the
researcher only electronically presented available material information.
Figure 6.7: Research Subjects Perception Change Regarding AUSIA of Materials Category after Implementation

133
In the certifications information category nearly eighty percent of the respondents
reported a positive change in automation area after implementing AUSIA framework, while
nearly twenty percent of respondents didn’t experience any difference. Integration and
accessibility areas in certifications information category imparted nearly seventy & sixty percent
positive change respectively while usefulness and satisfaction received more than twenty and
thirty percent positive change respectively. Cumulative negative experience was less than ten
percent. Overall more than twenty five percent of the field supervisory staff experienced a
positive change in certifications information category (see Figure 6.8 below). Compared to other
categories here more respondents didn’t experience any difference because LEED and other
certifications systems weren’t applicable to the jobsite.
Figure 6.7: Research Subjects Perception Change Regarding AUSIA Certifications Category after Implementation
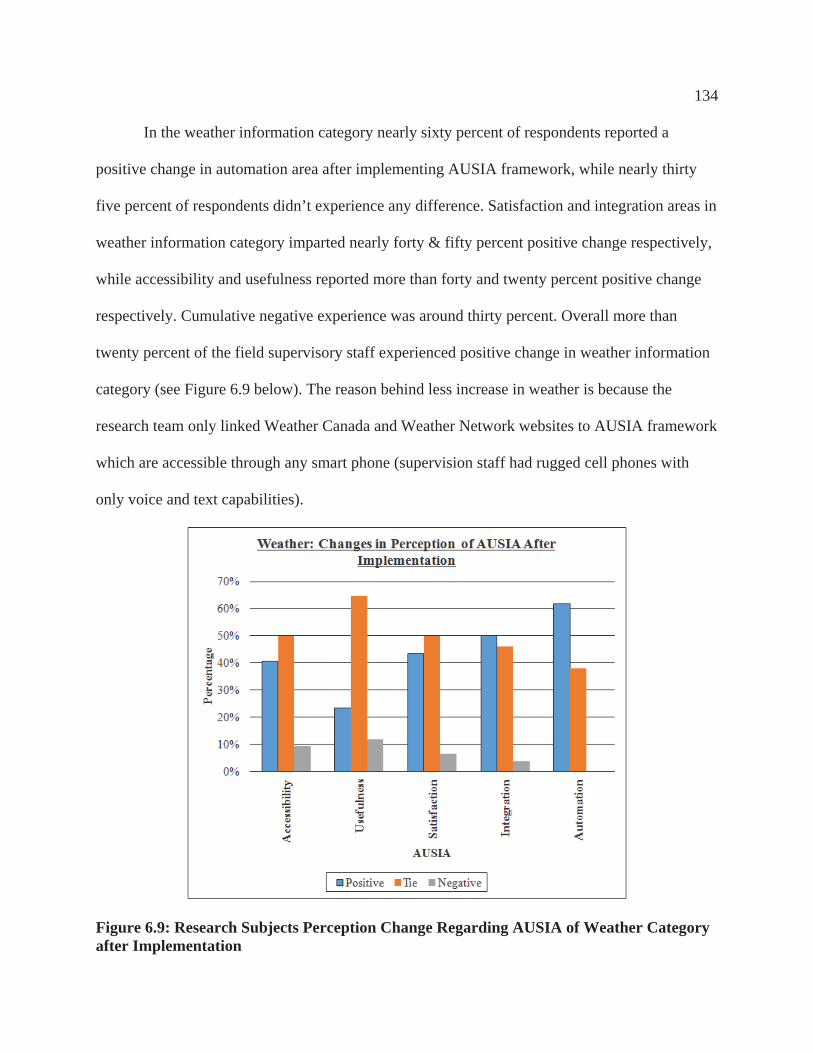
134
In the weather information category nearly sixty percent of respondents reported a
positive change in automation area after implementing AUSIA framework, while nearly thirty
five percent of respondents didn’t experience any difference. Satisfaction and integration areas in
weather information category imparted nearly forty & fifty percent positive change respectively,
while accessibility and usefulness reported more than forty and twenty percent positive change
respectively. Cumulative negative experience was around thirty percent. Overall more than
twenty percent of the field supervisory staff experienced positive change in weather information
category (see Figure 6.9 below). The reason behind less increase in weather is because the
research team only linked Weather Canada and Weather Network websites to AUSIA framework
which are accessible through any smart phone (supervision staff had rugged cell phones with
only voice and text capabilities).
Figure 6.9: Research Subjects Perception Change Regarding AUSIA of Weather Category after Implementation

135
In the technical information category nearly eighty percent of the respondents reported a
positive change in automation area after implementing AUSIA framework, while nearly twenty
percent of the respondents didn’t experience any difference. Accessibility and integration areas
in technical information category imparted nearly sixty percent positive change, while usefulness
and satisfaction received more than thirty and fifty percent positive change respectively.
Cumulative negative experience was less than ten percent. Overall more than thirty five percent
of the field supervisory staff experienced a positive change in technical information category
(see Figure 6.10 below).
Figure 6.10: Research Subjects Perception Change Regarding AUSIA of Technical Category after Implementation

136
The researcher divided the ten information categories into two sub-groups:
Primary Information: Drawings, Changes, Safety, Schedule, and Quality
Secondary Information: 3D/4D Models, Materials, Certification, Weather, and
Technical
Researcher assumed all information categories have equal weights and calculated the
perception change of overall AUSIA for primary and secondary information categories (see
Figure 6.11 below). In both primary and secondary information categories more than fifty
percent of the respondents reported a positive change in accessibility area after implementing
AUSIA framework, while less than five percent of the respondents experienced a negative
change. Automation and integration areas in both information categories imparted more sixty
percent positive change. More respondents haven’t experienced any change in usefulness and
satisfaction areas compared to other areas.
Based on the assumption that all five areas of AUSIA have equal weights, more than
sixty percent of the respondents reported a positive change, while thirty seven percent of the
respondents didn’t experience any difference. Only less than three percent experienced a
negative change.

137
Figure 6.11: Research Subjects Overall Perception Change Regarding AUSIA after Implementation
6.2 Comparing the Site Group with the Online Group
The researcher conducted an online version of the ‘present state of information
management’ survey instrument (Appendix V) to demonstrate that perception on field level
communication of the site sample is similar to that of the general population. The online survey
was distributed to the construction community in Calgary through CCA, and in North America
through FIATECH. The researcher received twenty-four total responses after circulating the
survey several times through the construction community in North America. The summary of
demographic information of survey participants is given below in Figure 6.12 and Figure 6.13.

138
Figure 6.12: Distribution of Research Subjects According to Industry Sector
The majority of participants were from the building construction industry and more than
fifty percent of the participants had more than fifteen years of experience. Participants had both
site and office experience to refer to when commenting on/assessing management practices in
the construction industry. The researcher conducted the Mann-Whitney U Test on both online
and onsite data sets. Reasons for selecting the Mann-Whitney U test instead of an independent T
Test were that both groups’ independent and dependent variables were ordinal, and a majority of
onsite samples were not normally distributed (Conover & Iman, 1981). The following are the
null hypothesis and alternative hypothesis tested.
H0 : Online and on-site groups have similar perceptions on field level communication
HA : Online and on-site groups have different perceptions on field level communication
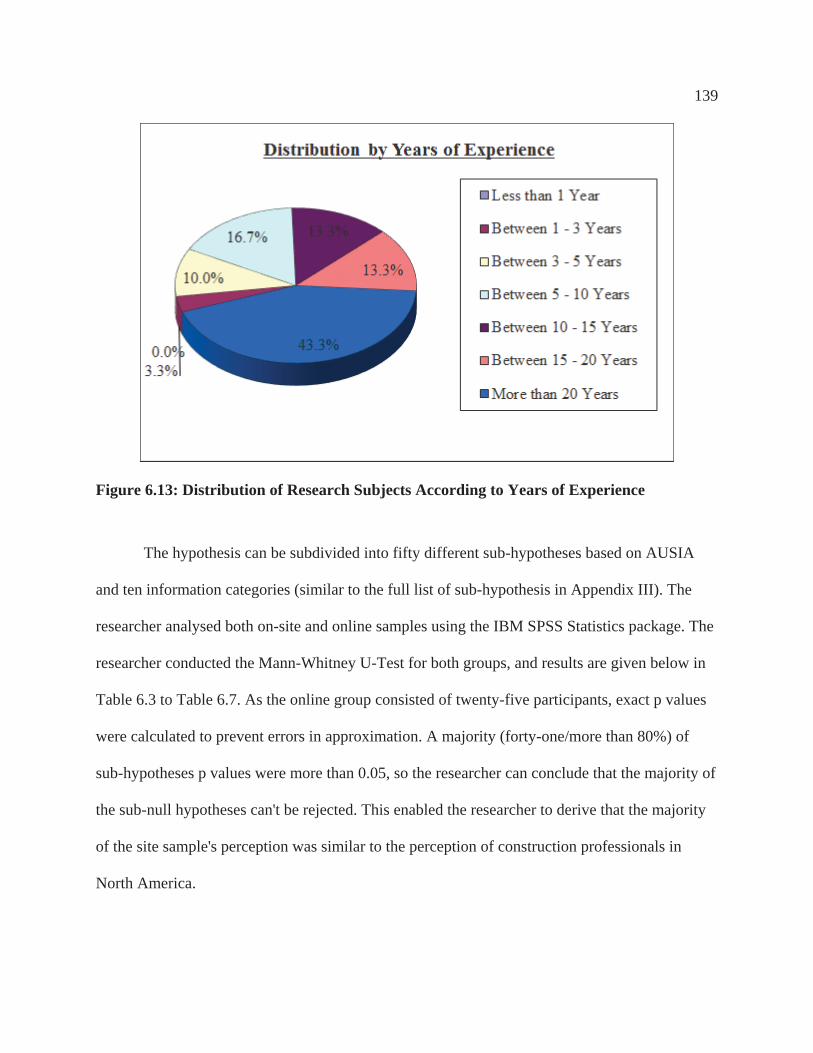
139
Figure 6.13: Distribution of Research Subjects According to Years of Experience
The hypothesis can be subdivided into fifty different sub-hypotheses based on AUSIA
and ten information categories (similar to the full list of sub-hypothesis in Appendix III). The
researcher analysed both on-site and online samples using the IBM SPSS Statistics package. The
researcher conducted the Mann-Whitney U-Test for both groups, and results are given below in
Table 6.3 to Table 6.7. As the online group consisted of twenty-five participants, exact p values
were calculated to prevent errors in approximation. A majority (forty-one/more than 80%) of
sub-hypotheses p values were more than 0.05, so the researcher can conclude that the majority of
the sub-null hypotheses can't be rejected. This enabled the researcher to derive that the majority
of the site sample's perception was similar to the perception of construction professionals in
North America.

140
For an example in the Table 6.3 below, which considers research subjects perception on
drawings and changes, all of the p values were more than 0.05 except in one circumstance
(automation of drawings). From this we can deduce that both the selected online research group
and onsite research subjects have similar perceptions on present level of accessibility,
usefulness, satisfaction and integration of drawings, and accessibility, usefulness, satisfaction,
integration and automation of changes. Similarly Tables 6.4 to 6.7 conclude that other than
accessibility, satisfaction, integration and automation of 3D/4D models, automation of technical
information, and accessibility and usefulness of quality information, both research groups have
similar perceptions on all other categories. This concludes that majority of onsite research
subjects perceptions are comparative to perspective of selected online research subjects.

141
Tab
le 6
.3: M
ann-
Whi
tney
U-T
est S
tatis
tics T
able
for
Dra
win
gs a
nd C
hang
es
Info
rmat
ion
Gro
up
AU
SIA
N
R
ank
Ave
rage
Sum
of
Ran
ks
U
Z
P
Dra
win
gs
On-
site
Acc
essi
bilit
y 41
27
.94
1145
.50
284.
500
-1.3
68
.165
U
sefu
lnes
s 39
26
.72
1042
.00
262.
000
-1.1
94
.261
Sa
tisfa
ctio
n 34
21
.76
740.
00
145.
000
-2.0
66
.053
In
tegr
atio
n 36
23
.42
843.
00
177.
000
-1.7
59
.081
A
utom
atio
n 31
18
.08
560.
50
64.5
00
-2.8
75
.003
Onl
ine
Acc
essi
bilit
y 25
33
.26
565.
50
U
sefu
lnes
s 24
31
.13
498.
00
Sa
tisfa
ctio
n 20
29
.85
388.
00
In
tegr
atio
n 21
30
.86
432.
00
A
utom
atio
n 19
30
.05
300.
50
Cha
nges
On-
site
Acc
essi
bilit
y 42
29
.14
1224
.00
321.
000
.770
.7
26
Use
fuln
ess
39
26.1
9 10
21.5
0 24
1.50
0 .2
59
.313
Sa
tisfa
ctio
n 33
24
.36
804.
00
219.
000
.754
.7
84
Inte
grat
ion
30
22.0
0 66
0.00
19
5.00
0 .1
51
.169
A
utom
atio
n 30
19
.70
591.
00
126.
000
.013
.0
12
Onl
ine
Acc
essi
bilit
y 24
30
.44
487.
00
U
sefu
lnes
s 23
30
.90
463.
50
Sa
tisfa
ctio
n 21
23
.14
324.
00
In
tegr
atio
n 24
27
.53
468.
00
A
utom
atio
n 20
29
.60
444.
00
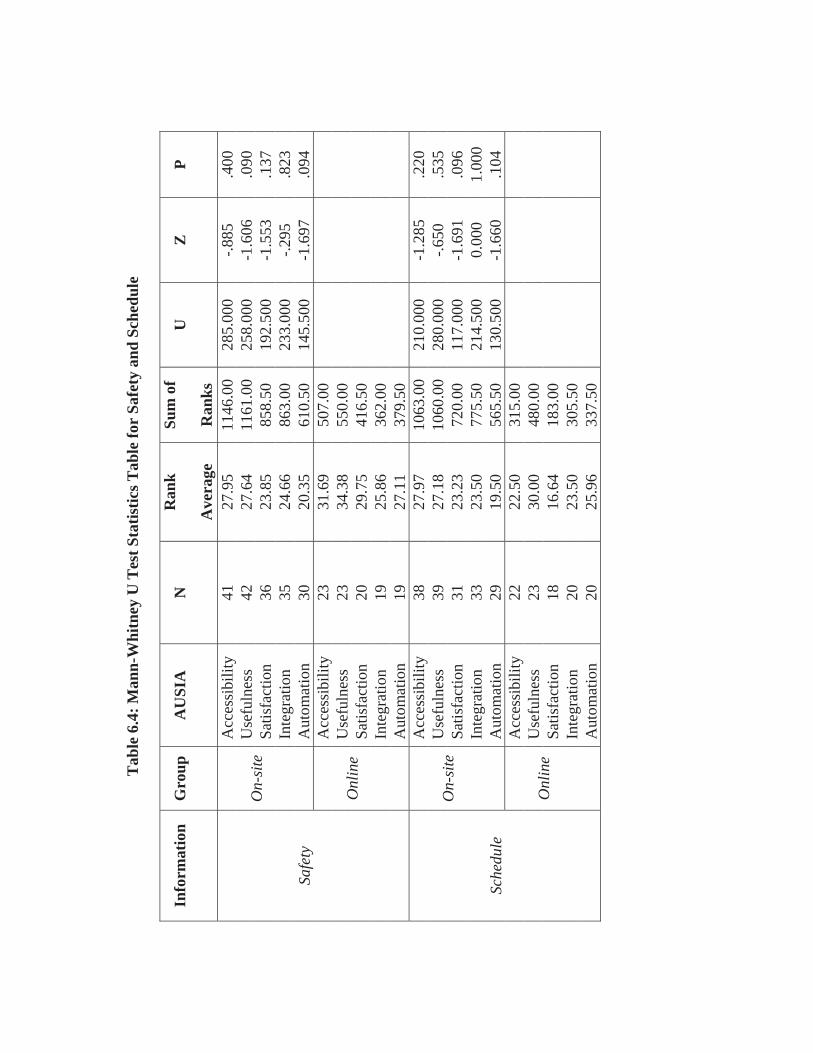
142
Tab
le 6
.4: M
ann-
Whi
tney
U T
est S
tatis
tics T
able
for
Safe
ty a
nd S
ched
ule
Info
rmat
ion
Gro
up
AU
SIA
N
R
ank
Ave
rage
Sum
of
Ran
ks
U
Z
P
Safe
ty
On-
site
Acc
essi
bilit
y 41
27
.95
1146
.00
285.
000
-.885
.4
00
Use
fuln
ess
42
27.6
4 11
61.0
0 25
8.00
0 -1
.606
.0
90
Satis
fact
ion
36
23.8
5 85
8.50
19
2.50
0 -1
.553
.1
37
Inte
grat
ion
35
24.6
6 86
3.00
23
3.00
0 -.2
95
.823
A
utom
atio
n 30
20
.35
610.
50
145.
500
-1.6
97
.094
Onl
ine
Acc
essi
bilit
y 23
31
.69
507.
00
U
sefu
lnes
s 23
34
.38
550.
00
Sa
tisfa
ctio
n 20
29
.75
416.
50
In
tegr
atio
n 19
25
.86
362.
00
A
utom
atio
n 19
27
.11
379.
50
Sche
dule
On-
site
Acc
essi
bilit
y 38
27
.97
1063
.00
210.
000
-1.2
85
.220
U
sefu
lnes
s 39
27
.18
1060
.00
280.
000
-.650
.5
35
Satis
fact
ion
31
23.2
3 72
0.00
11
7.00
0 -1
.691
.0
96
Inte
grat
ion
33
23.5
0 77
5.50
21
4.50
0 0.
000
1.00
0 A
utom
atio
n 29
19
.50
565.
50
130.
500
-1.6
60
.104
Onl
ine
Acc
essi
bilit
y 22
22
.50
315.
00
U
sefu
lnes
s 23
30
.00
480.
00
Sa
tisfa
ctio
n 18
16
.64
183.
00
In
tegr
atio
n 20
23
.50
305.
50
A
utom
atio
n 20
25
.96
337.
50

143
Tab
le 6
.5: M
ann-
Whi
tney
U T
est S
tatis
tics T
able
for
Mat
eria
l and
3D
/4D
Mod
els
Info
rmat
ion
Gro
up
AU
SIA
N
R
ank
Ave
rage
Sum
of
Ran
ks
U
Z
P
Mat
eria
l
On-
site
Acc
essi
bilit
y 32
22
.00
704.
00
176.
000
-1.8
69
.065
U
sefu
lnes
s 30
22
.27
668.
00
203.
000
-1.2
66
.215
Sa
tisfa
ctio
n 29
21
.16
613.
50
178.
500
-1.0
29
.314
In
tegr
atio
n 29
20
.91
606.
50
171.
500
-.864
.3
99
Aut
omat
ion
26
17.9
4 46
6.50
11
5.50
0 -1
.650
.1
13
Onl
ine
Acc
essi
bilit
y 22
29
.50
472.
00
U
sefu
lnes
s 24
27
.06
460.
00
Sa
tisfa
ctio
n 21
25
.10
376.
50
In
tegr
atio
n 21
24
.25
339.
50
A
utom
atio
n 18
24
.12
313.
50
3D/4
D M
odel
s
On-
site
Acc
essi
bilit
y 23
15
.22
350.
00
74.0
00
-2.0
24
.049
U
sefu
lnes
s 28
18
.27
511.
50
105.
500
-1.9
40
.057
Sa
tisfa
ctio
n 23
14
.35
330.
00
54.0
00
-2.1
54
.030
In
tegr
atio
n 25
15
.28
382.
00
57.0
00
-2.2
44
.026
A
utom
atio
n 23
14
.63
336.
50
60.5
00
-2.2
06
.028
Onl
ine
Acc
essi
bilit
y 16
22
.27
245.
00
U
sefu
lnes
s 19
25
.71
308.
50
Sa
tisfa
ctio
n 15
22
.00
198.
00
In
tegr
atio
n 13
23
.67
213.
00
A
utom
atio
n 15
22
.45
224.
50
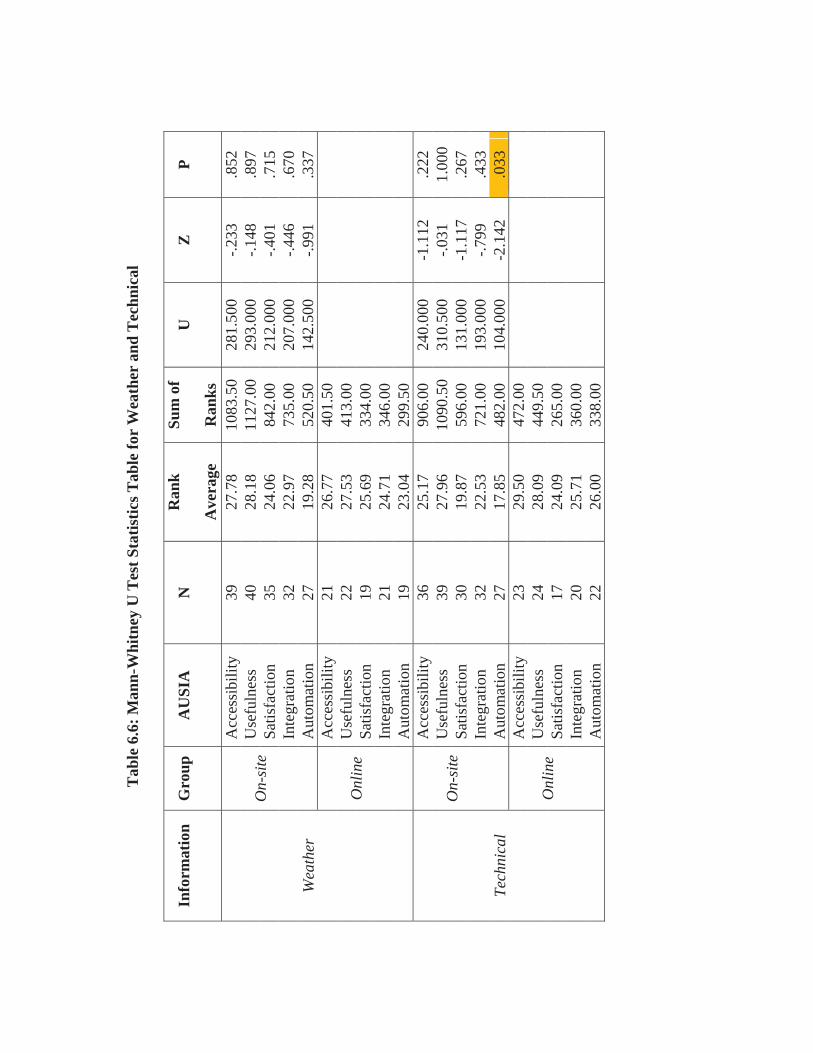
144
Tab
le 6
.6: M
ann-
Whi
tney
U T
est S
tatis
tics T
able
for
Wea
ther
and
Tec
hnic
al
Info
rmat
ion
Gro
up
AU
SIA
N
R
ank
Ave
rage
Sum
of
Ran
ks
U
Z
P
Wea
ther
On-
site
Acc
essi
bilit
y 39
27
.78
1083
.50
281.
500
-.233
.8
52
Use
fuln
ess
40
28.1
8 11
27.0
0 29
3.00
0 -.1
48
.897
Sa
tisfa
ctio
n 35
24
.06
842.
00
212.
000
-.401
.7
15
Inte
grat
ion
32
22.9
7 73
5.00
20
7.00
0 -.4
46
.670
A
utom
atio
n 27
19
.28
520.
50
142.
500
-.991
.3
37
Onl
ine
Acc
essi
bilit
y 21
26
.77
401.
50
U
sefu
lnes
s 22
27
.53
413.
00
Sa
tisfa
ctio
n 19
25
.69
334.
00
In
tegr
atio
n 21
24
.71
346.
00
A
utom
atio
n 19
23
.04
299.
50
Tech
nica
l
On-
site
Acc
essi
bilit
y 36
25
.17
906.
00
240.
000
-1.1
12
.222
U
sefu
lnes
s 39
27
.96
1090
.50
310.
500
-.031
1.
000
Satis
fact
ion
30
19.8
7 59
6.00
13
1.00
0 -1
.117
.2
67
Inte
grat
ion
32
22.5
3 72
1.00
19
3.00
0 -.7
99
.433
A
utom
atio
n 27
17
.85
482.
00
104.
000
-2.1
42
.033
Onl
ine
Acc
essi
bilit
y 23
29
.50
472.
00
U
sefu
lnes
s 24
28
.09
449.
50
Sa
tisfa
ctio
n 17
24
.09
265.
00
In
tegr
atio
n 20
25
.71
360.
00
A
utom
atio
n 22
26
.00
338.
00

145
Tab
le 6
.7: M
ann-
Whi
tney
U T
est S
tatis
tics T
able
for
Qua
lity
and
Cer
tific
atio
ns
Info
rmat
ion
Gro
up
AU
SIA
N
R
ank
Ave
rage
Sum
of
Ran
ks
U
Z
P
Qua
lity
On-
site
Acc
essi
bilit
y 35
23
.59
825.
50
195.
500
-2.0
97
.030
U
sefu
lnes
s 39
24
.59
959.
00
179.
000
-2.8
21
.004
Sa
tisfa
ctio
n 31
21
.74
674.
00
178.
000
-1.1
44
.273
In
tegr
atio
n 31
20
.77
644.
00
148.
000
-1.0
88
.304
A
utom
atio
n 25
17
.94
448.
50
123.
500
-1.5
60
.124
Onl
ine
Acc
essi
bilit
y 24
31
.28
500.
50
U
sefu
lnes
s 24
36
.31
581.
00
Sa
tisfa
ctio
n 22
25
.79
361.
00
In
tegr
atio
n 19
25
.17
302.
00
A
utom
atio
n 20
23
.68
331.
50
Cer
tific
atio
ns
On-
site
Acc
essi
bilit
y 20
15
.03
300.
50
89.5
00
-.026
1.
000
Use
fuln
ess
20
15.5
0 31
0.00
80
.000
-.5
43
.626
Sa
tisfa
ctio
n 16
11
.44
183.
00
47.0
00
-.649
.5
73
Inte
grat
ion
17
12.3
2 20
9.50
45
.500
-.4
05
.677
A
utom
atio
n 12
9.
83
118.
00
40.0
00
-.654
.5
32
Onl
ine
Acc
essi
bilit
y 12
14
.94
134.
50
U
sefu
lnes
s 12
13
.89
125.
00
Sa
tisfa
ctio
n 10
13
.29
93.0
0
Inte
grat
ion
09
11.0
8 66
.50
A
utom
atio
n 11
11
.50
92.0
0

146
6.3 Conclusion
Non-parametric statistical analysis and qualitative analysis of research data were
conducted to ensure that the benefits of the AUSIA framework were calculated properly. As
explained above, the majority of the on-site data set did not satisfy the normality assumption, so
hypothesis testing was conducted using non-parametric tests. The researcher established that the
AUSIA framework has a positive impact on communication through hypothesis testing and then
used qualitative analysis to quantify the actual perception change of research subjects. Analysis
revealed that in the primary information category (other than safety) research subjects perception
of integration and automation categories have changed positively by seventy and eighty percent
respectively. In the 3D and 4D models category research subject’s perception of accessibility
has changed positively by more than eighty percent, while their perception of automation and
integration of these models have increased by eighty and eighty two percent respectively. The
analysis concluded that the implementation of AUSIA framework has increased research
subject's overall perception of communication at the operational level by around sixty percent.
The other challenge was to ensure that the selected TTC complex was not an anomaly,
because the impact of the framework depends on the perception of field staff. The researcher
conducted an online survey through CCA and FIATECH to make sure the perspective of site
staff and the perspective of other selected construction professionals from FIATECH and CCA
are similar. Hypothesis testing revealed the majority of the on-site sample’s perspectives are
similar to the selected online sample's viewpoint.
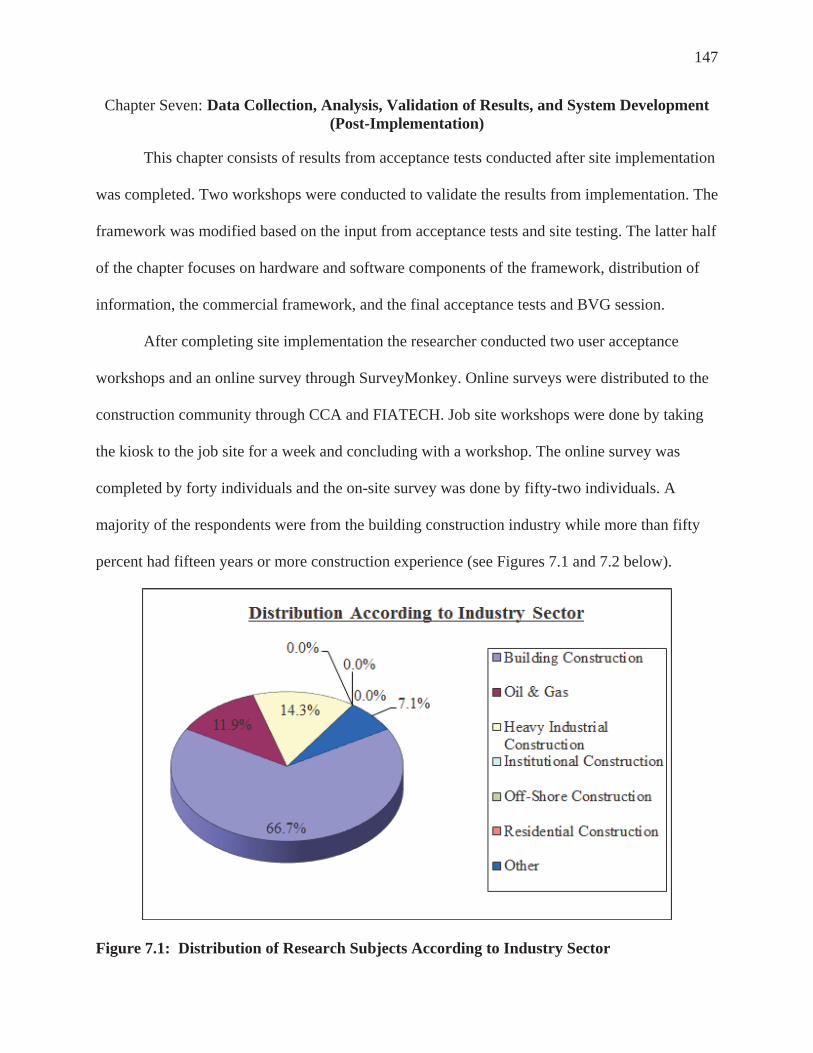
147
Chapter Seven: Data Collection, Analysis, Validation of Results, and System Development (Post-Implementation)
This chapter consists of results from acceptance tests conducted after site implementation
was completed. Two workshops were conducted to validate the results from implementation. The
framework was modified based on the input from acceptance tests and site testing. The latter half
of the chapter focuses on hardware and software components of the framework, distribution of
information, the commercial framework, and the final acceptance tests and BVG session.
After completing site implementation the researcher conducted two user acceptance
workshops and an online survey through SurveyMonkey. Online surveys were distributed to the
construction community through CCA and FIATECH. Job site workshops were done by taking
the kiosk to the job site for a week and concluding with a workshop. The online survey was
completed by forty individuals and the on-site survey was done by fifty-two individuals. A
majority of the respondents were from the building construction industry while more than fifty
percent had fifteen years or more construction experience (see Figures 7.1 and 7.2 below).
Figure 7.1: Distribution of Research Subjects According to Industry Sector

148
Figure 7.2: Distribution of Research Subjects According to Years of Experience
Participants were also questioned about their previous awareness of the AUSIA
framework or i-Booth. Nearly eighty-five percent of on-line participants had heard about the
system before and more than fifty percent of the on-site participants had also heard about the
system (see Figure 7.3 below). This was done to ensure that most of the participants were aware
about the AUSIA framework (second generation i-Booth) before proceeding with the survey
instrument.
Figure 7.3: Participants Awareness of i-Booth

149
7.1 User Acceptance of AUSIA Framework
The researcher provided on-site research subjects the opportunity to try the system
beforehand. The online community was given a description and a picture of the system to find
out their willingness to utilize the system. All of the on-site participants were willing to utilize
the system, while over eighty percent of the online community was willing to deploy the system
in their job site or organization (see Figure 7.4 below).
Figure 7.4: Participants Willingness to Deploy i-Booth
Research participants were asked to provide input on the ideal location to keep the i-
Booth to maximize the usage and benefits. A majority of the online community wanted to keep it
on the work site while a majority of the on-site community wanted to keep it in the site office for
security reasons (see Figure 7.5 below).
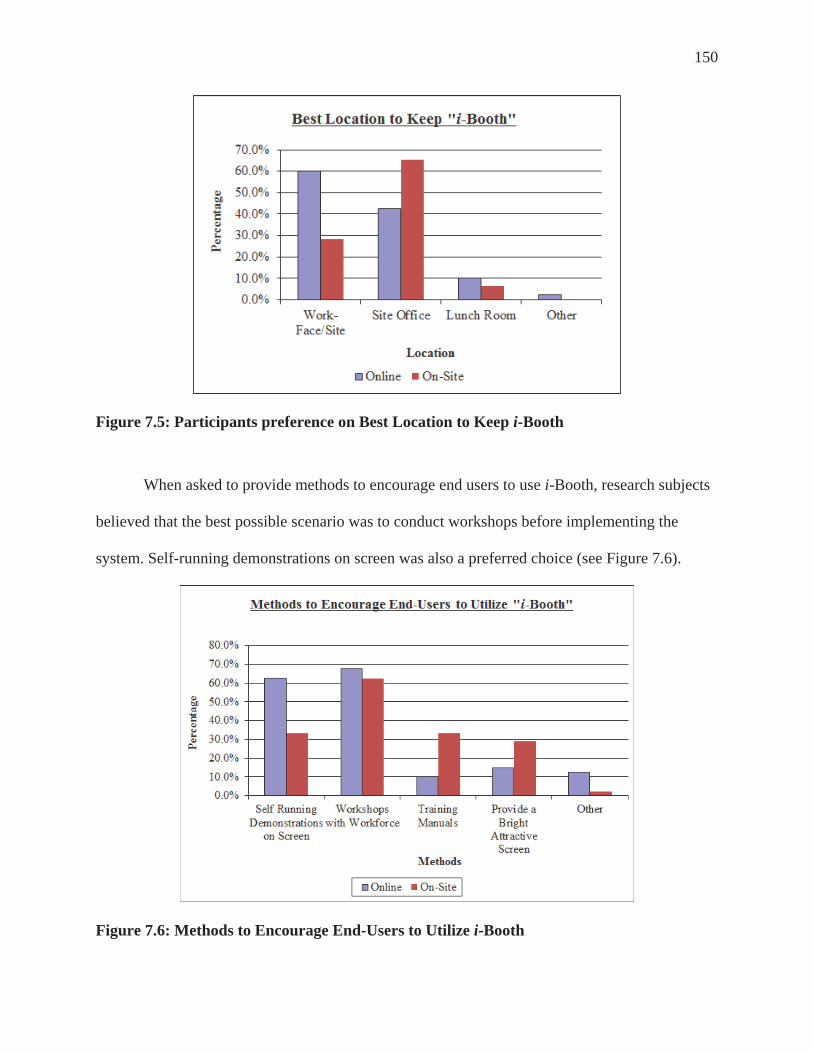
150
Figure 7.5: Participants preference on Best Location to Keep i-Booth
When asked to provide methods to encourage end users to use i-Booth, research subjects
believed that the best possible scenario was to conduct workshops before implementing the
system. Self-running demonstrations on screen was also a preferred choice (see Figure 7.6).
Figure 7.6: Methods to Encourage End-Users to Utilize i-Booth

151
Research subjects were asked to select their preferred method for access control of the
system in the field (access to i-Booth). Two options given were free access to all or limited
access (only foremen and up in the organization having access to the kiosk). The reason for this
was that general contractors were concerned that the workers might concentrate more on the
information given rather than on the work at hand. A majority of the research subjects preferred
limited access while a minority proposed a hybrid solution, namely to allow workers to have free
access to limited portions of the system, mainly work assignments, safety (emergency response
plan), and weather information (see Figure 7.7 below).
Figure 7.7: Participants Preference of Access Control
The most popular choice for access control methods was a traditional user name and
password, while an access card was the second best choice (see Figure 7.8). Research subjects
were not that comfortable with a biometric scan and retinal scan for privacy reasons.
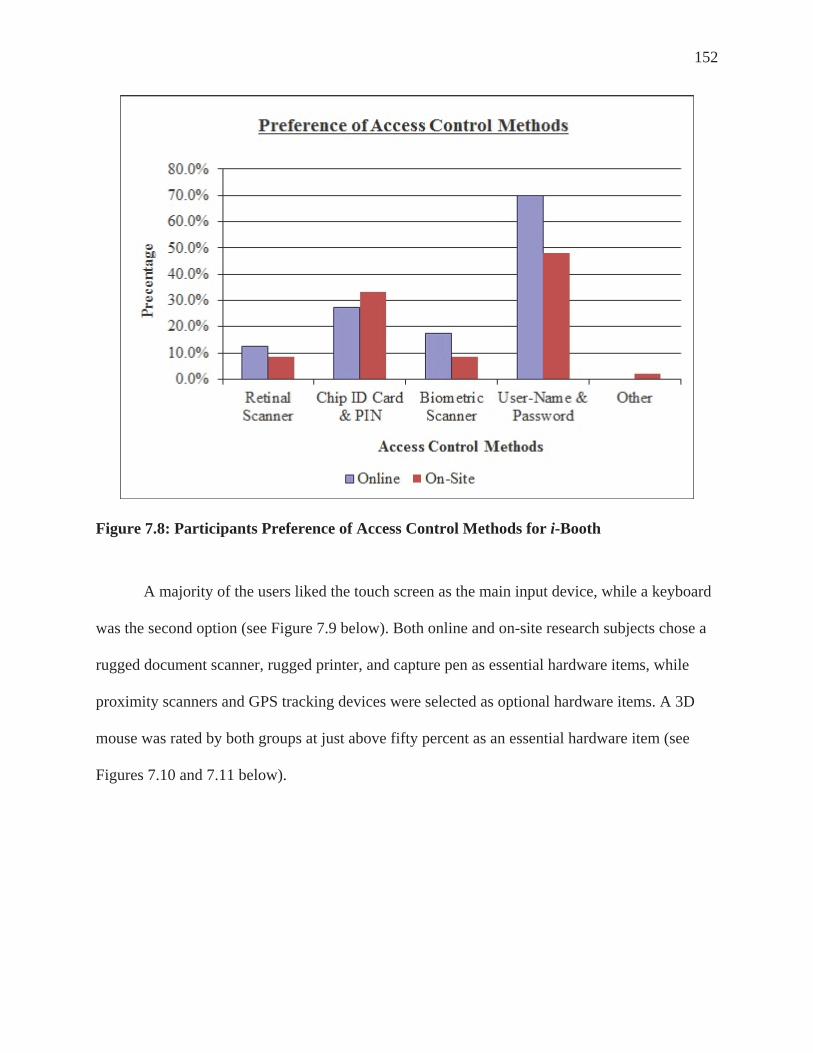
152
Figure 7.8: Participants Preference of Access Control Methods for i-Booth
A majority of the users liked the touch screen as the main input device, while a keyboard
was the second option (see Figure 7.9 below). Both online and on-site research subjects chose a
rugged document scanner, rugged printer, and capture pen as essential hardware items, while
proximity scanners and GPS tracking devices were selected as optional hardware items. A 3D
mouse was rated by both groups at just above fifty percent as an essential hardware item (see
Figures 7.10 and 7.11 below).

153
Figu
re 7
.9: U
ser
Rat
ings
on
Val
ue A
dditi
on fr
om In
put D
evic
es

154
Figure 7.10: Categorization of Essential and Optional Hardware Items According to Online Participants Preference
Figure 7.11: Categorization of Essential and Optional Hardware Items According to On-Site Participants Preference

155
Research subjects were also asked to comment on value addition from each hardware
item. More than ninety percent of the online community believed a rugged printer would bring
good value addition to the kiosk. In the online community more than sixty percent believed other
hardware items such as a 3D mouse, rugged document scanner, and capture pen would bring
good value addition to the kiosk. Only fifty percent of the online community believed a
proximity scanner and GPS tracking device would add value to the kiosk (see Figure 7.12
below).
Figure 7.12: Online Participants Perception on Value Addition from Input Devices
A majority (more than eighty percent) of the on-site community believed a rugged
document scanner, rugged printer, and capture pen would add value to the kiosk. A GPS tracking
device and a proximity scanner came next in value addition (more than sixty percent). A 3D

156
mouse was last in value addition (less than fifty percent) from the on-site community (see Figure
7.13 below).
Figure 7.13: On-Site Participants Perception on Value Addition from Input Devices
7.2 Validation of Site Implementation Results
The latter part of the instrument focused on the areas that the AUSIA framework has an
impact on. This was asked to validate the findings from field implementation. Both communities
believed that the system has a very positive impact on information integration, quality, and BIM
integration with the field level. All research subjects believed that all other categories have more
than seventy percent positive impact (see Figures 7.14 and 7.15) on the construction industry.
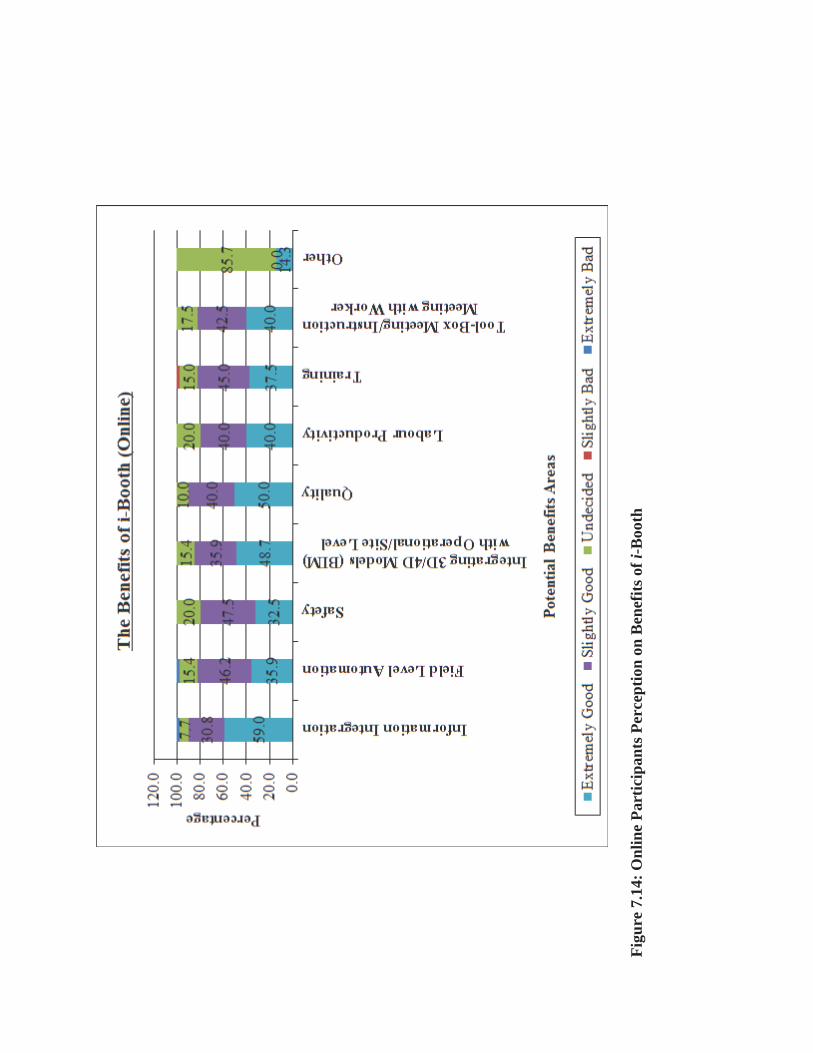
157
Figu
re 7
.14:
Onl
ine
Part
icip
ants
Per
cept
ion
on B
enef
its o
f i-B
ooth
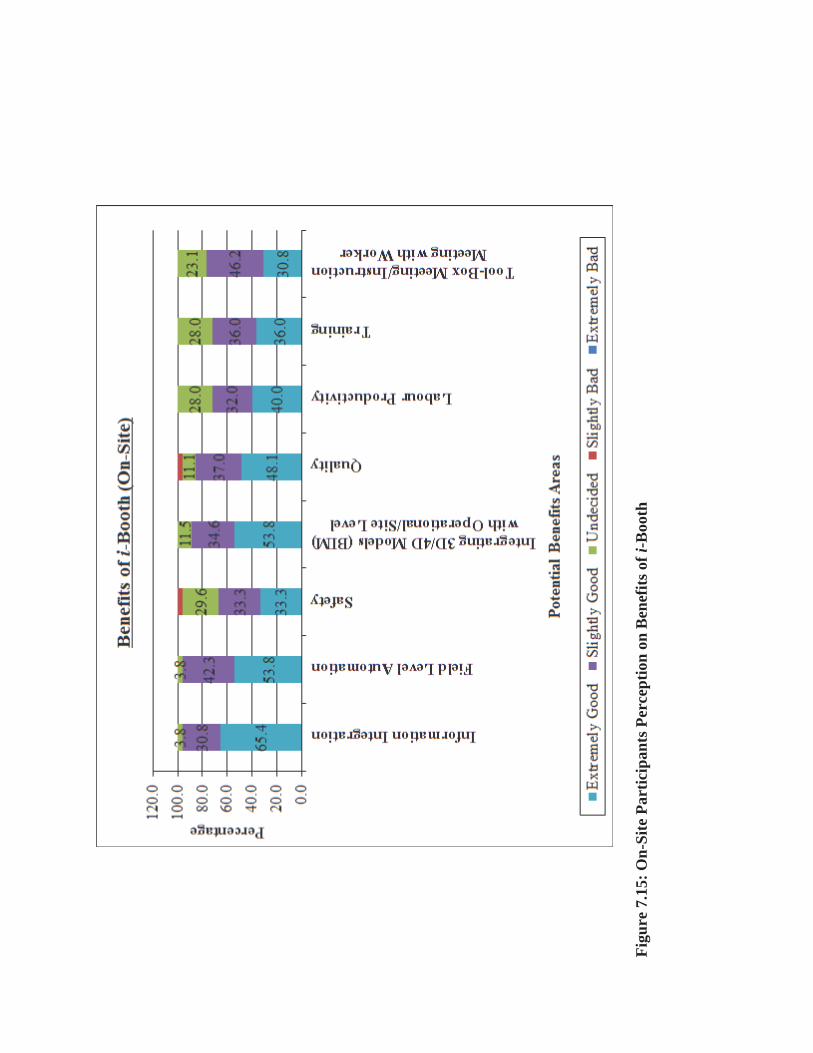
158
Figu
re 7
.15:
On-
Site
Par
ticip
ants
Per
cept
ion
on B
enef
its o
f i-B
ooth

159
7.3 Modified AUSIA Framework (Second Generation i-Booth)
The research team developed a new, totally integrated solution to improve
efficiency and effectiveness of information management in the construction industry
based on the feedback from site implementation and workshops.
The conceptual framework of the second generation i-Booth consists of the job
site end and the office end. This framework is designed as a distributed computer system.
The AUSIA framework has a server to communicate between the various information
systems of the general contractor, engineer, and architect. Construction personnel have
direct access to the system through a web portal. Depending on roles and responsibilities,
users have read-only or read-write access to the system. Field personnel are equipped
with handheld devices and the construction site is equipped with one or more mobile and
wall-mounted kiosk units. The general contractor can decide the number of kiosk units
needed based on the number of workers on the job site, the nature of the construction, and
financial capability. BIM models are integrated with the framework through the kiosk
and handheld devices on the work site, while in the field office BIM is integrated through
virtual reality and augmented reality. The research team is developing another concept
called a digital plan room, which is explained in the final chapters.

160
Figu
re 7
.16:
Con
cept
ual A
USI
A F
ram
ewor
k (S
econ
d G
ener
atio
n i-B
ooth
)
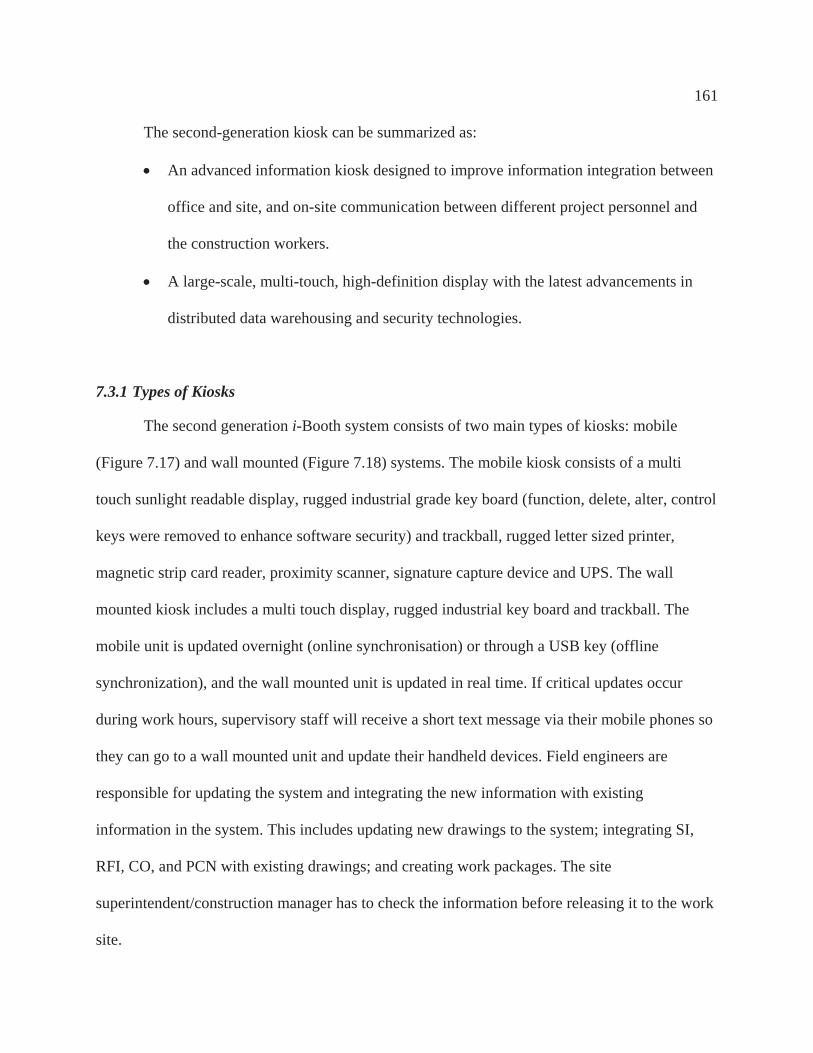
161
The second-generation kiosk can be summarized as:
An advanced information kiosk designed to improve information integration between
office and site, and on-site communication between different project personnel and
the construction workers.
A large-scale, multi-touch, high-definition display with the latest advancements in
distributed data warehousing and security technologies.
7.3.1 Types of Kiosks
The second generation i-Booth system consists of two main types of kiosks: mobile
(Figure 7.17) and wall mounted (Figure 7.18) systems. The mobile kiosk consists of a multi
touch sunlight readable display, rugged industrial grade key board (function, delete, alter, control
keys were removed to enhance software security) and trackball, rugged letter sized printer,
magnetic strip card reader, proximity scanner, signature capture device and UPS. The wall
mounted kiosk includes a multi touch display, rugged industrial key board and trackball. The
mobile unit is updated overnight (online synchronisation) or through a USB key (offline
synchronization), and the wall mounted unit is updated in real time. If critical updates occur
during work hours, supervisory staff will receive a short text message via their mobile phones so
they can go to a wall mounted unit and update their handheld devices. Field engineers are
responsible for updating the system and integrating the new information with existing
information in the system. This includes updating new drawings to the system; integrating SI,
RFI, CO, and PCN with existing drawings; and creating work packages. The site
superintendent/construction manager has to check the information before releasing it to the work
site.

162
Figure 7.17: Mobile Kiosk
Figure 7.18: Wall-mounted Kiosk

163
7.3.2 Hardware Components for the Kiosk
The researcher identified key hardware components during the site implementation.
These key components for smooth operation are the touch screen, keyboard, and track ball. Other
components identified are ruggedized printer, capture pen, BIM mouse, document scanner and
GPS tracking device. Only a selected number of hardware components were integrated with the
kiosk, but all other mentioned hardware components can be incorporated to the system.
7.3.2.1 Touch Screen
The touch screen is the most important hardware item of the kiosk. The minimum size of
the recommended screen is thirty-two inches. The important features associated with the screen
are sunlight readability, dust resistance, and cold weather resistance.
7.3.2.2 Key Board & Track Ball
The keyboard and mouse are washable and fully sealed industrial grade items. The
researcher used a track ball with left and right mouse buttons because during pilot testing some
problems were encountered when using a wired or wireless standard mouse. These problems
were:
connectivity issues between wireless mouse and the kiosk
due to dust and harsh nature of construction, wireless and wired mouses don't last
long
the ease of use heavily depends on the mouse pad but due to the rugged nature of
construction it's hard to keep a mouse pad in good condition

164
The researcher identified several other hardware components to make the
implementation process easier for field level and management level personnel. These
components are ruggedized printer, capture pen, BIM 3D mouse, document scanner, and GPS
tracking device.
7.3.2.3 Ruggedized Printer
This rugged 10 x 17 letter sized printer enables users to make printouts of
the information they need at field level.
7.3.2.4 Capture Pen
The capture pen is a new device that helps the field level to integrate
with the kiosk system without much difficulty. This capture pen works as a normal pen at field
level and management personnel can do the mark-ups and form filling in regular hardcopy
printouts, and later can synchronise with the computer to digitize these. This costs approximately
one thousand CAD per pen and a general contractor needs only a four-colour laser printer. This
enables the field level to do their work in a normal manner without using a computer, and later
on convert the data into soft data to share with others. This is a very good solution for
information integration (integrating RFI, SI, and CR to drawings and doing mark-ups in
drawings). This can reduce the need to maintain two separate hardcopy drawing sets in the field
office and management office. Later on these can be easily integrated with the kiosk system after
some modifications.

165
7.3.2.5 BIM 3D Mouse
The BIM 3D mouse is a specially designed mouse that can be used for BIM
model navigation. This makes it very easy for the field level personnel to navigate
the model without learning the software. This is a very good investment for
contractors because by making tasks easier for field level personnel, they will use BIM more and
that will increase the return on investment.
7.3.2.6 Document Scanner
The industrial document scanner increases two-way communications between
the field level and management. All day-to-day forms and other documents filled
by field level personnel can be scanned quickly and sent to upper management
easily. This allows site personnel with limited ability with computers to adapt to the system
quickly.
7.3.2.7 GPS Tracking Device
A GPS tracking device can be installed in the kiosk system to find the location of the
kiosk in the case of theft. The construction site should be geofenced. If the kiosk is moved from
the site, management will receive a short text and they can monitor movement of the unit online.
This will only cost thirty to forty CAD per month, which is worthwhile considering the capital
cost of the kiosk.
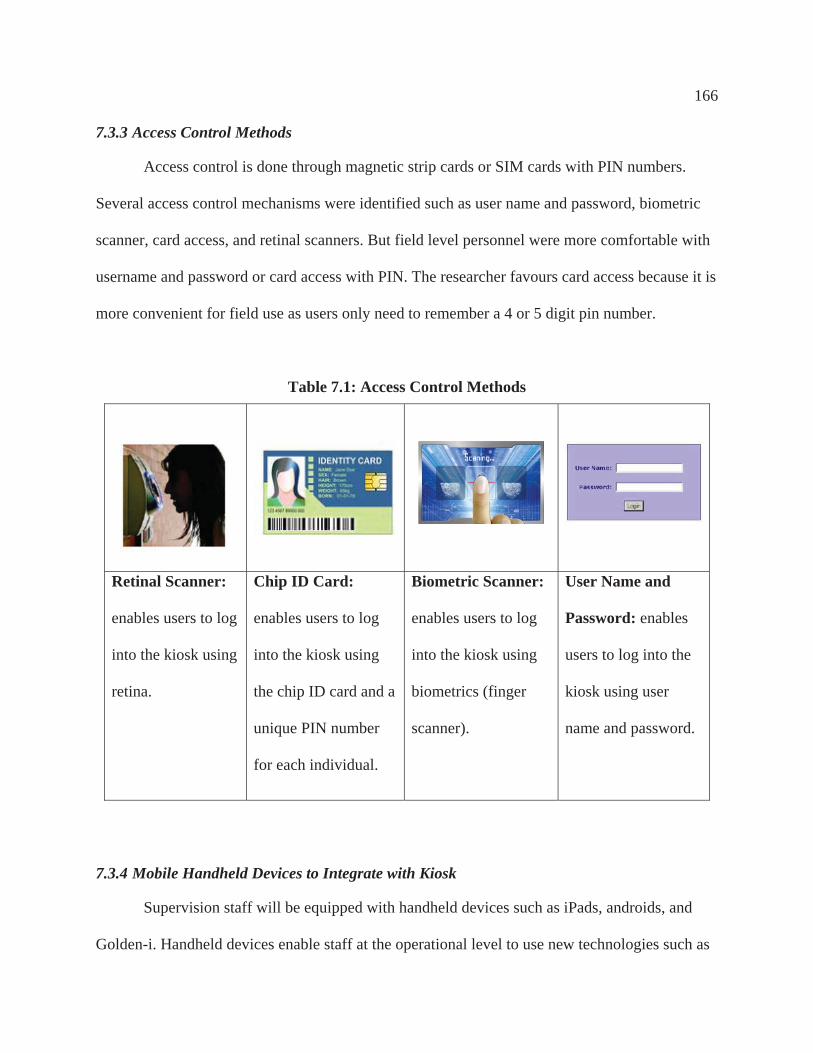
166
7.3.3 Access Control Methods
Access control is done through magnetic strip cards or SIM cards with PIN numbers.
Several access control mechanisms were identified such as user name and password, biometric
scanner, card access, and retinal scanners. But field level personnel were more comfortable with
username and password or card access with PIN. The researcher favours card access because it is
more convenient for field use as users only need to remember a 4 or 5 digit pin number.
Table 7.1: Access Control Methods
Retinal Scanner:
enables users to log
into the kiosk using
retina.
Chip ID Card:
enables users to log
into the kiosk using
the chip ID card and a
unique PIN number
for each individual.
Biometric Scanner:
enables users to log
into the kiosk using
biometrics (finger
scanner).
User Name and
Password: enables
users to log into the
kiosk using user
name and password.
7.3.4 Mobile Handheld Devices to Integrate with Kiosk
Supervision staff will be equipped with handheld devices such as iPads, androids, and
Golden-i. Handheld devices enable staff at the operational level to use new technologies such as

167
Quick Reference (QR) codes for Material Safety Data Sheet (MSDS), playing training videos,
and to display messages/photos and company contact details.
Table 7.2: Handheld Devices
Rugged Handheld:
enables users to
access certain
information from the
kiosk. This also
increases the two-way
communication
between site and
office.
Golden-i: enables
users to access the
kiosk through this
device via Bluetooth
(users can view a 15”
monitor through the
eye piece). This helps
end users to access
information while on
site without going to
the kiosk.
Androids: enables
users to access some
information through
an android. This
helps end users to
access the
information while on
site without going to
the kiosk.
iPad: enables users to
access some
information through an
iPad. This helps end
users to access
information while on
site without going to
the kiosk.

168
7.3.5 Software Components for the Kiosk
There are a few key software items that the researcher has identified as essential for
smooth operation of the kiosk. These are a PDF editor and viewer, BIM viewer, and Design Web
Format (DWF) and DWG (DraWinG) viewers. All these software components are included in
both types of kiosks. Other types of software can also be included as required without any
restrictions.
7.3.5.1 PDF Editor and Viewer
The researcher used a Professional PDF editor and viewer to integrate various
sources of information into one source. Drawings were integrated mainly
through PDF. Drawings were integrated with SI, RFI, CR, and other related
drawings. Examples:
Mechanical drawing of the lift-core was integrated with related structural drawings,
architectural drawings, electrical drawings, and changes (RFI, SI and CR).
Architectural drawings were integrated with cross sections, levels, and details.
Integrated relevant concrete spec sections were integrated with structural concrete
drawings.
The researcher secured the PDF file with a password after integration was completed.
Figure 7.19 below represents the integration of a structural drawing with a site
instruction.

169
Figure 7.19: Level 3 Concrete Beam Schedule Integrated with Site Instructions
3D models and BIM models are integrated with the field level through a 3D interactive
PDF model. Interactive 3D PDFs are easy to operate by field supervision staff for several
reasons:
No infrastructure is needed to view models through the kiosk (only Adobe Acrobat
Reader)
Models can be easily secured through PDF
Plug-ins to convert BIM models to PDF are inexpensive compared to BIM software
Field supervisory staff only need limited training to operate 3D PDF models
Field supervisory staff has the ability to check dimensions and identify elements just
by clicking on the elements.
Figure 7.20 below shows a sample 3D PDF.

170
Figure 7.20: 3D Interactive PDF Model (Adobe, 2013)
7.3.5.2 BIM Viewer/Autodesk Navisworks Freedom
The researcher utilized freely available Autodesk Navisworks Freedom software (BIM
viewer) to access BIM models through the kiosk. The BIM viewer enables users to interact with
the model while providing security needed by engineers to prevent users from editing the model.
This viewer is highly intuitive and easily accessible through the touch screen. This allows
workers who are not comfortable with the keyboard and mouse to utilize models through the
touch screen with ease.
7.3.5.3 DWF and DWG Viewers
Autodesk DWF and DWG file viewers were used in the second generation i-Booth to
access 2D CAD drawings. These 2D drawings were used as an alternative to PDF files. The
CAD file format was integrated with the system at the request of the foremen. They mentioned
that they can access missing information and interact with the CAD file format more easily than

171
with PDFs. At present the construction industry integrates with Bluebeam software (Bluebeam,
2013), which enables users to interact with 2D drawings similar to CAD files. However there are
some issues with accuracy of the measurements, whereas measurements are exact with CAD
files.
7.3.6 Information Arrangement in The System
In the second generation i-Booth the researcher and software development team decided
to enable faceted browsing in the system rather than the hierarchical browsing used in first
generation i-Booth. Faceted browsing or faceted navigation is a technique for accessing
information organized according to a faceted classification system. A faceted classification
system allows assignment of multiple characteristics to an object. This enables users to apply
multiple filters in a search. The information in the system was categorized based on the
classifications in the following sections to enable faceted browsing. These classifications were
developed during a two day workshop with construction industry professionals. The
classifications given below were developed for a four-storey building project at the University of
Calgary. These classifications can be customized to suit the client’s needs and the project
requirements.
7.3.6.1 Design Drawings
Design drawings were classified based on five different criteria:
Type-drawings were classified into eight subtypes (Figure 7.21) based on the
discipline.
Location: This depends on project type and nature of the construction. As mentioned
above, the subtypes given below were developed for a four-storey building project

172
but if this was for a bridge project these subtypes would change to
substructure/foundation, pillars, deck, and abutments.
View: This was developed based on the views in 2D IFC drawings.
Element: Element sections will differ based on the selection of the eight ‘types’
mentioned above. The elements given below are structural elements.
Stage: Depends on the stage of the project.
Figure 7.21: Classification of Design Drawings
7.3.6.2 Shop Drawings
Shop drawing classification consists of three subtypes:
Master format: This was based on 2011 Master Format (CSI, 2013).
Trade: Depends on the job function.
Location: This depends on project type and nature of the construction.
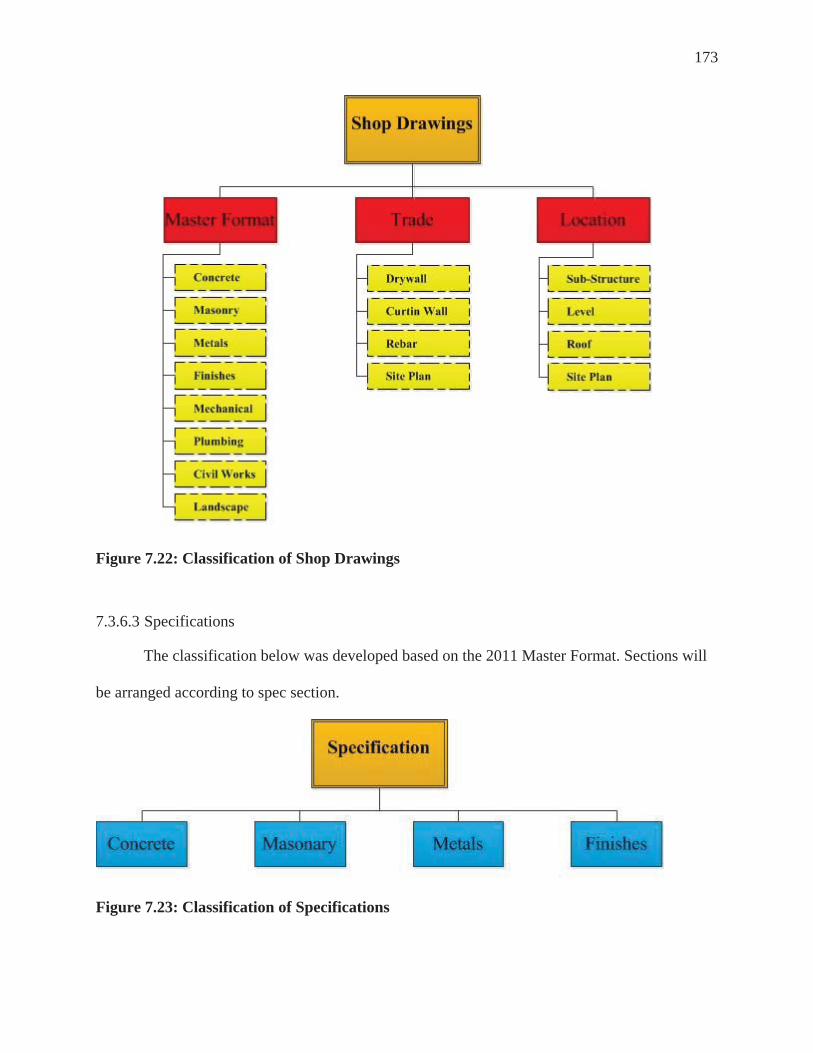
173
Figure 7.22: Classification of Shop Drawings
7.3.6.3 Specifications
The classification below was developed based on the 2011 Master Format. Sections will
be arranged according to spec section.
Figure 7.23: Classification of Specifications

174
7.3.6.4 Quality
This classification consists of four main subtypes:
Check list: This consists of all the check lists related to quality.
Quality plan: This is divided into two main categories, namely subcontractor and
general contractor.
Deficiency list
Other: Can include anything related to quality other than items mentioned above.
Figure 7.24: Classification of Quality
7.4 Distribution Matrix
Distribution of information in the AUSIA framework is based on a distribution matrix or
a distribution list. This matrix is based on the site organization structure. One of the major
concerns of research participants and other workshop participants was the need to ensure the
accuracy of the information in the AUSIA framework. The researcher decided to introduce the
distribution matrix concept to resolve the accuracy issues. Accuracy of information will be
checked by individuals appointed by the general contractor. These individuals (one or more) are

175
appointed based on the trade, and they have the authority to approve or reject the information in
the AUSIA framework. Supervisory staff members below the grade of the responsible authority
will not have access to information until approval is given. This ensures the accuracy of the
information before its release to the operational level.
After a handheld application of the AUSIA framework is developed, supervisory staff
will have the ability to make queries from the optional level. The information flow from the field
level depends on the supervisory relationship. As an example, when a lead hand or a foreman
makes an inquiry from the field, the AUSIA framework will notify the immediate supervisor of
that particular individual about the issue. This enables the individual and supervisor to resolve
the issue if possible, or the supervisor may choose to report it to upper management. If the
general contractor isn’t able to resolve the issue in-house then a RFI can be initiated through the
AUSIA framework to resolve the issue.
7.5 Commercial AUSIA Framework (2nd Generation i-Booth)
The second generation i-Booth was formally introduced to the construction indsutry at
the launching ceremoney in April, 2012 at the University of Calgary.
The commercial system (2nd generation i-Booth) was designed based on three principles
(known as three I’s):

176
Figure 7.25: Three 'I' Principles of AUSIA Framework
Interaction: The success of the 2nd generation i-Booth largely depends on how the
system interacts with users and other systems. The researcher selected hardware items
such as a touch screen, track ball, and card access to enhance the user interaction and
user experience. The software system/platform was designed to interact and integrate
seamlessly with other systems such as ERP, Contract Management, Schedule, Cost
Control, etc.
Integration: Information integration was the key aspect of the AUSIA framework.
As explained in earlier chapters, information integration has a positive correlation
with construction productivity. The researcher and software development team
enabled users from the office end to integrate information and access integrated
information from the kiosk. Previous versions of i-Booth utilized professional PDF
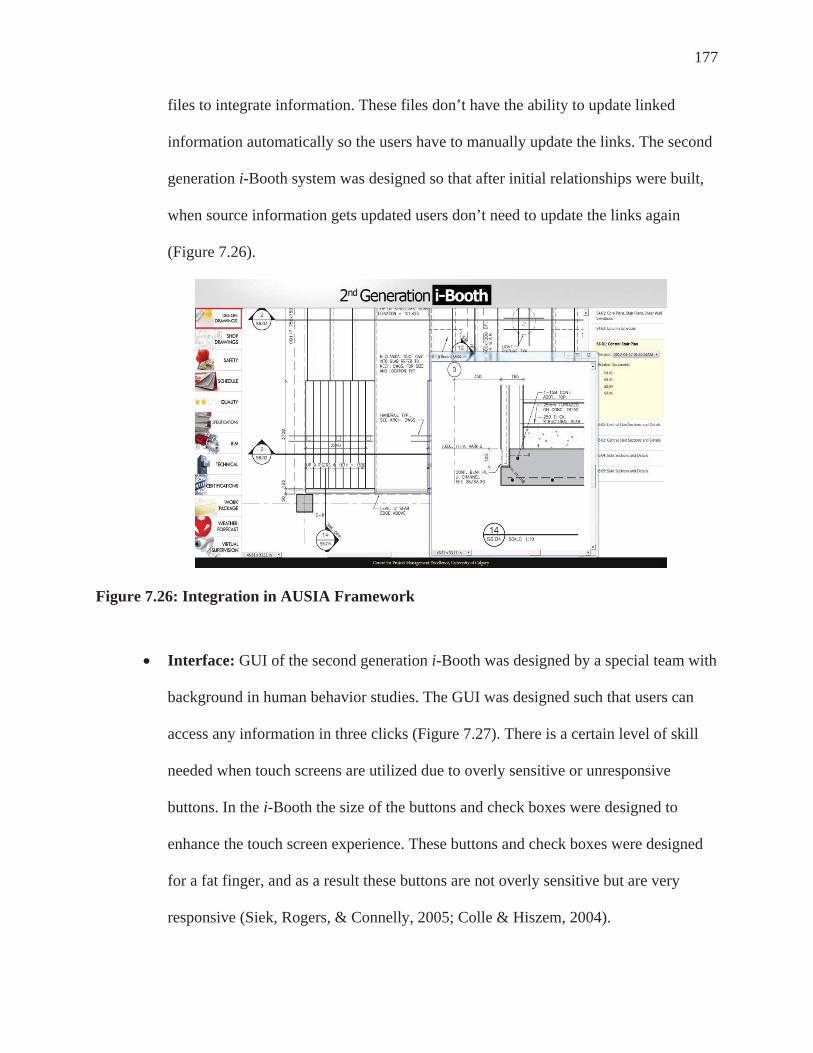
177
files to integrate information. These files don’t have the ability to update linked
information automatically so the users have to manually update the links. The second
generation i-Booth system was designed so that after initial relationships were built,
when source information gets updated users don’t need to update the links again
(Figure 7.26).
Figure 7.26: Integration in AUSIA Framework
Interface: GUI of the second generation i-Booth was designed by a special team with
background in human behavior studies. The GUI was designed such that users can
access any information in three clicks (Figure 7.27). There is a certain level of skill
needed when touch screens are utilized due to overly sensitive or unresponsive
buttons. In the i-Booth the size of the buttons and check boxes were designed to
enhance the touch screen experience. These buttons and check boxes were designed
for a fat finger, and as a result these buttons are not overly sensitive but are very
responsive (Siek, Rogers, & Connelly, 2005; Colle & Hiszem, 2004).

178
Figure 7.27: GUI of Second Generation i-Booth
7.6 Final Acceptance Testing
The researcher, software developer, and supervisor conducted an acceptance test at CCA.
Six general contractors participated in six different workshops to describe the changes and
modifications they wanted in the system. This was done in six workshops because contractors
had more freedom to express their needs without their competitors present. These sessions were
videotaped and user stories were later transferred to features and functions. Finally, research
subjects rated the system on eleven different categories in a 1-7 Likert scale. The survey
instrument used for rating in these workshops is given in Appendix XVII. The responses were
aggregated and summarized in table 7.5 below. Based on the aggregates all the categories

179
showed seventy percent positive responses. Percentages were calculated as follows (e.g. Overall
reaction to the System):
Total Number of Responses: 26
Total Possible Score: 7x26
182
Earned Score: 1x0 + 2x0 +3x1+4x1+ 5x11+
6x13+7x0
140
Percentage: 140/182x100
76.92%

180
Tab
le 7
.3: A
ccep
tanc
e T
estin
g Su
rvey
- 2nd
Gen
erat
ion
i-Boo
th (A
USI
A F
ram
ewor
k)
Item
1
2 3
4 5
6 7
Perc
enta
ge
1 O
vera
ll re
actio
n to
the
Syst
em
0101
1113
Te
rrib
le
W
onde
rful
2 Te
rmin
olog
y an
d Sy
stem
Info
rmat
ion
05
1506
C
onfu
sing
Ver
y cl
ear
3 Sy
stem
Com
patib
ility
with
Exi
stin
g
Syst
ems a
nd P
roce
sses
01
0613
0201
Bad
Goo
d
4 G
raph
ical
Use
r Int
erfa
ce/S
cree
n
Des
ign
0410
12
Con
fusi
ng
V
ery
clea
r
5 Sy
stem
Nav
igat
ion
0307
15
Con
fusi
ng
V
ery
clea
r
6 Pe
rcei
ved
Ease
of U
se
0104
1011
B
ad
G
ood
7 Pe
rcei
ved
Use
fuln
ess
01
04
1011
B
ad
G
ood
8 Su
bjec
tive
Satis
fact
ion
05
1307
B
ad
G
ood
9 Ef
ficie
ncy
0202
1406
B
ad
G
ood
10
Con
sist
ency
01
0708
09
Bad
Goo
d
11
Lear
n-ab
ility
01
0408
13
Bad
Goo
d
181
7.7 BVG Sessions
The researcher conducted four BVG sessions with Canadian construction
professionals to measure acceptance of the AUSIA framework within the construction
industry. These sessions were conducted at the following events:
Calgary Construction Association board of directors’ annual general meeting
held in Banff, Alberta.
Canadian Construction Association's annual general meeting held in Jasper,
Alberta.
Two sessions organized by Productivity Alberta for construction professionals
in Edmonton.
Events started with an overview and demonstration of the AUSIA framework and
concluded with open-ended discussions. A majority of the attendees expressed positive
feedback about the system and the research team is negotiating with a few of these
attendees to transfer the system.
7.8 Software Developers Contribution
A postdoctoral fellow helped the researcher in software development. Based on
availability of resources only the front-end GUI was modified. The main contribution
from the software developer was to develop a GUI to demonstrate the capabilities of
second generation i-Booth. Researcher provided all information required for faceted
classification and also provided a data set with required relationships and meta data for
faceted classification. Based on these input software developers designed the GUI to
demonstrate the capabilities of the kiosk.

182
7.9 Conclusion
The researcher conducted two workshops on two job sites and an online survey to
validate the findings from site implementation. Data collected from on-site and online
samples were analysed separately because the on-site sample had the opportunity to
interact with the kiosk for a week while the online group only had some pictures and a
description. The first part of the survey focused on logistics, setup, and hardware
components of the kiosk and the second half emphasised validating the impact on
communication. Both online and on-site groups wanted limited access to the kiosk, while
the on-site group wanted to make some portions of the system with unrestricted access
(such as safety, weather, and work assignments). A popular access control method was
username and password, even though the researcher expected the biometric scanner and
retinal scanner to be popular because of ease of use. But research subjects were not
comfortable with these due to privacy concerns.
The touch screen was a very successful interactive media for both the tech savvy
work force and the technologically challenged workforce. The majority of on-site and
online research subjects rated the touch screen as an extremely good input device. While
the document scanner, printer, and capture pen were essential hardware items, the
researcher included only a printer because the AUSIA framework in fully implemented
construction sites will be paperless. Both research groups believed that the framework
will have a very positive impact on information integration.
Finally, the researchers manufactured a market-ready information kiosk based on
the feedback received. The researcher and software developer changed the information

183
arrangement to support faceted browsing instead of hierarchical browsing to enhance user
experience.

184
Chapter Eight: Conclusions, Recommendations, and Future Research
This chapter briefly describes the specific observations and objectives achieved in
previous chapters, and conclusions derived from analysing data. The latter part of the
chapter further discusses limitations of the research study. Lastly, recommendations for
future development and research are included.
8.1 Research Summary
The main objective of this study was to improve on-site communication in the
construction industry. The researcher observed construction practices and issues faced by
field staff and workers due to poor communication. Workers faced problems such as
rework due to information delay, and time waste due to poor information management.
Looking at these issues, information technology seemed to be an ideal solution to bridge
the communication gap. But a few technology vendors and software developers so far
had limited success in implementing these solutions in the construction industry. This
insight from discussions with field staff led the researcher to develop an integrated
platform to communicate with different systems performed in isolation. This lead the
researcher to think beyond a simple information kiosk and develop a totally integrated
platform that would work with multiple systems across multiple operating systems.
Hand-held application for AUSIA framework will be developed in the next phase of the
research project.
Thereafter, the researcher designed and manufactured a prototype information
kiosk, which is part of the AUSIA framework. The research team, with the help of a
software developer, field tested the alpha version of the software platform with manual

185
integration capabilities. The researcher conducted several acceptance testing workshops
to investigate the features and functions of the software. At these workshops research
partners were keen to see Virtual Design and Construction (VDC) or Integrated Project
Delivery (IPD) with the system but the main drawback in early 2010 to late 2011 was that
field staff didn’t have a mechanism to communicate/interact with these models. The other
major complaint was the lack of integration between data: inability to move from one
data type to another without going back to the root menu (hierarchical browsing).
The researcher then conducted twelve months of field testing after modifying the
system based on feedback from the above acceptance tests . Several changes were done
to the AUSIA framework during site implementation, the main one being that the number
of information categories changed as a result of introducing new categories such as shop
drawings, work packages, etc. Also the researcher introduced integration between
drawings, changes, and specifications to enhance the efficiency and effectiveness of
communication. Workshops were conducted before, during, and after implementation to
prove that the AUSIA framework improved communication in the construction industry.
Finally, two more workshops were conducted on another two jobsites to validate
the research findings, and an acceptance test was done in CCA to determine the level of
acceptance of the system in the construction industry.
8.2 Research Outcome/Findings
Initial site observations and literature validated that there's a communication gap
in the construction industry. Supervisory staff waste more than two hours per day due to
ineffective information handling. This time waste can be minimised by using a better

186
communication system such as the AUSIA framework. According to the Project
Management Institute, “highly effective communicators are five times more likely than
minimally effective communicators to be high performers to complete their projects on
time, on budget and having met original goals and business intent” (PMI, 2013).
The hypothesis testing concluded that the AUSIA framework has increased the
overall communication at the operational level. Majority (around sixty percent) of the
research subjects experienced a positive change after implementation. The most
significant impact was reported in the automation and integration categories. Analysis
revealed that in the primary information category around seventy and eighty percent of
the research subjects experienced a positive change in integration and automation areas
respectively. In the secondary information category, around seventy percent of research
subjects experienced a positive change in integration and automation areas. Many
scholars in the past (Zhai et al., 2009; O'Connor & Yang, 2004; Zhai & Goodrum, 2009)
have established that automation and integration have a positive correlation to
construction productivity.
Overall around fifty percent of the respondents experienced a positive change in
accessibility of information compared to pre-implementation in all categories except for
safety and weather. Especially, eighty four percent of the research subjects have noted a
positive change in the accessibility of 3D and 4D models. Field supervisory staff was
impressed with the improved accessibility to BIM models, and the proposed framework
provided supervisory staff with HIDs to better interact with VDC and IPD models. Due
to the distributed architecture of the AUSIA framework, field staff don’t need to click
and wait for models to load. This was a major complaint from field staff initially when

187
the kiosk was fully web based, which led the researcher to update the system so the
information would synchronize overnight. Improved accessibility to drawings and
integration of information was a major success. As an example, when a foreman looks up
a structural drawing of the service core, information integration provides access to all
mechanical, electrical, changes (SI, RFI & CR), and spec sections relevant to that
drawing without having to go back and forth in the system. The redundancy of the
AUSIA framework and ability to perform offline is an added bonus to the field staff
because the majority of the information systems available don’t perform offline. The
AUSIA framework enabled the general contractor and other stakeholders to integrate
information systems, which enabled both site staff and office staff to better manage the
information. As a result of integration and automation, office staff can create a virtual
work package in the system and let field staff populate that with relevant information.
The faceted browsing function provides the field staff with an edge when searching for
information. The meta data and the classifications enable field staff to search for any
information relatively quickly. This drastically cuts down the time waste in searching for
information.
One of the major obstacles that needed to be overcome was to earn the trust of the
experienced supervisory staff in relying on information technology instead of printed
copies. Pen and paper was the main mode of red-lining drawings for generations. Red-
lining drawings in a softcopy wasn’t a concept they were willing to accept. The digital
pen was an intermediate solution to overcome this by offering the best of both hard copy
and soft copy. (See Appendix XVIII for detailed implementation of digital pen or capture
pen.) The general contractor maintained two master sets of drawings in the site office and

188
management office, which were manually updated by two different individuals. After
introducing the AUSIA framework the general contractor has the option to release one
staff member to more important work such as constructability reviews, detailed
construction planning, and supervision work.
This research concluded that the AUSIA framework improves communication in
the construction industry significantly, while bringing positive benefits to construction
productivity and reducing rework due to information delay.
8.3 Research Contribution
The most important contribution from this research is the market-ready hardware
solution with high-level software architecture. This research project recognised and field
tested several potential technologies to overcome communication issues in site level. The
research team has already sold one kiosk unit while several potential buyers are
negotiating with i-Booth Inc. to purchase more units.
The AUSIA framework and information distribution matrix enable higher
managements and other supervisory staff members to communicate real-time with
operational level more clearly and effectively. Also identification of suitable hardware
items and HIDs enhance the information retrieval while improving communication.
The drawbacks in current information management and communication systems
in commercial construction industry were clearly identified by this research. This clear
problem identification and analysis of drawbacks enable future researchers to better adopt
technology tools in commercial construction industry.
189
The site implementation of AUSIA framework revealed that the research subjects
believe the use of an integrated and automated system significantly improves
communication in operational level. Successful site implementation changed the attitude
of field supervisory personnel's' perception on construction technology.
There are several more contributions from this research. The research community
and the Calgary construction industry have experienced positive benefits from improved
communication between field and office. The research community has the opportunity to
integrate novel mobile technologies such as Golden-i and, maybe in future, Google Glass.
This system was pilot tested extensively in the construction environment; as a result,
developing the remaining parts of the system is not much of a challenge for the research
community.
The construction community and the Calgary construction industry will benefit as
this novel solution points general contractors towards paperless construction. The general
contractor who agreed to pilot test the system was very enthusiastic and had several
discussions with the researcher and the principal investigator to purchase the system. As a
result of financial barriers, however, the general contractor used his extensive knowledge
of the system to build an in-house version.
The kiosk developed during this research project was successfully tested in an oil
sands project in Northern Alberta for six months, with a different software platform
developed for industrial construction. This proves the versatility of the hardware in
different types of construction.

190
Penetrating the construction market with technology tools was a big challenge for
the researcher, and this successful market reception will pave the way for future
researchers.
8.4 Research Limitations
The major limitation of the research was unavailability of productivity data to
prove a direct benefit from increase in communication. As explained earlier, improving
communication without improving construction productivity will be an extra financial
burden for construction industry. The researcher used empirical means to suggest that the
framework generates positive construction productivity.
Another limitation was the inability to fully test the system with the general
contractor as a result of a confidentiality agreement that prevented integration with
contractor's information management system. This prevented full implementation and as
a result the researcher had to manually integrate the AUSIA framework. Other limitations
are summarized below.
The AUSIA framework was implemented with the general contractor who
was only self-performing formwork and concreting. As a result findings can’t
be generalized for other trades such as mechanical, electrical, and finishes.
The findings of the research are predominantly based on workshops,
interviews, and observations on a construction site in Calgary. It might not be
possible to generalize the findings to different regions because of differences
in workers’ skill levels, market conditions, and climate conditions. The
191
researcher investigated the level of communication across North America to
ensure that the selected job site isn’t an anomaly.
The proposed AUSIA framework was developed based on expectations and
opinions of construction professionals in Calgary. General contractors in other
regions might need to modify the framework based on the type of
construction, the region, and the needs of supervisory staff.
Success of the proposed framework largely depends on continuous
improvements. Devices and types of information need to be changed to suit
the needs of the construction industry.
8.5 Future Research and Recommendations
The researcher and i-Booth Inc. plan to design a digital drawing table and digital
drawing room for incorporation with the AUSIA framework. The digital drawing table
will be similar to the mobile i-Booth but the table angle, height, and width will be
determined by ergonomics. Table width will depend on the size of the door in trailers.
The digital plan room will consist of several digital drawing tables, mobile i-Booths, and
augmented, reality-based systems to visualize models. An augmented reality-based
system consists of several headsets that will enable users to have an actual walk-through
experience in the structure.

192
Figure 8.1: Digital Drawing Table

193
References
Adobe (2013). Displaying 3D models in PDFs. Retrieved October 2nd, 2013, from
http://help.adobe.com/en_US/acrobat/using/WS58a04a822e3e50102bd615109794195
ff-7bfd.w.html
Back, W., & Bell, L. (1995). Quantifying process benefits of electronic data management
technologies. Journal of Construction Engineering and Management, 121(4), 415–
421.
Balli, N. A. (2002). Handheld computer applications for the Tier II construction worker.
(Unpublished master’s thesis). University of Texas, Austin, TX.
Bart van, A., Inklaar, R., & McGuckin, R. H. (2003). ICT and productivity in Europe and
the United States: Where do the differences come from? CESifo Economic Studies,
49(3), 295-318.
Bluebeam (2013). Innovative PDF Solutions for Creation, Markup, Editing and
Collaboration. Retrieved October 2nd, 2013, from http://www.bluebeam.com/
Brochers, J., Deuusen, O., & Knorzer, C. (1995). Getting it across: Layout issues for
kiosk systems, SIGCHI Bulletin, 27(4), 68-74
Chang, C., Hanna, A., Lackney, J., & Sullivan, K. (2007). Quantifying the impact of
schedule compression on labor productivity for mechanical and sheet metal
contractor. Journal of Construction Engineering and Management, 133(4), 287-296.
doi:10.1061/(ASCE)0733-9364(2007)133:4(287)
Chen, Jau-Yuen, Bouman, Charles A., & Dalton, J. C. (2000). Hierarchical browsing and
search of large image databases. IEEE Transactions on Image Processing, 9(3), 442-
455. doi: 10.1109/83.826781

194
Colle, H. A., & Hiszem, K. J. (2004). Standing at a kiosk: Effects of key size and spacing
on touch screen numeric keypad performance and user preference. Ergonomics,
47(13), 1406-1423. doi: 10.1080/00140130410001724228
Conover, W. J., & Iman, R. L. (1981). Rank transformations as a bridge between
parametric and nonparametric statistics. The American Statistician, 35(3), 124-129.
Construction Industry Institute (2009). The Alberta Report - COAA Major Projects
Benchmarking Summary. Austin, TX: Construction Industry Institute.
Construction Owners Association of Alberta (2013), WorkFace Planning, Retrieved
November 07, 2013, from
<http://www.coaa.ab.ca/construction/WorkFacePlanning.aspx>
Couto, J. P., & Teixeira, J. C. (2005). Using linear model for learning curve effect on
highrise floor construction. Construction Management and Economics,
23(Compendex), 355-364.
CSI (2013). Construction Specifications Institute - MasterFormat. Retrieved October 2nd
2013, from http://www.csinet.org/masterformat
Daito Trust Construction Co. (2003). Annual Report. Retrieved December 30, 2010, from
<www.kentaku.co.jp/ir/pdf/annual/annual2003.pdf>
Dossick, C. S., & Neff, G. (2011). Messy talk and clean technology: Communication,
problem-solving and collaboration using Building Information Modelling.
Engineering Project Organization Journal, 1(2), 83-93. doi:
10.1080/21573727.2011.569929
Dozzi, S. P., & AbouRizk, S. M. (1993). “Productivity in Construction”, Institute for
Research in Construction, National Research Council, Ottawa, ON.

195
El-Mashaleh, M., O’Brien, W. J., & Minchin, R. E. (2006). Firm performance and
information technology utilization in the construction industry. Journal of
Construction Engineering and Management, 132(5), 499–507.
Fayek, A. R., & Tsehayae, A. A. (2012). “Modeling construction labour productivity
using fuzzy logic and exploring the use of fuzzy hybrid techniques.” Fuzzy
Information Processing Society (NAFIPS), 2012 Annual Meeting of the North
American.
FIATECH (2013). Real-Time Field Reporting Using Smart Devices (Phase 2) Retrieved
September 27th, 2013, from http://www.fiatech.org/145-active-projects/projects-
construction/590-real-time-field-reporting-using-smart-
devices#sthash.789AIhPN.dpuf
Franke, R. H., & Kaul, J. D. (1978). The Hawthorne experiments: First statistical
interpretation. American Sociological Review, 43(5), 623-643.
Ganesan, S. (1984). Construction Productivity, Habitat International, 8(3/4), 29-42.
Gannoruwa, A., & Ruwanpura, J. Y. (2008). “Development of an Efficiency Model for
Optimum Construction Productivity through Effective Supervision.” Proceedings of
the Canadian Society for Civil Engineering Annual Conference, Quebec City,
Quebec, June 10-13.
Gannoruwa, A. (2008). Development of an efficiency model for optimum construction
productivity through effective supervision on worker performances. (Unpublished
master’s thesis). University of Calgary, Calgary, AB.
Goodrum, P. M., Haas, C. T., Caldas, C., Zhai, D., Yeiser, J., & Homm, D. (2011).
Model to predict the impact of a technology on construction productivity. Journal of

196
Construction Engineering and Management, 137(9), 678-688. doi:
10.1061/(ASCE)CO.1943-7862.0000328
Griffis, F. H., Hogan, D. B., & Li, W. (1995). An analysis of the impacts of using three
dimensional computer models in the management of construction. Research Report
No. 106–11. Austin, TX: Construction Industry Institute.
Haas, C. T., Borcherding, J., Allmon, E., & Goodrum, P. M. (1999). U.S. construction
labour productivity trends 1970-1998. Centre for Construction Industry Institute,
Report No. 7, March. Austin, TX: University of Texas.
Hanna, A., Russell, J., Gotzion, T., & Nordheim, E. (1999). Impact of Change Orders on
Labor Efficiency for Mechanical Construction. Journal of Construction Engineering
and Management, 125(3), 176-184. doi: doi:10.1061/(ASCE)0733-
9364(1999)125:3(176)
Heale, D. G. (1993). Qualitative and quantitative analysis of factors affecting
productivity in Canadian construction projects. (Unpublished master’s thesis).
Memorial University, St. John’s, NL.
Hewage, K. N., & Ruwanpura, J. Y. (2006a). Carpentry workers issues and efficiencies
related to construction productivity in commercial construction projects in Alberta.
Canadian Journal of Civil Engineering, 33(8), 1075-1089. doi: 10.1139/l06-050
Hewage K. N., & Ruwanpura J. Y. (2006b). “Technology adoptability and adaptability
issues related to communication in Alberta commercial construction projects”,
Proceedings of 1st international specialty conference, CSCE, May 23-26.

197
Hewage, K., & Ruwanpura, J. (2009). A novel solution for construction on-site
communication – The Information Booth. Canadian Journal of Civil Engineering,
36(4), 659-671.
Horner, R., Talhouni, B., & Thomas, H. (1989). “Preliminary results of major labour
productivity monitoring programme”. Paper presented at the Proceedings of the 3rd
Yugoslavian Symposium on Construction Management, Cavtat.
Jaafar M., Aziz, A. R. A., Ramayah, T., & Saad, B. (2007). Integrating information
technology in the construction industry: Technology readiness assessment of
Malaysian contractors. International Journal of Project Management, 25, 115–120.
Jergeas, G., & McTague, B. (2002). “Productivity Improvements on Alberta Major
Construction Projects”, Construction Productivity Improvement Report/Project
Evaluation Tool, May 2002.
Johnson, K. D., & Tatum, C. B. (1993). Technology in marine construction firms.
Journal of Construction Engineering and Management, 119(1), 148-162.
Kaming, P. F., Olomolaiye, P. O., Holt, G. D., & Harris, F. C. (1997). Factors influencing
craftsmen's productivity in Indonesia. International Journal of Project Management,
15(1), 21-30.
Kang, Y., Thomas, S., & O’Brien, W. (2006). “Impacts of automation and integration
technologies on project and company performance.” National Institute of Standards
and Technology (NIST) Rep. No. GCR 06–900.
Kang, Y., O'Brien, W. J., Thomas, S., & Chapman, R. E. (2008). Impact of information
technologies on performance: Cross study comparison. Journal of Construction
Engineering and Management, 134(11), 852-863.

198
Kearsley, G. (1994) Public Access Systems, Alex Publishing Corporation, Norwood New
Jersey
Khaled, M., & Remon, F. (2013). Factors Influencing Construction Labor Productivity in
Egypt. Journal of Management in Engineering.
Kirk, J., & Miller, M. (1986). Reliability and validity in qualitative research. Newbury
Park: Sage Publications, Inc.
Koehn, E., & Brown, G. (1985). Climatic Effects on Construction. Journal of
Construction Engineering and Management, 111(2), 129-137. doi:
10.1061/(ASCE)0733-9364(1985)111:2(129)
Liberda, M., Ruwanpura, J. Y., & Jergeas, G. (2003). “Construction Productivity
Improvement: A study of Human, Managerial and External Factors.” Proceedings of
the ASCE Construction Research Congress, Hawaii.
Lim, E., & Alum, J. (1995). Construction productivity: Issues encountered by contractors
in Singapore. International Journal of Project Management, 13(1), 51-58.
Liu, X., & Ruwanpura, J. Y. (2007). “Ten Weeks Testing Model to Improve Construction
Productivity.” Proceedings of the Construction Research Congress 2007, ASCE,
Bahamas, May.
Magdic, A., Rebolj, D., Cus-Babic, N., & Milan, R. (2002). “Mobile computing in
construction.” International Council for Research and Innovation in Building and
Construction, CIB w78 conference, June 12–14.
Maguire, M. G. (1999). A review of user-interface design guidelines for public
information kiosk systems. International Journal of Human-Computer Studies, 50,
263-286.

199
Makulsawatudom, A., Emsley, M., & Sinthawanarong, K. (2004). Critical factors
influencing construction productivity in Thailand. The Journal of KMITNB, 14(3), 1-
6.
McAfee, A., & Brynjolfsson, E. (2008). Investing in the IT that makes a competitive
difference. Harvard Business Review, 86(7/8), 98-107.
McTague, B. and Jergeas, G. (2003). “Productivity improvement on Alberta major
construction projects”, Alberta Economic Development Board. Retrieved September
10, 2013, from http://www.alberta-canada.com.
Morris G., et al. (1995) Kiosks, A technological overview, Available
http://www.visi.com/~keefner/pdfs/kiosk-paper.htmtl#PTFToC2. Accessed July 20,
2010.
Moselhi, O., & Khan, Z. (2010). Analysis of labour productivity of formwork operations
in building construction. Construction Innovation, 10(3), 286-303. doi:
http://dx.doi.org/10.1108/14714171011060088
Moselhi, O. & Khan, Z (2012). Significance ranking of parameters impacting
construction labour productivity. Construction Innovation, 12(3): 272-296.
Nasirzadeh, F., & Nojedehi, P. (2013). Dynamic modeling of labor productivity in
construction projects. International Journal of Project Management, 31(6): 903-911.
Noor, I. A. (1992, November). Study of the variability in labor productivity in building
trades. Dundee, Scotland: Construction Management Research Unit, Department of
Civil Engineering, University of Dundee.
200
O’Connor, J. T., & Yang, L. (2004). Project performance versus use of technologies at
project and phase levels. Journal of Construction Engineering and Management,
130(3), 322–329.
Parasuraman, A. (2000). Technology Readiness Index (TRI): A multiple-item scale to
measure readiness to embrace new technologies. Journal of Service Research, 2(4),
307–320.
Park, S. (2003). An analysis of the impact of information technology on the performance
of construction contracting firms. (Unpublished doctoral thesis, UMI #: 3124205).
Purdue University, West Lafayette, IN.
PMI (2013). Pulse of the Profession Report: Project Success Depends on Effective
Communications. Retrieved October 2nd, 2013, from
http://www.pmi.org/passport/sept13/pulse-profession.htm
Rowings Jr., J. E., & Sonmez, R. (1996) Labor productivity modeling with neural
Networks, AACE International Transactions, Morgantown.
Sauser, B., Verma, D., Ramirez-Marquez, J., & Gove, R. (2006). From TRL to SRL: The
concept of systems readiness levels. Paper presented at the Conference on Systems
Engineering Research, Los Angeles, CA.
Siek, K., Rogers, Y., & Connelly, K. (2005). Fat Finger Worries: How Older and
Younger Users Physically Interact with PDAs. In M. Costabile & F. Paternò (Eds.),
Human-Computer Interaction - INTERACT 2005 (pp. 267-280). Springer Berlin
Heidelberg.
201
Silva, L. P., Hewage, K. N., & Ruwanpura, J. Y. (2008). “Total Information System
Integration in Construction Projects.” Proceedings of the Canadian Society for Civil
Engineering Annual Conference, Quebec City, Quebec, June 10- 13.
Silva, L. P., Ruwanpura, J. Y., & Hewage, K. (2009). "Virtual Supervision in
Construction Projects." Proceedings of the ASCE Construction Research Congress,
Seattle, 487-496.
Stiroh, K. J. (2002). Information technology and the U. S. productivity revival: What do
the industry data say? American Economic Review, 92(5), 1559–1576.
Song-Gook, K., Jang-Woon, K., & Chil-Woo, L. (2007). Implementation of multi-touch
tabletop display for HCI (human computer interaction). Paper presented at the
Human-Computer Interaction - Interaction Platforms and Techniques. 12th
International Conference, HCI International 2007, 22-27 July 2007, Berlin, Germany.
Tatum, C. B. (1986). Potential Mechanisms for Construction Innovation. Journal of
Construction Engineering and Management, 112(2), 179.
The Business Roundtable (1989). “Construction labour motivation”. Construction
industry cost effectiveness project report, Report A2, New York.
Thomas, H. R., Maloney, W. F., & Horner, R. M. W. (1990) Modeling Construction
Labor Productivity. Journal of Construction Engineering and Management, 116(4),
pp. 705-726.
Thomas, H. R., & Napolitan, C. (1995). Quantitative Effects of Construction Changes on
Labor Productivity. Journal of Construction Engineering and Management, 121(3),
290-296. doi: doi:10.1061/(ASCE)0733-9364(1995)121:3(290)

202
Thomas, H. R.,, & Raynar, K. (1997). Scheduled Overtime and Labor Productivity:
Quantitative Analysis. Journal of Construction Engineering and Management, 123(2),
181-188. doi: doi:10.1061/(ASCE)0733-9364(1997)123:2(181)
Thomas, H. R., Riley, D. R., & Sanvido, V. E. (1999). Loss of labor productivity due to
delivery methods and weather. Journal of Construction Engineering and
Management, 125(1) 39-46.
Thomas, S., Lee, S., Spencer, J., Tucker, R., & Chapman, R. (2004). Impacts of
design/information technology on project outcomes. Journal of Construction
Engineering and Management, 130(4), 586–597.
Tsehayae, A., & Fayek, A. (2012). A Research Framework for Work Sampling and Its
Application in Developing Comparative Direct and Support Activity Proportions for
Different Trades. Construction Research Congress 2012.
Wachira, I. N. (2001). Labour Management in Kenya, Department of Building
Economics and Management, University of Nairobi.
Wong, P. S. P., & Cheung, S. O. (2008). An analysis of the relationship between learning
behaviour and performance improvement of contracting organizations. International
Journal of Project Management, 26(2): 112-123.
Zakeri, M., Olomolaiye, P. O., Holt, G. D., & Harris, F. C. (1996). A survey of
constraints on Iranian construction operatives' productivity. Construction
Management & Economics, 14(5), 417-426.
Zhai D., Goodrum P. M., Hass C. T., & Caldas, C. H. (2009). Relationship between
automation and integration of construction information systems and labor

203
productivity. Journal of Construction Engineering and Management, 130(8), 745-
753.
Zhang, G., & Ruwanpura, J. Y. (2008). “An Efficient Construction Materials
Management Model to Improve Site Labor Productivity”. Proceedings of CIB Joint
International Symposium 2008, Nov, Dubai, UAE.

204
Appendix I – Combined Summary of Productivity Factors
Country
Total
Number of
Studied
Factors
Major Factors
United
Kingdom
(UK)
13
Skill of labour; Buildability; Quality of supervision;
Method of working; Incentive scheme; Site layout;
Complexity of construction information; Crew size and
composition; Length of working day; Availability of
power tools; Absenteeism; Total number of operatives on
site; and Proportion of work subcontracted (Horner,
Talhouni, & Thomas, 1989).
Singapore 17
Difficulty in recruitment supervisors; Difficulty in
recruitment workers; High rate of labour turnover;
Absenteeism at worksite; Communication problems with
foreign workers; and Inclement weather that requires
work stoppage for one day or more (Lim & Alum, 1995).
Iran 13
Material shortage; Weather and site conditions;
Equipment breakdown; Drawing deficiencies/change
orders; and Lack of proper tools and equipment (Zakeri,
Olomolaiye, Holt, & Harris, 1996).
Country Total Major Factors

205
Number of
Studied
Factors
Indonesia 11
Lack of materials; Rework; Absenteeism of operatives;
Lack of suitable tools and Equipment; and Crew
interference (Kaming, Olomolaiye, Holt, & Harris, 1997).
Thailand 23
Lack of material; Incomplete drawings; Incompetent
supervisors; Lack of tools and equipment; Absenteeism;
Poor communication; Instruction time; Poor site layout;
Inspection delay; and Rework(Makulsawatudom, Emsley,
& Sinthawanarong, 2004).
Canada 51
Thirty five of those factors were significantly related to
poor management practices in the construction industry.
Management factors, such as lack of detail planning,
inadequate supervision, and lack of information.
USA 81
CII identified 81 factors which narrow down to ten by
research group in 2009 to factors such as “I have to wait
for people and/or equipment to move the material I need”,
“There are errors in the drawings that I use”, etc. (Dai et
al., 2009)

206
Appendix II - Summary of Human Aspects in Kiosk Design
Item Recommendations
Defining user requirements Determine the end-user population for the
Kiosk. Obtain user feedback on system
content and concept.
Location and encouraging use Provide a bright attractive screen, and if
possible a self-running demonstration to
indicate purpose of system and how to use
it.
Place logically in the work area depending
upon the following: nature of the job site,
type of construction, complexity and total
project cost.
Physical access and number of kiosks Place the kiosk in a well-lit area with
adequate physical access.
Number of kiosks per construction job site
will be determined by job complexity, type
of construction, total project cost and
number of workers.

207
Item Recommendations
Introduction and instructions Workshops which target end users to
introduce the system.
On screen, short, free running
demonstration can save time on lengthy
instructions.
Proximity scanner to sense users and popup
the login screen.
Privacy SIM card access control system, finger print
scanner, or retinal scanning system will be
utilized to identify users.
User log file will record user activities.
Users will have different levels of access
(read-write and read-only) to different
contents depending upon job function.
Input to the kiosk (General) Trackball/Mouse and a touch screen can be
used as the pointing device.
Keyboard and speech input for content
input.
Mobile kiosk systems (open air system)
designed to withstand weather, vandalism
and continuous use.

208
Item Recommendations
Keyboard Generic keyboard or specific keyboard
depending upon user requirement.
Touch Screen Minimum button area 2.6cm2 (allowing for
gloved hands).
Feedback for users when button is pressed
(change of button colour, pressing action or
clicking/pressing sound)
Speech Input Noise robust speech input system.
Knowledge among users about keywords to
be used.
Data Capture Bar Code Scanners and RFID readers
depending on end-user requirement.
Communication (Optional Feature) Webcam & Microphone to communicate
with off-site management and supervision
staff. This feature is optional and can be
included depending upon end-user
requirement.
Text and Colour Minimum font Size 16point.
Font style simple.
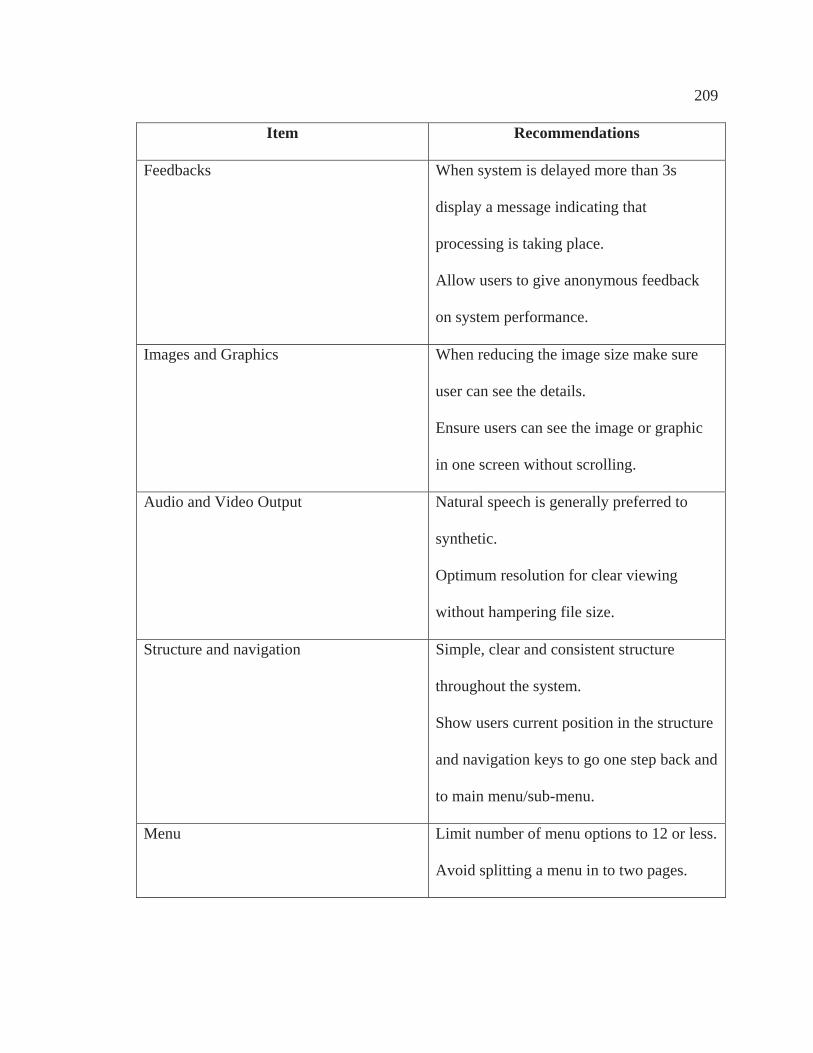
209
Item Recommendations
Feedbacks When system is delayed more than 3s
display a message indicating that
processing is taking place.
Allow users to give anonymous feedback
on system performance.
Images and Graphics When reducing the image size make sure
user can see the details.
Ensure users can see the image or graphic
in one screen without scrolling.
Audio and Video Output Natural speech is generally preferred to
synthetic.
Optimum resolution for clear viewing
without hampering file size.
Structure and navigation Simple, clear and consistent structure
throughout the system.
Show users current position in the structure
and navigation keys to go one step back and
to main menu/sub-menu.
Menu Limit number of menu options to 12 or less.
Avoid splitting a menu in to two pages.

210
Appendix III – Complete List of Hypothesis for AUSIA Framework
Table A1: Null and Alternative Hypothesis for Drawings
Hypothesis Description Null Hypothesis
H0DA Implementation of AUSIA framework does not improve accessibility of drawings on-site
H0DU Implementation of AUSIA framework does not improve usefulness of drawings on-site
H0DS Implementation of AUSIA framework does not improve satisfaction with drawings on-site
H0DI Implementation of AUSIA framework does not improve integration of drawings on-site
H0DA Implementation of AUSIA framework does not improve automation of drawings on-site
Alternative Hypothesis
HADA Implementation of AUSIA framework improves accessibility of drawings on-site
HADU Implementation of AUSIA framework improves usefulness of drawings on-site
HADS Implementation of AUSIA framework improves satisfaction with drawings on-site
HADI Implementation of AUSIA framework improves integration of drawings on-site
HADA Implementation of AUSIA framework improves automation of drawings on-site

211
Table A2: Null and Alternative Hypothesis for Changes
Hypothesis Description Null Hypothesis
H0ChA Implementation of AUSIA framework does not improve accessibility of changes on-site
H0ChU Implementation of AUSIA framework does not improve usefulness of changes on-site
H0ChS Implementation of AUSIA framework does not improve satisfaction with changes on-site
H0ChI Implementation of AUSIA framework does not improve integration of changes on-site
H0ChA Implementation of AUSIA framework does not improve automation of changes on-site
Alternative Hypothesis
HAChA Implementation of AUSIA framework improves accessibility of changes on-site
HAChU Implementation of AUSIA framework improves usefulness of changes on-site
HAChS Implementation of AUSIA framework improves satisfaction with changes on-site
HAChI Implementation of AUSIA framework improves integration of changes on-site
HACAh Implementation of AUSIA framework improves automation of changes on-site

212
Table A3: Null and Alternative Hypothesis for Safety Information
Hypothesis Description Null Hypothesis
H0SaA Implementation of AUSIA framework does not improve accessibility of safety information on-site
H0SaU Implementation of AUSIA framework does not improve usefulness of safety information on-site
H0SaS Implementation of AUSIA framework does not improve satisfaction with safety information on-site
H0SaI Implementation of AUSIA framework does not improve integration of safety information on-site
H0SaA Implementation of AUSIA framework does not improve automation of safety information on-site
Alternative Hypothesis
HASaA Implementation of AUSIA framework improves accessibility of safety information on-site
HASaU Implementation of AUSIA framework improves usefulness of safety information on-site
HASaS Implementation of AUSIA framework improves satisfaction with safety information on-site
HASaI Implementation of AUSIA framework improves integration of safety information on-site
HASaA Implementation of AUSIA framework improves automation of safety information on-site
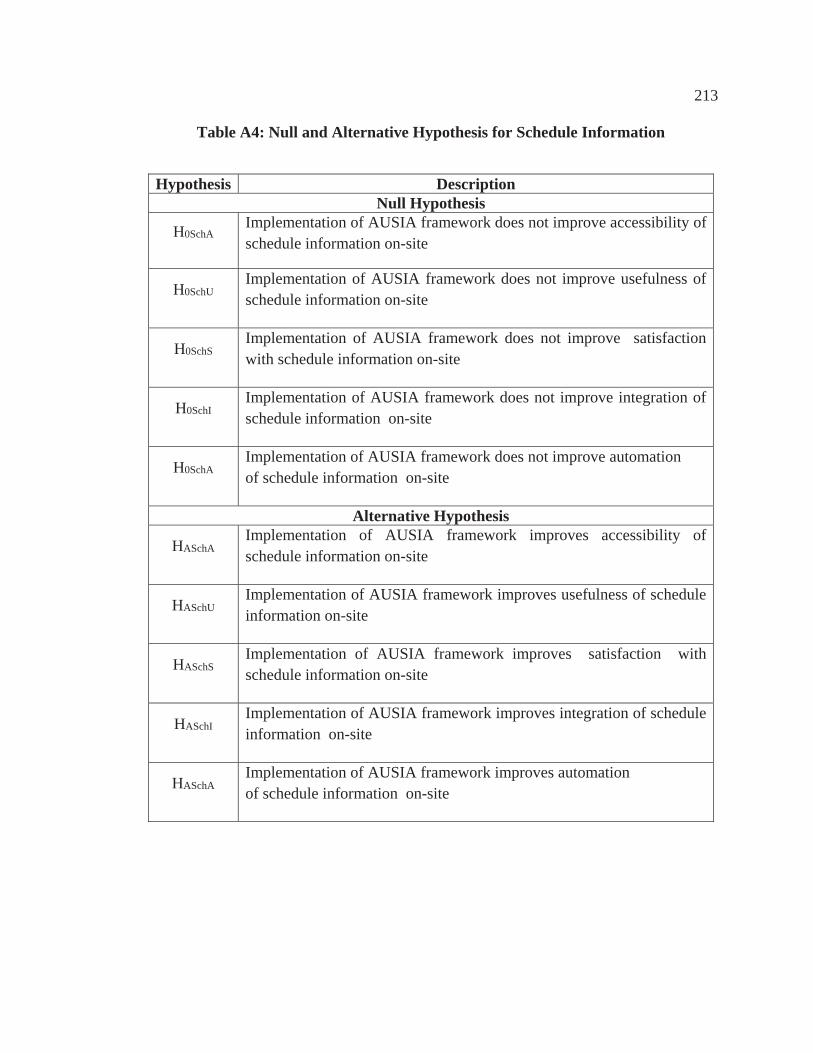
213
Table A4: Null and Alternative Hypothesis for Schedule Information
Hypothesis Description Null Hypothesis
H0SchA Implementation of AUSIA framework does not improve accessibility of schedule information on-site
H0SchU Implementation of AUSIA framework does not improve usefulness of schedule information on-site
H0SchS Implementation of AUSIA framework does not improve satisfaction with schedule information on-site
H0SchI Implementation of AUSIA framework does not improve integration of schedule information on-site
H0SchA Implementation of AUSIA framework does not improve automation of schedule information on-site
Alternative Hypothesis
HASchA Implementation of AUSIA framework improves accessibility of schedule information on-site
HASchU Implementation of AUSIA framework improves usefulness of schedule information on-site
HASchS Implementation of AUSIA framework improves satisfaction with schedule information on-site
HASchI Implementation of AUSIA framework improves integration of schedule information on-site
HASchA Implementation of AUSIA framework improves automation of schedule information on-site

214
Table A5: Null and Alternative Hypothesis for Material Information
Hypothesis Description Null Hypothesis
H0MaA Implementation of AUSIA framework does not improve accessibility of material information on-site
H0MaU Implementation of AUSIA framework does not improve usefulness of material information on-site
H0MaS Implementation of AUSIA framework does not improve satisfaction with material information on-site
H0MaI Implementation of AUSIA framework does not improve integration of material information on-site
H0MaA Implementation of AUSIA framework does not improve automation of material information on-site
Alternative Hypothesis
HAMaA Implementation of AUSIA framework improves accessibility of material information on-site
HAMaU Implementation of AUSIA framework improves usefulness of material information on-site
HAMaS Implementation of AUSIA framework improves satisfaction with material information on-site
HAMaI Implementation of AUSIA framework improves integration of material information on-site
HAMaA Implementation of AUSIA framework improves automation of material information on-site
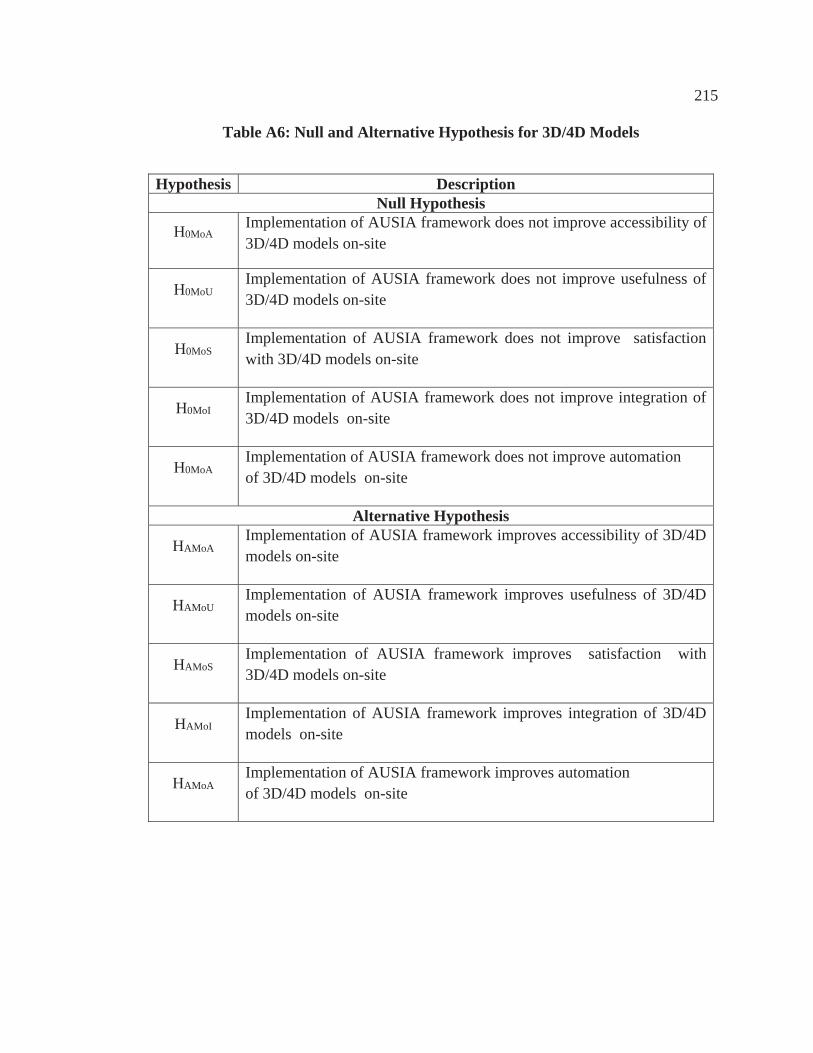
215
Table A6: Null and Alternative Hypothesis for 3D/4D Models
Hypothesis Description Null Hypothesis
H0MoA Implementation of AUSIA framework does not improve accessibility of 3D/4D models on-site
H0MoU Implementation of AUSIA framework does not improve usefulness of 3D/4D models on-site
H0MoS Implementation of AUSIA framework does not improve satisfaction with 3D/4D models on-site
H0MoI Implementation of AUSIA framework does not improve integration of 3D/4D models on-site
H0MoA Implementation of AUSIA framework does not improve automation of 3D/4D models on-site
Alternative Hypothesis
HAMoA Implementation of AUSIA framework improves accessibility of 3D/4D models on-site
HAMoU Implementation of AUSIA framework improves usefulness of 3D/4D models on-site
HAMoS Implementation of AUSIA framework improves satisfaction with 3D/4D models on-site
HAMoI Implementation of AUSIA framework improves integration of 3D/4D models on-site
HAMoA Implementation of AUSIA framework improves automation of 3D/4D models on-site

216
Table A7: Null and Alternative Hypothesis for Quality Related Information
Hypothesis Description Null Hypothesis
H0QuaA Implementation of AUSIA framework does not improve accessibility of quality related information on-site
H0QuaU Implementation of AUSIA framework does not improve usefulness of quality related information on-site
H0QuaS Implementation of AUSIA framework does not improve satisfaction with quality related information on-site
H0QuaI Implementation of AUSIA framework does not improve integration of quality related information on-site
H0QuaA Implementation of AUSIA framework does not improve automation of quality related information on-site
Alternative Hypothesis
HAQuaA Implementation of AUSIA framework improves accessibility of quality related information on-site
HAQuaU Implementation of AUSIA framework improves usefulness of quality related information on-site
HAQuaS Implementation of AUSIA framework improves satisfaction with quality related information on-site
HAQuaI Implementation of AUSIA framework improves integration of quality related information on-site
HAQuaA Implementation of AUSIA framework improves automation of quality related information on-site

217
Table A8: Null and Alternative Hypothesis for Certifications
Hypothesis Description Null Hypothesis
H0QuaA Implementation of AUSIA framework does not improve accessibility of certifications on-site
H0QuaU Implementation of AUSIA framework does not improve usefulness of certifications on-site
H0QuaS Implementation of AUSIA framework does not improve satisfaction with certifications on-site
H0QuaI Implementation of AUSIA framework does not improve integration of certifications on-site
H0QuaA Implementation of AUSIA framework does not improve automation of certifications on-site
Alternative Hypothesis
HAQuaA Implementation of AUSIA framework improves accessibility of certifications on-site
HAQuaU Implementation of AUSIA framework improves usefulness of certifications on-site
HAQuaS Implementation of AUSIA framework improves satisfaction with certifications on-site
HAQuaI Implementation of AUSIA framework improves integration of certifications on-site
HAQuaA Implementation of AUSIA framework improves automation of certifications on-site

218
Table A9: Null and Alternative Hypothesis for Weather Information
Hypothesis Description Null Hypothesis
H0WeaA Implementation of AUSIA framework does not improve accessibility of weather information on-site
H0WeaU Implementation of AUSIA framework does not improve usefulness of weather information on-site
H0WeaS Implementation of AUSIA framework does not improve satisfaction with weather information on-site
H0WeaI Implementation of AUSIA framework does not improve integration of weather information on-site
H0WeaA Implementation of AUSIA framework does not improve automation of weather information on-site
Alternative Hypothesis
HAWeaA Implementation of AUSIA framework improves accessibility of weather information on-site
HAWeaU Implementation of AUSIA framework improves usefulness of weather information on-site
HAWeaS Implementation of AUSIA framework improves satisfaction with weather information on-site
HAWeaI Implementation of AUSIA framework improves integration of weather information on-site
HAWeaA Implementation of AUSIA framework improves automation of weather information on-site

219
Table A10: Null and Alternative Hypothesis for Technical Information
Hypothesis Description Null Hypothesis
H0TecA Implementation of AUSIA framework does not improve accessibility of technical information on-site
H0TecU Implementation of AUSIA framework does not improve usefulness of technical information on-site
H0TecS Implementation of AUSIA framework does not improve satisfaction with technical information on-site
H0TecI Implementation of AUSIA framework does not improve integration of technical information on-site
H0TecA Implementation of AUSIA framework does not improve automation of technical information on-site
Alternative Hypothesis
HATecA Implementation of AUSIA framework improves accessibility of technical information on-site
HATecU Implementation of AUSIA framework improves usefulness of technical information on-site
HATecS Implementation of AUSIA framework improves satisfaction with technical information on-site
HATecI Implementation of AUSIA framework improves integration of technical information on-site
HATecA Implementation of AUSIA framework improves automation of technical information on-site

220
Appendix IV - Confidentiality Agreement

221

222

223

224
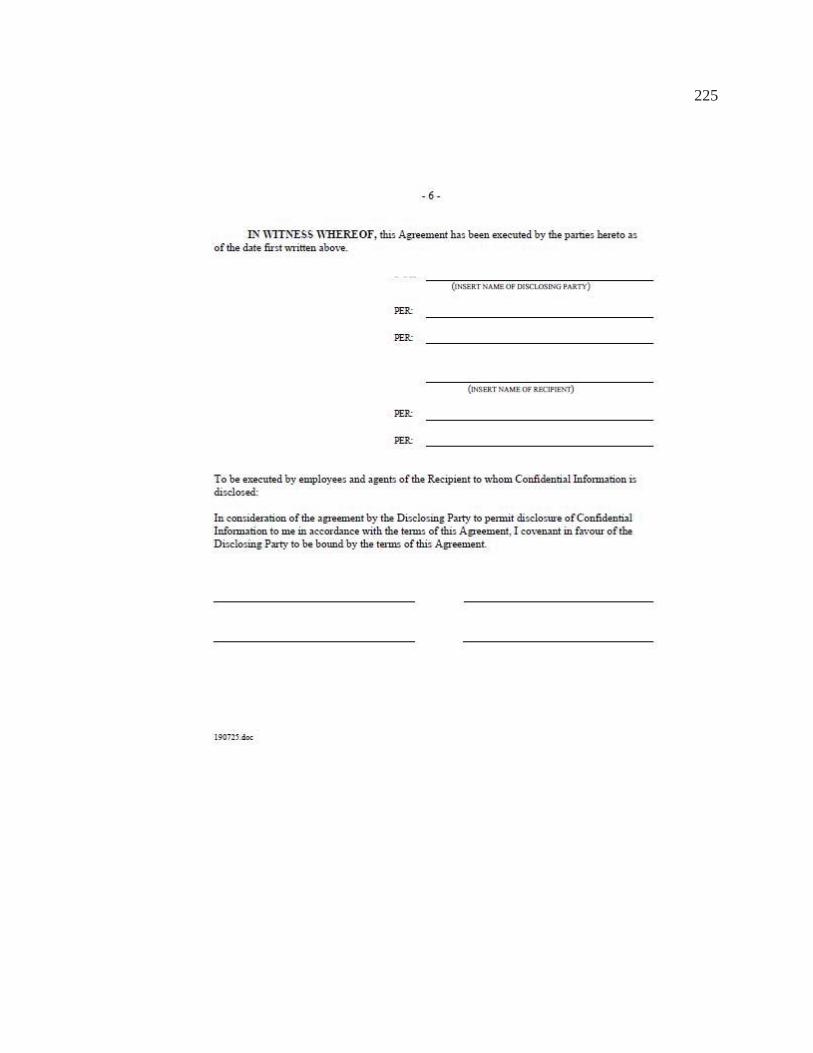
225

226

227
Appendix V - Information Management Questionnaire (Online)
228

229
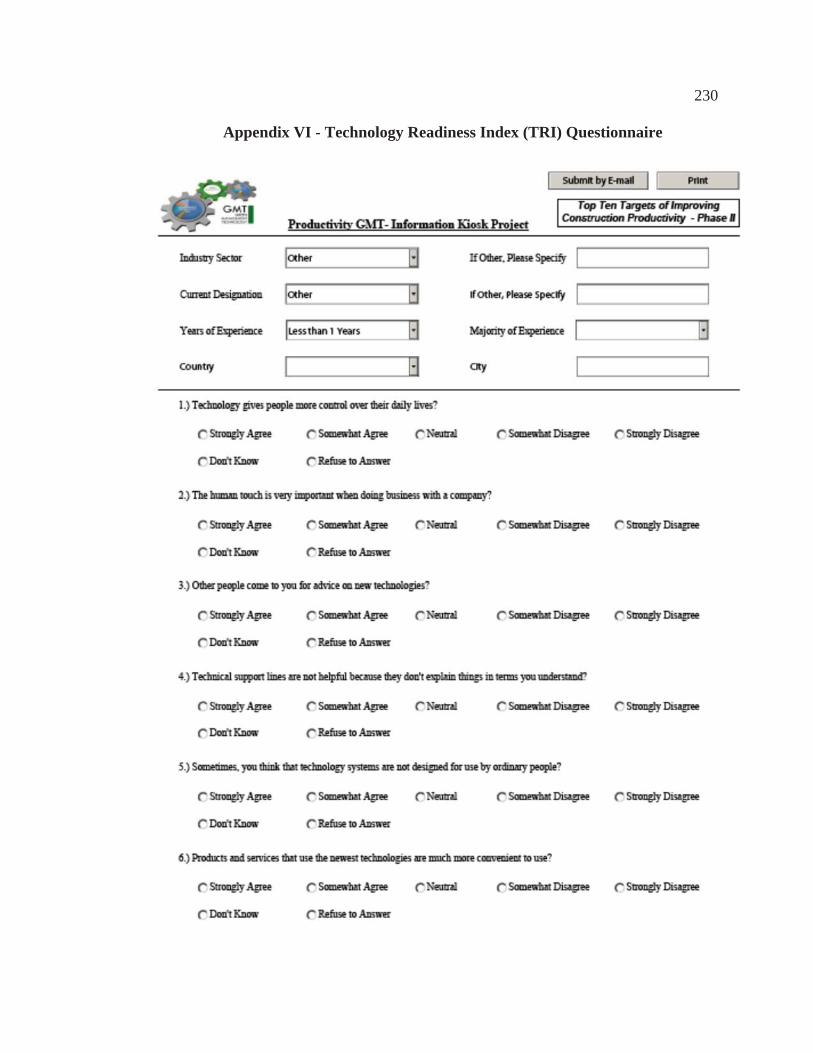
230
Appendix VI - Technology Readiness Index (TRI) Questionnaire

231

232

233

234

235
Appendix VII – Time Waste Data Entry Sheet

236
Appendix VIII - Present State of Information Management

237

238

239

240
App
endi
x IX
– E
rror
Mar
gin
Cal
cula
tion
for
Sam
ple
Size
Information
AU
SIA
Err
or
99%
Err
or
95%
Err
or
90%
Mean
99%
Con
fiden
ce
Lev
el
95%
Con
fiden
ce
Lev
el
90%
Con
fiden
ce
Lev
elU
pper
Lim
it
Low
er
Lim
it
Upp
er
Lim
it
Low
er
Lim
it
Upp
er
Lim
it
Low
er
Lim
it
Drawings
Acc
essi
bilit
y (B
efor
e)
.478
10.
189
0.14
2 0.
118
2.00
0 2.
189
1.81
1 2.
142
1.85
8 2.
118
1.88
2 A
cces
sibi
lity
(Afte
r)
.500
00.
198
0.14
8 0.
124
2.75
0 2.
948
2.55
2 2.
898
2.60
2 2.
874
2.62
6 U
sefu
lnes
s (B
efor
e)
.398
40.
158
0.11
8 0.
099
2.11
1 2.
269
1.95
3 2.
229
1.99
3 2.
210
2.01
2 U
sefu
lnes
s (A
fter)
.4
871
0.19
3 0.
144
0.12
1 2.
639
2.83
2 2.
446
2.78
3 2.
495
2.76
0 2.
518
Satis
fact
ion
(Bef
ore)
.5
884
0.23
3 0.
175
0.14
6 1.
710
1.94
3 1.
477
1.88
5 1.
535
1.85
6 1.
564
Satis
fact
ion
(Afte
r)
.569
90.
226
0.16
9 0.
141
2.48
4 2.
710
2.25
8 2.
653
2.31
5 2.
625
2.34
3 In
tegr
atio
n (B
efor
e)
.718
40.
284
0.21
3 0.
178
1.36
7 1.
651
1.08
3 1.
580
1.15
4 1.
545
1.18
9 In
tegr
atio
n (A
fter)
.5
724
0.22
7 0.
170
0.14
2 2.
500
2.72
7 2.
273
2.67
0 2.
330
2.64
2 2.
358
Aut
omat
ion
(Bef
ore)
.8
000
0.31
7 0.
237
0.19
8 1.
000
1.31
7 0.
683
1.23
7 0.
763
1.19
8 0.
802
Aut
omat
ion
(Afte
r)
.485
20.
192
0.14
4 0.
120
2.65
4 2.
846
2.46
2 2.
798
2.51
0 2.
774
2.53
4
Changes
Acc
essi
bilit
y (B
efor
e)
.603
60.
239
0.17
9 0.
149
2.08
3 2.
322
1.84
4 2.
262
1.90
4 2.
232
1.93
4 A
cces
sibi
lity
(Afte
r)
.467
20.
185
0.13
9 0.
116
2.69
4 2.
879
2.50
9 2.
833
2.55
5 2.
810
2.57
8 U
sefu
lnes
s (B
efor
e)
.447
80.
177
0.13
3 0.
111
2.26
5 2.
442
2.08
8 2.
398
2.13
2 2.
376
2.15
4 U
sefu
lnes
s (A
fter)
.4
478
0.17
7 0.
133
0.11
1 2.
735
2.91
2 2.
558
2.86
8 2.
602
2.84
6 2.
624
Satis
fact
ion
(Bef
ore)
.5
509
0.21
8 0.
163
0.13
6 1.
800
2.01
8 1.
582
1.96
3 1.
637
1.93
6 1.
664
Satis
fact
ion
(Afte
r)
.546
70.
216
0.16
2 0.
135
2.66
7 2.
883
2.45
1 2.
829
2.50
5 2.
802
2.53
2 In
tegr
atio
n (B
efor
e)
.689
50.
273
0.20
5 0.
171
1.34
6 1.
619
1.07
3 1.
551
1.14
1 1.
517
1.17
5 In
tegr
atio
n (A
fter)
.5
084
0.20
1 0.
151
0.12
6 2.
538
2.73
9 2.
337
2.68
9 2.
387
2.66
4 2.
412
Aut
omat
ion
(Bef
ore)
.8
771
0.34
7 0.
260
0.21
7 1.
333
1.68
0 0.
986
1.59
3 1.
073
1.55
0 1.
116
Aut
omat
ion
(Afte
r)
.465
30.
184
0.13
8 0.
115
2.70
4 2.
888
2.52
0 2.
842
2.56
6 2.
819
2.58
9
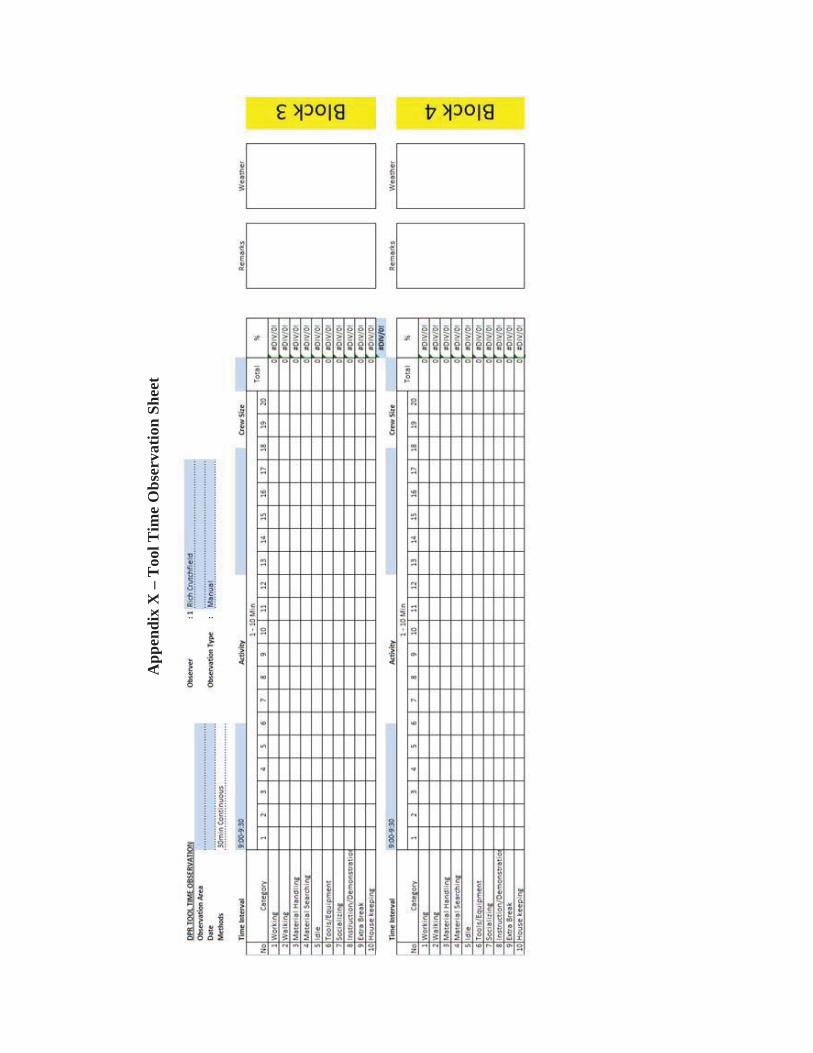
241
App
endi
x X
– T
ool T
ime
Obs
erva
tion
Shee
t

242
Appendix XI – Demo Software Overview

243

244

245
Appendix XII – Present Information Flow
Abbreviations used for each designation are given below
CM Construction Manager
RM Risk Manager
SPM Senior Project Manager
PM Project Manager
APM Assistant Project Manager
GS General Superintendent
BSM Building Systems Manager
ES Estimator
PC Project Coordinator
C Coordinator
FE Field Engineer
S Supervisor
QMC Quality Management Coordinator
O Operator
DC Document Control
S Superintendent
AS Assistant Superintendent
GF General Foremen
Su Surveyor
SS Summer Student
IS Intern Student

246
Symbol Description
Information initiated by the person
Information process intimately by the person
Information end up with the person

247
Initi
ated
By
(IB
)
Info
rmat
ion
or D
ocum
ent
Initi
ated
(I/D
I) fr
om
Off
ice-
End
SS
AS
HSE
C
M &
E C
A
PM
PC
Stru
ctur
al/
Arc
hite
ctur
al
/LE
ED
C
FE
ST
Info
rmat
ion
or
Doc
umen
t
Initi
ated
(I/D
I)
from
fiel
d-E
nd
Initi
ated
By
(IB
)
Su
perin
tend
ents
Dai
ly R
epor
t
Ass
ista
nt
/Tra
de
Supe
rinte
nden
t
W
eekl
y
Prog
ress
Rep
ort
Fiel
d
Engi
neer
s/
Fore
men
Seni
or
Supe
rinte
nden
t
Look
Ahe
ad
Sche
dule
Seni
or
Supe
rinte
nden
t
Cha
nge
Ord
er
R
FI/R
RFI
Su
b Tr
ades
Es
timat
e fo
r
Extra
Wor
k
Sub
Trad
es

248
IB
I/D
I
from
Off
ice-
End
PM
(Str
uctu
re)
PM
(Env
elop
e/
Site
)
GS
GS
(Str
uctu
re)
PCH
SE SQ
MC
C
M
SPM
A
S FE
G
F
I/D
I
from
Fiel
d-E
nd
IB
FE
Wor
k
Pack
ages
GS
(Stru
ctur
e)
Look
Ahe
ad
Sche
dule
Req
uest
for
Info
rmat
ion
GF
GS
Site
Inst
ruct
ions
PM
Cha
nge
Ord
er
HSE
S
Safe
ty
Rec
ord
Job
Haz
ard
Ana
lysi
s
GF
Supe
rvis
ors
Dai
ly R
epor
t
GF
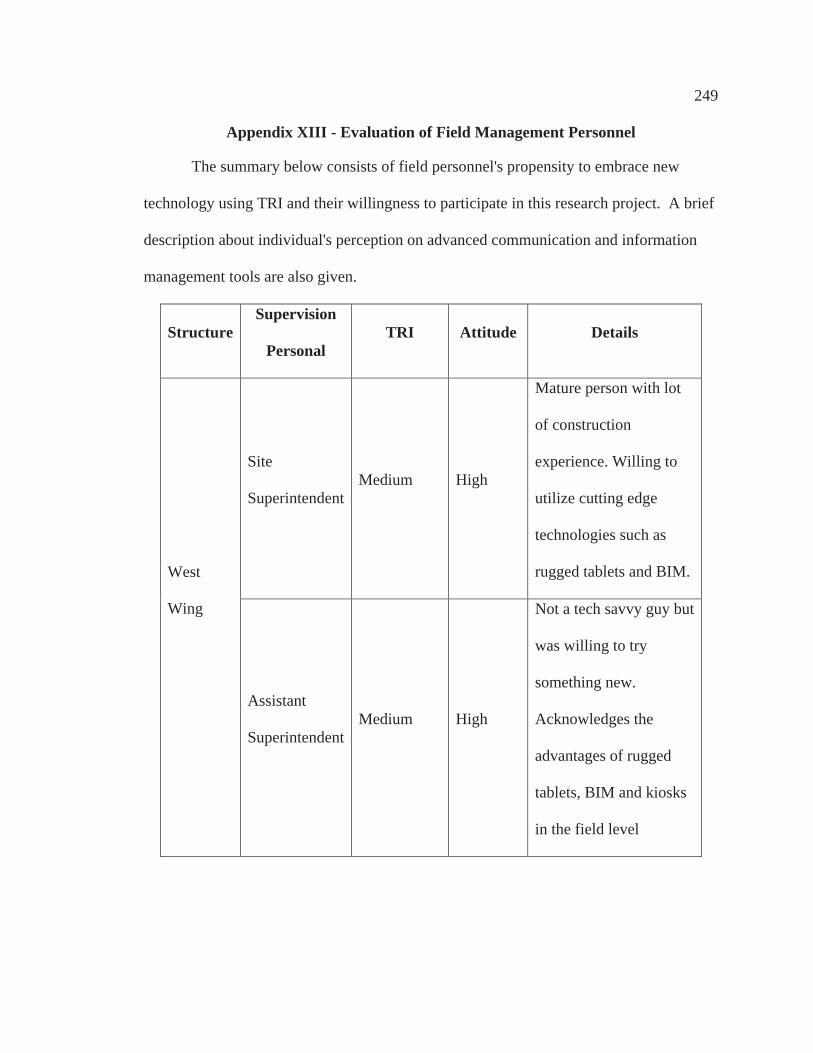
249
Appendix XIII - Evaluation of Field Management Personnel
The summary below consists of field personnel's propensity to embrace new
technology using TRI and their willingness to participate in this research project. A brief
description about individual's perception on advanced communication and information
management tools are also given.
StructureSupervision
PersonalTRI Attitude Details
West
Wing
Site
SuperintendentMedium High
Mature person with lot
of construction
experience. Willing to
utilize cutting edge
technologies such as
rugged tablets and BIM.
Assistant
SuperintendentMedium High
Not a tech savvy guy but
was willing to try
something new.
Acknowledges the
advantages of rugged
tablets, BIM and kiosks
in the field level

250
StructureSupervision
PersonalTRI Score Attitude Details
Centre
Wing
Site
SuperintendentLow Medium
Mature person closer to
retirement age, believes
extra effort needed to
learn new technology is
not beneficial for him.
Proposes proper training
program before
implementing new
technologies
Assistant
Superintendent
(Area A and
B)
Medium Medium
Relies on hard skills but
is willing to try new
technology
Assistant
Superintendent
(Area C)
High Low
Tech savvy guy but
believes everything he
needs is in in-house
solution
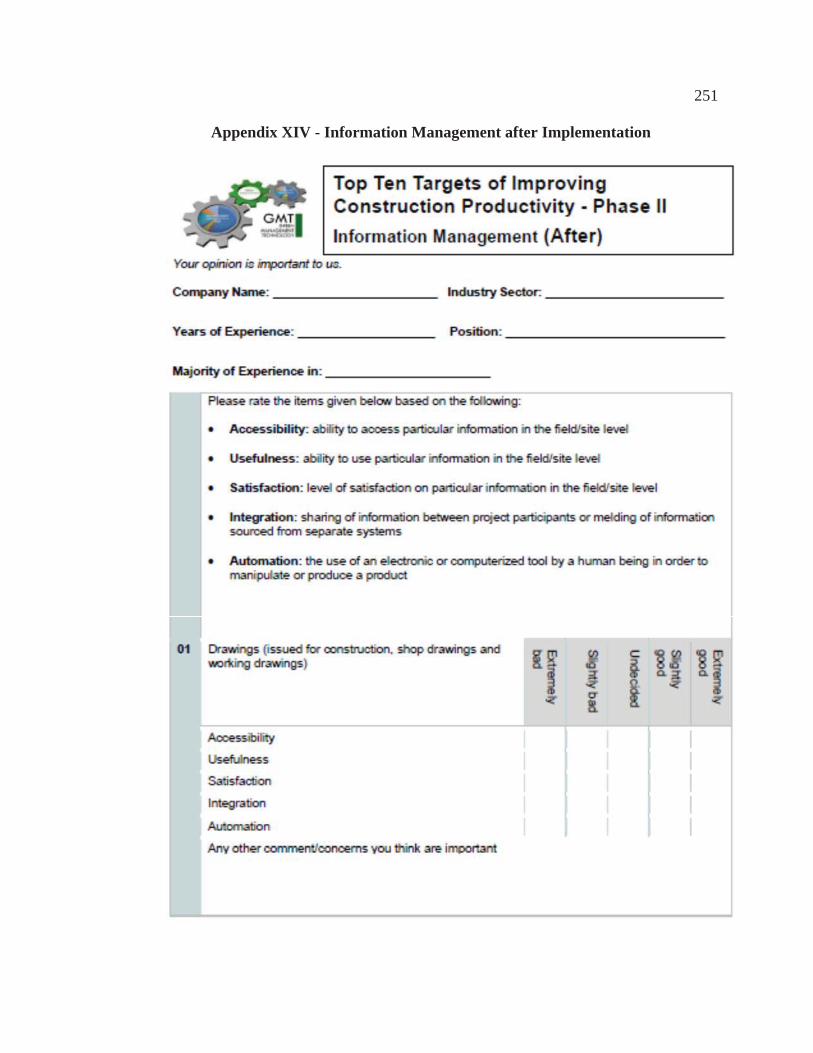
251
Appendix XIV - Information Management after Implementation
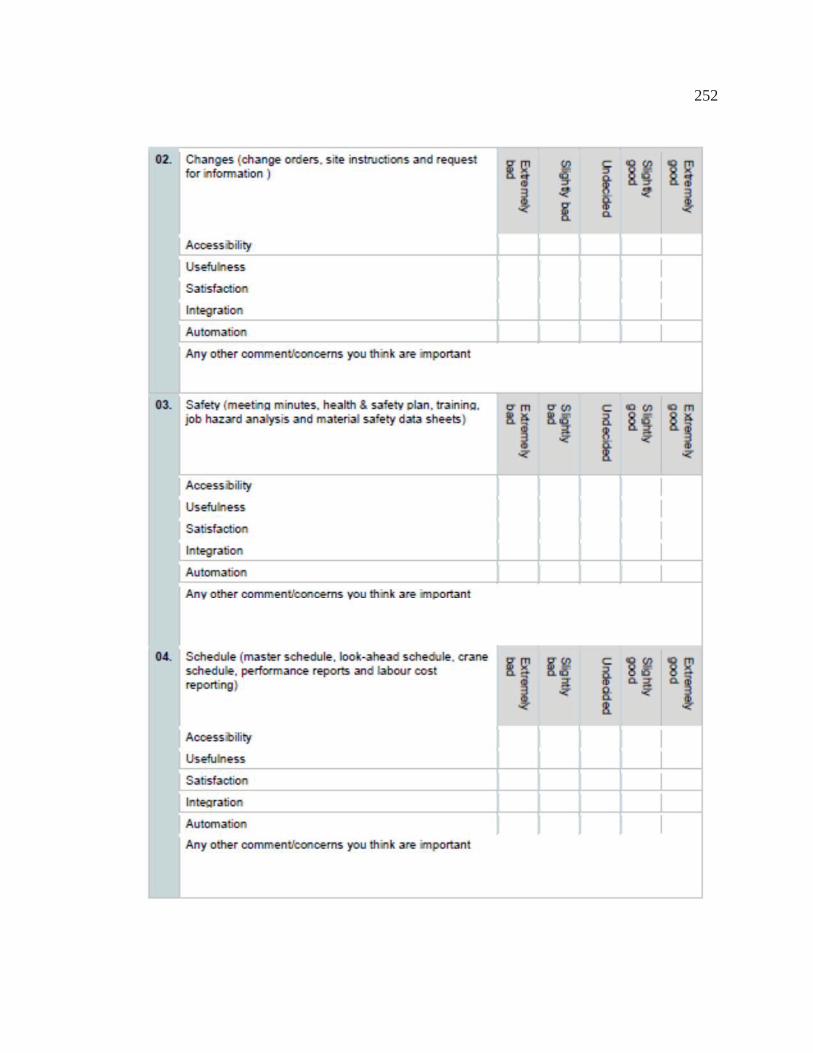
252

253

254

255
App
endi
x X
V –
Kol
mog
orov
–Sm
irno
v T
est S
tatis
tics
Tab
le A
11: K
-S T
est B
efor
e Im
plem
enta
tion
Info
rmat
ion
V
alue
A
cces
sibi
lity
Use
fuln
ess
Satis
fact
ion
Inte
grat
ion
Aut
omat
ion
Dra
win
gZ
2.38
32.
871
1.82
41.
724
1.28
8p
(Exa
ct S
ig.)
.000
.000
.003
.005
.072
Cha
nges
Z 2.
158
2.81
02.
008
1.69
61.
226
p (E
xact
Sig
.) .0
00.0
00.0
01.0
06.0
99Sa
fety
Z 2.
632
2.90
52.
635
1.89
31.
206
p (E
xact
Sig
.) .0
00.0
00.0
00.0
02.1
09Sc
hedu
leZ
1.86
21.
853
1.53
91.
486
1.48
2p
(Exa
ct S
ig.)
.002
.002
.018
.024
.025
Mat
eria
lZ
1.51
01.
736
1.37
91.
205
1.22
9p
(Exa
ct S
ig.)
.021
.005
.044
.110
.098
3D/4
D M
odel
s Z
1.02
31.
284
.917
1.22
2.9
84p
(Exa
ct S
ig.)
.246
.074
.369
.101
.287
Qua
lity
Z 2.
611
2.34
82.
175
1.32
31.
021
p (E
xact
Sig
.) .0
00.0
00.0
00.0
60.2
49C
ertif
icat
ions
Z
1.70
31.
669
1.02
1.9
23.8
24p
(Exa
ct S
ig.)
.006
.008
.248
.362
.505
Wea
ther
Z 1.
765
1.83
61.
774
1.92
51.
045
p (E
xact
Sig
.) .0
04.0
02.0
04.0
01.2
25Te
chni
cal
Z 2.
276
2.08
31.
826
1.51
01.
048
p (E
xact
Sig
.) .0
00.0
00.0
03.0
21.2
22
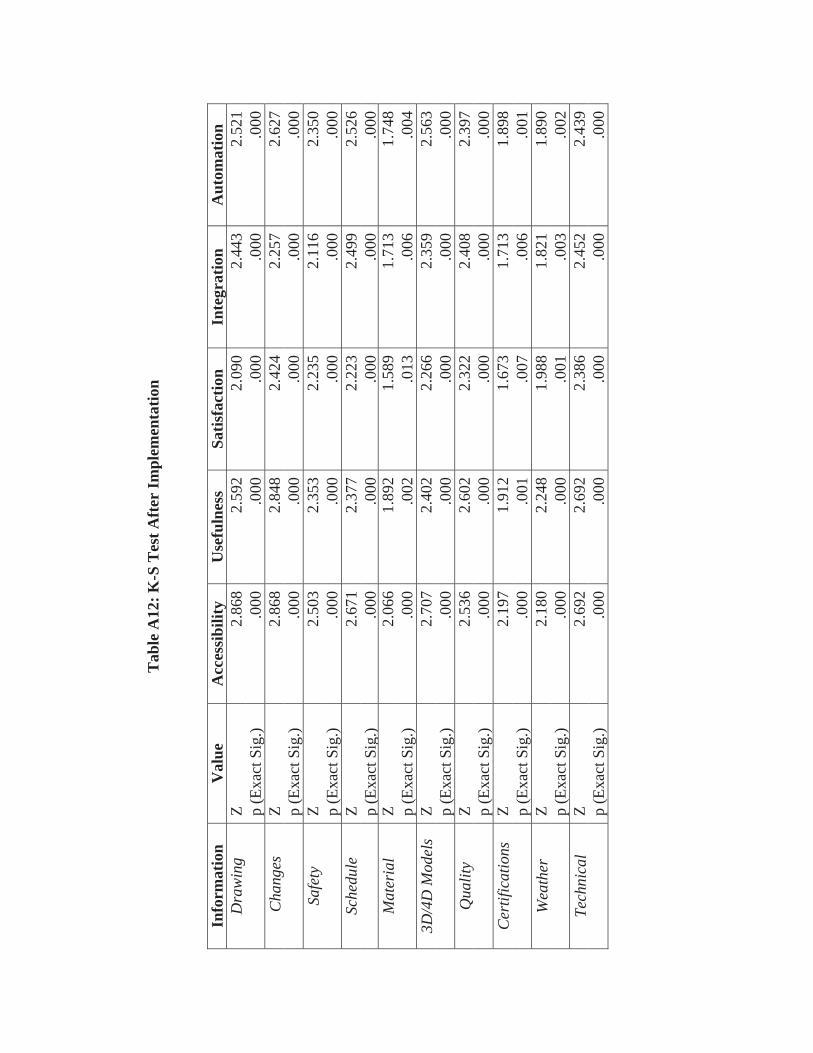
256
Tab
le A
12: K
-S T
est A
fter
Impl
emen
tatio
n
Info
rmat
ion
V
alue
A
cces
sibi
lity
Use
fuln
ess
Satis
fact
ion
Inte
grat
ion
Aut
omat
ion
Dra
win
gZ
2.86
82.
592
2.09
02.
443
2.52
1p
(Exa
ct S
ig.)
.000
.000
.000
.000
.000
Cha
nges
Z
2.86
82.
848
2.42
42.
257
2.62
7p
(Exa
ct S
ig.)
.000
.000
.000
.000
.000
Safe
tyZ
2.50
32.
353
2.23
52.
116
2.35
0p
(Exa
ct S
ig.)
.000
.000
.000
.000
.000
Sche
dule
Z 2.
671
2.37
72.
223
2.49
92.
526
p (E
xact
Sig
.) .0
00.0
00.0
00.0
00.0
00M
ater
ial
Z 2.
066
1.89
21.
589
1.71
31.
748
p (E
xact
Sig
.) .0
00.0
02.0
13.0
06.0
043D
/4D
Mod
els
Z 2.
707
2.40
22.
266
2.35
92.
563
p (E
xact
Sig
.) .0
00.0
00.0
00.0
00.0
00Q
ualit
y Z
2.53
62.
602
2.32
22.
408
2.39
7p
(Exa
ct S
ig.)
.000
.000
.000
.000
.000
Cer
tific
atio
ns
Z 2.
197
1.91
21.
673
1.71
31.
898
p (E
xact
Sig
.) .0
00.0
01.0
07.0
06.0
01W
eath
erZ
2.18
02.
248
1.98
81.
821
1.89
0p
(Exa
ct S
ig.)
.000
.000
.001
.003
.002
Tech
nica
lZ
2.69
22.
692
2.38
62.
452
2.43
9p
(Exa
ct S
ig.)
.000
.000
.000
.000
.000

257
Appendix XVI – Preference Change Before and After Implementation
Table A13: Wilcoxon Signed Ranks of Drawings
Table A14: Wilcoxon Signed Ranks of Changes (SI, RFI, PCN)
ID Information Rank
Dra
win
gs
Accessibility Negative Rank After < Before 0 Positive Rank After > Before 27
Tie After = Before 13
Usefulness Negative Rank After < Before 1 Positive Rank After > Before 20
Tie After = Before 18
Satisfaction Negative Rank After < Before 1 Positive Rank After > Before 19
Tie After = Before 13
Integration Negative Rank After < Before 0 Positive Rank After > Before 28
Tie After = Before 7
Automation Negative Rank After < Before 0 Positive Rank After > Before 27
Tie After = Before 3
ID Information Rank
Cha
nges
Accessibility Negative Rank After < Before 0 Positive Rank After > Before 22
Tie After = Before 18
Usefulness Negative Rank After < Before 0 Positive Rank After > Before 18
Tie After = Before 20
Satisfaction Negative Rank After < Before 0 Positive Rank After > Before 23
Tie After = Before 9
Integration Negative Rank After < Before 0 Positive Rank After > Before 24
Tie After = Before 6
Automation Negative Rank After < Before 0 Positive Rank After > Before 26
Tie After = Before 4

258
Table A15: Wilcoxon Signed Ranks of Safety
Table A16: Wilcoxon Signed Ranks of Schedule
ID Information Rank Sa
fety
Accessibility Negative Rank After < Before 1 Positive Rank After > Before 14
Tie After = Before 23
Usefulness Negative Rank After < Before 1 Positive Rank After > Before 15
Tie After = Before 21
Satisfaction Negative Rank After < Before 0 Positive Rank After > Before 14
Tie After = Before 16
Integration Negative Rank After < Before 0 Positive Rank After > Before 17
Tie After = Before 15
Automation Negative Rank After < Before 0 Positive Rank After > Before 20
Tie After = Before 7
ID Information Rank
Sche
dule
Accessibility Negative Rank After < Before 1 Positive Rank After > Before 17
Tie After = Before 16
Usefulness Negative Rank After < Before 1 Positive Rank After > Before 18
Tie After = Before 16
Satisfaction Negative Rank After < Before 1 Positive Rank After > Before 14
Tie After = Before 12
Integration Negative Rank After < Before 3 Positive Rank After > Before 20
Tie After = Before 4
Automation Negative Rank After < Before 0 Positive Rank After > Before 20
Tie After = Before 4

259
Table A17: Wilcoxon Signed Ranks of Material
Table A18: Wilcoxon Signed Ranks of 3D/4D Models
ID Information Rank M
ater
ial
Accessibility Negative Rank After < Before 1 Positive Rank After > Before 17
Tie After = Before 7
Usefulness Negative Rank After < Before 2 Positive Rank After > Before 11
Tie After = Before 10
Satisfaction Negative Rank After < Before 1 Positive Rank After > Before 15
Tie After = Before 5
Integration Negative Rank After < Before 1 Positive Rank After > Before 19
Tie After = Before 3
Automation Negative Rank After < Before 1 Positive Rank After > Before 16
Tie After = Before 3
ID Information Rank
3D/4
D M
odel
s
Accessibility Negative Rank After < Before 0 Positive Rank After > Before 19
Tie After = Before 3
Usefulness Negative Rank After < Before 1 Positive Rank After > Before 15
Tie After = Before 11
Satisfaction Negative Rank After < Before 0 Positive Rank After > Before 15
Tie After = Before 6
Integration Negative Rank After < Before 0 Positive Rank After > Before 18
Tie After = Before 5
Automation Negative Rank After < Before 0 Positive Rank After > Before 16
Tie After = Before 4

260
Table A19: Wilcoxon Signed Ranks of Quality
Table A20: Wilcoxon Signed Ranks of Certifications
ID Information Rank Q
ualit
y
Accessibility Negative Rank After < Before 1 Positive Rank After > Before 22
Tie After = Before 11
Usefulness Negative Rank After < Before 1 Positive Rank After > Before 23
Tie After = Before 14
Satisfaction Negative Rank After < Before 1 Positive Rank After > Before 21
Tie After = Before 9
Integration Negative Rank After < Before 0 Positive Rank After > Before 21
Tie After = Before 9
Automation Negative Rank After < Before 0 Positive Rank After > Before 19
Tie After = Before 5
ID Information Rank
Cer
tific
atio
ns
Accessibility Negative Rank After < Before 0 Positive Rank After > Before 7
Tie After = Before 4
Usefulness Negative Rank After < Before 1 Positive Rank After > Before 4
Tie After = Before 9
Satisfaction Negative Rank After < Before 0 Positive Rank After > Before 4
Tie After = Before 7
Integration Negative Rank After < Before 0 Positive Rank After > Before 8
Tie After = Before 3
Automation Negative Rank After < Before 0 Positive Rank After > Before 5
Tie After = Before 1

261
Table A21: Wilcoxon Signed Ranks of Weather
Table A22: Wilcoxon Signed Ranks of Technical
ID Information Rank W
eath
er
Accessibility Negative Rank After < Before 3 Positive Rank After > Before 16
Tie After = Before 17
Usefulness Negative Rank After < Before 4 Positive Rank After > Before 10
Tie After = Before 24
Satisfaction Negative Rank After < Before 2 Positive Rank After > Before 16
Tie After = Before 15
Integration Negative Rank After < Before 1 Positive Rank After > Before 16
Tie After = Before 13
Automation Negative Rank After < Before 0 Positive Rank After > Before 15
Tie After = Before 9
ID Information Rank
Tec
hnic
al
Accessibility Negative Rank After < Before 0 Positive Rank After > Before 21
Tie After = Before 13
Usefulness Negative Rank After < Before 0 Positive Rank After > Before 14
Tie After = Before 23
Satisfaction Negative Rank After < Before 1 Positive Rank After > Before 16
Tie After = Before 12
Integration Negative Rank After < Before 0 Positive Rank After > Before 19
Tie After = Before 12
Automation Negative Rank After < Before 0 Positive Rank After > Before 21
Tie After = Before 4

262
Appendix XVII – Acceptance Testing Workshop Instrument
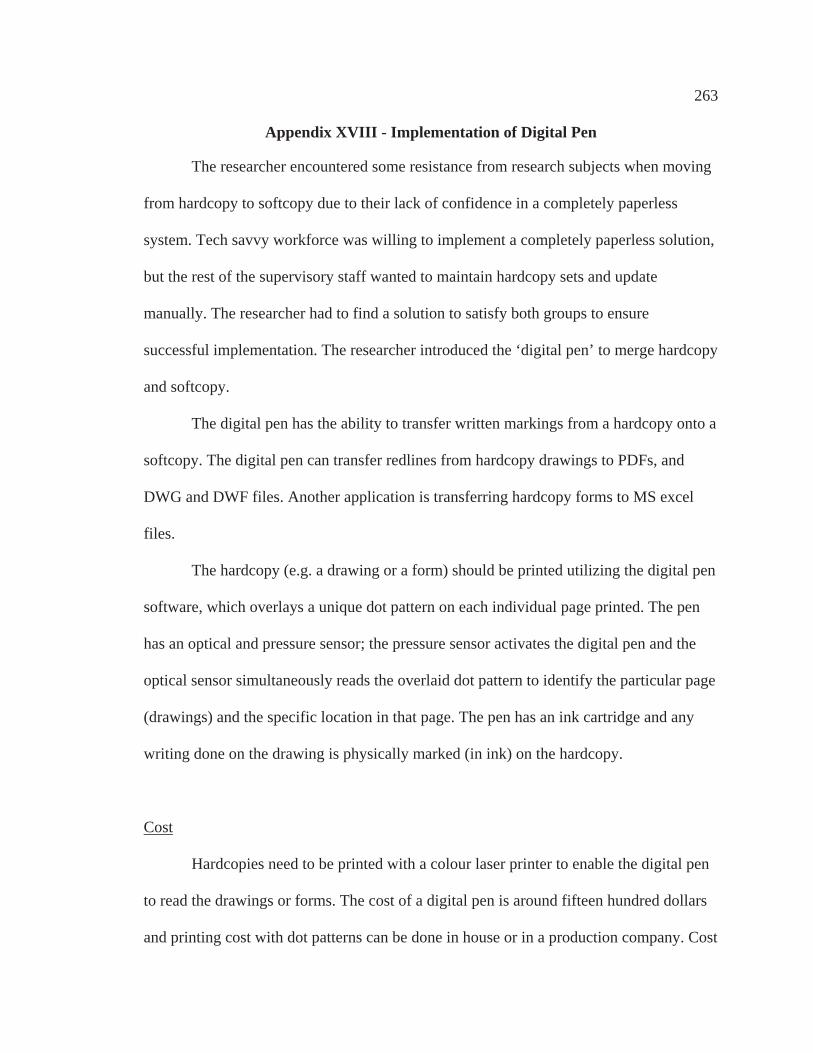
263
Appendix XVIII - Implementation of Digital Pen
The researcher encountered some resistance from research subjects when moving
from hardcopy to softcopy due to their lack of confidence in a completely paperless
system. Tech savvy workforce was willing to implement a completely paperless solution,
but the rest of the supervisory staff wanted to maintain hardcopy sets and update
manually. The researcher had to find a solution to satisfy both groups to ensure
successful implementation. The researcher introduced the ‘digital pen’ to merge hardcopy
and softcopy.
The digital pen has the ability to transfer written markings from a hardcopy onto a
softcopy. The digital pen can transfer redlines from hardcopy drawings to PDFs, and
DWG and DWF files. Another application is transferring hardcopy forms to MS excel
files.
The hardcopy (e.g. a drawing or a form) should be printed utilizing the digital pen
software, which overlays a unique dot pattern on each individual page printed. The pen
has an optical and pressure sensor; the pressure sensor activates the digital pen and the
optical sensor simultaneously reads the overlaid dot pattern to identify the particular page
(drawings) and the specific location in that page. The pen has an ink cartridge and any
writing done on the drawing is physically marked (in ink) on the hardcopy.
Cost
Hardcopies need to be printed with a colour laser printer to enable the digital pen
to read the drawings or forms. The cost of a digital pen is around fifteen hundred dollars
and printing cost with dot patterns can be done in house or in a production company. Cost

264
of a colour printout is $2.99/ft2 or $35.88/sheet (Arch E Large Format Sheet 36”x48”)
and a black and white printout costs $0.99/ft2 or $11.88/sheet (Arch E).
The researcher implemented the digital pen in the TTC complex. This project
utilized 550 drawings (Architectural, Structural, Mechanical, and Electrical). The general
contractor had printed two sets of hardcopies for the site office and management office,
and individual field supervisory staff members had reduced size copies (11”x17”). The
cost breakdown is given below:
Cost of colour printing with dots : 19,734.00 CAD
Cost of the pen : 1,500.00 CAD
Total cost for digital pen implementation : 21,234.00
Cost for printing two black and white sets : -13,068.00 CAD
Extra Cost : 8,166.00 CAD
This extra eight thousand dollars is offset by the direct cost saving of reducing the
number of field staff members needed to update multiple copies. Also the number of
11x17 copies needed by field supervisor staff can be reduced (cost of one set of 11x17
black and while hardcopy is around 700 CAD).
There are a few disadvantages of the digital pen, such as the pen might not
identify redlining over some dark hatched areas on drawings. This can be avoided by not
writing over dark shaded areas on the drawings. There might be a learning curve for the
printing company when printing the dotted drawings for the first time, however once they
are set up further printing will be seamless.

265
Appendix XIX - Cost Breakdown and Recovery of Investment for i-Booth Software Development
The research team spoke with several software developers to find out
development costs associated with the AUSIA framework; a feasible estimate was
500,000CAD - 750,000CAD. Calculation was done assuming i-Booth Inc. can generate
500,000CAD and the Industrial Research Assistance Program by National Research
Council of Canada will match the balance money. i-Booth Inc. plans to recover the
investment in 3 years with at least 15% ROI. i-Booth Inc. will engage in agreements with
6 potential clients to raise the 500,000CAD. These six clients don’t need to pay for site
license or enterprise license for 7 years (initial investment of 100,000CAD each). Cash
flow forecast is based on the following assumptions:
Initial investment : 750,000
Software Development : 500,000
Operating Cost : 250,000
AUSIA framework software will cost 5000CAD/month for site license or
20,000CAD/month for enterprise license.
Five clients for the first year with a one-year site license (5,000x12x5 =
300,000) will generate 300,000. The operating cost for the first year will be
150,000, assuming that this is only for support and server maintenance. A
one-time setup and training fee will be paid by the clients in the initial setup.
During the second year there will be one enterprise license for a year, and
three and a half site licenses (assuming one client terminates contract after six
months) for one year (20,000x12x1 + 5,000x12x3.5), amounting to 450,000.

266
The operating cost for the second year will increase to 250,000, assuming that
this is only for support, server upgrade, and server maintenance. A one-time
setup and training fee will be paid by the new clients in initial setup.
During the third year there will be one and a half enterprise licenses and four
site licenses for one year (20,000x12x2 + 5,000x12x4), amounting to
600,000. The operating cost for the second year will reduce to 200,000
because old projects in the server will be archived and server space will be
free for new projects. Operating cost will only be for support, server upgrade,
and server maintenance. A one-time setup and training fee will be paid by the
new clients in initial setup.
Table A23: Cash Flow Forecast for Next 3 Years
Year Cash-In Cash-Out
1 300,000 150,000
2 450,000 250,000
3 600,000 200,000
Net Present Value (NPV) [10% Discounted Rate] : 852,178.82
Profitability Index : 1.2044
Internal Rate of Return (IRR) : 19.5
Based on the calculations i-Booth Inc. will be able to recover the investment with
around 20% return on investment within 3 years.
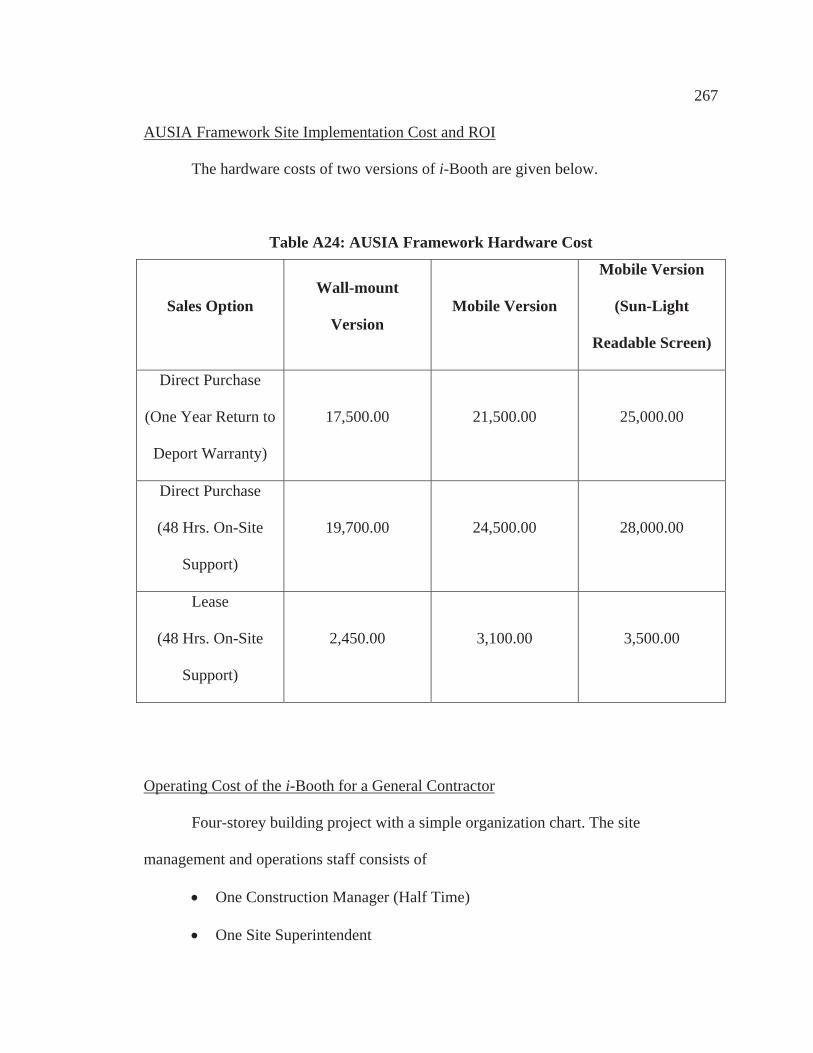
267
AUSIA Framework Site Implementation Cost and ROI
The hardware costs of two versions of i-Booth are given below.
Table A24: AUSIA Framework Hardware Cost
Sales Option Wall-mount
VersionMobile Version
Mobile Version
(Sun-Light
Readable Screen)
Direct Purchase
(One Year Return to
Deport Warranty)
17,500.00 21,500.00 25,000.00
Direct Purchase
(48 Hrs. On-Site
Support)
19,700.00 24,500.00 28,000.00
Lease
(48 Hrs. On-Site
Support)
2,450.00 3,100.00 3,500.00
Operating Cost of the i-Booth for a General Contractor
Four-storey building project with a simple organization chart. The site
management and operations staff consists of
One Construction Manager (Half Time)
One Site Superintendent

268
One Assistant Superintendent
Two General Foremen
One Field Engineer/Coordinator
One Lead Hand
The contractor can recover the operating expense of the system by direct time
savings of supervision staff. Assuming a flat charge out rate of 35$/hr. (0.60 per minute)
for above mentioned staff, benefit calculation will be as follows:
(As mentioned in chapter four, minutes saved per head/day due to i-Booth is
114.3mins)
Cost saving per person : 114.3x0.60
: 068.4
Cost saving for this site : 68.4*6.5
: 444.6/Day
Operating cost of the system was calculated with the following assumptions:
Site license for the software will cost 5000.00 CAD/Month
Site management will only have to lease a wall-mount unit for the project
because management trailer is located on-site and all site staff is equipped
with handheld devices (iPads or Windows Tablets)
Cost of the handheld devices per month is 66.67CAD (assuming unit cost is
1000 CAD and operational life is 15 months)
Cost of cellular data connection for a handheld device is 50.00CAD/month
Wired data connection costs 500.00CAD per month with Wi-Fi access points

269
Site License : 5000.00
Wall-mount Unit Lease : 2450.00
Cost of Handhelds : 66.67x6.5
: 0433.34
Cellular Data : 50.00x6.5
: 0325.00
Hardwire Connections with Wi-Fi : 0500.00
Total Cost for a Month : 8708.34
Number of Days to Recover the Cost : 8708.34/444.6
: 20 Days
Contractor can recover the operating expense of the system by direct time saving
of supervision staff.
Option II
Twenty storey building project with a midsize organization structure. The site
management and operations staff consists of
One Project Manager
One Construction Manager
One Site Superintendent
Two Assistant Superintendents
Four General Foremen
Two Field Engineers/Coordinators

270
Six Lead Hands
Assuming flat charge out rate of 36$/hr. (0.60 per minute) for the above
mentioned staff, the benefit calculation will be as follows:
Cost saving per person : 114.x0.60
: 068.4
Cost saving for this site : 68.4x17
: 1162.8/Day
Operating cost of the system was calculated with the following assumptions:
Site license will cost 5000.00 CAD/Month
Site management will lease three wall-mount unit and two sunlight readable
mobile units for the project because management trailer is located away site
and field trailer is located on-site. All site staff is equipped with handheld
devices (iPads or Windows Tablets)
Cost of the handheld devices per month is 66.67CAF (assuming unit will 1000
CAD and operational life is 15 months)
Cost of cellular data connection for a handheld devices is 50.00CAD/Month
Wired Data connections 1000.00CAD per month with Wi-Fi access points
Site License : 5000.00
Wall-mount Unit Lease : 2450.00s3
: 7350.00
Sunlight Readable Mobile Unit Lease : 3500.00x2

271
: 7000.00
Cost of Handhelds : 66.67x17
: 1133.33
Cellular Data : 50.00x17
: 0850.00
Hardwire Connections with Wi-Fi : 1000.00
Total Cost for a Month : 22333.33
Number of Days to Recover the Cost : 22333.33/1162.80
: 20 Days
The contractor can recover the operating expense of the system by direct time
savings of supervision staff.
The research team also spoke with solution provider about marketing the AUSIA
framework as a Software as a Service (SaaS) model. Further details about this option are
discussed in the Future Research section.

272
Appendix XXI – Permission to Reuse Copyrighted Material

273

274

275