AUSAIA GEOOGICA SUEY OGAISAIO - … f rr Indtr nd Enr •^ AUSAIA GEOOGICA SUEY OGAISAIO ECO 1993/5...
64
-
Upload
nguyentram -
Category
Documents
-
view
215 -
download
0
Transcript of AUSAIA GEOOGICA SUEY OGAISAIO - … f rr Indtr nd Enr •^ AUSAIA GEOOGICA SUEY OGAISAIO ECO 1993/5...
•••••••^Department of Primary Industries and Energy
•^AUSTRALIAN GEOLOGICAL SURVEY ORGANISATION
RECORD 1993/52
AUSTRALIAN SEISMOLOGICAL REPORT, 1990
compiled by
Kevin McCue and Peter Gregson
(Australian Seismological Centre)
AUSTRALIAN GOVERNMENT PUBLISHING SERVICECANBERRA
11 1 11 11 11 1^11 I* R 9 3 0 5 2 0 1 *
•••
DEPARTMENT OF PRIMARY INDUSTRIES AND ENERGY^•Minister for Resources: Hon. Michael Lee^ •Secretary: Greg Taylor^ •
••
AUSTRALIAN GEOLOGICAL SURVEY ORGANISATION^•Executive Director: Harvey Jacka^ •
© Commonwealth of Australia
•••
ISSN: 1039-0073 •
ISBN: 0 642 19578 1 ••
This work is copyright. Apart from any fair dealings for the purposes of study,research, criticism or review, as permitted under the Copyright Act, no part may bereproduced by any process without written permission. Copyright is the
••
responsibility of the Executive Director, Australian Geological Survey Organisation.Inquiries should be directed to the Principal Information Officer, Australian •Geological Survey Organisation, GPO Box 378, Canberra City, ACT, 2601. •
41••
Drafting: Lindell Emerton, Gail Hill and Ken Barrett^ ••••••••••

Contributors
Contributors to this publication are listed below according to the information furnished or serviceperformed:
Hypocentres and magnitudes
R. Cuthbertson, Queensland Geological Survey, Brisbane, QldV. Dent, Mundaring Geophysical Observatory, Mundaring, WAM. Douch, AGSO, Canberra, ACTG. Gibson, Philip Institute of Technology, Bundoora,P.J. Gregson, AGSO, Mundaring Geophysical Observatory, Mundaring, WAInternational Seismological Centre (ISC), Newbury, UKT. Jones, AGSO, Canberra, ACTD. Love, Sutton Institute of Earthquake Physics, SADME, SAK. McCue, AGSO, Canberra, ACTM. Michael-Leiba, AGSO, Canberra, ACTNational Earthquake Information Service, US Geological Survey (USGS), Boulder,
Colorado, USAE.P. Paull, AGSO, Mundaring Geophysical Observatory, Mundaring, WAJ. Pongratz, University of Tasmania, Hobart, TasJ. Vahala, AGSO, Canberra, ACTJ. Weekes, Research School of Earth Sciences, Australian National University, Canberra,
ACTV. Wesson, Phillip Institute of Technology, Bundoora, Vic
Intensities
R Cuthbertson, Department of Minerals & Energy, QldS Greenhalgh and K Malpas, Flinders University, SAP Gregson, E Paull & B Gaull, AGSO Mundaring, WAD Love & A McArdle, Sutton Institute of Earthquake Physics, SADME, SAK McCue & M Michael-Leiba, AGSO Canberra, ACT
Network operations (by institution)
Australian Seismological Centre, Australian Geological Survey Organisation, Canberra, ACT(AGSO), and Mundaring, WA (MUN)
Geological Survey of Queensland, Brisbane, Qld (GSQ)Research School Earth Sciences, Australian National University, Canberra, ACT (CAN)Seismology Research Centre, Phillip Institute of Technology, Bundoora, Vic (PIT)St Ignatius College, Riverview, NSW (RIV)Sutton Institute of Earthquake Physics, SADME, Adelaide, SA (ADE)University of Central Queensland, Rockhampton, Qld (UCQ)University of Queensland, Brisbane, Qld (UQ)University of Tasmania, Hobart, Tas (TAU)
Strong-motion data
V Dent, & P Gregson AGSO, Mundaring Geophysical Observatory, Mundaring, WAG. Gibson & V. Wesson, Phillip Institute of Technology, Bundoora, Vic.K. McCue 8z. M. Michael-Leiba, AGSO, Canberra, ACT
Nuclear monitoring
K. Muirhead, S. Spiliopoulos, D Jepson, K Beven, L. Hodgson, W PendersAGSO Canberra, ACT
•
•
0
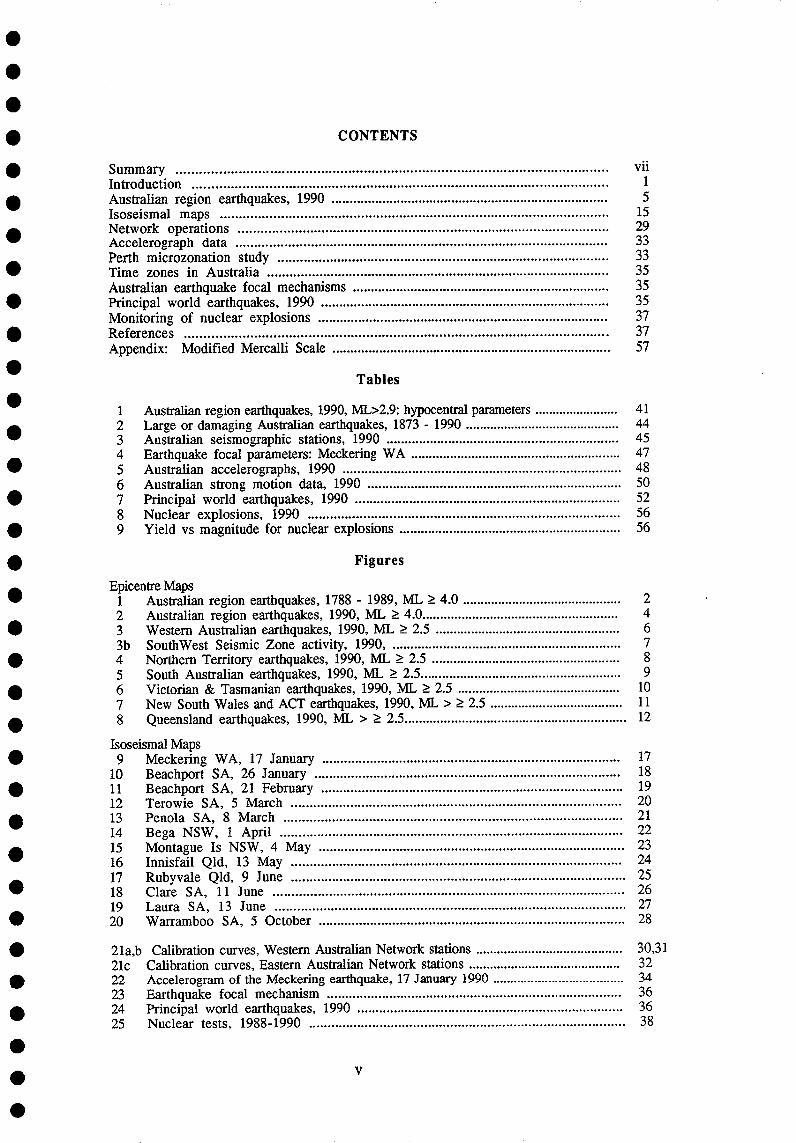
• CONTENTS
• Summary ^ viiIntroduction ^1
• Australian region earthquakes, 1990 ^5Isoseismal maps ^15
•Network operations ^29Accelerograph data ^33Perth microzonation study ^33
• Time zones in Australia ^35Australian earthquake focal mechanisms ^35
• Principal world earthquakes, 1990 ^35Monitoring of nuclear explosions ^37
• References ^37Appendix: Modified Mercalli Scale ^57
• Tables• 1 Australian region earthquakes, 1990, ML>2.9: hypocentral parameters^ 41
•2 Large or damaging Australian earthquakes, 1873 - 1990 ^ 443 Australian seismographic stations, 1990 ^ 454 Earthquake focal parameters: Meckering WA^ 47
• 5 Australian accelerographs, 1990 ^ 486 Australian strong motion data, 1990 ^ 50
• 7 Principal world earthquakes, 1990 ^ 528 Nuclear explosions, 1990 ^ 56
• 9 Yield vs magnitude for nuclear explosions ^ 56
• Figures
•Epicentre Maps
1^Australian region earthquakes, 1788 - 1989, ML 4.0 ^22^Australian region earthquakes, 1990, ML > 4.0 ^4
O 3 Western Australian earthquakes, 1990, ML ?_ 2.5 ^63b SouthWest Seismic Zone activity, 1990, ^7
• 4 Northern Territory earthquakes, 1990, ML 2.5 ^85^South Australian earthquakes, 1990, ML > 2.5 ^9
• 6 Victorian & Tasmanian earthquakes, 1990, ML 2.5 ^ 107 New South Wales and ACT earthquakes, 1990, ML > _>. 2.5 ^ 11
• 8 Queensland earthquakes, 1990, ML > 2.5^ 12
Isoseismal Maps• 9 Meckering WA, 17 January ^ 17
10 Beachport SA, 26 January ^ 18• 11 Beachport SA, 21 February ^ 19
12 Terowie SA, 5 March ^ 20O 13 Penola SA, 8 March ^ 21
14 Bega NSW, 1 April ^ 22
•15 Montague Is NSW, 4 May ^ 2316^Innisfail Qld, 13 May ^ 2417^Rubyvale Qld, 9 June ^ 25
• 18 Clare SA, 11 June ^ 2619 Laura SA, 13 June ^ 27
• 20 Warramboo SA, 5 October ^ 28
• 21a,b Calibration curves, Western Australian Network stations ^ 30,3121c Calibration curves, Eastern Australian Network stations^ 32
• 22 Accelerogram of the Meckering earthquake, 17 January 1990 ^ 3423 Earthquake focal mechanism ^ 36
III^24 Principal world earthquakes, 1990 ^ 3625^Nuclear tests, 1988-1990 ^ 38
•••
••••••• SUMMARY0
The year was an average one as measured by the size and frequency of Australian• earthquakes. The largest earthquake was near Meckering WA on 17 January, just 3
weeks after the similar sized earthquake near Newcastle NSW which was so• destructive. Only minor damage was caused in Meckering, a tribute to both the post-
1968 Meckering earthquake building code for domestic construction written by the WA• Local Government, and the building quality and workmanship used in the town's
reconstruction.• Twelve earthquakes were felt widely enough that intensity questionnaires were
distributed and isoseismal maps compiled. Of these, one was at Meckering WA, seven• occurred in South Australia, four in the South-east, two in the mid-north and another
on Eyre Peninsula, and the others were at Innisfail and Rubyvale Qld, and Montague Is• and Bega in NSW. Only the Meckering earthquake caused damage.
Seven accelerograms were obtained during the Meckering earthquake, from• Cadoux in the north to Canning Dam in the south over the distance range 75 to 110 km.
Other important accelerograms were recorded at Newcastle and Oolong NSW from• small close earthquakes, the recorded acceleration in the epicentral region near Oolong
exceeded 0.3g.• During 1990, 16 presumed underground nuclear explosions were detonated. This
compares with 26 in 1989 and 38 in 1988.•
•
•••••••••••••• vii•

••411^INTRODUCTION
• This report contains information on earthquakes of Richter magnitude 3 or greater thatwere reported in the Australian region during 1990. It is the eleventh of an annual
• series compiled by the Australian Geological Survey Organisation, using data fromAGSO and various seismological agencies in Australia. Its purposes are to aid the
• study of earthquake risk in Australia, and to provide information on Australian andworld earthquakes for scientists, engineers and the general public.
• The report has six main sections: Australian region earthquakes, whichcontains a summary of the 1990 seismicity, a State by State breakdown and a brief
• descriptions of the more important earthquakes; Isoseismal maps, describing thosethat were widely felt; Network operations, which gives details of the seismographs
• that operated in Australia during the year; Accelerograph data, which tabulatesrecordings from the accelerograph network; Principal world earthquakes, which
• lists the largest and most damaging earthquakes that took place world-wide during1990; and Monitoring of nuclear explosions, which describes the operation of
• the Nuclear Monitoring Section and lists 'mown underground nuclear explosions.In the report we refer to the magnitude of an earthquake and intensity caused
• by an earthquake. These terms are defined below.
• Magnitude• The magnitude of an earthquake is a measure of its size and is related to the energy• released at its focus. It is calculated from the amplitude and period of seismic waves
recorded on seismograms. The magnitude scale is logarithmic: a magnitude 6• earthquake produces ground amplitudes 10 times as large, and an energy release about
30 times as large, as a magnitude 5 earthquake.• A rule of thumb relation between magnitude M and energy E ( joules) is
log E = 4.8 + 1.5M• A shock of magnitude 2 is the smallest normally felt by humans, whereas
earthquakes of magnitude 5 or more can cause significant damage if they are shallow• and close to buildings. Great, major, large, and moderate are terms used to describe
earthquakes above magnitude 8, 7, 6 and 5 respectively whilst small and micro-• earthquake are for magnitudes below 4 and 3 respectively. The following magnitude
scales are in common use.•
Richter magnitude (ML)• Richter (1958) defined a scale to determine the relative size of local earthquakes in• California
ML = log A — log A 0• where A is the maximum trace amplitude (zero-to-peak) in millimetres on a standard
Wood-Anderson seismogram, and A 0 is the attenuation of amplitude with distance out• to 600 km. In California, Richter's reference earthquake, magnitude ML 3.0, causes a
trace amplitude of 1 mm on the Wood-Anderson seismogram, 100 km from the• epicentre.
If standard, horizontal Wood-Anderson instruments (Anderson & Wood,• 1925) are not available, an equivalent Richter magnitude can be determined by
correcting for the difference in magnification (see Willmore, 1979, para. 3.1.1)• between the seismometer used and the Wood-Anderson, and for a seismometer
mounted vertically, rather than horizontally. Allowance must also be made for• differences in attenuation from that in California.
••• 1•

•I*I•• • .• 1ii.. •^..
^
. • e 1^• ix Townsville
^
I^••
•ro^•
•• ••
• C^• •^it
• 1#^I• I
• i • ••
. c MtelSa•
•
T••
c Alice Springs 1•
^
I^••^•^I^• •I di
• 5p - — 1—ef-- -•• toe• e•^1• 0 .•^ •I^ •• ,^• ••^•^■•
• •• •, 0
^4^I ■ •
^
1^•^• i• r^• -/ --Kalgoorli ^• *eq. • • •• .^•b• •^ ;Is l • DBroken Hill •^•^•
• • .
G . el,* ••^I^• •I's ••^•^ • *^• Newcastle
•
*ADELAIDE \--\ • • S ir. •dirroi;77),DNEy• , • Wollongong
• • •11^. —^CANBERRAI •MELBOURNE •
24°—
500 km
MAGNITUDE Data 1973-1990
4.0 < 5.0 5.0 — 5_9 >5.9 DEPTH (km)
• •^•^0-69^4 ^6^
•^
70-299
• >299—moo— Bethyrnemc contour (ml
108°^ 1200^ 132°
•
144
• SO
••
••
Figure 1 Epicentres of Australian earthquakes, 1873-1990, magnitude ML ?_ 4.0.
•••
2^ •
•

•
•
• Surface-wave magnitude (Ms)
• The surface-wave magnitude was originally defined for shallow earthquakes in thedistance range 20-160 0, and in the period range T = 17-23 s. When these conditions
• hold, Ms values are calculated from the 1967 IASPEI formula (see Bath, 1981)Ms = log AlT + 1.66/0g/A + 3.3
• where A is the ground amplitude in micrometers (10 m), T is in seconds andA is theepicentral distance in degrees. Marshall & Basham (1973) extended this formula to
• distances as close as 1 °, and periods as short as 10 s.
• Body-wave magnitude (mb)
• For deeper earthquakes with negligible surface waves, or shallow earthquakes outsidethe distance range defined for ML or Ms, Gutenberg (1945) defined a body-wave scale
• mb = log AIT + Q (8 , h)where A is the maximum mean-to-peak ground amplitude in microns of the P, PP, or
• S-wave train, T is the corresponding wave-period (seconds), and Q is a function offocal depth h and distance A. The Q factors were derived by Gutenberg (1945) and
• are listed in Richter (1958). This definition was subsequently modified to limit theamplitude measurement to the first 20 s of the P or S phase for moderate sized
• earthquakes and the first 60 s for large earthquakes.
• Duration magnitude (MD)
• When an earthquake is close to the seismograph, the wave amplitude on theseismogram may be clipped, in which case no measure of magnitude is possible. To
• counteract this, another scale was devised (Bisztricsany, 1958), based on the recordedduration of the seismic wave train on short-period seismograms
• MD=alogt +b,d+cwhere t is the length of the earthquake coda in seconds (usually from the initial P
• onset), A is the distance from the epicentre, and a, b, and c are constants for aparticular recording station. Many other forms of this equation have been used.
Seismic moment magnitude (Mw)•
Kanamori (1978) defined another magnitude scale from the seismic moment M• Mw =(logM o ) / 1.5 — 6.0
and Mo = p A dwhere pt is the rigidity of the bedrock, A the fault surface area displaced, and d theaverage displacement on that surface. M o is proportional to the amplitude of the far-
• field displacement waveform at low frequencies. Bolt & Herraiz (1983) suggested away of computing the seismic moment (N-m) from Wood-Anderson seismographs
•^ log Mo = 9.74 +1.22 log (CDE)where C is the maximum peak-to-peak amplitude in mm,D the duration in seconds
• from the S-wave onset to the last point where the peak-to-peak amplitude exceeds C /3and E is the epicentral distance in kilometres.
•Magnitude from isoseismals•
• In some cases, where reliable magnitudes or moments cannot be determined fromseismograms, it is possible to estimate magnitudes from macroseismic data. In this
• report, the formula of McCue (1980) is usedM(Rp) = 1.011n(Rp ) + 0.13
•
•
•
• 3•
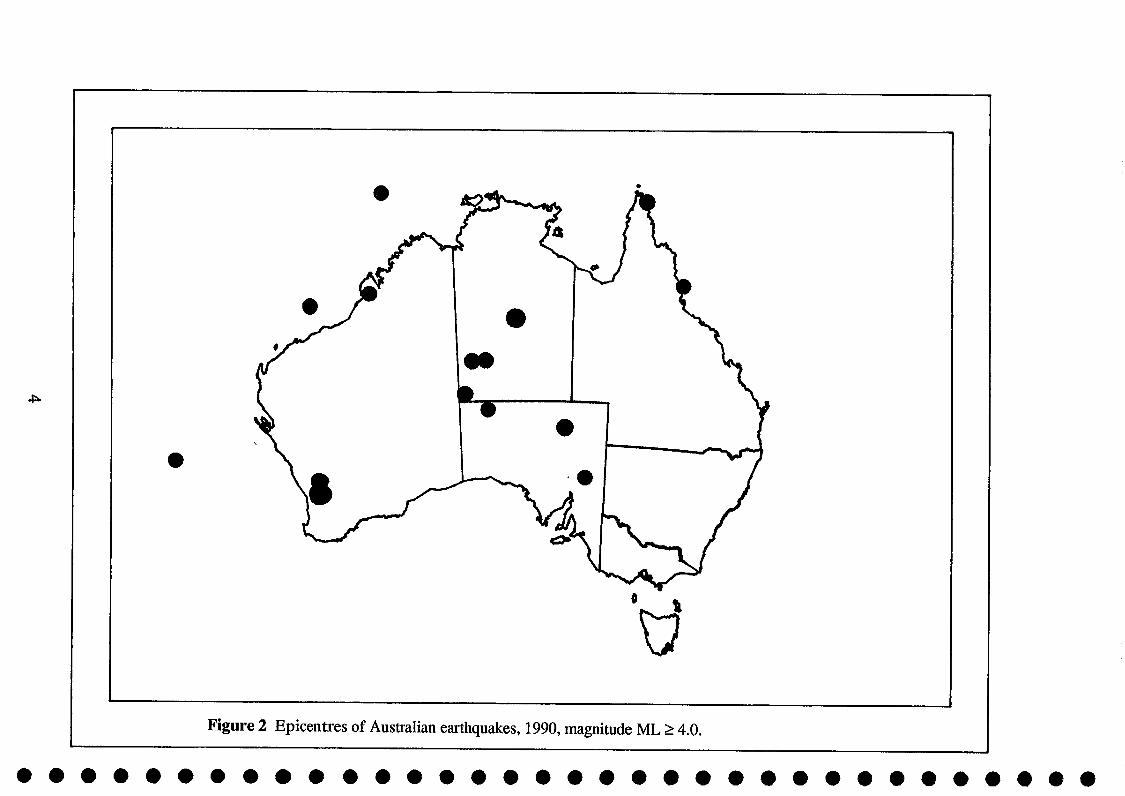
Figure 2 Epicentres of Australian earthquakes, 1990, magnitude ML 4.0.
.P..
• • • • • • • • • • • • • • • • • • • • • • • • • • • • • • • • • •
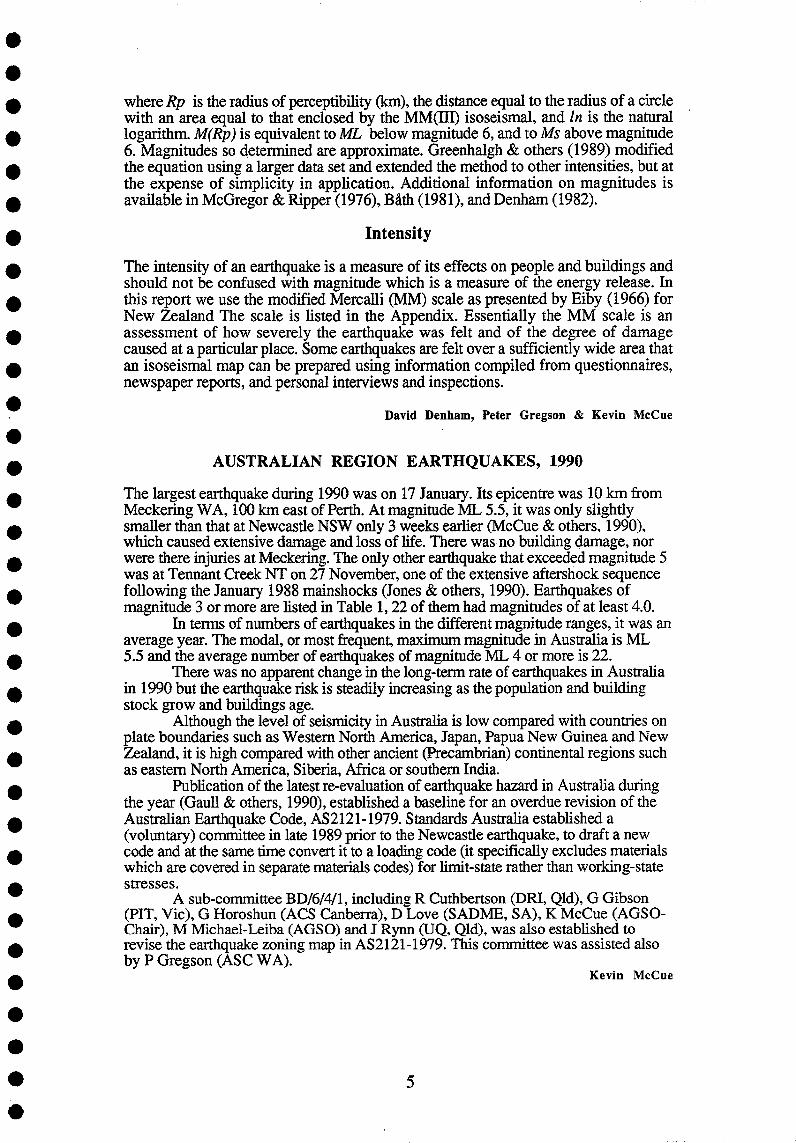
where Rp is the radius of perceptibility (km), the distance equal to the radius of a circlewith an area equal to that enclosed by the MM(Ill) isoseismal, and In is the naturallogarithm. M(Rp) is equivalent to ML below magnitude 6, and to Ms above magnitude6. Magnitudes so determined are approximate. Greenhalgh & others (1989) modifiedthe equation using a larger data set and extended the method to other intensities, but atthe expense of simplicity in application. Additional information on magnitudes isavailable in McGregor & Ripper (1976), Bath (1981), and Denham (1982).
Intensity
The intensity of an earthquake is a measure of its effects on people and buildings andshould not be confused with magnitude which is a measure of the energy release. Inthis report we use the modified Mercalli (MM) scale as presented by Eiby (1966) forNew Zealand The scale is listed in the Appendix. Essentially the MM scale is anassessment of how severely the earthquake was felt and of the degree of damagecaused at a particular place. Some earthquakes are felt over a sufficiently wide area thatan isoseismal map can be prepared using information compiled from questionnaires,newspaper reports, and personal interviews and inspections.•^David Denham, Peter Gregson & Kevin McCue
AUSTRALIAN REGION EARTHQUAKES, 1990
The largest earthquake during 1990 was on 17 January. Its epicentre was 10 km fromMeckering WA, 100 km east of Perth. At magnitude ML 5.5, it was only slightlysmaller than that at Newcastle NSW only 3 weeks earlier (McCue & others, 1990),which caused extensive damage and loss of life. There was no building damage, norwere there injuries at Meckering. The only other earthquake that exceeded magnitude 5was at Tennant Creek NT on 27 November, one of the extensive aftershock sequencefollowing the January 1988 mainshocks (Jones & others, 1990). Earthquakes ofmagnitude 3 or more are listed in Table 1,22 of them had magnitudes of at least 4.0.
In terms of numbers of earthquakes in the different magnitude ranges, it was anaverage year. The modal, or most frequent, maximum magnitude in Australia is ML5.5 and the average number of earthquakes of magnitude ML 4 or more is 22.
There was no apparent change in the long-term rate of earthquakes in Australiain 1990 but the earthquake risk is steadily increasing as the population and buildingstock grow and buildings age.
Although the level of seismicity in Australia is low compared with countries onplate boundaries such as Western North America, Japan, Papua New Guinea and NewZealand, it is high compared with other ancient (Precambrian) continental regions suchas eastern North America, Siberia, Africa or southern India.
Publication of the latest re-evaluation of earthquake hazard in Australia duringthe year (Gaull & others, 1990), established a baseline for an overdue revision of theAustralian Earthquake Code, AS2121-1979. Standards Australia established a(voluntary) committee in late 1989 prior to the Newcastle earthquake, to draft a newcode and at the same time convert it to a loading code (it specifically excludes materialswhich are covered in separate materials codes) for limit-state rather than working-statestresses.
A sub-committee BD/6/4/1, including R Cuthbertson (DRI, Qld), G Gibson(PIT, Vic), G Horoshun (ACS Canberra), D Love (SADME, SA), K McCue (AGS0-Chair), M Michael-Leiba (AGSO) and J Rynn (UQ, Qld), was also established torevise the earthquake zoning map in AS2121-1979. This committee was assisted alsoby P Gregson (ASC WA).
Kevin McCue
•^ 5
• •
£12^US^120^124
1_
•ANIL
.6,NAu
X
•
Z•
Asko •r--•tu
X
•V •X
1
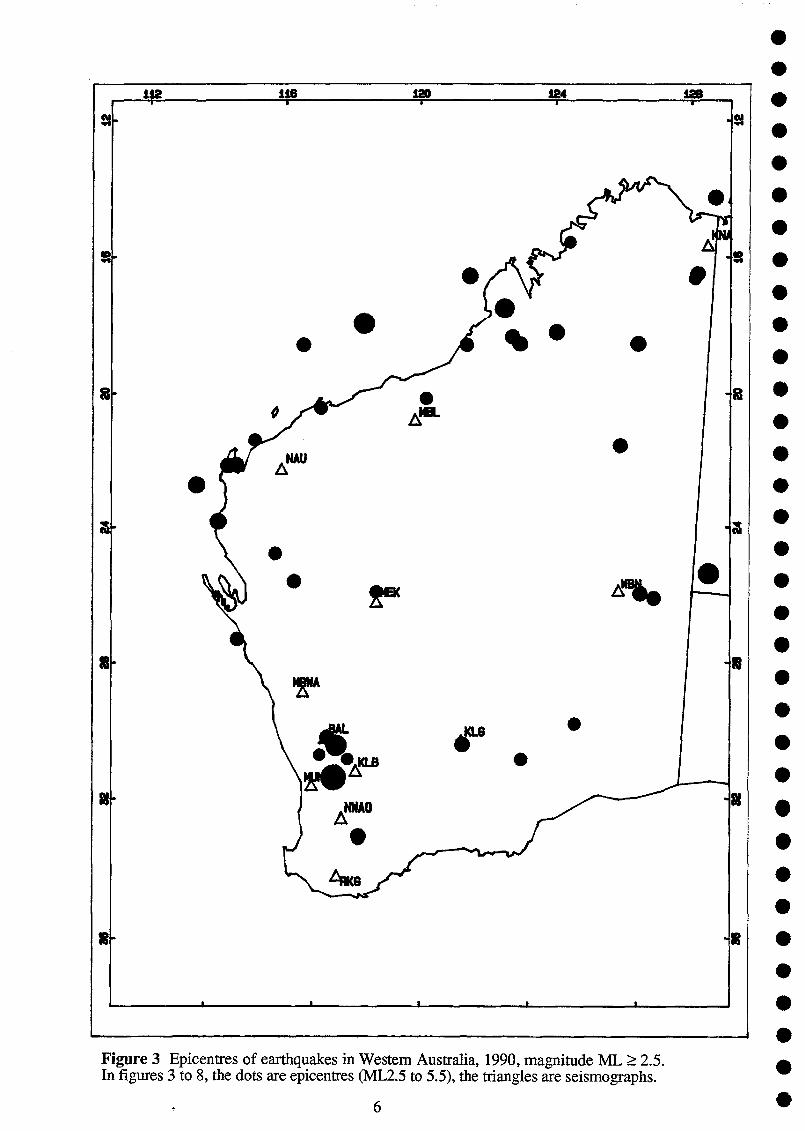
Figure 3 Epicentres of earthquakes in Western Australia, 1990, magnitude ML .. 2.5.In figures 3 to 8, the dots are epicentres (ML2.5 to 5.5), the triangles are seismographs.
6

115 118 117 118
0
NWA0 0
30
33
34
95
31
32
30
31
32
33
34
35
SWSZ EARTHQUAKES 1990
0BA LA*
Cadoux0
0
p Marred!Mocker ing
MUNA
0
p Bridgetown0
Augusta0
ARKG
o
Brooktonop
p Wag in
Figure 3b Epicentres of earthquakes in Southwest WA, 1990.7

Figure 4 Epicentres of earthquakes in the Northern Territory, 1990, magnitude ML .. 2.5.8

Figure 5 Epicentres of earthquakes in South Australia, 1990, magnitude ML __ 2.5.9
0I
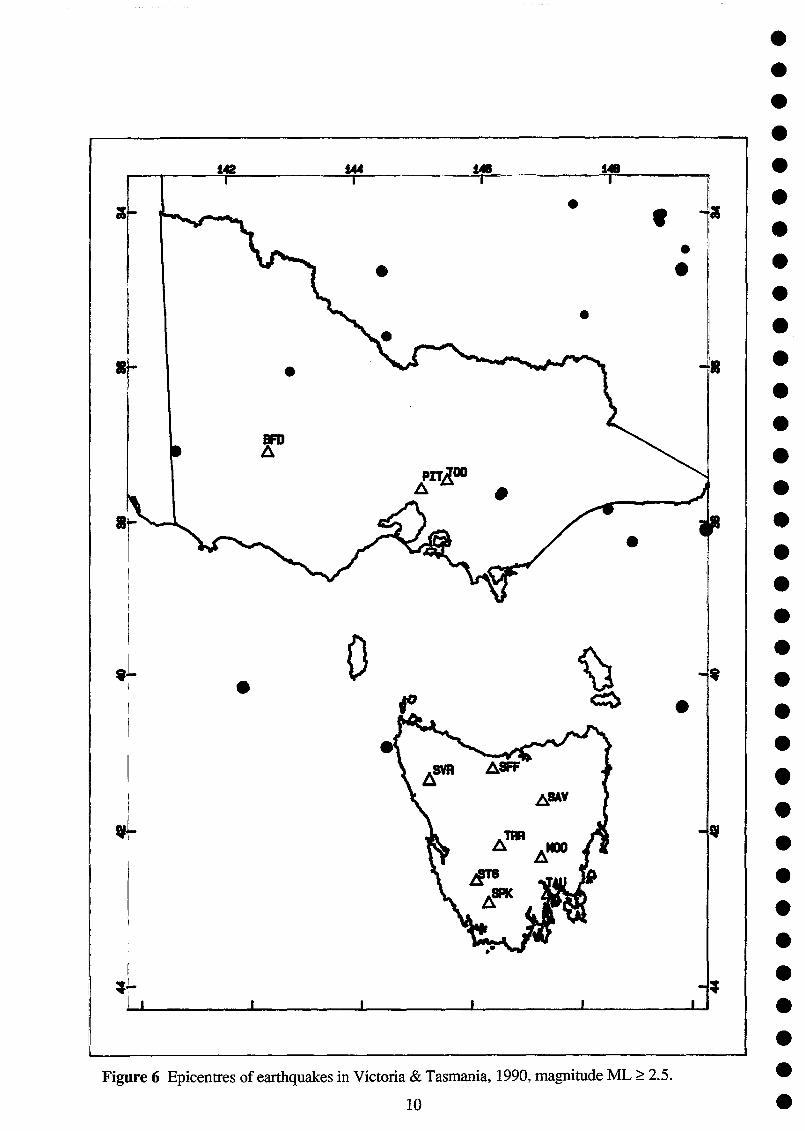
Figure 6 Epicentres of earthquakes in Victoria & Tasmania, 1990, magnitude ML 2.5.
10

SI
le
• • • • • • • • • • • • • • • • • • • • • • • 0 • • • • • • • • • •
Iwo*
Figure 7 Epicentres of earthquakes in New South Wales 1990, magnitude ML 2.5.
140 150145
150140 145
acm-
-
In-
-
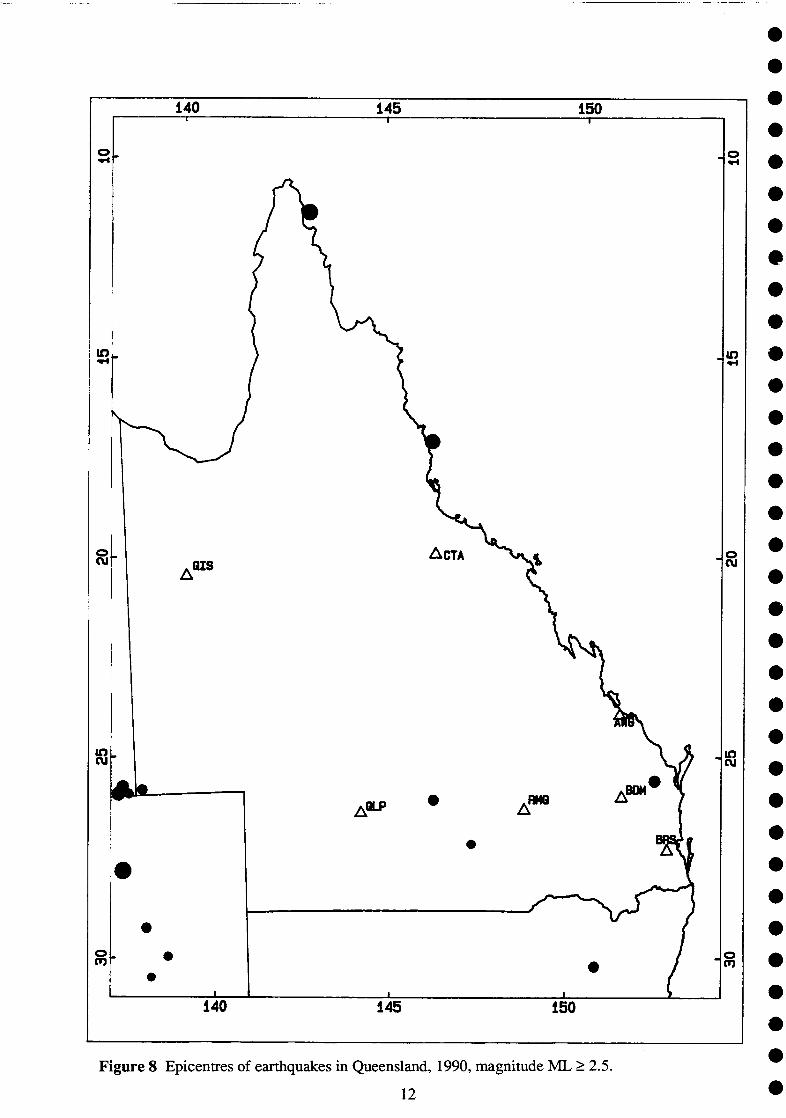
Figure 8 Epicentres of earthquakes in Queensland, 1990, magnitude ML 2.5.
12
Western Australia (Figure 3)
Five earthquakes of magnitude ML 4 or greater occurred in Western Australia, the samenumber as in 1989.
The largest ML 5.5, occurred on 17 January, 10 km south of Meckering. TheISC rated its magnitude as Mb 5.2 and listed 80 stations which reported the event. Bycomparison, the ISC gave the 1989 Newcastle NSW earthquake a magnitude of Mb 5.4and and it was reported by 253 stations worldwide. The 1990 Meckering earthquakewas obviously the smaller of the two.
Of the 138 earthquakes recorded in WA, the majority occurred within or closeto previously defined zones. The notable exception was a magnitude 2.9 earthquakeoffshore and about 150 km north of Geraldton on 28 May. This is in the same area as agroup of offshore earthquakes between Geraldton and Shark Bay between 1987 and1989 (Gregson, 1991).
Magnitude 4 or greater earthquakes outside the South-West Seismic Zoneoccurred 230 km N of Port Hedland (ML 4.5) on 18 February; 45 km NE of Broome(ML 4.2) on 17 August and 900 km W of Dongara (ML 4.1) on 9 May.
Seventy-eight earthquakes were located in the South-West Seismic Zone,compared with 62 in 1989. The most significant activity occurred near Meckering (14events) where the largest earthquake was recorded. Other areas of activity were Cadoux(10); Ballidu (23); Wyalkatchem (6) and Dumbleyung (6). Minor activity occurred nearBencubbin (3); Calingiri (2); Gnowangerup (10); Brookton (7); Corrigin (8); Nyabing(9); Quairading (5); Bolgart (1); Beverley (6); Kellerberrin (4) and Newdegate (11).
An isoseismal map was prepared for the Meckering earthquake.
Northern Territory (Figure 4)
Aftershock activity continued throughout the year at Tennant Creek with the largestevent, magnitude ML 5.2, on 27 November. Apart from a single small earthquake eastof Darwin, the remaining seismicity was in the southwest and in the Simpson Desert inthe southeast overlapping the South Australian and Queensland borders.
South Australia (Figure 5)
During 1990 about 300 earthquakes were located in South Australia by the Sutton Institute,SADME. This was down on the unusually high 380 the previous year, but the number ofevents over magnitude 3 doubled, resulting in 7 isoseismal maps. Most activity was again inthe Hinders Ranges but there were interesting events in many other areas as well, giving agreater spread of epicentres than usual. There were a number of aftershocks to the Beachport(8 Nov 1989) event in the South East of the state, two events in the far north-west (largestML- 4.1 near Amata but not felt) and the largest event of ML 4.5 was at the top of Lake Eyre(also not felt). There were more events than usual in the Simpson Desert and also aroundCleve on Eyre Peninsula. There was an interesting swarm of earthquakes on the eastern edgeof the Hinders Ranges near Peterborough, with nine events between magnitude ML 2 and 3.
The first 4 digital seismographs were installed during 1990, with a number of otheranalogue stations being opened, moved or closed. The additions to the network in the South-East of the State were as a result of a grant to study any correlation with oil strandings thatoccur regularly on the beaches, in the hope of finding an economic oil field.
Victoria & Tasmania (Figure 6)
Over 350 earthquakes were located within Victoria in 1990, but only fourteen of theseevents were reported felt.
On 25 January at 13:33 UTC an earthquake of magnitude ML 2.9 occurred inEast Bass Strait some 24 kilometres east of the Marlin oil rig. The event was feltbetween Mario and Cape Conran. One week after the event an oil slick was washed upon the Ninety Mile Beach, possibly related to this earthquake.
•
13
••Between 08:38 EDST on 12 March and 07:17 EDST on 13 March, a total of six^•
separate events were felt southwest of the town of Maldon in central Victoria, just eastof Cairn Curran Reservoir. The largest of these had a magnitude of ML 2.3, and was^•felt strongly at the property of Mr Michael Coles near Welshmans Reef, but did notcause any damage. Events as small as ML 0.3 were also felt on the property, so they^•must have been very shallow and not more than one or two kilometres away.
On 20 March at 07:36 UTC an earthquake of magnitude ML 2.4 occurred near^•Officer, 48 kilometres south east of Melbourne. This event was felt by many peoplebetween Pakenham and Narre Warren, especially about Berwick. No damage was^•reported.
On 22 April two separate events of magnitude ML 2.5 and ML 1.6 were felt at^•16:59 UTC and 21:03 UTC respectively in the town of Glenloth, near Wedderburn.The first of these was of sufficient intensity to wake people from their sleep and to rattle^•windows. The second, though smaller, was also widely felt. No damage wasreported.^ •
A swarm of five separate events occurred at Digby 50 km west of Hamilton on5 May. Two of these were at 09:59 UTC while the rest occurred at 10:00, 10:12, and10:17 UTC. They ranged in magnitude from ML 2.3 down to ML 1.0. A resident ofRifle Downs just west of Digby felt three of these events, but no damage was reported.^•
At 02:22 UTC on 11 May an earthquake of magnitude ML 3.0 occurred atThomson Reservoir, followed by four smaller aftershocks between 02:41 UTC and^•03:34 UTC. These were reservoir induced earthquakes, and were very shallow,occurring at a depth of about 2.5 km. The ML 3.0 event was the largest reservoir^•induced earthquake experienced in Victoria. It was felt by MMBW staff working atBell's Portal who were within one kilometre of the epicentre, but no damage was^•caused. Another similar event of magnitude ML 3.0 occurred at Thomson Reservoir on19 May at 17:09 UTC, but was not felt as it occurred in the middle of the night.^•
In Tasmania, magnitude ML 3.6 earthquakes occurred in the east and westTasman Sea Seismic Zones and a magnitude ML 3.3 earthquakes was centred in theOtway Basin off the northwest coast of Tasmania. A magnitude ML 3.5 earthquakewas detected in an unusual location west of King Island on 27 November.^ •
New South Wales and ACT (Figure 7)^ •
Most of the earthquakes were in the southeast of NSW, in an area stretching from^•Newcastle west to Parkes and south to Bega. Six of the eight ML 3 or greater earth-quakes were in this quadrant as was the largest, ML 3.5, at Oolong on 13 January.Isoseismal maps were drawn for small earthquakes at Bega on 1 April and MontagueIsland on 4 May following intense interest from the affected communities and the^•media.
A single small earthquake was felt at Cessnock, 30 km west of Newcastle on 23^•February. It was apparently shallow and is not considered to be an aftershock of theDecember 1989 Newcastle earthquake.^ •
Queensland (Figure 8)^ •
Innisfail and Cape York were the epicentral regions of the 2 earthquakes that were of^•magnitude ML 4 or more in Queensland. The offshore magnitude ML 4.2 earthquakeon 20 July was felt in Innisfail with an intensity of MM IV but there were no reports^11,that the larger ML 4.5 earthquake on 9 June near the site of the proposed spaceport onYork Peninsula was felt. Only three other small events could be located, all in the south^•of the State but none of these excited sufficient interest to distribute questionnaires.
•Kevin McCue, Peter Gregson, David Love, Gary Gibson & Wayne Peck
•
1 4^ •

•• ISOSEISMAL MAPS
• There were 12 earthquakes either important enough or widely felt, that warrantedfurther investigation or the distribution of questionnaires. Apart from the ML 5.5
• Meckering WA earthquake on 17 January, the other earthquakes studied were all small.Details of the earthquakes and maps are discussed below.
Meckering WA, 17 January (Figure 9)•
An earthquake occurred 10 km south of Meckering (100 km east of Perth) at 2.38 p.m.• WST (Gregson, 1992; Dent, 1990). This was the largest earthquake in the Meckering
area since 14 October 1968 when a magnitude Ms 6.9 earthquake destroyed the• townsite. An aftershock of magnitude ML 5.7 occurred several hours after the 1968
mainshock (Everingham & others, 1982).• Isolated reports of MM VI were received from near the epicentre of the 1990
earthquake. It was felt strongly at Meckering (MM V) with reports of crockery and• other items being thrown from shelves. In Northam the earthquake was reported as
'sounding like an explosion then violent shaking of buildings and extreme noise'.• There were no reports of structural damage and no injuries. The effects of the
earthquake were felt throughout the Perth Metropolitan area and over an area of• 200 000 km2 at distances of 280 km from the epicentre. The mean radius of the IV and
ifi isoseismals were 180 and 270 km respectively.• M(Rp) was calculated as 5.6 which is consistent with the Richter magnitude of
ML 5.5. Most of the intensities reported from Perth were consistent with MM IV which• is the same intensity as at towns on the Yilgarn block at a similar distance.
Only four aftershocks were recorded, ranging from MI. 2 to 2.3, and all of• them were within 2 days of the main earthquake.
• Beachport SA, 26 January (Figure 10)
• This ML 3.7 event at 9:55 am on Saturday 27 January (local time) was a small reminderof the ML 3.9 earthquake in November the previous year. Most people commented that
• the effects were much less. A portable digital recorder near Southend produced the firstdigital seismogram in the State. The data was used to compute a more accurate epicentre
• location, which turned out to be offshore as previously suspected. Isoseismal lineswere somewhat difficult to draw.
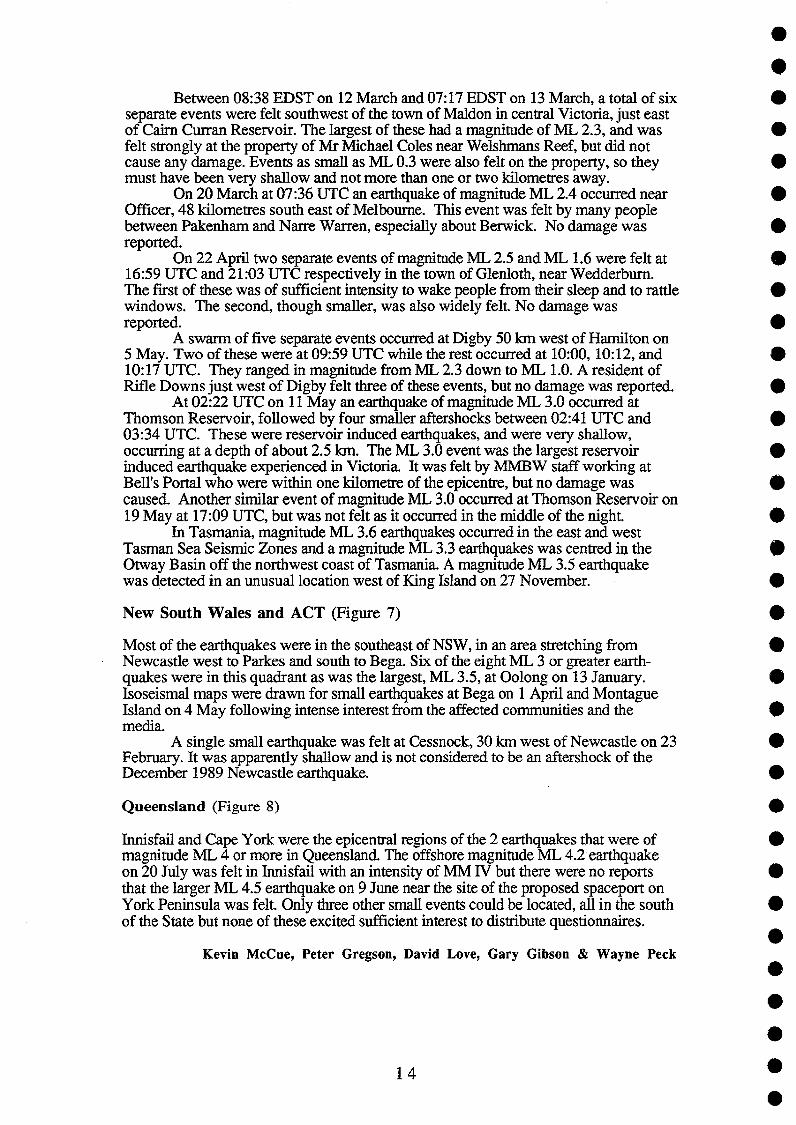
•Beachport SA, 21 February (Figure 11)
•This ML 3.4 event at 3:20pm was the last felt in the sequence of aftershocks from the
• November 1989 shock. It was not felt widely, but the reports suggested that this onemay have been a little closer to shore.
•Terowie SA, 5 March (Figure 12)
•From 4- 10 March 1990, the Peterborough - Terowie area was hit by a swarm of
• earthquakes. Nine had magnitudes over ML 2 with the two largest being magnitude ML3.0 about 1 minute apart on 5 March at 5:25pm.
• There were 69 questionnaires distributed and the map was produced from 39replies. Most respondents noted a number of the events, and particularly noted the
• noises which varied from loud cracks to rumbling with some people regularly hearingboth P and S arrivals.
•Penola SA, 8 March (Figure 13)
•At 8:27 pm on Thursday 8 March an earthquake of magnitude ML3.0 occurred south of
•
•
• 15•

Naracoorte and Penola. It was felt over a wide area with no clear centre of highintensity. The map was produced from questionnaires and a few phone calls.
The event was well recorded on the newly installed digital instrument nearNaracoorte, which was the first digital to be permanently installed in the State.
The location of this event was originally assumed to be Peterborough a fewhundred kilometres north, as it occurred in the middle of a swarm of events there.
Sega NSW, 1 April (Figure 14)
The Bega District News of Tuesday 3 April 1990 headed its front page story with:Not an explosion, not a crash, not something falling on the roof
Earthquake rocks BegaThe story included the following extracts:
The first reaction of most residents to the earthquake was that a truck orsemi-trailer had either hit the house or crashed nearby.Others thought it was an explosion of some sort, gas or petrol, or that abomb had gone off.Residents have reported the whole house shaking, while others only felttremors.The loud bang heard elsewhere was not reported in Bermagui.Police were inundated with calls.No damage was reported but in Merimbula and Pambula objects fell fromshelves.
Most of the reports from which this isoseismal map was drawn were from letters fromresidents responding to a request for information carried by the local newspaper. Theone surprising report was from Mallacoota, a Victorian coastal town some 10 km fromthe NSW border and more than 100 km from the epicentre of this ML 3.4 earthquake.
An isoseismal maps was drawn for a previous earthquake in the area on 13 June1987 (ML 2.6).
Montague Is NSW, 4 May (Figure 15)
This small earthquake 10 km southeast of Montague Island was felt along the coastalstrip from Moruya to Bega NSW. The epicentre is poorly constrained but felt reportsare consistent with the computed location. Questionnaires were not distributed, thereports were obtained by phone and from the local media.
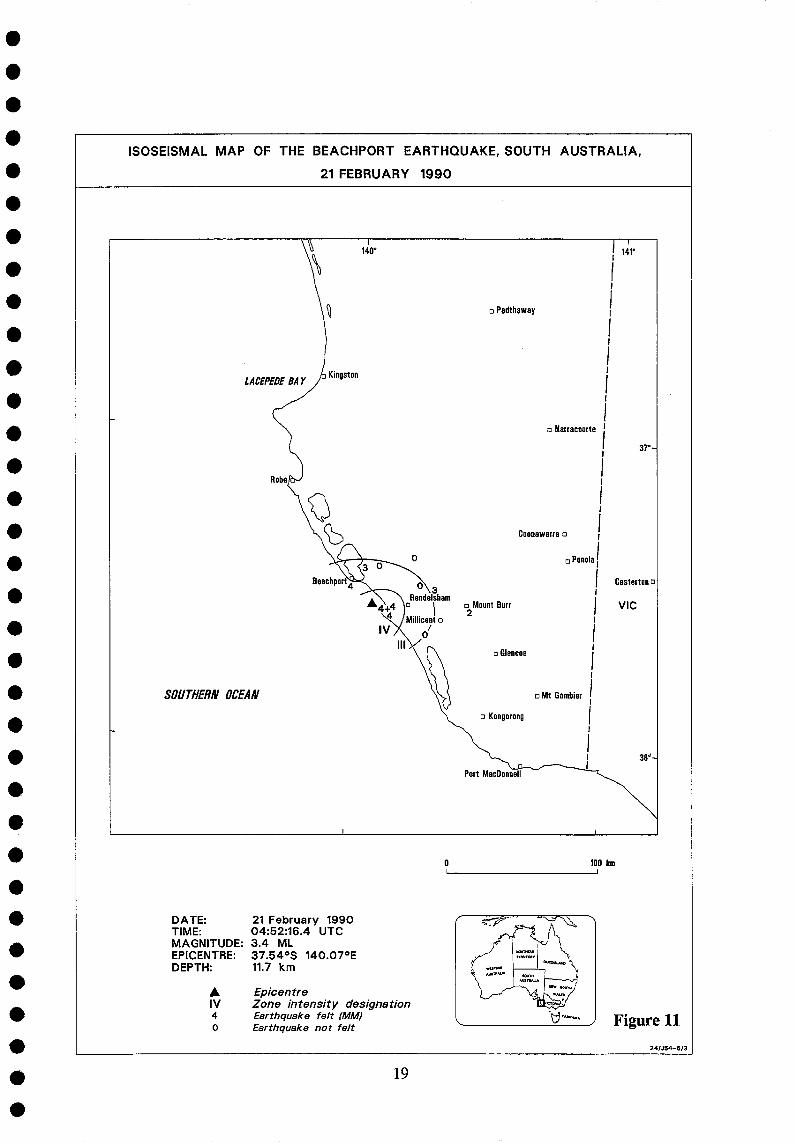
Innisfail Qld, 13 May (Figure 16)
On 13 May at 3:30 pm (AEST) an earthquake was felt in the Innisfail region. A surveyof the felt effects was conducted by Department of Minerals and Energy seismologistsand several Queensland Electricity Commission personnel in Ravenshoe. This ML 4.5event was located offshore, in the same area as a magnitude ML 4.0 earthquake on 16November last year. The offshore location limited the area over which the earthquakewas felt to 2000 km2. No damage was reported and the maximum assessed intensitywas MM IV.
Over 60 aftershocks were recorded on the nearby Tully-Millstream networkover the next 2 years. An aftershock on 15 August 1990 (ML 2.6) was felt by severalpeople at Flying Fish Point near Innisfail.
Rubyvale Qld, 9 June (Figure 17)
This ML 2.9 earthquake was felt in the gemfields of Rubyvale and Sapphire, 50 kmwest of Emerald in Central Queensland. The event was felt underground in the mines
16

•Iv4
0
Figure 9
DATETIME:MAGNITUDEEPICENTREDEPTH:
/ 7 January 199006: 38 : 08 UTC
: 5.5 ML (M UN)31.70°S, 117.00°E6 km
EpicentreZone Intensity DesignationEarthquake Felt (MM)Earthquake Not Felt
200 km 17
ISOSEISMAL MAP OF THE MECKERING EARTHQUAKE,WESTERN AUSTRALIA, 17 JANUARY 1990
24/WA/88

18 •
ISOSEISMAL MAP OF THE BEACHPORT EARTHQUAKE SOUTH AUSTRALIA26 JANUARY 1990
10
241.154-6/2
.LACEPEDE BAY
_
Robe .o
SOUTHERN OCEAN
_
1140°
Kingston
"ay
li^1411°
II
Io Padthaway^I
II
II
I1
I^o Narracoorte^I
I^37°—1
IiIsiCoonawarra o^1
0 Penola i
^
I^Casterton oI
o Mount Burr^I^VIC000 Millicent^ 1
0^ Io Glencoe^
I
II
^0 Mt Gambier^II
o Kongorong^II
I
^
I^38°—
Port Mactionnell
I
BeachportNMI o
3 23 o3 Rendelsham
• 0044+
IVIII
I
DATE:^26 January 1990TIME:^23:25:11.9 UTCMAGNITUDE: 3.7 MLEPICENTRE:^37.55°S 139.99°EDEPTH:
•
3.8 km
EpicentreIV^Zone intensity designation4^Earthquake felt (MM)0^Earthquake not felt
01^100 km
Figure
- ,-
4'i."
••••••••
•••••••
141°
3r -
LACEPEDE BAYKingston
140°
Robe
I
1
iI
o Padthaway^
II
II
II
II
ia Narracoarte 1
II
II
II
Coonawarra a^II
a Penole 1
I Casterton aII^VICI
II
o Mount Burr2
a Glencoe
SOUTHERN OCEAN
1
ISOSEISMAL MAP OF THE BEACHPORT EARTHQUAKE, SOUTH AUSTRALIA,21 FEBRUARY 1990
100 km
DATE:^21 February 1990
TIME:^04:52:16.4 UTC
MAGNITUDE: 3.4 MLEPICENTRE: 37.54°S 140.07°EDEPTH:^
11.7 km
•^EpicentreIV^Zone intensity designation4^Earthquake felt (MM)o^Earthquake not felt Figure 11
24/J54-6/3
19

•
•••
ISOSEISMAL MAP OF THE TEROWIE EARTHQUAKE, SOUTH AUSTRALIA
5 MARCH 1990
12
24/SA159
o Doom
—
o Port Pine
1139°
0
(^14
Peterborough cl4^5-
3^3+^Ao^3 4^5^5-
3^Terowie^5Jamestown 0
0
V
-
IV Ili
0
0
1140°
33°—
0
I
o Burra
o Clare1
DATE:TIME:MAGNITUDE:EPICENTRE:DEPTH:
AIV40
5 MARCH 199006:55:10.4 UTCML 3.033.07° S, 138,98° E6 km
EpicentreZone intensity designationEarthquake felt (MM)Earthquake not felt
01
50 kmI
Figure
20
•
•
•••••••
••••••••••••
••••

••• 21
ISOSEISMAL MAP OF THE PENOLA EARTHQUAKE,SOUTH AUSTRALIA, 8 MARCH 1990
i140° I^11.'I
3^1I
Cl Padthaway^/
III
. KingstonLACEPEDE BAYI
3
_4 o Nerracoorte^I
3^1^37°—
0 3 IRobe • 3 I
0 I0 IV 1
III
I4^
Coonawarra o^
/ I
34t Penola i
Beachport4 4 A
4+^1^Casterton o
0 0 Fiendelsham oMount Burr^ VICMillicent o
0
o
Nangwarry3o
Glencoe
SOUTHERN OCEAN 0 o Mt Gambier^II
o Kongorong I_ 1II^3& —
PortPort MacDonneli
I I
0 WO km
DATE: 8 March 1990TIME: 09:55:20.6 UTCMAGNITUDE: 3.0 MLEPICENTRE: 37.50°S 140.75°EDEPTH: 14.5 km
• EpicentreIV Zone intensity designation4 Earthquake felt (MM) ' Figure 130 Earthquake not feltF Felt
241.104-6/4
••••••••••••••••••••••••

22 •
•
•
••••
•IV4
0
Figure 14
DATETIMEMAG NITUDEEPICENTREDEPTH
1 April 199012:04:30 UTC
: 3.4 ML (8MR)36.59°S, 149.84°EShallow
EpicentreZone Intensity DesignationEarthquake Felt (MM)Earthquake Not Felt
ISOSEISMAL MAP OF THE BEGA EARTHQUAKE,NEW SOUTH WALES,1 APRIL 1990
60 km
24/N/34

23
Figure 15
DATE:TIMEMAGNITUDE:EPICENTREDEPTH:•
IV4
o
4 May 199012:06:08 UTC3.3 ML(BMR)36.31 °S, 150.36 °E10 km (-±50)
EpicentreZone Intensity DesignationEarthquake Felt (MM)Earthquake Not Felt
ISOSEISMAL MAP OF THE MONTAGUE ISLAND EARTHQUAKE,NEW SOUTH WALES, 4 MAY 1990
?^40km
I
24/N/35
•
•••ISOSEISMAL MAP OF THE INNISFAIL EARTHQUAKE, QUEENSLAND
13 MAY 1990
1624/Q/26
Edmonton
Gordonvale
0 0
o Atherton
a Herberton0
Millaa Millaa 0^3
3^0°
3 _ 2 4'3 00
0^13&Wooroora Dam SiSrP1^0a Cardsione
Nitchaga Dam^Koombooloomba
&
0^ 20 kmi^ 1
033Ravenshoe
a0
a 00^0
0
Babinda a
3
3
III
33
South Johnston
Darn
0
A
1146'
A
a^Bramston Beach44
IV
Inisfail40
334
o
4
30a Silkwood
0
a Elarish3
a Tully
18. —
DATE:^13 MAY 1990TIME:^05:35:24.9 UTCMAGNITUDE:^4.2 ML (GSQ)EPICENTRE:^17.26°S 146.15°EDEPTH:^0 km
• EpicentreIV^Zone intensity designation3^Earthquake felt (MM)0^Earthquake not felt
Figure
24
•••••••••••••
••••••••••••

•
•• 25
ISOSEISMAL MAP OF THE RUBYVALE EARTHQUAKE, QUEENSLAND
9 JUNE 1990
17
24/0/25
114730'
A0
Rubyvale 3 3 33 D 34 3 3
o0
0^Sapphire
Anakie
i14800
I
• Capella
,
1
2300' i
2330' —Emerald
DATE:TIME:MAGNITUDE:EPICENTRE:DEPTH:
•IV30
9 JUNE 199004:06:10.3 UTC2.9 ML (GSQ)23.36°S 147.82°E10 km
EpicentreZone intensity designationEarthquake felt (MM)Earthquake not felt
01
20 kmI
Figure
•••••••••••••••••••••••••••••

26 •
••
ISOSEISMAL MAP OF THE CLARE EARTHQUAKE, SOUTH AUSTRALIA
11 JUNE 1990
01
20 km1
3
0o Spalding
3
0
III
4Dare c^3^3
3-4
Sevenhill o 0
3Auburn o
1136'Hallett o
0
0
0
o Burra
Farrell Flat
3
33' —
o Saddleworth
o Riverton
I
18
24/SA/56
o Snowtown
o Lochiel
—
\o Po rl Wakefield
0Brinkworth o
3
3-4
0 Blyth3
0
o Balaklava
DATE:TIME:MAGNITUDE:EPICENTRE:DEPTH:
•IV30
15:08:04.5 UTC2.7 ML (ADE)33.70°S 138.45°E18 km
EpicentreZone intensity designationEarthquake felt (MM)Earthquake not felt
11 JUNE 1990
Figure
•
•
•
••
•••••••••
•••••
••••

24/SA/57
139°
0 Orroroo
0 , Me lrose
III3
3Peterborough 0
33• —0
0
30 km
ISOSEISMAL MAP OF THE LAURA EARTHQUAKE, SOUTH AUSTRALIA13 JUNE 1990
EpicentreIV^Zone intensity designation4^Earthquake felt (MM)0^Earthquake not felt
DATE:^13 JUNE 1990TIME:^20:23:54.2 UTCMAGNITUDE: 3.0 ML (ADE)EPICENTRE:^33.160°S 138.318°EDEPTH:^14 KM
Figure 19
27

o Yaninee^ 136'
o Pygery
o Wudinna
o Kyanculta
Koongawa
3+^4
3+ o Warramboo4+
3
3+
3
43
o Kopi
McLachlan
o Lock
3
o Cootra
33• —
ISOSEISMAL MAP OF THE WARRAMBOO EARTHQUAKE, SOUTH AUSTRALIA
5 OCTOBER 1990
DATE:^5 October 1990TIME:^22:11:01.3 UTCMAGNITUDE: 2.7 ML (ADE)EPICENTRE:^33.39°S 135.93°EDEPTH:^7 km
•^EpicentreIV^Zone intensity designation3^Earthquake felt (MM)
Earthquake not feltFigure 20
24/SA/58
28
•
•
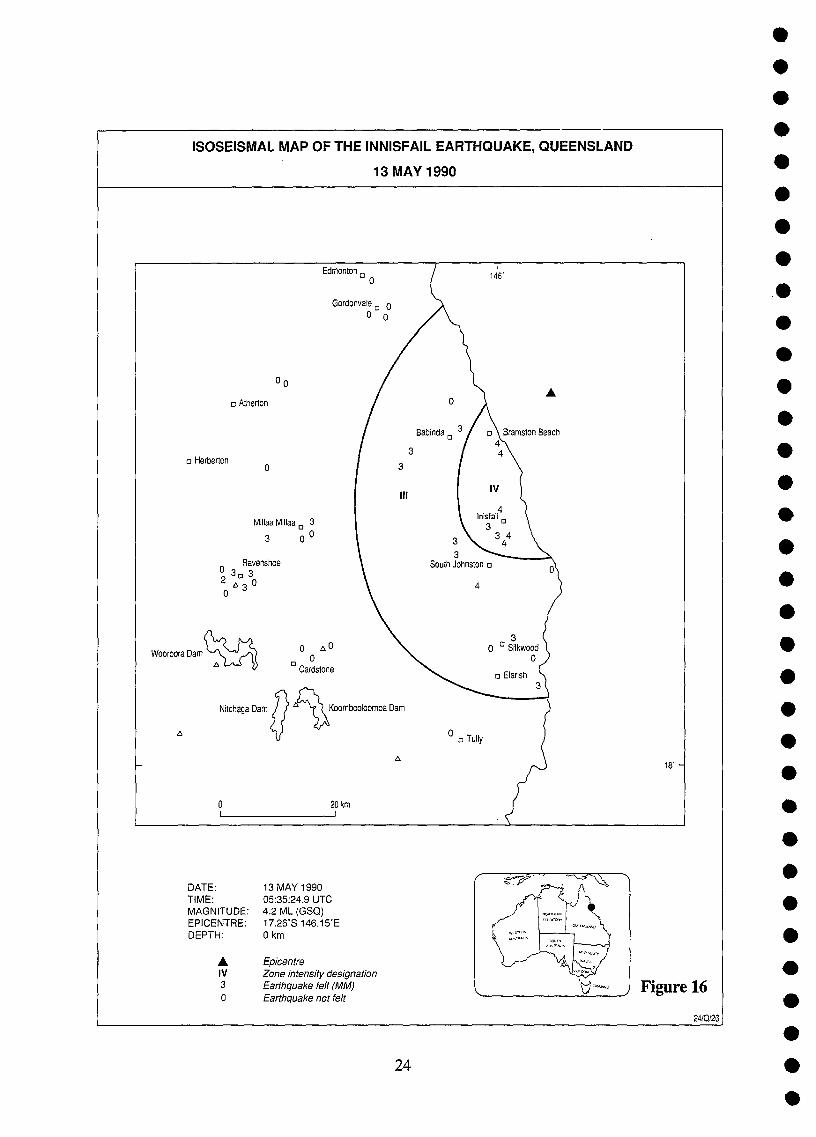
• and there were reports of trees and bushes being shaken to the extent that birds tookflight. Unfortunately the nearest seismograph to record the event was 320 km away so
• it was not possible to accurately determine the epicentre. A limited number of intensityreports with a restricted distribution were obtained by seismologists at the University of
• Central Queensland, University of Queensland and the Department of Minerals andEnergy.
Clare SA, 11 June (Figure 18)
Laura SA, 13 June (Figure 19)
Just before 6 am (14 June local time) a small earthquake of magnitude ML 3.0 occurred• east of Port Pine, near Laura and Napperby. Rumbling and vibration were noticed from
at least as far north as Murraytown and to Georgetown in the south. People who felt the• event contacted the SA Dept of Mines and Energy and were sent questionnaires. The
map was produced from 25 replies and a few phone calls. The early hour of the• morning made the determination of intensity difficult in a number of cases.
• Warramboo SA, 5 October (Figure 20)
• At 22:11 UTC on 5 October 1990 (7:41am local time on 6 October), Warramboo wasagain shaken by a small earthquake. The epicentre was in Hambidge Conservation Park
• near the previous event on 7 September 1989. The magnitude of the event was ML 2.7,slightly smaller than the previous one.
• The Principal at Warramboo Primary School gained a sudden interest in the eventas his transportable home twisted, and pictures moved on walls. He distributed
• questionnaires from which the isoseismal map was compiled. Due to lack of regionalcoverage, isoseismal lines could not be drawn.
•D Love, S Greenhalgh, K Malpas, K McCue, P Gregson, M Leiba & R Cuthbertson
• NETWORK OPERATIONS 1990
• The National Seismographic Network underwent only minor changes during the yearand these are listed in Table 3. A new seismograph was installed at Casey in Antarctica,
• the data telemetered back to Canberra via ANARESAT. Calibration curves for most ofthe stations are shown in Figures 21& 21a.
• Significant additions and closures were made to regional networks. InQueensland one DRI station was moved, a new station was installed at Cracow and a
• network of 6 seismographs was installed around the proposed Tully-Millstream damsite north of Cairns. The Applied Physics Department, University of Central
• Queensland commenced a research program with the installation of a seismograph atRockhampton and jointly with AGSO, a triaxial digital recorder at Mount Morgan.
• In South Australia 6 new stations were installed and 2 closed by SADME. Theresult is a better monitoring capability and improved epicentre control for earthquakes in
• Adelaide and the active South-East region.The Hunter Valley NSW network of 4 seismographs was installed by the ASC
• on the direction of the then Minister, Senator Peter Cook. Partial funding for one of theseismographs was provided by the Newcastle City Council and ICiwanis International,•
• 29
• Soon after midnight on Tuesday 12 June (local time) an ML 2.7 micro-earthquake was• felt at Clare. Twenty four questionnaires were sent out. From the 13 replies and a
number of phone calls an intensity map was produced. Although one window pane was• reported cracked, very few replies exceeded intensity MM3. Many people were still
awake, and only a few were awoken, one by a dog pining just before the event.• The epicentre plots just outside the arae of perceptibility at a depth of about
18 km.•
fp
•

__,
MRWA_RKG
-^MUN HG
_
_
BAL-^KLB
___.
NWAO•
MUN
2
Figure 21a Calibration curves, Western Australian network stations.30
10.05^0 1^PERIOD (Seconds)
2000
1000
100
00
10
•••••••••••
•••••••••••••0
••••••••

•2000••
•^1000
••••••
•••
aao7 .<z0I z<0LT20<m
••••••
WARB
NANUMBL
MEKA
FORRCOOL
KNA
-MTN
_
_
..__
_
_
_
.^.^.^.^.^,01^PERIOD (Seconds)
^1
Figure 21b Calibration curves, Western Australian network stations.31
••••
10.05

Magnification
.... ''' ... ...".D.. — .......di- ... ._
...0 •,.____•••••■
......
----^...44..
...e.. ........ . .s.^
---..r ... ...,........
.5...
•41...:."•••^'-•^,
,...•.
•-..4
......A.,.
,%. 41/4„.
"aNs
4. ft. ••1 : ;„: ."...
„ . .^'"..
••••.^••
• —.^..——• --- —.
.^\
).
\•\
•\
lit
.."
•
• '''''
db.., .
•••.:S.
11
\
\
\
../ R k
\ \
\^ll
dei
../.
..."
\\
\ \
\
X
It
\.1,,,,
11
\^N.
N.X 't^\
11X \ ‘
X^\
X ,
N %
ri.
\ it
N %
N \
'1, •
-X 1
ICI\ \
X %
'1X %
1 1,X %
14,---
10
•
•••••
BFD •CMS •CNB •"Ccio
Ts •-()Ep11A7 •11MQ •TOO •
•••••••••••
Period
1e+06
5
2
le+05
5
2
1e+04
5
2
le+03
5
2
le+02
le-01^
2^
5^1e+00^
2^•
••
Figure 21c Calibration curves, Eastern Australian network stations.^ •
•
•32
0•

the rest came from the AGSO budget. Data from one channel of the digital Kelungi atNorth Lambton is telemetered to the Newcastle Regional Museum where it is recordedon an analogue recorder. The ASC also installed a digital accelerograph at the PoliceHeadquarters building in the Newcastle Central Business District.
A South-eastern Australian network was installed and maintained by the ANUbetween 1958 and 1972 to monitor the Snowy Mountains, Dalton-Gunning andSydney Water Board dams at Avon, Werombi and Jenolan. The network has beenreduced from 16 stations in 1987 to 10 in 1990 with a substantial loss of detectioncapability, particularly in the Snowy Mountains.
Graeme Small, Peter Gregson, Kevin McCue & David Love
ACCELEROGRAPH DATA
There were no accelerographs close to either of the magnitude 5+ earthquakes of 1990.
In Western Australia Twenty accelerograms were recorded by the network in theSouth-West Seismic Zone during 1990, from 9 earthquakes in the Cadoux area and theML 5.5 earthquake at Meckering. The latter event was recorded at Dowerin at an epi-central distance of about 75 km (S-P =8 s) where the peak acceleration was 93 mms -2(Table 6). The accelerogam is shown in Figure 22. Other accelerographs weretriggered at Mundaring Weir (90 km) where the peak acceleration was 287 inms-2across the dam wall, compared with 75 nuns -2 along the wall. It was also recorded atCanning Dam (100 km) and Cadoux (110 km).
In Eastern Australia Accelerograms of 7 micro-earthquakes in a swarm near OolongNSW were recorded on a digital recorder nearby (FND). Peak horizontal and verticalground accelerations in excess of 0.3 g were recorded during the close magnitude ML3.5 earthquake which initiated the swarm on 13 January. Other Dalton/Gunning Zoneearthquakes on 23 and 24 March were recorded on an accelerograph installed on theproperty Springfield (SPF).
An accelerogram was recorded at the Newcastle Police Station in the CBD on23 February 1990. The epicentre of this magnitude ML 2.9 earthquake was about 30km away near Cessnock, at shallow rather than mid-crustal depth, and too far from theepicentre of the December 1989 earthquake to be considered an aftershock.
Accelerograms, 20 in all from 16 earthquakes, were recorded in Victoria. Fourof the records are for magnitude ML 3 earthquakes on 11 and 19 May which areincluded in Table 6.
K McCue, M Leiba, V Dent, P Gregson & G Gibson
PERTH MICROZONATION STUDY
In August 1989, Brian Gaull visited Hokkaido University, the Tokyo Institute ofTechnology, the Earthquake Research Institute and Aichi University of Education inJapan with a grant from the Australian Academy of Science and Japan Society for thePromotion of Science. The liaison with microzonation experts in Japan enabled Gaull toset up a study of microzonation effects in metropolitan Perth, WA.
A return visit was made by Drs Kagami and Tanigushi in January 1990 to assistwith a pilot study of Perth which was subsequently expanded during the year byMundaring Geo-physical Observatory staff. A set of 6 simultaneous observations weremade along north-south traverses across the coastal plain near Perth to measure thevariation in background noise at sites with varying geological foundations comparedwith a rock site at Mundaring.
•
•
33

DOW^1990-01-17 0638Meckering WA
SeisMac 1.0d10, 1993-07-27200 sample/sec, full scale 2097152Polarity Unspecified
20512East
20512
20512North5266
#1100^0104#11
20512Up
6609
Ii^ I^I 20^ 215^ 30
P^ S1990-01-17 0638 18.490 (±0.005)^P 22.610^S 31.365 F 0639 19.9 Dur 57.4
35
No sync applied
• • • • • • • • • • • • • • • • • • • • • • • • • • • • • • • • • •
Figure 22 Accelerogram of the Meckering earthquake, 17 January 1990 recorded at Dowerin at anepicentral distance of 78 km. The ordinate scale is in counts where 20 000 counts is about 0.01 g.

Fortuitously, an earthquake occurred on the 8 May 1990 near Cadoux WAwhilst the zonation measurements were in progress. It was recorded on sediments inthe suburb of Kewdale where the ground motion was ten times that at Mundaring,confirming the observation of considerable magnification in the background noiselevels on alluvium compared with those on rock.
The results will be published in a BMR Record.
B A GauII, P Gregson & K McCue
TIME ZONES IN AUSTRALIA
The Standard Time Act of 1895 introduced Greenwich Mean Time (GMT) to Australiaand standardised time zones within the States; Eastern, Central and Western StandardTime, 10, 9:30 and 8 hours ahead of GMT. According to Paul Payne of the SydneyObservatory; prior to 1895 the times of the capital cities for noon in Sydney were:Melbourne 11:45 am, Adelaide 11:10 am, Perth 9:39 am, Hobart 11:45 am, Brisbane12:07 pm, which times correspond closely to the difference in longitude from Sydney.Towns near the capital cities probably adopted the same time but what standard wasadopted in isolated towns is not known.
GMT is a measure of Earth rotation relative to the Sun at the longitude ofGreenwich UK. The Coordinated Universal Time (UTC) scale, synonymous withGMT since 1970, is derived from the US National Bureau of Standards atomicfrequency standard which emulates the Caesium resonance frequency to within a fewparts in 10 13 . Integral second corrections are applied to UTC as required so that it neverdiffers from UT (the Earth rotation time with respect to the sun and corrected for polarmotion) by more than 0.7s (NBS, 1972; J. McK. Luck, 1991).
AUSTRALIAN EARTHQUAKE FOCAL MECHANISM
Meckering WA The epicentre determined by Mundaring seismologists is 2 km eastof, and down-clip from, the Meckering Fault scarp caused by the 1968 earthquake(Gordon & Lewis, 1980). First motions at 16 Australian seismographic stations and 7worldwide stations reporting impulsive P-wave arrivals to the ISC were initially used tostudy the focal mechanism of the Meckering earthquake.
The solution was poorly constrained but additional data was obtained fromSouth Australian (CLV, PNA & HWK) and ANU stations (BWA & IVY) and someseismograms, including that recorded broad-band at Mawson were reanalysed. TheISC bulletin reported a compression at WRA but a check of WB5 showed it to be aclear dilatation. The Chinese data do not fit the preferred solution but were down-weighted because of their distance and the relatively small size of the earthquake. Thepreferred mechanism (Figure 23) is a thrust with only a very small dip-slip component.The northerly nodal plane parallels the strike of the closest section of the Meckeringfault and its dip is 66° E, strong evidence for concluding that it is the fault plane. Theimplied principal stress direction is eastwest.
This solution is nearly identical to that of the 14 October 1968 earthquake whichproduced the fault scarp, indicating that this large earthquake did not release all thecrustal stress nor change the long term stress regime in the region of the fault.
K McCue
PRINCIPAL WORLD EARTHQUAKES, 1990
Table 7 lists earthquakes that occurred throughout the world in 1990 of magnitude 7.0or greater, or that caused fatalities or substantial damage. There were no greatearthquakes, and 8 of the 11 earthquakes of magnitude Ms 7 or more occurred aroundthe Pacific rim. The largest at magnitude Ms 7.7 - 7.8, were those in Iran on 20 June
35

MECKERING,WA17 JAN 1990
Figure 23 Focal mechanism of the Meckering earthquake, 17 January 1990. ALambert equal area projection was used. Solid circles are compressions, open circlesdilatations. The dashed lines represent the nodal planes with strike and dip as marked.
Figure 24 Principal world earthquakes, magnitude 6 or greater. Data extracted fromthe AGSO/ISC earthquake database.
36

••
and the Philippines on 11 July. The most destructive earthquake was that in Iran.Nearly all buildings were destroyed in the Rasht-Qazvin-Zanjan area of north-easternIran. Substantial damage occurred as far as Khalkhal and Nor Shahr. A spectacularstrike-slip fault was caused during the Philippine Is earthquake, with 5.5 m of left-lateral displacement. Figure 24 shows the locations of these earthquakes.
World-wide, more than 52 000 people died in earthquakes in 1990, comparedwith 530 and 26 550 in 1989 and 1988 respectively, and the average for the century of10 000 per year.
Intraplate earthquakes outside Australia included one in the UK of magnitudeMb 4.6 (ML 5.1) on 2 April at 13:46 UTC which caused building damage in Liverpool,Manchester, Wrexham and Shrewsbury. A magnitude 7.2 earthquake in the Sudan on20 May at 02:22 UTC caused building damage in the Sudan and Uganda.
This information is from the ISC monthly bulletins, 'Earthquake Data Reports'published by the United States Geological Survey, and the SEAN Bulletin of theSmithsonian Institution (SEAN, 1990).
P Gregson and K McCue
MONITORING OF NUCLEAR EXPLOSIONS
Underground nuclear explosions presumed to have been detonated during 1990 arelisted in Table 8. Except for 2 small Nevada tests, which are in the core shadow zone,all of the listed events were recorded by Australian seismic stations. Seven nuclear testswere conducted at the US test site in Nevada, whereas the then-USSR performed theirsolitary test at Novaya Zemlya. China held 2 tests at Lop Nor, the first time China hasdetonated more than one test in any year. The 2 largest French nuclear devices wereexploded at Fangataufa and the remaining 4 were at Mururoa.
The approximate yield (in kilotons) of an underground nuclear explosion can bedetermined empirically from its average body-wave magnitude mb (Table 9).
In the past few years there has been a dramatic reduction in the number of testsof nuclear weapons (Figure 25).
D Jepson
REFERENCES
Anderson, J.A. & Wood, H.O., 1925 — Description and theory of the torsion seismometer.Bulletin of the Seismological Society of America, 15, 1-72.
Bath, M., 1981 — Earthquake magnitude - recent research and current trends. Earth ScienceReviews, 17, 315 - 398.
Bisztricsany, E., 1958 — A new method for the determination of the magnitude of earthquakes.Geofizikai Kozlemenyek, 7, 69-96.
Bolt, B.A., & Herraiz, 1983 — Simplified estimation of seismic moment from seismograms.Bulletin of the Seismological Society of America, 73, 735-748.
Denham, D., 1982— Proceedings of the workshop on Australian earthquake magnitude scales.BMR, Canberra, 21 May 1982. Bureau of Mineral Resources, Australia, Record 1982/29.
Dent, V., 1990 — The ML 5.5 Meckering earthquake of 17 January 1990 and its foreshocks andaftershocks. Proceedings of the symposium Recent Intraplate Seismicity Studies. BMR,Perth 5-7 September 1990. Bureau of Mineral Resources, Australia, Record 19890/44..
Eiby, G., 1966 — The Modified Mercalli Scale of earthquake intensity and its use in NewZealand. New Zealand Journal of Geology and Geophysics, 9, 122-129.
Everingham, I.B., Denham, D., & Greenhalgh, S. A., 1987 — Surface-wave magnitudes ofsome early Australian earthquakes. BMR Journal of Australian Geology & Geophysics, 10,253-259.
Everingham, I.B., McEwin, A.J., & Denham, D., 1982 — Atlas of isoseismal maps ofAustralian earthquakes. Bureau of Mineral Resources, Australia, Bulletin 214.
Gaull, B.A., Michael-Leiba, M.O., & Rynn, J., 1990 — Probabilistic earthquake riskmaps of Australia. Australian Journal of Earth Sciences, 37, 169-187.
37

•^16 -
China
France
U.S.
774 U.S.S.R.
totp4t.444,
VG-40. • •• • 4Lt..*
1988^
1989^
1990
Figure 25 Number of underground nuclear tests, 1988 - 1990.
•^38
•

Gordon, F. R. & Lewis, J. D., 1980 — The Meckering and Calingiri earthquakesOctober 1968 and March 1970. Geological Survey of Western Australia, Bulletin126.
Gregson, P.J., 1991 - Mundaring Geophysical Observatory Annual Report 1986-1989. Bureau of Mineral Resources, Geology and Geophysics, Record 1991/(unpublished).
Gregson, P.J., 1992 - Mundaring Geophysical Observatory Annual Report 1990.Bureau of Mineral Resources, Geology and Geophysics, Record 1992/18.
Greenhalgh, S., Denham, D., McDougall, R., & Rynn, J.M.W., 1989 — Magnitude-intensityrelations for Australian earthquakes. Bulletin of the Seismological Society of America, 78,(1), 374-379.
Gutenberg, B., 1945 — Amplitudes of P, PP and SS, and magnitudes of shallow earthquakes.Bulletin of the Seismological Society of America, 35, 57-69.
Jones, T. D., Gibson G., McCue, K. F., Denham, D., Gregson, P. J., and Bowman, J. R.,1991. Three large intraplate earthquakes near Tennant Creek, Northern Territory, Australia,on 22 January 1988, BMR J. Australian Geology & Geophysics, 12(4), 339-343.
Kanamori, H.,-1978 — Quantification of earthquakes. Nature, 271, 411-414.Luck, J. McK., 1991 — Report to National Time Committee of National Standards
Commission, Australia on 21st General Assembly of the International Astronomical Union.Buenos Aires, 21 July - 2 August 1991.
Marshall, P.D., & Basham, P.W., 1973 — Rayleigh wave magnitude scale Ms. Pure andApplied Geophysics, 103, 406-414.
McCue, K.F., 1980 — Magnitude of some early earthquakes in Southeastern Australia. Search,11(3), 78-80.
McCue, K.F., Wesson, V. & Gibson, G., 1990 — The Newcastle New South Walesearthquake of 28 December 1989. BMR Journal of Australian Geology & Geophysics, 11,559-567.
McGregor, P.M., & Ripper, I.D., 1976 — Notes on earthquake magnitude scales. Bureau ofMineral Resources, Australia, Record 1976/76.
NBS 1972 — NBS frequency and time broadcast services. Ed P. P. Viezbicke, Specialpublication 236, US Department of Commerce, Boulder, Colorado.
Richter, C.F., 1958 — Elementary Seismology. Freeman & Company, San Francisco.Rynn, J.M.W., Denham, D., Greenhalgh, G., Jones, T., Gregson, P., McCue, K.F., & Smith,
R.S., 1987 — Atlas of isoseismal maps of Australian earthquakes, part 2. Bureau ofMineral Resources, Australia, Bulletin 222.
SEAN 1989— Scientific Event Network Bulletin, Smithsonian Institution, Washington, USA.Willmore, P., 1979— Manual of seismological observatory practice. World Data
Centre for Solid Earth Geophysics, US Department of Commerce, Boulder, Co,USA, Report SE-20.
39

Date Time (UTC) Latitude Longitude ML Location
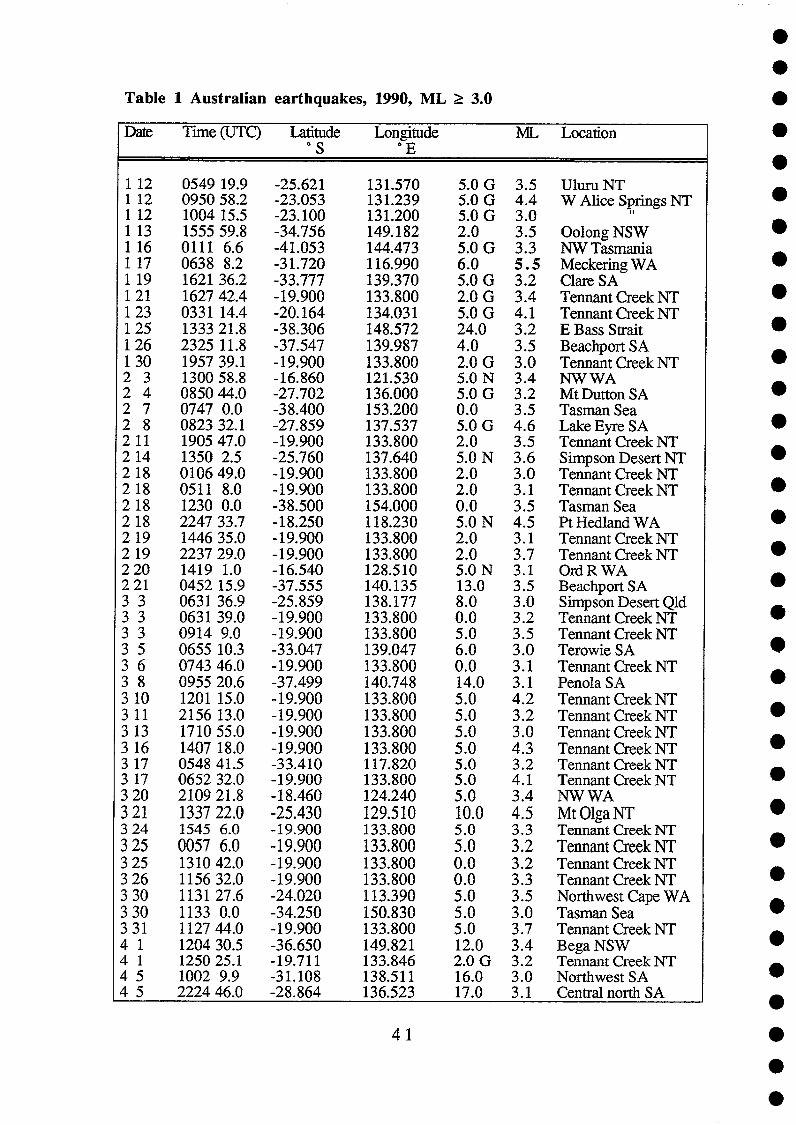
112 0549 19.9 -25.621 131.570 5.0 G 3.5 Uluru NT112 0950 58.2 -23.053 131.239 5.0 G 4.4 W Alice Springs NT112 1004 15.5 -23.100 131.200 5.0 G 3.0113 1555 59.8 -34.756 149.182 2.0 3.5 Oolong NSW116 0111^6.6 -41.053 144.473 5.0 G 3.3 NW Tasmania117 0638 8.2 -31.720 116.990 6.0 5 . 5 Mecketing WA119 1621 36.2 -33.777 139.370 5.0 G 3.2 Clare SA1 21 1627 42.4 -19.900 133.800 2.0 G 3.4 Tennant Creek NT1 23 0331 14.4 -20.164 134.031 5.0 G 4.1 Tennant Creek NT1 25 1333 21.8 -38.306 148.572 24.0 3.2 E Bass Strait1 26 2325 11.8 -37.547 139.987 4.0 3.5 Beachport SA1 30 1957 39.1 -19.900 133.800 2.0 G 3.0 Tennant Creek NT23 1300 58.8 -16.860 121.530 5.0 N 3.4 NW WA24 0850 44.0 -27.702 136.000 5.0 G 3.2 Mt Dutton SA27 0747 0.0 -38.400 153.200 0.0 3.5 Tasman Sea28 0823 32.1 -27.859 137.537 5.0 G 4.6 Lake Eyre SA211 1905 47.0 -19.900 133.800 2.0 3.5 Tennant Creek NT2 14 1350 2.5 -25.760 137.640 5.0 N 3.6 Simpson Desert NT2 18 0106 49.0 -19.900 133.800 2.0 3.0 Tennant Creek NT2 18 0511 8.0 -19.900 133.800 2.0 3.1 Tennant Creek NT2 18 1230 0.0 -38.500 154.000 0.0 3.5 Tasman Sea2 18 2247 33.7 -18.250 118.230 5.0 N 4.5 Pt Hedland WA2 19 1446 35.0 -19.900 133.800 2.0 3.1 Tennant Creek NT2 19 2237 29.0 -19.900 133.800 2.0 3.7 Tennant Creek NT220 1419 1.0 -16.540 128.510 5.0 N 3.1 Ord R WA221 0452 15.9 -37.555 140.135 13.0 3.5 Beachport SA33 0631 36.9 -25.859 138.177 8.0 3.0 Simpson Desert Qld33 0631 39.0 -19.900 133.800 0.0 3.2 Tennant Creek NT33 0914 9.0 -19.900 133.800 5.0 3.5 Tennant Creek NT35 0655 10.3 -33.047 139.047 6.0 3.0 Terowie SA36 0743 46.0 -19.900 133.800 0.0 3.1 Tennant Creek NT38 0955 20.6 -37.499 140.748 14.0 3.1 Penola SA3 10 1201 15.0 -19.900 133.800 5.0 4.2 Tennant Creek NT3 11 2156 13.0 -19.900 133.800 5.0 3.2 Tennant Creek NT3 13 1710 55.0 -19.900 133.800 5.0 3.0 Tennant Creek NT3 16 1407 18.0 -19.900 133.800 5.0 4.3 Tennant Creek NT3 17 0548 41.5 -33.410 117.820 5.0 3.2 Tennant Creek NT3 17 0652 32.0 -19.900 133.800 5.0 4.1 Tennant Creek 1•IT3 20 2109 21.8 -18.460 124.240 5.0 3.4 NW WA321 1337 22.0 -25.430 129.510 10.0 4.5 Mt Olga NT3 24 1545 6.0 - 19.900 133.800 5.0 3.3 Tennant Creek NT3 25 0057 6.0 -19.900 133.800 5.0 3.2 Tennant Creek NT3 25 1310 42.0 -19.900 133.800 0.0 3.2 Tennant Creek NT3 26 1156 32.0 -19.900 133.800 0.0 3.3 Tennant Creek NT3 30 1131 27.6 -24.020 113.390 5.0 3.5 Northwest Cape WA3 30 1133 0.0 -34.250 150.830 5.0 3.0 Tasman Sea331 1127 44.0 -19.900 133.800 5.0 3.7 Tennant Creek NT41 1204 30.5 -36.650 149.821 12.0 3.4 Bega NSW41 1250 25.1 -19.711 133.846 2.0 G 3.2 Tennant Creek NT45 1002 9.9 -31.108 138.511 16.0 3.0 Northwest SA45 2224 46.0 -28.864 136.523 17.0 3.1 Central north SA
Table 1 Australian earthquakes, 1990, ML 3.0
41
••
••••••••
•••••••••••••••••••••••• 42
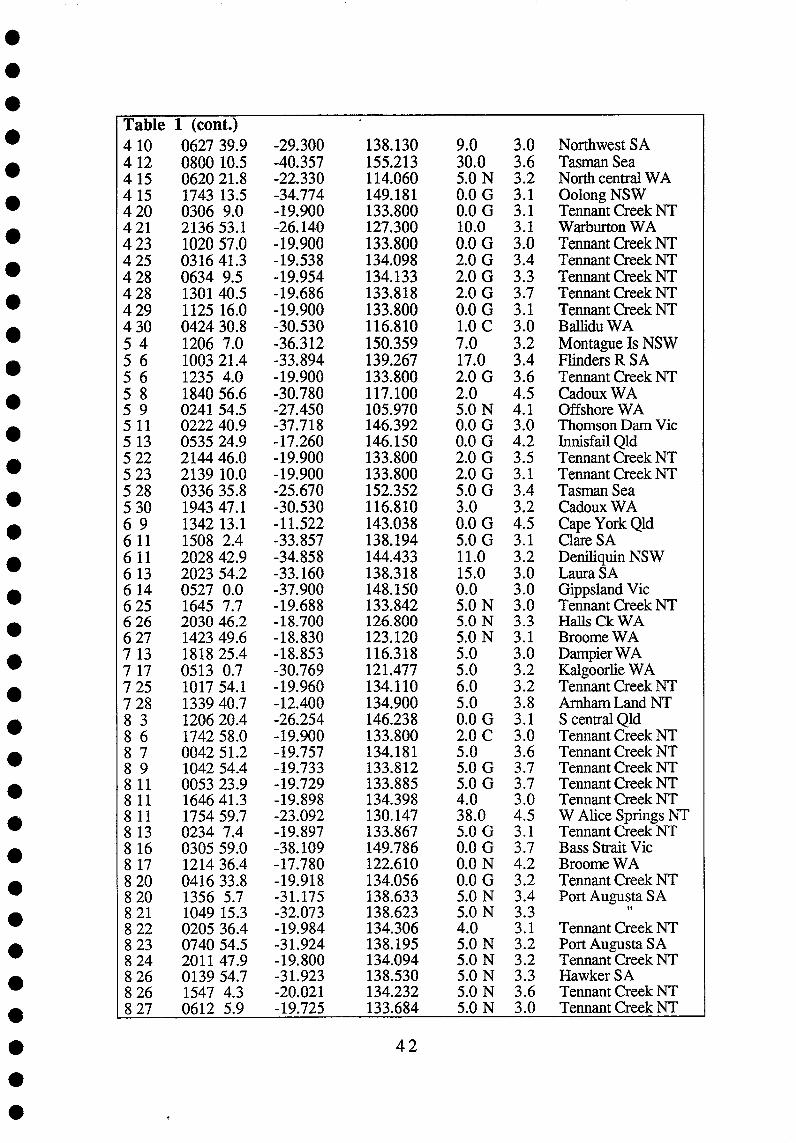
Table 1 (cont.)410 0627 39.9 -29.300 138.130 9.0 3.0 Northwest SA4 12 0800 10.5 -40.357 155.213 30.0 3.6 Tasman Sea415 0620 21.8 -22.330 114.060 5.0 N 3.2 North central WA4 15 1743 13.5 -34.774 149.181 0.0 G 3.1 Oolong NSW420 0306 9.0 -19.900 133.800 0.00 3.1 Tennant Creek NT421 2136 53.1 -26.140 127.300 10.0 3.1 Warburton WA423 1020 57.0 -19.900 133.800 0.0 G 3.0 Tennant Creek NT425 0316 41.3 -19.538 134.098 2.00 3.4 Termant Creek NT428 0634 9.5 -19.954 134.133 2.0 G 3.3 Tennant Creek NT428 1301 40.5 -19.686 133.818 2.0 G 3.7 Tennant Creek NT429 1125 16.0 -19.900 133.800 0.0 G 3.1 Tennant Creek NT430 0424 30.8 -30.530 116.810 1.0 C 3.0 Ballidu WA5 4 1206 7.0 -36.312 150.359 7.0 3.2 Montague Is NSW5 6 1003 21.4 -33.894 139.267 17.0 3.4 Flinders R SA5 6 1235 4.0 -19.900 133.800 2.0 G 3.6 Tennant Creek NT5 8 1840 56.6 -30.780 117.100 2.0 4.5 Cadoux WA59 0241 54.5 -27.450 105.970 5.0 N 4.1 Offshore WA5 11 0222 40.9 -37.718 146.392 0.0 G 3.0 Thomson Dam Vic513 0535 24.9 -17.260 146.150 0.00 4.2 Innisfail Qld522 2144 46.0 -19.900 133.800 2.0 G 3.5 Tennant Creek NT523 2139 10.0 -19.900 133.800 2.0 G 3.1 Tennant Creek NT5 28 0336 35.8 -25.670 152.352 5.0 G 3.4 Tasman Sea530 1943 47.1 -30.530 116.810 3.0 3.2 Cadoux WA6 9 1342 13.1 -11.522 143.038 0.0 G 4.5 Cape York Qld6 11 1508 2.4 -33.857 138.194 5.0 G 3.1 Clare SA6 11 2028 42.9 -34.858 144.433 11.0 3.2 Deniliquin NSW613 2023 54.2 -33.160 138.318 15.0 3.0 Laura SA6 14 0527 0.0 -37.900 148.150 0.0 3.0 Gippsland Vic625 1645 7.7 -19.688 133.842 5.0 N 3.0 Tennant Creek NT626 2030 46.2 -18.700 126.800 5.0 N 3.3 Halls Ck WA627 1423 49.6 -18.830 123.120 5.0 N 3.1 Broome WA7 13 1818 25.4 -18.853 116.318 5.0 3.0 Dampier WA7 17 0513 0.7 -30.769 121.477 5.0 3.2 Kalgoorlie WA7 25 1017 54.1 -19.960 134.110 6.0 3.2 Tennant Creek NT728 1339 40.7 -12.400 134.900 5.0 3.8 Arnham Land NT8 3 1206 20.4 -26.254 146.238 0.0 G 3.1 S central Qld8 6 1742 58.0 -19.900 133.800 2.0 C 3.0 Tennant Creek NT8 7 0042 51.2 -19.757 134.181 5.0 3.6 Tennant Creek NT8 9 1042 54.4 -19.733 133.812 5.00 3.7 Tennant Creek NT8 11 0053 23.9 -19.729 133.885 5.0 G 3.7 Tennant Creek NT811 1646 41.3 -19.898 134.398 4.0 3.0 Tennant Creek NT811 1754 59.7 -23.092 130.147 38.0 4.5 W Alice Springs NT8 13 0234 7.4 -19.897 133.867 5.0 G 3.1 Tennant Creek NT8 16 0305 59.0 -38.109 149.786 0.00 3.7 Bass Strait Vic8 17 1214 36.4 -17.780 122.610 0.0 N 4.2 Broome WA8 20 0416 33.8 -19.918 134.056 0.0 G 3.2 Tennant Creek NT8208 21
1356 5.71049 15.3
-31.175-32.073
138.633138.623
5.0 N5.0 N
3.43.3
Port Augusta SAft
8 22 0205 36.4 -19.984 134.306 4.0 3.1 Tennant Creek NT823 0740 54.5 -31.924 138.195 5.0 N 3.2 Port Augusta SA8 24 2011 47.9 -19.800 134.094 5.0 N 3.2 Tennant Creek NT826 0139 54.7 -31.923 138.530 5.0 N 3.3 Hawker SA826 1547 4.3 -20.021 134.232 5.0 N 3.6 Tennant Creek NT827 0612 5.9 -19.725 133.684 5.0 N 3.0 Tennant Creek NT

Table 1 (cont.)8 27 0807 6.0 -19.846 134.901 5.0 N 3.2 Tennant Creek NT828 1004 54.2 -22.860 112.750 0.0 3.6 Exmouth WA828 2201 31.7 -19.610 133.696 5.0 N 3.1 Tennant Creek NT9 3 0632 43.2 -40.446 149.543 10.0 3.5 West Tasman Sea9 5 0412 5.7 -41.050 117.900 5.0 N 3.0 Albany WA912 1020 3.9 -19.800 133.900 0.0 3.0 Tennant Creek NT912 1205 39.5 -18.630 122.870 5.0 N 3.2 Broome WA913 1456 58.4 -19.599 133.646 5.0 N 3.8 Tennant Creek NT9 13 1749 36.0 -34.065 148.783 5.0 N 3.0 Blanket Flat NSW913 1928 22.8 -32.847 148.289 0.00 3.3 Yarrabin NSW914 1000 24.7 -19.800 133.900 0.0 3.3 Tennant Creek NT9 15 1538 15.9 -29.890 108.910 5.0 N 3.7 WNW Perth WA9 16 2057 34.2 -19.800 133.900 0.0 3.1 Tennant Creek NT921 0408 3.4 -19.800 133.900 0.0 3.2 Tennant Creek NT922 1321 32.7 -19.800 133.900 0.0 3.2 Tennant Creek NT927 1241 51.8 -25.931 137.514 5.00 3.8 Simpson Desert NT929 0914 13.4 -19.881 133.608 5.0 N 3.3 Tennant Creek NT10^7 0004 17.1 -19.900 133.800 2.0 G 3.0 Tennant Creek NT10 9 1816 15.5 -14.290 128.900 5.0 N 3.3 Kununurra WA10 15 1949 27.2 -22.340 113.790 5.0 N 3.2 Learmonth WA10 23 1313 29.2 -19.900 133.800 2.0 G 3.0 Tennant Creek NT10 23 1430 44.5 -19.900 133.800 2.0 G 4.1 Tennant Creek NT10 28 2140 51.0 -20.010 133.796 2.00 4.3 Tennant Creek NT10 31 0600 10.6 -20.061 134.166 2.00 4.5 Tennant Creek NT11 3 2308 38.0 -19.900 133.800 2.00 3.0 Tennant Creek NT11 6 1049 39.4 -20.066 134.127 2.0 G 3.2 Tennant Creek NT11 8 0003 9.0 -19.923 133.781 2.00 3.4 Tennant Creek NT11 14 1856 45.0 -30.329 150.840 6.0 3.1 Armidale NSW11 25 2146 51.4 -21.730 126.400 5.0 N 3.0 L Tobin WA11 27 1721 11.9 -40.235 142.015 17.0 3.5 Bass Strait11 27 2116 26.3 -20.046 133.599 0.0 G 5.2 Tennant Creek NT12 1 2054 51.6 -26.527 131.809 12.0 3.3 Northwest SA12 1 2235 16.3 -26.582 131.325 21.0 4.1 Northwest SA12 3 1318 39.6 -31.420 139.323 5.0 G 4.2 Flinders Ranges SA12 26 0010 40.2 -31.495 139.154 17.0 3.0 Flinders Ranges SA12 28 0452 54.0 -19.900 133.800 2.00 3.1 Tennant Creek NT12 28 1414 30.0 -19.900 133.800 2.0 G 3.5 Tennant Creek NT12 29 1226 11.0 -19.900 133.800 2.00 3.0 Tennant Creek NT
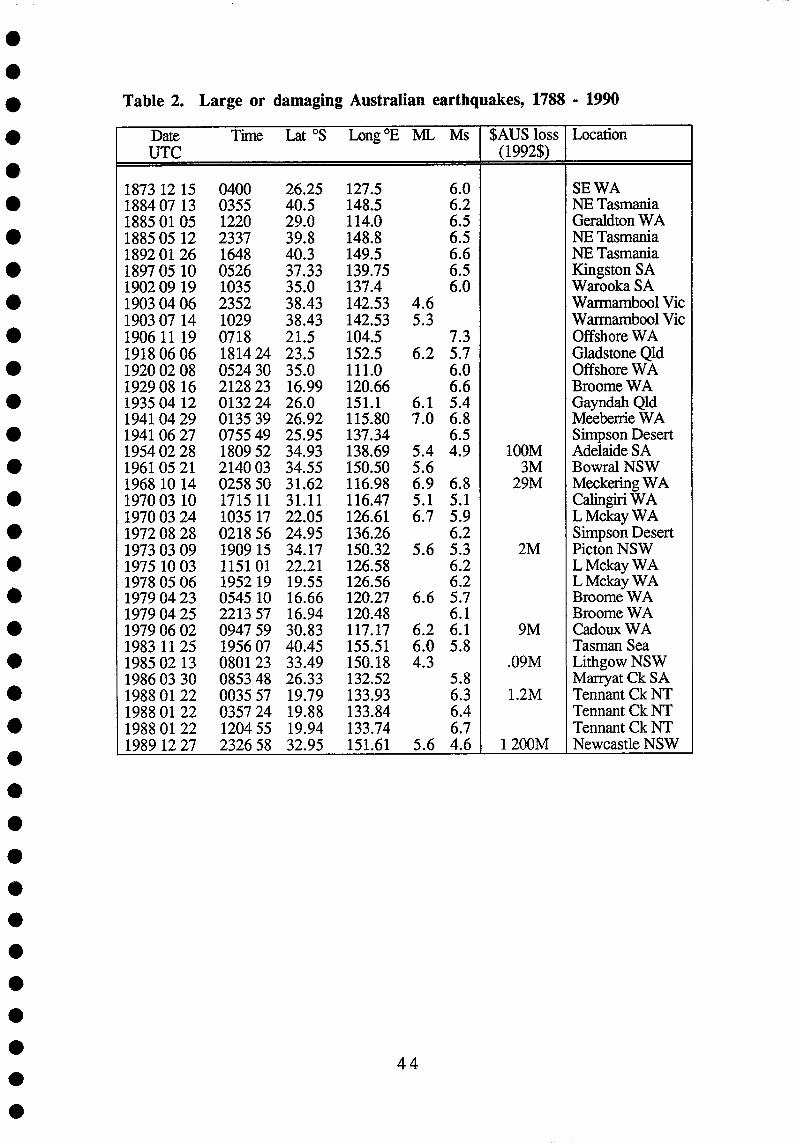
•• Table 2. Large or damaging Australian earthquakes, 1788 - 1990
• DateUTC
Time Lat °S Long °E ML Ms $AUS loss(1992$)
Location
1873 12 15 0400 26.25 127.5 6.0 SE WA1884 07 13 0355 40.5 148.5 6.2 NE Tasmania1885 01 05 1220 29.0 114.0 6.5 Geraldton WA1885 05 12 2337 39.8 148.8 6.5 NE Tasmania1892 01 26 1648 40.3 149.5 6.6 NE Tasmania1897 05 10 0526 37.33 139.75 6.5 Kingston SA1902 09 19 1035 35.0 137.4 6.0 Warooka SA1903 04 06 2352 38.43 142.53 4.6 Warmambool Vic1903 07 14 1029 38.43 142.53 5.3 Waimambool Vic1906 11 19 0718 21.5 104.5 7.3 Offshore WA1918 06 06 1814 24 23.5 152.5 6.2 5.7 Gladstone Qld1920 02 08 0524 30 35.0 111.0 6.0 Offshore WA1929 08 16 2128 23 16.99 120.66 6.6 Broome WA1935 04 12 0132 24 26.0 151.1 6.1 5.4 Gayndah Qld1941 04 29 0135 39 26.92 115.80 7.0 6.8 Meeberrie WA1941 06 27 0755 49 25.95 137.34 6.5 Simpson Desert1954 02 28 1809 52 34.93 138.69 5.4 4.9 100M Adelaide SA1961 05 21 2140 03 34.55 150.50 5.6 3M Bowral NSW1968 10 14 0258 50 31.62 116.98 6.9 6.8 29M Meckering WA1970 03 10 1715 11 31.11 116.47 5.1 5.1 Calingiri WA1970 03 24 1035 17 22.05 126.61 6.7 5.9 L Mckay WA1972 08 28 0218 56 24.95 136.26 6.2 Simpson Desert1973 03 09 1909 15 34.17 150.32 5.6 5.3 2M Picton NSW1975 10 03 1151 01 22.21 126.58 6.2 L Mckay WA1978 05 06 1952 19 19.55 126.56 6.2 L Mckay WA1979 04 23 0545 10 16.66 120.27 6.6 5.7 Broome WA1979 04 25 2213 57 16.94 120.48 6.1 Broome WA1979 06 02 0947 59 30.83 117.17 6.2 6.1 9M Cadoux WA1983 11 25 1956 07 40.45 155.51 6.0 5.8 Tasman Sea1985 02 13 0801 23 33.49 150.18 4.3 .09M Lithgow NSW1986 03 30 0853 48 26.33 132.52 5.8 Marryat Ck SA1988 01 22 0035 57 19.79 133.93 6.3 1.2M Tennant Ck NT1988 01 22 0357 24 19.88 133.84 6.4 Tennant Ck NT1988 01 22 1204 55 19.94 133.74 6.7 Tennant Ck NT1989 12 27 2326 58 32.95 151.61 5.6 4.6 1 200M Newcastle NSW
•
••••••••••••••••••••••••••••• 44
•
Code#^Name Lat° S Long`E Elev. Operator Type*(m)
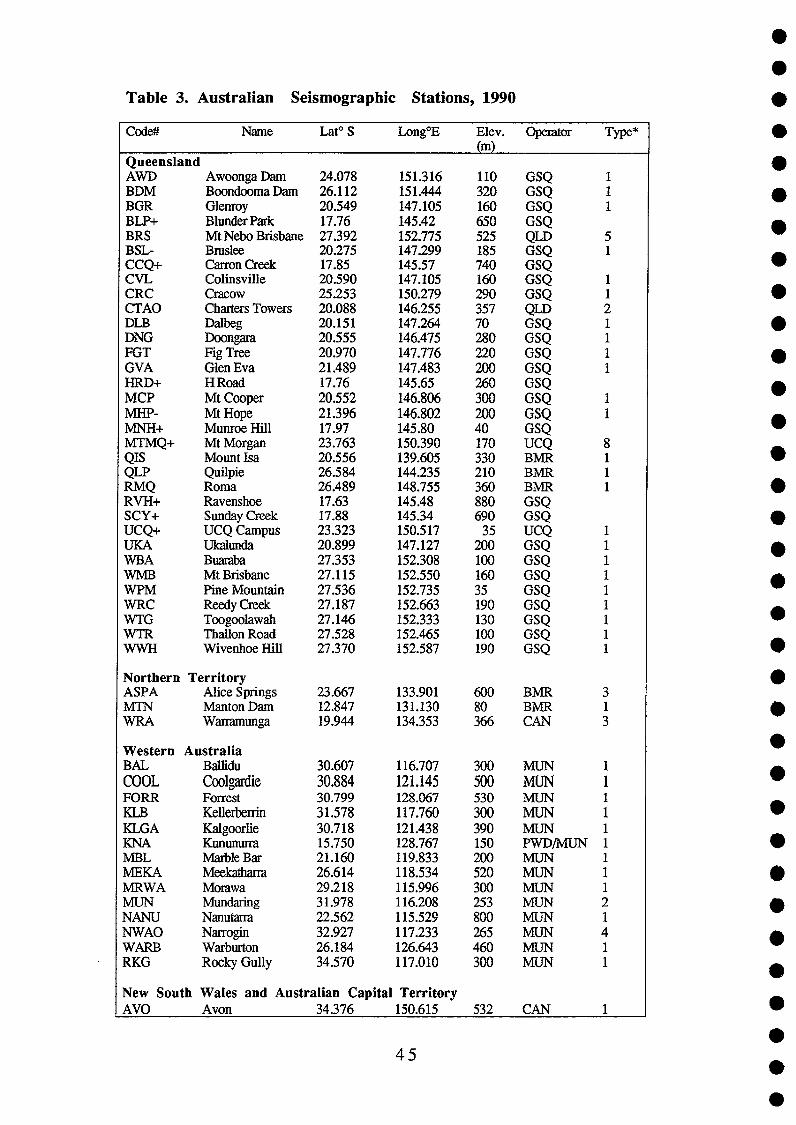
QueenslandAWD^Awoonga Dam 24.078 151.316 110 GSQ 1BDM^Boondooma Dam 26.112 151.444 320 GSQ 1BGR^Glenroy 20.549 147.105 160 GSQ 1BLP+^Blunder Park 17.76 145.42 650 GSQBRS^Mt Nebo Brisbane 27.392 152.775 525 QLD 5BSL- Bruslee 20.275 147.299 185 GSQ 1CCQ+^Carron Creek 17.85 145.57 740 GSQCVL^Colinsville 20.590 147.105 160 GSQ 1CRC^Cracow 25.253 150.279 290 GSQ 1CTAO^Charters Towers 20.088 146.255 357 QLD 2DLB^Dalbeg 20.151 147.264 70 GSQ 1DNG^Doongara 20.555 146.475 280 GSQ 1FGT^Fig Tree 20.970 147.776 220 GSQ 1OVA^Glen Eva 21.489 147.483 200 GSQ 1HRD+^H Road 17.76 145.65 260 GSQMCP^Mt Cooper 20.552 146.806 300 GSQ 1MHP- Mt Hope 21.396 146.802 200 GSQ 1MNH+^Munroe Hill 17.97 145.80 40 GSQMTMQ+^Mt Morgan 23.763 150.390 170 UCQ 8QIS^Mount Isa 20.556 139.605 330 BMR 1QLP^Quilpie 26.584 144.235 210 BMR 1RMQ^Roma 26.489 148.755 360 BMR 1RVH+^Ravenshoe 17.63 145.48 880 GSQSCY+^Sunday Creek 17.88 145.34 690 GSQUCQ+^UCQ Campus 23.323 150.517 35 UCQ 1UKA^Ukalunda 20.899 147.127 200 GSQ 1Wl3A^Buaraba 27.353 152.308 100 GSQ 1WMB^Mt Brisbane 27.115 152.550 160 GSQ 1WPM^Pine Mountain 27.536 152.735 35 GSQ 1WRC^Reedy Creek 27.187 152.663 190 GSQ 1WTG^Toogoolawah 27.146 152.333 130 GSQ 1WTR^Thalton Road 27.528 152.465 100 GSQ 1WWH^Wivenhoe Hill 27.370 152.587 190 GSQ 1
Northern TerritoryASPA^Alice Springs 23.667 133.901 600 BMR 3MTN^Manton Dam 12.847 131.130 80 BMR 1WRA^Warramunga 19.944 134.353 366 CAN 3
Western AustraliaBAL^Bal 'Wu 30.607 116.707 300 MUN 1COOL^Coolgardie 30.884 121.145 500 MUN 1FORR^Forrest 30.799 128.067 530 MUN 1KLB^Kellerbenin 31.578 117.760 300 MUN 1KLGA^Kalgoorlie 30.718 121.438 390 MUN 1ICNA^Kununurra 15.750 128.767 150 PWD/MUN 1MBL^Marble Bar 21.160 119.833 200 MUN 1MEKA^Meekatharra 26.614 118.534 520 MUN 1MRWA^Morawa 29.218 115.996 300 MUN 1MUN^Mtmdaring 31.978 116.208 253 MUN 2NANU^Nanutarra 22.562 115.529 800 MUN 1NWAO^Nairogin 32.927 117.233 265 1VIUN 4WARE^Warburton 26.184 126.643 460 MUN 1RKG^Rocky Gully 34.570 117.010 300 MUN 1
New South Wales and Australian Capital TerritoryAVO^Avon^34.376 150.615 532 CAN 1
•
••
Table 3. Australian Seismographic Stations, 1990^ •
4 5^ ••
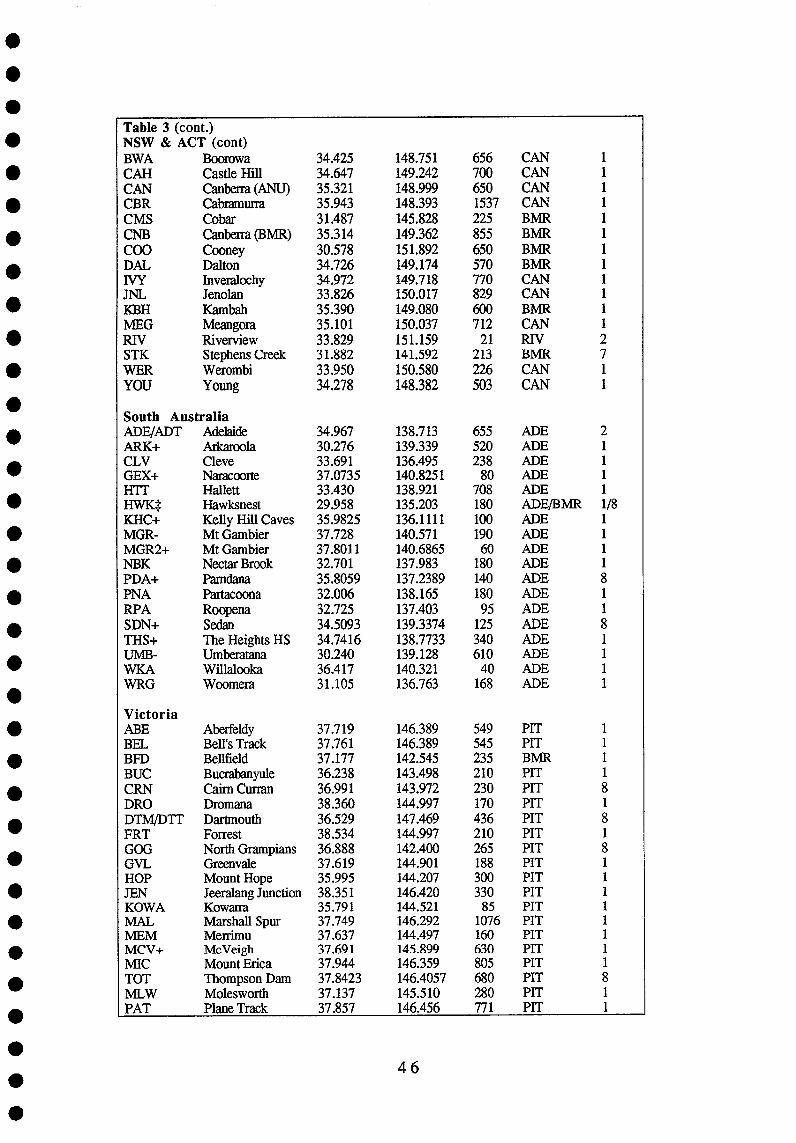
Table 3 (cont.)NSW & ACT (cont)BWA Boorowa 34.425 148.751 656 CAN 1CAR Castle Hill 34.647 149.242 700 CAN 1CAN Canberra (ANU) 35.321 148.999 650 CAN 1CBR Cabramurra 35.943 148.393 1537 CAN 1CMS Cobar 31.487 145.828 225 BMR 1CNB Canberra (BMR) 35.314 149.362 855 BMR 1COO Cooney 30.578 151.892 650 BMR 1DAL Dalton 34.726 149.174 570 BMR 1IVY Inveralochy 34.972 149.718 770 CAN 1JNL Jenolan 33.826 150.017 829 CAN 1KBH Kambah 35.390 149.080 600 BMR 1MEG Meangora 35.101 150.037 712 CAN 1RIV Riverview 33.829 151.159 21 RIV 2STK Stephens Creek 31.882 141.592 213 BMR 7WER Werombi 33.950 150.580 226 CAN 1YOU Young 34.278 148.382 503 CAN 1
South AustraliaADE/ADT Adelaide 34.967 138.713 655 ADE 2ARK+ Arkaroola 30.276 139.339 520 ADE 1CLV Cleve 33.691 136.495 238 ADE 1GEX+ Naracoorte 37.0735 140.8251 80 ADE 1HTT Hallett 33.430 138.921 708 ADE 1HWK* Hawksnest 29.958 135.203 180 ADE/BMR 1/8KHC+ Kelly Hill Caves 35.9825 136.1111 100 ADE 1MGR- Mt Gambier 37.728 140.571 190 ADE 1MGR2+ Mt Gambier 37.8011 140.6865 60 ADE 1NBK Nectar Brook 32.701 137.983 180 ADE 1PDA+ Panidana 35.8059 137.2389 140 ADE 8PNA Partacoona 32.006 138.165 180 ADE 1RPA Roopena 32.725 137.403 95 ADE 1SDN+ Sedan 34.5093 139.3374 125 ADE 8THS+ The Heights HS 34.7416 138.7733 340 ADE 1UMB- Umberatana 30.240 139.128 610 ADE 1WKA Willalooka 36.417 140.321 40 ADE 1WRG Woomera 31.105 136.763 168 ADE 1
VictoriaABE Aberfeldy 37.719 146.389 549 PIT 1BEL Bell's Track 37.761 146.389 545 PIT 1BFD Bellfield 37.177 142.545 235 BMR 1BUC Bucrabanyule 36.238 143.498 210 PIT 1CRN Cairn Curran 36.991 143.972 230 PIT 8DRO Dromana 38.360 144.997 170 PIT 1DTM/DTT Dartmouth 36.529 147.469 436 PIT 8FRT Forrest 38.534 144.997 210 PIT 1GOG North Grampians 36.888 142.400 265 PIT 8GVL Greenvale 37.619 144.901 188 PIT 1HOP Mount Hope 35.995 144.207 300 PIT 1JEN Jeeralang Junction 38.351 146.420 330 PIT 1KOWA Kowaira 35.791 144.521 85 PIT 1MAL Marshall Spur 37.749 146.292 1076 PIT 1MEM Merrirnu 37.637 144.497 160 PIT 1mCV+ McVeigh 37.691 145.899 630 PIT 1MIC Mount Erica 37.944 146.359 805 PIT 1TOT Thompson Dam 37.8423 146.4057 680 PIT 8MLW Molesworth 37.137 145.510 280 PIT 1PAT Plane Track 37.857 146.456 771 PIT 1
••••••^46
•
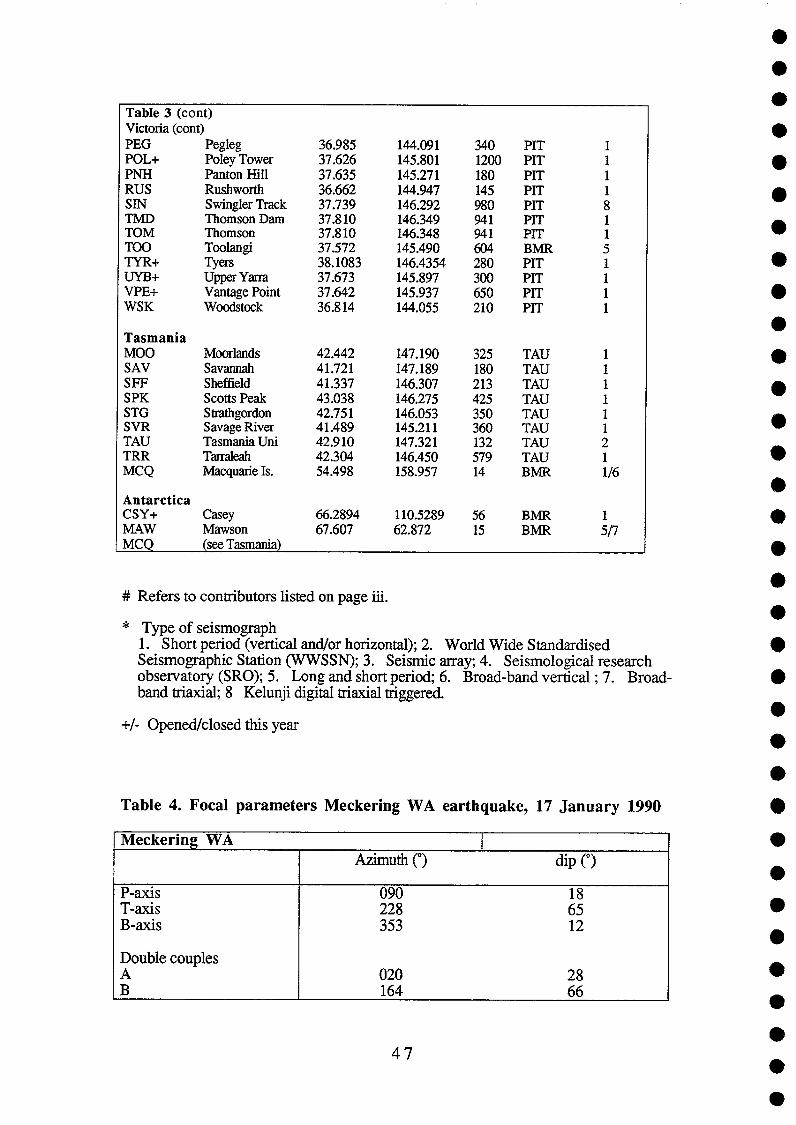
Table 3 (cont)Victoria (coat)PEG Pegleg 36.985 144.091 340 PIT 1POL+ Poley Tower 37.626 145.801 1200 PIT 1PNH Panton Hill 37.635 145.271 180 PIT 1RUS Rushworth 36.662 144.947 145 PIT 1SIN Swingler Track 37.739 146.292 980 PIT 8TMD Thomson Dam 37.810 146.349 941 PIT 1TOM Thomson 37.810 146.348 941 PIT 1TOO Toolangi 37.572 145.490 604 BMR 5TYR+ Tyeas 38.1083 146.4354 280 PIT 1UYB+ Upper Yana 37.673 145.897 300 PIT 1VPE+ Vantage Point 37.642 145.937 650 PIT 1WSK Woodstock 36.814 144.055 210 PIT 1
TasmaniaMOO Moorlands 42.442 147.190 325 TAU 1SAV Savannah 41.721 147.189 180 TAU 1SFF Sheffield 41.337 146.307 213 TAU 1SPK Scotts Peak 43.038 146.275 425 TAU 1STG Strathgordon 42.751 146.053 350 TAU 1SVR Savage River 41.489 145.211 360 TAU 1TAU Tasmania Uni 42.910 147.321 132 TAU 2TRR Tarraleah 42.304 146.450 579 TAU 1MCQ Macquarie Is. 54.498 158.957 14 BMR 1/6
AntarcticaCSY+ Casey 66.2894 110.5289 56 BMR 1MAW Mawson 67.607 62.872 15 BMR 5/7MCQ (see Tasmania)
••
# Refers to contributors listed on page iii.
* Type of seismograph1. Short period (vertical and/or horizontal); 2. World Wide StandardisedSeismographic Station (WWSSN); 3. Seismic array; 4. Seismological researchobservatory (SRO); 5. Long and short period; 6. Broad-band vertical ; 7. Broad-band triaxial; 8 Kelunji digital triaxial triggered.
+/- Opened/closed this year
Meckering WAAzimuth (°) dip (°)
P-axis 090 18T-axis 228 65B-axis 353 12
Double couplesA 020 28B 164 66
•47^ •
••••••••••••••••••••••
Table 4. Focal parameters Meckering WA earthquake, 17 January 1990^•
•
••••
•
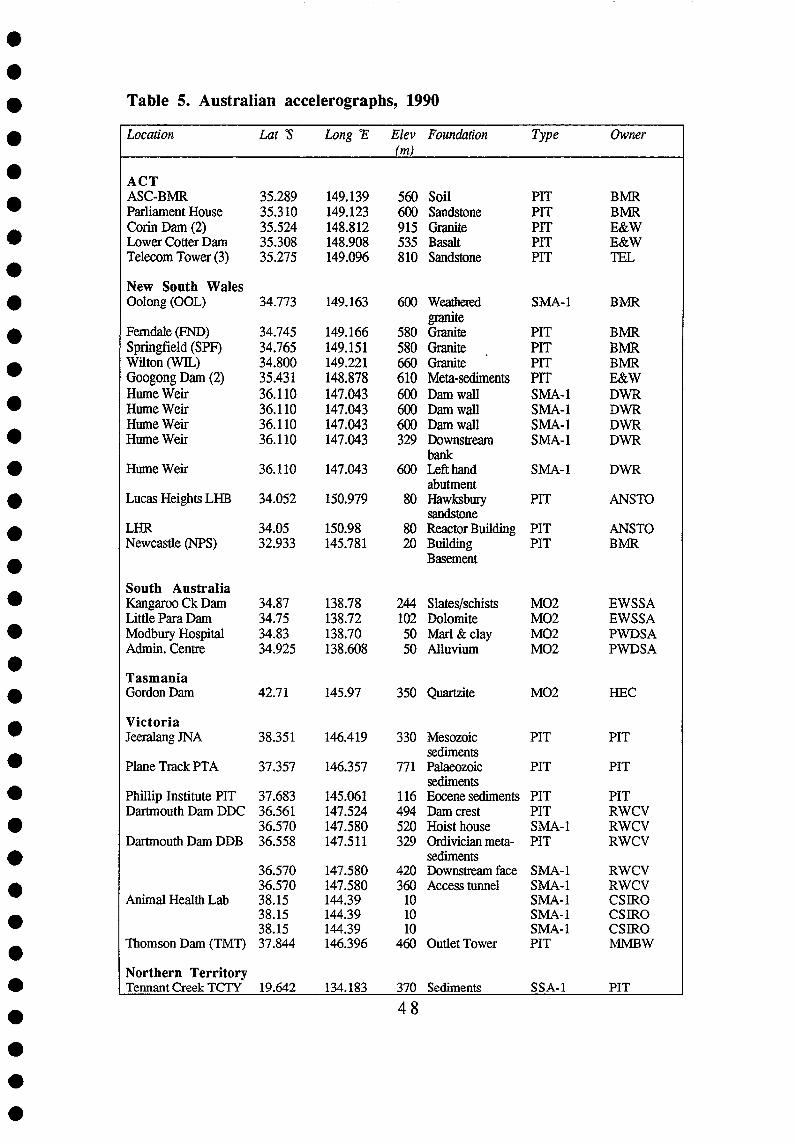
Table 5. Australian accelerographs, 1990
•
Location Lot S Long r Elev Foundation Type Owner(m)
AC T ASC-BMR 35.289 149.139 560 Soil PIT BMRParliament House 35.310 149.123 600 Sandstone PIT BIVIRCorin Dam (2) 35.524 148.812 915 Granite PIT E&WLower Cotter Dam 35.308 148.908 535 ^Basalt PIT E&WTelecom Tower (3) 35.275 149.096 810 Sandstone PIT TEL
New South WalesOolong (00L) 34.773 149.163 600 Weathered
graniteSMA-1 BMR
Ferndale (FND) 34.745 149.166 580 Granite PIT BMRSpringfield (SPF) 34.765 149.151 580 Granite PIT BMRWilton (W1L) 34.800 149.221 660 Granite PIT BMRGoogong Dam (2) 35.431 148.878 610 Meta-sediments PIT E&WHume Weir 36.110 147.043 600 Dam wall SMA-1 DWRHume Weir 36.110 147.043 600 Dam wall SMA-1 DWRHume Weir 36.110 147.043 600 Dam wall SMA-1 DWRHume Weir 36.110 147.043 329 Downstream
bankSMA-1 DWR
Hume Weir 36.110 147.043 600 Left handabutment
SMA-1 DWR
Lucas Heights LHB 34.052 150.979 80 Hawksburysandstone
PIT ANSTO
LHR 34.05 150.98 80 Reactor Building PIT ANSTONewcastle (NPS) 32.933 145.781 20 Building PIT BMR
Basement
South AustraliaKangaroo Ck Dam 34.87 138.78 244 Slates/schists MO2 EWSSALittle Para Dam 34.75 138.72 102 Dolomite MO2 EWSSAModbury Hospital 34.83 138.70 50 Marl & clay MO2 PWDSAAdmin. Centre 34.925 138.608 50 Alluvium MO2 PWDSA
TasmaniaGordon Dam 42.71 145.97 350 Quartzite MO2 HEC
VictoriaJeeralang JNA 38.351 146.419 330 Mesozoic
sedimentsPIT PIT
Plane Track PTA 37.357 146.357 771 Palaeozoicsediments
PIT PIT
Philip Institute PIT 37.683 145.061 116 Eocene sediments PIT PITDartmouth Dam DDC 36.561 147.524 494 Dam crest PIT RWCV
36.570 147.580 520 Hoist house SMA-1 RWCVDartmouth Dam DDB 36.558 147.511 329 Ordivician meta-
sedimentsPIT RWCV
36.570 147.580 420 Downstream face SMA-1 RWCV36.570 147.580 360 Access tunnel S MA-1 RWCV
Animal Health Lab 38.15 144.39 10 SMA-1 CSIRO38.15 144.39 10 SMA-1 CSIRO38.15 144.39 10 SMA-1 CSERO
Thomson Dam (TMT) 37.844 146.396 460 Outlet Tower PIT MMBW
Northern TerritoryTennant Creek TCTY 19.642 134.183 370 Sediments SSA-1 PIT
48

Table 5 (cont.)
QueenslandWivenhoe Dam 27.394 152.602 80 Crest A700 BAWB
27.395 152.603 28 Base A700 BAWB27.347 152.631 78 Power Station A700 QEC27.375 152.631 78 Power Station A700 QEC
Splityard Ck. Dam 27.379 152.641 170 Dam Wall A700 QEC27.375 152.641 65 Valve room A700 QEC
Tully Millstream 17.76 145.42 65 PIT QEC17.85 145.57 74 PIT QEC
Western AustraliaBallidu (BA-M) 30.607 116.707 300 Granite MO2 BMRCadouxAvery C. (CA-C) 30.851 117.160 300 Alluvium MO2 BMREmmott J. (CA-E) 30.895 117.123 320 Laterite A700 BMRICalajzic C. (CA-K) 30.718 117.141 380 LateriteGranite MO2 BMRKalajzic M. (CA-A) 30.746 117.151 320 Alluvium A700 BMRRobb A. (CA-R) 30.781 117.138 360 Alluvium MO2 BMRShanldand (CA-S) 30.810 117.132 400 W Granite MO2 BMRCanning DamLower gallery (CD--L) 32.154 116.126 142 Granite A700 BMRUpper gallery (CD-U) 32.154 116.126 202 Granite A700 BMRDowerin (DO-W) 31.010 116.982 300 Granite PIT BMRGoomalling (G0-0) 31.394 116.852 250 Granite PIT BMRKununurraDam abutment ICNA 16.113 128.737 Phyllite A700 WAWADam wall KNW 16.113 128.738 Rock fill, 3m
clay coreA700 WAWA
Meckering MEK 31.694 116.982 200 Alluvium BMRMundaringWeir MUW 31.958 116.164 140 Concrete wall SMA1 WAWA
42m highO'Connor museum 31.957 116.162 106 Concrete floor MO2 WAWAMUCNorth Dandalup NDD 32.52 116.01 205 Granite A700 WAWAPerthTelecom building PTB 31.953 115.850 10 Basement SMA1 TELTelecom building 31.953 115.850 40 Middle floor SMA1 TELPTMTelecom building PTT 31.953 115.850 70 Top floor SMA1 TELSerpentine DamBasement SEB 32.40 116.10 Granite A700 WAWAWall SEW 32.40 116.10 Earthfill A700 WAWAVictoria Dam YID 32.04 116.06 Granite A700 WAWA
AAEC Australian Atomic Energy Commission; BAWB Brisbane and Area Water BoardBMR Bureau of Mineral Resources, Canberra/Mundaring; EWSSA Engineering & Water SupplyDepartment, South Australia; E&W ACT Electricity and Water AuthorityHEC Hydroelectric Commission, Tasmania; MMBW Melbourne & Metropolitan Board of WorksPIT Seismology Research Centre, RMIT; PWDSA Public Works Department, South AustraliaPWDWA Public Works Department, Western Australia; QEC Queensland Electricity CommissionTEL Telecom (ACT & Perth); RWCV Rural Water Commission, VictoriaDWR Department of Water Resources, NSW; WAWA Water Authority of Western Australia
49

Date^TimeUTC
Lat°s
LongoE
ML Site *HIEkm
Comp T(S)s
Accnuns-2
01 17 0638 31.72 116.99 5.5 DO-W 78/78 PZ 0.15 4.0PN 0.15 4.0PE 0.15 2.0SZ 0.075 23.0SN 0.075 21.0SE 0.075 93.0
CA-E 90/90 PZ 0.104 26.0PN 0.129 30.0PE 0.153 49.0SZ 0.104 18.0SN 0.153 26.0SE 0.153 72.0
MU-W 90/90 Z 0.08 98.0N 0.05 75.0E 0.08 278.0
CA-S 100/100 LZ 0.046 31.0LN 0.052 35.0LE 0.058 51.0
CD-U 100/100 PZ 0.25 15.0PN (0.2) 12.0PE (0.3) 18.0SZ 0.15 29.0SN (0.7) 44.0SE 0.13 123.0
CD-L 100/100 SZ 18.0SN 0.2 15.0SE 0.164 18.0
CA-K 110/110 SZ 0.059 17.0SN 0.059 5.0SE 0.059 29.0LZ 0.147 24.0LN 0.059 16.0LE 0.147 40.0
02 23 1243 33.00 151.43 2.9 NPS 3.64 s PZ 0.04 3.1PN 0.04 1.1PE 0.04 1.6SZ 0.1 1.9SN 0.1 4.9SE 0.1 4.9
05 08 1841 30.78 117.10 4.5 CA-S 4/6 PZ 0.035 155.0PN 0.030 91.0PE 0.030 86.0SZ 0.035 360.0SNSE 0.035 910.0LZ 0.097 580.0
Table 6.^Australian accelerograms, 1990
50

Table 6 (cont.)05 08 1841 30.78 117.10 4.5 CA-A 6/6 PZ 0.103 137.0
PN 0.074 61.0PE 0.074 65.0SZ 0.035 607.0SN 0.025 2458.0SE 0.056 2036.0
05 08 1841 30.78 117.10 4.5 CA-K 8/8 PZ 0.050 154.0PN 0.050 108.0PE 0.050 114.0SZ 0.065 632.0SN 0.053 457.0SE 0.059 685.0
CA-E 15/15 PZ 0.039 47.0PN 0.10 16.0PE 0.10 14.0SZ 0.125 128.0SN 0.147 140.0SE 0.145 309.0
DOW 28/28 PZ 0.05 18.0PN 0.03 33.0SZ 0.04 61.0SN 0.035 65.0
00-0 68/68 PZ 0.043 8.0PN 0.043 8.0PE 0.043 18.0SZ 0.043 40.0SN 0.043 33.0LE 0.043 74.0
5 11 0222 37.759 146.37 3.0 JNA 66/66 SZ 0.085 0.73SN 0.08 0.75SE 0.095 0.73
5 19 1709 37.761 146.37 3.0 PTA 13.6/13 SZ 0.135 9.3SN 0.115 19.0SE 0.15 16.2
TMT 10/9.4 SZ 0.09 35.9SN 0.06 26.28SE 0.06 21.74
•••
•
••••
••••••••••••••••
* Hypocentral/epicentral distance (km) or (S-P) time (seconds)^ •••
5 1^ •
41

•
•
• Table 7. Principal world earthquakes, 1990
• (Earthquakes of magnitude 7.0 or greater, or causing fatalities or substantial damage).PAS Pasadena, BRK Berkeley, PMR Palmer, Alaska, PAL Palisades, New York, JMA JapanMeteorological Agency, TRI Trieste, NES US Geological Survey)*.0Date^Origin Time (UTC)^Region^Lat.^Long.^Magnitude
•
• 28 Feb^23 43 36.6^Southern California^34.140 N^117.700 W 5.5 mb, 5.5 Ms5.2 ML (PAS)
• 6.2 ML (BRK)
• Depth 5 km. Thirty people received minor injuries and damage was estimated to be at least 12.7 milliondollars. Some damage (VII) at Claremont, Covina, La Verne, Montclair, Mount Baldy, Ontario, Pomona,
•San Dimas, Upland and Walnut. Slight damage (VI) at Arcadia, Azusa, Chino, Colton, Compton,Glendora, Lincoln Heights, Lytle Creek, Pico Rivera and West Covina. Felt from Santa Barbara toEnsenada, Mexico and northeast as far as Las Vegas, Nevada.
•03 Mar^12 16 27.9^South of Fiji Islands^22.122 S^175.163 E^6.3 mb, 7.4 Ms
• 7.4 Ms (BAK)7.1 Ms (PAS)
•Depth 33 km.
• 04 Mar^19 46 19.6^Pakistan^28.925 N^66.331 E^5.8 mb, 6.1 Ms
• Depth 10 km. At least 11 people killed, about 40 injured and many homes and buildings damaged in theKalat area. Also felt at Quetta and Mastung. Complex event.
•05 Mar^16 38 12.5^Vanuatu Islands^18.318 S^168.063 E^5.6 mb, 7.0 Ms
• 7.0 Ms (BRK)6.8 Ms (PAS)
•Depth 21 km. Felt (V) at Port Vila.
•25 Mar^13 22 55.6^Costa Rica^9.919 N^84.808W 6.2 mb, 7.0 Ms
• 6.8 Ms (BRK)
•Depth 22 km. Ten people slightly injured. Damage (VIII) in the Puntarenas area and about 60 buildingsseverely damaged (VII) in the San Jose area. Several landslides blocked roads in the area for a short time.Felt throughout Costa Rica and southwestern Nicaragua. Felt (IV) at Ahnirante and Puerto Annuelles and
• III and David, Panama.
• 18 Apr^13 39 19.0^Minahassa Peninsula^1.186 N^122.857E^6.2 mb, 7.4 Ms7.3 Ms (BRK)
IIDepth 26 km. At least 3 people killed and 25 people injured. More than 1,140 houses damaged in the
• Bolaang-Gorontalo area. Felt strongly throughout the IvIinahassa Peninsula. Also felt in central Sulawesi.Two events about 4.5 seconds apart.
• 26 Apr^09 37 15.0^Qinghai Province,^35.986 N^100.245 E^6.5 mb, 6.9 Ms
•China^ 6.7 Ms (BRK)
6.4 Ms (PAS)
• Depth 8 km. At least 126 people killed, many injured, extensive damage and landslides in the Gonghe-Xinghai area. Also felt in Gansu Province.
•
••• 52
••
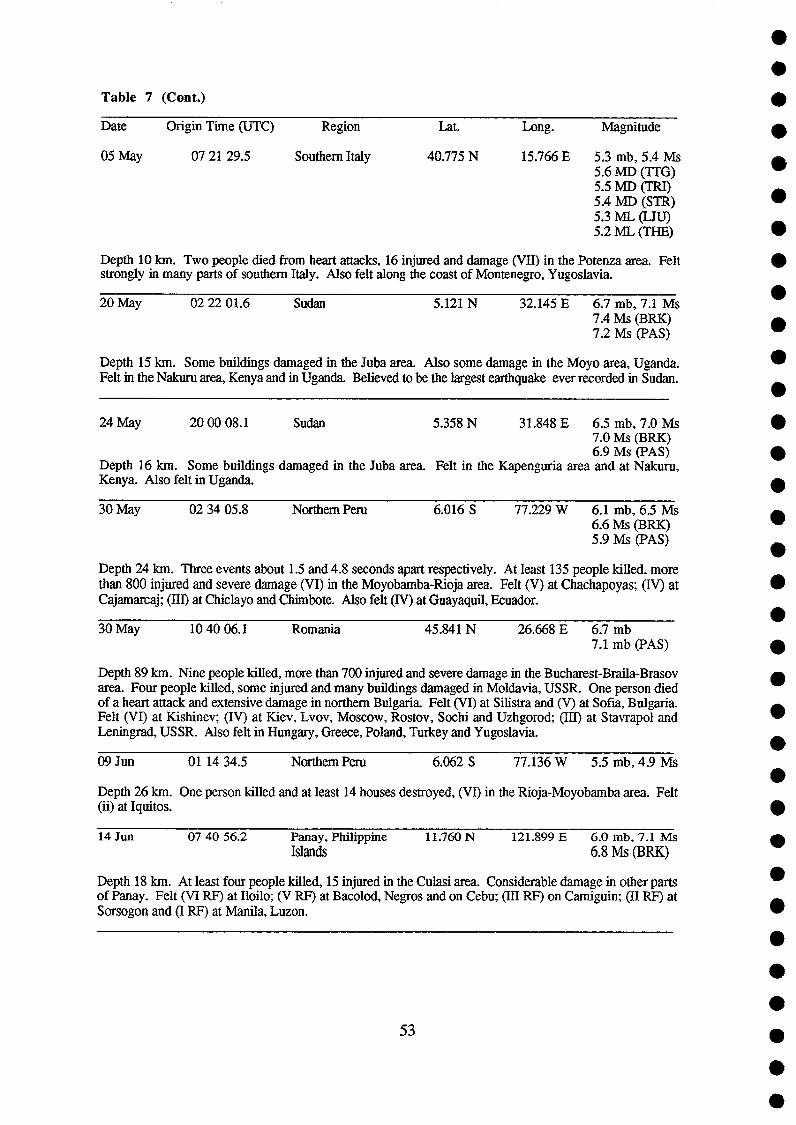
Table 7 (Cont.)
Date^Origin Time (UTC)^Region^Lat.^Long.^Magnitude
05 May^07 21 29.5^Southern Italy^40.775 N^15.766 E^5.3 mb, 5.4 Ms5.6 MD (TTG)5.5 MD (TRI)5.4 MD (STR)5.3 ML (LJU)5.2 ML (THE)
Depth 10 km. Two people died from heart attacks, 16 injured and damage (VII) in the Potenza area. Feltstrongly in many parts of southern Italy. Also felt along the coast of Montenegro, Yugoslavia.
20 May^02 22 01.6^Sudan^5.121 N^32.145 E^6.7 mb, 7.1 Ms7.4 Ms (BRK)7.2 Ms (PAS)
Depth 15 km. Some buildings damaged in the Juba area. Also some damage in the Moyo area, Uganda.Felt in the Nakuru area, Kenya and in Uganda. Believed to be the largest earthquake ever recorded in Sudan.
24 May^20 00 08.1^Sudan^5.358 N^31.848 E 6.5 mb, 7.0 Ms7.0 Ms (BRK)6.9 Ms (PAS)
Depth 16 km. Some buildings damaged in the Juba area. Felt in the Kapenguria area and at Nakuru,Kenya. Also felt in Uganda.
30 May^02 34 05.8^Northern Peru^6.016 S^77.229 W^6.1 mb, 6.5 Ms6.6 Ms (BRK)5.9 Ms (PAS)
Depth 24 km. Three events about 1.5 and 4.8 seconds apart respectively. At least 135 people killed, morethan 800 injured and severe damage (VI) in the Moyobatnba-Rioja area. Felt (V) at Chachapoyas; (IV) atCajamarcaj; (III) at Chiclayo and Chitnbote. Also felt (IV) at Guayaquil, Ecuador.
30 May^10 40 06.1^Romania^45.841 N^26.668 E 6.7 mb7.1 mb (PAS)
Depth 89 km. Nine people killed, more than 700 injured and severe damage in the Bucharest-Braila-Brasovarea. Four people killed, some injured and many buildings damaged in Moldavia, USSR. One person diedof a heart attack and extensive damage in northern Bulgaria. Felt (VI) at Silistra and (V) at Sofia, Bulgaria.Felt (VI) at Kishinev; (IV) at Kiev, Lvov, Moscow, Rostov, Sochi and Uzhgorod; (HI) at Stavrapol andLeningrad, USSR. Also felt in Hungary, Greece, Poland, Turkey and Yugoslavia.
09 Jun^01 14 34.5^Northern Peru^6.062 S^77.136 W^5.5 mb, 4.9 Ms
Depth 26 km. One person killed and at least 14 houses destroyed, (VI) in the Rioja-Moyobamba area. Felt(ii) at Iquitos.
14 Jun^07 40 56.2^Panay, Philippine^11.760 N^121.899 E^6.0 mb, 7.1 MsIslands^ 6.8 Ms (BRK)
Depth 18 km. At least four people killed, 15 injured in the Culasi area. Considerable damage in other partsof Panay. Felt (VI RF) at Iloilo; (V RF) at Bacolod, Negros and on Cebu; (III RF) on Camiguin; (II RF) atSorsogon and (I RF) at Manila, Luzon.
53
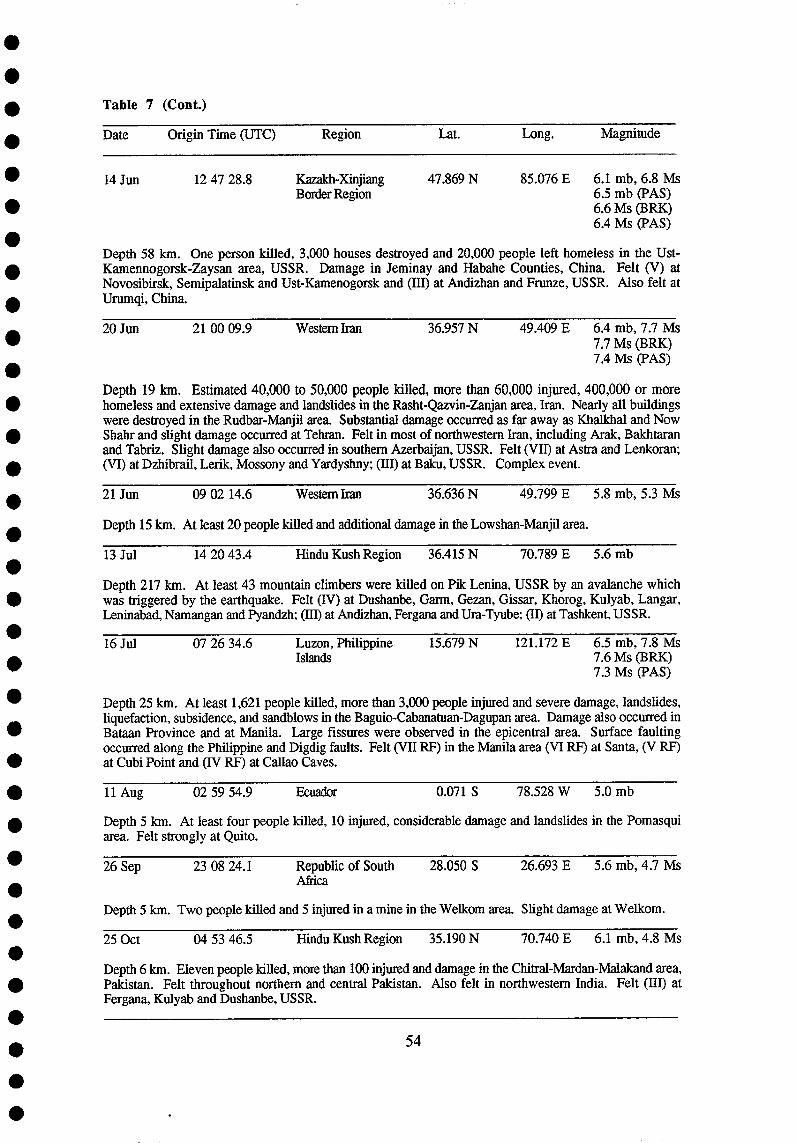
Table 7 (Cont.)
Date^Origin Time (UTC)^Region^Lat.^Long.^Magnitude
14 Jun 12 47 28.8 Kazakh-Xinjiang 47.869 N 85.076 E 6.1 mb, 6.8 MsBorder Region 6.5 mb (PAS)
6.6 Ms (BRK)6.4 Ms (PAS)
Depth 58 km. One person killed, 3,000 houses destroyed and 20,000 people left homeless in the Ust-Kamennogorsk-Zaysan area, USSR. Damage in Jeminay and Habahe Counties, China. Felt (V) atNovosibirsk, Semipalatinsk and Ust-Kamenogorsk and (III) at Andizhan and Frunze, USSR. Also felt atUrumqi, China.
20 Jun^21 00 09.9^Western Iran^36.957 N^49.409 E 6.4 mb, 7.7 Ms7.7 Ms (BRK)7.4 Ms (PAS)
Depth 19 km. Estimated 40,000 to 50,000 people killed, more than 60,000 injured, 400,000 or morehomeless and extensive damage and landslides in the Rasht-Qazvin-Zanjan area, Iran. Nearly all buildingswere destroyed in the Rudbar-Manjil area. Substantial damage occurred as far away as Khalkha' and NowShahr and slight damage occurred at Tehran. Felt in most of northwestern Iran, including Aralc, Balchtaranand Tabriz. Slight damage also occurred in southern Azerbaijan, USSR. Felt (VII) at Astra and Lenkoran;(VI) at Dzhibrail, Lerik, Mossony and Yardyshny; (III) at Baku, USSR. Complex event.
21 Jun^09 02 14.6^Western Iran^36.636 N^49.799 E^5.8 mb, 5.3 Ms
Depth 15 km. At least 20 people killed and additional damage in the Lowshan-Manjil area.
13 Jul^14 2043.4^Hindu Kush Region^36.415 N^70.789 E^5.6 mb
Depth 217 km. At least 43 mountain climbers were killed on Pik Lenina, USSR by an avalanche whichwas triggered by the earthquake. Felt (IV) at Dushanbe, Gann, Gezan, Gissar, Khorog, Kulyab, Langar,Leninabad, Namangan and Pyandzh; (III) at Andizhan, Fergana and Ura-Tyube; (II) at Tashkent, USSR.
16 Jul^07 26 34.6^Luzon, Philippine^15.679 N^121.172 E^6.5 mb, 7.8 MsIslands^ 7.6 Ms (BRK)
7.3 Ms (PAS)
Depth 25 km. At least 1,621 people killed, more than 3,000 people injured and severe damage, landslides,liquefaction, subsidence, and sandblows in the Baguio-Cabanatuan-Dagupan area. Damage also occurred inBataan Province and at Manila. Large fissures were observed in the epicentral area. Surface faultingoccurred along the Philippine and Digdig faults. Felt (VII RF) in the Manila area (VI RF) at Santa, (V RF)at Cubi Point and (IV RE) at Callao Caves.
11 Aug^02 59 54.9^Ecuador^0.071 S^78.528 W^5.0 mb
Depth 5 km. At least four people killed, 10 injured, considerable damage and landslides in the Pomasquiarea. Felt strongly at Quito.
26 Sep^23 08 24.1^Republic of South^28.050 S^26.693 E^5.6 mb, 4.7 MsAfrica
Depth 5 km. Two people killed and 5 injured in a mine in the Welkom area. Slight damage at Welkom.
25 Oct^04 53 46.5^Hindu Kush Region^35.190 N^70.740 E^6.1 mb, 4.8 Ms
Depth 6 km. Eleven people killed, more than 100 injured and damage in the Chitral-Mardan-Malakand area,Pakistan. Felt throughout northern and central Paldstan. Also felt in northwestern India. Felt (III) atFergana, Kulyab and Dushanbe, USSR.
54

••
Table 7 (Cont.)
Date^Origin Time (UTC)^Region^Lat.^Long.^Magnitude
06 Nov^18 45 54.1^Southern Iran^28.234 N^55.455 E^6.2 mb, 6.8 Ms6.7 Ms (BRK)^•
Depth 25 km. At least 22 people killed, 100 injured, 21,000 homeless and 18 villages severely damaged inthe Darab area.
06 Nov^20 14 30.9^Komandorsky Islands 53.468 N^169.929 E^6.4 mb, 7.0 MsRegion^ 6.8 Ms (BRK)
Depth 32 km. Felt (IV) on Attu and Shemya.
01 Dec^18 09 28.8^Kirghiz SSR^40.797 N^73.622 E^5.0 mb, 4.6 Ms
Depth 32 km. Approximately 3000 people homeless and more than 940 buildings damaged (VI) in theUzgen area. Felt (V) at Dzhalal-Abad and (IV) at Osh. Also felt at Frunze.^ 013 Dec 00 24 24.3 Sicily 37.198 N 15.502 E 5.4 mb
Depth 10 km. At least 19 people killed, about 200 injured, 2,500 homeless and severe damage (VII) in theCarlentini area. Damage also occurred at Augusta, Lentini and Noto and slight damage occurred as far awayas Cefalu. Felt as far west as Trapani.
13 Dec^03 01 49.0^Taiwan 24.032 N^121.669 E^5.9 mb, 6.2 Ms •Depth 14 km. At least 2 people killed and 3 people injured. Damage (IV JMA) at Hualien. Also felt (IVJMA) at Taipei. (III JMA) at Chiai, Hsinchu and Ilan. (II JMA) at Chilung and Taitung and (I JMA) atKaohsiung.
21 Dec 06 57 44.0 Greece 40.984 N 22.338 E 5.8 mb, 5.9 Ms
Depth 18 km. One person killed, at least 60 injured and damage in the Edhessa-Killds area. Several peopleinjured slightly and some buildings damaged (VIII) in the Gevgelija-Strumica area, Yugoslavia. Felt inMacedonia and southern Serbia, Yugoslavia. Also felt in Albania and at Mikhailovgrad, Plovdiv and (IV) atSofia, Bulgaria. Felt (III) at Bucharest, Romania.
22 Dec 17 27 54.8 Costa Rica 9.908 N 84.299 W 5.3 mb, 5.6 Ms
Depth 13 km. One person killed at Alajuela, one person died of a heart attack and about 350 people injuredin central Costa Rica. Damage (VIII) at Santiago de Puriscal, (VII) at Alajuela and (VI) at Heredia and SanJose. Felt throughout Costa Rica and in western Panama. •30 Dec^19 14 19.7^New Britain Region^5.090 S^150.984 E^6.7 mb, 7.0 MsDepth 188 km. Some damage in the Hoskins area. Felt at Port Moresby and many parts of Papua NewGuinea.
55
••S••••
••••••••
•••S••S•••
••
•
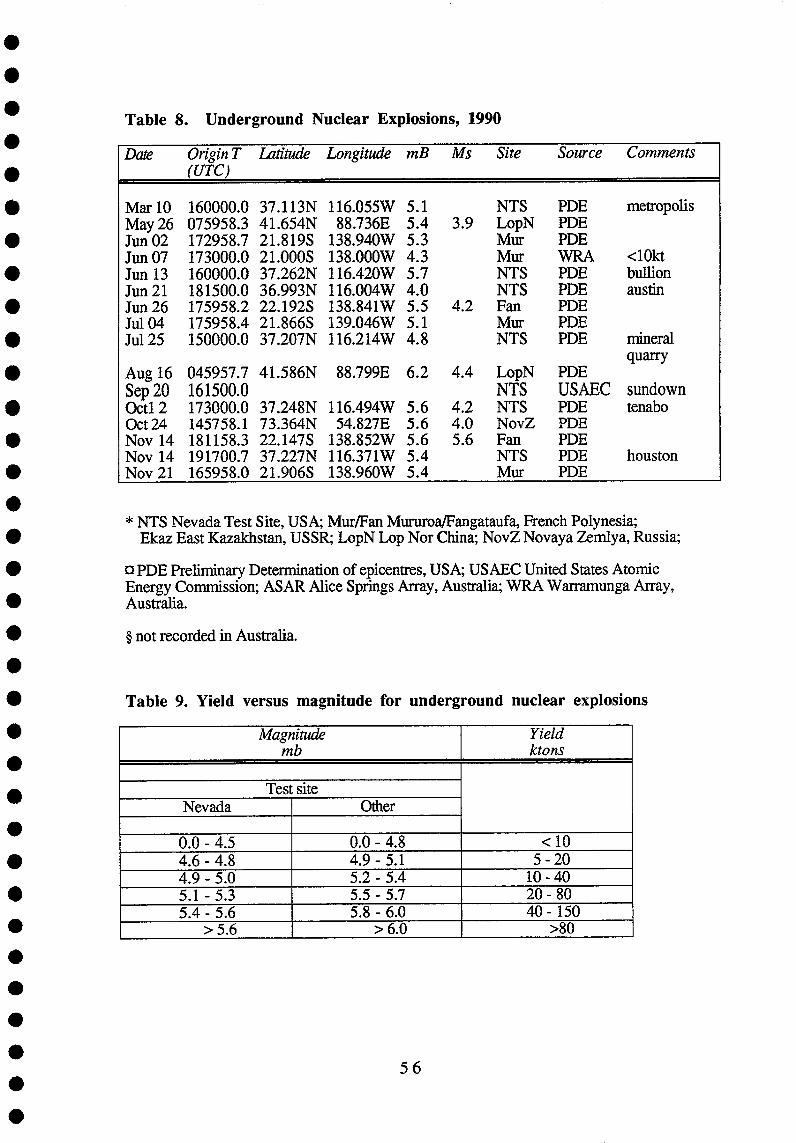
Date Origin T Latitude Longitude mB Ms Site Source Comments(UTC)
Mar 10 160000.0 37.113N 116.055W 5.1 NTS PDE metropolisMay 26 075958.3 41.654N 88.736E 5.4 3.9 LopN PDEJun 02 172958.7 21.819S 138.940W 5.3 Mur PDEJun 07 173000.0 21.000S 138.000W 4.3 Mur WRA <101ctJun 13 160000.0 37.262N 116.420W 5.7 NTS PDE bullionJun 21 181500.0 36.993N 116.004W 4.0 NTS PDE austinJun 26 175958.2 22.192S 138.841W 5.5 4.2 Fan PDEJul 04 175958.4 21.866S 139.046W 5.1 Mur PDEJul 25 150000.0 37.207N 116.214W 4.8 NTS PDE mineral
quarryAug 16 045957.7 41.586N 88.799E 6.2 4.4 LopN PDESep 20 161500.0 NTS USAEC sundownOct1 2 173000.0 37.248N 116.494W 5.6 4.2 NTS PDE tenaboOct 24 145758.1 73.364N 54.827E 5.6 4.0 NovZ PDENov 14 181158.3 22.147S 138.852W 5.6 5.6 Fan PDENov 14 191700.7 37.227N 116.371W 5.4 NTS PDE houstonNov 21 165958.0 21.906S 138.960W 5.4 Mur PDE
•
• Table 9. Yield versus magnitude for underground nuclear explosions•••••••
Magnitudemb
Yieldktons
Test siteNevada Other
0.0 - 4.5 0.0 - 4.8 <104.6 - 4.8 4.9 - 5.1 5 -204.9 - 5.0 5.2 - 5.4 10 - 405.1 - 5.3 5.5 - 5.7 20 - 805.4- 5.6 5.8 - 6.0 40- 150
> 5.6 > 6.0 >80
•••^Table 8. Underground Nuclear Explosions, 1990••••••••••••
* NTS Nevada Test Site, USA; Mur/Fan Mururoaffangataufa, French Polynesia;• Ekaz East Kazakhstan, USSR; LopN Lop Nor China; NovZ Novaya Zemlya, Russia;
O PDE Preliminary Determination of epicentres, USA; USAEC United States AtomicEnergy Commission; ASAR Alice Springs Array, Australia; WRA Warramunga Array,Australia.
• § not recorded in Australia.
••
••••• 56
•

APPENDIX Modified Mercalli (MM) Scale of Earthquake Intensity(after Eiby, 1966)
••
MMI^Not felt by humans, except in especially favourable circumstances, but birdsand animals may be disturbed. Reported mainly from the upper floors of buildingsmore than ten storeys high. Dizziness or nausea may be experienced. Branches oftrees, chandeliers, doors, and other suspended systems of long natural period maybe seen to move slowly. Water in ponds, lakes, reservoirs, etc., may be set intoseiche oscillation.
MIVIII Felt by a few persons at rest indoors, especially by those on upper floors orotherwise favourably placed. The long-period effects listed under MM I may bemore noticeable.
MMIll Felt indoors, but not identified as an earthquake by everyone. Vibrationsmay be likened to the passing of light traffic. It may be possible to estimate theduration, but not the direction.Hanging objects may swing slightly. Standingmotorcars may rock slightly.
MMIV Generally noticed indoors, but not outside. Very light sleepers may beawakened. Vibration may be likened to the passing of heavy traffic, or to the joltof a heavy object falling or striking the building. Walls and frame of building areheard to creak. Doors and windows rattle. Glassware and crockery rattle. Liquidsin open vessels may be slightly disturbed. Standing motorcars may rock, and theshock can be felt by their occupants.
MMV Generally felt outside, and by almost everyone indoors. Most sleepersawakened. A few people frightened. Direction of motion can be estimated. Smallunstable objects are displaced or upset. Glassware and crockery may be broken.Some windows crack. A few earthenware toilet fixtures crack. Hanging picturesmove. Doors and shutters swing. Pendulum clocks stop, start, or change rate.
MMVI Felt by all. People and animals alarmed. Many run outside. Difficultyexperienced in walking steadily. Slight damage to masonry D. Some plastercracks or falls. Isolated cases of chimney damage. Windows and crockerybroken. Objects fall from shelves, and pictures from walls. Heavy furnituremoves. Unstable furniture overturns. Small school bells ring. Trees and bushesshake, or are heard to rustle. Material may be dislodged from existing slips, talusslopes, or slides.
MM VII General alarm. Difficulty experienced in standing. Noticed by drivers ofmotorcars. Trees and bushes strongly shaken. Large bells ring. Masonry Dcracked and damaged. A few instances of damage to Masonry C. Loosebrickwork and tiles dislodged. Unbraced parapets and architectural ornamentsmay fall. Stone walls crack. Weak chimneys break, usually at the roof-line.Domestic water tanks burst. Concrete irrigation ditches damaged. Waves seen onponds and lakes. Water made turbid by stirred-up mud. Small slips, and caving-inof sand and gravel banks.
MM VIII Alarm may approach panic. Steering of motor cars affected. Masonry Cdamaged, with partial collapse. Masonry B damaged in some cases. Masonry Aundamaged. Chimneys, factory stacks, monuments, towers, and elevated tankstwisted or brought down. Panel walls thrown out of frame structures. Some brickveneers damaged. Decayed wooden piles break. Frame houses not secured to thefoundation may move. Cracks appear on steep slopes and in wet ground.Landslips in roadside cuttings and unsupported excavations. Some tree branchesmay be broken off.
57•••

• M MIX General panic. Masonry D destroyed. Masonry C heavily damaged,sometimes collapsing completely. Masonry B seriously damaged. Frame
• structures racked and distorted. Damage to foundations general. Frame houses notsecured to the foundations shift off. Brick veneers fall and expose frames.
• Cracking of the ground conspicuous. Minor damage to paths and roadways. Sandand mud ejected in alluviated areas, with the formation of earthquake fountains
• and sand craters. Underground pipes broken. Serious damage to reservoirs.
• MMX Most masonry structures destroyed, together with their foundations. Somewell-built wooden buildings and bridges seriously damaged. Dams, dykes, and
• embankments seriously damaged. Railway lines slightly bent. Cement and asphaltroads and pavements badly cracked or thrown into waves. Large landslides onriver banks and steep coasts. Sand and mud on beaches and flat land movedhorizontally. Large and spectacular sand and mud fountains. Water from rivers,
• lakes, and canals thrown up on the banks.
• MMXI Wooden frame structures destroyed. Great damage to railway lines. Greatdamage to underground pipes.
•MMXII Damage virtually total. Practically all works of construction destroyed or
• greatly damaged. Large rock masses displaced. Lines of slight and level distorted.Visible wave-motion of the ground surface reported. Objects thrown upwards into
• the air.
• Categories of non-wooden construction• Masonry A Structures designed to resist lateral forces of about 0.1 g, such as those• satisfying the New Zealand Model Building By-law, 1955. Typical buildings of this
kind are well reinforced by means of steel or ferro-concrete bands, or are wholly of• ferro-concrete construction. All mortar is of good quality and the design and
workmanship are good. Few buildings erected prior to 1935 can be regarded as• Masonry A.
• Masonry B Reinforced buildings of good workmanship and with sound mortar, butnot designed in detail to resist lateral forces.
• Masonry C Buildings of ordinary workmanship, with mortar of average quality. No• extreme weakness, such as inadequate bonding of the corners, but neither designed nor
reinforced to resist lateral forces.• Masonry D Buildings with low standards of workmanship, poor mortar, or• constructed of weak materials like mud brick and rammed earth. Weak horizontally.
Notes• Window breakage depends greatly upon the nature of the frame and its orientation with
respect to the earthquake source. Windows cracked at MM V are usually either large• display windows, or windows tightly fitted to metal frames.
• The 'weak chimneys' listed under MM VIE are unreinforced domestic chimneys ofbrick, concrete block, or poured concrete.
The 'domestic water tanks' listed under MM VII are of the cylindrical corrugated-iron• type common in New Zealand rural areas. If these are only partly full, movement of the
water may burst soldered and riveted seams. Hot-water cylinders constrained only by• supply and delivery pipes may move sufficiently to break pipes at about the same
intensity.•
58•
a


![AMS GIAU YES O AUSAIA YMEOEA III/media/Documents/QM/About+Us/...AMS GIAU YES O AUSAIA YMEOEA III ^57 a eso [= Gooae] Q ue 1913 a a i i uy QM cas o seaae is a sies as oows Ca 1 - 1](https://static.fdocuments.net/doc/165x107/60b3aac0b290a712027ea813/ams-giau-yes-o-ausaia-ymeoea-iii-mediadocumentsqmaboutus-ams-giau-yes-o.jpg)