AURALISATION OF DEEP CONVOLUTIONAL NEURAL NETWORKS: LISTENING TO LEARNED FEATURES

Auteur, Titel 1
Auralisation of a Scale Model of the Royal Albert HallDipl. Phys. K.-H. LorenzAdviesbureau Peutz & Associés B.V., Lindenlaan 41, PB NL-6585 ZH Mook, [email protected]
AbstractFollowing the law of acoustical similarity, the improvement of existing and design of new enclosures have beenstudied since Spandöck by means of scale model measurements. Auralisation, making measurements audible, became possible by measuring impulse responses in modelfrequency range (e.g. 600 Hz-92 kHz, scale 1:12). Main problem is absorption by oxygen and water molecules leading to energy dissipation increasing with timeand frequency. Instead of using a closed cavity filled with nitrogen or dried air the correction of model impulseresponses can be done by computer equipment. Here, a time- and frequency varying filter, computed in MATLAB, supplies equalisation of the speaker andmodel dummy head, compensation of high frequency attenuation and correction of the decay for noise.The auralisation of the corrected and compensated binaural impulse responses is done by convolution withanechoic music recordings and special HRTF filters, using the difference of a special real scale dummy headand the test person to get individual frequency correction spectra for each listener. The application to a scale model of the Royal Albert Hall in different stage and reflector setups to reduce thefamous echo further and to make improvements audible is presented with examples of convolved music.
1. IntroductionThe quotation above of the pioneer of room acoustic model measurements F. Spandöck leadsdirectly to the problems of this subject: the modelling of sound fields in enclosure scalemodels has its base in the laws of acoustical similarity [1]:
λ λ λλ
M
M
R
R
M
R
M
RM
R
MRl l
Mll
fM
cc
f= = = =; ;1
. (1)
The correct modeling of halls and refraction phenomena requires the wavelengths in theModel λλλλM to have the same relation to the dimensions of the model lM as the wavelength λλλλRto the dimension lR in the real enclosure. The interesting frequency range for models istherefore by the scale factor higher than in reality: in real halls the range from 50 Hz to 8 kHzis the most important, in 1 by 12 scale model like that of the Royal Albert Hall the interestingfrequency range is 600 Hz to 196 kHz. This indicates the need to use loudspeakers andmicrophones that are capable to operate in ultrasonic frequency range.If the walls in the model have similar absorption properties for the corresponding frequencyrange like the real walls in the real frequency range, the sound fields in the model should besimilar to the sound fields in the real hall in the limit of how good the details are modeled –that is the idea.A major problem in model measurements and auralisation is the fact that the in the filling gasair the oxygen molecules are influenced in their relaxation behavior by water molecules. This

2 NAG-Journaal
leads to a dissipation of energy increasing with traveling time and frequency which is highlynonlinear. The dissipation coefficient δδδδ is a function of frequency f, temperature ϑϑϑϑ andrelative humidity ϕϕϕϕ of the air and can empirically be estimated to the rule-of-thumb [1]:
CmkHz
ff °=⋅⋅
≈ − 20,110
%/85),,( 4
2
ϑϕ
ϕϑδ . (2)
Former solution for smaller models was the use of Nitrogen as filling gas, which does notshow this high frequency attenuation effect – but filling a 5 m long and 2.5 m high 1 by 12scale model like the one of the Royal Albert Hall would require an even bigger anechoicvacuum vessel of about 50 m3 volume which had to be filled with Nitrogen! To overcome this rather uneconomic solution formerly also a drying up of normal air wasapplied, which was also effective because dry air without water molecules behaves much lessabsorbing; but this method suffered from the long drying times before it was possible tomeasure [1]. But this method, too, was only practicable for small models.The aim of these methods was to get a valid modeling of the sound-field of the hall in thescale model. For room acoustic purposes reverberation times and ETCs of the first hundredsof milliseconds may be sufficient with the use of correction formulas, but for auralisationvalid impulse responses have to be measured.
2. Model Measurements – Equipment and procedureThe first step in auralisation of model impulse responses is the measurement of valid andhighly repeatable model room impulses. Validation measurements were made in the realRoyal Albert Hall. Then impulse responses were measured in the 1:12 scale model of theRAH of the company Peutz nearby Nijmegen at the same positions as before in the real hall:
Figure 1: 1:12 Scale Model of the Royal Albert Hall Figure 2: Model Source and Dummy HeadThe impulse responses were measured using the maximum-length-sequence based programWINMLS 2.0 by the SEKD Prodif 96 Pro card with a MLS sequence order of 16 at a samplefrequency of 96 kHz. This fact restricted the frequency range of the result to 4 kcpsmaximum. This seems to be low, but is perhaps enough for a realistic impression.The microphones used were Monacor MCD 2500 capsules for the monaural, and the modeldummy head with built-in Sennheiser KE 4-211-2 capsules for the binaural impulseresponses. The used sound source was a Motorola piezo-effect high frequency loudspeaker,which was covered by a special developed symmetrical cone out of hard foam material. Thesource and receivers are the critical part in this system, as the calibration measurements willshow below, due to the limited and spiky frequency responses. On a scale 1:12 even more

Auteur, Titel 3
than in reality all possible things are obstacles in the sound field so that refraction may occuranywhere. Furthermore special microphones and power amplifiers were used to ensure a flatfrequency response up to 48 kHz.
3. Auralisation of Model Impulse ResponsesThe task was to find a way to correct the more than proportional air absorption of highfrequencies in measured impulse responses of a model of the famous Royal Albert Hall inLondon by use of a computer. The way to do this was to implement a module in theprogramming platform MATLAB, which solved all the parts of this problem in one:to correct the frequency responses of the combination of source and microphone used, to compensate for the air absorption of the model impulse responses, to remove the amplifiednoise background, and to correct the tail of the responses.The aim was to convolve these corrected impulse responses with music recorded in ananechoic room and to compare the results to the original convolutions of the Royal AlbertHall measurements regarding their frequency-limited bandwidth.
2.1 Air Absorption in Scale Models – Ways of SolvingMeasurements in room models filled with air generally suffer from high-frequency-absorption which is much higher than the law of acoustical similarity predicts. By travelingthrough the medium air, sound waves are damped by a frequency- and traveling-time-dependent attenuation due to dissipation of their energy, following the Law of Lambert-Beer:
I(t)=I0 • exp (-δ t). (3)For the special conditions of 293K temperature, normal pressure of p=1013 H Pa and arelative humidity of 55% the following figure 3 (taken from [2]) shows the enormouseffect on to high frequencies of sound in air and the need to correct model room impulsemeasurements for this effect, which seems to be rather small, but turns out to be in therange of dozens of dB in a several m large model and several hundred ms travelingtimes. Apart from the expensive filling of a scale model with nitrogen one can use thecapabilities of modern computing power to calculate the reduction in the amount ofabsorption and to correct the measurements by applying digital audio processing.The basic principles of this process were developed and described by [2].
102
103
104
-70
-60
-50
-40
-30
-20
-10
0
10
Fre quency respo nse o f transducers
Leve
l (dB
)
F re que ncy (Hz )
Figure 3: Magnitude and Phase of δ δ δ δ (from [2]) Figure 2: Frequency Response of Model Transducers

4 NAG-Journaal
2.1.1 Problem 1: Equalisation of Source and MicrophoneFor the fact, that both source and microphone work in the region of ultrasonic and the mostimportant aim for their development was to reach the best non-directivity possible, they donot have a flat frequency response, and for good measurements, this has to be as flat aspossible without spoiling the time-response.So using the efforts of the digital domain we built a module to equalise the frequencyresponse of a given pair of speaker and microphone by means of a given free-field referencemeasurement, say href. Unfortunately the direct inverse filtering of the reference measurement- which would mean to calculate the discrete Fourier transform:
Href=DFT (href) ; (4)and calculating 1/Href - leads to a general unstable filter for the transfer function; Href is not ofminimum phase and the time sequence:
hinv=IFT (1/Href) ; (5)is not necessarily a causal filter any more and the convolution hrev * hinv may not result in theunit sample response δδδδ (t) (see [3]). As a correction filter we used the normalized conjugatecomplex function of the transfer function, like it is described in [4]: while the convolution ofhrev and hinv may not result in a stable filter, the least-squares criterion is applied:
<{[hfilter*(hmodel*href+hnoise)-hmodel]2}> , (6)i. e. the ensemble average over all possible realizations in the model has to be minimum for agiven length of the applied filter. The optimum filter satisfying eq. (6) is:
F w W wW w R wn n
( ) =* ( )
[ ( ) ( )],2 + , (7)
where the superscript * denotes the complex conjugate and Rn,n the autocorrelation functionof hnoise, which is assumed to be constant over frequencies, i.e. broad band noise. The auto-correlation of broad band noise has only a contribution near dc, so it may be neglected here.
Figure 5: Magnitude of Equalising Filter Figure 6: Frequency Response of Model MeasurementThis filter makes a nearly perfect equalisation of the source to microphone measurement.Unfortunately this free-field reference measurement itself suffers from several errors due tothe dimensions and shaping of the transducers: In all the reference free field measurementsvery narrow and sharp dips in the frequency curve occur due to interference cancellation. Ifthese dips – which are due to measurement artifacts and not to the transfer functions of thetransducers - are compensated perfectly, like this least-squares filter it provides, any noisethat exist in the measurement of the model will be amplified in the narrow dips; by thecorrection filter these turn into sharp high peaks. Amplifying broad band noise with a filtercontaining frequency peaks will lead to narrow band noise of high amplitudes, and thesenarrow noise bands are audible as tones and especially in high frequencies, as a constant

Auteur, Titel 5
ringing. So this effect had to be suppressed by making the frequency properties of thecorrecting filter less accurate again especially in the higher frequencies above 1 kHz. Thiswas done by applying an fractional-octave averaging to the magnitudes of the filter to smoothit out. Afterwards the filter-FFT was recomposed using the unchanged phases. Now the filterwas ready to work as a correction filter for the model impulse responses measured with thesame microphone-speaker combination to give a frequency-corrected impulse response:
hEQ= hmodel * hcorr. (8)
Figure 7: Frequency Resp. of Equalised Model Measurement Figure 8: Deabsorption Filter
2.1.2 Problem 2: Compensation of the Sound Attenuation in AirThe solution is basically to build up a time- and frequency-varying filter which amplifies theroom model impulse responses linearly in dB and even more the higher the frequencyaccording to the values of the damping coefficient δδδδ mentioned before. Such a filter shape isdepicted in figure (8). We applied an overlapping series of time-windows to the measuredsample sequence and filter the windowed time sample sections with stepwise changingcoefficients calculated out of the damping values. In a last step the overlapping filtered timewindows are added back together to get the absorption-corrected model impulse response.The corrected room response hEQ was split up into two shifted series of boxcar-windowedtime slices:
Figure 9,10: Boxcar windowed Time Slices of Corrected Model Impulse Response, 1st and 2nd Serieswhich were long enough to provide the lowest needed frequency, in real world thecorresponding largest wavelength had to fit into the length of one slice. Then we took the values for the absorption-correcting amplification [5] and made tables outof it ready to apply in filtering later on and selectable in 10 % steps of relative humidity of airat room temperature – the example shape shown in figure (8) is e.g. valid for 60 % r. H.

6 NAG-Journaal
Then the final gain of the filter and the gains for the different slices in between have to becalculated by the time in milliseconds the sound is traveling, for the absorption in the tablegiven as coefficients of the dimension Level/time are in dB per second, minus the amount ofdamping in high frequencies is normal in real scale. The gain of the filter has to beinterpolated for the different frequencies out of the edge-values of the tables mentionedabove. So these values are estimated by a linear stepwise interpolation per octave frequency.One further transforms the coefficient value in dB/s to the multiplication factor to apply tocalculate linear amplitude values. The single time slices of the two series are now time-windowed by multiplying with a hanning window, which has the very nice property, that anoverlap of half the window length and a subsequent adding of the time slices reveals the totalenergy unchanged. The calculated values of δδδδ serve as coefficients to build up a FIR-filterwhich provides the wanted slice-wise changing amplitude gain values to the recentfrequencies. The result now is achieved by filtering the windowed time parts of the twosequences hwin with the filters hfil to get hfiltered:
hfiltered = hfil * hwin. (9)While the high frequency absorption is linear per time and distance in level, the filter turnsout to of be highly exponential shape. After the filtering process the filtered time windowseries are added together to get the complete time data again. This time data is now correctedfor the high frequency absorption in the useful data parts, but unfortunately every highfrequency noise content is also amplified; and nevertheless, how small the amount may be,after an amplification of e.g. 60 already dB it sooner or later becomes audible – and visible.And this gives a chance for the next step of the process.
2.1.3 Problem 3: Correction of the Decay for the Background NoiseThe model room impulse response, which is now corrected for the air absorption effect, nowsuffers from the limited signal to noise ratio of the measurement, for all noise in the higherfrequency-bands which is in the original measurement, will be amplified by the absorptioncorrection filter with some dozen of dB per second, i.e. linear amplitude factors of 105 up to1025. Like the following figure shows, the result is that the tail of the impulse response, thatshould go down with the now absorption corrected slope in each frequency band turns itsdirection after a certain time and starts to grow in magnitude again. To get reasonable resultswhich can be convolved with music recorded in an anechoic chamber in order to auralise themodel and changes in it, this growing part of the decay curve has to be corrected somehow inorder to get the right slope of decay. Due to the fact, that it is only the noise of themeasurement and no real sound information, this late part of the impulse response could bediscarded and replaced by a signal that has the desired decay slope and no disturbing effects.We took this tail as it results from the process and treated it in a different way: after an octaveband filtering in every octave band the turning point of the logarithmic envelope is detectedby the supposition, that this turning point is near to the local minimum level of the smoothedenvelope. Therefore the octave bands are low-pass filtered with a first-order butterworth-filter, which does the job perfectly if a fitting cut-off frequency is chosen, e.g. 17 ms for the63 cps octave. In the smoothed logarithmic level-time curve the local minimum is chosen asthe turning point after that a complete de-trending operation removes the growing trend of theoctave band noise to a constant level. This constant tail is now multiplied with an octavedepending factor in dB/s, which is derived from the real impulse response of the hall, so thatthe ‘right’ reverberation time is multiplied to the model octave bands. This, of course, couldbe replaced by the EDT-values out of the model decay. Then the octave bands are addedtogether out of the beginning of the absorption corrected ones and the de-noised tail after the

Auteur, Titel 7
turning point, and in a last step the equalized, dissipation- and noise-corrected model impulseresponse is summed up from the different octave bands.
Figure 11: Absorption Corrected Octave Band Figure 12: Tail Noise Correction Process
Figure 13: Absorption and Tail Corrected IR Figure 14: New Dummy Head, Model Dummy Head
3. Building up personal HRTF correction filter3.1 Difference Measurements of Two Transmission Chains
This test was to show that a compensation of the differences in frequency response anddirectionality patterns of the two system chains: a) Dodecahedron source – enclosure – dummy head – amplifier – headphones – ear oflistener; b) Dodecahedron source – enclosure – ear of listenercan be corrected for each another. For this test the Transmission test room at the Peutzlaboratory was chosen with a T60 of about 3 sec. instead of the dry free-field laboratory,because the sound field in there can be assumed to be a sufficiently diffuse field one, and thecorrection should not depend on random dips in free field frequency response curves, whichoccur often due to interference or comb-filter effects. The desired correction was to correctthe power spectra. The experimental setup was the following: The additional transmissionsystem consisted of the dummy head, one Tascam DAT-tape deck DA-P1 working asmicrophone pre-amplifier and headphones amplifier, followed by a pair of Beyerdynamic DT550 headphones. In the case with additional transmission system the impulse response ofenclosure and system was measured at the test person’s ear, in the second case only impulseresponse of the enclosure, now with test person at the same spot as the dummy head before.All measurements were done with the MLSSA system, with MLS of Fs 80 kHz, the sequenceorder and averages were 16 to enhance the S/N ratio by 12 dB.

8 NAG-Journaal
Figure 15: Different Experimental Setups for Measuring Transfer Functions of the Two System ChainsThese MLS were amplified by the Quad 303 Amp and fed into the dodecahedron. Thesystems responses were measured at the ear of the listener by use of a Monacor MCE 2500capsule, set into the pinnae right 1 cm in front of the entrance of the ear channel. Someexperiments had to be made with the exact position and direction of this capsule, for if it wasto near to the ear channel, deep dips occurred in the frequency response of that measurement,too far away from it (above 1.5 cm) strong reflections in the resulting impulse response couldbe detected. So there is an optimum at about ¾ cm distance to the entrance of the ear channel,exactly in the nice little bow which exists in the fine structure of the pinnae; this position alsohas the advantage that it can be used unchanged with headphones on the head. The capsulewas taped directly to the skin facing upwards to ensure, that at least the high frequencydirectionality in the horizontal plane changes only due to the fine structure of the pinna, notdue to the microphone properties.
3.2 New dummy headA former used Sennheiser dummy head turned out to be too specific, like any human being’sear would be: the pinnae are much too detailed, so that the resulting directionally dependentfrequency curves have very serious dips and peaks [6]. One can see: the measurementconditions for head related transfer functions (HRTFs) are very critical for suchmeasurements; moving the microphone a little out of the optimal position will result innarrow and steep dips due to interference cancellations. The structure of the pinna and itseffect on the fraction of sound due to the of any direction different dimensions allows it tolocate sound sources even if the person is able only to hear with one ear, where level- andtime differences are not important. We all are used to our own ears, we grew up with themand therefore it is a difficult task, to apply a specific personal HRTF to a sound due to thesharp dips in frequency response. This task comes even harder, if a correction is tried, wherefor the measurement a dummy head is used, which is almost as specific as any individual,because there these dips have to be corrected before one can apply the wanted HRTF. Withthe sharp peaks of 35 dB height any noise in signal or measurement will be a possible sourceof ringing sounds or narrow band noise, which is perceived as similar to tones. Anotherproblem about this way of correction is, that in principle the “personal dips” of the dummyhead have at first to be removed and than at other frequencies applied again. The aim was, toget a correcting FIR-filter with less than 500 points of length to be able to feed forpresentations a real-time convolution machine. So it was decided not to take the specificdummy head and instead of the new unspecific one with a smooth frequency curve and aboutthe same directional characteristics in lower and middle frequency bands as a natural head. In1:12 a dummy head can not be too detailed. So the used dummy head had to be modified to

Auteur, Titel 9
be similar to the model dummy head: the original, much too specific pinna imitations werereplaced by halved cylinders of wood, 5.5 cm in diameter and 4.4 cm long - a very simpleshape. The aim of the modification was not to simulate one specific head or not even anaverage head exactly, but to ensure localisation and perception of spaciousness in diffusesound fields like concert halls. The dummy head now is not of a very specific shape apartfrom the slice structure of the head which should make effects in the range of 10 kHzcorresponding to their dimension of about 1 cm in step size. But this frequency range is forthe auralisation at least of model measurements not too important any more. In front of thecylindrical pieces the microphone capsules KE-4-211-2 have been placed with a impedancematching circuit in the head, facing towards the sides. The pieces of wood ensure the mainfunctions of natural pinnae: to build a shield to damp the high frequencies falling in frombehind and to emphasize that frequencies coming from the front, without adding too muchdetails to the frequency response. This simple modification of the AKG dummy head showedquite remarkable results at once: when only listening by headphone to the uncorrected signalsof this dummy head the in-head-localisation vanished and a front localization was perceptivealthough being a little elevated. The next figures show the 50° angle-of-incidence frequencyresponses and the directional pattern of the modified dummy head, the second pair of figuresis a natural HRTF and pattern just for a comparison:
-100-50
050
100 -100-50
050
1002
2.5
3
3.5
4
A bs o lute Le v e l (dB)A bs o lute Le v e l (dB)
log1
0 (
Fre
que
ncy
(H
z))
D ire ctio nality P lo tc:\klaus \data\t ims \pino bigl\
10
210
310
4
-1 20
-1 10
-1 00
-9 0
-8 0
-7 0
-6 0
-5 0
-4 0
-3 0Fre que ncy re s po ns e H arry ( le ft, 50°, s m o o the d) R m a0-05.t im
Log
arit
hm
ic A
mp
litu
de
(d
B)
F re que ncy (Hz )
Figure 16: Directional Pattern of Dummy Head Figure 17: Frequency Response Dummy Head, 50º
-1 0 0-5 0
05 0
1 0 0 -1 0 0-5 0
05 0
1 0 02
2 .5
3
3 .5
4
A b s o lu te Le v e l ( d B )A b s o lu te Le v e l ( d B )
log
10 (
Fre
que
ncy
(H
z))
D ire c t io na lity P lo tc :\k lau s \data \t im s \po larp lo ts \m o nk ll\
10
210
310
4
-120
-110
-100
-90
-80
-70
-60
-50
-40
Fre que ncy re s po ns e K .-H .L. (le ft, 50°, s mo o the d) R ma0-05.tim
Log
arit
hmic
Am
plit
ud
e (
dB
)
F re que ncy (Hz )
Figure 18: Directional Pattern of Natural Head Figure 19: Frequency Response Natural Head, 50ºObviously the signals recorded with this dummy head are much easier to filter to anindividual HRTF than a complicated response. But it had to be proved, that the directionalcharacteristics are also almost unaltered by this special dummy head. MLS measurements onthe rotating desk were made: in 10 degree steps the impulse responses were measured andtime-windowed, the frequency responses calculated by Fourier-transforms, the magnitudesaveraged in every third-octave-band and the results plotted versus the angle of incidence.
10 NAG-Journaal
Figure (15) shows the directionality patterns for the modified new dummy head. Theaveraged octave band directionality patterns show a reasonable good matching of themodified dummy head to the real head, better than the former used old Sennheiser head.
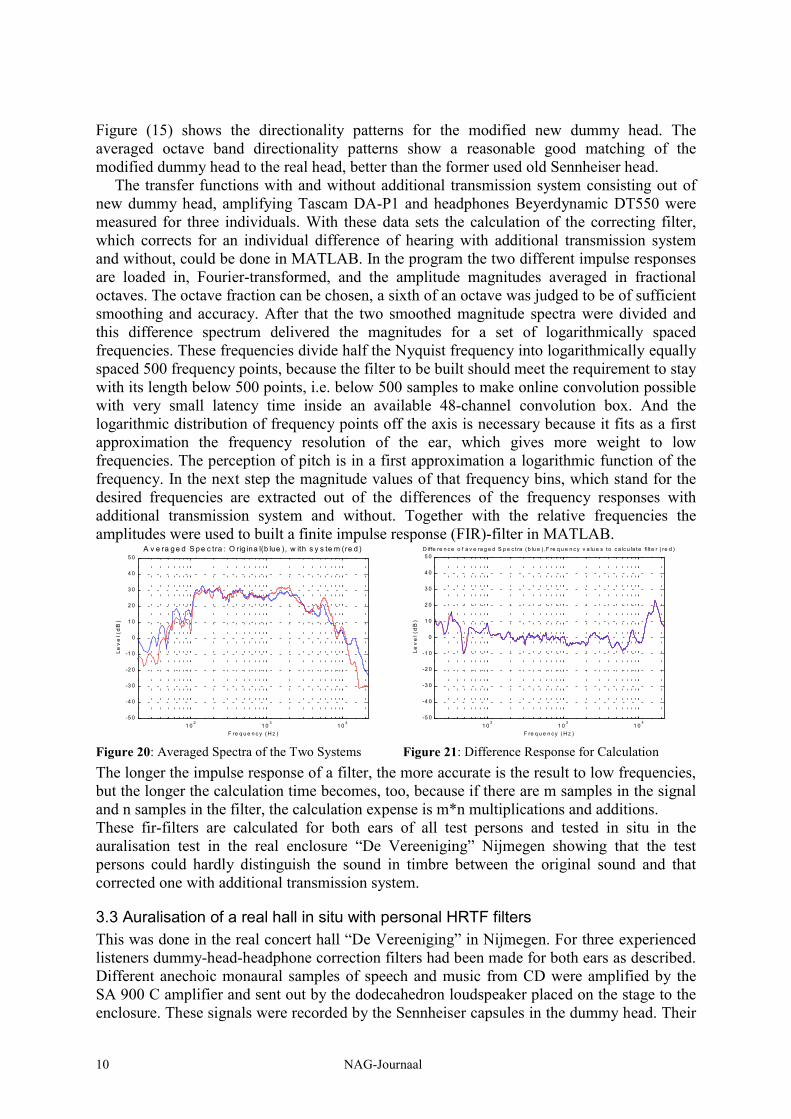
The transfer functions with and without additional transmission system consisting out ofnew dummy head, amplifying Tascam DA-P1 and headphones Beyerdynamic DT550 weremeasured for three individuals. With these data sets the calculation of the correcting filter,which corrects for an individual difference of hearing with additional transmission systemand without, could be done in MATLAB. In the program the two different impulse responsesare loaded in, Fourier-transformed, and the amplitude magnitudes averaged in fractionaloctaves. The octave fraction can be chosen, a sixth of an octave was judged to be of sufficientsmoothing and accuracy. After that the two smoothed magnitude spectra were divided andthis difference spectrum delivered the magnitudes for a set of logarithmically spacedfrequencies. These frequencies divide half the Nyquist frequency into logarithmically equallyspaced 500 frequency points, because the filter to be built should meet the requirement to staywith its length below 500 points, i.e. below 500 samples to make online convolution possiblewith very small latency time inside an available 48-channel convolution box. And thelogarithmic distribution of frequency points off the axis is necessary because it fits as a firstapproximation the frequency resolution of the ear, which gives more weight to lowfrequencies. The perception of pitch is in a first approximation a logarithmic function of thefrequency. In the next step the magnitude values of that frequency bins, which stand for thedesired frequencies are extracted out of the differences of the frequency responses withadditional transmission system and without. Together with the relative frequencies theamplitudes were used to built a finite impulse response (FIR)-filter in MATLAB.
1 0 2 1 0 3 1 0 4-5 0
-4 0
-3 0
-2 0
-1 0
0
1 0
2 0
3 0
4 0
5 0A v e ra g e d S p e c tra : O rig ina l(b lue ), w ith s y s te m (re d )
Lev
el (
dB
)
F re q u e n c y ( H z )1 0
21 0
31 0
4-5 0
-4 0
-3 0
-2 0
-1 0
0
1 0
2 0
3 0
4 0
5 0D iffe re n c e o f a v e ra g e d S p e c t ra ( b lu e ) ,F re q u e n c y v a lu e s t o c a lc u la te filt e r ( re d )
Lev
el (
dB
)
F re q u e n c y ( H z )
Figure 20: Averaged Spectra of the Two Systems Figure 21: Difference Response for CalculationThe longer the impulse response of a filter, the more accurate is the result to low frequencies,but the longer the calculation time becomes, too, because if there are m samples in the signaland n samples in the filter, the calculation expense is m*n multiplications and additions. These fir-filters are calculated for both ears of all test persons and tested in situ in theauralisation test in the real enclosure “De Vereeniging” Nijmegen showing that the testpersons could hardly distinguish the sound in timbre between the original sound and thatcorrected one with additional transmission system.
3.3 Auralisation of a real hall in situ with personal HRTF filtersThis was done in the real concert hall “De Vereeniging” in Nijmegen. For three experiencedlisteners dummy-head-headphone correction filters had been made for both ears as described.Different anechoic monaural samples of speech and music from CD were amplified by theSA 900 C amplifier and sent out by the dodecahedron loudspeaker placed on the stage to theenclosure. These signals were recorded by the Sennheiser capsules in the dummy head. Their

Auteur, Titel 11
signals were amplified by the Behringer Ultragain Mic 2002 by 32 dB and sent to acomputer-controlled 48 channel convolution box which had the 6 personal correction filterspre-loaded. This convolution box convolves with minimum latency (therefore the filter lengthhad to be reduced to 500 samples, i.e. 11 ms) these fir-filters and the input from thepreamplifier. The resulting compensated signals were recorded by the Tascam DAT-tapedeck DA-P1 and passed amplified through to the Beyerdynamic DT 550 headphones. For twolisteners the samples were recorded on DAT with the system in between. The test-listenerscompared in situ localisation, timbre, reverberation, spaciousness of their natural hearingdirectly besides and behind the dummy head to their personally compensated signals, as thepicture below shows. The impression was of course not completely identical - but very closeto the original in all of these properties. The difference was not in the timbre or reverberationnor even the localisation; only the spaciousness of some single reflections was different. Butin total it can be stated that the smoothed frequency curve correction of the calculated filtersworks very well in fitting the personal impression of this hall. An in situ auralisation withoutalmost no loss is possible with this way of compensating the transmission system.
Figure 22: Experimental Setup for Auralisation in situ Figure 23: Auralisation in situ in Real Concert Hall
Conclusion: Results of the Model-Auralization and LimitationsConvolutions were made with music that was recorded without reverberation (Denon PG6006) and convoluted with stereo room impulse responses measured in the 1:12 scale modelof the Royal Albert Hall at the Peutz laboratory and processed in the way described above.
Figure 24: Old Setup of Mushrooms Figure 25: New Setup of MushroomsThe convolutions revealed a relatively natural sounding picture of a reverberation and soundquality similar to the real hall. So this approach to solving the problems with these kind ofmeasurements turned out to be a valid and successful tool in the auralization of model roomimpulse responses. It also can reveal, that the quality of auralization models and theirmaterials, too, for there remains little difference between model and real impulse response intime response, and a more audible difference in frequency content or perceived timbre andspaciousness. To make this audible, impulse responses of the model in two different states to

12 NAG-Journaal
listen to the changes of a modified stage setup and a new arrangement of the famous“mushroom” reflectors. To make the difference visible, pseudo-three dimensional sonagrampictures are made from the pure, but band-limited impulse responses of the real hall, theunchanged and the corrected model measurements in the two states of the model:
Figure (26): Model in old state (corrected), in new state (corrected), real hall bandlim., real hallIn further evaluations it has at first to be shown why the difference exists, e.g. because themodel itself may suffer from some errors in the frequency-shifted absorption coefficients ofthe materials used in the model, which may behave additive in the audible differences andlead to too smaller reverberation times in the beginning of the reverberation process.
The limitations in our approach to improve are:• limited frequency bandwidth up to 4000 Hz, which could be pushed up by other
measurement equipment, which would make reference and dissipation correction harder;• limited signal-to-noise ratio in the model room impulses, which could be improved by
using MLS of a higher level, order and a larger number of additions,• do the correction of air absorption and noise tail smaller time- and fractional frequency
bands: e.g. third-octave bands would approach the ideal better and have less disturbingeffects due to sharp edges in the level at the frequency band boundaries,
• replace the reference free-field measurement of the combination of loudspeaker andmicrophone by a diffuse-field reference measurement to cancel out comb-filter peaks.
AcknowledgementsI dedicate my deep thankfulness to my colleagues J. v. d. Werff and D. de Leeuw ofAdviesbureau Peutz for their indefatigable help and fruitful discussions in this subject.
References1. Cremer, L., et al., 1978, “Die wissenschaftlichen Grundlagen der Raumakustik”, Bd. I, p.132,164,1412. Polack, S. et al., 1993, “Auralization in Scale Models: Processing of Impulse Response”, J. Audio Eng.
Soc. Vol. 41, No. 11, p. 939-9453. Schafer, R., Oppenheim, A., 1974, “Digital Signal Processing”, Prentice Hall, Englewood Cliffs, p. 1324. Berkhout, A., de Vries, D., 1980, “A new method to acquire impulse responses in concert halls”, J.
Acoust. Soc. Am. 68(1), July, p. 179-1835. Weast, R. (Ed.), 1985, “Absorption and velocity of sound in still air”, CRC Handbook of chemistry and
Physics, pp.E-456. Lorenz, K.-H., 2000, “Development of new Auralization Techniques in Room Acoustics based upon
Binaural Impulse Responses”, Diploma Thesis, Universität Düsseldorf, pp. 47


![SÍNdromE PEuTZ-JEGHErS: rEPorTE dE uN CASo y … · GENÉTICA INTroduCCIóN El síndrome Peutz-Jeghers (PJS) [MIM 175200] es un desorden genético autosómico dominante con penetrancia](https://static.fdocuments.net/doc/165x107/5bb4d9c909d3f2f2678b50f5/sindrome-peutz-jeghers-reporte-de-un-caso-y-genetica-introduccion-el-sindrome.jpg)