
AUGUST 2016 CVA IR Presentation EQUITY 8.3.16
33
NYSE: CVA AUGUST 2016 Investor Presentation
Transcript of AUGUST 2016 CVA IR Presentation EQUITY 8.3.16

NYSE: CVA AUGUST 2016
Investor Presentation

Cautionary Statements
All information included in this earnings presentation is based on continuing operations, unless otherwise noted.
Forward-Looking Statements
Certain statements in this press release constitute “forward-looking” statements as defined in Section 27A of the Securities Act of 1933 (the “Securities Act”), Section 21E of the Securities Exchange Act of 1934 (the “Exchange Act”), the Private Securities Litigation Reform Act of 1995 (the “PSLRA”) or in releases made by the Securities and Exchange Commission (“SEC”), all as may be amended from time to time. Such forward-looking statements involve known and unknown risks, uncertainties and other important factors that could cause the actual results, performance or achievements of Covanta Holding Corporation and its subsidiaries (“Covanta”) or industry results, to differ materially from any future results, performance or achievements expressed or implied by such forward-looking statements. Statements that are not historical fact are forward-looking statements. Forward-looking statements can be identified by, among other things, the use of forward-looking language, such as the words “plan,” “believe,” “expect,” “anticipate,” “intend,” “estimate,” “project,” “may,” “will,” “would,” “could,” “should,” “seeks,” or “scheduled to,” or other similar words, or the negative of these terms or other variations of these terms or comparable language, or by discussion of strategy or intentions. These cautionary statements are being made pursuant to the Securities Act, the Exchange Act and the PSLRA with the intention of obtaining the benefits of the “safe harbor” provisions of such laws. Covanta cautions investors that any forward-looking statements made by us are not guarantees or indicative of future performance. Important assumptions and other important factors that could cause actual results to differ materially from those forward-looking statements with respect to Covanta, include, but are not limited to, the risk that Covanta may not successfully grow its business as expected or close its announced or planned acquisitions or projects in development, and those factors, risks and uncertainties that are described in periodic securities filings by Covanta with the SEC. Although we believe that our plans, intentions and expectations reflected in or suggested by such forward-looking statements are reasonable, actual results could differ materially from a projection or assumption in any of our forward-looking statements. Our future financial condition and results of operations, as well as any forward-looking statements, are subject to change and inherent risks and uncertainties. The forward-looking statements contained in this press release are made only as of the date hereof and we do not have, or undertake, any obligation to update or revise any forward-looking statements whether as a result of new information, subsequent events or otherwise, unless otherwise required by law.
Note: All estimates with respect to 2016 and future periods are as of July 26, 2016. Covanta does not have or undertake any obligation to update or revise any forward-looking statements whether as a result of new information, subsequent events or otherwise, unless otherwise required by law.
Non-GAAP Financial Measures
We use a number of different financial measures, both United States generally accepted accounting principles (“GAAP”) and non-GAAP, in assessing the overall performance of our business. The non-GAAP financial measures of Adjusted EBITDA, Free Cash Flow and Adjusted EPS, as described and used in this earnings presentation, are not intended as a substitute or as an alternative to net income, cash flow provided by operating activities or diluted earnings per share as indicators of our performance or liquidity or any other measures of performance or liquidity derived in accordance with GAAP. In addition, our non-GAAP financial measures may be different from non-GAAP measures used by other companies, limiting their usefulness for comparison purposes. The presentations of Adjusted EBITDA, Free Cash Flow and Adjusted EPS are intended to enhance the usefulness of our financial information by providing measures which management internally use to assess and evaluate the overall performance of its business and those of possible acquisition candidates, and highlight trends in the overall business. Please refer to the appendix of this presentation for reconciliations of non-GAAP financial measures.
AUGUST 20162

Covanta – World Leader in EfW: at a Glance
3
Note: Affirmed guidance as of 7/26/16.
Energy:~10million MWhgenerated annually
1,500+ MW base load capacity (majority of generation in PJM, NEPOOL and NYISO markets)
Metals:~500,000 gross tons of ferrous and non‐ferrous recovered annually
Newmetals processing facility in Fairless Hills, PA expands metals recovery capabilities
Waste:42 Energy‐from‐Waste (EfW) facilities
~20million waste tons processed annually → 1:1 tons of CO2 equivalent offset
15material processingfacilities (9 waste, 6 liquid)
30+ year operating history
FY 2016Guidance:• Adjusted EBITDA:
$390 ‐ $430 million
• Free Cash Flow: $140 ‐ $180 million
% of 2015
Revenue
Waste67%
Metals4%
Energy26%
Other3%
AUGUST 2016

Key Investment Highlights
• Critical infrastructure assets– Essential service to host communities– Concentrated in attractive markets in Northeast U.S. with high barriers to entry – irreplaceable asset portfolio
• World leader in Energy-from-Waste– 42 EfW facilities with ~20 million tons disposal capacity – one of the largest operators in the world– Strong track record of operating performance – consistently achieve boiler availability in excess of 90%
• Very attractive underlying economics– Earn revenue from both input (waste disposal) and output (energy and recycled metal)– High Adjusted EBITDA margins (~25%) and Free Cash Flow conversion (~40%) – Significant operating leverage and upside to long-term commodity price recovery
• Highly contracted revenues with credit-worthy counterparties– ~85% of revenue contracted or hedged– Customers are primarily municipalities and utilities
• Substantial and consistent cash flow generation– Cash flow underpins healthy shareholder capital returns and value-accretive reinvestment for growth– Business model and balance sheet built to support capital allocation strategy through the commodity and economic cycles
4 AUGUST 2016

Energy-from-Waste Process
• Municipalities and others pay us to dispose of waste– Unlike other energy producers, we are paid for our fuel
• Technologically advanced facilities combust waste at high temperatures– Primarily mass-burn facilities that combust MSW as received (no pre-processing)
• Resulting steam used to produce electricity for sale or sold directly
• Metals are recovered from the process and sold to recyclers
5
500 - 650 kWh of Power
~50 lbs. of Recycled Metal
Ash: ~10% of Original Volume
One Ton of Municipal Solid Waste (MSW)
Note: See Appendix slide 30 for Key to chart.
AUGUST 2016

Benefits of Energy-from-Waste
EfW Facility (Onondaga County, NY)
6
• Environmentally sustainable waste management– Best solution after recycling – waste volume reduced by 90%– Attractive to businesses and governments seeking "zero landfill" disposal option
• Generates renewable energy– Reliable baseload power 24 / 7; located near demand centers
• Combats climate change– 1:1 CO2 offset for each ton of waste processed
Fewer fossil fuels burned: 1 ton of waste ≈ ¼ ton of coal
– Methane from landfills: 80+ times more potent than CO2 as a greenhouse gas over a 20 year period
Landfill
AUGUST 2016

7
• 41 EfW facilities– Over two-thirds of U.S. EfW capacity– Process ~5% of overall U.S. waste generation
• Complementary environmental services and waste transportation infrastructure
• Operations primarily concentrated in the Northeast– Attractive, densely-populated markets– Limited new capacity in metropolitan areas– Cost advantage vs. long haul transfer to landfills– Electricity sold at high demand points
North American Asset Footprint
Corporate HeadquartersEfW Facilities
Material Processing Facilities
AUGUST 2016

Highly Contracted Revenue
Note: Figures presented for North America operations only.
16%
84%
2015: $1,102 million
Uncontracted Contracted
100%
2015: $61 million
Uncontracted
• ~85% contracted, typically with inflation escalators
• Paid either per-ton “tip fee” or fixed service fee
• Excellent track record extending long-term contracts
• Generate revenue on ~6.5 million MWh generation (net of client sharing)
• ~75% contracted or hedged• Increasing output at market prices
over time• Concentrated in attractive markets
• Generate revenue on ~330k tons of ferrous metal and ~35k tons of non-ferrous metal (net of client sharing)
• Metals are sold at spot market prices
Waste & Service
22%
26%52%
2015: $385 million
Hedged Uncontracted Contracted
Energy Metal
• Covanta primarily generates revenue from 3 sources – paid every step of the way
8 AUGUST 2016

9
Evolution of Covanta
1980’s - 2008• Construction and acquisition of
EfW portfolio• Original service agreements• Steady repayment of project debt
2009 - 2015• Mark-to-market of long-term
contracts• Focus on organic growth via
recycled metal and special waste revenues
• Established shareholder-focused capital allocation policy• $1.00 per share (annualized)
dividend• Over $1 billion returned to
shareholders
2016+• Focus on Continuous
Improvement and organic growth• Cash flow underpinned by
long-term contracted revenue –supports capital allocation policy through the cycle
• Dublin project coming online (late 2017)
• Significant long-term upside to commodity price recovery
AUGUST 2016

Strategic Objectives
10 AUGUST 2016
Current Business
Consistent operating and financial performance• Safety and environmental excellence• Facility availability and production• Investment in long-term facility
performance• Extending long-term contracts
Continuous Improvement
Long-term Growth
Maximize Shareholder Value
Construction of Dublin EfW facility
Execute on new projects• Dublin, NYC MTS contract
Organic growth• Expand Covanta Environmental Solutions
business• Metal recovery and processing
Pursue strategic investment opportunities • Acquisitions and new projects• North America, Europe, China
Liquid Waste Processing
NYC Waste Transport via Barge
Non-Ferrous Metal Recovery System

Strategic Objectives – Environmental Solutions
11
• M&A and organic growth• Combined environmental solutions margins expected to be similar to
corporate average
GROWTH VEHICLE FOR COVANTA
GROW >$100 MILLION REVENUE OVER NEXT ~3 YEARS
HIGHLY COMPLEMENTARY TO BASE BUSINESS
• EfW footprint is unmatched in North America • Provides a network for customers requiring thermal destruction and/or
zero landfill services for non-hazardous waste
EfW Profiled Waste~$100 million revenue
~50% Adjusted EBITDA margin
Environmental Services~$100 million revenue
~20% Adjusted EBITDA marginServices include:• De-packaging• Solidification• Shredding• Wastewater treatment• Material recycling and reuse• Professional services• Industrial service (cleaning, spill
response, remediation, etc.)• E-waste• Logistics
AUGUST 2016
• Internalization of profiled waste displaces spot MSW • New service revenue opportunities

Strategic Objectives – Metals Management
12 AUGUST 2016
1. “Base” project plan rollout
(8th inning)
• 40+ projects implemented to date
• Created ‐3/8” non‐ferrous products
• 6 to 12 additional systems opportunities
• Continue to learn and optimize our operations
2. Processing metal
(4th inning)
• Process recovered ferrous and non‐ferrous to improve quality of product and achieve higher price
• Expand potential sales channels
• Ability to consolidate and bulk ship to overseas markets
3. Enhanced metal(3rd inning)
• Focus on stainless steel recovery and other “fine” metals
• Initial full scale pilot system installed and being evaluated
• Design and financial justification of 3 to 4 additional systems within the next 12 months
4. Ash reuse
(1st inning)
• In house expertise established
• Evaluating technology to create aggregate fractions for reuse in road bed and several other applications

Strategic Objectives – Executing on New Projects
13 AUGUST 2016
New York City MTS Contract
• Multimodal transportation and disposal for ~800,000 tons of NYC waste via two marine transfer stations
• Investing ~$150 million at attractive IRR• Operations at first MTS (Queens) began in Q1
2015; second MTS (Manhattan) expected to begin in early 2018
Dublin EfW Facility
• 600,000 annual tonnes, 58 MW
• €500 million total capital investment at less than 9x Adjusted EBITDA multiple
• Construction >70% complete, with commercial operations targeted late 2017

Two Cash Flow Streams
14 AUGUST 2016
2. Market Commodity Value
• Commodities extracted from the waste stream are growing value drivers for Covanta
• Cash flow has greater volatility
• Funds opportunistic capital allocation
150 139 130-160
2014 2015 2016E
Market commodity value above 2016E guidanceChinaFree Cash Flow pre-working capital at 2016E commodity prices
Free Cash Flow (Pre-Working Capital)
($ in millions)
235
169
1. Infrastructure Cash Flow
• Irreplaceable infrastructure assets
• Waste revenue and contracted energy
• Highly contracted revenue (>80%)
Underpins credit and dividend
Highly leveraged to market recovery

Stable and Flexible Balance Sheet
15
As of 6/30/16 (Face Value; $ in millions)
Covanta Energy, LLC
Revolving Credit Facility due 2019-2020: (1) $493Term Loan due 2020: 199Equipment Leases due 2024-2027: 71 Tax-Exempt Corporate Bonds due 2024-2045: (2) 464
Domestic Subsidiaries
Project Debt: $235
International Subsidiaries
Project Debt: $137
Covanta Holding Corporation7.250% Senior Notes due 2020: $4006.375% Senior Notes due 2022: 4005.875% Senior Notes due 2024: 400
1) Total facility size of $1.0 billion ($50 million due 2019 and $950 million due 2020), with $160 million letters of credit outstanding and $347 million availability at June 30, 2016.
2) The tax-exempt corporate bonds are obligations of Covanta Holding Corporation and are guaranteed by Covanta Energy, and as such are effectively senior in right of payment to the other indebtedness of Covanta Holding Corporation.
• Weighted average debt maturity of ~9 years, with no material corporate maturities until 2020
• Ample liquidity with $347 million availability under revolver at 6/30/16
• Weighted average interest rate of ~5.2% at 6/30/16
AUGUST 2016

Capital Allocation Policy
16 AUGUST 2016
Annualized cash dividend of $1.00 / share
Disciplined approach Organic growth investments Project development Opportunistic M&A
Share repurchases Debt repayment
Dividend
Growth Investments
Other Potential
Uses

Key Investment Highlights
• Critical infrastructure assets– Essential service to host communities– Concentrated in attractive markets in Northeast U.S. with high barriers to entry – irreplaceable asset portfolio
• World leader in Energy-from-Waste– 42 EfW facilities with ~20 million tons disposal capacity – one of the largest operators in the world– Strong track record of operating performance – consistently achieve boiler availability in excess of 90%
• Very attractive underlying economics– Earn revenue from both input (waste disposal) and output (energy and recycled metal)– High Adjusted EBITDA margins (~25%) and Free Cash Flow conversion (~40%) – Significant operating leverage and upside to long-term commodity price recovery
• Highly contracted revenues with credit-worthy counterparties– ~85% of revenue contracted or hedged– Customers are primarily municipalities and utilities
• Substantial and consistent cash flow generation– Cash flow underpins healthy shareholder capital returns and value-accretive reinvestment for growth– Business model and balance sheet built to support capital allocation strategy through the commodity and economic cycles
17 AUGUST 2016

Appendix
18 AUGUST 2016

Major Municipal Waste Contract Transitions
Renewed 35 out of 38 anchor municipal client contracts for average extension of ~10 years
19 AUGUST 2016
Tip
Fee
Serv
ice
Fee
Ow
ned
Serv
ice
Fee
Ope
rate
d

Waste Update
North America EfW (1)
(in millions, except price) Q2 2015A Q2 2016A 2016E
Waste & Service Revenue:
Waste Processing $231 $238 $935 - $965
Debt Service 4 2 9
Other (2) 3 3 5 - 10
Total $238 $243 $950 - $980
Tons: (3)
Contracted (4) 4.4 4.4
Uncontracted 0.5 0.5
Total 4.9 4.9 19.5 - 19.7
Revenue per Ton: (5)
Contracted $44.72 $45.87
Uncontracted $70.10 $74.94
Average $47.29 $48.71 $48.00 - $49.00
• Q2 2016 EfW waste processing revenue vs. Q2 2015:▪ Same store price up $5 million (2.1%);
volume flat▪ EfW profiled waste up 9% year-over-year
• Trends and outlook:▪ Uncontracted price improvement driven by strong
Northeast price environment and continued mix shift away from low-priced spot MSW
▪ Contractual price escalations running at ~1%
1) North America EfW results include only Energy-from-Waste assets. 2) Other includes service revenue not directly related to waste processing. 3) Excludes liquid waste.
(Unaudited)
4) Includes contracts at transfer stations from which waste is internalized. 5) Calculated for waste and service revenue, excluding debt service and other revenue.
20 AUGUST 2016
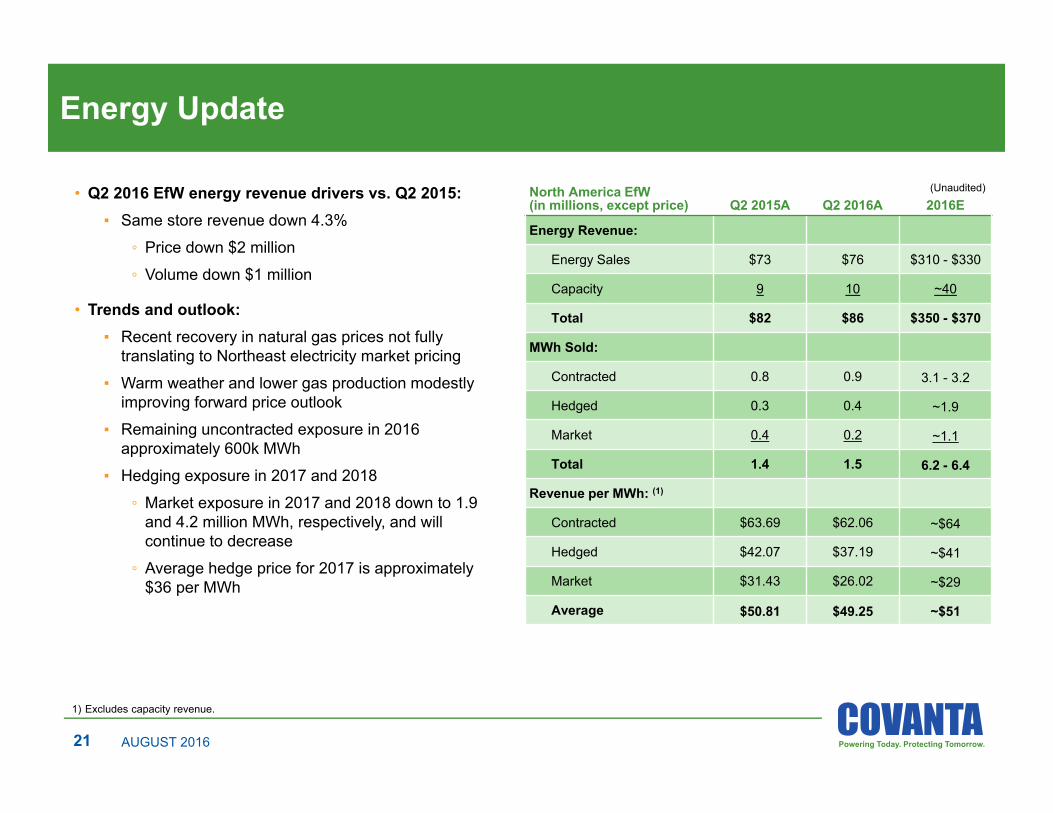
Energy Update
North America EfW(in millions, except price) Q2 2015A Q2 2016A 2016E
Energy Revenue:
Energy Sales $73 $76 $310 - $330
Capacity 9 10 ~40
Total $82 $86 $350 - $370
MWh Sold:
Contracted 0.8 0.9 3.1 - 3.2
Hedged 0.3 0.4 ~1.9
Market 0.4 0.2 ~1.1
Total 1.4 1.5 6.2 - 6.4
Revenue per MWh: (1)
Contracted $63.69 $62.06 ~$64
Hedged $42.07 $37.19 ~$41
Market $31.43 $26.02 ~$29
Average $50.81 $49.25 ~$51
• Q2 2016 EfW energy revenue drivers vs. Q2 2015:▪ Same store revenue down 4.3%
◦ Price down $2 million◦ Volume down $1 million
• Trends and outlook:▪ Recent recovery in natural gas prices not fully
translating to Northeast electricity market pricing▪ Warm weather and lower gas production modestly
improving forward price outlook▪ Remaining uncontracted exposure in 2016
approximately 600k MWh ▪ Hedging exposure in 2017 and 2018
◦ Market exposure in 2017 and 2018 down to 1.9 and 4.2 million MWh, respectively, and will continue to decrease
◦ Average hedge price for 2017 is approximately $36 per MWh
1) Excludes capacity revenue.
(Unaudited)
21 AUGUST 2016

Recycled Metals Update
North America($ in millions, except price; tons in thousands) Q2 2015A Q2 2016A 2016E
Metals Revenue:
Ferrous $11 $11 $30 - $35
Non-Ferrous 6 6 20 - 25
Total $17 $17 $50 - $60
Tons Sold:
Ferrous 85 77 330 - 340
Non-Ferrous 8 9 34 - 38
Revenue per Ton:
Ferrous $127 $138 $95 - $110
Non-Ferrous $741 $650 ~$650
Average HMS index price (1) $236 $220 $175 - $195
• Q2 2016 revenue drivers vs. Q2 2015:▪ Volume:
◦ Ferrous down 10% – recovery up, but sales volume impacted by centralized processing and timing of shipments
◦ Non-ferrous up 14% ▪ Price:
◦ Ferrous up 8%, with lower market price more than offset by higher realized revenue as % of index
◦ Non-ferrous down 12%
• Market trends and outlook:
▪ Recent strength in both ferrous and non-ferrous markets; however, expect softness for rest of 2016 due to seasonality of scrap market and strong USD
1) Q2 2016 and Q2 2015 average #1 Heavy Melt Steel composite index ($ / gross ton) as published by American Metal Market.
(Unaudited)
22 AUGUST 2016

Plant Operating Expense and Maintenance Capex Update
• Q2 2016 summary:
▪ North America EfW plant maintenance expense flat vs. Q2 2015 on same store basis
▪ North America EfW other plant operating expenses up 3% vs. Q2 2015 on same store basis
• Trends and outlook:
▪ 2016 full-year maintenance plan on track; ~65% of maintenance spend completed
Total Company(in millions) Q2 2015A Q2 2016A 2016EPlant Maintenance Expense:
North America EfW $81 $80 $265 - $275
Other 4 2
Total $85 $82
Maintenance Capex:
North America EfW $26 $28 $85 - $95
Other 3 4 ~20
Total $29 $32 $105 - $115
Total EfW Maintenance Spend $107 $108 $350 - $370
Other Plant Operating Expense:
North America EfW $155 $165
Other 60 67
Total $215 $232
(Unaudited)
23 AUGUST 2016

Growth Investment Outlook
Growth Investments (Unaudited, in millions)FY 2015Actual
YTD6/30/16
FY 2016Outlook
Organic growth investments (1) $34 $22 ~ $40
New York City contract 30 3 ~5
Essex County EfW emissions control system (2) 26 18 ~35
Acquisitions 72 9 9
Subtotal: Corporate funded $162 $52 ~ $90
Dublin facility construction 184 73 175 - 200
Total growth investments $346 $125 ~ $265 - 295
1) Organic growth programs are focused primarily on growing waste and metal revenue.2) Classified as growth investment because cost is reflected in overall economic benefit of contract restructuring completed in 2013.
• Remaining Dublin investment to be funded entirely with project financing – no impact on domestic capital allocation• Acquisitions to be targeted on an opportunistic basis – potential additional activity not reflected in FY 2016 outlook
24 AUGUST 2016

Capitalization Summary
1) Net debt is calculated as total principal amount of debt outstanding less cash and cash equivalents, debt service principal-related restricted funds ($13 million at June 30, 2016), and escrowed construction financing proceeds ($48 million at June 30, 2016).
2) Excludes $128 million of net debt (debt of $137 million less restricted funds of $9 million) outstanding at June 30, 2016 at Dublin project subsidiary.3) Leverage ratio as calculated for senior credit facility covenant. Effectively represents leverage at Covanta Energy, LLC and subsidiaries.
(Face value; unaudited, in millions) 12/31/2014 12/31/2015 6/30/2016Cash and Cash Equivalents $84 $94 $108
Corporate Debt:Secured $405 $621 $763Unsecured 1,569 1,664 1,664
Total Corporate Debt $1,974 $2,285 $2,427Project Debt 225 197 372Total Debt $2,199 $2,482 $2,799
Net Debt (1) $2,029 $2,326 $2,630
Stockholders’ Equity $784 $640 $480
Credit Ratios:Net Debt / Adjusted EBITDA Ratio 4.3x 5.4x 6.2x
Excluding Non-Recourse Construction Debt (2) 4.3x 5.3x 5.9xSenior Credit Facility Leverage Ratio (3) 2.1x 2.9x 3.4x
25 AUGUST 2016

Long-term Outlook: Energy Detail
North America EfW Facilities (Unaudited, in millions, except price) 2014A 2015A 2016E 2017E 2018E 2019E 2020E
MWh Sold – CVA Share:
Contracted 3.2 3.0 3.2 2.4 2.1 2.1 2.1
Hedged 1.4 1.4 1.9 2.2 0.2 — —
Market 1.1 1.4 1.1 1.9 4.2 4.5 4.5
Total MWh Sold 5.6 5.8 ~6.2 ~6.5 ~6.5 ~6.6 ~6.6
Market Sales (MWh) by Geography:
PJM East 0.4 0.5 0.5 1.0 2.4 2.7 2.7
NEPOOL 0.3 0.3 0.1 0.4 1.1 1.1 1.1
NYISO — 0.1 0.1 0.1 0.2 0.2 0.2
Other 0.3 0.4 0.4 0.4 0.5 0.5 0.5
Total Market Sales 1.1 1.4 1.1 1.9 4.2 4.5 4.5
Revenue per MWh: (1)
Contracted $67.56 $65.56 ~$64
Average ~$57 / MWh on contracts expiring through 2020Hedged $42.87 $45.64 ~$41
Market $49.12 $33.18 ~$29
Average Revenue per MWh $58.06 $53.17 ~$51
Note: hedged generation as presented above reflects only existing hedges. 1) Excludes capacity revenue.
• Note: Production estimates for 2017 - 2020 are approximated based on historical operating performance and expected contract structures
26 AUGUST 2016

Non-GAAP Reconciliation: Adjusted EBITDA & Free Cash Flow
Q2 YTD Full Year(Unaudited, in millions) 2016 2015 2016 2015 Estimated 2016 (1)
Net Loss Attributable to Covanta Holding Corporation $(29) $(6) $(66) $(43)
Depreciation and amortization expense 51 50 103 98
Interest expense, net 34 33 68 68
Income tax expense (benefit) 3 (40) (7) (30)
Impairment charges 4 24 19 24
Loss on extinguishment of debt — 2 — 2
Debt service billings in excess of revenue recognized 1 — 2 1
Severance and reorganization costs 1 — 2 2
Non-cash compensation expense 4 3 9 11
Capital type expenditures at service fee operated facilities (2) 12 14 23 22
Other 1 3 5 7
Total adjustments 111 89 224 205Adjusted EBITDA $82 $83 $158 $162 $390 - $430
Cash paid for interest, net of capitalized interest (45) (42) (67) (61)
Cash paid for taxes — (2) (4) (4)
Capital type expenditures at service fee operated facilities (2) (12) (14) (23) (22)
Adjustment for working capital and other 2 (36) (6) (44)
Cash flow provided by (used in) operating activities from continuing operations $27 $(11) $58 $31 $245 - $295Maintenance capital expenditures (32) (29) (68) (55) (105) - (115)
Free Cash Flow $(5) $(40) $(10) $(24) $140 - $180
Weighted Average Diluted Shares Outstanding 129 132 129 132
1) Guidance affirmed as of July 26, 2016.2) Adjustment for impact of adoption of FASB ASC 853 – Service Concession Arrangements.
27 AUGUST 2016

Non-GAAP Reconciliation: Adjusted EBITDA
Full Year LTM(Unaudited, in millions) 2014 2015 6/30/2016
Net (Loss) Income Attributable to Covanta Holding Corporation $(2) $68 $45
Operating loss related to insurance subsidiaries 2 — —
Depreciation and amortization expense 211 198 203
Debt service expense 147 134 134
Income tax expense (benefit) 15 (84) (61)
Impairment charges 64 43 38
Loss on extinguishment of debt 2 2 —
Net income attributable to noncontrolling interests in subsidiaries 1 1 1
Debt service billings in excess of revenue recognized 2 1 2
Severance and reorganization costs 9 4 4
Non-cash compensation expense 17 18 16
Capital type expenditures at service fee operated facilities (1) — 31 32
Other 6 12 10
Total adjustments 476 360 379
Adjusted EBITDA $474 $428 $424
1) Adjustment for impact of adoption of FASB ASC 853 – Service Concession Arrangements.Note: Adjusted EBITDA results provided to reconcile the denominator of the Net Debt / Adjusted EBITDA ratios on slide 13.
28 AUGUST 2016

Non-GAAP Reconciliation: Adjusted EPS
Q2 YTD
(Unaudited, in millions, except per share amounts) 2016 2015 2016 2015
Diluted Loss Per Share $(0.23) $(0.05) $(0.51) $(0.33)
Reconciling Items 0.01 (0.01) 0.10 0.14
Adjusted EPS $(0.22) $(0.06) $(0.41) $(0.19)
Reconciling Items
Impairment charges $4 $24 $19 $24
Severance and reorganization costs 1 — 2 6
Loss on extinguishment of debt — 2 — 2
Effect on income of derivative instruments not designated as hedging instruments (3) — 1 —
Effect of foreign exchange (gain) loss on indebtedness — (1) (1) 1
Total Reconciling Items, pre-tax 2 25 21 33
Pro forma income tax impact (c) (1) (11) (8) (14)
Legal entity restructuring charge — (15) — —
Total Reconciling Items, net of tax $1 $(1) $13 $19
Diluted Earnings Per Share Impact $0.01 $(0.01) $0.10 $0.14
29 AUGUST 2016

Keys and Information
Refers to slide 5
30 AUGUST 2016
31
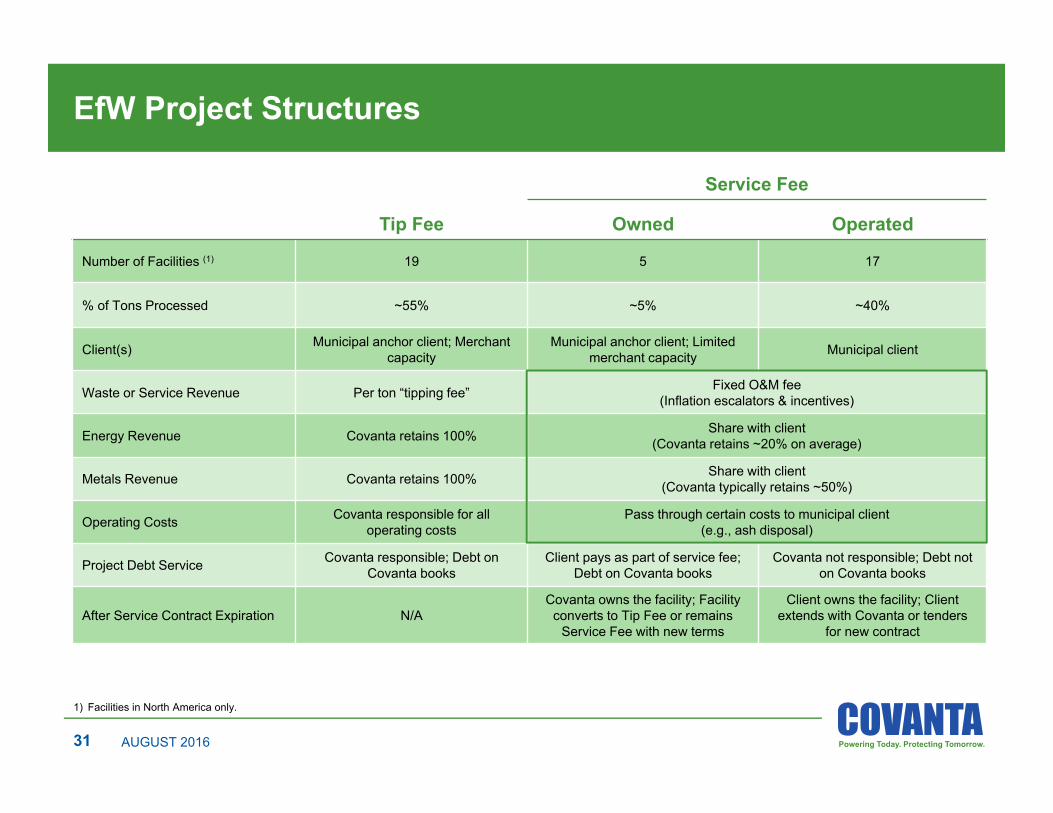
EfW Project Structures
Service Fee
Tip Fee Owned Operated
Number of Facilities (1) 19 5 17
% of Tons Processed ~55% ~5% ~40%
Client(s) Municipal anchor client; Merchant capacity
Municipal anchor client; Limited merchant capacity Municipal client
Waste or Service Revenue Per ton “tipping fee” Fixed O&M fee(Inflation escalators & incentives)
Energy Revenue Covanta retains 100% Share with client(Covanta retains ~20% on average)
Metals Revenue Covanta retains 100% Share with client(Covanta typically retains ~50%)
Operating Costs Covanta responsible for all operating costs
Pass through certain costs to municipal client(e.g., ash disposal)
Project Debt Service Covanta responsible; Debt on Covanta books
Client pays as part of service fee;Debt on Covanta books
Covanta not responsible; Debt not on Covanta books
After Service Contract Expiration N/ACovanta owns the facility; Facility
converts to Tip Fee or remains Service Fee with new terms
Client owns the facility; Client extends with Covanta or tenders
for new contract
1) Facilities in North America only.
AUGUST 2016

North American EfW Facility Detail
32
Tip Fee Service Fee (Owned) Service Fee (Operated)Alexandria / Arlington (VA) Babylon (NY) Burnaby (BC, Canada)Bristol (CT) Huntington (NY) Dade (FL)Camden (NJ) Marion County (OR) Durham / York (Ontario, Canada) Delaware Valley (PA) Onondaga County (NY) Harrisburg (PA)Essex County (NJ) Southeast Connecticut (CT) Hennepin County (MN)Fairfax County (VA) Hillsborough County (FL)Haverhill (MA) Honolulu (HI)Hempstead (NY) Huntsville (AL)Indianapolis (IN) Kent County (MI)Lake County (FL) Lancaster County (PA)Niagara (NY) Lee County (FL)Pittsfield (MA) Long Beach (CA)Plymouth (PA) MacArthur (NY)Southeast Massachusetts (MA) Montgomery County (MD)Stanislaus County (CA) Pasco County (FL)Springfield (MA) Pinellas County (FL)Tulsa (OK) York (PA)Union County (NJ)Warren County (NJ)
AUGUST 2016

Non-GAAP Financial MeasuresFree Cash Flow
Free Cash Flow is defined as cash flow provided by operating activities, less maintenance capital expenditures, which are capital expenditures primarily to maintain our existing facilities. We use the non-GAAP measure of Free Cash Flow as a criterion of liquidity and performance-based components of employee compensation. We use Free Cash Flow as a measure of liquidity to determine amounts we can reinvest in our core businesses, such as amounts available to make acquisitions, invest in construction of new projects, make principal payments on debt, or amounts we can return to our stockholders through dividends and/or stock repurchases. In order to provide a meaningful basis for comparison, we are providing information with respect to our Free Cash Flow for the three months ended March 31, 2016 and 2015, reconciled for each such period to cash flow provided by operating activities, which we believe to be the most directly comparable measure under GAAP.
Adjusted EBITDA
We use Adjusted EBITDA to provide further information that is useful to an understanding of the financial covenants contained in the credit facilities as of March 31, 2016 of our most significant subsidiary,Covanta Energy, LLC ("Covanta Energy"), through which we conduct our core waste and energy services business, and as additional ways of viewing aspects of its operations that, when viewed with theGAAP results and the accompanying reconciliations to corresponding GAAP financial measures, provide a more complete understanding of our core business. The calculation of Adjusted EBITDA is based onthe definition in Covanta Energy’s credit facilities as of March 31, 2016, which we have guaranteed. Adjusted EBITDA is defined as earnings before interest, taxes, depreciation and amortization, as adjustedfor additional items subtracted from or added to net income. Because our business is substantially comprised of that of Covanta Energy, our financial performance is substantially similar to that of CovantaEnergy. For this reason, and in order to avoid use of multiple financial measures which are not all from the same entity, the calculation of Adjusted EBITDA and other financial measures presented herein areours, measured on a consolidated basis. Under the credit facilities as of March 31, 2016, Covanta Energy is required to satisfy certain financial covenants, including certain ratios of which Adjusted EBITDA isan important component. Compliance with such financial covenants is expected to be the principal limiting factor which will affect our ability to engage in a broad range of activities in furtherance of ourbusiness, including making certain investments, acquiring businesses and incurring additional debt. Covanta Energy was in compliance with these covenants as of March 31, 2016. Failure to comply with suchfinancial covenants could result in a default under these credit facilities, which default would have a material adverse affect on our financial condition and liquidity.
These financial covenants are measured on a trailing four quarter period basis and the material covenants are as follows:• maximum Covanta Energy leverage ratio of 4.00 to 1.00, which measures Covanta Energy’s Consolidated Adjusted Debt (which is the principal amount of its consolidated debt less certain restricted
funds dedicated to repayment of project debt principal and construction costs) to its Adjusted EBITDA (which for purposes of calculating the leverage ratio and interest coverage ratio, is adjusted ona pro forma basis for acquisitions and dispositions made during the relevant period); and
• minimum Covanta Energy interest coverage ratio of 3.00 to 1.00, which measures Covanta Energy’s Adjusted EBITDA to its consolidated interest expense plus certain interest expense of ours, to the extent paid by Covanta Energy.
In order to provide a meaningful basis for comparison, we are providing information with respect to our Adjusted EBITDA for the three months ended March 31, 2016 and 2015, reconciled for each such period to net income and cash flow provided by operating activities, which are believed to be the most directly comparable measures under GAAP. Our projected full year 2016 Adjusted EBITDA is not based on GAAP net income/loss and is anticipated to be adjusted to exclude the effects of events or circumstances in 2016 that are not representative or indicative of our results of operations. Projected GAAP net income/loss for the full year would require inclusion of the projected impact of future excluded items, including items that are not currently determinable, but may be significant, such as asset impairments and one-time items, charges, gains or losses from divestitures, or other items. Due to the uncertainty of the likelihood, amount and timing of any such items, we do not have information available to provide a quantitative reconciliation of full year 2016 projected net income/loss to an Adjusted EBITDA projection.
Adjusted EPS
Adjusted EPS excludes certain income and expense items that are not representative of our ongoing business and operations, which are included in the calculation of Diluted Earnings Per Share in accordancewith GAAP. The following items are not all-inclusive, but are examples of reconciling items in prior comparative and future periods. They would include impairment charges, the effect of derivative instrumentsnot designated as hedging instruments, significant gains or losses from the disposition or restructuring of businesses, gains and losses on assets held for sale, transaction-related costs, income and loss on theextinguishment of debt and other significant items that would not be representative of our ongoing business. We will use the non-GAAP measure of Adjusted EPS to enhance the usefulness of our financialinformation by providing a measure which management internally uses to assess and evaluate the overall performance and highlight trends in the ongoing business. In order to provide a meaningful basis forcomparison, we are providing information with respect to our Adjusted EPS for the three months ended March 31, 2016 and 2015, reconciled for each such period to diluted income per share, which is believedto be the most directly comparable measure under GAAP.
AUGUST 201633


![arXiv:0912.4404v1 [q-fin.PR] 22 Dec 2009 · and Equity Return Swap valuation under Counterparty Risk ... Tarenghi: Structural Model - Lehman CDS calibration + equity swaps CVA 4 2](https://static.fdocuments.net/doc/165x107/5b214c927f8b9a88348b46ab/arxiv09124404v1-q-finpr-22-dec-2009-and-equity-return-swap-valuation-under.jpg)