August 2014 Sales by Area
18
www.TeamBlackBear.com [email protected] 970.337.7777 Vail Valley / Eagle County Market Report August 2014 - YTD
-
Upload
joan-harned -
Category
Documents
-
view
216 -
download
3
description
August 2014 Sales by Area
Transcript of August 2014 Sales by Area

www.TeamBlackBear.com [email protected] 970.337.7777
Vail Valley / Eagle County
Market Report
August 2014 - YTD

Area#
Sold
% of
Sold
Total $
Volume
% of $
Volume
Average
Sold Price
Average
Price / SF
AVG
DOM
% of List
Price
Total* 110 100% $70,179,824 100% $ 637,998 $ 359.41 121 94.84%
East Vail 11 10.0% 5,621,700$ 8.01% 511,064$ 420.22$ 85 95.74%
Vail Village 2 1.8% 1,696,800$ 2.42% 848,400$ 913.50$ 323 95.33%
Eagle‐Vail 3 2.7% 1,275,000$ 1.82% 425,000$ 260.20$ 47 93.65%
Beaver Creek 6 5.5% 7,535,000$ 10.74% 1,255,833$ 571.30$ 402 93.72%
Bachelor Gulch 0 0.0% ‐$ 0.00% ‐$ ‐$ 0 0.00%
Arrowhead 7 6.4% 9,370,000$ 13.35% 1,338,571$ 501.43$ 219 87.87%
Singletree 6 5.5% 4,532,500$ 6.46% 755,417$ 286.00$ 42 96.62%
Edwards 4 3.6% 2,076,225$ 2.96% 519,056$ 317.03$ 131 99.17%
Homestead 5 4.5% 2,224,600$ 3.17% 444,920$ 244.45$ 89 96.02%
Lake Creek Valley 0 0.0% ‐$ 0.00% ‐$ ‐$ 0 0.00%
Cordillera 1 0.9% 1,410,000$ 2.01% 1,410,000$ 304.40$ 373 94.31%
Cordillera Valley Club 0 0.0% ‐$ 0.00% ‐$ ‐$ 0 0.00%
Bellyache Wolcott 0 0.0% ‐$ 0.00% ‐$ ‐$ 0 0.00%
Eagle 5 4.5% 1,387,000$ 1.98% 277,400$ 167.88$ 9 99.11%
Eagle Ranch 7 6.4% 3,166,000$ 4.51% 452,286$ 228.40$ 61 97.22%
Gypsum 8 7.3% 2,228,000$ 3.17% 278,500$ 143.22$ 20 97.38%
Cotton Ranch 6 5.5% 2,419,000$ 3.45% 403,167$ 166.13$ 170 97.86%
If your area is not listed please contact us and we will gladly provide those stats.
* Total is for all residential sales in the MLS. Some areas have been omitted but their numbers are reflected in the total. Information contained in this report is not guaranteed to be
accurate. All statistical data is supplied by the Vail Board of Realtors and is deemed reliable but not guaranteed and individual verification is recommended.
August 2014 Sales by Area

August 2014 Monthly Snapshot
One-Year Change in One-Year Change in
Closed Sales All Properties
Active ListingsAll Properties
23456789
10111213141516
Monthly Indicators
- 13.6% - 14.9% + 0.5%One-Year Change in
Most local markets continue to recover from a soft patch earlier this year. The macro trend is still positive; the micro trend involves more moderate pinching up and down the month-to-month timeline. This is not uncommon in a balanced market, but it's been so long since we've seen one that we're watching it with perhaps too much trepidation. Metrics to watch include inventory and prices, but also days on market, months' supply and percent of list price received at sale. Declines in pending and closed sales activity may reflect strong decreases at lower price points and may not indicate softening demand.
New Listings were up 9.7 percent for single family/duplex homes but decreased 35.4 percent for townhouse-condo properties. Pending Sales decreased 13.0 percent for single family/duplex homes but increased 39.1 percent for townhouse-condo properties.
The Median Sales Price was down 0.1 percent to $455,000 for single family/duplex homes but increased 3.3 percent to $465,000 for townhouse-condo properties. Months Supply of Inventory increased 12.4 percent for single family/duplex units but decreased 25.2 percent for townhouse-condo units.
Sustained job growth, lower mortgage rates and a slow rise in the number of homes for sale appear to have unleashed at least some pent-up demand. Since housing demand relies heavily on an economy churning out good jobs, it's encouraging to see second quarter GDP growth revised upwards to a 4.2 percent annualized rate and stronger-than-expected job growth in recent months. Further improvements are still needed by way of wage growth and consumer confidence but recovery continues.
Median Sales PriceAll Properties
Residential real estate activity in Vail Board of REALTORS® MLS, comprised of single-family properties, townhomes and condominiums.. Percent changes are calculated using rounded figures.
Single Family/Duplex Activity Overview
Closed Sales and Inventory by Price Range
Current as of September 7, 2014. All data from the Vail Board of REALTORS® MLS. Powered by 10K Research and Marketing.
Townhouse-Condo Activity Overview
Days on Market Until SaleHousing Affordability IndexInventory of Active ListingsMonths Supply of InventoryAll Properties Activity Overview
New ListingsPending SalesClosed SalesMedian Sales PriceAverage Sales PricePercent of List Price Received
Glossary of Terms

Single Family/Duplex Activity Overview
Key Metrics Historical Sparkbars 8-2013 8-2014 Percent Change YTD 2013 YTD 2014 Percent Change
`
Key metrics for Single Family properties by report month and for year-to-date (YTD) starting from the first of the year.
New Listings 72 79 + 9.7% 644 - 4.9%
Pending Sales 69 60 - 13.0% 390 366 - 6.2%
677
- 11.5%
Median Sales Price $455,500 $455,000 - 0.1% $550,000 $582,500 + 5.9%
Closed Sales 60 51 - 15.0% 357 316
+ 35.1%
Pct. of List Price Received 97.0% 96.2% - 0.8% 95.7% 95.7% 0.0%
Average Sales Price $589,896 $745,265 + 26.3% $902,986 $1,219,974
+ 6.0%
Affordability Index 72 75 + 4.2% 60 59 - 1.7%
Days on Market 111 110 - 0.9% 151 160
Current as of September 7, 2014. All data from the Vail Board of REALTORS® MLS. Powered by 10K Research and Marketing. | Click for Cover Page | 2
--
Months Supply 11.3 12.7 + 12.4% -- -- --
Active Listings 579 544 - 6.0% -- --
8-2011 8-2012 8-2013 8-2014
8-2011 8-2012 8-2013 8-2014
8-2011 8-2012 8-2013 8-2014
8-2011 8-2012 8-2013 8-2014
8-2011 8-2012 8-2013 8-2014
8-2011 8-2012 8-2013 8-2014
8-2011 8-2012 8-2013 8-2014
8-2011 8-2012 8-2013 8-2014
8-2011 8-2012 8-2013 8-2014
8-2011 8-2012 8-2013 8-2014

Townhouse-Condo Activity Overview
Key Metrics Historical Sparkbars 8-2013 8-2014 Percent Change YTD 2013 YTD 2014 Percent Change
--
Current as of September 7, 2014. All data from the Vail Board of REALTORS® MLS. Powered by 10K Research and Marketing. | Click for Cover Page | 3
Months Supply 12.3 9.2 - 25.2% -- --
- 13.8%
Active Listings 592 452 - 23.6% -- -- --
Affordability Index 73 74 + 1.4% 80 69
+ 0.5%
Days on Market 235 134 - 43.0% 210 195 - 7.1%
Pct. of List Price Received 94.0% 96.6% + 2.8% 94.8% 95.3%
$998,732 + 29.8%
Median Sales Price $450,000 $465,000 + 3.3% $414,000 $500,000
Average Sales Price $910,167 $557,041 - 38.8% $769,668
374 + 10.7%
+ 20.8%
Closed Sales 65 57 - 12.3% 338
597 + 2.4%
Pending Sales 64 89 + 39.1% 380 454 + 19.5%
583
Key metrics for Townhouse-Condo properties by report month and for year-to-date (YTD) starting from the first of the year.
New Listings 79 51 - 35.4%
8-2011 8-2012 8-2013 8-2014
8-2011 8-2012 8-2013 8-2014
8-2011 8-2012 8-2013 8-2014
8-2011 8-2012 8-2013 8-2014
8-2011 8-2012 8-2013 8-2014
8-2011 8-2012 8-2013 8-2014
8-2011 8-2012 8-2013 8-2014
8-2011 8-2012 8-2013 8-2014
8-2011 8-2012 8-2013 8-2014
8-2011 8-2012 8-2013 8-2014
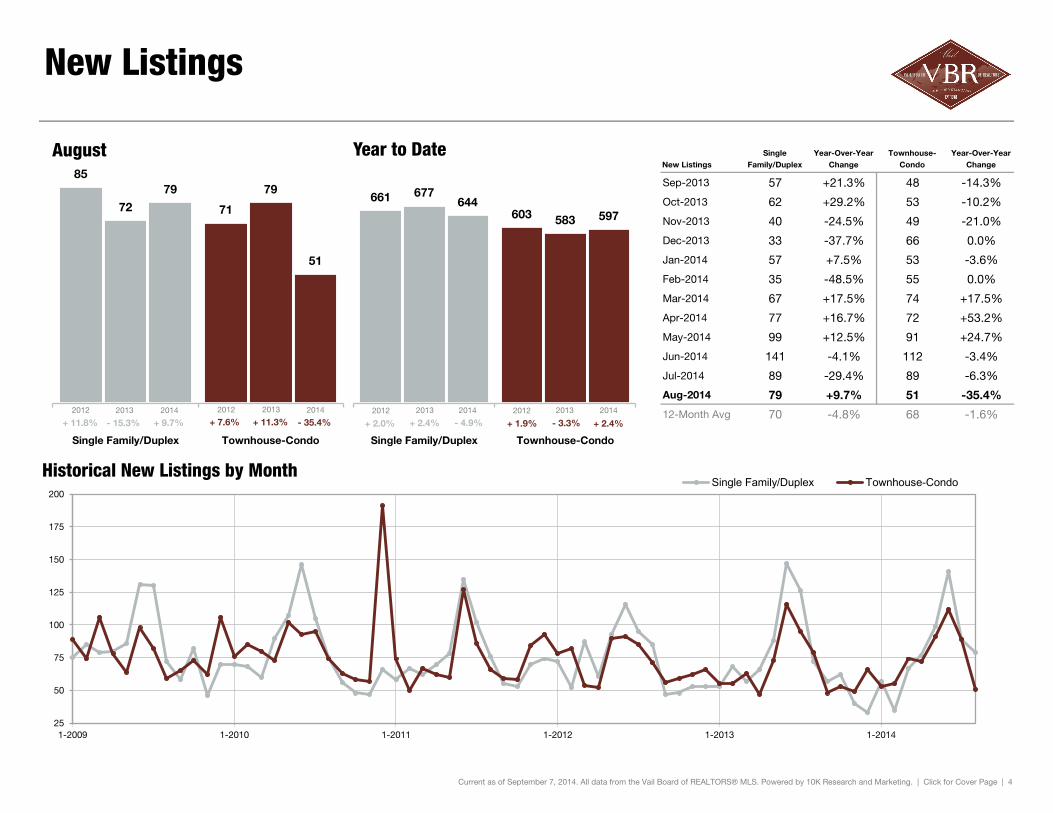
New Listings
New ListingsSingle
Family/DuplexYear-Over-Year
ChangeTownhouse-
CondoYear-Over-Year
Change
Sep-2013 57 +21.3% 48 -14.3%
Oct-2013 62 +29.2% 53 -10.2%
Nov-2013 40 -24.5% 49 -21.0%
Dec-2013 33 -37.7% 66 0.0%
Jan-2014 57 +7.5% 53 -3.6%
Feb-2014 35 -48.5% 55 0.0%
Mar-2014 67 +17.5% 74 +17.5%
Apr-2014 77 +16.7% 72 +53.2%
May-2014 99 +12.5% 91 +24.7%
Jun-2014 141 -4.1% 112 -3.4%
Jul-2014 89 -29.4% 89 -6.3%
Aug-2014 79 +9.7% 51 -35.4%
12-Month Avg 70 -4.8% 68 -1.6%
Historical New Listings by Month
Current as of September 7, 2014. All data from the Vail Board of REALTORS® MLS. Powered by 10K Research and Marketing. | Click for Cover Page | 4
A count of the properties that have been newly listed on the market in a given month.
85
71 72
79 79
51
Single Family/Duplex Townhouse-Condo
August
25
50
75
100
125
150
175
200
1-2009 1-2010 1-2011 1-2012 1-2013 1-2014
Single Family/Duplex Townhouse-Condo
661 603
677
583
644 597
Single Family/Duplex Townhouse-Condo
Year to Date
2012 2013 2014
- 35.4% + 11.3% + 9.7% - 15.3% - 3.3% - 4.9% + 2.4% + 2.4%
2012 2013 2014 2012 2013 2014 2012 2013 2014
+ 11.8% + 2.0% + 1.9% + 7.6%

Pending Sales
Pending SalesSingle
Family/DuplexYear-Over-Year
ChangeTownhouse-
CondoYear-Over-Year
Change
Sep-2013 53 -10.2% 66 +37.5%
Oct-2013 37 -42.2% 45 -23.7%
Nov-2013 38 -2.6% 30 -11.8%
Dec-2013 22 -26.7% 30 -16.7%
Jan-2014 38 -7.3% 49 +19.5%
Feb-2014 37 -9.8% 47 +34.3%
Mar-2014 49 -22.2% 50 +4.2%
Apr-2014 42 -16.0% 71 +82.1%
May-2014 37 +23.3% 35 -32.7%
Jun-2014 43 -10.4% 42 +20.0%
Jul-2014 60 +25.0% 71 +7.6%
Aug-2014 60 -13.0% 89 +39.1%
12-Month Avg 43 -11.3% 52 +12.2%
Historical Pending Sales by Month
A count of the properties on which offers have been accepted in a given month.
Current as of September 7, 2014. All data from the Vail Board of REALTORS® MLS. Powered by 10K Research and Marketing. | Click for Cover Page | 5
77
68 69 64
60
89
Single Family/Duplex Townhouse-Condo
August
0
20
40
60
80
100
1-2009 1-2010 1-2011 1-2012 1-2013 1-2014
Single Family/Duplex Townhouse-Condo
409 414 390 380 366
454
Single Family/Duplex Townhouse-Condo
Year to Date
2012 2013 2014
+ 39.1% - 5.9% - 13.0% - 10.4% - 8.2% - 6.2% - 4.6% + 19.5%
2012 2013 2014 2012 2013 2014 2012 2013 2014
+ 45.3% + 44.5% + 30.6% + 58.1%

Closed Sales
Closed SalesSingle
Family/DuplexYear-Over-Year
ChangeTownhouse-
CondoYear-Over-Year
Change
Sep-2013 54 -26.0% 60 -13.0%
Oct-2013 57 -16.2% 72 -1.4%
Nov-2013 42 -31.1% 42 -10.6%
Dec-2013 45 -21.1% 39 -20.4%
Jan-2014 25 +8.7% 30 -3.2%
Feb-2014 30 -16.7% 33 +3.1%
Mar-2014 28 -24.3% 51 +45.7%
Apr-2014 47 -11.3% 51 +21.4%
May-2014 45 -22.4% 59 +15.7%
Jun-2014 46 +9.5% 44 +10.0%
Jul-2014 44 -8.3% 49 +16.7%
Aug-2014 51 -15.0% 57 -12.3%
12-Month Avg 43 -16.6% 49 +1.9%
Historical Closed Sales by Month
A count of the actual sales that closed in a given month.
Current as of September 7, 2014. All data from the Vail Board of REALTORS® MLS. Powered by 10K Research and Marketing. | Click for Cover Page | 6
61 66
60 65
51
57
Single Family/Duplex Townhouse-Condo
August
0
20
40
60
80
1-2009 1-2010 1-2011 1-2012 1-2013 1-2014
Single Family/Duplex Townhouse-Condo
330 354 357
338 316
374
Single Family/Duplex Townhouse-Condo
Year to Date
2012 2013 2014
- 12.3% - 1.5% - 15.0% - 1.6% - 4.5% - 11.5% + 8.2% + 10.7%
2012 2013 2014 2012 2013 2014 2012 2013 2014
+ 79.4% + 39.8% + 14.2% + 53.5%
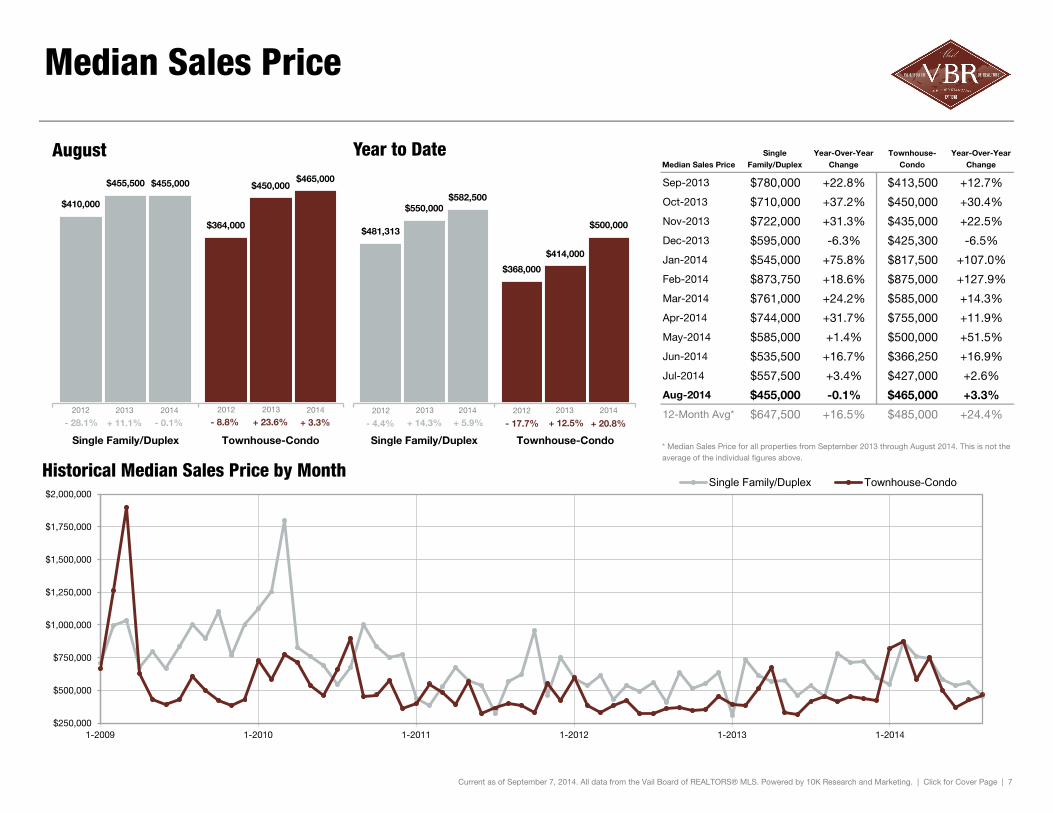
Median Sales Price
Median Sales PriceSingle
Family/DuplexYear-Over-Year
ChangeTownhouse-
CondoYear-Over-Year
Change
Sep-2013 $780,000 +22.8% $413,500 +12.7%
Oct-2013 $710,000 +37.2% $450,000 +30.4%
Nov-2013 $722,000 +31.3% $435,000 +22.5%
Dec-2013 $595,000 -6.3% $425,300 -6.5%
Jan-2014 $545,000 +75.8% $817,500 +107.0%
Feb-2014 $873,750 +18.6% $875,000 +127.9%
Mar-2014 $761,000 +24.2% $585,000 +14.3%
Apr-2014 $744,000 +31.7% $755,000 +11.9%
May-2014 $585,000 +1.4% $500,000 +51.5%
Jun-2014 $535,500 +16.7% $366,250 +16.9%
Jul-2014 $557,500 +3.4% $427,000 +2.6%
Aug-2014 $455,000 -0.1% $465,000 +3.3%
12-Month Avg* $647,500 +16.5% $485,000 +24.4%
Historical Median Sales Price by Month
Point at which half of the sales sold for more and half sold for less, not accounting for seller concessions, in a given month.
* Median Sales Price for all properties from September 2013 through August 2014. This is not the average of the individual figures above.
Current as of September 7, 2014. All data from the Vail Board of REALTORS® MLS. Powered by 10K Research and Marketing. | Click for Cover Page | 7
$410,000
$364,000
$455,500 $450,000 $455,000 $465,000
Single Family/Duplex Townhouse-Condo
August
$250,000
$500,000
$750,000
$1,000,000
$1,250,000
$1,500,000
$1,750,000
$2,000,000
1-2009 1-2010 1-2011 1-2012 1-2013 1-2014
Single Family/Duplex Townhouse-Condo
$481,313
$368,000
$550,000
$414,000
$582,500
$500,000
Single Family/Duplex Townhouse-Condo
Year to Date
2012 2013 2014
+ 3.3% + 23.6% - 0.1% + 11.1% + 12.5% + 5.9% + 14.3% + 20.8%
2012 2013 2014 2012 2013 2014 2012 2013 2014
- 28.1% - 4.4% - 17.7% - 8.8%

Average Sales Price
Average Sales Price
SingleFamily/Duplex
Year-Over-YearChange
Townhouse-Condo
Year-Over-YearChange
Sep-2013 $1,396,172 +25.1% $866,646 +31.7%
Oct-2013 $1,346,206 +56.0% $722,328 -10.7%
Nov-2013 $1,406,825 +15.0% $1,017,538 +31.3%
Dec-2013 $1,253,751 +16.6% $878,973 -10.1%
Jan-2014 $1,205,468 +85.0% $1,390,563 +113.2%
Feb-2014 $1,098,540 -27.4% $1,201,270 +28.4%
Mar-2014 $1,482,573 +78.0% $849,114 -8.4%
Apr-2014 $2,160,310 +157.1% $1,494,230 +51.4%
May-2014 $1,239,178 +9.3% $1,097,950 +75.4%
Jun-2014 $1,048,943 +33.1% $720,431 +37.2%
Jul-2014 $848,849 -5.9% $906,673 +58.7%
Aug-2014 $745,265 +26.3% $557,041 -38.8%
12-Month Avg* $1,270,709 +30.8% $944,717 +21.2%
Historical Average Sales Price by Month
Average sales price for all closed sales, not accounting for seller concessions, in a given month.
* Average Sales Price for all properties from September 2013 through August 2014. This is not the average of the individual figures above.
Current as of September 7, 2014. All data from the Vail Board of REALTORS® MLS. Powered by 10K Research and Marketing. | Click for Cover Page | 8
$1,053,229
$529,681 $589,896
$910,167
$745,265
$557,041
Single Family/Duplex Townhouse-Condo
August
$500,000
$1,000,000
$1,500,000
$2,000,000
$2,500,000
$3,000,000
1-2009 1-2010 1-2011 1-2012 1-2013 1-2014
Single Family/Duplex Townhouse-Condo
$1,200,055
$803,274
$902,986
$769,668
$1,219,974
$998,732
Single Family/Duplex Townhouse-Condo
Year to Date
2012 2013 2014
- 38.8% + 71.8% + 26.3% - 44.0% - 4.2% + 35.1% - 24.8% + 29.8%
2012 2013 2014 2012 2013 2014 2012 2013 2014
+ 37.4% + 11.1% - 16.1% - 38.0%

Percent of List Price Received
Pct. of List Price Received
SingleFamily/Duplex
Year-Over-YearChange
Townhouse-Condo
Year-Over-YearChange
Sep-2013 95.1% +1.1% 94.3% +0.4%
Oct-2013 95.5% +1.8% 94.1% +0.2%
Nov-2013 95.6% +2.1% 95.3% +0.8%
Dec-2013 95.0% +1.6% 95.9% -0.2%
Jan-2014 95.9% -0.6% 94.3% -1.4%
Feb-2014 94.2% +0.7% 94.0% -1.5%
Mar-2014 96.2% -0.1% 94.9% -0.1%
Apr-2014 95.0% +0.6% 93.6% -0.6%
May-2014 96.4% -0.4% 95.6% +0.3%
Jun-2014 95.9% +0.4% 95.9% +0.8%
Jul-2014 95.4% +0.7% 96.3% +1.5%
Aug-2014 96.2% -0.8% 96.6% +2.8%
12-Month Avg* 95.5% +0.7% 95.1% +0.4%
Historical Percent of List Price Received by Month
Percentage found when dividing a property’s sales price by its most recent list price, then taking the average for all properties sold in a given month, not accounting for seller concessions.
* Pct. of List Price Received for all properties from September 2013 through August 2014. This is not the average of the individual figures above.
Current as of September 7, 2014. All data from the Vail Board of REALTORS® MLS. Powered by 10K Research and Marketing. | Click for Cover Page | 9
94.2% 93.7% 97.0% 94.0% 96.2% 96.6%
Single Family/Duplex Townhouse-Condo
August
70.0%
75.0%
80.0%
85.0%
90.0%
95.0%
100.0%
1-2009 1-2010 1-2011 1-2012 1-2013 1-2014
Single Family/Duplex Townhouse-Condo
93.5% 93.8% 95.7% 94.8% 95.7% 95.3%
Single Family/Duplex Townhouse-Condo
Year to Date
2012 2013 2014
+ 2.8% + 0.3% - 0.8% + 3.0% + 1.1% 0.0% + 2.4% + 0.5%
2012 2013 2014 2012 2013 2014 2012 2013 2014
- 0.8% + 0.8% + 0.9% 0.0%

Days on Market Until Sale
Days on MarketSingle
Family/DuplexYear-Over-Year
ChangeTownhouse-
CondoYear-Over-Year
Change
Sep-2013 257 +52.1% 185 -5.6%
Oct-2013 140 -15.2% 203 -3.8%
Nov-2013 173 +9.5% 213 +5.4%
Dec-2013 135 -32.2% 277 +18.9%
Jan-2014 152 -18.7% 197 +28.8%
Feb-2014 239 +22.6% 182 +16.7%
Mar-2014 180 +100.0% 341 +11.8%
Apr-2014 206 -6.8% 243 +1.7%
May-2014 200 +21.2% 158 -7.1%
Jun-2014 116 -1.7% 169 -17.2%
Jul-2014 110 -17.3% 141 -30.9%
Aug-2014 110 -0.9% 134 -43.0%
12-Month Avg* 160 +4.2% 210 -3.8%
Historical Days on Market Until Sale by Month
Average number of days between when a property is listed and when an offer is accepted in a given month.
* Days on Market for all properties from September 2013 through August 2014. This is not the average of the individual figures above.
Current as of September 7, 2014. All data from the Vail Board of REALTORS® MLS. Powered by 10K Research and Marketing. | Click for Cover Page | 10
113
179
111
235
110
134
Single Family/Duplex Townhouse-Condo
August
0
100
200
300
400
500
1-2009 1-2010 1-2011 1-2012 1-2013 1-2014
Single Family/Duplex Townhouse-Condo
184
215
151
210
160
195
Single Family/Duplex Townhouse-Condo
Year to Date
2012 2013 2014
- 43.0% + 31.3% - 0.9% - 1.8% - 2.3% + 6.0% - 17.9% - 7.1% 2012 2013 2014 2012 2013 2014 2012 2013 2014
- 56.2% - 18.2% - 4.0% + 24.3%

Housing Affordability Index
Affordability IndexSingle
Family/DuplexYear-Over-Year
ChangeTownhouse-
CondoYear-Over-Year
Change
Sep-2013 43 -25.9% 81 -19.8%
Oct-2013 47 -33.8% 74 -30.2%
Nov-2013 49 -26.9% 81 -22.1%
Dec-2013 57 -3.4% 79 -3.7%
Jan-2014 61 -48.3% 40 -57.0%
Feb-2014 38 -22.4% 38 -59.1%
Mar-2014 44 -24.1% 57 -18.6%
Apr-2014 45 -29.7% 44 -18.5%
May-2014 59 -3.3% 69 -34.9%
Jun-2014 64 -11.1% 94 -11.3%
Jul-2014 61 -1.6% 80 0.0%
Aug-2014 75 +4.2% 74 +1.4%
12-Month Avg* 54 +11.1% 68 -16.7%
Historical Housing Affordability Index by Month
This index measures housing affordability for the region. An index of 120 means the median household income is 120% of what is necessary to qualify for the median-priced home under prevailing interest rates. A higher number means greater affordability.
* Affordability Index for all properties from September 2013 through August 2014. This is not the average of the individual figures above.
Current as of September 7, 2014. All data from the Vail Board of REALTORS® MLS. Powered by 10K Research and Marketing. | Click for Cover Page | 11
88
100
72 73 75 74
Single Family/Duplex Townhouse-Condo
August
0
20
40
60
80
100
120
1-2009 1-2010 1-2011 1-2012 1-2013 1-2014
Single Family/Duplex Townhouse-Condo
2012 2013 2014
+ 1.4% - 27.0% + 4.2% - 18.2% 2012 2013 2014
+ 49.2% + 17.6%
75
99
60
80
59
69
Single Family/Duplex Townhouse-Condo
Year to Date
- 13.8% - 19.2% - 1.7% - 20.0% + 11.9% + 30.3% 2012 2013 2014 2012 2013 2014

Inventory of Active Listings
Active ListingsSingle
Family/DuplexYear-Over-Year
ChangeTownhouse-
CondoYear-Over-Year
Change
Sep-2013 543 -12.8% 540 -18.8%
Oct-2013 535 -3.4% 505 -19.5%
Nov-2013 504 -6.5% 498 -20.7%
Dec-2013 469 -6.9% 493 -18.2%
Jan-2014 461 -4.2% 485 -16.2%
Feb-2014 443 -9.4% 479 -17.6%
Mar-2014 446 -3.7% 489 -15.3%
Apr-2014 448 -1.8% 454 -15.0%
May-2014 486 +2.7% 476 -10.4%
Jun-2014 546 -0.4% 519 -11.6%
Jul-2014 552 -8.5% 521 -13.5%
Aug-2014 544 -6.0% 452 -23.6%
12-Month Avg 498 -5.3% 493 -16.8%
Historical Inventory of Active Listings by Month
The number of properties available for sale in active status at the end of a given month.
Current as of September 7, 2014. All data from the Vail Board of REALTORS® MLS. Powered by 10K Research and Marketing. | Click for Cover Page | 12
675 689
579 592 544
452
Single Family/Duplex Townhouse-Condo
August
400
500
600
700
800
900
1,000
1,100
1-2009 1-2010 1-2011 1-2012 1-2013 1-2014
Single Family/Duplex Townhouse-Condo
2012 2013 2014 - 23.6% - 14.1% - 6.0% - 14.2%
2012 2013 2014
- 11.9% - 17.2%

Months Supply of Inventory
Months SupplySingle
Family/DuplexYear-Over-Year
ChangeTownhouse-
CondoYear-Over-Year
Change
Sep-2013 10.9 -23.2% 11.4 -20.8%
Oct-2013 11.0 -9.8% 10.7 -16.4%
Nov-2013 10.7 -7.0% 10.7 -16.4%
Dec-2013 10.1 -1.9% 10.7 -12.3%
Jan-2014 9.9 0.0% 10.6 -10.2%
Feb-2014 9.6 -3.0% 10.4 -12.6%
Mar-2014 9.9 +6.5% 10.3 -14.9%
Apr-2014 10.0 +12.4% 9.5 -16.7%
May-2014 11.2 +19.1% 9.8 -10.9%
Jun-2014 12.4 +13.8% 10.6 -13.1%
Jul-2014 12.7 +8.5% 10.5 -16.0%
Aug-2014 12.7 +12.4% 9.2 -25.2%
12-Month Avg 10.9 +1.3% 10.4 -15.6%
Historical Months Supply of Inventory by Month
The inventory of homes for sale at the end of a given month, divided by the average monthly closed sales from the last 12 months.
* Months Supply for all properties from September 2013 through August 2014. This is not the average of the individual figures above.
Current as of September 7, 2014. All data from the Vail Board of REALTORS® MLS. Powered by 10K Research and Marketing. | Click for Cover Page | 13
16.1 15.7
11.3 12.3 12.7
9.2
Single Family/Duplex Townhouse-Condo
August
0.0
10.0
20.0
30.0
40.0
50.0
1-2009 1-2010 1-2011 1-2012 1-2013 1-2014
Single Family/Duplex Townhouse-Condo
2012 2013 2014 - 25.2% - 21.7% + 12.4% - 29.8%
2012 2013 2014
- 34.0% - 25.6%

All Properties Activity Overview
Key Metrics Historical Sparkbars 8-2013 8-2014 Percent Change YTD 2013 YTD 2014 Percent Change
--
Current as of September 7, 2014. All data from the Vail Board of REALTORS® MLS. Powered by 10K Research and Marketing. | Click for Cover Page | 14
Months Supply 11.8 10.9 - 7.6% -- --
- 9.8%
Active Listings 1,171 996 - 14.9% -- -- --
Affordability Index 72 75 + 3.8% 69 62
+ 0.2%
Days on Market 175 123 - 29.7% 180 179 - 0.6%
Pct. of List Price Received 95.5% 96.4% + 0.9% 95.3% 95.5%
$1,100,054 + 31.2%
Median Sales Price $455,000 $457,500 + 0.5% $480,000 $555,000
Average Sales Price $756,437 $645,924 - 14.6% $838,149
690 - 0.7%
+ 15.6%
Closed Sales 125 108 - 13.6% 695
1,241 - 1.5%
Pending Sales 133 149 + 12.0% 770 820 + 6.5%
1,260
Key metrics for All Properties by report month and for year-to-date (YTD) starting from the first of the year.
New Listings 151 130 - 13.9%
8-2011 8-2012 8-2013 8-2014
8-2011 8-2012 8-2013 8-2014
8-2011 8-2012 8-2013 8-2014
8-2011 8-2012 8-2013 8-2014
8-2011 8-2012 8-2013 8-2014
8-2011 8-2012 8-2013 8-2014
8-2011 8-2012 8-2013 8-2014
8-2011 8-2012 8-2013 8-2014
8-2011 8-2012 8-2013 8-2014
8-2011 8-2012 8-2013 8-2014

Closed Sales
By Price Range 8-2013 8-2014 Change 8-2013 8-2014 Change 7-2014 8-2014 Change 7-2014 8-2014 Change YTD 2013 YTD 2014 Change YTD 2013 YTD 2014 Change$299,999 and Below 145 72 - 50.3% 200 135 - 32.5% 10 6 - 40.0% 11 20 + 81.8% 87 49 - 43.7% 104 83 - 20.2%$300,000 to $599,999 192 167 - 13.0% 166 210 + 26.5% 14 22 + 57.1% 25 16 - 36.0% 113 112 - 0.9% 103 126 + 22.3%$600,000 to $999,999 125 112 - 10.4% 90 96 + 6.7% 7 13 + 85.7% 8 15 + 87.5% 70 64 - 8.6% 59 59 0.0%$1,000,000 to $1,499,999 59 51 - 13.6% 49 53 + 8.2% 1 5 + 400.0% 3 5 + 66.7% 36 31 - 13.9% 28 39 + 39.3%$1,500,00 to $1,999,999 26 32 + 23.1% 26 26 0.0% 5 2 - 60.0% 3 0 - 100.0% 19 14 - 26.3% 20 19 - 5.0%$2,000,000 to $2,499,999 18 18 0.0% 9 18 + 100.0% 1 0 - 100.0% 2 1 - 50.0% 9 8 - 11.1% 7 14 + 100.0%$2,500,000 to $4,999,999 39 39 0.0% 29 34 + 17.2% 6 3 - 50.0% 4 0 - 100.0% 19 27 + 42.1% 13 26 + 100.0%$5,000,000 to $9,999,999 9 19 + 111.1% 6 15 + 150.0% 1 0 - 100.0% 3 0 - 100.0% 3 8 + 166.7% 4 8 + 100.0%$10,000,000 and Above 3 4 + 33.3% 1 0 - 100.0% 0 0 -- 0 0 -- 1 3 + 200.0% 0 0 --All Price Ranges 616 514 - 16.6% 576 587 + 1.9% 45 51 + 13.3% 59 57 - 3.4% 357 316 - 11.5% 338 374 + 10.7%
Inventory of Active Listings
By Price Range 8-2013 8-2014 Change 8-2013 8-2014 Change 7-2014 8-2014 Change 7-2014 8-2014 Change$299,999 and Below 26 20 - 23.1% 55 35 - 36.4% 22 20 - 9.1% 43 35 - 18.6%$300,000 to $599,999 69 65 - 5.8% 148 116 - 21.6% 66 65 - 1.5% 152 116 - 23.7%$600,000 to $999,999 111 120 + 8.1% 116 83 - 28.4% 93 120 + 29.0% 80 83 + 3.8%$1,000,000 to $1,499,999 84 62 - 26.2% 66 53 - 19.7% 59 62 + 5.1% 40 53 + 32.5%$1,500,00 to $1,999,999 54 58 + 7.4% 48 35 - 27.1% 47 58 + 23.4% 34 35 + 2.9%$2,000,000 to $2,499,999 39 42 + 7.7% 27 27 0.0% 35 42 + 20.0% 25 27 + 8.0%$2,500,000 to $4,999,999 111 102 - 8.1% 84 60 - 28.6% 97 102 + 5.2% 58 60 + 3.4%$5,000,000 to $9,999,999 57 58 + 1.8% 39 35 - 10.3% 46 58 + 26.1% 37 35 - 5.4%$10,000,000 and Above 28 17 - 39.3% 9 8 - 11.1% 21 17 - 19.0% 7 8 + 14.3%All Price Ranges 579 544 - 6.0% 592 452 - 23.6% 486 544 + 11.9% 476 452 - 5.0%
Current as of September 7, 2014. All data from the Vail Board of REALTORS® MLS. Powered by 10K Research and Marketing. | Click for Cover Page | 15
A measure of the number of homes available for sale at a given time.
Year over Year Compared to Prior Month Year to DateSingle Family Condo Single Family Condo Single Family Condo
There are no year-to-date figures for inventory because it is simply a
snapshot frozen in time at the end of each month. It does not add up over a
period of months.
Actual sales that have closed in a given quarter.
Rolling 12 Months Compared to Prior Month Year to DateSingle Family Condo Single Family Condo Single Family Condo
345 358
215 108 52 27 68 15 4
207
377
208 104 58 36 73 34 4
< $300K $300K to $599K $600K to $999K $1.0M to $1.4M $1.5M to $1.9M $2.0M to $2.5M $2.5M to $4.9M $5.0M to $9.9M $10.0M+
By Price Range – All Properties – Rolling 12 Months 8-2013 8-2014
- 40.0%
616 576 1,192
514 587 1,101
Singe Family Townhouse-Condo All Properties
By Property Type 8-2013 8-2014
+ 5.3% - 3.3% - 3.7% + 11.5% + 33.3% + 7.4% + 126.7% 0.0% - 16.6% + 1.9% - 7.6%
81 217 227
150 102 66 195
96 37 55
181 203 115 93 69
162 93
25
< $300K $300K to $599K $600K to $999K $1.0M to $1.4M $1.5M to $1.9M $2.0M to $2.5M $2.5M to $4.9M $5.0M to $9.9M $10.0M+
By Price Range – All Properties 8-2013 8-2014
- 32.1%
579 592 1,171
544 452 996
Singe Family Townhouse-Condo All Properties
By Property Type 8-2013 8-2014
- 16.6% - 10.6% - 23.3% - 8.8% + 4.5% - 16.9% - 3.1% - 32.4% - 6.0% - 23.6% - 14.9%

Glossary of Terms
New Listings
Pending Sales
Closed Sales
Median Sales Price
Average Sales Price
Percent of List Price Received
Days on Market Until Sale
Housing Affordability Index
Inventory of Active Listings
Months Supply of Inventory
Current as of September 7, 2014. All data from the Vail Board of REALTORS® MLS. Powered by 10K Research and Marketing. | Click for Cover Page | 16
A research tool provided by the Colorado Association of REALTORS®
A measure of how much new supply is coming onto the market from sellers (e.g., Q3 New Listings are those listings with a system list date from July 1 through September 30).
A count of all the listings that went into Pending during the reported period. Pending listings are counted at the end of the reported period. Each listing can only be counted one time. If a listing goes into Pending, out of Pending, then back into Pending all in one reported period, this listing would only be counted once. This is the most real-time measure possible for home buyer activity, as it measures signed contracts on sales rather than the actual closed sale. As such, it is called a "leading indicator" of buyer demand.
A measure of home sales that were closed to completion during the report period.
A measure of home values in a market area where 50% of activity was higher and 50% was lower than this price point.
A sum of all home sales prices divided by total number of sales.
A mathematical calculation of the percent difference from last list price and sold price for those listings sold in the reported period.
A measure of how long it takes homes to sell, on average.
A measure of how affordable a region’s housing is to its consumers. A higher number means greater affordability. The index is based on interest rates, median sales price and average income by county.
A measure of the number of homes available for sale at a given time. The availability of homes for sale has a big effect on supply-demand dynamics and home prices.
A measure of how balanced the market is between buyers and sellers. It is expressed as the number of months it would hypothetically take to sell through all the available homes for sale, given current levels of home sales. A balanced market ranges from 4 to 7 months of supply. A buyer's market has a higher number, reflecting fewer buyers relative to homes for sale. A seller's market has a lower number, reflecting more buyers relative to homes for sale.