2015 National Training NT 1505 2015 National Training NT 1505.
Upload
vuongkhanhCategory
view
215download
1
SUMMER TRAINING REPORT
on
REC MECHANISM & REGULATORY FRAMEWORK IN INDIA
Vis-à-vis DEVELOPED COUNTRIES
(COMPARATIVE STUDY AND FUTURE PERSPECTIVE)
At
LARSEN & TOUBRO Ltd., CHENNAI
(Water & Renewable IC)
AUGUST-2013
Under the guidance of :
Mr.S.K.CHOUDHARY
Principal Director,
CAMPS, NPTI
Mr.RAJEEV B. AGARWAL
Business Acquisition Head-L&T
Integrated Mega Solar PV farms
Prepared by
ABHINAV AGRAWAL
MBA - Power Management, Class: 2012-14
Centre for Advanced Management and Power Studies (CAMPS)
NATIONAL POWER TRAINING INSTITUTE (NPTI), Faridabad
Submitted to
MAHARISHI DAYANAND UNIVERSITY, ROHTAK

i
DECLARATION
I, Abhinav Agrawal, student of MBA-Power Management (2012-14) at National Power Training
Institute, Faridabad hereby declare that the Summer Training Report entitled
“REC MECHANISM & REGULATORY FRAMEWORK IN INDIA
Vis-à-vis DEVELOPED COUNTRIES”
(COMPARATIVE STUDY AND FUTURE PERSPECTIVE)
is an original work and the same has not been submitted to any other institute for the award of any
other degree.
A seminar presentation of the Training Report was made on and the
suggestions approved by the faculty were duly incorporated.
Presentation Incharge Signature of Candidate
COUNTER SIGNED PRINCIPAL/DIRECTOR
OF INSTITUE

ii
CERTIFCATE

iii
ACKNOWLEDGEMENT
I have no words to express my sincere gratitude to all the people who had been associated with
me in some way or the other and helped me avail this opportunity for my summer Internship on
the topic “A COMPARITIVE STUDY OF REC MECHANISM & REGULATORY FRAMEWORK IN
INDIA Vis-à-vis DEVELOPED COUNTRIES”.
I express my heartily thanks to Mr. Milan Kumar (Sr. G.M., EDRC) for providing me the
opportunity to work on such an insightful project.
I acknowledge with gratitude and humanity my indebtedness to my Summer Internship guide
Mr. Rajeev Agarwal (Business Acquis i t ion Head -Solar PV) for providing me
excellent guidance and motivation under whom I completed my summer internship.
I would like to take the opportunity to thanks Mr. Prateek (Asst.Manager), Mr.Vineet
(Sr.Engg.), Mr. Dinesh (Sr.Engg.), Mr.Dhruva Ballal (Sr.Engg.) for their guidance and support
throughout the course of my project.
This project would have been quite difficult without the suggestions and guidance of my college
senior at L&T Mr. Gurudutt Bhatt, I would express my sincere thanks to him.
I would like to thank my Project In-charge Mr. S.K.Choudhary (Principal Director, CAMPS)
and Mr. J.S.S. Rao (Principal Director, CP&M, NPTI) Faridabad for his support and guidance
throughout the course of summer internship.
A special thanks to Manju Mam (Director) and Mrs. Indu Maheswari (Dy. Director) for their
guidance throughout my summer internship. I am highly grateful to Dr. Rohit Verma (Dy.
Director) and Dr. K.P.S. Parmar (Asst. Director) and all faculty members for arranging my
internship at L&T (W&R IC) and being a constant source of motivation and guidance
throughout the course of my internship.
Thank you for all for being there for me always.
Abhinav Agrawal
iv
EXECUTIVE SUMMARY India’s expeditiously growing economy and expanding grandiloquent urban population is
catalyzing the appetite of country’s electricity requirement enormously. IEA predicts that by
2020 country will need 327 GW of power generation capacity implying addition of 16 GW per
year. This increase in electricity needs with slower than expected increase in domestic fuel
production has lead country to import of fossil fuels like oil with almost 75% of dependency and
estimated 30% of coal dependency by 2017 on global fuel supply market which is getting
costlier and volatile due to global competition to get access over the scarce resources. This
clearly signifies that for one of the biggest economies of world like India for addressing all issues
like booming economy, energy requirements, climate change, health issues, environmental
commitments made at Kyoto protocol relying on only one sources of energy is not enough and
diversifying the energy security by integrating the renewable by adopting the global schemes like
CDM/JI will be a wise option. Estimations of MNRE and some key consultants say that India
has got a potential of almost 50 GW of wind potential, 18 GW of biomass potential, 15.4 GW of
small hydro power potential and almost near around 67 GW of solar potential till 2017. The
initiatives for promoting RE began back in 1994 with schemes like “Small Wind &Hybrid
Systems” but because of incentive scarce schemes with lesser support the Renewable market
didn’t picked up in the country. Until recently the most effective tool has been „The Electricity
Act 2003 with a clause which required SERC’s to set a Renewable Portfolio Standard within
their states and MNRE also issued guidelines to create an attractive environment for promoting
various technologies in Renewable. The prime minister’s NAPCC released in June 2008,
mandated to meet 15% of power requirements via Renewable by 2020. In the process of
supporting the above target, Jawaharlal Nehru National Solar Mission (JNNSM) targeting 22
GW of solar generations till 2022 was launched in 2009. Taking concern of vibrant-risk taking
entrepreneurial culture of country MNRE announced schemes like Generation Based Incentive
(GBI) and Accelerated Depreciation (AD) in 2008 and 2009 respectively to attract the
developers and various tax/levy deduction-exemption policies for manufacturers in the market.
Almost 21 states have come up with their state level Renewable Policies with attractive Feed in
tariffs (FIT‟s) for RE generators and almost a bunch of benefits for attracting Captive RE
generators as well. Moreover REC mechanism already operational in the market is also expected
to play a revolutionary role in development of India’s Renewable sector. Thus with ample of
natural resources like sunlight, wind, biomass, bagasse, etc available and with the best of the
enabling and supporting environment provided to financial institutions and entrepreneurs by the
central government with some of the smartest policies arsenals today India has come a long way
from just 2% in 1995 to almost 10.9% of renewable mix of installed generations in country and
we believe to lead the renewable market globally in near future but there are some prominent
issues backstabbing this success journey and international learning to improve REC markets.

v
LIST OF ABBREVIATION
AD Accelerated Depreciation
BHEL Bharat Heavy Electricals Limited
CDM Clean Development Mechanism
CEA Central Electricity Authority
CPP Captive Power Plant
CFA Central Finance Assistance
CERC Central Electricity Regulatory Commission
DMRPS Dynamic Minimum Renewable Purchase Standard
DORA Date Of Receiving Application
GHG Green House Gas
GBI Generation Based Incentive
GW Giga Watt
GOI Government of India
IEA International Energy Agency
IPP Independent Power Producer
JI Just Implementation
JNNSM Jawaharlal Nehru National Solar Mission
MW Mega Watt
MWh Mega Watt Hour
MOEF Ministry Of Environment And Forest
MOP Ministry Of Power
MEP Market Equilibrium Price

vi
MU Million Units
NTPC National Thermal Power Corporation
NHPC National Hydro Power Corporation
NEEPCO North Eastern Electric Power Corporation Limited.
NLDC National Load Dispatch Centre
NAPCC National Action Plan for Climate Change
PLF Plant Load Factor
PFC Power Finance Corporation
REC Renewable Energy Certificates
RO Renewable Obligation
ROC Renewable Obligation Certificate
RPO Renewable Purchase Obligation
SEB State Electricity Board
SNA State Nodal Agency
SHP Small Hydro Plant
vii
LIST OF FIGURE AND CHARTS
Figure 1: Electricity Demand and Supply Curve Between 2003 T0 2010 ..................................... 1
Figure 2: Installed Capacity in India (in GW) ................................................................................ 4
Figure 3: Electricity Demand projection in billion units from 2010 till 2020 ................................ 4
Figure 4: RE Installed Capacity ...................................................................................................... 5
Figure 5: Eligibiltiy For Availing REC Benefit ........................................................................... 29
Figure 6: Process Of Issuance Of Roc In U.K. ............................................................................. 43
Figure 7: Large Scale Generation Certificate Trading Procedure ................................................ 58
Figure 8: Small Scale Technology Certificates Trading Procedure .............................................. 59
LIST OF TABLES AND ANNEXURE
Table 1: RE Projects, capital cost and levellised tariff for FY 2013-14 (lakh/MW) by CERC ...... 7
Table 2:Potential of RE technologies (Source: MNRE, 30/JUNE/2013) ..................................... 11
Table 3: Preferential Tariff ........................................................................................................... 22
Table 4: RPO Targets Set By SERC’s (2013) In Accordance With NAPCC Target ................... 24
Table 5: ROC Trading Price U.K. - 2013 ..................................................................................... 44
Table 6: Band Allocation to Different RE Technologies.............................................................. 49
Table 7: LRET Annual Target ...................................................................................................... 56
Table 8: Schedule of Solar Credits Multipliers (Source: ORER) ................................................. 62
Table 9: Solar Credits Calculation ................................................................................................ 62
1
TABLE OF CONTENT
DECLARATION ............................................................................................................................. i
CERTIFCATE ................................................................................................................................ ii
ACKNOWLEDGEMENT ............................................................................................................. iii
EXECUTIVE SUMMARY ........................................................................................................... iv
1 Introduction ............................................................................................................................. 1
1.1 Current Scenario ............................................................................................................... 2
1.2 Indian Power Sector: Demand, Capacity And Projection ................................................ 3
1.3 Role Of Renewable Energy In The In The Power Sector ................................................ 5
1.3.1 Off Grid Renewable Energy ..................................................................................... 6
1.4 Renewable Energy Costs .................................................................................................. 6
1.5 Key Drivers Of Renewable Energy .................................................................................. 8
1.5.1 Accelerated Depreciation: ......................................................................................... 8
1.5.2 Generation Based Incentives: ................................................................................... 8
1.5.3 National Solar Mission: ............................................................................................ 8
1.5.4 Income Tax Holiday: ................................................................................................ 9
1.5.5 Feed-In-Tariff: .......................................................................................................... 9
1.6 Need Of Renewable Energy ........................................................................................... 10
1.6.1 Coal Deficit ............................................................................................................. 10
1.6.2 Greenhouse Gas Emissions ..................................................................................... 10
1.6.3 Clean Development Mechanism And Carbon Markets .......................................... 10
1.6.4 Enormous Renewable Potential .............................................................................. 10
1.6.5 Energy Security ....................................................................................................... 11
1.7 Objective ........................................................................................................................ 12
1.8 Scope Of Work ............................................................................................................... 12
1.9 About The Organization ................................................................................................. 12
2 Literature Review And Research Methodology .................................................................... 15
Literature Review.................................................................................................................... 15
2
2.1 National And International Experience With RECs ...................................................... 15
2.1.1 Rec Implementation In Australia ............................................................................ 15
2.1.2 Rec Implementation In United Kingdom ................................................................ 15
2.1.3 Rec Implementation In Usa .................................................................................... 15
2.1.4 Rec Implementation In India .................................................................................. 16
2.2 Research Methodology ................................................................................................... 21
3 Regulatory Framework For RE deployment ......................................................................... 22
3.1 Feed In Tariffs (Fit) ........................................................................................................ 22
3.2 Renewable Purchase Obligations (RPO)........................................................................ 23
3.3 Renewable Energy Certificates (REC) ........................................................................... 26
4 REC Mechanism .................................................................................................................... 27
4.1 Basics Of REC Mechanism ............................................................................................ 27
4.2 REC Objective: .............................................................................................................. 28
4.3 Pre-Requisites Of Eligible Entity ................................................................................... 29
4.4 Procedure For Implementation Of REC Mechanism .................................................... 31
4.4.1 Procedure For Accreditation (Through State Nodal Agency) ................................ 31
4.4.2 Procedure For Registration ..................................................................................... 32
4.4.3 Procedure For Issuance ........................................................................................... 32
4.4.4 Procedure For Trading And Redemption ................................................................ 33
4.4.5 Trading (Through PXs) ........................................................................................... 33
4.4.6 Redemption (Through PXs) .................................................................................... 34
4.4.7 Compliance Reporting: ........................................................................................... 34
4.5 Fees And Charges........................................................................................................... 35
4.6 Pricing Of Certificate: .................................................................................................... 36
4.7 Recent Amendmnets In Rec Mechanism ....................................................................... 38
5 REC INTERNATIONAL LEARNING ................................................................................ 40
5.1 United Kingdom ............................................................................................................. 40
5.1.1 Introduction ............................................................................................................. 40
5.1.2 Technology Banding of Renewable Obligation ...................................................... 41

3
5.1.3 Implementation Authority:...................................................................................... 42
5.1.4 Issuance Of ROCs ................................................................................................... 43
5.1.5 How the value of a ROC is determined .................................................................. 44
5.1.6 Setting the obligation level ..................................................................................... 45
5.1.7 Recent Amendment In Ro Banding (2013-2017) ................................................... 45
5.1.8 Band Allocation for RE Technologies .................................................................... 46
5.1.9 Renewable Obligation:............................................................................................ 51
5.1.10 Future of the Renewables Obligation in UK........................................................... 52
5.2 AUSTRALIA ................................................................................................................. 53
5.2.1 Introduction ............................................................................................................. 54
5.2.2 Regulatory Authorities ............................................................................................ 54
5.2.3 Small-scale Renewable Energy Scheme (SRES) .................................................... 54
5.2.4 Large-scale Renewable Energy Target ................................................................... 55
5.2.5 Types of Renewable Energy Certificates (RECs): .................................................. 57
5.2.6 Failed Certificates ................................................................................................... 63
Renewable Obligation ............................................................................................. 63
6 CONCLUSION AND RECOMMENDATION ................................................................... 66
6.1 Conclusion: .................................................................................................................... 66
6.2 Recommendation:........................................................................................................... 67
6.3 Bibliography .................................................................................................................. 68
6.4 Annexure ........................................................................................................................ 69

1
1 INTRODUCTION
The Indian energy sector is grappling with new challenges, a result of rapid economic growth,
which has become a hallmark of the development agenda of the country. In the last decade, the
Indian economy has experienced growth at 7-8%, transforming the country into the ninth largest
economy in the world. However, in the last couple of years, there has been a slow-down, with
growth rates having dropped to around 5% in FY 2012-13. In the past few years industrial
production has dipped, and with a concurrent lack of quality service delivery, growth rates have
flattened.
The struggling Indian power sector has much to do with this situation. With a perpetual power
deficit of 8-10% for a decade, electricity available for industry and business has been
insufficient. In order to sustain their production, they have resorted to inefficient diesel-fuelled
back-up power. At the same time around 300 million people in rural India wait for a modern
electricity connection in their homes. India’s energy planning, which is based on the twin
objectives of high economic growth and providing electricity to all, is failing to meet either.
India’s domestic power demand in 2012 was 918 billion units and is expected to reach 1,640
billion units by 2020 at 9.8% annual growth. At this count, India will have to almost double its
current installed capacity of210 gigawatts (GW) to 390 GW in the next eight years. This seems
highly unlikely, given the over-dependence on conventional sources for electricity generation,
and the apathetic view taken towards alternative renewable energy sources by the country’s
energy planners.
There is growing energy inequity between rural and urban areas and also between the developed
and developing states. As stated, 300 million rural citizens are yet to benefit from electricity,
there being a profound injustice in delivery through the centralized system. While the urban-rural
divide in energy supply could be reduced through decentralized systems running on renewable
energy, it is more difficult to bridge the widening gap between developed and not so-developed
states. Thus, to take an example, on one hand, Delhi and Punjab has a per capita electricity
consumption which is more than double the national average, while in Bihar, the per capita
consumption is still rooted at one-fifth the national average.
Figure 1: Electricity Demand and Supply Curve Between 2003 T0 2010

2
1.1 CURRENT SCENARIO
India’s current Centralized energy planning, which tilts heavily on coal and fossil fuel sources,
quixotically leave most of the homes in these coal-bearing and forested regions in darkness. This
fossil fuel addition also tends to be expensive, pushing fiscal deficits to dangerous levels. Thus,
the main concern arises on how to protect our last reserves of forests, their dependent indigenous
communities from destructive coal mining and yet ensure energy security.
Decentralized renewable energy systems are the proverbial silver lining in the Indian power
sector’s dark cloud. This sector is witnessing unprecedented growth, both in terms of capacity
addition and cost reduction, domestically and globally. In 2009-10, renewable energy provided
25% of the country’s gross energy consumption. In the last decade, installed capacity of
renewable energy has grown from just 3%in 2002 to 12% in 2012, largely dominated by wind
energy. Electricity generated from renewable energy sources have also become affordable,
making it highly competitive with conventional sources. With wind having reached grid parity,
the point at which subsidies or government support can be trimmed, and solar expected to reach
that point in the next two to three years, positive market conditions have developed in
Favor of renewable energy in the country.
The threat of climate change, caused by rising global temperatures, has also had it’s its impact on
India’s energy planning. India has pledged to reduce its economy’s greenhouse gas (GHG)
intensity by 20-25%by 2020 from 2005 levels, and promised that its per capita emissions will not
exceed those of developed nations. Further in this direction, the National Action Plan on Climate
Change (NAPCC) was released in2008 by the Government of India, which has set a target of
15% electricity to be generated from renewable energy sources by 2020. However this target is
highly conservative and lacks realism, viewed in conjunction with existing potential, current cost
reduction and past record on installed capacity. In light of growth within the renewable energy
sector, and the gaps in power generation in context of India’s needs, suggests that new targets
need to be set beyond 2020.
In the past few years, the Government of India has introduced some specific regulations and
schemes to boost the renewable energy sector in order to achieve its NAPCC targets and fulfill
its climate pledge to the international community. Of these, the Jawaharlal Nehru National Solar
Mission (JNNSM) is the most significant. A specific target of 20 GW by2022 under JNNSM has
improved market conditions for solar energy technologies which should create rapid diffusion of
these technologies across the country. The JNNSM has already led to decrease in tariffs and
overall project costs. There is growing expectation that the JNNSM’s and corresponding state
solar purchase obligation (SPO) targets will encourage the development of manufacturing
capabilities in solar technology and equipment.
Another important government regulation in this context is the Renewable Purchase Obligation
(RPO) whereby state electricity regulatory commissions (SERCs) are obligated by law to buy a
certain percentage of electricity from renewable energy sources. The guidelines issued in 2010
by Central Electricity Regulatory Commission (CERC) had recommended a standardized RPO
target of 5% in every state with linear increase of 1% annually till2020 to achieve the NAPCC
target of 15%.

3
Introduction of the Renewable Energy Certificate(REC) mechanism by Government of India,
which is a market based mechanism to facilitate the compliance of RPO’s across states of the
country and provides an alternative to obligated entities to fulfill their targets by purchasing
REC’s that are traded on the Indian energy exchanges. This was seen by many as possible
redemption for RPO implementation but with many sellers lined up and hardly any buyers, the
Riches not been able to take a big flight and has failed miserably on the ground.
In reality, the corresponding RPO targets across the different states range between 1 and 20%,
the states having failed in achieving their objective. The current RPO regulation does not have a
clear rationale for the formulation of RPO targets for the respective states. It only factors the
capacity addition from locally available renewable energy resources and overlooks two
important factors that govern power demand – the consumption pattern according to the
consumer profile and purchasing capability of the respective states. The existing RPO regulation
also lacks the presence of an abiding compliance mechanism for achieving its targets. With state
regulators’ hands tied with the lack of an effective penal mechanism and power utilities citing
bad financial conditions as an excuse, there is hardly any compliance to the RPO regulation.
Although the business opportunities that lie in massive shift towards renewable energy is well
understood, the sector faces numerous critical barriers towards its development & deployment,
largely regulatory in nature, perception related, and technology biased and political. To
overcome these challenges, appropriate policy reforms at both the regulatory and market levels
must be ensured.
1.2 INDIAN POWER SECTOR: DEMAND, CAPACITY AND PROJECTION
India, which has to build up its energy infrastructure to keep pace with the economic and social
changes, faces a formidable challenge. Energy and electricity requirements have risen sharply in
recent years, and this trend is likely to continue in the foreseeable future. As on 30 June 20131,
India has a total installed capacity of 225.793 GW, with coal being the principal source of
electricity, followed by large-scale hydroelectric power. Renewable energy takes third place
at 12%, having jumped nearly four times in the last decade2. Of the total installed capacity,
around 30%has been added by the private sector while over40% is controlled or owned by state
governments, the remaining coming under the ambit of the central power sector.
It is expected that by 2020, India’s peak power demand will rise to 1,640 billion units with close
to 8% growth rate, which means that in the next eight years India’s peak power demand will
almost double. With peak power deficit ranging between8-10% and annual power demand
growing at 9%, it will be a giant challenge for India to build its energy infrastructure fast enough
to meet its twin objectives of sustaining a high economic growth rate in the range of 8-9 % for a
longer period of time, while at the same time ensuring all of its citizens have access
to modern electricity supply.
1 CEA Monthly Report – JUNE 2013 2 India’s performance in renewable energy, Energetica India, November-December, 2012

4
Figure 2: Installed Capacity in India (in GW)
Figure 3: Electricity Demand projection in billion units from 2010 till 2020
There are various estimates on capacity addition in the Indian power sector in order to meet
rising power demand as well as reducing the growing power deficit. While Greenpeace, the
European Renewable Energy Council (EREC) and Global Wind Energy Council (GWEC)
estimate that India needs390 GW of installed capacity by 2020, Germany’s GiZ, the US
department of energy and the renewable energy policy network, REN 21 predicts that the
requirement will be 415-440 GW by 2017.3 The Union power ministry has proposed an addition
of 76 GW in the current 12thfive-year plan (2012-17) and another 93 GW in the13thfive-year plan
(2017-22). However, in the 11thfive-year plan, the Government of India missed its revised
installed capacity target of 10 GW which is being carried forward to the current plan period
COAL, 132.288
GAS, 20.359
DIESEL, 1.19
NUCLEAR, 4.78
HYDRO, 39.623
RES, 27.541

5
1.3 ROLE OF RENEWABLE ENERGY IN THE IN THE POWER SECTOR
In 2002, renewable energy accounted for only 3% of the country’s installed capacity at 3,497
MW, in the last 10 years; it has risen to 12%. In 2009, renewable energy provided 25% of India’s
total energy consumption, which clearly shows that it can deliver at economies of scale and
become India’s principal source of energy with the necessary policy, fiscal and regulatory
support in place. Amongst renewable energy technologies, wind is the most dominant with 70%
of the share followed by small-hydro power with 13%. Most of the country’s grid-connected
installed renewable energy capacity– over 91% – exists across just eight states, Tamil Nadu,
Gujarat, Karnataka, Maharashtra, Rajasthan, Andhra Pradesh, Uttar Pradesh and Himachal
Pradesh. (See Annexure 1 for technology-wise installed capacity of renewable energy).
In 2012, actual electricity generation from different renewable energy technologies stood at
46.04 billion units, accounting for 5.76% of the total electricity generation, half of this generated
from wind energy. Among the states, Tamil Nadu, Karnataka, Maharashtra, Gujarat and
Rajasthan account for nearly80% of the total electricity generation from renewable energy
technologies.
Figure 4: RE Installed Capacity
In 2012 WIND energy contributed 2% of the total electricity generated, in the country. The real
potential of wind energy is yet to be realized. It can meet up to 25% of the country’s future
electricity demand by 2020. Wind energy potential in India ranges between 543 GW and 2006
GW at 80meter hub height with turbine density of 9 MW/sq. km5, more than 95% of this in the
five southern and western states of Tamil Nadu, Karnataka, Maharashtra, Gujarat and Andhra
Pradesh. Of this, just one state, Tamil Nadu already provides 40%quite typically, government
estimates wind energy potential conservatively at 103 GW at 80 meter hub height and 50 GW at
WIND68%
SMALL HYDRO13%
SOLAR PV6%
BIOMASS5%
BAGASSE COGEN8%WASTE TO POWER
0%
Renewable Installed Capacity (GW)

6
50 meter hub height6, which indicates that there is still a huge potential available to the
Government of India to exploit.
Among other renewable energy technologies, SOLAR power has the greatest potential and a
long way to go, given the abundance of incident radiation on the Indian mainland. Currently,
solar energy accounts for only 4% of the total renewable energy installed, with the Government
of India under JNNSM seeking to increase capacity addition up to 20 GW by 2022. Now it
seems
that this target is highly conservative, given the current price churning in the Indian solar energy
sector, with costs of solar energy having dropped to 40% of 2008summer prices, and expected to
reduce further. India will add nearly 34 GW of solar energy by 2020 particularly through
massive deployment of solar photovoltaic (PV)and solar rooftop applications, taking solar
energy’s share to 8% of the installed capacity, according to the Greenpeace report, Energy
[R]evolution India.
Other renewable energy technologies are also expected to play a vital role in the future growth of
this sector, with small hydro-power (< 25 MW) tagged at a potential of around 25 GW. This will
mostly be driven by private investments and by 2020 India will have added at least 5 GW of
small hydro-power, even by the most conservative scenarios. Biomass-based electricity
generation, on continuous flow of economical raw material is expected to hold a minimum
potential of 24GW, largely from non-productive agricultural residues and farm product wastes.
1.3.1 OFF GRID RENEWABLE ENERGY
Although there is no clear and explicit assessment of the true potential of off-grid and grid-
interactive distributed renewable energy, It is conservatively estimated that over 4 billion units of
electricity is being generated from different off-grid applications since the period 2011-12 and it
is expected that by2020, this generation, even on an incremental basis will come up to around 27
billion units. Even though electricity generation from off-grid and grid-interactive distributed
renewable energy systems are lacking in quantity, its real impact can be observed by the positive
changes it has brought about in the lives and livelihood of the millions in remote villages of the
country, where centralized electricity schemes like the Rajiv Gandhi Gramin Vidyutikaran
Yojana (RGGVY) have failed to deliver quality electricity supply. A form of small-scale energy
revolution, based on decentralized, distributed and application oriented renewable energy
solutions can be witnessed in some developing but energy-poor states like Uttar Pradesh, Bihar,
West Bengal and Madhya Pradesh. They have not only brought lights to the villages but
transformed the entire village economy.
1.4 RENEWABLE ENERGY COSTS Renewable energy technologies are not just on the verge of being deemed mature technologies
but also, the price for exploring these technologies is falling rapidly, as is evident from the
proposed tariffs by CERC.
Renewable energy technologies fare decently well on learning rate standards, the cost of a
technology which has a learning rate of 0.90 is expected to fall by 10% every time the
cumulative output from the technology doubles. For solar PV this rate stands at 0.8 for the past
30 years and for wind it varies between 0.75-0.94.8 In real market terms the price of PV modules

7
per megawatt (MW) has fallen by 40%since the summer of 2008, while wind turbine prices have
fallen by 18% per MW in the last two years.9 This reduction in costs is largely attributed to
deployment led cost reductions. This indicates that renewable have the potential to stabilize
energy prices and create a healthy market compared to the exponentially rising costs of
conventional sources leading to wide spread disruptions in markets globally.
Table 1: RE Projects, capital cost and levellised tariff for FY 2013-14 (lakh/MW) by CERC3
Technology Capital Cost
(INR Lakhs/MW) Tariff (INR/KWh)
Wind Energy 595.99 3.6 to 5.7
Small Hydro Projects
A) Himachal Pradesh,Uttarakhand &
North Eastern States
(less than 5 MW)
B) Himachal Pradesh,Uttarakhand &
North Eastern States
(5MW to 25 MW)
C) Other States (below 5 MW)
D) Other States ( 5 MW to 25 MW)
798.11 4.02
725.55 3.42
621.90 4.74
570.08 4.01
Biomass Power Projects 462.33 5.4 to 6.1
Non- Fossil Fuel based Co-Gen 436.36 4.8 to 5.96
Solar PV Power Projects 800.00 7.9
Solar Thermal Power Projects 1200.00 10.7
Biomass Gasifier Power Projects 421.42 5.8 to 6.6
Biogas Power Projects 842.85 6.7
3CERC order for generic levellised tariff for renewable energy technologies for FY 2013-14

8
1.5 KEY DRIVERS OF RENEWABLE ENERGY
The growth of RE in India has been catalyzed by several Acts, policies and institutional
measures that have been implemented over the past few years especially post EA 2003.
The following are major drivers of growth of renewable energy in India.
1.5.1 Accelerated Depreciation:
The GoI allowed renewable energy based power producers to claim accelerated depreciation
(AD) at the rate of up to 80% in the first year on a written-down value (WDV) basis under
Section 32, Rule 5 of the Income Tax Act. This was the most significant driver of renewable
energy capacity addition in the past. However, this has resulted, to some extent, in mushrooming
of players with the purpose of off-setting income from other business to claim tax benefits rather
than actual production of electricity. However, AD for wind power projects has been withdrawn
recently to attract attention from more serious players for development of Renewable Energy.
1.5.2 Generation based incentives:
The GoI along with Indian Renewable Energy Development Agency (IREDA) as the nodal
agency, had introduced a scheme for grid interactive wind power projects which provided an
incentive of Rs 0.50 per kilowatt-hour (kWh), with a cap of Rs. 15 lakh per MW per year,
totaling Rs. 62.5 lakh per MW to be availed for a minimum of four years and maximum of 10
years. The scheme was however limited to a capacity of first 4,000 MW commissioned through
GBI on or before 31 March, 2013. Recently the central government withdrew AD benefit for
wind projects. This has slowed down wind energy capacity addition by almost 50% on year-on-
year basis. However, there is a possibility of reinstatement of GBI to attract investments in wind
sector. Subsidy in equipment imports: Some technologies like small hydro, biomass and solar PV
(off grid) systems are provided support through capital subsidy based on installed capacity. For
example, Ministry of New and Renewable Energy (MNRE) provides a capital subsidy of 30%
for off-grid and decentralized solar photovoltaic (SPV) applications.
1.5.3 National Solar Mission:
The Mission has set an overall target of 20,000 MW in three phases: First phase up to 2012/13,
second phase from 2013 to 2017, and the third phase from 2017 to 2022. The mission targets
capacity of grid-connected solar power generation to 1,000 MW by 2013 and 4,000 MW by
2017. It is further envisioned that the solar capacity addition could reach 10,000 MW by 2017
and 20,000 MW by 2022. JNNSM targets, including grid connected, off-grid application and for
solar collectors.

9
1.5.4 Income Tax Holiday:
Section 80 IA of the Income Tax Act offers a 10-year consecutive tax holiday period within a
block of first 15 years during the life cycle of all infrastructure projects which also includes
renewable energy power generation projects.
1.5.5 Feed-in-tariff:
Central and state electricity regulatory commissions (CERCs and SERCs) have notified wind-
specific feed-in-tariff for electricity generated from wind. Also, state-specific tariff for solar
energy in states such as Rajasthan, Gujarat, Madhya Pradesh, and Karnataka have been
announced. Such preferential tariffs have provided attractive returns to investors leading them to
set up projects in various states.
All the above policy measures that have been largely driven by fiscal incentives and subsidies
have resulted in growth of RE supply. However, such measures do not help in large scale
development of RE. For development of renewable energy markets it is important to create
demand pull as well which will result in better pricing of power from RE. Hence, market creation
remains the overwhelming emphasis of the policy makers. In this regard, mechanisms such as
Renewable Purchase Obligation (RPO)4 and Renewable Energy Certificates (REC)5 have been
introduced through policies and regulations.
4 Discussed in Section 3.2 5 Discussed in Section 3.3

10
1.6 NEED OF RENEWABLE ENERGY
1.6.1 Coal Deficit India has got 250 billion tons of coal reserves, but due to poor quality of coal whole of the reserves available can’t be procured and put to use. Annual report of FY 10 of Ministry of Coal clearly states that the maximum amount of coal allocated in country is to the power industry, despite of the above fact CEA has announced that out of the 85 operating thermal power plants (TPP‟s) 7 plants are running at critical stock (coal) level of less than 7 days and 9 stations are running at super critical stock levels of less than 4 days whereas the ideal stock level for pithead plants is 15 days and for other TPP‟s it varies from 20 to 30 days
1.6.2 Greenhouse Gas Emissions
As per the latest CEA report dated 30th June 2013 the overall generation capacity of India is
225.793 GW and almost more than 75 % of installed generation in India comes from thermal
sources which include fossil fuels like coal, diesel and natural gas. But this heavy reliability with
increasing global competition for access of scarce resources and the need for designing the boiler
of plants to soot for the imported coal in the plants. The most important of all is the increasing
greenhouse gas emissions from the plants, presently the India stands at 5th place globally in terms
of greenhouse gas emitters. An overview of GHG inventory for energy sector under Ministry of
Environment and Forest (MOEF) shows the consumption trends of fossil fuels depicting the
rampant increase in the use of fossil fuels in the past decade resulting in a CO2 emissions
increasing at CAGR of almost 4.8% for 1994 to 2006.
1.6.3 Clean Development Mechanism and Carbon Markets The increasing concerns for environment across the world lead to Kyoto Protocol which
ultimately resulted in flexible mechanisms like Clean Development Mechanism (CDM) and Just
Implementation (JI). These have created the path for developing countries like India to
participate in carbon credit markets. Carbon credits can be exchanged between organizations in
international markets at the current market prices. In 2009 when the global GDP declined the
carbon markets grew 6%. Industrial governments of various countries have started working in
this field by implementing domestic policies and regulations. Experience shows that cost of
reducing greenhouse gases in developing countries costs around US$ 1 to 4 as compared to
developed countries where it costs around US$15 to 100 because of various opportunities
available in developing country. Presently India is on 2nd no. behind China for the amount CDM
projects approved across the world.
1.6.4 Enormous Renewable Potential
India’s demographic location makes it a resource rich country as far as renewable are concerned.
There is long coastline of 7517 km facilitating sufficient wind energy potential in states like

11
Tamil Nadu, Karnataka and Gujarat and the country also receives an annual radiations of 5000
trillion KWh/year with an average isolation of 4KWh/day to 7 KWh/day, country also
experiences almost 300 sunny days/year. Biomass has also got a high energy potential in the
country with resources such as firewood, agro-residues and animal wastes, which are mainly
used by rural population also there lies a tremendous off grid renewable power potential to
places where it is costly to extend the grid. Northern and North eastern regions are also having
high potentials in SHPs and currently installation of about 300 MW/year is being achieved in
SHPs. Summary of the renewable potential of different RE technologies and their respective
harnessed capacity is shown below:
Table 2: Potential of RE technologies (Source: MNRE, 30/JUNE/2013)
SOURCES POTENTIAL AVAILABLE POTNETIAL HARNESSED
Biomass And Bagasse Co-Gen 22000 MW 3602.23 MW
Wind 48500 MW 19564.95 MW
Small Hydro Plant(<25 MW) 15000 MW 3686.25 MW
Solar 50000 MW 1759.44 MW
1.6.5 Energy Security
According to planning commission’s “Integrated Energy Policy”, August 2006, we are energy
secure when we are able to supply lifeline energy to all our citizens irrespective of their ability to
pay for it at competitive price with prescribed confidence level considering shocks and
disruptions that can be expected reasonably, to meet their effective demand for safe and
convenient energy to satisfy their needs. On the contrary major rural population of our country is
depending upon the fossil fuels like cow dung, kerosene, firewood as their domestic fuel through
which they are not able to meet their effective demands neither it is a safe option as its smoke
produces eyes and skin diseases mainly to household ladies in rural. One more reason to switch
to renewable lies in promoting them for off-grid applications to the remote villages in our
country which are not cost effective to get connected to a grid. Increasing mobile connections
almost 8 to 10 million every year has also triggered the dire need of energizing the increasing
telecommunication towers via Renewable against diesel sets / gas sets which are currently
serving the purpose.
12
1.7 OBJECTIVE
The main objective of the project is to review and compare the mechanism of implementation of
Renewable Energy Certificate in India and suggesting L&T what are the changes that can be
encountered for sustainability of REC mechanism in India. The objective entails the following
points:
Study of REC Mechanism implementation in different countries
Need based analysis and cost benefit analysis
Study and compare the role of Renewable Obligation in various countries.
Study the various methods of REC implementation in various countries.
To explore India‘s REC market opportunities
Analyzing the future of RECs in various countries and factors that will replace REC
mechanism.
Recommendations and Conclusion
1.8 SCOPE OF WORK
Based on the study of Renewable Energy Certificate Mechanism implementation in various
countries it can be suggested that various ‘Technology Bands’ and ‘Certificate Multiplier
Scheme’ along with enforcement of the Renewable Purchase Obligation (RPO) can be
implemented in India too in coming years by Central Electricity Regulatory Commissions. REC
market in India is in its earlier stages so REC market opportunities can be more in future if some
changes like above suggested are notified in its regulatory framework.
The report provides the various suggestions for the L&T to frame its marketing strategy
accordingly and focus on ‘Off-Grid’ renewable solution as it will beneficial from RECs
prospective too.
1.9 ABOUT THE ORGANIZATION
LARSEN & TOUBRO LIMITED
Larsen & Toubro is a USD 14 billion technology, engineering, construction, manufacturing and
financial services conglomerate, with global operations. It is ranked 4thin the global list of Green
Companies in the industrial sector by the reputed international magazine Newsweek, and ranked
the world’s 9th Most Innovative Company by Forbes International. L&T is one of the largest and
most respected companies in India’s private sector. A strong, customer–focused approach and
the constant quest for top-class quality have enabled L&T to attain and sustain leadership in its
major lines of business over seven decades.
L&T Construction- Larsen & Toubro’s Construction Group
L&T Construction is India’s largest construction organization with over 70 years of experience
and expertise in the field. L&T Construction figures among the World’s top contractors and

13
ranks 35thamong top global contractors and ranks 60thamong international contractors as per the
survey conducted by Engineering News Record magazine, USA. To add to our credentials here,
L&T Construction is the 1stand the only Indian EPC among the top 100 in the above survey, to
be featured ahead of globally renowned contractors such as Technip, Samsung, Hyundai, Foster
Wheeler etc.
Many of the country’s prized landmarks – its exquisite buildings, tallest structures, largest
airports/ industrial projects, longest flyovers, highest via-ducts, longest pipelines including many
other benchmark projects have been built by L&T Construction. L&T Construction’s leading
edge capabilities cover every discipline of construction: civil, mechanical, electrical and
instrumentation engineering and these services are extended to all core sector industries and
infrastructure projects.
To specifically cite our landmarks in power plant construction, L&T has constructed many large
scale utility power plants with full compliance to international standards. L&T has a track record
of 50,000MW plant capacities being executed through 134 projects done globally. In
transmission line projects, L&T has executed 9,700 km national and 1200 odd km international
projects. L&T has also executed 218 air insulated and 36 gas insulated substations in the range of
33kV to 400kV globally.
These landmark projects testify that L&T Construction is equipped with the requisite expertise
and wide-ranging experience to undertake Engineering Procurement and Construction (EPC)
projects with single source responsibility. Contracts are executed using state of the art design
tools and project management techniques from concept to commissioning.
L&T Construction today is organized into six Independent Companies to allow for more in-depth
technology and business development as well as to improve focus on domestic and international
project execution. Each Independent Company is further split into different Business Units (BU)
to take care of the specific needs of various customers under each market segment.
L&T Construction, with its recent foray into turnkey EPC solutions under the Water & Renewable Energy
IC for the Solar Industry, is also making a strong statement about L&T’s commitment to the welfare of
the nature.L&T Construction is a brand of Larsen & Toubro Ltd.
The Independent Companies (ICs) are:
1. Water & Renewable Energy
2. Power Transmission & Distribution
3. Buildings & Factories
4. Infrastructure
5 .Metallurgical & Material Handling Projects
6. Transportation & Infrastructure

14
L&T Solar Business- Solar Business arm of Water & Renewable Energy Independent Company
L&T Solar Business within the Water & Renewable Energy IC belongs to the L&T
Conglomerate’s Construction arm; which designs, constructs and facilitate developers with
finances for Utility Scale Solar power plants in India and abroad including Photovoltaic and CSP
Technologies and also, EPC Solutions for Rooftop Solar Systems.
L&T Solar Business ranks 11thfor the year 2012 among Global Solar EPC Companies declared
by IMS Research. L&T Solar Business is the Only Indian Solar EPC figured among Top 15
Globally.
The Solar Business operates out of the L&T Construction group (erstwhile ECC) headquarters
located in the south of India at Chennai, Tamil Nadu. With its branch offices and project setups
operating across key solar intensive regions in India, it has more than 330 employees with further
planned expansion of manpower to cater the upcoming projects in pipelines.
L&T Solar Business is an Accredited MNRE Channel Partner and supports the customer for
obtaining MNRE subsidy for their solar systems. It has been awarded “SP 1A” grading by CARE
for Highest Performance Capability and High financial Strength.
Our strengths are solar PV power project design, fast and cost effective solar PV power plant
construction without compromising on quality, and our ability to bring in financial assistance for
developers of utility scale photovoltaic power plants in India. Thanks to the combination of our
many decades of power plant EPC experience in India, constant innovation/adaptation to new
ideas within the solar industry as well as our extensive networks with the financing communities,
given our conglomerate image, we are today emerging as one of the most reliable EPCs for
turnkey construction of Solar PV power plants in the country, we are someone trusted by various
government agencies, investors and well respected by both: the private & public sector
companies in India for pioneering work in the green energy area.
Over the past year, the annual growth of our turnkey Solar EPC business ranks well over the
industry average in India– we already commissioned 114 MWp of utility scale solar PV plants
across India (most of it in record time) in the FY12 and in FY13, we commissioned 41 MWp
solar PV power projects. Together totaling to 177MWp of solar PV power plants. In the CSP
segment, 125 MW Solar Thermal Power Plant is under construction, on commissioning this will
be the largest CSP plant in Asia.
Apart from our India focus, internationalizing our business activities is also on the anvil along
with our plan to build further plants in the country over the next few years; an expansion to
countries synergetic with L&T’s skill and expertise is also well planned.

15
2 LITERATURE REVIEW AND RESEARCH METHODOLOGY
LITERATURE REVIEW
2.1 National and International Experience with RECs
2.1.1 REC Implementation in Australia
The Government of Australia enacted The Renewable Energy (Electricity) Act 2000 for
the establishment and administration of a scheme to encourage additional electricity generation
from renewable energy sources. This is done through the issuing of certificates for the
generation of electricity using eligible renewable energy sources and requiring certain
purchasers (called liable entities) to surrender a specified number of certificates for the electricity
that they acquire during a year. Where a liable entity does not have enough certificates to
surrender, the liable entity will have to pay renewable energy shortfall charge. It was implemented
in the year 2001.
2.1.2 REC Implementation in United Kingdom
The tradable RE certificate in UK is called as Renewable Obligation Certificate (ROC).The
“Renewable Obligation (RO)” implemented in UK in April, 2002 in UK, and the “Renewable
Obligation Scotland” and the “Northern Ireland Renewable Obligation” are designed to incentivize
renewable generation into the electricity generation market. These schemes were introduced by the
Department of Trade and Industry, the Scottish Executive and the Department of Enterprise, Trade
and Investment respectively and are administered by the Gas and Electricity Markets Authority of
Great Britain. In UK, Renewable Obligation (RO) was introduced through Renewable Obligation
Order (ROO) in April 2002 and was enforced under the terms of Section 32 of the Electricity Act,
1989. RO has been made the main support scheme for renewable electricity in the UK. Through
ROO 2002, the targets for RO were defined for period up-to March 31, 2011. However, during the
review of RO in 2009 target for FY 2020 was revised to 15 % and the ROC mechanism was
extended to year 2037 from earlier 2027.
2.1.3 REC Implementation in USA
In USA, 29 states plus the districts of Columbia have adopted RPS with varying target values,
ranging from 1% to 30% within an implementation schedule varying from 5 to 25 years.
Eligible renewable resources also vary from state to state. Texas was the first state to
implement a renewable energy certificates trading program. Amongst several RPS systems
that allow REC trading, Texas’s RES system has often been referred to as well design RPS
system. It was implemented in January 2002. There are two categories of certificates in the Texas
REC Program: Renewable Energy Credits (RECs) and REC Offsets.

16
2.1.4 REC Implementation in India
2.1.4.1 The Electricity Act, 2003
An Act to consolidate the laws relating to generation, transmission, distribution, trading and use
of electricity and generally for taking measures conducive to development of electricity
industry, promoting competition therein, protecting interest of consumers and supply of
electricity to all areas, rationalization of electricity tariff, ensuring transparent policies
regarding subsidies, promotion of efficient and environmentally benign policies, constitution
of CEA, Regulatory Commissions and establishment of Appellate Tribunal and for matters
connected therewith or incidental thereto.
Further, the Electricity Act, 2003 entrusts on the appropriate Commission the responsibility of
promotion of co-generation and generation based on renewable energy sources. The policy
framework of the GOI also stresses on the encouragement of renewable energy sources keeping in
view the need for energy security of the country. Relevant provisions of the Act are reproduced as
below:
Section 86(1)(e): The State Commission shall promote cogeneration and generation of electricity
from renewable sources of energy by providing suitable measures for connectivity with the grid and
sale of electricity to any person, and also specify, for purchase of electricity from such sources, a
percentage of the total consumption of electricity in the area of a distribution licensee.
Section 61(h): The Appropriate Commission shall, subject to the provisions of the Act, specify the
terms and conditions for the determination of tariff, and in doing so, shall be guided by the
promotion of co-generation and generation of electricity from renewable sources of energy.
Section 86(1)(b): The SERCs shall discharge the function to regulate electricity purchase and
procurement process of distribution licensees including the price at which electricity shall be
procured from the generating companies or licensees or from other sources through agreements
for purchase of power for distribution and supply within the State.
Section 3(1): The Central Government shall, from time to time, prepare the National
Electricity Policy and tariff policy, in consultation with the State Governments and the
Authority for development of the power systems based on optimal utilization of resources such
as coal, natural gas, nuclear substances or materials, hydro and renewable sources of energy.
Section 3(3): The Central government may, from time to time in consultation with the
State governments, and the Authority review or revise, the National Electricity Policy and tariff
policy referred to in section 3(1).
Section 79(k): CERC shall discharge the functions assigned under the Act.
17
Section 66: The Appropriate Commission shall endeavor to promote the development of a market
(including trading) in power in such manner as may be specified and shall be guided by the
National Electricity Policy referred in Section 3 in this regard.
2.1.4.2 National Electricity Policy, 2005
National Electricity Policy was notified by Central Government in February 2005 as per provisions
of Section 3 of EA 2003. The Clause 5.12 of NEP outlines several conditions in respect of
promotion and harnessing of renewable energy sources. The salient features of the said provisions
of NEP are as follows.
• Non-conventional sources of energy being the most environment friendly there is an urgent need
to promote generation of electricity based on such sources of energy. For this purpose, efforts need
to be made to reduce the capital cost of projects based on non-conventional and renewable sources
of energy. Cost of energy can also be reduced by promoting competition within such projects. At
the same time, adequate promotional measures would also have to be taken for development of
technologies and a sustained growth of these sources.
• The Electricity Act 2003 provides that co-generation and generation of electricity from non-
conventional sources would be promoted by the SERCs by providing suitable measures for
connectivity with grid and sale of electricity to any person and also by specifying, for purchase of
electricity from such sources, a percentage of the total consumption of electricity in the area of a
distribution licensee. Such percentage for purchase of power from non-conventional sources should
be made applicable for the tariffs to be determined by the SERCs at the earliest. Progressively the
share of electricity from non-conventional sources would need to be increased as prescribed by
SERCs. Such purchase by distribution companies shall be through competitive bidding process.
Considering the fact that it will take some time before non-conventional technologies compete,
in terms of cost, with conventional sources, the Commission may determine an appropriate
differential in prices to promote these technologies.
• Industries in which both process heat and electricity are needed are well suited for cogeneration of
electricity. A significant potential for cogeneration exists in the country, particularly in the sugar
industry. SERCs may promote arrangements between the co-generator and the concerned
distribution licensee for purchase of surplus power from such plants. Cogeneration system also
needs to be encouraged in the overall interest of energy efficiency and also grid stability."
2.1.4.3 Tariff Policy, 2006
National Electricity Policy was notified by Central Government during January 2006 as per
provisions of Section 3 of EA 2003. Tariff Policy (TP) has further elaborated the role of regulatory
commissions, mechanism for promoting harnessing of renewable energy and timeframe for

18
implementation etc. The Clause 4 of the TP addresses various aspects associated with promotion
and harnessing of renewable energy sources. The salient features of the said provisions of TP are as
under:
• Pursuant to provisions of section 86(1)(e) of the Act, the Appropriate Commission shall fix a
minimum percentage for purchase of energy from such sources taking into account availability of
such resources in the region and its impact on retail tariffs. Such percentage for purchase of energy
should be made applicable for the tariffs to be determined by the SERCs latest by April 1, 2006.
It will take some time before non-conventional technologies can compete with conventional
sources in terms of cost of electricity. Therefore, procurement by distribution companies shall be
done at preferential tariffs determined by the Appropriate Commission.
• Such procurement by Distribution Licensees for future requirements shall be done, as far as
possible, through competitive bidding process under Section 63 of the Act within suppliers offering
energy from same type of nonconventional sources. In the long-term, these technologies would
need to compete with other sources in terms of full costs.
• The Central Commission should lay down guidelines within three months for pricing non-firm
power, especially from non-conventional sources, to be followed in cases where such
procurement is not through competitive bidding.
2.1.4.4 Rural Electricity Policy, 2006
Rural Electricity Policy also envisaged the need for non-conventional sources of energy with
the provision of institutional arrangements and technical support by the State Governments in
order to achieve cost effective and sustainable energy. The salient features of the Clause 3.3 and
Clause 8.9 of REP are as under:
Non-conventional sources of energy could be utilized even where grid connectivity exists provided
it is found to be cost effective.
• Institutional arrangements for back-up services and technical support to systems based on
nonconventional sources of energy will have to be created by the State Governments. Such
services would be provided on cost basis so as to make the arrangements sustainable.
2.1.4.5 National Action Plan for Climate Change, 2008
On June 30, 2008 Hon„ Prime Minister of India announced National Action Plan for Climate
Change(NAPCC) which delineated India’s strategy to tackle menace of global warming without
jeopardizing prospects of economic growth. The Technical Document annexed to NAPCC
includes following provisions for mainstreaming the RE based resources in India’s power
sector. In particular the document solicits use of REC mechanism. The provisions listed under
section 4.2.2 of NAPCC on Grid Connected Systems, are as follows:
19
• Dynamic Minimum Renewable Purchase Standard (DMRPS) may be set, with escalation each
year till a pre-defined level is reached, at which time the requirements may be revisited. It is
suggested that starting 2009-10, the national renewable standard (excluding hydropower with
storage capacity in excess of daily peaking capacity, or based on agriculture based renewable
sources that are used for human food) may be set at 5% of total grids purchase, to increase by 1%
each year for 10 years, SERCs may set higher percentages than this minimum at each point in
time.
• Central and State Governments may set up a verification mechanism to ensure that the
renewable based power is actually procured as per the applicable standard (DMRPS or SERC
specified). Appropriate authorities may also issue certificates that procure renewable based
power in excess of the national standard. Such certificates may be tradable, to enable utilities falling
short to meet their renewable standard obligations. In the event of some utilities still falling short,
penalties as may be allowed under the Electricity Act 2003 and rules there under may be
considered.
• Procurement of renewable based power by the State Electricity Boards/other power utilities
should, in so far as the applicable renewable standard (DMRPS or SERC specified) is concerned,
be based on competitive bidding, without regard to scheduling, or the tariffs of conventional power
(however determined).
• Renewable based power may, over and above the applicable renewable standards, be enabled to
compete with conventional generation on equal basis (whether bid tariffs or cost-plus tariffs),
without regard to scheduling (i.e.) renewable based power supply above the renewable standard
should be considered as displacing the marginal conventional peaking capacity). All else being
equal, in such cases, the renewable based power should be preferred to the competing conventional
power.
2.1.4.6 Forum of Regulators Recommendations
Forum of Regulators (FOR) established under Section 166 of the Electricity Act is an association of
Chairpersons of all electricity regulators. Chairperson of the Central Electricity Regulatory
Commission is ex-officio Chairperson of the FOR. The primary responsibility of the FOR is to
harmonize the regulatory policies in the country. The FOR has established various Working Groups
to look into different aspects of the electricity sector. The FOR has published a report Policies on
Renewables in 2008, with the objective of evolving a common approach for the promotion of RES
in the country. The report recommends that each State Commission may specify a minimum RPO
in line with the NAPCC and emphasizes to develop REC mechanism for achieving RPO targets.
FOR came out with Model Regulations on Renewable Purchase Obligation and its compliance
for SERCs in October, 2009 to evolve a framework for implementation of REC mechanism
20
which necessitated both Central Commission and State Commissions to frame suitable
regulations for giving effect to the REC framework. The framework of REC is expected to give
push to renewable energy capacity addition in the country. Some suggested outlines are:
• Need for inter-State exchange of RE power. Inter-State exchange of RE power is desirable from
National perspective and the same should be promoted.
• Mechanism for appropriate treatment for inter-State RE exchange through Regional Energy
Account needs to be developed.
2.1.4.7 CERC Guidelines, 2010
In exercise of the mandate in section 66 of the Act, the Central Commission has notified CERC
(Terms and Conditions for recognition and issuance of REC for RE Generation) Regulations, 2010
to facilitate development of renewable energy market at national level. The salient features of the
CERC guidelines are:
• CERC to designate any agency as Central Agency. Functions of Central agency shall include
registration, maintaining account, repository settlement and such other functions as designated by
CERC. Detailed procedures, bye laws to be prepared by Central Agency and shall be approved by
CERC.
• Power exchanges approved by CERC shall be eligible exchange platforms for REC exchange.
Fees and charges payable under this mechanism shall be specified by CERC.
• Two categories of certificates one for electricity generation from solar technologies called solar
certificates and another for electricity from other renewable energy technologies called non-solar
certificates. Both these certificates are mutually exclusive and cannot be exchanged. The
certificates will be valid for 365 days after issuance. CERC determine forbearance price and floor
price within which REC can be exchanged.
2.1.4.8 Provision for Compliance Auditing
Under Section 4.5 of order (Notice no. L-1/12/2010-CERC) “Detailed Procedure for Issuance of
Renewable Energy Certificate to the Eligible Entity by Central Agency” CAs have to monitor the
compliance of duties and obligation as specified by CERC by undertaking detailed
investigation/audit and submit the report on revocation of Registration of the Eligible Entity, if
necessary, to the Central Agency/Central Commission. Remuneration charges payable to
such auditors shall be met by Central Agency.
21
2.2 RESEARCH METHODOLOGY
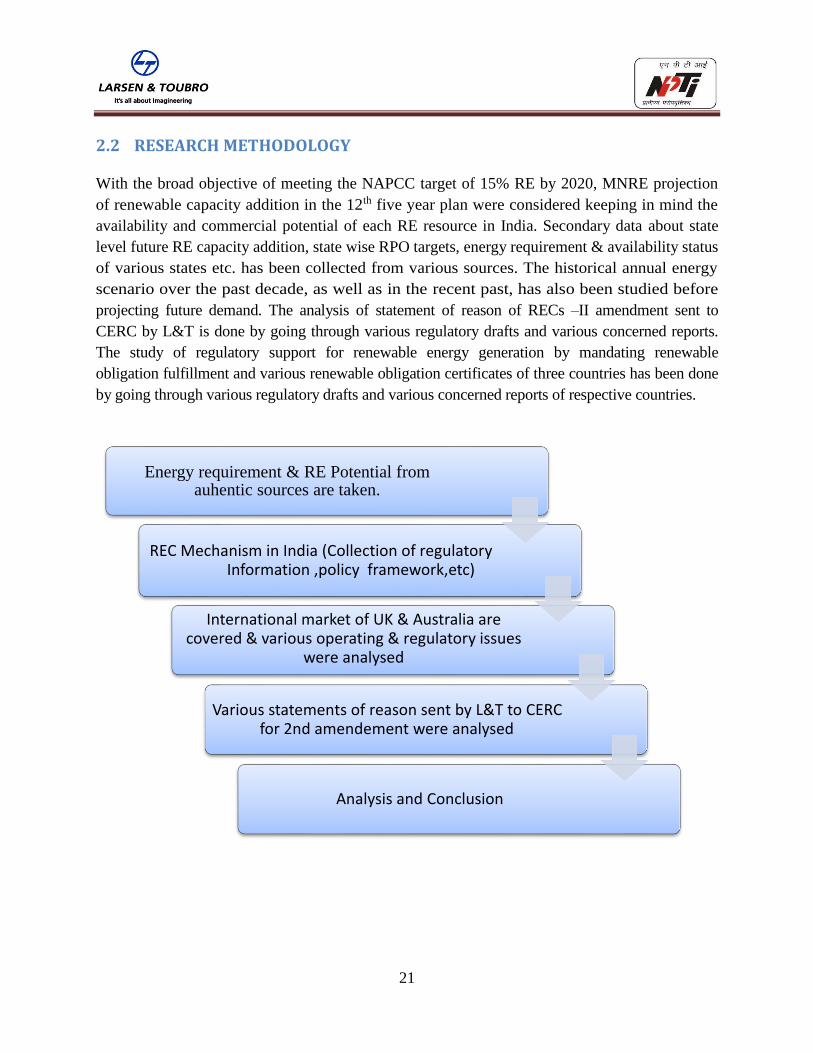
With the broad objective of meeting the NAPCC target of 15% RE by 2020, MNRE projection
of renewable capacity addition in the 12th five year plan were considered keeping in mind the
availability and commercial potential of each RE resource in India. Secondary data about state
level future RE capacity addition, state wise RPO targets, energy requirement & availability status
of various states etc. has been collected from various sources. The historical annual energy
scenario over the past decade, as well as in the recent past, has also been studied before
projecting future demand. The analysis of statement of reason of RECs –II amendment sent to
CERC by L&T is done by going through various regulatory drafts and various concerned reports.
The study of regulatory support for renewable energy generation by mandating renewable
obligation fulfillment and various renewable obligation certificates of three countries has been done
by going through various regulatory drafts and various concerned reports of respective countries.
Energy requirement & RE Potential from auhentic sources are taken.
REC Mechanism in India (Collection of regulatory Information ,policy framework,etc)
International market of UK & Australia are covered & various operating & regulatory issues
were analysed
Various statements of reason sent by L&T to CERC for 2nd amendement were analysed
Analysis and Conclusion
22
3 REGULATORY FRAMEWORK FOR REDEPLOYMENT
3.1 Feed in Tariffs (FIT)
Under section 61(h) EA2003 empowered the CERC to specify terms and conditions for the tariff
determination for promotion of co-generation of electricity from renewable sources of energy
and section 86(1) (b) empowered the SERCs to regulate electricity purchase and procurement
process of Discoms including the price at which electricity is procured. Tariff policy notified by
central government has a clause 4 saying non-conventional sources of electricity will take time to
compete with conventional sources of electricity and so procurement by distribution companies
should be done on the basis of preferential tariff which should be set by SERCs latest by 1st April
2006, it also mandated the CERC to lay down guidelines for preferential tariff of non-firm power
within 3 months of TP notification. FIT is a preferential tariff set by different SERCs based on
the guidelines of CERC in their respective states for encouraging the developers to participate in
developing Renewable based generation power plants. FIT helps the developers to recover their
investments in RE technologies at a fast pace and hence reducing the burden of heavy debt
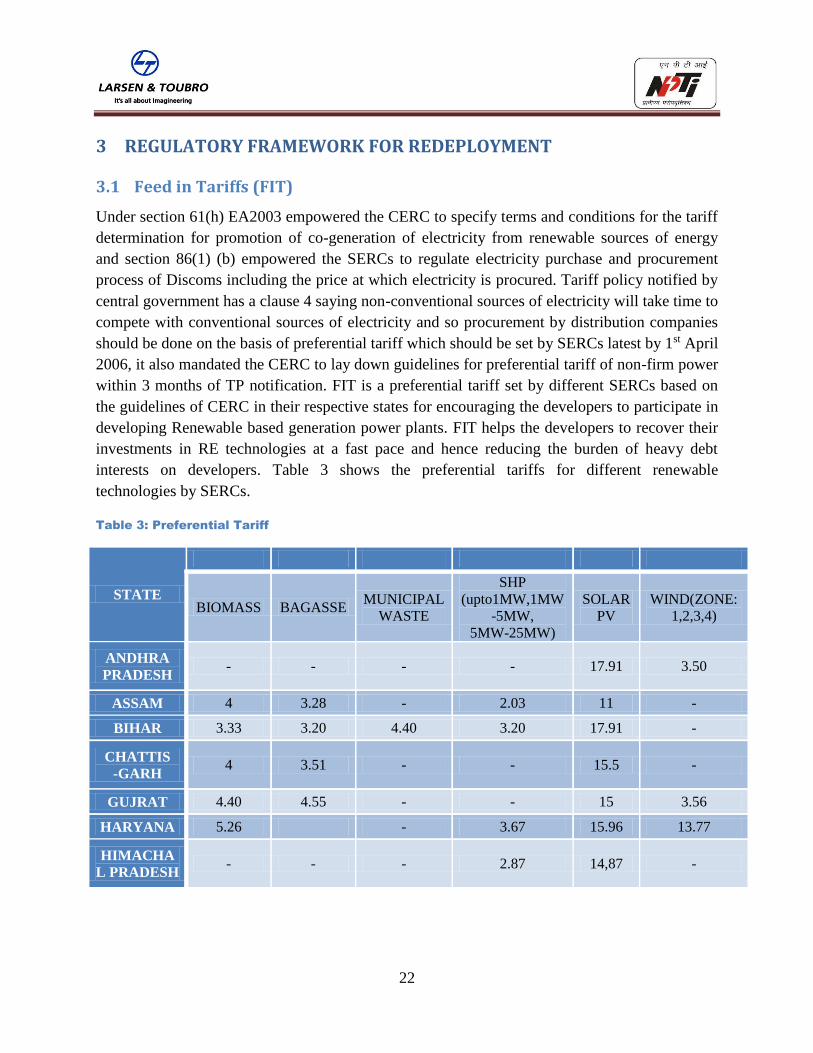
interests on developers. Table 3 shows the preferential tariffs for different renewable
technologies by SERCs.
Table 3: Preferential Tariff
STATE
BIOMASS BAGASSE MUNICIPAL
WASTE
SHP
(upto1MW,1MW
-5MW,
5MW-25MW)
SOLAR
PV
WIND(ZONE:
1,2,3,4)
ANDHRA
PRADESH - - - - 17.91 3.50
ASSAM 4 3.28 - 2.03 11 -
BIHAR 3.33 3.20 4.40 3.20 17.91 -
CHATTIS
-GARH 4 3.51 - - 15.5 -
GUJRAT 4.40 4.55 - - 15 3.56
HARYANA 5.26 - 3.67 15.96 13.77
HIMACHA
L PRADESH - - - 2.87 14,87 -

23
3.2 RENEWABLE PURCHASE OBLIGATIONS (RPO)
Under Section 86 (1) (e) of the EA2003, State commission are empowered to promote
cogeneration and generation of electricity from renewable sources of energy for connectivity
with the grid and specifying a certain percentage of the total consumption of electricity from
such sources. Following this most of the SERCs have issued Orders/Regulations specifying such
percentages. This percentage is referred to as “Renewable Purchase Obligation (RPO)”. These
orders will mandate the Discoms and other obligated entities in the order to buy a minimum
percentage of power from the renewable energy sources. CERC have taken out guidelines for
RPO obligations but the each of the state’s RPO obligation order differs from each other. If the
obligated entity fails to fulfill its RPO obligations it will be directed by the respective SERC to
deposit a certain amount in to a separate fund which will be further used in promoting the
Renewable. Table 4 shows the various states RPOs as per their respective latest orders.
RPOs are enforced on three categories of power consumers:
a) Distribution licensees
b) Open Access consumers
c) Captive consumers of electricity generated from conventional sources of energy.
They can meet this RPO obligation by:
1. Purchasing the required quantity of solar power directly from producers at Preferential Tariff.
2. Buying Renewable Energy Certificates (RECs)6 from Power Exchange.
3. Self or Captive Generation of Renewable Energy.
No RPO is fulfilled by:
1) Discom’s purchasing power at APPC.
2) Purchase of power at mutually agreed price at Power Exchanges by captive consumers and
open access consumers.
The obligations are driven by the National Action Plan on Climate Change (NAPCC) that aims
at 15% renewable energy in the overall energy mix of India by 2020.
There are two categories of RPOs:
i) Solar RPO (Solar Purchase Obligation i.e. SPO)
ii) Non-Solar RPO
6 Discussed in Section 3.3

24
States in India are free to set their own RPOs in line with the recommendations from their State
Electricity Regulatory Commissions (SERCs).
Table 4: RPO Targets Set By SERC’s (2013) In Accordance With NAPCC Target7
S.No. STATES STATUS/YEA
R OF ISSUE
TECHNOLO
GY (NON-
SOLAR
/SOLAR)
RPO TRAJECTORY(IN PERCENT)
FY 12 FY 13 FY 14 FY 15
1. ANDHRA
PRADESH FINAL (2012)
NON SOLAR 4.75 4.75 4.75 4.75
SOLAR 0.25 0.25 0.25 0.25
TOTAL 5.00 5.00 5.00 5.00
2. ARUNACHAL
PRADESH NOT ISSUED
3. ASSAM FINAL (2010)
NON SOLAR 2.70 4.05 5.40 6.75
SOLAR 0.10 .15 .20 0.25
TOTAL 2.80 4.20 5.60 7.00
4. BIHAR FINAL (2012)
NON SOLAR 2.25 3.75 4.00 4.25
SOLAR 0.25 0.25 0.50 0.75
TOTAL 2.50 4.00 4.50 5.00
5. CHHATTISGARH FINAL (2011)
NON SOLAR 5.00 5.25
SOLAR 0.25 0.50
TOTAL 5.25 5.75
6. DELHI FINAL (2012)
NON SOLAR 1.90 3.25 4.60 5.95
SOLAR 0.10 0.15 0.20 0.25
TOTAL 2.00 3.40 4.80 6.20
7. JERC(GOA+UT’S) FINAL (2010)
NON SOLAR 1.70 2.60
SOLAR 0.30 0.40
TOTAL 2.00 3.00
8. GUJRAT FINAL (2010)
NON SOLAR 5.50 6.00
SOLAR 0.50 1.00
TOTAL 6.00 7.00
9. HARYANA FINAL (2011)
NON SOLAR 1.50 2.00 3.00
SOLAR 0.00 0.05 0.10
TOTAL 1.50 2.05 3.10
10. HIMACHAL
PRADESH FINAL (2010)
NON SOLAR 10.00 10.00 10.00 10.00
SOLAR 0.01 0.25 0.25 0.25
TOTAL 10.01 10.25 10.25 10.25
11. JAMMU&
KASHMIR FINAL (2011)
NON SOLAR 2.90 4.75
SOLAR 0.10 0.25
TOTAL 3.00 5.00
12. JHARKHAND FINAL (2010)
NON SOLAR 2.50 3.00
SOLAR 0.50 1.00
TOTAL 3.00 4.00
13. KARNATAKA FINAL (2011)
NON SOLAR 101 /7.02 101/7.02
SOLAR 0.25 .25
TOTAL 10.25/7.25 10.25/7.25
14. KERELA FINAL (2010)
AMND3 (2013)
NON SOLAR 3.35 3.65 3.95 4.25
SOLAR 0.25 0.25 0.25 0.25
TOTAL 3.60 3.90 4.20 4.50
7Source: Various SERCS RPO Draft

25
15. MADHYA
PRADESH FINAL (2010)
NON SOLAR 2.10 3.40 4.70 6.00
SOLAR 0.40 0.60 0.80 1.00
TOTAL 2.50 4.00 5.50 7.00
16. MAHARASTRA FINAL (2010)
NON SOLAR 6.75 7.75 8.50 8.50
SOLAR 0.25 0.25 0.50 0.50
TOTAL 7.00 8.00 9.00 9.00
17. MANIPUR FINAL (2010)
NON SOLAR 2.75 4.75
SOLAR 0.25 0.25
TOTAL 3.00 5.00
18. MIZORAM FINAL (2010)
NON SOLAR 5.75 6.75
SOLAR 0.25 0.25
TOTAL 6.00 7.00
19. MEGHALAYA FINAL (2010)
NON SOLAR 0.45 0.60
SOLAR 0.30 0.40
TOTAL 0.75 1.00
20. NAGALAND FINAL (2011)
NON SOLAR 6.75 7.75
SOLAR 0.25 0.25
TOTAL 7.00 8.00
21. ODISHA FINAL (2010)
NON SOLAR 4.90 5.35
SOLAR 0.10 0.15
TOTAL 5.00 5.50
22. PUNJAB FINAL (2011)
NON SOLAR 2.37 2.83 3.37 3.81
SOLAR 0.03 0.07 0.13 0.19
TOTAL 2.40 2.90 3.50 4.00
23. RAJASTHAN FINAL (2011)
NON SOLAR 5.50 6.35 7.20
SOLAR .50 0.75 1.00
TOTAL 6.00 7.10 8.20
24. SIKKIM NOT ISSUED
25. TAMIL NADU FINAL (2010)
AMND3(2013)
NON SOLAR 8.95 8.90 8.90
SOLAR .05 3 6
TOTAL 9.00 11.90 14.90
26. TRIPURA FINAL (2009)
NON SOLAR 0.90 1.90
SOLAR 0.10 0.10
TOTAL 1.00 2.00
27. UTTARAKHAND FINAL (2010)
AMND3 (2013)
NON SOLAR 4.50 6.00 7.00 8.00
SOLAR 0.03 0.05 .075 .100
TOTAL 4.53 6.05 7.075 8.100
28. UTTAR
PRADESH FINAL (2010)
NON SOLAR 4.50 5.00
SOLAR 0.50 1.00
TOTAL 5.00 6.00
29. WEST BENGAL FINAL (2012)
NON SOLAR - 3.75 4.70 5.60
SOLAR - 0.25 0.30 0.40
TOTAL 3.00 4.00 5.00 6.00

26
3.3 Renewable Energy Certificates (REC) The guidelines for above two framework started the RE development at an intrastate level. The
states started announcing their respective FIT and RPO state policies. The RE potential states
started adhering to the NAPCC targets whereas non-potential states had neither RE sources
neither any means of buying RE power outside the state to fulfill the NAPCC targets and hence
they kept their RPOs low. Thus to facilitate the non-potential states for interstate trading of RE
power and encourage RE developer to generate more power for such trading concept of REC
was introduced in 2009.
REC is “A certificate that is proof that one megawatt-hour (MWh) of electricity was generated
from a renewable energy resource”.
1 REC= 1 MWh of energy equivalent
Once the electricity provider has fed the electricity into the grid, the Renewable Energy
Certificate (REC) they received can then be sold on the open market as a commodity. Because of
the additional cost for producing "green" energy, the RECs provide an additional income stream
to the energy provider, thus making it a bit more attractive to produce.
RECs can be traded in the market to meet Renewable Purchase Obligation (RPO).A Renewable
Energy Certificate (REC) is a market based instrument which provides evidence that a generator
has produced a certain amount of electricity from a RE resource.
Electricity produced from Renewable Energy sources are notionally distinguished into two parts:
The first being the electricity component and the Second being the environmental attribute of the
electricity produced from Renewable Energy. A Renewable Energy Certificate signifies this
second component that is the environmental attribute of the renewable energy.
REC is required in India because:
Distribution of RE resources is not uniform across the country, which results in
non uniform RPO.
States with higher RE potential pay more for RE electricity since RE generation
is more capital intensive.
RE electricity generation costs are not uniform across the RE technologies.
DISCOMs reluctant to purchase RE electricity by paying extra

27
4 REC MECHANISM
4.1 BASICS OF REC MECHANISM
Who can generate RE certificate?
Generators of Small Hydro (up to 5MW), wind, solar, biomass, bio fuel cogeneration, urban or
municipal waste to energy. And the condition for getting REC is that the generator should not have
any PPA.
Who requires RE certificate?
(a) Distribution Licensee
(b) Captive Consumer
(c) Open Access Consumer
(d) Voluntary Entities: Corporate under CSR, Individuals can also buy RECs although they do
not have to fulfill any RPO.
Categories of projects those are eligible for RECs?
(a). Projects for captive consumption (self-use)
(b). Projects for third party sale (RESCO)
(c). Projects with a Power Purchase Agreement (PPA) with a DISCOM.
Who are involved?
1. RE generators- Owner of RECs generated
2. State renewable nodal agency (SNA) -Accreditation Agency
(a) SERC (State Electricity Regulatory Authority) – Regulatory Framework
(b) SLDC (State Load Dispatch Center) – Redemption Authority
(c) NLDC (National Load Dispatch Centre) – Central Agency
(d) CERC (Central Electricity Regulatory Authority) -Rule making & fixing transaction charges
(e) Power Exchange & Traders (PXs) – Trading Market
(f) Distribution licensee /open access consumers/captive power consumers. –Obligated Entities
(e) Compliance Auditor: submit a detailed investigation report
Categories of RECs:
There are two categories of RECs, they are:
Solar REC: Issued for energy generated and fed to grid only from solar source
Non-Solar REC: Issued for the energy generated and fed to grid from non-solar source
such as Wind, Small Hydro Plants, Biomass, Cogeneration, Municipal waste to energy.
28
4.2 REC OBJECTIVE:
The REC mechanism has been adopted in many countries in the world. The main motive of this
concept is promotion of RE generation. The guiding factors behind the adoption of REC vary
across different countries. In Indian context:
Objectives:
To achieve equal contribution from each state towards achieving the nations RE target by:
Overcoming geographical constraints in harnessing dispersed RE sources:
REC mechanism was introduced to promote the developers to harness the available RE potential
and recover the cost of generation in an effective and efficient way.
Increasing the flexibility for participants:
The REC mechanism will provide flexibility to the Obligated Entities to complete their obligation
by procuring RECs from any part of the country without paying an extra transaction charge and
also to RE generators to recover their cost of generation from two different entities.
Reducing risks for local distributor by limiting its liability to energy purchase:
Under the earlier RPO Regulations the developer was bound to procure non-firm RE power
physically whenever it was produced, ultimately increasing the financial risks for the distributor.
Through REC mechanism the local distributor becomes flexible enough to oblige its compliance
by buying RECs whenever it is in sound financial position.
Enforcing a penalty mechanism for non-compliance of RPO:
Under the RPO Regulations there were no enforcement provisions for the obligated entities who
fail to complete their obligations. Through REC mechanism a penalty (Forbearance) price has
been discovered which will be enforced under amended RPO regulations for non-compliance.
Creating competition among different RE technologies:
The trading sessions of REC is likely to bring competition among different RE Technologies. The
adoption of most advanced technological innovations with optimized capital expenditure.

29
4.3 PRE-REQUISITES OF ELIGIBLE ENTITY
Figure 5: Eligibility for Availing REC Benefit
The RE Project Developer have two options:
1) Sell power directly to obligated entities at Preferential Tariff but then it can not avail RECs.
2) Sell power to non-obligated entities (for example, commercial and industrial users of power at
mutually agreed price at Power Exchanges or at APPC) and avail RECs that can be traded on the
exchange.
ELIGIBLE ELIGIBLE
RE
GENERATO
R
Self consumption/ Captive use
* Self/Captive consumer shall be
eligible for RECs if it fulfills both of
above two conditions
No
Promotional
Banking
No
Promotional
Wheeling
Third party sale / Open Access
Sale at
mutually
agreed
price
Sale through Bilateral Contract
Sale at
mutually
agreed
price
PPA with Distribution
Licensee
PPA at
Average
Power
Purchase
Cost
PPA at
State
Regulate
Tariff
ELIGIBLE NOT
ELIGIBLE
ELIGIBLE*
30
The generating company has to meet one of the eligibility criteria, as defined by the CERC, and
given below, to be designated as an “Eligible Entity” before the central agency can grant it
registration:
(a) RE Generator does not have any power purchase agreement for the capacity with any entity
which is still in force at the time of his making an application for selling of RECs against the RE
power he produces.
b) The applicant RE generator does not have a PPA with another entity, which has been
terminated within a period of three years prior to his submission of application. Even if the PPA
has been terminated due to non-compliance with the contractual obligations by the RE generator,
RE generator is not eligible to sell his power through the REC route for a period of three years.
c) Only if the PPA has been terminated with mutual consent of both the RE generator and the
obligated entity or if the contract has been terminated due to a breach of contract by the obligated
entity to which the RE generator is selling, the RE generator may submit his application inside a
period of three years from the date of termination of the PPA.
d) RE generator has not availed or does not propose to avail any benefit in the form of
concessional/promotional transmission or wheeling charges, banking facility benefit (this is not
related to the generation based incentives that he gets).
e) A period of three years has elapsed from the date of forgoing the benefits of concessional
transmission or wheeling charges, banking facility benefit.
f) The benefits of concessional transmission or wheeling charges, banking facility benefit and
has been withdrawn by the State Electricity Regulatory Commission and/or the State
Government

31
4.4 PROCEDURE FOR IMPLEMENTATION OF REC MECHANISM
Procedure for Application of Issuance of Renewable Energy Certificates:
1. Accreditation (Through State Nodal Agency)
2. Registration (Through Central Agency, NLDC)
3. Issuance (Through Central Agency, NLDC)
4. REC Trading at Exchange Platform (PXs)
5. Surrender/Redeeming of RECs (SERCs/SNA)
6. Compliance Reporting (Compliance Auditor)
4.4.1 PROCEDURE FOR ACCREDITATION (THROUGH STATE NODAL AGENCY)
Through this process, State Nodal Agency (SNA) authorizes or endorses the RE Generator and
recommends it for registration.
Eligible Generator can get accredited not before 6 months prior to the proposed date of
commissioning.
Accreditation Certificates are valid for 5 years from the date of accreditation.
Separate application required for separate RE generation projects.

32
4.4.2 PROCEDURE FOR REGISTRATION
Through this process, National Load Dispatch Centre (NLDC) registers Generator as ‘Eligible
Entity’ for its RE Generation Project.
Eligible Generator can get accredited not before 3 months prior to the proposed date of
commissioning.
Registration can only be done after receipt of the ‘Certificate of Accreditation’ for the RE
Generation Project from the concerned State Agency.
Accreditation Certificates are valid for 5 years from the date of Registration.
4.4.3 PROCEDURE FOR ISSUANCE
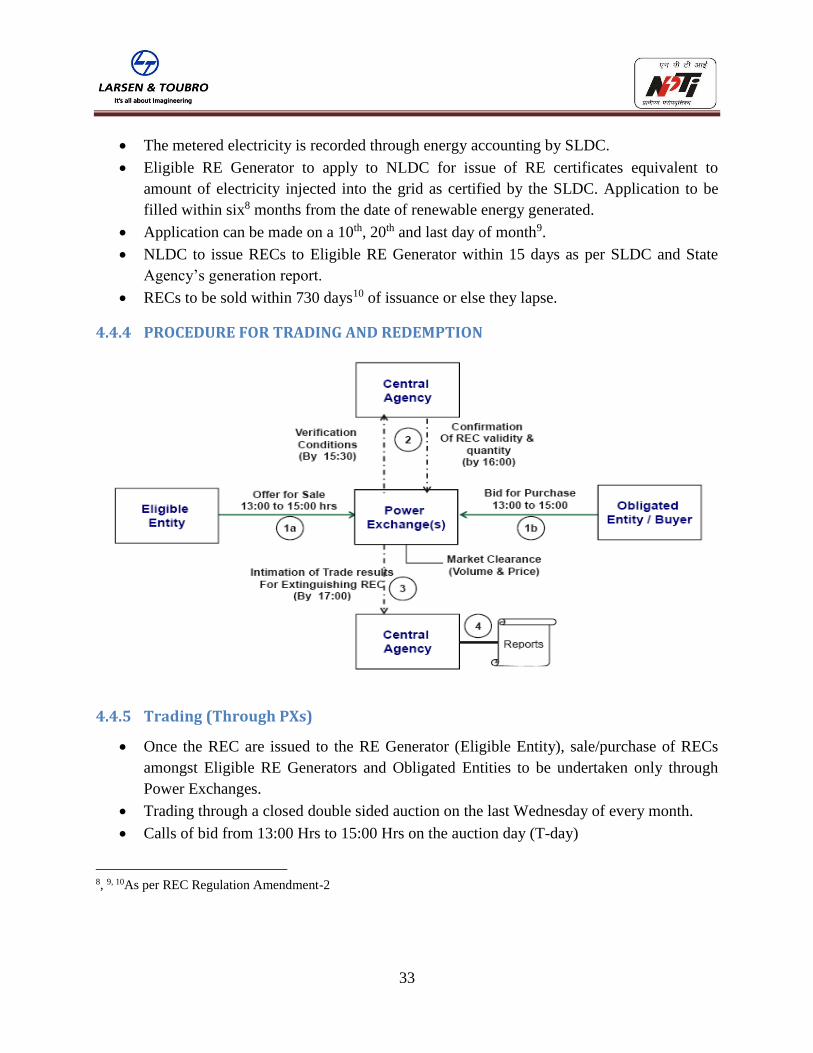
33
The metered electricity is recorded through energy accounting by SLDC.
Eligible RE Generator to apply to NLDC for issue of RE certificates equivalent to
amount of electricity injected into the grid as certified by the SLDC. Application to be
filled within six8 months from the date of renewable energy generated.
Application can be made on a 10th, 20th and last day of month9.
NLDC to issue RECs to Eligible RE Generator within 15 days as per SLDC and State
Agency’s generation report.
RECs to be sold within 730 days10 of issuance or else they lapse.
4.4.4 PROCEDURE FOR TRADING AND REDEMPTION
4.4.5 Trading (Through PXs)
Once the REC are issued to the RE Generator (Eligible Entity), sale/purchase of RECs
amongst Eligible RE Generators and Obligated Entities to be undertaken only through
Power Exchanges.
Trading through a closed double sided auction on the last Wednesday of every month.
Calls of bid from 13:00 Hrs to 15:00 Hrs on the auction day (T-day)
8, 9, 10As per REC Regulation Amendment-2
34
Exchanges intimate details of maximum sale bids placed by each Eligible Generator to
NLDC by 15:30 Hrs.
NLDC to check availability of RECs with the eligible entity by 16:00 Hrs.
Post confirmation from NLDC, Exchanges to determine Market clearing Price and
Market Clearing Volume and send the details of final trade to NLDC for extinguishing of
RECs sold by 17:00 Hrs.
4.4.5.1 Market Clearing Procedure in PXs:
- Eligible Entities shall place deal for both Solar and Non-Solar on any CERC authorized
PE.
- Bidding Window opens: Eligible Entities place their offers-buyers place their bids.
- Bidding Window Close: PE shall send the bid volumes available for each Eligible Entity
to CA for verification.
- CA sends a report of quantity of valid RECs after confirming the availability of RECs
with Eligible Entity.
- PE works out the MCP and MCV as per advice of CA and sends final cleared trades to
CA for records.
4.4.6 REDEMPTION (Through PXs)
Obligated Entities purchase RECs through Exchanges and submit them to the concerned
agency as specified by SERCs as proof of RPO compliance, NLDC (REC Registry) to
maintain record of RECs sold and purchased.
4.4.7 COMPLIANCE REPORTING:
Under Section 4.5 of order “Procedure for Issuance of Renewable Energy Certificate to the
Eligible Entity by Central Agency” compliance auditors have to monitor the compliance of
duties and obligation as specified by CERC by undertaking detailed investigation/audit and
submit the report on revocation of Registration of the Eligible Entity, if necessary, to the Central
Agency/Central Commission.

35
4.5 FEES AND CHARGES
Details of the accreditation fees payable to the SLDC:
Fees Structure FEES (INR)
One-time application processing fee (paid to state agency)
5,000 (€77)
One-time accreditation charge (paid to state agency)
30,000 (€462)
Annual charge (to be paid by April 10th) 10,000 (€154)
Revalidation/Extension (end of 5 years) 15,000 (€231)
Taxes and duties 12.36%
Details of the registration fees payable to the NLDC:
One time registration fees 5,000 (€77)
One time application processing fee 1,000 (€15)
Annual charge (to be paid by 1st April) 1,000 (€15)
Revalidation/Extension fees (End of 5 years) 5,000 (€77)
Taxes and duties 12.36%
Details of the issuance fees payable to the NLDC
Application for issuance 10 per REC (€0.15)
Taxes and duties extra 12.36%
Details of the Registration fees payable to the PXs for trading RECs
S.No. Fees Structure TCM11 TSCM12
1. Minimum Net worth 1,50,00,000
2. Processing Fees 5,000 5,000
3. One Time Fees 650,000 650,000
4. Annual Fees 100,000 100,000
4. IFSD 200,000 200,000
5. Total Amount(1+2+3+4) 955,000 955,000
6. Service Tax @ 12.36% on (1+2+3) 93,318 93,318
7. Total Fees(5+6) 1048,318 1048,318
Details of Trading Charges per REC payable to the PXs
IEX INR 20/REC
PXIL INR 10/REC
11 Trading cum Clearing Member 12 Trading cum Self Clearing Member
36
4.6 Pricing of Certificate:
(1) The price of Certificate shall be as discovered in the Power Exchange:
Provided that the Commission may, in consultation with the Central Agency and Forum of
Regulators from time to time provide for the floor price and forbearance price separately for
solar and non-solar Certificates.
(2) The Commission while determining the floor price and forbearance price shall be guided
inter alia by the following principles:
(a) Variation in cost of generation of different renewable energy technologies falling under solar
and non-solar category, across States in the country;
(b) Variation in the Pooled Cost of Purchase across States in the country;
(c) Expected electricity generation from renewable energy sources including:-
i. expected renewable energy capacity under preferential tariff
ii. expected renewable energy capacity under mechanism of certificates;
(d) Renewable Purchase obligation targets set by State Commissions”
These prices are calculated as under:
Forbearance Price = Maximum (Preferential Tariff - Average Pooled Power Cost)
Floor Price = Market Equilibrium Price (Minimum requirement for project
viability of RE technologies - Average Pooled Power Cost)
CERC calculated these prices for the period of FY 2012- FY2017:
(a) Non-solar Forbearance price:
(i).The highest difference between the Costs of Generation (RE Tariff) and the APPC has been
specified as the forbearance price for non–solar technologies. The highest difference has been
rounded off to the next hundred’s (or next ten’s in case of unit price), to arrive at the forbearance
price of ` 3300/MWh (Annexure -1).
(b) Non – Solar Floor Price:
(i).The difference between the project viability requirement and APPC is arranged in ascending
order (Rs/kWh) for different RE technologies across states. The expected generation (MUs) from
RE technology in a particular state is mapped with the respective difference between the project
viability requirement and APPC.

37
(ii).In this case floor price has been taken as the price (difference between feasibility requirement
and APPC) at which the target RE generation of 70000 MUs (average of renewable energy target
as per NAPCC and MNRE vision Report 2010 for non solar technology) will be realized. The
difference at this point has been rounded off to the next hundred’s (or next ten’s in case of unit
price), to arrive at the floor price of ` 1500/MWh (Annexure - 2).
(iii).This approach for floor price is considered adequate as the objective is to ensure that the
basic minimum requirements (in terms of recovery of cost) of the target generation are met.
(c) Solar Forbearance price:
(i).This has been derived based on the highest difference between the Solar PV/Thermal tariff for
2011-12 and the APPC of 2011-12 across states. The highest difference in unit price has been
rounded off to the next hundred’s (or next ten’s in case of unit price), to arrive at the forbearance
price of `13400/MWh (Annexure - 3).
(d) Solar Floor price:
(i).The floor price of solar RECs has been calculated based on the project viability approach. The
project viability approach covers the cost required to meet viability parameters including O&M,
interest, principal repayment etc.
(ii).The highest difference between the minimum requirement for project viability of Solar
PV/Thermal and respective state APPC of previous year (2011-12) has been considered as floor
price. The highest difference has been rounded off to the nearest hundred’s (or next ten’s in case
of unit price), to arrive at the floor price of ` 9300/MWh (Annexure - 3).
Based on the above principles, the following forbearance price and floor price are prescribed
dealing in Certificates under the REC Regulations for period of 2012-2017.
38
4.7 RECENT AMENDMNETS IN REC MECHANISM
The latest amendment on 10th July 2013 has been notified by the Central Electricity Regulatory
Commission (CERC) shall be called as (Terms and Conditions for recognition and issuance of
Renewable Energy Certificate for Renewable Energy Generation) (Second Amendment)
Regulations, 2013.
The following amendments have been notified in the Principal Draft of REC:
REC and Reverse Bidding/Tendering – CERC has clarified that the projects which have
signed a PPA through any state tendering mechanisms (reverse bidding) would be ineligible for
procuring RECs. There should be no ambiguity in this for two reasons – the state utilities usually
initiate the tenders with the purpose of fulfilling their RPO which obviously makes the developer
ineligible for RECs to prevent double accounting. Secondly the developer already takes into
consideration all the costs/risks associated with the project while proposing a tariff and as such
there is no need for REC to bridge the tariff gap (which is the intention of the REC mechanism in
the first place).
Bagasse based cogeneration – There has been specific changes with respect to bagasse based
cogeneration power plants which have been setup for captive consumption. It has now been
proposed that the entire connected load capacity as assessed by the distribution licensee would be
considered for the issuance of RECs as opposed to the capacity for which the PPA has been
signed. It has done so as the PPAs (in this particular case) are usually signed for sale of excess
electricity after captive consumption.
APPC – Previously, the guidelines were worded in such a way which brought in significant
ambiguity as it stated that the PPA should be signed at a price not exceeding the APPC price
which suggested that the tariff could be BELOW the APPC price. The guidelines now clarify
that the PPA shall have to be signed at a price equal to the APPC price which was prevalent the
previous year.
Electricity duty and captive generators – Presently, many states have waived the electricity
duty for captive power generation irrespective of whether the generators use fossil fuels or RE
based systems. This duty is a state specific price component. REC guidelines currently state that
any generator availing ANY subsidy INCLUDING electricity duty waiver is ineligible for
claiming RECs. However, CERC has now proposed to remove the electricity duty exemption as
a disqualification criterion as the quantum of contribution to final tariff is quite miniscule. The
other criteria for disqualification such as concessional wheeling/banking would still be in force.
Time period for availing RECs – Current regulations state that there is a three month time
window after approval from the SLDC to get the required clearance from the central agency.

39
However since the receipt of information from the SLDC sometimes takes more than three
months to reach the central agency, it has been proposed to extend the window to six months. In
addition to this, currently the application for receipt of the certificates can be made only on the
1st and 15th of each month. This has been revised to the 10th, 20th and last day of each month.
No cap on minimum capacity – previously, it was proposed that RE power plants with a
capacity of 250 kW and above would only be eligible for certificates under the REC mechanism
(subject to approval by MNRE) even though the CERC guidelines do not dictate a minimum
requirement. CERC has clarified that there is no minimum capacity and that ANY RE generator
would be eligible to claim REC provided they satisfy the prescribed criteria.
Retention of RECs – As per current regulations, RE generators who have setup captive power
plants to fulfill their REC requirement would have to procure RECs from the exchange even
though their generation is eligible for RECs. This generates significant overheads due to
transaction costs associated with procuring the certificates, listing them and then procuring them
again from the exchanges. CERC has now clarified that all RECs generated through a RE captive
power plant can be retained by the developer (to fulfill their obligations) thereby reducing the
overheads which is subject to verification by the SNA.
Shelf-life of RECs – RECs shall now have a shelf-life of two years (730 days) as opposed to one
year (365 days).
Date of issuance – Any power plant setup under the REC mechanism would be eligible for
RECs from the date of commercial operation or from the date of registration of such plant by the
Central Agency whichever is later.
40
5 REC INTERNATIONAL LEARNING
5.1 United Kingdom
5.1.1 Introduction
UK is a unitary state which consists of four countries England, Northern Ireland, Scotland and
Wales. There are three devolved national administrations with varying powers situated in
capitals of Northern Ireland, Wales and Scotland. UK has signed up to the EU Renewable
Energy Directive to supply 15% of total energy demand from renewable by 2020. To meet this
target various renewable obligation schemes were designed to incentivize renewable generation
into the electricity generation market.
The first Renewable Obligation Order (ROO) enforced under Section 32 of Electricity Act 1989
came in April 2002 (Wales), so did the second Renewable Obligation (Scotland) Order and
the last Renewable Obligation Order (Northern Ireland) came into force in April 2005.
Later amendments were done and new orders were passed in 2009 which was also amended in
years 2010, 2011 and 2012. ROO 2002 defined targets till March 2011; ROO 2009 review
revised the targets till FY 2020 and ROO 2012 (amendment for bands 2013-17) revised the ROC
band allocation for different RE sources.
The three schemes introduced by Department of Enterprise, Trade and Investment, The Scottish
Executive and Department of Trade and Industry under these orders are:
1. Renewable Obligation (RO) (for England &Wales)
2. Renewable Obligation Scotland (ROS)
3. Northern Ireland Renewable Obligation (NIRO)
These orders place an obligation on licensed electricity suppliers in England and Wales, Scotland
and Northern Ireland to source an increasing proportion of electricity from renewable sources.
The certificates issued in these three schemes are named as Renewable Obligation Certificates
(ROCs), Scotland ROCs (SROCs) and Northern Ireland ROCs (NIROCs).Office of Gas and
Electricity Market (Ofgem) issues and administers ROCs and SROCs. NIROCs are also
issued by the Ofgem on behalf of Northern Ireland Authority for Utility Regulation
(NIAUR) under an Agency Service Agreement; however NIAUR retains the legislative
responsibilities for administrating the NIRO. The sunset dates for RO and ROS is 2037 and for
NIRO it is 2033.
The EU Renewable Energy Directive commits the UK to meeting 15% of its energy needs from
renewable sources by 2020. To achieve this, renewable electricity supply from large scale
generation will need to increase from around 26TWh in 2010 to around 108TWh (under the

41
central renewables deployment scenario) by 2020, and further deployment of renewable
electricity will need to come from smaller-scale generation (<5MW).
The Renewables Obligation (RO), introduced in 2002, is currently the Government’s main
financial policy mechanism for incentivizing the deployment of large scale renewable electricity
generation in the UK – small scale renewable electricity generation is incentivized through a
separate Feed-in-Tariff scheme. Since the introduction of the RO in 2002, there has been a more
than trebling in the UK’s renewable generation, from 1.8% to 9.4% in 2011.The RO has played
an important part in securing reductions in carbon dioxide emissions, alongside other policy
measures such as the Climate Change Act 2008.
5.1.2 Technology Banding of Renewable Obligation
From the RO’s introduction in 2002 until 2008-09, all renewable energy technologies received
the same band of support at 1 Renewable Obligation Certificate (ROC) per MWh of renewable
electricity generated.
As a result, whilst being ostensibly technology-neutral, the Renewables Obligation in its original
form in fact favored the deployment of the more established, near-market technologies such as
landfill gas and onshore wind, those which were most economically efficient, over less well
developed technologies that were further from commercial viability. Different RO bands of
support for eligible technologies were set for new stations in the four years from 2009-10 to
2012-13, which sought to remove overcompensation of lower cost technologies and provide
incentive for more expensive technologies that had significant deployment potential.
The Government announced its intention to reform the Renewables Obligation in 2006. Banding
was introduced in 2009 to provide differing levels of support to groups of technologies
depending upon their relative maturity, development cost and associated risk. Whilst increasing
the incentive for technologies in the early stages of development this also allowed the level of
support for well established technologies to be reduced to avoid over-subsidization.
In reforming the Renewables Obligation in this way, and scheduling regular future reviews, the
Government recognized that the market would not deliver the mix of renewable energy
generation required to meet the targets if the incentives remained technology-neutral. It was
therefore necessary for the Government to perform a continuing strategic role and retain the
capability to intervene if necessary. The introduction of banding allowed the Government to steer
industry towards investment in less well developed forms of renewable energy to enable them to
contribute to meeting the long-term targets, rather than concentrating investment in technologies
that are economically favorable in the short-term.
In 2009 to help emerging Renewable Energy technologies overcome the various constraints
like delays in legislative planning, grid connection, practical resource availability and higher

42
costs of renewable energy projects government introduced the “Banding Process” with 4 proposed
bands:
Established Band = 0.25 ROC/MWh
Reference Band = 1 ROC/MWh
Post Demonstration Band = 1.5 ROCs/MWh
Emerging Technologies = 2 ROCs/MWh
5.1.3 IMPLEMENTATION AUTHORITY:
1. The RO is administered and enforced by Ofgem, who report annually on their administration of the RO
and conduct regular audits in relation to compliance with the RO.
1. Ofgem’s role:
The Orders detail Ofgem's powers and functions to administer the Renewables Obligation. These
functions include:
Accrediting generating stations as being capable of generating electricity from eligible
renewable sources
Issuing ROCs and revoking these as necessary
Establishing and maintaining a Register of ROCs
Monitoring compliance with the requirements of the Orders
Calculating annually the buy-out price
Receiving buy-out payments and redistributing the buy-out fund
Receiving late payments and redistributing the late payment fund, and
Publishing an annual report on the operation of and compliance with the requirements of
the Orders.
Ofgem also administers the Northern Ireland Renewables Obligation (NIRO) on behalf of the
Northern Ireland Authority for Energy Regulation (NIAER).
2. DECC is responsible for monitoring the impact of the RO on the development of renewable energy and
collects detailed information on growth in renewable energy generation and projects under development.

43
5.1.4 ISSUANCE OF ROCs
ROCs are issued to all generating stations (monthly bases) with declared net capacity (DNC)
greater than 50kW and even micro generators with 10 kW < DNC < 50kW can opt to receive
ROCs (annually), supplying electricity via part of national transmission/distribution network.
The captive generator can also claim ROCs for eligible electricity used on site provided the
operator signs a declaration “Permitted Ways” and submit to Ofgem every year. The various
generation technologies for which the certificates are issued in UK are On-shore wind, Landfill
gas, Fuelled (Biomass, Anaerobic digestion, Co-firing), Off-shore wind, Hydro, Others (PV,
Tidal flow and Wave Power) and Sewage Gas. FIT scheme introduced in April 2010 made all
installations of capacity between 50 KW to 5 MW certified under MCS (micro generation
schemes) installed on or after 15 July 2009 valid under it. Obligated Entities are allowed to meet
12.5% of their obligation by ROCs issued for co-firing of fossil fuels and biomass and yearly
25% of obligations could be met by banked ROCs. One ROC is issued for every MWh of
electricity fed into the network.
5.1.4.1 Process of Issuance:
1. Accredited generators are issued ROCs based on the net renewable electricity that is generated
each month by an accredited renewable generating station by on the Office of the Gas and
Electricity Markets (Ofgem).ROCs can then be sold directly or indirectly to suppliers who will
redeem them against their Renewables Obligation.
2. The number of ROCs issued per megawatt hour (MWh) is determined by the technology / fuel
used by the station, its size, its location and how long it has been accredited under the RO. In
order to be accredited under the Orders, generating stations must meet certain statutory criteria,
including the fact that they have been commissioned. Once accredited, further criteria must be
met on a monthly basis if ROCs are to be issued.
Figure 6: Process of Issuance of ROC in U.K.

44
3. Once a ROC has been issued and transferred to a supplier, that supplier can redeem that ROC
against their Renewables Obligation. The ROC can only be redeemed by a supplier against the
obligation period in which it was issued or against the following obligation period. For example,
a ROC issued in respect of generation in June 2011 can be redeemed by a supplier in respect of
the 2011/12 or 2012/13 obligation periods only. After that, the ROC would effectively expire and
cannot be presented to us against a supplier‘s obligation.
4. The level of the annual obligation on electricity suppliers is published by 1 October in the year
before it comes into effect, e.g. the obligation for the financial year starting 1 April 2013 was
published on 28 September 2012.
5. Generators sell their ROCs to suppliers (or traders), which allows them to receive a premium
in addition to the wholesale electricity price.
6. Suppliers present their ROCs to Ofgem to demonstrate their compliance with the RO.
Suppliers who do not present enough ROCs to meet their obligation must pay a penalty (known
as the ‘buy-out price’).
7. The money Ofgem collects in the buy-out and late payment funds is re-distributed on a pro-
rata basis to suppliers who presented ROCs.
5.1.5 How the value of a ROC is determined
ROCs are tradable commodities that have no fixed price. The amount an electricity supplier pays
for a ROC is a matter for negotiation between the supplier and generator.
For the purposes of government financial planning, the long-term value of a ROC is made up of
the buyout price, i.e. the payment avoided by the supplier for presenting ROCs to Ofgem, plus
10%.This is roughly £44 per ROC in 2013/14 prices.
Table 5: ROC Trading Price U.K. - 2013
Auction Date Average
ROC Price
Lowest
ROC Price Total No' of ROCs Co-Fired ROCs
30 July 2013 £43.65 £ 43.13 70,325 0
28 June 2013 £44.10 £ 43.60 118,505 896
31 May 2013 £44.19 £ 44.15 87,707 1,364
24 April 2013 £43.99 £ 43.10 103,438 464
28 March 2013 £43.76 £ 42.85 88,722 0
26 February 2013 £42.34 £41.70 112,264 1,094
24 January 2013 £41.48 £40.90 31,143 1,344
20 December 2012 £41.33 £40.60 56,696 2,380

45
5.1.6 Setting the obligation level
DECC sets the level of the obligation each year using a fixed target or a ‘headroom’ calculation.
It does this in accordance with provisions in the Renewables Obligation Order 2009 (as
amended).
Headroom works by providing a set margin between the predicted generation (supply of ROCs)
and the level of the obligation (demand for ROCs). This helps reduce the possibility of supply
exceeding the obligation in any given year and therefore crashing the value of the ROC.
Headroom lets investors feel more confident that there will always be a market for their ROCs
and it helps stabilize the ROC price.
The obligation level determines the number of ROCs suppliers are required to produce for each
megawatt hour of electricity (MWh) they supply to customers. Each supplier’s obligation is
calculated by multiplying their total annual supply to customers in the UK (MWh) by the level of
the obligation (ROCs per MWh).
The obligation level for each obligation period (1 April to 31 March) is published annually by 1
October of the previous year. The obligation level for suppliers for April 2013 to 31 March 2014
is 0.206 ROCs for each MWh they supply for customers in England and Wales.
Suppliers can meet their obligation by:
Presenting ROCs
Making a buy-out payment to Ofgem to cover any shortfall in the number of ROCs
requirement (set at £42.02 per ROC for 2013/14)
A combination of both
The money Ofgem collects in the buy-out and late payment funds is recycled on a pro-rata basis
to suppliers who presented ROCs minus the cost of Ofgem’s administration of the RO.
Suppliers that do not present ROCs pay into the buy-out fund at the buy-out price but do not
receive any portion of the recycled fund.
5.1.7 RECENT AMENDMENT IN RO BANDING (2013-2017)
To ensure that the level of subsidy remains appropriate, the individual bands need to be reviewed
periodically. The Orders provide that a banding review may be commenced in October 2010 and
then at four yearly intervals thereafter. The changes set out in this chapter were introduced on 1
April 2013 (or 1 May 2013 under the NIRO) as a result of the first of these reviews.
The Government consulted on the levels of banded support for renewable electricity generation
for the period 2013-17 between 20 October 2011 and 12 January 2012. On 25 July 2012, the
Government’s response to the consultation was published which indicated that it would be
necessary to re-consult on a number of areas where further engagement with industry and
relevant stakeholders was necessary to ensure the right evidence to fully implement the
proposals.

46
On 7 September 2012, the Government published two consultation papers setting out proposals
for the RO for the period 1 April 2013 to 31 March 2017. One consultation addressed the levels
of banded support for solar PV for this period and the other addressed biomass affordability and
sustainability.
The solar PV consultation proposed to reduce the level of support for new solar PV to 1.5
ROCs/MWh for new accreditations and additional capacity added in 2013/14, with subsequent
reductions to 1.3 ROCs for new accreditations and additional capacity added in 2014/15,
1.1 ROCs/MWh in 2015/16 and 0.9ROCs/MWh in 2016/17. These levels of support were
intended to be broadly equivalent to projected tariffs for the largest solar PV FITs band
(>250kW-5MW) and to ensure only the most economically-sound solar PV projects were
supported. The consultation also proposed to control the costs of solar PV within the RO by
using the existing mechanism in article 33 of the Renewables Obligation Order 2009.
For the building-mounted solar PV band, the Government has decided to set the following
support levels for new accreditations and for additional capacity during the banding review
period (April 2013 to March 2017).
For the ground-mounted solar PV band, the Government has decided to set the following support
levels for new accreditations and additional capacity during the banding review period (April
2013 to March 2017).
5.1.8 Band Allocation for RE Technologies
There were three options that were considered by the govt. for deciding the bands for different
RE technologies those are:
Option 1 – Do nothing (Current bands)
This option retains the bands which are currently offered through the RO, as shown in the second
column of Table 1 below. It also retains the cap on co-firing at 12.5% of all ROCs that suppliers
can submit in a given year.

47
Option 2 – Consultation bands
This option reflects the bandings as proposed in the Consultation. In particular, it removes the
cap on co-firing; introduced two new bands of ECF and conversion; increases support for wave
and tidal stream to 5 ROCs/MWh (subject to a 30MW project cap); cuts support for hydro and
EfW to 0.5 ROCs/MWh; reduces support for onshore wind to 0.9 ROCs/MWh; and reduces
support for everything at the 2 ROCs level, including offshore wind, to 1.9 in 2015/16 and 1.8 in
2016/17.
Option 3 – Response bands
Following assessment of new evidence received through the Consultation and updated analysis,
the following changes to the Consultation bands have been announced in the Government
Response:
• Standard co-firing (SCF) enhanced co-firing (ECF) and conversion:
I. To redefine SCF, ECF and conversion as burning a percentage of biomass fuel in a boiler /unit
as opposed to the percentage of biomass fuel burnt in the whole (former) fossil fuel power
station, with bands increasing gradually as a greater percentage of biomass is burned in each unit
as follows:
• SCF (Up to 50% biomass) at 0.3 ROCs/MWh in 2013/14 and 2014/15 rising to 0.5ROCs/MWh
for the rest of the period – this proposal will be the subject of a further consultation
• Mid-range co-firing (50% to up to 85% biomass) at 0.6 ROCs/MWh
• High-range co-firing (85% to up to 100% biomass) at 0.7 ROCs/MWh in 2013/14, rising to 0.9
ROCs/MWh from 2014/15
• Conversion (100% biomass) at 1.0 ROC/MWh
II. Proposed new monitoring and reporting requirements for biomass conversions and ECF will
be the subject of a new consultation. See section 9 of the government response.
III. Bioliquids will not be an eligible fuel for the mid-range co-firing and high-range co-firing
bands.
IV. There will be no additional support for mid-range co-firing with energy crops, high-range co-
firing with energy crops or conversion with energy crops bands.
V. There will be additional support for mid-range co-firing with CHP, high-range co-firing with
CHP and conversion with CHP bands.18 Extra support for CHP may incentivize heat off take on
these technologies where there is a heat demand, allowing greater efficiency and carbon savings.
• Solar PV: Evidence by PB Power19collected for the FiTs Consultation demonstrated that
estimates of the cost of solar PV had fallen dramatically. In response to this evidence, the

48
Government will consult on proposals for reduced ROC support for solar PV generating stations
which accredit or add additional capacity on or after 1 April 2013;
• Energy from Waste CHP: EfW CHP will be supported at a higher level (1 ROC/MWh) than
that proposed in the consultation. New cost evidence was used and an investment decision was
assessed against a counterfactual of building a power-only plant, which is a more appropriate
basis than no investment at all. This new analysis indicated more support was required.
• Advanced Conversion Technologies20: analysis of data from the ACT call for evidence
indicated that the costs of most ‘standard’ (steam cycle) plants had been underestimated for the
consultation, with a range of ROCs required from 0 to 7.721. The new evidence suggests that the
ROCs required to incentivize all of the technical potential for both ‘standard’ and ‘advanced’
(gas engine) is above 2 ROCs/MWh, although much of it can be brought on at 2 ROCs. In order
to encourage the development of a reasonable level of both standard and advanced ACT, the
Government response has announced that all new accreditations and additional capacity added in
2013/14 and 2014/15 will receive 2 ROCs/MWh, reducing to 1.9 ROCs/MWh in 2015/16 and
1.8 ROCs/MWh in 2016/17.
• Hydro: in order to incentivize more deployment of this cost-effective technology, support has
been increased from the consultation proposal of 0.5 ROCs/MWh to 0.7 ROCs/MWh for new
accreditations and additional capacity added in the banding review period (1 April 2013 to 31
March 2017). Following consultation responses, and further discussions with developers, the
generic cost and potential assumptions for hydro above 5MW were revised, and individual
pipeline project data analyzed - these individual results are commercially confidential.
• Landfill gas: an additional 0.1 ROCs/MWh will be available to incentivize waste heat to
power units as evidence was provided of the additional efficiency gain and hence additional
generation of adding ‘waste heat to power’ units onto landfill gas installations. Whilst no costs
were provided to suggest landfill recovery required support from open sites, consultation
responses indicated that there was new landfill gas potential from closed sites no longer
accepting waste, and that there were additional costs associated with closed sites, which are
expected to require 0.2 ROCs/MWh to proceed. Given the cost-effectiveness of landfill gas
recovery, support is now proposed at 0.2 ROCs/MWh for landfill gas generation from closed
sites.

49
Table 6: Band Allocation to Different RE Technologies. (Source: Amended RO order April 2013)

50

51
5.1.9 Renewable Obligation:
The obligation is set on the basis of 3 calculations:
1. Fixed Targets (Calculation A): The no. of ROCs that would be needed by licensed electricity
suppliers to meet a fixed target of obligation from eligible renewable sources per MWh from
electricity sales. The number of Renewable Obligation Certificates (ROCs) that would be needed for suppliers to meet a fixed target of 0.134 ROCs per MWh from eligible renewable sources in England, Scotland and Wales and 0.063 ROCs per MWh in Northern Ireland
Countries 2009-10 2010-11 2011-12 2012-13 2013-14 2014-15 2015-16
England
and Wales
9.7% 10.4% 11.4% 12.4% 13.4% 14.4% 15.4%
Scotland 9.7% 10.4% 11.4% 12.4% 13.4% 14.4% 15.4%
Northern
Ireland
3.5% 4.0% 5.0% 6.3% 6.3% 6.3% 6.3%
2. Headroom (Calculation B): The amount of renewable electricity we expect to be generated in
coming year and based on this the no. of ROCs we expect will be issued, uplifted by 10% (as
decided by government). Headroom is a mechanism to ensure that the size of the obligation will
always be at least 8% above expected generation in the obligation period.
3. The Cap (Calculation C): The number of ROCs that would be issued if suppliers were to
source 0.2 ROCs per MWh from eligible renewable sources.
The Obligation level is set as one of these calculations, determined as:
Fixed targets: If fixed targets (A) is greater than headroom (B).
Headroom: If headroom (B) is greater than the fixed target (A).

52
5.1.10 Future of the Renewables Obligation in UK
The UK Government has proposed wide-ranging reforms to the UK electricity market which will
eventually see Feed-in Tariffs with Contracts for Difference (CfD) replace the Renewables
Obligation as the main renewable generation support mechanism. Unlike ROCs, CfDs will also
be available to generators of nuclear electricity.
The Renewables Obligation will remain open to new generation until 31 March 2017, allowing
new renewable generation that comes online between 2014 (when it is anticipated the CfDs will
start) and 2017 to choose between CfDs and ROCs. After that date, the Government intends to
close the Renewables Obligation to new generation and ‘vintage’ existing ROCs, meaning that
levels and length of support for existing participants in the Renewables Obligation will be
maintained.
1. In its White Paper of 12 July 2011 the government set out its proposals for Electricity Market
Reform. The proposals include maintaining the banded RO until 31 March 2037 but closing to
new capacity after 31 March 2017. It is proposed that generating stations and additional capacity
already accredited prior to 1 April 2017 will continue to receive their full lifetime support in the
vintaged scheme.
2. Within the vintaged scheme the obligation is proposed to be set annually using the current
headroom mechanism (potentially with a fixed target underpin). From 2027, the price of a ROC
is likely to be fixed at its long-term value, and government is likely to buy the ROCs directly
from generators, suppliers or traders. This is intended to reduce volatility in the final years of the
mechanism.
3. A new Feed-in-Tariffs with Contracts for Difference (CfD) scheme is expected to be
introduced in 2014 to eventually wholly replace the RO. It is proposed that generators will have
a choice between the RO and the new CfD scheme, once it is introduced, until the RO closes to
new capacity on 1 April 2017.
53
5.2 AUSTRALIA Most of Australia’s electricity is produced using coal, which accounted for 77 per cent of total
electricity generation in 2008–09. Burning coal and other fossil fuels for electricity generation
accounts for more than one third of Australia’s current greenhouse gas emissions.
Following the KYOTO Protocol dated Oct 1997, the Prime Minister of Australia announced an
A$ 180 million package with 24 designed measures to improve the Greenhouse performance of
country. One of the measures in above package was Mandatory Renewable Energy Target
(MRET); the major consultation for implementation of MRET started in April 1998 and was
completed in May 1999. Following this The Renewable Energy (Electricity) Act 2000 and The
Renewable Energy (Electricity)(Charge) Act 2000 were enacted which detailed about
requirements and provisions to enable the renewable energy liability, certificate system operation
and the penalty system and the relevant shortfall charges for non-compliance. The main
objectives behind this Renewable Energy Target (RET) was to encourage additional generation
from renewable energy sources and ensure that renewable energy sources are ecologically
sustainable. The Renewable Energy (Electricity) Act 2000 established a statutory agency the
Office of Renewable Energy Regulator (ORER) to oversee the implementation of MRET. The
Obligation percentage for Renewable Energy Target (RET) was set in “Renewable Energy
(Electricity) Regulations 2001.
Later the Renewable Energy (Electricity) Amendment Bill 2010 passed in June 2010 splited
RETS into Large Scale RET (LRET) and Small Scale Renewable Energy Scheme (SRES) from
January 1, 2011, to support the development of both large scale and small scale renewable
energy systems in country. The Certificates issued in these two schemes are Large Scale
Generation Certificates (LGC) and Small Scale Technology Certificates (STC) respectively.
LGC can be traded directly between liable entities and generators or with a mediating agent
between them at a negotiated price whereas the STC can be traded through STC Clearing House
at a fixed price of A$ 40/STC. The REC registry an internet based registry system under ORER
facilitates the creation, registration, transfer and surrenders of LGC‟s and STC‟s and maintains
various registers as set in act.
The government has implemented a target of 20% renewable energy sourced electricity
by 2020
The current RET requires 9500 GWh of renewable energy to be delivered by energy
companies
The 20/20 target requires 45000 GWh
1MWh of energy equals 1 REC, so 45,000,000 RECs will be generated to meet the 2020
target
To meet the target, energy companies must surrender RECs into their holding account at
the end of every calendar year at an amount representative to 20% of their market share
If energy companies don't put sufficient RECs into the holding account, the company is
fined at a rate much higher than the REC value.

54
5.2.1 Introduction
Key features of this REC scheme:
One REC represents one MWh of electricity.
RET increased from 9500 GWh to 45000 GWh by 2020.
20% of electricity supply from renewable by 2020.
Sunset date 2030.
Partial Exemptions Certificates for Emission Intensives Trade exposed Activities (EITE).
Solar Credits.
41000 GWh target under LRET by 2020.
On 24 June 2010 the Commonwealth Parliament passed legislation to separate the Renewable
Energy Target (RET) into two parts from 1 January 2011:
1. Small-scale Renewable Energy Scheme (SRES)
2. Large-scale Renewable Energy Target (LRET).
Liable entities need to meet obligations under both SRES and LRET by acquiring and
surrendering renewable energy certificates created from both large-scale and small-scale
renewable energy technologies.
5.2.2 Regulatory Authorities
The Clean Energy Regulator oversees the implementation of the RET scheme.
The Department of Climate Change and Energy Efficiency manages national policy and
the legal framework.
5.2.3 Small-scale Renewable Energy Scheme (SRES)
The Small-scale Renewable Energy Scheme creates a financial incentive for owners to install
eligible small-scale installations such as solar water heaters, heat pumps, solar panel systems,
small-scale wind systems, or small-scale hydro systems. It does this by legislating demand for
Small-scale Technology Certificates (STCs). STCs are created for these installations according
to the amount of electricity they produce or displace. RET liable entities have a legal requirement
to buy STCs and surrender them on a quarterly basis.
Eligibility
Solar water heater or heat pump installations are eligible if the system is new and listed in
the Register of Solar Water Heaters managed by the Clean Energy Regulator.
Small-scale solar, wind and hydro systems are eligible if:
o the system is new;
55
o its components are listed in the Clean;
o it is installed correctly by a Clean Energy Council accredited installer;
o it is installed on an eligible premises (only required if claiming Solar Credits); and
o it complies with all local, State, and Federal requirements for its type of installation.
Documentation for small-scale systems, demonstrating compliance with the legislated
requirements, must be completed and signed by the owner, installer, and/or Registered
Agent (as appropriate), and able to be produced if requested by the Clean Energy
Regulator.
A Registered Agent is eligible to create STCs if the owner has correctly signed over the
certificates to them and this signed documentation can be provided to the Clean Energy
Regulator.
5.2.4 Large-scale Renewable Energy Target
The Large-scale Renewable Energy Target creates a financial incentive for the establishment and
growth of renewable energy power stations, such as wind and solar farms, or hydro-electric
power stations. It does this by legislating demand for Large-scale Generation Certificates
(LGCs). These LGCs are created based on the amount of eligible renewable electricity produced
by the power stations. LGCs can be sold or traded to liable to entities, in addition to the power
station’s sale of electricity to the grid. RET Liable entities have a legal obligation to buy LGCs
and surrender them to the Clean Energy Regulator on an annual basis.
Eligibility
Power stations must generate their electricity from approved sources such as solar
energy, wind, ocean waves and the tide, geothermal-aquifers, wood waste, agricultural
waste, bagasse (sugar cane waste), black liquor (a by-product of the paper-making
process), or landfill gas.
A full list of eligible renewable energy sources is included in Section 17 of the
Renewable Energy (Electricity) Act 2000. There are currently more than 15 different
types of renewable energy sources being used in accredited power stations.
Electricity generated from fossil fuels, or waste products derived from fossil fuels, is not
eligible for LGCs.
During the accreditation process of a power station, the Regulator determines the baseline
generally the average amount of electricity generated from eligible renewable energy
sources over the 1994, 1995 and 1996 years. Eligible parties can only create LGCs for
electricity generated above the baseline.
Power stations which generated electricity for the first time after 1 January 1997 have a
nil baseline.

56
LRET includes legislated annual targets and operates much the same as the previous RET
design, but as a separate scheme to SRES. From 2011 to 2030, the annual targets for LRET are
set at 4000 Gigawatt -hours (GWh) per year less than the previous RET targets, reaching 41,000
GWh by 2020. This is to take account of the separate mechanism to support small-scale
renewable energy systems under SRES. LRET annual targets are listed in the table below.
Table 7: LRET Annual Target
Year
Target in MWh as at
8 July 2010,
commencing on
1 January 2011
Adjustments to take
account of a higher
than expected number
of certificates created
in 2010
Adjustments for the
commencement of waste coal
mine gas as an eligible
renewable energy source
Number of RECs
/ LGCs required
to meet the target
(section 40 of the Act)
(section 40 (1A)(a) and
(b) of the Act as
appropriate)
(section 40 (2) – (5) of the
Act)
2013 14,200,000 +4,038,000 +850,000 19,088,000
2014 16,100,000 N/A +850,000 16,950,000
2015 18,000,000 N/A +850,000 18,850,000
2016 22,600,000 -2,019,000 +850,000 21,431,000
2017 27,200,000 -2,019,000 +850,000 26,031,000
The general formula showing the amount of electricity generation eligible for LGCs is:
TLEG – (FSL + AUX + (DLEG * (1 – MLF))
TLEG = Total electricity generated in MWh by a power station in a year.
FSL = Fossil fuel component of generated electricity.
AUX = Auxiliary losses of electricity.
DLEG = Transmission losses on the exported electricity
MLF = Marginal loss factor.
Under The Renewable Energy (Electricity) Act 2000, the electricity acquisitions liable for REC
are called “Relevant Acquisitions” (RA). The Act defined basic two types of RA wholesale
acquisitions (purchase of electricity from AEMO) and notional acquisitions (the liable entity is
the generator selling to the end user). The electricity (a) if delivered on a grid of less than 100
MW and (b) if captive generation and its end use is done within 1 km of distance then both could
be considered as irrelevant acquisition and would not be liable for REC.

57
5.2.5 Types of Renewable Energy Certificates (RECs):
From 2001 to the end of 2010, the commodity in the market was called a “Renewable Energy
Certificate” or REC.
From 1 January 2011 RECs were reclassified into two certificate types: “Large-scale Generation
Certificates” (LGCs) and “Small-scale Technology Certificates” (STCs).
5.2.5.1 Large-scale Generation Certificates (LGC)
Large-scale Generation Certificates (LGCs) are an electronic form of currency created on the
REC Registry by eligible parties. A LGC is equivalent to:
1 MWh of renewable electricity generated above the power station's baseline
Properly created LGCs are validated by the Clean Energy Regulator and are able to be
transferred between eligible parties and liable parties for a negotiated price. Payment is arranged
outside the REC Registry.
LGC Trading Procedure:
LGCs are created and registered in the REC Registry: LGCs are created in the REC Registry
by the registered person for the accredited renewable energy power station. The LGC record,
including ownership and status is available in the REC Registry. To be eligible to create LGCs,
power stations must generate their electricity from approved renewable energy sources such as
solar energy, wind, ocean waves and tides, geothermal-aquifers, wood waste, agricultural waste,
bagasse (sugar cane waste), black liquor (a by-product of the paper-making process), or landfill
gas.
LGCs must be correctly created and validated in the REC Registry before they can be made
available for purchase and/or surrender.
LGCs are sold through the open LGC market, where the price will vary according to supply and
demand and payment for LGCs is negotiated outside of the REC Registry.
Ownership must be transferred in the REC Registry. The owner of the LGCs may sell or
surrender their certificates as they wish.
While most LGCs are purchased by liable entities to fulfill their legal requirements under the
Act, anyone with an appropriate REC Registry account may trade in LGCs.
Liable entities can purchase LGCs directly from sellers including renewable energy power
stations, registered agents, individual registered persons, or from companies that sell LGCs.
Renewable energy power stations and agents usually bundle LGCs together and offer them to
liable entities at a negotiated price.

58
LGCs are usually sold to liable entities. The liable entities are required by law to surrender a set
number of LGCs to the Clean Energy Regulator in each calendar year.
Figure 7: Large Scale Generation Certificate Trading Procedure
LGCs are surrendered:
Annually to demonstrate liability compliance against the requirements of the Large-scale
Renewable Energy Target (LRET);
Voluntarily for any reason throughout the year; or
For non-compliance (such as under the relevant enforceable undertaking sections of the
Act i.e. RPP) throughout the year.
5.2.5.2 Small-scale Technology Certificates (STC)
Small-scale Technology Certificates (STCs) are created by eligible installations of Solar Water
Heaters (SWH), Air Source Heat Pump Water Heaters and Small Generation Units (SGU)
(small-scale solar photovoltaic panels, wind and hydro systems). A STC is generally equivalent
to:
1 MWh of renewable electricity deemed to be generated by Small Generation Units (solar
panel, wind or hydro system)unless the Solar Credits REC multiplier applies over the course
of its lifetime of up to 15 years; or
1 MWh of electricity deemed to be displaced by the installation of Solar Water Heaters or
Air Source Heat Pump Water Heaters over the course of its lifetime of up to 10 years.
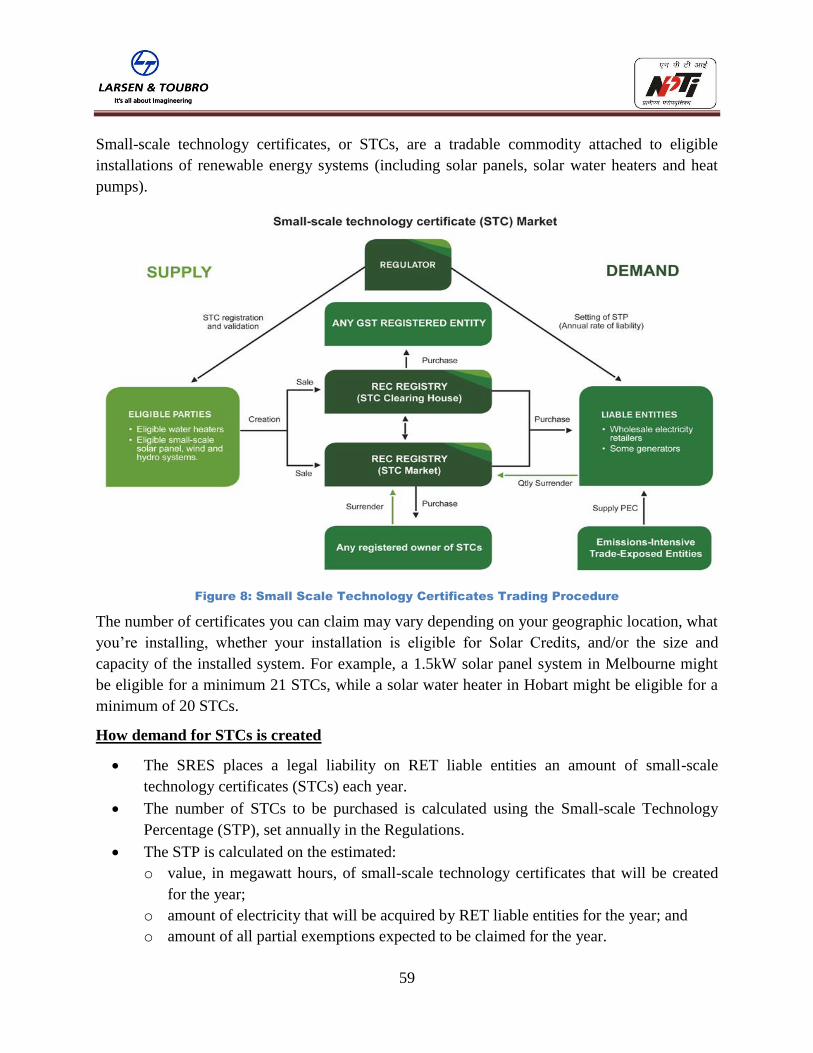
59
Small-scale technology certificates, or STCs, are a tradable commodity attached to eligible
installations of renewable energy systems (including solar panels, solar water heaters and heat
pumps).
Figure 8: Small Scale Technology Certificates Trading Procedure
The number of certificates you can claim may vary depending on your geographic location, what
you’re installing, whether your installation is eligible for Solar Credits, and/or the size and
capacity of the installed system. For example, a 1.5kW solar panel system in Melbourne might
be eligible for a minimum 21 STCs, while a solar water heater in Hobart might be eligible for a
minimum of 20 STCs.
How demand for STCs is created
The SRES places a legal liability on RET liable entities an amount of small-scale
technology certificates (STCs) each year.
The number of STCs to be purchased is calculated using the Small-scale Technology
Percentage (STP), set annually in the Regulations.
The STP is calculated on the estimated:
o value, in megawatt hours, of small-scale technology certificates that will be created
for the year;
o amount of electricity that will be acquired by RET liable entities for the year; and
o amount of all partial exemptions expected to be claimed for the year.
60
This is done each year as, under the Act, there is no target on the number of STCs to be
generated for any given year.
RET liable entities apply the annual STP to the total megawatt hours of relevant
electricity that they acquire from relevant electricity grids. This determines how many
STCs they will need to purchase for each quarter of that year.
The Clean Energy Regulator also provides RET liable entities with an estimate of
required surrender amounts for quarters 1 – 3 of each calendar year.
STCs can be:
Assigned to a registered agent (usually a retailer/installer) in exchange for a financial
benefit such as a delayed cash payment or upfront discount on $40; or
Created in the REC Registry and sold through the STC Clearing House for a fixed price
Government-guaranteed price of $40 (excl. GST).However, certificates may take some
time to clear, thus delaying payment to the seller.
While it is possible for owners of renewable energy systems to create and sell the STCs
themselves, in practice, installers of these systems usually offer a discount on the price of an
installation, or a cash payment, in return for the right to create the STCs. Householders
considering installing small-scale renewable energy systems are encouraged to shop around for
the best deal.
STCs are surrendered:
RET liable entities must surrender to the Clean Energy Regulator the STCs that they have
purchased during the year to prove they have met their required surrender amount.
When certificates are surrendered, they are marked as invalid in the REC Registry. They
cannot any longer be sold, traded, or purchased.
RET liable entities need to surrender STCs in April, July, October and February of each
calendar year, to meet their quarterly liability requirements.
If a RET liable entity does not surrender its required number of STCs in a quarter, it will
be liable to pay a shortfall charge, currently set at $65 per STC not surrendered.
Owners of STCs may also voluntarily surrender their STCs at any time. Any person with
STCs registered to them in the REC Registry can voluntarily surrender their STCs; this
includes owners, Agents and RETS liable entities.
RET Liable entities may voluntarily surrender STCs separately to their mandatory
liability set by the STP. For example, when a householder opts to use electricity from
renewable energy sources the liable entity can buy certificates equivalent to the
householder’s electricity usage and voluntarily surrender these certificates to the Clean
Energy Regulator.
Voluntary surrender creates further demand in the market for renewable energy, over and
above the mandated requirement.

61
Partial Exemption Certificates (PEC):
“A PEC can provide the liable entity with a certain number of megawatt hours (MWh) worth of
exemption from LGC and STC liability when included in their annual reporting”.
The Act and Regulations include provisions to provide partial exemption from LRET and SRES
liability for electricity used in prescribed emissions-intensive trade-exposed (EITE) activities.
Such activities include production of glass containers and bulk flat glass, integrated production
of lead and zinc, manufacture of newsprint and carton board, and petroleum refining. There A
full list of eligible EITE activities is included in Schedule 6 of the Renewable Energy
(Electricity) Regulations 2001, and summarized in the RET EITEs section of the Clean Energy
Regulator website. There are currently more than 30 activities in the Schedule.
In order to receive exemption, companies that carry on RET-based EITE activities must apply
annually to the Clean Energy Regulator for a Partial Exemption Certificate (PEC) and trade the
PEC to the named liable entity, at a value negotiated between the EITE company and the liable
entity. The RET legislation and regulations provides partial exemptions from RET for electricity
used in defined EITE activities. There are various EITE activities mentioned in the Act which
can apply for the PEC. The entities involved in such EITE activities shall apply for PEC to
ORER. Some of these EITE’s comes directly under the scope of RET as wholesale purchasers of
electricity while most of them comes under the indirect purview of the retailers. Thus it is
envisaged that the entity to whom PEC is issued will voluntarily submit a copy of PEC to its
electricity retailer for the purchase of RET liable electricity for EITE. This retailer while
surrendering its obligation could use this PECs to attain an exemption from the proportion of
liability it holds for the year. Thus the total relevant acquisitions could be defined as difference
between the relevant acquisitions made and PECs presented by the obligated entity.
Solar Credits:
‘Solar Credits are provided in the form of additional tradable certificates called small-scale
technology certificates (STCs) for eligible small-scale renewable energy systems including solar
photovoltaic (PV) systems’.
The Solar Credits mechanism under the small-scale component of the RET (called the Small-
scale Renewable Energy Scheme or SRES) provides additional upfront support to households,
businesses and community groups that install small-scale renewable energy generation systems
by multiplying the number of tradable certificates able to be created for eligible installations. The
Solar Credits multiplier reduces over time, reflecting reductions in rooftop solar panel costs.
Solar Credit is a mechanism which increases the no. of STCs which can be created for eligible
installations under SRES scheme by multiplying the no. of certificates for which the system
would normally be eligible. It is applicable for the first 1.5 kW of on grid capacity installed and
20 KWs of off grid systems installed.

62
Generation from capacity above 1.5 kW (on-grid), or 20kW (off-grid), either on the original
system or on any additional capacity installed at a later date, is eligible for one (1) STC per
MWh of generated power.
Table 8: Schedule of Solar Credits Multipliers (Source: ORER)
Date
Installed
1st
JAN 2011 –31 Dec
2012
1st
Jan 2012 –30 June
2012
1st
July 2012 – 31 Dec
2012
Multiplier 5 3 2
For systems installed from 1 July 2012 to 31 December 2012, the multiplier is two. The standard
rate of STC creation (a multiplier of one) will apply for systems installed from 1 January 2013.
Amendments to the RET scheme regulations are to be put in place before the end of 2012 to
implement the early phase-out of the multiplier. These amendments are to include arrangements
to preserve legally binding contracts to install supported systems entered into before 16
November 2012, and made on the basis of the current rules (which include a solar credits
multiplier of two).
Solar credit can be created only once for a particular installation. Eligibility conditions for solar
credits are:
Solar PV systems up to 100 KWs.
Small wind turbine up to 10 KWs.
Micro-hydro system up to 6.4 KWs.
Installations should be at eligible premises.
No more than one system at eligible premises is entitled to solar credits.
System should be new and complete.
Application should be made within the 12 months from the date of commissioning.
The table below sets out the indicative level of support that would be provided through creation
and sale of tradable small-scale technology certificates (STCs) under the SRES for a 3kW solar
panel system installed across Australia considering $32 per certificate price with different Solar
Credits support depending on the date and location.
Table 9: Solar Credits Calculation
City 2 x Solar Credits multiplier (systems installed
up to 31 December 2012)
No Solar Credits multiplier (systems
installed from 1 January 2013)
STC Approximate support STC Approximate support
Adelaide $2,976 62 $1,984
Brisbane $3,296 $2,208

63
5.2.6 Failed Certificates
During an audit process, small-scale technology certificates (STCs) and large-scale generation
certificates (LGCs) are sometimes failed by the Clean Energy Regulator.
1. The main reasons STCs are failed are:
(a).Home-owner receiving pre-approval for the following Federal Government rebates for their
solar panel installation. Under the Act they cannot receive solar credits if they have pre-approval
for the following:
Solar Homes and Communities Plan
Renewable Remote Power Generation
National Solar Schools Program
Photovoltaic Rebate Program
(b).Systems are found to be second hand
2. The main reasons LGCs are failed are:
Over-creation of amount of LGCs the power station was eligible for.
LGCs created under the wrong fuel source.
LGCs created under the wrong time-frame. For example, LGCs are improperly created in
the wrong month.
Electricity data adjustment. In this case meter data that was sent to the Clean Energy
Regulator to support LGC creations was adjusted which resulted in the under/over-
creation of LGCs.
Renewable Obligation
There are two different obligations set under LRET and SRES schemes. Renewable Power
Percentage (RPP) under LRET and Small Scale Technology Percentage (STP) under SRES
schemes places a legal liability on liable entities typically electricity retailers and wholesale
purchasers of electricity to source certain amount of their purchase through renewable energy by
purchase of LGC and STC every year. RPP and STP are set on the basis of:
Required RE target of year.
Estimated amount of electricity to be acquired by the liable entities for the year.
Estimated amount of Partial Exemption Certificates (PEC) to be claimed for the year.
Under/over surrender of LGCs and STCs in previous year.
The RPP and STP for the year 2013 is 10.65% equivalent to 19.088 million LGCs and 19.7%
equivalent to 35.7 million Small-scale Technology Certificates (STCs) as a proportion of total

64
estimated electricity consumption, both the percentage obligations are published before 31st
of
March 2103 every year on ORER‟s website. The entities which fail to comply with their
obligations are supposed to pay a corresponding Renewable Energy Shortfall Charge (RESC).
RESC was set by Renewable Energy (Electricity) (Charge) Act 2000 which has now been
replaced by Large Scale Generation Shortfall Charge (LGSC) and Small Scale Technology
Shortfall Charge (STSC) applicable under “The Renewable Energy (Electricity) (Large Scale
Generation Shortfall Charge) Act 2000” and “The Renewable Energy (Electricity) (Small Scale
Technology Shortfall Charge) Act 2010” respectively. The respective LGSC and STSC charge
set are $65/LGC and $65/STC for compliance years from 2011 to 2030. The methodology
adopted for LGSC calculation under the Act is explained below:
LGSC CALCUALTION
Liable Entity’s large-scale generation shortfall for a year is calculated:
LGSC = [(X – Y)] *Z (rounding the result to the nearest MWh)] + A – B
X = Total MWh during the year
Y = Amount of partial exemption
Z = RPP
A = Shortfall carried forward (+)/surplus (-)
B = Large Scale generation certificates
SURPLUS: LGSC less than zero.
SHORTFALL: LGSC greater than zero.
STSC CALCULATION:
Liable Entity’s small-scale generation shortfall for a year is calculated:
First Quarter :( 0.35 x X1 x Y1 round to nearest MWh) - (Z1 + A1) = R1
Second Quarter: (0.25 x X2 x Y2 round to nearest MWh) - (Z2 + A2) = R2
Third Quarter: (0.25 x X3 x Y3 round to nearest MWh) - (Z3 + A3) = R3
Fourth Quarter: (X1 + X2 + X3) - (X4 x Y4 round to nearest MWh) = C
If C is greater than 0: C – (A+B) = R4

65
If C if less than 0: C + (A + B) = R4
Where,
X1, X2, X3, X4 = previous years reduced acquisitions.
Y1, Y2, Y3, Y4= small scale technology percentage for the assessment year.
Z1, Z2, Z3, Z4 = Small Scale Technology certificates surrendered for first, second, third, fourth
quarter surrender period respectively.
A1, A2, A3, A4 = amount of the quarterly surplus that the liable entity has for the first quarter.
R1, R2, R3, R4 = First, Second, Third, Fourth Quarter Result respectively.
SHORTFALL: If R1, R2, R3, C is greater than zero here is a shortfall for 1st, 2nd, 3rd, 4thquarter.
SURPLUS: If R1, R2, R3, C are smaller than zero there is a surplus for 1st, 2nd, 3rd, 4thquarter.
As per section 95(2) of The Renewable Energy (Electricity) Act 2000, STSC is not redeemable
whereas LGSC can be redeemed within 3 years. The respective redeemable conditions for LGSC
are:
The redeemable period starts soon after the liable entity lodges the large scale generation
shortfall statement for the year after the charge year and ends 3 years after the liable
entity paid the large scale generation shortfall charge.
Liable entity must specify the charge year in respect of which it is surrendering the
LGCs.
Value of LGC surrendered for the purpose will be equivalent to LGSC charge paid
earlier.
Total LGC value surrendered for redeeming previous LGSC must not exceed the amount
of LGSC paid by the liable entity for that year.

66
6 CONCLUSION AND RECOMMENDATION
6.1 CONCLUSION:
India is a nation in transition. Considered an "emerging economy," increasing GDP is driving the
demand for additional electrical energy, as well as transportation fuels. India is blessed with vast
resources of renewable energy in solar, wind, biomass and small hydro. In fact, the technical
potential of these renewables exceeds the present installed generation capacity. For increased
demand of the power in the country with industrialization and economic growth, the country
needs to scale up the power generation. For this the government has come up with new
initiatives in promoting the renewable sector. The introduction of the REC mechanism in
the country made the transaction of RE easy and now the RPO can be met much easily.
Renewable Energy Certificates are paper instruments aiming to enhance renewable power
development by facilitating uniform dissemination of renewable sources of energy in the country
and thus simplifying compliance with renewable purchase targets. They effectively remove the
burden of developing purchase targets based on availability of resources within the states as they
allow inter-state renewable energy transactions. Renewable Energy sources should be effectively
tapped so that the energy requirement in near future can be met.
The potential of RE at the national level needs to be re-assessed urgently. In the absence of
realistic potential assessment figures, policy decisions on power generation could be skewed in
favor of conventional sources.
The huge untapped solar potential of the country is important from the point of view of energy
security. International experience shows that cost reduction can be achieved by way of mass
production and R&D efforts.
The assessment of 27 states and 6 union territories shows that NAPCC target set for the year
2013-2014 will not be achieved (will achieve 6.67% against the NAPCC target of 9%) Thus,
proposed RPO level of 10% by 2015 is achievable only if rapid supportive steps for installing RE
generation units will be taken.
67
6.2 RECOMMENDATION:
RE potential is state and site-specific, leading to a mismatch in RPO and RE availability in the
country so CERC should take necessary steps for enhancement of REC mechanism to remove
this mismatch by taking ideas from various REC mechanism supporting schemes from UK and
Australia for the same, SERCs should consider their state potential of Renewable energy while
fixing RPO.
Up to date 29 SERC have declared RPO for their obligated entities the remaining 2 SERCs
has to speed up the process of declaring RPO for obligated entities.
RE generation based incentive shall be increased so that generators will show interest to
expand their capacities.
NAPCC targets should be adopted by SERCs as minimum RPO targets to generate more
renewable energy.
All SERCs should adopt strict penalty mechanism so that obligated entities will stick to RPO
target.
As recommended by FOR, penalty mechanism should consider penalty provisions as per EA
2003 as well as financial liability in terms of Rs/kWh for RE shortfall as is being
implemented in UK and Australia so that if obligated entities are not able to fill their
obligation than they will be required to buy REC’s .
Trading margin for the trade of REC at power exchanges should be fixed at the earliest so that
trading companies will show interest in REC trading.
CERC can also follow FIT & CfD (Contract for Difference mechanism) as is being
followed in United Kingdom.
L&T can speed up putting its effort towards Rooftop Solar PV projects as CERC has
removed minimum cap restriction for claiming REC benefit and in coming year can also
allow Off-Grid RE projects to be eligible for availing REC benefit.
68
6.3 BIBLIOGRAPHY
Central Electricity Regulatory Commission (CERC) (2010). Terms and Conditions
for Recognition and Issuance of Renewable Energy Certificate for Renewable Energy
Generation Regulations, 2010, Central Electricity Regulatory Commission, New Delhi.
Central Electricity Regulatory Commission (Terms and Conditions for recognition and
issuance of Renewable Energy Certificate for Renewable Energy Generation) (Second
Amendment) Regulations, 2013. Dated: 10th of July, 2013.
Determination of Forbearance and Floor Price for the REC Framework, 2010,
Central Electricity Regulatory Commission, New Delhi.
FOR (2008). Policies on Renewable: Report, Forum of Regulation, Central
Electricity Regulatory Authority, New Delhi. Government of India (GoI)
Report given by Bridge To India on “The REC Mechanism Viability of solar projects in
India”.
National Action Plan of Climate Change (NAPCC), Government of India, New Delhi.
Ministry of New and Renewable Energy.
Report given by ABPS Infra Advisory Private Limited to Ministry of New and
Renewable Energy, June 2009.
Ministry of New and Renewable Energy, Annual Report, 2012-13
Electricity Act, 2003, Government of India
Australian Governments Clean Energy Regulators Report on LRET and SRES.
RES, Policy, Legislation: http://www.reshaping-res-policy.eu
IEX WBSITE:http://www.iexindia.com/Reports/RECData.asx
PXIL WEBSITE: http://www.powerexindia.com/PXIL/rec.aspx
U.K. ROC FRAME WORK : https://www.gov.uk/government/policies/increasing-the-
use-of-low-carbon-technologies/supporting-pages/the-renewables-obligation-ro
AUSTRAILA LRET: http://ret.cleanenergyregulator.gov.au/About-the-Schemes/Large-
scale-Renewable-Energy-Target--LRET-/about-lret
2012-2013 ANNUAL REGULATORY PLAN AUSTRIALIA:
http://www.climatechange.gov.au./annual-regulatory-plan-2012-13
AUSTRAILIA SOLAR CREDITS: http://ret.cleanenergyregulator.gov.au/Solar-
Panels/Solar-Credits/transitionals
RET TARGET AUSTRAILIA: http://www.climatechange.gov.au./reducing-
carbon/renewable-energy/renewable-energy-target/enhanced-renewable-energy-target

69
6.4 ANNEXURE
ANNEXURE 1: CENTRAL ELECTRICITY REGULATORY COMMISSION, NEW DELHI
Petition No. 142/2011 (Suo Motu)
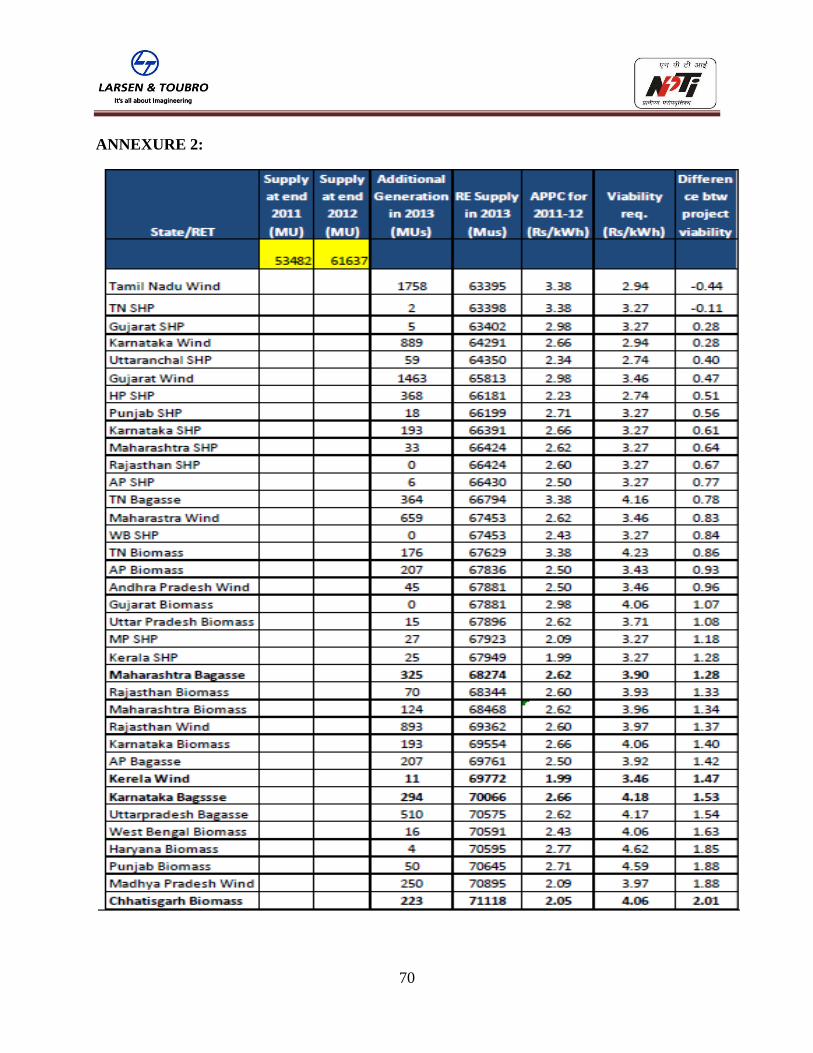
70
ANNEXURE 2:

71
ANNEXURE 3:

72
ANNEXURE 4: REC MARKET ANALYSIS: 2013-14
NAME OF
STATE
TOTAL
ENERGY
REQUIRED
(MU)
RPO OF
STATE
(%)
SPO OF
STATE
(%)
NON SOLAR
RE
PROCUREMEN
T
(MU)
SOLAR RE
PROCUREMENT
(MU)
TOTAL RE
PROCUREMENT
(MU)
ANDHRA PRADESH
109293 4.75 0.25 5191.418 273.2325 5464.65
ARUNACHAL PRADESH
655 0.00 0 0 0 0
ASSAM 7031 4 0.15 284.7555 10.5465 295.302
BIHAR 15628 3.75 0.25 586.05 39.07 625.12 CHHASTISGAR
H 21410 5.25 0.5 1124.025 107.05 1231.075
D.N. HAVELI 5315 2.6 0.4 138.19 21.26 159.45
DAMAN & DIU 2115 2.6 0.4 54.99 8.46 63.45
DELHI 26910 3.25 0.15 874.575 40.365 914.94
DVC 19605 2.6 0.4 509.73 78.42 588.15
GOA 3219 2.6 0.4 83.694 12.876 96.57
GUJRAT 76808 5.5 6 4224.44 4608.48 8832.92
HARYANA 44700 2 0.05 894 22.35 916.35 HIMACHAL PRADESH
9425 10 0.25 942.5 23.5625 966.0625
JAMMU & KASHMIR
16240 4.75 0.25 771.4 40.6 812
JHARKHAND 8609 3 1 258.27 86.09 344.36
KARNATAKA 75947 10.25 0.25 7784.568 189.8675 7974.435
KERELA 22384 3.65 0.25 817.016 55.96 872.976 MADHYA PRADESH
59431 3.4 0.6 2020.654 356.586 2377.24
MAHARASTRA 118455 7.75 0.25 9180.263 296.1375 9476.4
MANIPUR 596 4.75 0.25 28.31 1.49 29.8
MEGHALAYA 1905 0.6 0.4 11.43 7.62 19.05
MIZORAM 430 6.75 0.25 29.025 1.075 30.1
NAGALAND 591 7.75 0.25 45.8025 1.4775 47.28
ORISSA 27130 5.35 0.15 1451.455 40.695 1492.15
PUDUCHERRY 2451 2.6 0.4 63.726 9.804 73.53
PUNJAB 50850 2.83 0.07 1439.055 35.595 1474.65
RAJASTHAN 59770 6.35 0.75 3795.395 448.275 4243.67

73
SIKKIM 531 0 0 0 0 0
TAMIL NADU 99765 8.95 3 8928.968 2992.95 11921.92
TRIPURA 1216 1.9 0.1 23.104 1.216 24.32 UTTAR
PRADESH 97785 5 1 4889.25 977.85 5867.1
UTTARAKHAND
12455 6 0.05 747.3 6.2275 753.5275
WEST BENGAL 48489 3.75 0.25 1818.338 121.2225 1939.56
TOTAL 1047144 59011.69 10916.41 69928.11