August 2008 Issue Brief - Commonwealth Fund
12
Issue Brief AUGUST 2008 This and other Commonwealth Fund publications are online at www.commonwealthfund.org. To learn more about new publications when they become available, visit the Fund’s Web site and register to receive e-mail alerts. Commonwealth Fund pub. 1164 Vol. 42 Seeing Red: The Growing Burden of Medical Bills and Debt Faced by U.S. Families MICHELLE M. DOTY, S ARA R. COLLINS , S HEILA D. RUSTGI , AND J ENNIFER L. KRISS ABSTRACT: Analysis of the 2007 Commonwealth Fund Biennial Health Insurance Survey finds the proportion of working-age Americans who struggled to pay medical bills and accumulated medical debt climbed from 34 percent to 41 percent, or 72 million people, between 2005 and 2007. In addition, 7 million adults age 65 and older had these problems, bringing the total to 79 million adults with medical debt or bill problems. All income groups reported an increase. Families with low or moderate incomes were particularly hard hit, as were adults who had gaps in health coverage or those underinsured. Because of medical bills or accumulated medical debt, an estimated 28 million adults reported they used up all their savings, 21 million incurred large credit card debt, and another 21 million were unable to pay for basic necessities. Sixty-one percent of those with medical debt or bill problems were insured at the time care was provided. OVERVIEW As health care costs continue to rise and adequate health insurance becomes increasingly unaffordable, many families across the United States are having problems paying for their medical care. 1 High out-of-pocket health spending and sluggish growth in real incomes are contributing to the rise of medical debt 2 and personal bankruptcies, forcing many families to make hard choices among life’s necessities. All too often, health insurance and health care are sacrificed along the way. 3 Drawing from the Commonwealth Fund 2005 and 2007 Biennial Health Insurance Surveys, this study estimates the prevalence and recent growth of medical bill problems and accrued medical debt among nonelderly U.S. adults (ages 19 to 64). 4 Our analysis finds that in 2007, 41 percent of this population— an estimated 72 million people—had problems with payment of medical bills, accrued debt, or both. This represents a significant increase since 2005. For more information about this study, please contact: Michelle M. Doty, Ph.D. Director of Survey Research The Commonwealth Fund E-mail [email protected]
Transcript of August 2008 Issue Brief - Commonwealth Fund

Issue BriefAugust 2008
This and other Commonwealth Fund publications are online at www.commonwealthfund.org. To learn more about new publications when they become available, visit the Fund’s Web site and register to receive e-mail alerts.
Commonwealth Fund pub. 1164 Vol. 42
Seeing Red: The Growing Burden of Medical Bills and Debt Faced by U.S. Families
Michelle M. Doty, Sara r. collinS, Sheila D. ruStgi, anD Jennifer l. KriSS
ABSTRACT: Analysis of the 2007 Commonwealth Fund Biennial Health Insurance Survey finds the proportion of working-age Americans who struggled to pay medical bills and accumulated medical debt climbed from 34 percent to 41 percent, or 72 million people, between 2005 and 2007. In addition, 7 million adults age 65 and older had these problems, bringing the total to 79 million adults with medical debt or bill problems. All income groups reported an increase. Families with low or moderate incomes were particularly hard hit, as were adults who had gaps in health coverage or those underinsured. Because of medical bills or accumulated medical debt, an estimated 28 million adults reported they used up all their savings, 21 million incurred large credit card debt, and another 21 million were unable to pay for basic necessities. Sixty-one percent of those with medical debt or bill problems were insured at the time care was provided.
OveRviewAs health care costs continue to rise and adequate health insurance becomes increasingly unaffordable, many families across the United States are having problems paying for their medical care.1 High out-of-pocket health spending and sluggish growth in real incomes are contributing to the rise of medical debt2 and personal bankruptcies, forcing many families to make hard choices among life’s necessities. All too often, health insurance and health care are sacrificed along the way.3
Drawing from the Commonwealth Fund 2005 and 2007 Biennial Health Insurance Surveys, this study estimates the prevalence and recent growth of medical bill problems and accrued medical debt among nonelderly U.S. adults (ages 19 to 64).4 Our analysis finds that in 2007, 41 percent of this population—an estimated 72 million people—had problems with payment of medical bills, accrued debt, or both. This represents a significant increase since 2005.
For more information about this study, please contact:
Michelle M. Doty, Ph.D.Director of Survey ResearchThe Commonwealth FundE-mail [email protected]

2 the coMMonwealth funD
While families with low or moderate incomes were particularly hard hit, all income groups were affected. And while rates of medical bill problems and debt are highest among the uninsured, people with coverage hardly go unscathed. In fact, about 60 per-cent of adults who had coverage all year but were “underinsured”—that is, their out-of-pocket medical expenses or deductibles were high relative to their income5—reported medical bill problems, more than double the rate for those who had adequate coverage all year (26%).
Notably, adults age 65 or older were far less likely than working-age adults to report medical bill problems or debt (Table 1). Only 19 percent of seniors—half the rate for people under 65 (41%)—reported any medical bill problems or debt. Nearly all seniors have Medicare, which, combined with supplemental private coverage or Medicaid (for those with low income), provides substantial financial protection.
Overall, an estimated 79 million people over the age of 18, including 7 million elderly adults and 72 million adults ages 19 to 64, reported medical bill problems or accumulated medical debt. Given the link between being uninsured or underinsured and having financial problems related to medical bills, the remain-der of this issue brief focuses on the 19-to-64 age group, the segment of the population that has been most affected by gaps in coverage and high levels of cost-sharing.
UnAFFORDABle MeDiCAl BillSOver the last two years, U.S. adults have become increasingly hard-pressed to pay their medical bills. The survey asked respondents whether they had expe-rienced problems with medical bills over the past year, including if there were times when they had difficulty paying bills or were unable to pay them, whether they had been contacted by a collection agency concerning outstanding medical bills, or whether they had to change their lives significantly to pay their bills. The survey also asked respondents whether they were pay-ing off medical debt over time. In 2007, more than two of five (41%) adults ages 19 to 64, or 72 million peo-
ple, reported any one of those problems—up from 34 percent in 2005 (Figure 1, Table 2). This increase occurred across all income groups but was sharpest for families with low or moderate incomes: more than half of adults with incomes below $40,000 reported prob-lems with their medical bills in 2007.
Over the two-year period, people experienced increases in all the types of bill payment problems that were examined. In 2007, 27 percent of adults said they had problems paying or were unable to pay their bills, up from 23 percent in 2005, and 18 percent said they had to change their way of life in order to pay their bills, up from 14 percent in 2005. In 2007, 16 percent also reported they had been contacted by a collection agency about bills that had not been paid, compared with 13 percent in 2005 (Figure 2).6
MeDiCAl DeBT: A GROwinG PROBleM Between 2005 and 2007, the share of adults who said that they were paying off medical bills over time rose significantly. Twenty-eight percent of adults, or 49 million people, said they were paying off medical debt in 2007, up from 21 percent, or 37 million, in 2005 (Figure 2). As a result, an estimated 12 million more working-age adults were grappling with medical debt in 2007 than in 2005.
Many individuals who are paying off their medical bills over time carry substantial debt loads.
Figure 1. Problems with Medical Bills orAccrued Medical Debt Increased, 2005–2007
Note: Income refers to annual income. In 2005 and 2007, low income is <$20,000, moderate income is $20,000–$39,999, middle income is $40,000–$59,999, and high income is $60,000 or more.Source: The Commonwealth Fund Biennial Health Insurance Surveys (2005 and 2007).
75
50
25
0Total Low Moderate Middle High
income income income income
2005 2007
56
41
Percent of adults ages 19–64 with medical bill problems or accrued medical debt
32
2025
3948
53
4334

Seeing reD: the growing BurDen of MeDical BillS anD DeBt faceD By u.S. faMilieS 3
One-quarter (24%) of adults who were paying off medical bills reported that they were carrying more than $4,000 in debt, and 12 percent had $8,000 or more (Figure 3). Adults who were uninsured for any time during the year had the highest debt loads: more than one-third (34%) of those who were uninsured at the time of the survey and one-quarter (24%) of those who were uninsured for a time in the past year reported debt of $4,000 or more, and 20 percent and 13 percent, respectively, had $8,000 or more in debt. In addition, many people are carrying debt incurred over multiple years: more than one-third (37%) of adults with medi-cal debt had overdue bills from care received more than one year ago, and 8 percent were paying bills from both the previous year and earlier years.
The UninSUReD AnD UnDeRinSUReD ARe BURDeneD MOST By MeDiCAl DeBTAdults who were uninsured for any part of the year reported higher rates of medical bill problems and debt than those who were insured all year long. However, people who had coverage all year but were underin-sured—meaning they were insured but reported high out-of-pocket medical expenses or deductibles relative to their income7—reported medical bill problems at similar rates to those who were uninsured for any part of the year (Figure 4). In 2007, three of five adults who were uninsured or underinsured reported medical bill problems or accrued medical debt—more than double the rate of those who had adequate insurance all year (26%).
COnSeqUenCeS OF UnPAiD MeDiCAl BillS AnD DeBTConfronted with medical bills and debt, many people are forced to make tradeoffs in their spending and sav-ing priorities. The survey asked respondents whether they had to make certain adjustments or sacrifices in the past two years because of medical bills. A signifi-cant number of adults with medical debt and unpaid bills—an estimated 28 million—said they used up all their savings because of medical bills (Table 2). Meanwhile, an estimated 21 million adults incurred large credit card debt, and another 21 million were unable to pay for basic necessities like food, heat, or rent because of medical bills. Close to 8 million adults
Figure 3. Uninsured Adults Are More Likely to Be Paying Off Large Amounts of Medical Debt Over Time
Source: The Commonwealth Fund Biennial Health Insurance Surveys (2007).
Percent of adults ages 19–64 who are paying off medical bills over time
Uninsured Anytime in Past Year
Total Insured all year
Insured now,time uninsured
in past year Uninsured
now
How much are the medicalbills that are being paid offover time?
Less than $2,000 51% 57% 46% 38% $2,000–$3,999 21 20 25 22 $4,000–$7,999 12 11 11 14 $8,000 or more 12 9 13 20
Was this for care received in past year or earlier?
Past year 54 57 53 43 Earlier year 37 38 37 44 Both 8 7 9 12
Figure 4. Sixty Percent of Underinsured or Uninsured Adults Reported Medical Bill Problems or Debt
*Includes only those individuals who had a bill sent to a collection agency when they were unable to pay it.Source: The Commonwealth Fund Biennial Health Insurance Survey (2007).
75
50
25
0
Percent of adults ages 19–64
Not able to pay medical bills
Contacted by collection agency*
Had to change way of life to pay medical
bills
Medical bills/ debt being paid
off over time
Any medical bill problem or
outstanding debt
Uninsured during year
13
48
2923
8
43
8
3136
47
2619
32
6161
Insured, not underinsured Underinsured
Figure 2. Medical Bill Problems and Accrued Medical Debt, 2005–2007
Source: The Commonwealth Fund Biennial Health Insurance Surveys (2005 and 2007).
Percent of adults ages 19–64
2005 2007 In the past 12 months:
Had problems paying or unable to pay medical bills
23% 39 million
27% 48 million
Contacted by collection agency for unpaid medical bills
13% 22 million
16% 28 million
Had to change way of life to pay bills 14% 24 million
18% 32 million
Any of the above bill problems 28% 48 million
33% 59 million
Medical bills being paid off over time 21% 37 million
28% 49 million
Any bill problems or medical debt 34% 58 million
41% 72 million

4 the coMMonwealth funD
reported that medical bills caused them to take out a mortgage against their home or take out a loan.
Such tradeoffs were especially common among adults who were uninsured for any time or were under-insured (Figure 5). Nearly half of working-age adults with bill problems or debt who had spent any time without coverage had used up all their savings to pay for medical bills, and two of five were unable to pay for food, heat, or rent. Underinsured adults made simi-lar tradeoffs: 46 percent said they had used all their savings, 33 percent took on credit card debt, and 29 percent were unable to pay for basic necessities.
inSURAnCe DOeS nOT GUARAnTee PROTeCTiOnThe fact that American families can have health insur-ance year-round and still experience financial stress related to medical bills highlights the important role of insurance benefit design in ensuring financial protec-tion. Gaps in benefits and substantial cost-sharing can undermine family finances in ways similar to having no insurance.8 Indeed, the study finds an association between having medical bill problems or accrued debt and having a health insurance plan that lacks prescrip-tion drug or dental care coverage, or a plan that fea-
tures high deductibles. Forty-four percent of working-age adults without prescription and dental coverage reported medical bill and debt problems, compared with 29 percent who had both of these benefits (Figure 6, Table 3). And more than half (53%) of adults who had deductibles that equaled or exceeded 5 percent of their income, compared with one-third (33%) of adults with lower deductibles, incurred medical bill burdens and debt.
Substantial cost-sharing relative to income can also erode family finances. Nearly six of 10 work-ing-age adults (59%) whose insurance premiums consumed 10 percent or more of their household income reported medical bill problems or debt. These kinds of difficulties occurred half as often (30%) among adults who spent a lower percentage of their income on premiums.
Survey respondents who reported limitations in their health plan benefits experienced medical bill and debt problems at a rate double that experienced by those without such limitations. For example, two-thirds (65%) of continuously insured adults who had incurred expensive medical bills for services that their plan did not cover reported that they had problems paying these bill or had resulting debt; in contrast, 22 percent of adults who did not have uncovered services
Figure 5. More Than One-Quarter of Adults Under Age 65with Medical Bill Burdens and Debt
Were Unable to Pay for Basic Necessities
Source: The Commonwealth Fund Biennial Health Insurance Surveys (2007).
Percent of adults ages 19–64 with medical bill problemsor accrued medical debt
Insured All Year Uninsured Anytime During Year
Percent of adults reporting: Total
No underinsured
indicators Underinsured
Insured now, time uninsured
in past year Uninsured
now
Unable to pay for basic necessities (food, heat, or rent) because of medical bills
29% 16% 29% 42% 40%
Used up all of savings 39 26 46 46 47
Took out a mortgage against your home or took out a loan
10 9 12 11 11
Took on credit card debt 30 28 33 34 26
Insured at time care was provided 61 80 82 46 24
Figure 6. Insured Adults with Less Comprehensive Coverage and Benefit Limits Are More Likely to Face
Medical Bill and/or Debt Problems
Source: The Commonwealth Fund Biennial Health Insurance Surveys (2007).
Percent of continually insured adults ages 19–64 with bill and/or debt problems
MD did not charge more than insurance covered MD charged more than insurance would pay;
patient paid difference Health plan does not limit total dollar amount
Health plan limits total dollar amount
Annual premium is less than 10% of income Annual premium is 10% or more of income
Deductible is less than 5% of income Deductible is more than 5% of income
Has both Rx and dental coverage Has neither Rx nor dental coverage
No expensive bills for services not covered Had expensive medical bills for services not
covered by insurance
0 25 50 75
43
65
56
59
53
4429
27
24
22
30
33

Seeing reD: the growing BurDen of MeDical BillS anD DeBt faceD By u.S. faMilieS 5
experienced these same problems. Also, more than half (56%) of adults who indicated that their doctor charged more than what their insurance would pay for their care reported medical bill burdens and debt. Finally, 43 percent of continuously insured adults whose health plans limited the total amount they could spend incurred medical bill problems and unpaid debt, compared with 27 percent of adults who did not have total-dollar limits. Even after adjusting for other important factors (such as poverty status, health status, race/ethnicity, age, and gender), having insurance ben-efits that are less-than-comprehensive remains a signif-icant predictor of medical bill problems and medical debt (data not shown).
A ChAllenGe TO POliCyMAkeRSDuring a period when average incomes barely budged in the U.S. and working families took on record amounts of household debt relative to income, gaps and inadequacies in the nation’s health insurance sys-tem further strained family budgets.9 In 2007, 72 mil-lion adults under age 65, or 41 percent of that popula-tion, reported a problem paying their medical bills or had accrued medical debt, up from 58 million, or 34 percent, in 2005. This increase occurred across all income groups, but families with low or moderate incomes were particularly hard hit: more than half of adults with incomes below $40,000 reported problems paying their medical bills or medical debt in 2007. An estimated 49 million adults said they were paying off medical bills over time, of whom 24 percent were car-rying medical debt balances of $4,000 or more.
The financial consequences of medical bill bur-dens are often dire. Because of medical bills or accu-mulated medical debt, an estimated 28 million adults used up all their savings; 21 million incurred large
credit card debt; 21 million were unable to pay for basic necessities like food, heat, or rent; and 8 million took out a mortgage against their home or took out another loan as a result of medical debt. Medical debt is affecting the lives of working Americans, and push-ing more families to the edge of financial crisis.
The people most at risk are the uninsured, but even those who have insurance reported problems with medical bills and accrued debt. Sixty-one percent of those with medical bill problems or accumulated medi-cal debt reported being insured at the time care was provided. For millions of U.S. families, the trend toward greater cost-sharing in employer-based health plans—particularly in the form of higher deductibles, which have more than doubled since 2000—has broad-ened their exposure to health care costs. Combined with sluggish income growth, this exposure to high out-of-pocket costs relative to income means many Americans are effectively underinsured. Twenty-five million adults under age 65 were underinsured in 2007, up from 16 million in 2003.10 Three of five underinsured adults reported medical bill problems in the study, the same rate as adults who were without coverage during the year. In addition, people who identified limitations or coverage gaps in their health plans reported medical bill problems and accrued debt at higher rates than those whose plans did not have limits.
The findings of this study underscore the urgent need for policymakers to expand health insurance cov-erage to everyone in America. But the fact that mil-lions of Americans are insured but have nonetheless fallen deeply into medical debt is a vivid reminder that the content, cost-sharing, and financial protection of health insurance must also be addressed in any health reform plan.

6 the coMMonwealth funD
noteS
1 S. R. Collins, J. L. Kriss, M. M. Doty, and S. D. Rustgi, Losing Ground: How the Loss of Adequate Health Insurance Is Burdening Working Families, Findings from the Commonwealth Fund Biennial Health Insurance Sur-veys, 2001–2007 (New York:The Commonwealth Fund, Aug. 2008); C. Schoen, S. R. Collins, J. L. Kriss, and M. M. Doty, “How Many Are Underinsured? Trends Among U.S. Adults, 2003 and 2007,” Health Affairs Web Exclusive (June 10, 2008):w289–w309; C. Schoen, M. M. Doty, S. R. Collins, and A. L. Holmgren, “Insured But Not Protected: How Many Adults Are Underinsured?,” Health Affairs Web Exclusive (June 14, 2005):w5-289– w5-302; S. Heffler, S. Smith, S. Keehan et al., “U.S. Health Spending Projections for 2004–2014,” Health Affairs Web Exclusive (Feb. 23, 2005):w5-74–w5-85.
2 H. T. Tu, Rising Health Costs, Medical Debt, and Chronic Conditions, Issue Brief No. 88 (Washington, D.C.: Center for Studying Health System Change, Sept. 2004); J. H. May and P. J. Cunningham, Tough Trade-Offs: Medical Bills, Family Finances and Access to Care, Issue Brief No. 85 (Washington, D.C.: Center for Studying Health System Change, June 2004); D. U. Himmelstein, E. Warren, D. Thorne et al., “Illness and Injury as Contribu-tors to Bankruptcy,” Health Affairs Web Exclusive (Feb. 2, 2005):w5-63–w5-73; T. P. O’Toole, J. J. Arbelaez, R. S. Lawrence et al., “Medical Debt and Aggressive Debt Restitution Practices: Predatory Billing Among the Urban Poor,” Journal of General Internal Medicine, July 2004 19(7):772–78; S. R. Collins, M. M. Doty, K. Davis, C. Schoen, A. L. Holmgren, and A. Ho, The Affordability Crisis in U.S. Health Care: Findings from the Common-wealth Fund Biennial Health Insurance Survey (New York: The Commonwealth Fund, Mar. 2004).
3 D. Dranove and M. L. Millenson, “Medical Bankruptcy: Myth Versus Fact,” Health Affairs Web Exclusive (Feb. 28, 2006):w74–w83; Himmelstein et al., “Illness and Injury,” 2005; O’Toole et al., “Medical Debt,” 2004; M. B. Jacoby, testimony at U.S. House Committee on Energy and Commerce, Subcommittee on Oversight and Investigations, hearing, “A Review of Hospital Billing and Collection Practices,” June 24, 2004.
4 This analysis is based on a 2005 Commonwealth Fund study that used data from the 2003 Commonwealth Fund Biennial Health Insurance Survey; see M. M. Doty, J. N. Edwards, and A. L. Holmgren, Seeing Red: Ameri-cans Driven Into Debt by Medical Bills (New York: The Commonwealth Fund, Aug. 2005). The ways in which the medical bill questions and debt were asked in 2003, however, differ from the 2005 and 2007 surveys and thus prevent comparison of two of the four questions as well as the composite statistic. In 2003, the survey asked only adults who reported a medical bill problem whether they were paying off debt over time. In 2005 and 2007, we asked the full sample whether they were paying off debt over time. In addition, in 2003, the survey did not distin-guish between whether someone had been contacted by a collection agency because of a bill that had not been paid or because there was a billing error. In 2005 and 2007, the survey asks respondents to distinguish between those two reasons for the contact by a collection agency. The composite statistic in 2005 and 2007 includes only adults who were contacted by a collection agency because of a bill that had not been paid. In 2003, 71 million adults ages 19 to 64 and 6 million adults 65 and over reported a medical bill problem or accrued medical debt, for an estimated total of 77 million adults.
5 Schoen et al., “How Many Are Underinsured?” 2008. Underinsured adults are individuals who are insured all year but report at least one of three indicators of financial exposure relative to income: 1) out-of-pocket medical expenses equal 10 percent or more of income; 2) among low-income adults (below 200% of the federal poverty level), medical expenses amount to at least 5 percent of income; or 3) deductibles equal or exceed 5 percent of income.
6 All increases between 2005 and 2007 are statistically significant (p<.001), except for the percent reporting they had been contacted by a collection agency about unpaid bills (p<.10).
7 See note 5.8 Schoen et al., “How Many Are Underinsured?” 2008.9 The Federal Reserve Board, Household Debt Service and
Financial Obligations Ratios; http://www.federalreserve.gov/releases/housedebt
10 Schoen et al., “How Many Are Underinsured?” 2008.

Seeing reD: the growing BurDen of MeDical BillS anD DeBt faceD By u.S. faMilieS 7
Table 1. Prevalence of Medical Bill and Medical Debt Problems Among Adults Age 19 and Older, by Insurance Status and Age
Adults 19–64 Adults 65+
Total(n=2616)
Uninsured Anytime (n=747)
Insured All Year(n=1869)
Total(n=840)
Total (millions) 177.0 49.5 127.5 36.1
Medical Bill Problems in Past Year
Had problems paying or unable to pay medical bills 27% 48% 19% 11%
Contacted by collection agency for unpaid medical bills 16 29 11 6
Had to change way of life to pay bills 18 32 12 12
Any of the above bill problems 33 56 25 16
Medical debt or bills being paid off over time 28 36 24 10
Any bill problems or medical debt 41 61 33 19
Base: Any Medical Bills Being Paid Off Over Time
How much are the medical bills that are being paid off over time?
Less than $2,000 51 41 57 61
$2,000 to less than $4,000 21 24 20 11
$4,000 to less than $8,000 12 13 11 12
$8,000 to less than $10,000 2 2 2 2
$10,000 or more 10 16 7 3
Was this for care received in past year or earlier?
Past year 54 47 57 54
Earlier year 37 41 35 35
Both 8 11 7 5
Base: Any Bill Problem or Medical Debt
Percent reporting that the following happened in the past 2 years because of medical bills:
Unable to pay for basic necessities (food, heat, or rent) 29 41 20 34
Used up all of savings 39 47 33 37
Took out a mortgage against your home or took out a loan 10 11 10 8
Took on credit card debt 30 29 30 22
Insurance status of person/s at time care was provided
Insured at time care was provided 61 32 81 71
Uninsured at time care was provided 32 59 13 23
Other insurance combination 3 3 3 2
Source: The Commonwealth Fund Biennial Health Insurance Survey (2007).
8 the coMMonwealth funD
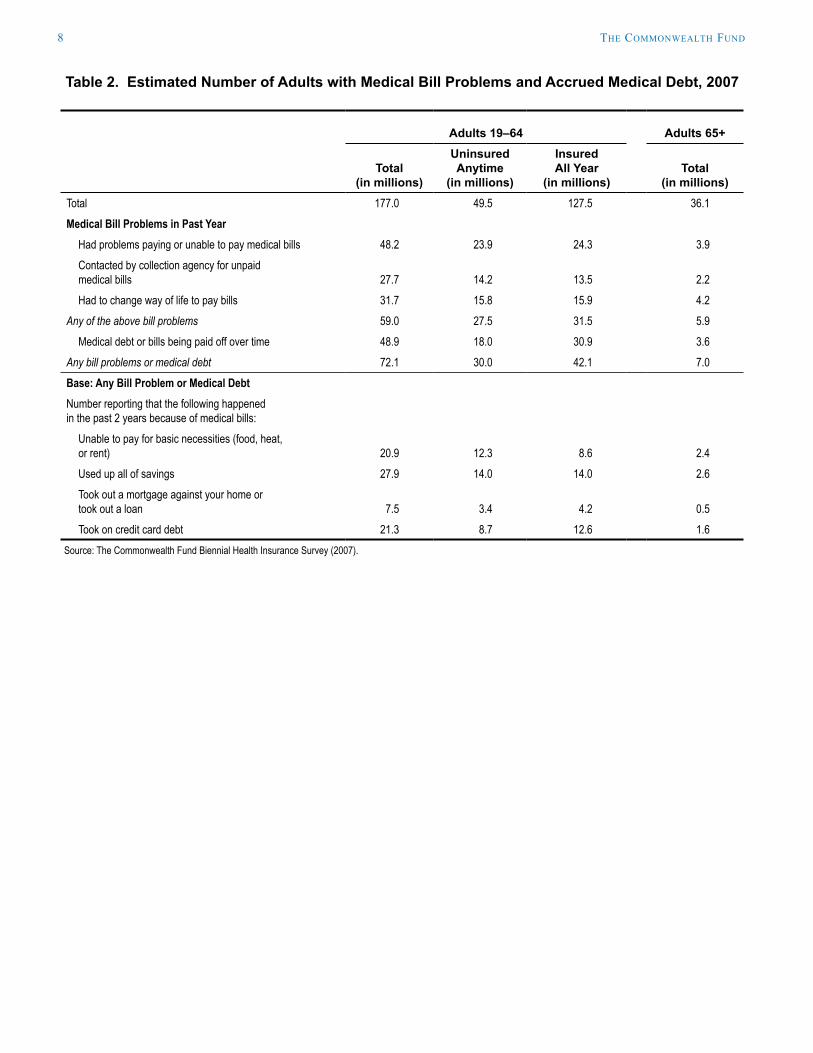
Table 2. Estimated Number of Adults with Medical Bill Problems and Accrued Medical Debt, 2007
Adults 19–64 Adults 65+
Total(in millions)
Uninsured Anytime
(in millions)
InsuredAll Year
(in millions)Total
(in millions)Total 177.0 49.5 127.5 36.1Medical Bill Problems in Past Year
Had problems paying or unable to pay medical bills 48.2 23.9 24.3 3.9Contacted by collection agency for unpaid medical bills 27.7 14.2 13.5 2.2Had to change way of life to pay bills 31.7 15.8 15.9 4.2
Any of the above bill problems 59.0 27.5 31.5 5.9Medical debt or bills being paid off over time 48.9 18.0 30.9 3.6
Any bill problems or medical debt 72.1 30.0 42.1 7.0Base: Any Bill Problem or Medical Debt Number reporting that the following happened in the past 2 years because of medical bills:
Unable to pay for basic necessities (food, heat, or rent) 20.9 12.3 8.6 2.4Used up all of savings 27.9 14.0 14.0 2.6Took out a mortgage against your home or took out a loan 7.5 3.4 4.2 0.5Took on credit card debt 21.3 8.7 12.6 1.6
Source: The Commonwealth Fund Biennial Health Insurance Survey (2007).

Seeing reD: the growing BurDen of MeDical BillS anD DeBt faceD By u.S. faMilieS 9
Table 3. Relationship Between Insurance Benefits and Medical Bill Problems and Debt Among Continuously Insured Adults Ages 19–64
Characteristics of Respondents TotalAny Medical Bill Problema
Any Medical Bill or Debt
Adults Insured All Year (in millions) 127.5 31.5 42.1Percent insured all year 72% 25% 33%Characteristics of Insurance Plan
Has neither prescription nor dental coverage 27% 36% 44%Has prescription and dental coverage 73 21 29
Deductible is 5 percent or more of household income 5b 43 53Deductible is less than 5 percent of household income 71 25 33
Annual premium is 10 percent or more of household income 16 49 59Annual premium is less than 10 percent of household income 84 21 30
Insurance Plan Difficulties and LimitsHad expensive medical bills for services not covered by insurance 26 53 65No expensive medical bills 73 15 22
Doctor charged more than insurance would pay; individual had to pay the difference 28 45 56Doctor did not charge more than insurance would pay 71 17 24
Health plan limits the total dollar amount it will pay for medical care 38c 33 43Health plan does not limit total dollar amount 41 19 27
Notes: a Problems paying or unable to pay medical bills, contacted by collection agency for inability to pay medical bills, or had to change way of life significantly in order to pay medical bills; b Values do not add to 100% because a number of respondents did not report income or a deductible amount; c Values do not add to 100% because 21 percent of respondents did not know whether their health plan limits the total dollar amount it will pay for medical care.Source: The Commonwealth Fund Biennial Health Insurance Survey (2007).

10 the coMMonwealth funD
StuDy MethoDology
Data for this study were drawn from the Commonwealth Fund Biennial Health Insurance Survey (2007), a national telephone survey conducted June 6 through October 24, 2007, among a nationally representative sam-ple of 3,501 adults age 19 and older living in the continental United States. The 25-minute telephone inter-views were completed in both English and Spanish, according to the preference of the respondent. The survey achieved a 45 percent response rate (calculated according to the standards of the American Association for Public Opinion Research).
The survey sample was drawn using standard list-assisted random-digit-dialing methodology, which selected telephone numbers disproportionately from area-code/exchange combinations with higher-than-average den-sity of low-income households. Using this stratified sampling design, this study obtained an oversample of low-income, African American, and Hispanic adults. To correct for the disproportionate sample design and to make the final total sample results representative of all adults age 19 and older living in the continental U.S., the data are weighted by age, sex, race/ethnicity, education, household size, and geographic region, using the U.S. Census Bureau’s 2006 Annual Social and Economic Supplement (ASEC). The margin of sampling error for the weighted data is +/– 2.2 percent.
We classified respondents by age and by whether they were insured all year or had any lapse in coverage dur-ing the year. There were 45 respondents who did not provide their age and were excluded from the analysis. This report includes 840 adults age 65 and older and 2,616 adults ages 19 to 64, of whom 747 were uninsured during the year and 1,869 were insured all year.

Seeing reD: the growing BurDen of MeDical BillS anD DeBt faceD By u.S. faMilieS 11
aBout the authorS
Michelle McEvoy Doty, Ph.D., director of survey research, directs survey development and analysis at The Commonwealth Fund and conducts research examining health care access and quality among vulnerable populations and the extent to which lack of health insurance contributes to barriers to health care and inequities in quality of care. She received her M.P.H. and Ph.D. in public health from the University of California, Los Angeles.
Sara R. Collins, Ph.D., is assistant vice president at The Commonwealth Fund. An economist, she is responsi-ble for survey development, research, and policy analysis, as well as program development and management of the Fund’s Program on the Future of Health Insurance. Prior to joining the Fund, Dr. Collins was associate director/senior research associate at the New York Academy of Medicine, Division of Health and Science Policy. Earlier in her career, she was an associate editor at U.S. News & World Report, a senior economist at Health Economics Research, and a senior health policy analyst in the New York City Office of the Public Advocate. She holds an A.B. in economics from Washington University and a Ph.D. in economics from George Washington University.
Sheila D. Rustgi is program assistant for the Program on the Future of Health Insurance at The Commonwealth Fund. She is a graduate of Yale University with a B.A. in economics. While in school, she volunteered in several local and international health care organizations, including Yale New Haven Hospital and a Unite for Sight eye clinic. Prior to joining the Fund, she worked as an analyst at a management consulting firm.
Jennifer L. Kriss is associate program officer for the Program on the Future of Health Insurance at The Commonwealth Fund. She is a graduate of the University of North Carolina at Chapel Hill with a B.S. in public health. While in school, she worked as an intern at a community health center and was a volunteer coordinator for a student-run health clinic. She is currently pursuing a master’s degree in epidemiology at Columbia University.
Editorial support was provided by Christopher Hollander.

The mission of The Commonwealth Fund is to promote a high performance health care system. The Fund carries out this mandate by supporting independent research on health care issues and making grants to improve health care practice and policy. The views presented here are those of the authors and not necessarily those of The Commonwealth Fund or its directors, officers, or staff.