Augmented Reality Talking Heads as a Support for Speech ...
26
0 Augmented Reality Talking Heads as a Support for Speech Perception and Production Olov Engwall Centre for Speech Technology, School of Computer Science and Communication, KTH (Royal Institute of Technology), Stockholm Sweden 1. Introduction Visual face gestures, such as lip, head and eyebrow movements, are important in all human speech communication as a support to the acoustic signal. This is true even if the speaker’s face is computer-animated. The visual information about the phonemes, i.e. speech sounds, results in better speech perception (Benoît et al., 1994; Massaro, 1998) and the benefit is all the greater if the acoustic signal is degraded by noise (Benoît & LeGoff, 1998; Sumby & Pollack, 1954) or a hearing-impairment (Agelfors et al., 1998; Summerfield, 1979). Many phonemes are however impossible to identify by only seeing the speaker’s face, because they are visually identical to other phonemes. Examples are sounds that only differ in voicing, such as [b] vs. [p], or sounds for which the difference in the articulation is too far back in the mouth to be seen from the outside, such as [k] vs. [N] or [h]. A good speech reader can determine to which viseme, i.e. which group of visually identical phonemes, a speech sound belongs to, but must guess within this group. A growing community of hearing-impaired persons with residual hearing therefore relies on cued speech (Cornett & Daisey, 1992) to identify the phoneme within each viseme group. With cued speech, the speaker conveys additional phonetic information with hand sign gestures. The hand sign gestures are however arbitrary and must be learned by both the speaker and the listener. Cued speech can furthermore only be used when the speaker and listener see each other. An alternative to cued speech would therefore be that the differences between the phonemes are directly visible in an augmented reality display of the speaker’s face. The basic idea is the following: Speech recognition is performed on the speaker’s utterances, resulting in a continuous transcription of phonemes. These phonemes are used in real time as input to a computer-animated talking head, to generate an animation in which the talking head produces the same articulatory movements as the speaker just did. By delaying the acoustic signal from the speaker slightly (about 200 ms), the original speech can be presented together with the computer animation, thus giving the listener the possibility to use audiovisual information for the speech perception. An automatic lip reading support of this type already exists, in the SYNFACE extension (Beskow et al., 2004) to the internet telephony application Skype. Using the same technology, but adding augmented reality, the speech perception support can be extended to display not only facial movements, but face and tongue movements together, in displays similar to the ones shown in Fig. 1. This type of speech
Transcript of Augmented Reality Talking Heads as a Support for Speech ...

0
Augmented Reality Talking Heads as a Supportfor Speech Perception and Production
Olov EngwallCentre for Speech Technology, School of Computer Science and Communication, KTH
(Royal Institute of Technology), StockholmSweden
1. Introduction
Visual face gestures, such as lip, head and eyebrow movements, are important in all humanspeech communication as a support to the acoustic signal. This is true even if the speaker’sface is computer-animated. The visual information about the phonemes, i.e. speech sounds,results in better speech perception (Benoît et al., 1994; Massaro, 1998) and the benefit is all thegreater if the acoustic signal is degraded by noise (Benoît & LeGoff, 1998; Sumby & Pollack,1954) or a hearing-impairment (Agelfors et al., 1998; Summerfield, 1979).Many phonemes are however impossible to identify by only seeing the speaker’s face, becausethey are visually identical to other phonemes. Examples are sounds that only differ invoicing, such as [b] vs. [p], or sounds for which the difference in the articulation is too farback in the mouth to be seen from the outside, such as [k] vs. [N] or [h]. A good speechreader can determine to which viseme, i.e. which group of visually identical phonemes,a speech sound belongs to, but must guess within this group. A growing community ofhearing-impaired persons with residual hearing therefore relies on cued speech (Cornett &Daisey, 1992) to identify the phoneme within each viseme group. With cued speech, thespeaker conveys additional phonetic information with hand sign gestures. The hand signgestures are however arbitrary and must be learned by both the speaker and the listener.Cued speech can furthermore only be used when the speaker and listener see each other.An alternative to cued speech would therefore be that the differences between the phonemesare directly visible in an augmented reality display of the speaker’s face. The basic ideais the following: Speech recognition is performed on the speaker’s utterances, resulting ina continuous transcription of phonemes. These phonemes are used in real time as inputto a computer-animated talking head, to generate an animation in which the talking headproduces the same articulatory movements as the speaker just did. By delaying the acousticsignal from the speaker slightly (about 200 ms), the original speech can be presented togetherwith the computer animation, thus giving the listener the possibility to use audiovisualinformation for the speech perception. An automatic lip reading support of this typealready exists, in the SYNFACE extension (Beskow et al., 2004) to the internet telephonyapplication Skype. Using the same technology, but adding augmented reality, the speechperception support can be extended to display not only facial movements, but face and tonguemovements together, in displays similar to the ones shown in Fig. 1. This type of speech

2 Augmented Reality
perception support is less vulnerable to automatic speech recognition errors and is thereforepreferred over displaying the recognized text string.Similarly, second language learners and children with speech disorders may have difficultiesunderstanding how a particular sound is articulated or what the difference compared toanother phoneme is. Both these groups may be helped by an augmented reality displayshowing and describing tongue positions and movements. The AR talking head displayallows a human or virtual teacher to instruct the learner on how to change the articulationin order to reach the correct pronunciation.For both types of applications, augmented reality is created by removing parts of the facialskin or making it transparent, in order to provide additional information on how the speechsounds are produced. In this chapter, we are solely dealing with computer-animated talkingheads, rather than the face of a real speaker, but we nevertheless consider this as a goodexample of augmented reality, rather than virtual reality, for two reasons: Firstly, the displayedarticulatory movements are, to the largest extent possible, real speech movements, and hencerelate to the actual reality, rather than to a virtual, and possibly different, one. Secondly,the listener’s perception of reality (the sounds produced) is enhanced using an augmenteddisplay showing another layer of speech production. In addition, many of the findings anddiscussions presented in this chapter would also be also relevant if the augmented realityinformation about tongue movements was displayed on a real speaker’s cheek.
2 Augmented Reality Talking Heads as a Support for Speech Perception and Production
information for the speech perception. An automatic lip reading support of this typealready exists, in the SYNFACE extension (Beskow et al., 2004) to the internet telephonyapplication Skype. Using the same technology, but adding augmented reality, the speechperception support can be extended to display not only facial movements, but face and tonguemovements together, in displays similar to the ones shown in Fig. 1. This type of speechperception support is less vulnerable to automatic speech recognition errors and is thereforepreferred over displaying the recognized text string.
Similarly, second language learners and children with speech disorders may have difficultiesunderstanding how a particular sound is articulated or what the difference compared toanother phoneme is. Both these groups may be helped by an augmented reality displayshowing and describing tongue positions and movements. The AR talking head displayallows a human or virtual teacher to instruct the learner on how to change the articulationin order to reach the correct pronunciation.
For both types of applications, augmented reality is created by removing parts of the facialskin or making it transparent, in order to provide additional information on how the speechsounds are produced. In this chapter, we are solely dealing with computer-animated talkingheads, rather than the face of a real speaker, but we nevertheless consider this as a goodexample of augmented reality, rather than virtual reality, for two reasons: Firstly, the displayedarticulatory movements are, to the largest extent possible, real speech movements, and hencerelate to the actual reality, rather than to a virtual, and possibly different, one. Secondly,the listener’s perception of reality (the sounds produced) is enhanced using an augmented
(a) Side view
(b) Front view (c) Back view
(d) Half head view (e) Vocal tract view
Fig. 1. Illustration of different alternatives to create the augmented reality display. (a) Skin made transparent inorder to show the movements of the articulators. Display used for the experiments described in Section 3.2. (b) Frontview with transparent skin, similar to one option in Massaro & Light (2003). (c) Viewer position inside the talkinghead, similar to one display in Massaro & Light (2003). (d) Front half of the head removed, similar to the display inBadin et al. (2008). (e) Displaying the vocal tract only, similar to the display in Kröger et al. (2008).
Fig. 1. Illustration of different alternatives to create the augmented reality display. (a) Skinmade transparent in order to show the movements of the articulators. Display used for theexperiments described in Section 3.2. (b) Front view with transparent skin, similar to oneoption in Massaro & Light (2003). (c) Viewer position inside the talking head, similar to onedisplay in Massaro & Light (2003). (d) Front half of the head removed, similar to the displayin Badin et al. (2008). (e) Displaying the vocal tract only, similar to the display in Kröger et al.(2008).

Augmented Reality Talking Heads as a Support for Speech Perception and Production 3
Since we are normally unaccustomed to seeing the movements of the tongue, the use of sucha display leads to several research questions. AR talking head displays have therefore beencreated by several research teams, in order to investigate their usefulness as a support forspeech perception or for speech production practice. This chapter will first introduce anddiscuss the different types of augmented reality displays used (Section 2) and then present aset of studies on speech perception supported by AR talking heads (Section 3). The use forspeech production practice is more briefly discussed in Section 4, before ending with a generaloutlook on further questions related to the use of AR talking heads in Section 5.
2. Augmented reality talking heads
Augmented reality displays of the face have been tested for both speech perception (Badinet al., 2008; Engwall, 2010; Engwall & Wik, 2009a; Grauwinkel et al., 2007; Kröger et al., 2008;Wik & Engwall, 2008) and speech production (Engwall, 2008; Engwall & Bälter, 2007; Engwallet al., 2006; Fagel & Madany, 2008; Massaro et al., 2008; Massaro & Light, 2003; 2004). Thesestudies have used different displays to visualize the intraoral articulation, as examplified inFig. 1 and summarized in Table 1. The list excludes the epiglottis and the larynx, which areonly shown in the studies by Badin et al. (2008) and Kröger et al. (2008).As is evident from Table 1 and Fig. 1, there are several different choices for the presentationof the AR display. It is beyond the scope of this chapter to try to determine if any set-up issuperior to others, but it may nevertheless be interesting to compare the different alternatives,as it is not evident what articulators to display and how. In addition to the tongue, allstudies show the jaw in some form, since it is needed as a reference frame to interprettongue movements and since it in itself gives important information for speech reading(Guiard-Marigny et al., 1995). One could argue that all other articulators that are relevantto speech production should be displayed as well, in order to give the viewer all the availableinformation. However, most viewers have a diffuse and superficial understanding of theintraoral anatomy and articulatory movements and may hence be confused or frightenedoff by too much detail in the display. Some articulators may also hide others if a fullthree-dimensional representation is used.Displays that show the entire 3D palate, either fully visible or semi-transparent, mayencounter problems in conveying sufficiently clear information about if and where the tonguetouches the palate, which is vital in speech production. To overcome such problems, Cohenet al. (1998) proposed to supplement the face view with a separate display that shows theregions were the tongue is in contact with the palate. This additional display would howeversplit the learner’s visual attention and it has not been used in the subsequent studies byMassaro et al. The alternative opted for by Badin et al. (2008), Engwall (2010); Engwall & Wik(2009a); Wik & Engwall (2008) and Massaro et al. (2008) is to concentrate on the midsagittaloutline of the palate to facilitate the perception of the distance between the tongue and thepalate. Engwall (2010); Engwall & Wik (2009a); Wik & Engwall (2008) simplified the displayfurther by showing the tongue and jaw moving inside a dark oral cavity, with the limit of thetransparent skin region corresponding to the palate outline (Fig. 1(a)). This choice was madesince the children who were shown a line tracing of the palate in Engwall et al. (2006) found itdifficult to interpret (they e.g., speculated that it was a small tube where the air passes in thenose). Kröger et al. (2008) on the other hand presented the vocal tract movements without thesurrounding face, as in (Fig. 1(e)), and avoided occluding articulators this way.

4 Augmented Reality
The velum has been included in some of the studies in Table 1, but the usefulness of displayingit can be discussed. Seeing tongue movements is strange for many viewers, but they are atleast conscious of the appearance and proprioceptic responses of the tongue surface, whereasit is much more difficult to internally visualize the placement and movement of the velum.Another simplification, used in several studies, is to present the intra-oral articulations from aside view that makes the display similar to traditional two-dimensional tracings in phonetics,even if the model is in 3D. The side-view is the one that makes different articulations mostdistinct (which is why this display is used in phonetics), but one may well argue that different
B=Badin et al. (2008)E={ E1=Wik & Engwall (2008), E2=Engwall & Wik (2009a), E3=Engwall (2010) }F=Fagel & Madany (2008), K=3D model in Kröger et al. (2008)M=Massaro et al. (2008), ML=Massaro & Light (2003), Massaro & Light (2004)
View Side view (B, E, F, K) (Fig. 1(a)), with a small angle (M) (Fig. 1(d))Front view (K, ML) (Fig. 1(b))Back view (ML) (Fig. 1(c))
Face Video-realistic. Closer half removed, remoter half a black silhouette (B)Synthetic-looking. Closer half removed (M), semi-transparent skin (F, ML),transparent skin at the oral cavity (E)No face (K) (Fig. 1(e))
Lips 3D and video-realistic (B)3D and synthetic-looking (F, K, L)3D for the remoter part of the face (E, M)
Tongue Midsagittal shape (in red, B; or turquoise, M) and the remoter half (B, M)Upper tongue surface (K)3D body (E, F, ML)
Jaw & Midsagittal shape of the incisor (in blue, B; or green, M) and the remoter halfteeth of the lower and upper jaw (B, M)
Semi-transparent schematic teeth blocks or quadrangles (F, K)Semi-transparent and realistic in 3D (ML)Visible and realistic 3D jaw, lower teeth and upper incisor (E)
Palate Midsagittal shape (in yellow, B; or green, M) and the remoter half (B, M)Uncoloured semi-transparent tube walls (K)Semi-transparent schematic (F) or realistic (ML)Upper limit of transparent part of the skin corresponds to themidsagittal contour of the palate (E, Fig. 1(a))
Velum Midsagittal shape (B) and the remoter part (M)Part of the semi-transparent tube walls (K)As part of the palate surface (F)
Pharynx Realistic remoter half (B)walls Non-realistic surface at the upper part of the pharynx (F, M)
Semi-transparent tube wall (K)Limit of transparent part corresponds to upper pharynx walls (E)
Movements Resynthesis of one speaker’s actual movements measured with EMA (B,E2)Rule-based, but coarticulation adapted to measurements (E1, E3, K)Rule-based with coarticulation models from facial animation (F, M, ML)
Table 1. Alternative representations of the articulators in the augmented reality display.

Augmented Reality Talking Heads as a Support for Speech Perception and Production 5
viewers may prefer different set-ups. Massaro & Light (2003) in addition used a front (as inFig. 1(b)) and a back (as in Fig. 1(c)) view of the head, but without attempting to investigateif any view was better than the other. As an alternative, one could choose an interactivedisplay, in which the user can rotate the 3D structure to different view points, but there is arisk that the structure complexity in other views may hide important articulatory features. Tothe best of our knowledge, the side view is hence the best alternative for displaying intra-oralmovements.The studies also differ in the attempted realism of the articulator appearance, anatomy andmovements. For the appearance, several researchers, e.g., Badin et al. (2008); Massaro et al.(2008) intentionally depart from realism by choosing contrasting colours for the differentarticulators. No user study has yet been performed to investigate whether viewers prefereasier discrimination between articulators or caricaturized realism. The meaning of the latterwould be that the appearance does not have to be photo-realistic, but that the articulatorcolours have the expected hue. Concerning anatomy, the models were created from MagneticResonance Imaging (MRI) (Badin et al., 2008; Engwall, 2010; Engwall & Wik, 2009a; Wik& Engwall, 2008) or adapted through fitting of an existing geometric model to data fromMRI (Fagel & Madany, 2008; Kröger et al., 2008) or three-dimensional ultrasound (Cohenet al., 1998). For the articulatory movements, Badin et al. (2008); Engwall & Wik (2009a)used actual Electromagnetic articulography (EMA) measurements of the uttered sentences,while the other studies used rule-based text-to-speech synthesis. Experiments reported inSection 3.2 indicate that this choice may have an influence on speech perception. On the onehand, prototypic or exaggerated movements created by rules may be easier to understandthan real tongue movements, but on the other, real movements may be closer to the viewer’sown production and therefore more easily processed subconsiously.A final issue regarding realism concerns the appearance of the face and its correspondencewith the intra-oral parts. A video-realistic face may have benefits both for pleasantness ofappearance and possibly also for speech perception, since finer details may be conveyed bythe skin texture. There is however a risk of the so called uncanny valley effect when theintra-oral articulation is shown within a video-realistic face. In the current scope, the uncannyvalley effect signifies that users may perceive the talking head as unpleasant if the face hasa close-to-human appearance, but includes non-human augmented reality, with parts of theskin removed or transparent. This question is further discussed in Section 5.
3. AR talking heads as a speech perception support
AR talking heads as a speech perception support have been investigated in several studiesin the last years (Badin et al., 2008; Engwall, 2010; Engwall & Wik, 2009a; Grauwinkel et al.,2007; Kröger et al., 2008; Wik & Engwall, 2008). The studies have shown that even if theintraoral articulators give much less information than the face, at least some listeners benefitfrom seeing tongue movements; but only if they have received explicit or implicit training onhow to interpret them.Badin et al. (2008) tested audiovisual identification of all non-nasal French voiced consonantsin symmetrical vowel-consonant-vowel (VCV) contexts with [a, i, u, y] and different levelsof signal-to-noise ratio (SNR). To one group the stimuli was presented in four decreasingsteps of SNR, from clean conditions to muted audio, whereas the steps were reversed withincreasing SNR for the other group. The first group hence received implicit training of the
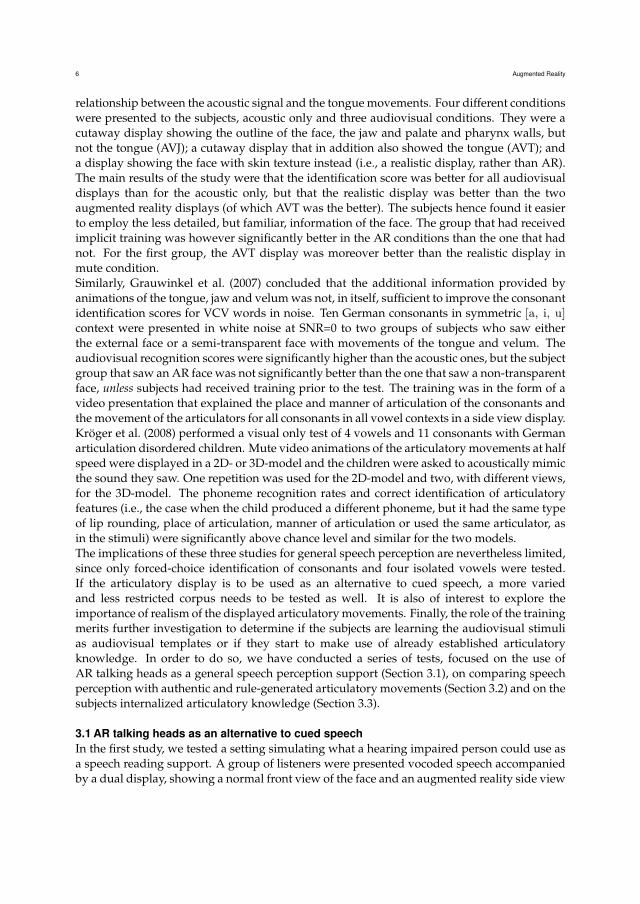
6 Augmented Reality
relationship between the acoustic signal and the tongue movements. Four different conditionswere presented to the subjects, acoustic only and three audiovisual conditions. They were acutaway display showing the outline of the face, the jaw and palate and pharynx walls, butnot the tongue (AVJ); a cutaway display that in addition also showed the tongue (AVT); anda display showing the face with skin texture instead (i.e., a realistic display, rather than AR).The main results of the study were that the identification score was better for all audiovisualdisplays than for the acoustic only, but that the realistic display was better than the twoaugmented reality displays (of which AVT was the better). The subjects hence found it easierto employ the less detailed, but familiar, information of the face. The group that had receivedimplicit training was however significantly better in the AR conditions than the one that hadnot. For the first group, the AVT display was moreover better than the realistic display inmute condition.Similarly, Grauwinkel et al. (2007) concluded that the additional information provided byanimations of the tongue, jaw and velum was not, in itself, sufficient to improve the consonantidentification scores for VCV words in noise. Ten German consonants in symmetric [a, i, u]context were presented in white noise at SNR=0 to two groups of subjects who saw eitherthe external face or a semi-transparent face with movements of the tongue and velum. Theaudiovisual recognition scores were significantly higher than the acoustic ones, but the subjectgroup that saw an AR face was not significantly better than the one that saw a non-transparentface, unless subjects had received training prior to the test. The training was in the form of avideo presentation that explained the place and manner of articulation of the consonants andthe movement of the articulators for all consonants in all vowel contexts in a side view display.Kröger et al. (2008) performed a visual only test of 4 vowels and 11 consonants with Germanarticulation disordered children. Mute video animations of the articulatory movements at halfspeed were displayed in a 2D- or 3D-model and the children were asked to acoustically mimicthe sound they saw. One repetition was used for the 2D-model and two, with different views,for the 3D-model. The phoneme recognition rates and correct identification of articulatoryfeatures (i.e., the case when the child produced a different phoneme, but it had the same typeof lip rounding, place of articulation, manner of articulation or used the same articulator, asin the stimuli) were significantly above chance level and similar for the two models.The implications of these three studies for general speech perception are nevertheless limited,since only forced-choice identification of consonants and four isolated vowels were tested.If the articulatory display is to be used as an alternative to cued speech, a more variedand less restricted corpus needs to be tested as well. It is also of interest to explore theimportance of realism of the displayed articulatory movements. Finally, the role of the trainingmerits further investigation to determine if the subjects are learning the audiovisual stimulias audiovisual templates or if they start to make use of already established articulatoryknowledge. In order to do so, we have conducted a series of tests, focused on the use ofAR talking heads as a general speech perception support (Section 3.1), on comparing speechperception with authentic and rule-generated articulatory movements (Section 3.2) and on thesubjects internalized articulatory knowledge (Section 3.3).
3.1 AR talking heads as an alternative to cued speechIn the first study, we tested a setting simulating what a hearing impaired person could use asa speech reading support. A group of listeners were presented vocoded speech accompaniedby a dual display, showing a normal front view of the face and an augmented reality side view

Augmented Reality Talking Heads as a Support for Speech Perception and Production 7
Augmented Reality 7
do so, we have conducted a series of tests, focused on the use of AR talking heads as a generalspeech perception support (Section 3.1), on comparing speech perception with authenticand rule-generated articulatory movements (Section 3.2) and on the subjects internalizedarticulatory knowledge (Section 3.3).
3.1 AR Talking Heads as an alternative to cued speech
In the first study, we tested a setting simulating what a hearing impaired person could use asa speech reading support. A group of listeners were presented vocoded speech accompaniedby a dual display, showing a normal front view of the face and an augmented reality side view(c.f. Fig. 2). Vocoded speech is a good simulation of a hearing impairment and a dual displaywould be used in a speech reading support, since the front view is the best for lip reading,while the side view is better to show the articulation of the tongue.
3.1.1 Stimuli and subjects
The stimuli consisted of acoustically degraded short Swedish sentences spoken by a maleSwedish speaker. The audio degradation was achieved by using a noise-excited channelvocoder that reduces the spectral details and creates an amplitude modulated and bandpassfiltered speech signal consisting of multiple contiguous channels of white noise over aspecified frequency range (Siciliano et al., 2003). In this chapter, the focus is placed on 30sentences presented with a three-channel vocoder, but Wik & Engwall (2008) in addition giveresults for sentences presented with two channels.
The sentences have a simple structure (subject, predicate, object) and ”everyday content”,such as ”Skjortan fastnade på en spik” (The shirt got caught on a nail). These sentences are partof a set of 270 sentences designed for audiovisual speech perception tests, based on MacLeod& Summerfield (1990). The sentences were normally articulated and the speech rate was keptconstant during the recording of the database by prompting the speaker with text-to-speechsynthesis set to normal speed.
The sentences were presented in three different conditions: Acoustic Only (AO), Audiovisualwith Face (AF) and Audiovisual with Face and Tongue (AFT). For the AF presentation a
Fig. 2. The dual face display showing a normal front view and an AR side view simultaneously. The picture inaddition shows the experimental display set-up with an entry frame, in which the subjects typed in the sentence thatthey perceived.
Fig. 2. The dual face display showing a normal front view and an AR side viewsimultaneously. The picture in addition shows the experimental display set-up with an entryframe, in which the subjects typed in the sentence that they perceived.
(c.f. Fig. 2). Vocoded speech is a good simulation of a hearing impairment and a dual displaywould be used in a speech reading support, since the front view is the best for lip reading,while the side view is better to show the articulation of the tongue.
3.1.1 Stimuli and subjectsThe stimuli consisted of acoustically degraded short Swedish sentences spoken by a maleSwedish speaker. The audio degradation was achieved by using a noise-excited channelvocoder that reduces the spectral details and creates an amplitude modulated and bandpassfiltered speech signal consisting of multiple contiguous channels of white noise over aspecified frequency range (Siciliano et al., 2003). In this chapter, the focus is placed on 30sentences presented with a three-channel vocoder, but Wik & Engwall (2008) in addition giveresults for sentences presented with two channels.The sentences have a simple structure (subject, predicate, object) and ”everyday content”,such as ”Skjortan fastnade på en spik” (The shirt got caught on a nail). These sentences are partof a set of 270 sentences designed for audiovisual speech perception tests, based on MacLeod& Summerfield (1990). The sentences were normally articulated and the speech rate was keptconstant during the recording of the database by prompting the speaker with text-to-speechsynthesis set to normal speed.The sentences were presented in three different conditions: Acoustic Only (AO), Audiovisualwith Face (AF) and Audiovisual with Face and Tongue (AFT). For the AF presentation afrontal view of the synthetic face was displayed (left part of Fig. 2) and the AFT presentation inaddition showed a side view, where intra-oral articulators had been made visible by makingparts of the skin transparent (Fig. 2).18 normal-hearing native subjects (15 male and 3 female) participated in the experiment. Allwere current or former university students and staff. They were divided into three groups,with the only difference between groups being that the sentences were presented in differentconditions to different groups, so that every sentence was presented in all three conditions,but to different groups. The sentence order was random, but the same for all subjects.

8 Augmented Reality
3.1.2 Experimental set-upThe acoustic signal was presented over headphones and the graphical interface was displayedon a 15” laptop computer screen. The perception experiment started with a familiarizationset of sentences in AFT condition, in which the subjects could listen to and watch a set offive vocoded and five clear sentences as many times as they wanted. The correct text wasthen displayed upon request in the familiarization phase. When the subjects felt preparedfor the actual test, they started it themselves. For each stimulus, the subjects could repeat itany number of times and they then typed in the words that they had heard (contrary to thefamiliarization phase, no feedback was given on the answers during the test). No limit was seton the number of repetitions, since the material was much more complex than the VCV wordsof the studies cited above and since subjects in Badin et al. (2008) reported that it was difficultto simultaneously watch the movements of the lips and the tongue in one side view. Allowingrepetitions made it possible for the subjects to focus on the front face view in some repetitionsand the augmented side view in others. This choice is hence similar to that in Grauwinkelet al. (2007), where each stimulus was repeated three times. The subjects’ written responseswere analyzed manually, with the word accuracy counted disregarding morphologic errors.
3.1.3 ResultsThe results for the two audiovisual conditions were significantly better than the acousticonly, as shown in Fig. 3(a). A two-tailed t-test showed that the differences were significantat a level of p<0.05. The word recognition for the two audiovisual conditions was verysimilar, with word accuracy 70% vs. 69% and standard deviation 0.19 vs. 0.15 for AF vs.AFT. Overall, the augmented reality display of the tongue movements did hence not improvethe performance further compared to the normal face view, similar to the findings by Badinet al. (2008) and Grauwinkel et al. (2007). Fig. 3(a) however also shows that the performancediffered substantially between the groups, with higher accuracy in AFT condition than in AFfor groups 1 and 2, but lower for group 3.The reason for this may be any of, or a combination of, differences in the semantic complexitybetween the sentence sets, in the phonetic content of the sentences between the sentence sets
Augmented Reality 9
(a) Average word accuracy (b) Average weighted word accuracy
Fig. 3. Word accuracy for all subjects and the three different groups. a) The numbers in the bars indicate which setof sentences that was presented in the different conditions. b) The weighting is a normalization, applied to factor outthe influence of intra-set differences.
between sentence sets and subject groups were therefore first analyzed. For the sets, theaverage word accuracy was 71% for set 1, 59% for set 2 and 64% for set 3, where the differencebetween sets 1 and 2 is statistically significant at p<0.005, using a paired t-test, whereas thedifference between sets 1 and 3 and between sets 2 and 3 is non-significant. For the groups,the average word accuracy was 66% for group 1, 62% for group 2 and 66% for group 3, andnone of the intra-group differences are significant.
There is hence an artifact of set difficulty that needs to be taken into account in the followinganalysis. In order to be able to compare display conditions without the influence of theintra-set differences, a weighted word accuracy was calculated, in which the average scoreof each set was normalized to the average of the three sets (66%). The word accuracy forsentences belonging to set 1 was decreased by multiplying it by a factor 0.66/0.71=0.92, whilethat of sets 2 and 3 was increased by a factor 1.12 and 1.03, respectively. The weighted wordaccuracy for the different display conditions is displayed in Fig. 3(b). The difference betweenthe weighted AF and AO conditions is significant at a level of p<0.05, while that between AFTand AO is significant at p<0.001. The difference between the two audiovisual conditions isstill not significant.
The intra-subject differences are a natural consequence of different subjects having differentmultimodal speech perception abilities to make use of augmented reality displays of intraoralarticulations, and this was also observed in the study by Badin et al. (2008) (personalcommunication). Fig. 4 shows that six subjects (1:3, 1:5, 1:6, 2:3, 2:6, 3:3) clearly benefitedfrom the augmented reality view, with up to 20% higher weighted word accuracy scores inAFT than in AF, while three others (2:4, 3:2, 3:5) were as clearly better in the AF condition. Infuture studies we plan to use an eye-tracking system to investigate if the differences betweensubjects may be due to where they focus their visual attention, so that subjects who havehigher recognition scores in the augmented reality condition give more attention to the tonguemovements. Such an evaluation has also been proposed by Badin et al. (2008).
In order to analyze how different phonetic content influenced the speech perception indifferent display conditions, the average word accuracy per sentence was first considered.
Fig. 3. Word accuracy for all subjects and the three different groups. a) The numbers in thebars indicate which set of sentences that was presented in the different conditions. b) Theweighting is a normalization, applied to factor out the influence of intra-set differences.

Augmented Reality Talking Heads as a Support for Speech Perception and Production 9
or in the distribution of individual subjects’ ability between the subject groups. Sentences andsubjects were distributed randomly between their three respective groups, but it could be thecase that the sentences in one set were easier to understand regardless of condition, or thatone group of subjects performed better regardless of condition. Since the sentence sets werepresented in different conditions to the subject groups, both differences between sentencesets and subject groups can make comparisons between conditions unfair. The differencesbetween sentence sets and subject groups were therefore first analyzed. For the sets, theaverage word accuracy was 71% for set 1, 59% for set 2 and 64% for set 3, where the differencebetween sets 1 and 2 is statistically significant at p<0.005, using a paired t-test, whereas thedifference between sets 1 and 3 and between sets 2 and 3 is non-significant. For the groups,the average word accuracy was 66% for group 1, 62% for group 2 and 66% for group 3, andnone of the intra-group differences are significant.There is hence an artifact of set difficulty that needs to be taken into account in the followinganalysis. In order to be able to compare display conditions without the influence of theintra-set differences, a weighted word accuracy was calculated, in which the average scoreof each set was normalized to the average of the three sets (66%). The word accuracy forsentences belonging to set 1 was decreased by multiplying it by a factor 0.66/0.71=0.92, whilethat of sets 2 and 3 was increased by a factor 1.12 and 1.03, respectively. The weighted wordaccuracy for the different display conditions is displayed in Fig. 3(b). The difference betweenthe weighted AF and AO conditions is significant at a level of p<0.05, while that between AFTand AO is significant at p<0.001. The difference between the two audiovisual conditions isstill not significant.The intra-subject differences are a natural consequence of different subjects having differentmultimodal speech perception abilities to make use of augmented reality displays of intraoralarticulations, and this was also observed in the study by Badin et al. (2008) (personalcommunication). Fig. 4 shows that six subjects (1:3, 1:5, 1:6, 2:3, 2:6, 3:3) clearly benefitedfrom the augmented reality view, with up to 20% higher weighted word accuracy scores inAFT than in AF, while three others (2:4, 3:2, 3:5) were as clearly better in the AF condition.In future studies we plan to use an eye-tracking system to investigate if the differencesbetween subjects may be due to where they focus their visual attention, so that subjects who
10 Augmented Reality Talking Heads as a Support for Speech Perception and Production
Fig. 4. Average weighted mean word accuracy per subject in the acoustic only (AO) condition and the changecompared to the AO condition when the AF or the AFT display is added. Numbers on the x-axis indicate group andsubject number within the group. Subjects have been sorted on increasing AO performance within each group.
Fig. 5 shows the weighted word accuracy, where the effect of differences in subjectperformance between the groups has been factored out through a normalization procedureequivalent to that described for the sentence set influence (however, contrary to the setinfluence, the effect of the different subject groups was marginal, with scale factors 0.98, 0.98and 1.05).
From Fig. 5 one can identify the sentences for which AFT was much better than AF (sentences5, 9, 10, 17, 21, 22, 28) and vice versa (1-3, 6-8, 12, 27). A first observation concerning thiscomparison of the two audiovisual conditions is that of the first eight sentences, seven weremore intelligible in the AF display. This suggests that the subjects were still unable to use
-40%
-20%
0%
20%
40%
60%
80%
100%
12 26 4 27 2 19 24 29 1 23 20 18 6 14 25 5 3 28 15 22 30 7 8 11 9 16 21 10 17 13
Sentence number
Weig
hte
d w
ord
accura
cy
AF change AFT change AO
Fig. 5. The weighted mean word accuracy for each stimulus in the acoustic only (AO) condition and the changecompared to the AO condition when the AF or the AFT display is added. The sentences have been sorted in order ofincreasing AFT change.
Fig. 4. Average weighted mean word accuracy per subject in the acoustic only (AO)condition and the change compared to the AO condition when the AF or the AFT display isadded. Numbers on the x-axis indicate group and subject number within the group. Subjectshave been sorted on increasing AO performance within each group.

10 Augmented Reality
10 Augmented Reality Talking Heads as a Support for Speech Perception and Production
Fig. 4. Average weighted mean word accuracy per subject in the acoustic only (AO) condition and the changecompared to the AO condition when the AF or the AFT display is added. Numbers on the x-axis indicate group andsubject number within the group. Subjects have been sorted on increasing AO performance within each group.
Fig. 5 shows the weighted word accuracy, where the effect of differences in subjectperformance between the groups has been factored out through a normalization procedureequivalent to that described for the sentence set influence (however, contrary to the setinfluence, the effect of the different subject groups was marginal, with scale factors 0.98, 0.98and 1.05).
From Fig. 5 one can identify the sentences for which AFT was much better than AF (sentences5, 9, 10, 17, 21, 22, 28) and vice versa (1-3, 6-8, 12, 27). A first observation concerning thiscomparison of the two audiovisual conditions is that of the first eight sentences, seven weremore intelligible in the AF display. This suggests that the subjects were still unable to use
-40%
-20%
0%
20%
40%
60%
80%
100%
12 26 4 27 2 19 24 29 1 23 20 18 6 14 25 5 3 28 15 22 30 7 8 11 9 16 21 10 17 13
Sentence number
Weig
hte
d w
ord
accura
cy
AF change AFT change AO
Fig. 5. The weighted mean word accuracy for each stimulus in the acoustic only (AO) condition and the changecompared to the AO condition when the AF or the AFT display is added. The sentences have been sorted in order ofincreasing AFT change.
Fig. 5. The weighted mean word accuracy for each stimulus in the acoustic only (AO)condition and the change compared to the AO condition when the AF or the AFT display isadded. The sentences have been sorted in order of increasing AFT change.
have higher recognition scores in the augmented reality condition give more attention to thetongue movements. Such an evaluation has also been proposed by Badin et al. (2008).In order to analyze how different phonetic content influenced the speech perception indifferent display conditions, the average word accuracy per sentence was first considered.Fig. 5 shows the weighted word accuracy, where the effect of differences in subjectperformance between the groups has been factored out through a normalization procedureequivalent to that described for the sentence set influence (however, contrary to the setinfluence, the effect of the different subject groups was marginal, with scale factors 0.98, 0.98and 1.05).From Fig. 5 one can identify the sentences for which AFT was much better than AF (sentences5, 9, 10, 17, 21, 22, 28) and vice versa (1-3, 6-8, 12, 27). A first observation concerning thiscomparison of the two audiovisual conditions is that of the first eight sentences, seven weremore intelligible in the AF display. This suggests that the subjects were still unable to usethe additional information from the AFT display, despite the familiarization set, and wereinitially only confused by the tongue animations, whereas the more familiar AF view couldbe used as a support immediately. The very low AFT score for sentence 12 is probably due toa previously unnoticed artifact in the visual synthesis, which caused a chaotic behavior of thetongue for a few frames in the animation.The analysis of the sentences that were better perceived in AFT than in AF condition istentative and needs to be supported by more, and more controlled, experimental data, wheresentences can be clearly separated with respect to the type of articulatory features theycontain. As a first hypothesis, based on the words that had a higher recognition rate in AFTcondition, it appears that subjects found additional information in the AFT display mainlyfor the tongue dorsum raising in the palatal plosives [k, g] and the tongue tip raising inthe alveolar lateral approximant [l] and the alveolar trill [r]. In addition, the fricatives [Ê, C]also seem to have been better perceived, but they appeared in too few examples to attempt

Augmented Reality Talking Heads as a Support for Speech Perception and Production 11
hypothesizing. The animations of the tongue in particular appear to have been beneficial forthe perception of consonant clusters, such as [kl, ml, pl, sk, st, kt, rd, rt, rn, dr, tr], for whichthe transitions are difficult to perceive from a front face view.Note that there is a weak negative correlation (σ=-0.09) between the number of repetitions fora sentence and the accuracy rates, and the accuracy rate is hence not increased if the subjectslistened to the stimuli additional times. The word accuracy decreased almost monotonouslywith the number of repetitions after an initial peak (at 1-2 repetitions for AO and AF and at3 for AFT), as shown in Fig. 6. A two factor ANOVA with number of repetitions and displaycondition as factors indicates that there is no interaction between number of listenings anddisplay condition for the word recognition accuracy. Fig. 6 also shows that, on average, thestimuli were mostly played two, three or more than six times. From the number of repetitionsused and the corresponding word accuracy, it appears that the subjects were either certainabout the perceived words after 1-3 repetitions, or they used many repetitions to try to decodedifficult sentences, but gained little by doing so. Fig. 6 suggests that the additional repetitionwith the AFT display allowed users to take more information from both face views intoaccount.Due to the rapidity of the tongue movements and the comparably low word recognition forone repetition, it seems unrealistic that the AR talking head could be used as an alternative tocued speech for real-time speech perception for an average person, at least not without largeamounts of training. However, the study shows that some subjects are indeed very strong”tongue readers”, and such persons could well be helped by an AR talking head display.The following two sections continue to explore how the tongue movements in the augmentedreality animations are processed by the listeners.
Augmented Reality 11
the additional information from the AFT display, despite the familiarization set, and wereinitially only confused by the tongue animations, whereas the more familiar AF view couldbe used as a support immediately. The very low AFT score for sentence 12 is probably due toa previously unnoticed artifact in the visual synthesis, which caused a chaotic behavior of thetongue for a few frames in the animation.
The analysis of the sentences that were better perceived in AFT than in AF condition istentative and needs to be supported by more, and more controlled, experimental data, wheresentences can be clearly separated with respect to the type of articulatory features theycontain. As a first hypothesis, based on the words that had a higher recognition rate in AFTcondition, it appears that subjects found additional information in the AFT display mainlyfor the tongue dorsum raising in the palatal plosives [k, g] and the tongue tip raising inthe alveolar lateral approximant [l] and the alveolar trill [r]. In addition, the fricatives [Ê, C]also seem to have been better perceived, but they appeared in too few examples to attempthypothesizing. The animations of the tongue in particular appear to have been beneficial forthe perception of consonant clusters, such as [kl, ml, pl, sk, st, kt, rd, rt, rn, dr, tr], for whichthe transitions are difficult to perceive from a front face view.
Note that there is a weak negative correlation (σ=-0.09) between the number of repetitions fora sentence and the accuracy rates, and the accuracy rate is hence not increased if the subjectslistened to the stimuli additional times. The word accuracy decreased almost monotonouslywith the number of repetitions after an initial peak (at 1-2 repetitions for AO and AF and at3 for AFT), as shown in Fig. 6. A two factor ANOVA with number of repetitions and displaycondition as factors indicates that there is no interaction between number of listenings anddisplay condition for the word recognition accuracy. Fig. 6 also shows that, on average, thestimuli were mostly played two, three or more than six times. From the number of repetitions
0%
10%
20%
30%
40%
50%
60%
70%
80%
90%
100%
1 2 3 4 5 6 >6Number of repetitions
Pe
rce
nt
/ P
erc
en
t c
orr
ec
t
AO AF AFTAO AF AFT
Fig. 6. Lines show the average weighted mean word accuracy in the three display conditions as a function of numberof times the stimulus was repeated before the subject gave an answer. Bars show the distribution of the averagenumber of repetitions for the different conditions.
Fig. 6. Lines show the average weighted mean word accuracy in the three display conditionsas a function of number of times the stimulus was repeated before the subject gave an answer.Bars show the distribution of the average number of repetitions for the different conditions.

12 Augmented Reality
3.2 On the importance of realism of articulator movementsAs described in Section 2, both rule-based and recorded articulator movements have beenused in the AR animations. Movements created from rules are more prototypic, may behyperarticulated (i.e. more exaggerated) and have no variation between repetitions of thesame utterance. Recorded movements display speaker specific traits, with variability andmore or less clearly articulated words, but they are, on the other hand, natural movements. Wehave performed a study on VCV words and sentences to investigate if the difference betweenthese two types of movements influences the perception results of the viewers. Realistictongue movements could be more informative, because the listener can unconsciously mapthe displayed movements to his or her own, either through activation of mirror neurons(Rizzolatti & Arbib, 1998) when seeing tongue movements, or if the theory of speech motorcontrol is applicable (Perkell et al., 2000). It may, on the other hand, be so that the rule-basedmovements give more information, because the hyperarticulation means that the articulationsare more distinct. This was indeed found to be the case for the velar plosive [g], for the partof this test on VCV words (Engwall & Wik, 2009a). The consonant identification rate was0.44 higher with animations displaying rule-based [g] movements than for those with realmovements. For other consonants ([v, d, l, r, n, s C, Ê]), the difference was either small orwith the recorded movements resulting in higher identification rates. For a description of thetest with VCV words, please refer to Engwall & Wik (2009a), as the remainder of this sectionwill deal with sentences of the same type as in Section 3.1.
3.2.1 Stimuli and subjectsFor the animations based on recorded data (AVR), the movements were determined frommeasurements with the MacReflex motion capture system from Qualisys (for the face) and theMovetrack EMA (for the tongue movements) of one female speaker of Swedish (Beskow et al.,2003). For the face, 28 small reflective markers were attached to the speaker’s jaw, cheeks, lipsand nose, as shown in Fig. 7(a). To record the tongue movements, three EMA coils were placedon the tongue, using a placement shown in Fig. 7(b). In addition, EMA coils were also placedon the jaw, the upper lip and the upper incisor. Beskow et al. (2003) describe how the recordeddata was transformed to animations in the talking head model through a fitting procedure tominimize the difference between the data and the resynthesis in the model.For the rule-based synthesis animations (AVS), the movements were created by a text-to-visualspeech synthesizer with forced-alignment (Sjölander, 2003) to the recorded acoustic signal.The text-to-visual speech synthesis used is an extension to the one created for the face byBeskow (1995) and determines the articulator movements through targets for each phonemeand interpolation between targets. The targets and the timing for the tongue movements arebased on data from static MRI and dynamic EMA (Engwall, 2003), but the interpolation isthe same as for the face, which might not be suitable for the tongue movements, since theyare much faster and of a slightly different nature. It has been shown that the syntheticallygenerated face animations are effective as a speech perception support (Agelfors et al., 1998;Siciliano et al., 2003), but we here concentrate on if the synthesis is adequate for intraoralanimations.The stimuli were 50 Swedish sentences of the same type (but not necessarily the same content)and with the same acoustic degradation as described in Section 3.1.1. The sentences weredivided into three sets S1, S2 and S3, where S1 contained 10 stimuli and S2 and S3 20 stimulieach.

Augmented Reality Talking Heads as a Support for Speech Perception and Production 13
Augmented Reality 13
(a) Motion capture markers (b) EMA coil placement
Fig. 7. Set-up used to collect data for the AVR animiations. (a) Placement of the Qualisys motion capture markers.(b) The corresponding virtual motion capture markers (+) and articulography coils (circled) in the talking headmodel.
For the rule-based synthesis animations (AVS), themovements were created by a text-to-visualspeech synthesizer with forced-alignment (Sjölander, 2003) to the recorded acoustic signal.The text-to-visual speech synthesis used is an extension to the one created for the face byBeskow (1995) and determines the articulator movements through targets for each phonemeand interpolation between targets. The targets and the timing for the tongue movements arebased on data from static MRI and dynamic EMA (Engwall, 2003), but the interpolation isthe same as for the face, which might not be suitable for the tongue movements, since theyare much faster and of a slightly different nature. It has been shown that the generated faceanimations are effective as a speech perception support (Agelfors et al., 1998; Siciliano et al.,2003), but we here concentrate on if the synthesis is adequate for intraoral animations.
The stimuli were 50 Swedish sentences of the same type (but not necessarily the same content)and with the same acoustic degradation as described in Section 3.1.1. The sentences weredivided into three sets S1, S2 and S3, where S1 contained 10 stimuli and S2 and S3 20 stimulieach.
The subjects were 20 normal-hearing native speakers of Swedish (13 male and 7 female). Theywere divided into two groups, I and II. The sentences in S2 were presented in AVS conditionto Group I and in AVR to Group II, while those in S3 were presented in AVR to Group I and inAVS to Group II. Both groupswere presented S1 in acoustic only (AO) condition. To determinethe increase in word recognition when adding the AR animations to the acoustic signal, amatched control group (Group III) was presented all stimuli in AO. For the comparisonsbelow, the stimuli was hence the same as for Groups I and II, but the subjects were different inGroup III. The results on set S1 were therefore used to adjust the scores of the control group sothat the AO baseline performance corresponded to that of Groups I-II on S1, since inter-groupdifferences could otherwise make inter-condition comparisons invalid.
3.2.2 Experimental set-up
The AR talking head shown in Fig. 1(a) was used to display the animations and the acousticsignal was presented over high-quality headphones. The sentence order was the same for all
Fig. 7. Set-up used to collect data for the AVR animiations. (a) Placement of the Qualisysmotion capture markers. (b) The corresponding virtual motion capture markers (+) andarticulography coils (circled) in the talking head model.
The subjects were 20 normal-hearing native speakers of Swedish (13 male and 7 female). Theywere divided into two groups, I and II. The sentences in S2 were presented in AVS conditionto Group I and in AVR to Group II, while those in S3 were presented in AVR to Group I and inAVS to Group II. Both groups were presented S1 in acoustic only (AO) condition. To determinethe increase in word recognition when adding the AR animations to the acoustic signal, amatched control group (Group III) was presented all stimuli in AO. For the comparisonsbelow, the stimuli were hence the same as for Groups I and II, but the subjects were different inGroup III. The results on set S1 were therefore used to adjust the scores of the control group sothat the AO baseline performance corresponded to that of Groups I-II on S1, since inter-groupdifferences could otherwise make inter-condition comparisons invalid.
3.2.2 Experimental set-upThe AR talking head shown in Fig. 1(a) was used to display the animations and the acousticsignal was presented over high-quality headphones. The sentence order was the same for allsubjects and the display condition (AVR, AVS or AO) was random, but balanced, so that allconditions were equally frequent at the beginning, middle and end of the test.Each sentence was presented three times before the subjects typed in their answer in five entryframes. The five frames were always active, even if the sentence contained fewer words.Before the test, the subjects were given the familiarization task to try to identify the connectionbetween the sound signal and tongue movements in five sentences presented twice withnormal acoustic signal and twice with degraded.
3.2.3 ResultsBoth types of animations resulted in significantly higher word recognition rates than theacoustic only condition, when comparing the perception results for Groups I and II with thoseof Group III for sets S2 and S3, as shown in Table 2. When considering the two audiovisualconditions, the word recognition rate was 7% higher when the animations were based onrecorded data than when they were synthesized, and the difference is highly significant, usinga single factor ANOVA (p<0.005).

14 Augmented Reality
AO AVS AVRacc. 54.6% 56.8% 63.9%std. 0.12 0.09 0.09
Table 2. Word accuracy rates (acc.) and standard deviation (std) when the stimuli werepresented as acoustic only (AO), with animations created from synthesis (AVS) and frommeasurements (AVR). The differences AVR-AO and AVS-AO are significant at p<0.005,using a paired two-tailed t-test.
Since the same subject was not presented the same sentences in both AVR and AVS, therecognition scores were weighted, so that the average score for the two sets S2 and S3 overall subjects and both conditions AVR and AVS is the same. The scale factors were wS1=0.97and wS2=1.03. As shown in Fig. 8, the accuracy rate in the AVR condition varied between45% and 85% for different subjects, and 40% of the subjects actually performed better in AVScondition. The majority of the subjects nevertheless performed better in the AVR condition,and whereas four subjects were more than 10% better with AVR, only one was 10% better withAVS.The word accuracy rate per sentence, shown in Fig. 9, was higher in AVR for 70% of thesentences, and for about half of these, the difference is large. For one of the sentences (”Snönlåg metertjock på marken”, i.e. ”The snow lay a meter deep on the ground”), the word accuracy is35% higher in AVR, and the difference is significant at the sentence level at p<0.0005.In a follow-up study, published in Engwall & Wik (2009b), it was shown that subjects (ofwhich 11 out of the 22 were the same as in the experiment presented here) could not judgeif an animation was created from real recordings or from text-to-speech synthesis. It is hence
Augmented Reality 15
-20%
0%
20%
40%
60%
80%
1 2 3 4 5 6 7 8 9 10 11 12 13 14 15 16 17 18 19 20 m
AVS
m
AO
Subjects
Wo
rd a
cc
ura
cy
AVR-AVS
AVR-AO
AVR
m
Fig. 8. Rate of correctly recognized words for animations with recorded data (AVR, black line) and difference inrecognition rate between AVR and synthetic movements (AVS, striped bars) for each subject. The AVR average forthe group (m) and the average improvement for the group, compared to AVS (m AVS, striped bar) and acoustic only(m AO, blue bar) is also also given. Subjects are shown in order of increasing AVR score.
acoustic and visual information by the subjects. There are indeed several theories andevidence that could point in that direction. Skipper et al. (2007) showed that perception ofaudiovisual speech leads to substantial activities in the speech motor areas of the listener’sbrain and that the activated areas when seeing a viseme are the same as when producing thecorresponding phoneme. However, the connection between visemes and speech perceptioncould be established through experience, when seeing the viseme simultaneously withhearing the phoneme, whereas we here deal with a connection between acoustics and visual
-15%
-10%
-5%
0%
5%
10%
15%
20%
25%
30%
35%
0
Differ
ence
in w
ords c
orrec
t
Fig. 9. Difference in recognition rate between AVR and AVS for each sentence. The sentences have been sorted inorder of increasing AVR-AVS difference.
Fig. 8. Rate of correctly recognized words for animations with recorded data (AVR, blackline) and difference in recognition rate between AVR and synthetic movements (AVS, stripedbars) for each subject. The AVR average for the group (m) and the average improvement forthe group, compared to AVS (m AVS, striped bar) and acoustic only (m AO, blue bar) is alsogiven. Subjects are shown in order of increasing AVR score.

Augmented Reality Talking Heads as a Support for Speech Perception and Production 15
Augmented Reality 15
-20%
0%
20%
40%
60%
80%
1 2 3 4 5 6 7 8 9 10 11 12 13 14 15 16 17 18 19 20 m
AVS
m
AO
Subjects
Wo
rd a
cc
ura
cy
AVR-AVS
AVR-AO
AVR
m
Fig. 8. Rate of correctly recognized words for animations with recorded data (AVR, black line) and difference inrecognition rate between AVR and synthetic movements (AVS, striped bars) for each subject. The AVR average forthe group (m) and the average improvement for the group, compared to AVS (m AVS, striped bar) and acoustic only(m AO, blue bar) is also also given. Subjects are shown in order of increasing AVR score.
acoustic and visual information by the subjects. There are indeed several theories andevidence that could point in that direction. Skipper et al. (2007) showed that perception ofaudiovisual speech leads to substantial activities in the speech motor areas of the listener’sbrain and that the activated areas when seeing a viseme are the same as when producing thecorresponding phoneme. However, the connection between visemes and speech perceptioncould be established through experience, when seeing the viseme simultaneously withhearing the phoneme, whereas we here deal with a connection between acoustics and visual
-15%
-10%
-5%
0%
5%
10%
15%
20%
25%
30%
35%
0
Differ
ence
in w
ords c
orrec
t
Fig. 9. Difference in recognition rate between AVR and AVS for each sentence. The sentences have been sorted inorder of increasing AVR-AVS difference.
Fig. 9. Difference in recognition rate between AVR and AVS for each sentence. The sentenceshave been sorted in order of increasing AVR-AVS difference.
the case that even though subjects are unaccustomed to seeing tongue movements and cannot consciously judge if the animations are truthful representations of the tongue movements,they are, as a group, nevertheless better if the actual articulations that produced the acousticsare displayed.A possible explanation for this would be that there is a more direct connection betweenspeech perception and articulatory movements, rather than a conscious interpretation ofacoustic and visual information by the subjects. There are indeed several theories andevidence that could point in that direction. Skipper et al. (2007) showed that perception ofaudiovisual speech leads to substantial activities in the speech motor areas of the listener’sbrain and that the activated areas when seeing a viseme are the same as when producing thecorresponding phoneme. However, the connection between visemes and speech perceptioncould be established through experience, when seeing the speaker’s face producing theviseme simultaneously with hearing the phoneme, whereas we here deal with a connectionbetween acoustics and visual information that is not normally seen. A potential explanationcould be provided by the direct realist theory of speech perception (Fowler, 2008), whichstates that speech is perceived through a direct mapping of the speech sounds to the listener’sarticulatory gestures. Hence, seeing the gestures may influence perception unconsciously.Similarly, the speech motor theory (Liberman & Mattingly, 1985) stipulates that both acousticand visual gestures are processed in accordance with how the speaker produced them.This would explain why the AVS animations, which are realistic, but are not necessarilyin accordance with the speaker’s gestures, gave lower recognition rates than AVR, whereacoustic and visual gestures correspond.The above explanations are however problematic, since the speaker’s and the listener’s oralanatomy differ, and they would use slightly different gestures to produce the same sequenceof sounds. It is hence unclear if the listener could really map the speaker’s articulatorygesture’s to his or her own. An alternative explanation is provided by the fuzzy logicaltheory of speech perception (Massaro, 1998), which argues that perception is a probabilisticdecision based on previously learned templates. Acoustic and visual information is processedindependently and then combined in a weighted fusion to determine the most probable matchwith both sources of information. While this appears to be a plausible explanation for visemes(see further the explanation of the McGurk effect in Section 3.3), it is unclear how the visual

16 Augmented Reality
templates for the tongue movements could have been learned. In the next section, this issueof learning is investigated further.
3.3 How do people learn to ”read” tongue movements?All perception studies cited above indicated that a training phase in some form wasrequired if the subjects should be able to use the information provided by the AR talkinghead. A fundamental question is then what the subjects learn during this training phase:Is it a conscious mapping of articulatory movements to corresponding phonemes in atemplate learning scheme? Or are tongue reading abilities pre-existing, and the role of thetraining phase is to make subjects sub-consciously aware of how to extract information fromanimations of articulatory movements?In order to investigate this issue, the so called McGurk effect (McGurk & MacDonald, 1976)can be used. The McGurk effect describes the phenomenon that if the acoustic signal ofone phoneme is presented together with the visual lip movements of another, it is often thecase that a third phoneme is perceived, because of audiovisual integration. For example, ifauditory [ba] is presented with visual [ga], then for the very large majority of subjects [da] isperceived. The reason is that the visual signal is incompatible with [ba] (since the lip closureis missing) and the acoustic with [ga] (the acoustic frequency pattern in the transition from theconsonant to the following vowel is wrong) and the brain therefore integrates the two streamsof information to perceive [da], which is more in agreement with both streams. It should benoted that this effect is sub-conscious, that the subject actually perceives [da], and that theeffect appears even for subjects who know about the conflicting stimuli.For the AR talking heads, the McGurk effect was adapted to create mismatches between theacoustic signal and the tongue movements in the AR display, rather than with face movementsin a normal display. Subjects were then randomly presented either matching stimuli (theacoustics and the animations were of the same phoneme) or conflicting (McGurk stimuli).The underlying idea was that if the subjects had an existing subconscious notion of generalarticulatory movements, then the perception score for the matching stimuli should be higherand that some type of McGurk effect should be observed for the conflicting stimuli.
3.3.1 Stimuli and subjects24 different symmetric VCV words, with C=[p, b, t, d, k, g, l, v] and V=[a, I, U], uttered by afemale Swedish speaker, were presented at four different levels of white noise (signal-to-noiseratio SNR=+3dB, -6dB, -9dB and Clean speech) and three different audiovisual conditions.The stimuli were presented in blocks of 48 stimuli at each noise level, in random order betweennoise levels and audiovisual conditions, but in the same order for all subjects. The 48 stimuliconsisted of the 24 VCV words played in acoustic only condition (AO), plus 12 of these VCVwords played with the animations of the tongue matching the acoustic signal (AVM) and12 played with animations of the tongue movements that were in conflict with the acoustics(AVC).The conflicting animations were created by in turn combining the acoustic signal of each of thebilabials [p, b], alveolars [t, d] and velars [k, g] with tongue movements related to one of theother two places of articulation. The conflicting condition for [l] was visual [v] and vice versa.The display excluded the lip area (in order to avoid that lip movements, rather than those ofthe tongue, influenced the results), and the labial consonants [p, b, v] therefore constitute aspecial case for both AVM and AVC. Since the subjects did not see the articulation of the lips,

Augmented Reality Talking Heads as a Support for Speech Perception and Production 17
AVM in this case signifies that there were no conflicting tongue movements in the animation,and AVC for acoustic [k, g, t, d, l] with the animation showing the articulation of [p, b, v] inthis case signifies that there were no supporting tongue movements in the animation.Subjects were divided into two groups, with the only difference between groups being thatthe were presented the AVM and AVC stimuli in opposite conditions. That is, Group I waspresented Set 1=[ap:a, Id:I, uk:u, Ib:I, ut:u, ag:a, up:u, ad:a, Ik:I, al:a, Iv:I, ul:u] with matchedanimations and Set 2=[ab:a, It:I, ug:u, Ip:I, ud:u, ak:a, ub:u, at:a, Ig:I, av:a, Il:I, uv:u] withconflicting. Group II was, on the other hand, presented Set 1 with conflicting and Set 2 withmatching animations. Note that Sets 1 and 2 are balanced in terms of vowel context andconsonant place of articulation and voicing, i.e., if Set 1 contains a VCV word with an unvoicedconsonant, then Set 2 contains the voiced consonant having the same place of articulation inthe same vowel context, and this is reversed for another vowel context.The 18 subjects (13 male and 5 female, aged 21-31 years, no known hearing impairment) haddifferent language backgrounds. Four were native speakers of Swedish; two each of Greek,Persian and Urdu; and one each of German, English, Serbian, Bangla, Chinese, Korean, Thaiand Tamil. The heterogeneous subject group was chosen to investigate if familiarity with thetarget articulations influenced perception results. The question is relevant in the light of theuse of AR talking heads for pronunciation training of a foreign language (c.f. Section 4). Theinfluence of the subjects’ first language is further discussed in Engwall (2010), while we heredeal with the general results.The description in this chapter concentrates on the stimuli presented at SNR=-6dB, where thecombination of audio and animations was the most important. An analysis of the results atthe other noise levels is given in Engwall (2010).
3.3.2 Experimental set-upEach stimulus was presented once, with the acoustic signal played over high qualityheadphones and the animations of the tongue movements shown on a 21” flat computerscreen. AVM and AVC animations displayed the movements in an AR side view, such asthe one in Fig. 1(a), but translated to hide the lip area. For AO, an outside view, without anymovements, was instead shown.For the auditory stimuli, the SNR for the added white noise spectrum was relative to theaverage energy of the vowel parts of each individual VCV word and each VCV word wasthen normalized with respect to the energy level.Before the test, a set of 9 VCV words with C=[m, n, N] and V=[a, I, U] was presented in AVM atSNR=Clean, -6dB and -9dB, as a familiarization to the task. No feedback was given and thesestimuli were not included in the test. The familiarization did hence not constitute a trainingphase.A forced choice setting was used, i.e., subjects gave their answer by selecting the on-screenbutton for the consonant that they perceived. In the results below, accuracy is always countedwith respect to the acoustic signal.
3.3.3 ResultsThe mean accuracy levels at SNR=-6dB are shown in Table 3. The differences between AVMand AO and between AVM and AVC are significant at p<0.05 using a single factor ANOVA.Note that voicing errors were disregarded and responses were grouped as [p/b], [t/d] and[k/g], giving a chance level of 20%. The reasons for this was that several subjects were from

18 Augmented Reality
AO AVM AVCacc. 36.2% 43.1% 33.8%std. 0.13 0.15 0.14
Table 3. Word accuracy rates (acc.) and standard deviation (std) when the stimuli werepresented as acoustic only (AO), with matching animations (AVM) and with conflicting(AVC). The differences AVM-AO and AVM-AVC are significant at p<0.05, using a singlefactor ANOVA.
language backgrounds lacking the voiced-unvoiced distinction (such as between [t] and [d])and that the aim was to investigate the influence of the visual information given about thetongue articulation. In the following, /p/ refers to [p, b], /t/ to [t, d] and /k/ to [k, g].As a general result, the animations with matching articulatory movements hence gave animportant support to the perception of the consonants in noise. This is all the more true ifonly the consonants that are produced with the tongue [t, d, k, g, l] are considered. Fig. 10summarizes the individual and average perception scores (mAVM=59%) for these consonants.The graph shows that 14 of the 18 subjects performed better with matched animations thanwith only audio and that 9 performed worse with conflicting animations than with audio only.Curiously, 9 subjects however performed better with conflicting animations than with audioonly, indicating that one effect of presenting the animations may have been that the subjectslistened more carefully to the acoustic signal than if the same acoustic signal was presentedwithout animations. The graph also shows, just as the results for the studies presented above,that the differences between subjects were very large, with e.g., subject 18 being a particularlygifted tongue reader (100% recognition in AVM compared to 32.5% in AO)
Augmented Reality 19
-40%
-20%
0%
20%
40%
60%
80%
100%
1 2 3 4 5 6 7 8 9 10 11 12 13 14 15 16 17 18 m
Subjects
Accu
racy r
ate
AVM-AO AVC-AO AVM
Fig. 10. The accuracy rate for [t,d,k,g,d,l] in the matched (AVM) condition (black line), and the difference betweenthe matched AVM (red and white striped bars) or conflicting AVC (blue bars) conditions and the acoustic only(AO), for each individual subject, and for the group (m). Subjects are presented in order of increasing AVM score.
that the differences between subjects were very large, with e.g., subject 18 being a particularlygifted tongue reader (100% recognition in AVM compared to 32.5% in AO)
When analyzing the responses with respect to accompanying animation shown in Fig. 11,several patterns appear, both in terms of the strength of the information given by a particularacoustic signal or articulatory movement and integration effects for conflicting acoustic andvisual signals. For the acoustic signal, [l] is the most salient with over 90% correct responsesalready with AO and consequently only marginal improvement with AVM or decline withAVC. On the other hand, the fricative [v] is particularly vulnerable to the background noise,with the AO accuracy level being half that of the next lowest, /p/. For the visual signal,the articulatory movement of /k/ has the strongest influence: For acoustic /k/, when themovement is shown in AVM, the accuracy in the responses increases with 50%, and when it islacking in AVC, the accuracy decreases by 25%, regardless of if the animation shows no tonguearticulation (for /p/) or a conflicting movement (for /t/). Further, for /p, t/, a conflicting /k/animation decreases the recognition score in AVC by 10% compared to AO.
Concerning audiovisual integration, shown in Fig. 12, the changes listed in Table 4 are themost important that can be observed. Several of these changes are similar to the McGurkeffect, even if the change is much smaller (and only took place with a noisy acoustic signal).
In conclusion for this study we can argue that the subjects must have a prior knowledgeof articulatory movements of the tongue, since the animations were randomly matched andconflicting and the subjects performed significantly better with the matching movements. Theconflicting animations further showed that subjects integrated both signals in their perception.
Fig. 10. The accuracy rate for [t,d,k,g,d,l] in the matched (AVM) condition (black line), andthe difference between the matched AVM (red and white striped bars) or conflicting AVC(blue bars) conditions and the acoustic only (AO), for each individual subject, and for thegroup (m). Subjects are presented in order of increasing AVM score.

Augmented Reality Talking Heads as a Support for Speech Perception and Production 19
20 Augmented Reality Talking Heads as a Support for Speech Perception and Production
Fig. 11. The accuracy rate in acoustic only AO condition (black line), and the change (bars) when animations wereadded. The stimuli having the same acoustic signal ([p/b, t/d, k/g, l, v]) are grouped on the x-axis and withineach group the bars indicate the difference in perception score, for that stimuli, compared to AO. Red and whitestriped bars signal matching condition AVM, blue bars conflicting AVC.
We are currently planning a follow-up study with a training phase prior to the test, in orderto investigate if consistency between training and test or between acoustics and articulation isthe most important. In this, subjects will be divided into four groups. Group I will be shownmatching audiovisual stimuli in both training and test. Group II will be shown conflictingaudiovisual stimuli in both training and test, but the audiovisual combinations would beconsistent between training and test. Group III will be shown conflicting audiovisual stimuliin the training, but matching in the test. Group IVwill be shownmatching audiovisual stimuliin the training, but conflicting in the test.
If match between the acoustic and visual signals is the most important, then Group I andGroup III will have higher recognition scores than Groups II and IV. If, on the other hand,consistency between training and test is more important, Groups I and II will performsimilarly, and better than Groups III and IV.
Fig. 11. The accuracy rate in acoustic only AO condition (black line), and the change (bars)when animations were added. The stimuli having the same acoustic signal ([p/b, t/d, k/g, l,v]) are grouped on the x-axis and within each group the bars indicate the difference inperception score, for that stimuli, compared to AO. Red and white striped bars signalmatching condition AVM, blue bars conflicting AVC.
When analyzing the responses with respect to accompanying animation shown in Fig. 11,several patterns appear, both in terms of the strength of the information given by a particularacoustic signal or articulatory movement and integration effects for conflicting acoustic andvisual signals. For the acoustic signal, [l] is the most salient with over 90% correct responsesalready with AO and consequently only marginal improvement with AVM or decline withAVC. On the other hand, the fricative [v] is particularly vulnerable to the background noise,with the AO accuracy level being half that of the next lowest, /p/. For the visual signal,the articulatory movement of /k/ has the strongest influence: For acoustic /k/, when themovement is shown in AVM, the accuracy in the responses increases with 50%, and whenit is lacking in AVC, the accuracy decreases by 25%, regardless of if the animation shows notongue articulation (for /p/) or a conflicting movement (for /t/). Further, for /t/, a conflicting/k/ animation decreases the recognition score in AVC by 10% compared to AO.Concerning audiovisual integration, shown in Fig. 12, the changes listed in Table 4 are themost important that can be observed. Several of these changes are similar to the McGurkeffect, even if the change is much smaller (and only took place with a noisy acoustic signal).In conclusion for this study we can argue that the subjects must have a prior knowledgeof articulatory movements of the tongue, since the animations were randomly matched and

20 Augmented Reality
Augmented Reality 21
-20%
-15%
-10%
-5%
0%
5%
10%
15%ApVt ApVk AtVp AtVk AkVp AkVt AlVv AvVl
Ch
an
ge
in
re
sp
on
se
ra
te
p t k l v
Fig. 12. The change in response rate for different consonant labels when comparing AVC with AO. The conflictingstimuli are given on the x-axis, with AxVy indicating that the acoustic signal was of consonant x and the visualsignal of consonant y.
A V + - Explanationp t k v The acoustic signal is incompatible with /t/ &
the visual with /p, v/, /k/ is the most compatible with both.p k p t The acoustic signal is incompatible with /t/,
the jaw movement in /k/ may be interpreted as signaling a bilabial closure.t p k The visual signal is incompatible with /k/.t k p The acoustic signal is incompatible with /k/ &
the jaw movement in /k/ may be interpreted as signaling a bilabial closurek p t k The acoustic signal is incompatible with /p/ &
the visual with /k/, /t/ is the most compatible with both.k t t k The visual signal is compatible with /t/ and incompatible with /k/.l v l The visual signal is incompatible with /l/.v l t p The acoustic signal is incompatible with /l/ &
the visual with /p/, /t/ is the most compatible with both.
Table 4. Observed changes in response when a conflicting animation is added to an acoustic stimuli. Thetable lists the acoustic (A) and the visual (V) signals, the main increase (+) and decrease (-) in the subjects’responses compared to the AO condition and a tentative explanation on why the change takes place.
Fig. 12. The change in response rate for different consonant labels when comparing AVCwith AO. The conflicting stimuli are given on the x-axis, with AxVy indicating that theacoustic signal was of consonant x and the visual signal of consonant y.
A V + - Explanationp t k v The acoustic signal is incompatible with /t/ &
the visual with /p, v/, /k/ is the most compatible with both.p k p t The visual signal is incompatible with /t/,
the jaw movement in /k/ may be interpreted as signaling a bilabial closure.t p k The visual signal is incompatible with /k/.t k p l The acoustic signal is incompatible with /k/, the visual with /t,l/ &
the jaw movement in /k/ may be interpreted as signaling a bilabial closurek p t k The acoustic signal is incompatible with /p/ &
the visual with /k/, /t/ is the most compatible with both.k t t k The visual signal is compatible with /t/ and incompatible with /k/.l v l The visual signal is incompatible with /l/.v l t p The acoustic signal is incompatible with /l/ &
the visual with /p/, /t/ is the most compatible with both.
Table 4. Observed changes in response when a conflicting animation is added to an acousticstimuli. The table lists the acoustic (A) and the visual (V) signals, the main increase (+) anddecrease (-) in the subjects’ responses compared to the AO condition and a tentativeexplanation on why the change takes place.

Augmented Reality Talking Heads as a Support for Speech Perception and Production 21
conflicting and the subjects performed significantly better with the matching movements. Theconflicting animations further showed that subjects integrated both signals in their perception.We are currently planning a follow-up study with a training phase prior to the test, in orderto investigate if consistency between training and test or between acoustics and articulation isthe most important. In this, subjects will be divided into four groups. Group I will be shownmatching audiovisual stimuli in both training and test. Group II will be shown conflictingaudiovisual stimuli in both training and test, but the audiovisual combinations would beconsistent between training and test. Group III will be shown conflicting audiovisual stimuliin the training, but matching in the test. Group IV will be shown matching audiovisual stimuliin the training, but conflicting in the test.If match between the acoustic and visual signals is the most important, then Group I andGroup III will have higher recognition scores than Groups II and IV. If, on the other hand,consistency between training and test is more important, Groups I and II will performsimilarly, and better than Groups III and IV.
4. AR talking heads in speech production training
Several studies on the use of AR talking heads in pronunciation training have been performed(Engwall & Bälter, 2007; Engwall et al., 2006; Fagel & Madany, 2008; Massaro et al., 2008;Massaro & Light, 2003; 2004).In Massaro & Light (2003), Japanese students of English were instructed how to produce /r/and /l/ with either a normal front view of the talking face or with four different AR displaysthat illustrated the intraoral articulation from different views (c.f. Section 2). In Massaro &Light (2004), American hearing-impaired children were instructed how to produce consonantclusters, the fricative-affricate distinction and voicing differences in their native language,using the same four AR displays. In Massaro et al. (2008), English speakers were instructedhow to produce either one pair of similar phonemes in Arabic or one pair of similar phonemesin Mandarin. For the Arabic phoneme pair, the main articulatory difference was the place ofcontact between the tongue and the palate, while for the Mandarin pair, the difference wasin the lip rounding. For the Arabic pair, a cut-away AR side-view was used to illustrate theposition of the tongue, while a normal front view was used for the Mandarin pair.These three studies did not provide any strong evidence that the AR view was beneficial, asjudged by listeners rating the students production before and after the training. In Massaro& Light (2003), the students improved in both training conditions, but those who had beenpresented the AR displays did not improve more than those who had seen the normal faceview. In Massaro & Light (2004), the children did improve, but since they were not comparedwith other subjects who had not been shown the AR talking heads, it can not be concluded thatthis was thanks to the augmented reality-based training. In Massaro et al. (2008), the groupthat practised the Mandarin pair with the normal face view had improved significantly morethan a control group that had only been presented the auditory targets, while the group thatpractised the Arabic phoneme pair was not significantly better than the acoustic only controlgroup. However, many of the subjects in the three studies reported that they really enjoyedthe practise with the AR talking head and believed that it was useful.The outcome in Fagel & Madany (2008) was somewhat better in terms of subject improvement.Children with pathological lisping were instructed how to produce [s, z] during twointeractive lessons with a human teacher and the AR talking head was used as a tool to

22 Augmented RealityAugmented Reality 23
Fig. 13. Change in the tongue articulation of ’r’, from a French rothic in the first attempt (black line, +) toa Swedish alveolar trill (red line, o; blue line, ▽) in the sequence ”rik”.
of the Swedish [r] and [Ê] was measured with ultrasound. Some subjects readily followed theaudiovisual instructions, as exemplified in Fig. 13 showing two French speakers who changedtheir articulation from the French rhotic [K] with a low tongue tip to the Swedish [r] witha raised tip, after a number of attempts and feedback. However, other subjects had greatdifficulties changing the articulation in the short practice session.
The studies described above indicated that it is not an easy task initially to transfer articulatoryinstructions to the own production. However, throughout the different studies, the subjectswere positive about the usefulness of the AR talking heads. They stated that they thought thatthey had improved through the practise and that the feedback instructions had been helpfulto change the articulation. As an example, in Engwall & Bälter (2007), subjects were asked torate the pronunciation training system’s usability on a number of aspects, using a 1-9 Likertscale. For the question regarding if the articulatory animations were confusing (1) or clear (9),the mean opinion score was m=7.75 with a standard deviation of ρ=1.18, and the subjectsfurther stated that the interaction with the virtual teacher was clear (m=7.68, ρ=1.04) andinteresting (m=8.06, ρ=1.31). They also thought that the practice had helped them improvetheir pronunciation (m=7.32, ρ=1.37). It may hence well be the case that AR talking headscould provide the learners with useful information after additional familiarization. For amore thorough discussion of the use of AR talking heads in computer-assisted pronunciationtraining, please refer to Engwall & Bälter (2007) or Engwall (2011).
5. Paths for future research
Many questions concerning AR talking head support remain, regarding both the largedifferences between subjects and for which phoneme sequences the AR animations arehelpful.
It would be interesting to monitor the subjects’ visual attention using an eye-trackingsystem to investigate if there is evidence that the subjects’ viewing patterns influence theirperformance. That is, if subjects with higher perception rates or adequate production changesfocus more on the areas on the screen that provide important information about place andmanner of articulation. By analysing the looking pattern one could also look into if theimportant factor is where the subject looks (on what part of the display) or how (focusedon the task or watching more casually).
All the studies described above have further used naive subjects, in some cases with a shortexplicit or implicit training prior to the perception test. An intriguing question is if long-termuse would make tongue reading a viable alternative for some hearing-impaired subjects, just
Fig. 13. Change in the tongue articulation of ’r’, from a French rothic in the first attempt(black line, +) to a Swedish alveolar trill (red line, o; blue line, 5) in the sequence ”rik”.
illustrate prototypic correct articulations. Listeners, who rated the degree of lisping beforeand after the lessons, judged that there was a significant reduction in lisping for the childrenas a group, but that there were large individual differences.In Engwall et al. (2006), Engwall & Bälter (2007) and Engwall (2011), the subjects were givenfeedback on their articulation, using the AR talking head display shown in Fig. 1(a). Thefeedback was in the form of instructions on how to change the articulation, e.g., ”Lower thetongue tip and move the back of the tongue as far back as you can in the mouth and then slightly forward,to create a wheezing sound.” in order to change the articulation from [S] to [Ê], accompaniedby animations illustrating the instructions in the AR talking heads. In the first study, thesubjects were Swedish children with pronunciation disorders and in the other two, they werenon-native speakers without prior knowledge of Swedish. The first two studies focusedon user evaluations of the interface and the subjects’ improvement in the production of thepractice phoneme, the velar fricative [Ê], was not investigated quantitatively. In the last study,the articulation change that the subjects did when they received feedback on the productionof the Swedish [r] and [Ê] was measured with ultrasound. Some subjects readily followedthe audiovisual instructions, as exemplified in Fig. 13, showing two French speakers whochanged their articulation from the French rhotic [K] with a low tongue tip to the Swedish [r]with a raised tip, after a number of attempts and feedback. However, other subjects had greatdifficulties changing the articulation in the short practice session.The studies described above indicate that it is not an easy task initially to transfer articulatoryinstructions to the own production. However, throughout the different studies, the subjectswere positive about the usefulness of the AR talking heads. They stated that they thought thatthey had improved through the practise and that the feedback instructions had been helpfulto change the articulation. As an example, in Engwall & Bälter (2007), subjects were asked torate the pronunciation training system’s usability on a number of aspects, using a 1-9 Likertscale. For the question regarding if the articulatory animations were confusing (1) or clear (9),the mean opinion score was m=7.75 with a standard deviation of ρ=1.18, and the subjectsfurther stated that the interaction with the virtual teacher was clear (m=7.68, ρ=1.04) andinteresting (m=8.06, ρ=1.31). They also thought that the practice had helped them improvetheir pronunciation (m=7.32, ρ=1.37). It may hence well be the case that AR talking headscould provide the learners with useful information after additional familiarization. For amore thorough discussion of the use of AR talking heads in computer-assisted pronunciationtraining, please refer to Engwall & Bälter (2007) or Engwall (2011).

Augmented Reality Talking Heads as a Support for Speech Perception and Production 23
5. Paths for future research
Many questions concerning AR talking head support remain, regarding both the largedifferences between subjects and for which phoneme sequences the AR animations arehelpful.It would be interesting to monitor the subjects’ visual attention using an eye-trackingsystem to investigate if there is evidence that the subjects’ viewing patterns influence theirperformance. That is, if subjects with higher perception rates or adequate production changesfocus more on the areas on the screen that provide important information about place andmanner of articulation. By analysing the looking pattern one could also look into if theimportant factor is where the subject looks (on what part of the display) or how (focusedon the task or watching more casually).All the studies described above have further used naive subjects, in some cases with a shortexplicit or implicit training prior to the perception test. An intriguing question is if long-termuse would make tongue reading a viable alternative for some hearing-impaired subjects, justas normal speech reading abilities improve with practice and experience. The experimentshave shown that some subjects are in fact very apt at extracting information from the ARtalking head displays and it would be of interest to investigate recognition accuracy and useropinion for such subjects after several longer practice sessions.Further, systematic larger studies are required to determine how AR talking heads may beused as a support for speech perception and in production. With larger subject groups and alarger speech material, the potentials for long term use could be more clearly evaluated.Another question, already introduced in Section 2, concerns the realism of the AR talkinghead: How are the recognition rates and the subjects’ impression of the interface influenced bythe visual representation? That is, are recognition rates higher with videorealistic animationsof the face and/or the intraoral parts or with schematic, more simplified illustrations of themost important articulatory features? We are planning for a perception study comparing the3D AR talking head display with simplified 2D animations of the midsagittal tongue, lips andpalate contours. Kröger et al. (2008) found that 5–8 year old children were as successful inmimicking vowels and consonants if they were presented a 2D- as a 3D-representation of thearticulation. The authors therefore concluded that the more complex 3D view did not provideany additional information. It could however be argued that the 3D model used (only thesurface of the tongue moving in a semi-transparent vocal tract tube, with no face, similar tothe display in Fig. 1(e)) may not represent the full potential of AR talking heads.Other issues that merit further consideration include user preferences for colour coding ofdifferent articulators (contrast vs. realism), correspondence in realism between the face andintraoral parts (potential problems of combining a videorealistic face with computer graphicsfor the tongue and mouth cavity) and strategy to create the Augmented Reality display(see-through or cut-away of the facial skin, or hiding the face).For the last issue, we are interested in investigating the uncanny valley effect for AugmentedReality talking heads. The uncanny valley effect normally refers to the situation in roboticsand 3D computer animation when human observers become negative towards the robot oravatar because it appears to be or act almost like a human, but either lack or have some aspectsthat one would or would not expect from a human. In the case of AR talking heads the effectcould appear if the face of the avatar is so truthfully videorealistic that viewers feel uneasyabout representations suggesting that the head of the avatar has been cut in half or that partsof the skin have been surgically removed. To avoid such reactions it may be suitable either to

24 Augmented Reality
choose a less realistic face or to project intraoral information on the skin of the avatar’s cheekinstead. This could for example be in the form of stylized X-ray or MR Images, which manyviewers are familiar with and they would hence immediately understand the analogy thatthese imaging techniques allow to see what is underneath the skin. With further advances inAugmented Reality display technology and response times for Automatic Speech Recognitionone can also envisage that such a display could be used to provide information directly on areal speaker’s cheek.Even if much research is required to further investigate user reactions, preferences andperformance with AR talking heads, we are convinced that they could potentially have animportant role to play as a support for speech perception and production. In addition, themethods described above to illustrate tongue movements in an AR setting are also of interestfor numerous other applications, such as planning for and rehabilitation after glossectomysurgery, education in phonetics, and animation in computer games and movies.
6. Acknowledgments
This work is supported by the Swedish Research Council project 80449001Computer-Animated LAnguage TEAchers (CALATEA).
7. References
Agelfors, E., Beskow, J., Dahlquist, M., Granström, B., Lundeberg, M., Spens, K.-E. &Öhman, T. (1998). Synthetic faces as a lipreading support, Proceedings of InternationalConference on Spoken Language Processing, pp. 3047–3050.
Badin, P., Elisei, F., Bailly, G. & Tarabalka, Y. (2008). An audiovisual talking head foraugmented speech generation: Models and animations based on a real speaker’sarticulatory data, in F. Perales & R. Fisher (eds), Articulated Motion and DeformableObjects, Springer, pp. 132–143.
Benoît, C. & LeGoff, B. (1998). Audio-visual speech synthesis from French text: Eight years ofmodels, design and evaluation at the ICP, Speech Communication 26: 117–129.
Benoît, C., Mohamadi, T. & Kandel, S. (1994). Effects of phonetic context on audio-visualintelligibility of French, Journal of Speech and Hearing Research 37: 1195–1203.
Beskow, J. (1995). Rule-based visual speech synthesis, Proceedings of Eurospeech, pp. 299–302.Beskow, J., Engwall, O. & Granström, B. (2003). Resynthesis of facial and intraoral motion
from simultaneous measurements, Proceedings of International Congress of PhoneticalSciences, pp. 431–434.
Beskow, J., Karlsson, I., Kewley, J. & Salvi, G. (2004). Synface - a talking head telephonefor the hearing-impaired, in K. Miesenberger, J. Klaus, W. Zagler & D. Burger (eds),Computers Helping People with Special Needs, Springer-Verlag, pp. 1178–1186.
Cohen, M., Beskow, J. & Massaro, D. (1998). Recent development in facial animation: aninside view, Proceedings of International Conference on Audiovisual Signal Processing,pp. 201–206.
Cornett, O. & Daisey, M. E. (1992). The Cued Speech Resource Book for Parents of Deaf Children,National Cued Speech Association.
Engwall, O. (2003). Combining MRI, EMA & EPG in a three-dimensional tongue model, SpeechCommunication 41/2-3: 303–329.

Augmented Reality Talking Heads as a Support for Speech Perception and Production 25
Engwall, O. (2008). Can audio-visual instructions help learners improve their articulation?- an ultrasound study of short term changes, Proceedings of Interspeech 2008,pp. 2631–2634.
Engwall, O. (2010). Is there a McGurk effect for tongue reading?, Proceedings of InternationalConference on Auditory-Visual Speech Processing.
Engwall, O. (2011). Analysis of and feedback on phonetic features in pronunciation trainingwith a virtual language teacher, Computer Assisted Language Learning .
Engwall, O. & Bälter, O. (2007). Pronunciation feedback from real and virtual languageteachers, Computer Assisted Language Learning 20(3): 235–262.
Engwall, O., Bälter, O., Öster, A.-M. & Kjellström, H. (2006). Designing the human-machineinterface of the computer-based speech training system ARTUR based on early usertests, Behavior and Information Technology 25: 353–365.
Engwall, O. & Wik, P. (2009a). Are real tongue movements easier to speech read thansynthesized?, Proceedings of Interspeech, pp. 824–827.
Engwall, O. & Wik, P. (2009b). Can you tell if tongue movements are real or synthetic?,Proceedings of International Conference on Audiovisual Signal Processing.
Fagel, S. & Madany, K. (2008). A 3-D virtual head as a tool for speech therapy for children,Proceedings of Interspeech, pp. 2643–2646.
Fowler, C. (2008). The FLMP STMPed, Psychonomic Bulletin & Review 15: 458–462.Grauwinkel, K., Dewitt, B. & Fagel, S. (2007). Visual information and redundancy conveyed
by internal articulator dynamics in synthetic audiovisual speech, Proceedings ofInterspeech, pp. 706–709.
Guiard-Marigny, T., Ostry, O. & Benoît, C. (1995). Speech intelligibility of synthetic lips andjaw, Proceedings of the International Congress of Phonetical Sciences, pp. 222–225.
Kröger, B., Graf-Borttscheller, V. & Lowit, A. (2008). Two- and three-dimensional visualarticulatory models for pronunciation training and for treatment of speech disorders,Proceedings of Interspeech, pp. 2639–2642.
Liberman, A. & Mattingly, I. (1985). The motor theory of speech perception revised, Cognition21: 1–36.
MacLeod, A. & Summerfield, Q. (1990). A procedure for measuring auditory andaudiovisual speech-reception thresholds for sentences in noise. Rationale, evaluationand recommendations for use, British Journal of Audiology 24: 29–43.
Massaro, D. (1998). Perceiving Talking Faces: From Speech Perception to a Behavioral Principle, MITPress.
Massaro, D., Bigler, S., Chen, T., Perlman, M. & Ouni, S. (2008). Pronunciation training: Therole of eye and ear, Proceedings of Interspeech, pp. 2623–2626.
Massaro, D. & Light, J. (2003). Read my tongue movements: Bimodal learning to perceive andproduce non-native speech /r/ and /l/, Proceedings of Eurospeech, pp. 2249–2252.
Massaro, D. & Light, J. (2004). Using visible speech for training perception and productionof speech for hard of hearing individuals, Journal of Speech, Language, and HearingResearch 47: 304–320.
McGurk, H. & MacDonald, J. (1976). Hearing lips and seeing voices, Nature 264(5588): 746–748.Perkell, J., Guenther, F., Lane, H., Matthies, M., Perrier, P., Vick, J., Wilhelms-Tricarico, R. &
Zandipour, M. (2000). A theory of speech motor control and supporting data fromspeakers with normal hearing and with profound hearing loss, Journal of Phonetics28: 233–272.

26 Augmented Reality
Rizzolatti, G. & Arbib, M. (1998). Language within our grasp, Trends Neuroscience 21: 188–194.Siciliano, C., Williams, G., Beskow, J. & Faulkner, A. (2003). Evaluation of a multilingual
synthetic talking face as a communication aid for the hearing impaired, Proceedingsof International Conference of Phonetic Sciences, pp. 131–134.
Sjölander, K. (2003). An HMM-based system for automatic segmentation and alignment ofspeech, Proceedings of Fonetik, pp. 93–96.
Skipper, J., Wassenhove, V. v., Nusbaum, H. & Small, S. (2007). Hearing lips and seeingvoices: How cortical areas supporting speech production mediate audiovisualspeech perception, Cerebral Cortex 17: 2387 – 2399.
Sumby, W. & Pollack, I. (1954). Visual contribution to speech intelligibility in noise, Journal ofthe Acoustical Society of America 26: 212–215.
Summerfield, Q. (1979). Use of visual information for phonetic perception, Phonetica36: 314–331.
Wik, P. & Engwall, O. (2008). Can visualization of internal articulators support speechperception?, Proceedings of Interspeech, pp. 2627–2630.