Auditory Selective Attention: an introduction and evidence for distinct ...
99
Aus dem Epilepsiezentrum Erlangen Leiter: Prof. Dr. med. Hermann Stefan der Neurologischen Klinik mit Poliklinik der Friedrich-Alexander-Universität Erlangen-Nürnberg Direktor: Prof. Dr. med. Stefan Schwab Durchgeführt im Helen Wills Neuroscience Institute der University of California, Berkeley, USA Direktor: Robert T. Knight, M.D. Betreuer: Aurélie Bidet-Caulet, Ph.D. Auditory Selective Attention: an introduction and evidence for distinct facilitation and inhibition mechanisms Inaugural-Dissertation zur Erlangung der Doktorwürde der Medizinischen Fakultät der Friedrich-Alexander-Universität Erlangen-Nürnberg vorgelegt von Constanze Elisabeth Anna Mikyska aus München
-
Upload
truonghanh -
Category
Documents
-
view
220 -
download
0
Transcript of Auditory Selective Attention: an introduction and evidence for distinct ...

Aus dem Epilepsiezentrum Erlangen
Leiter: Prof. Dr. med. Hermann Stefan
der
Neurologischen Klinik mit Poliklinik
der Friedrich-Alexander-Universität
Erlangen-Nürnberg
Direktor: Prof. Dr. med. Stefan Schwab
Durchgeführt im
Helen Wills Neuroscience Institute
der
University of California, Berkeley, USA
Direktor: Robert T. Knight, M.D.
Betreuer: Aurélie Bidet-Caulet, Ph.D.
Auditory Selective Attention: an introduction and
evidence for distinct facilitation and inhibition mechanisms
Inaugural-Dissertation
zur Erlangung der Doktorwürde
der Medizinischen Fakultät
der
Friedrich-Alexander-Universität
Erlangen-Nürnberg
vorgelegt von
Constanze Elisabeth Anna Mikyska
aus
München

Gedruckt mit Erlaubnis der
Medizinischen Fakultät der
Friedrich-Alexander-Universität
Erlangen-Nürnberg
Dekan: Prof. Dr. med. Dr. h.c. J. Schüttler
Referent: Prof. Dr. med. H. Stefan
Korreferent: Prof. Dr. med. Dipl.-Psych. Ch. Lang
Tag der mündlichen Prüfung: 29. Februar 2012

To my family

Table of contents
1 Summary 1 1.1 Summary 1
1.2 Zusammenfassung 3
2 Introduction 5 2.1 Auditory system: anatomy and function 5
2.1.1 Ear 5
2.1.2 Sub-cortical auditory relays 10
2.1.3 Auditory cortex 13
2.2 Investigation of auditory perception and processing 14
2.2.1 Psychophysics – psychoacoustics 15
2.2.2 Brain activity – electroencephalography (EEG) 17
2.2.2.1 Introduction and history 17
2.2.2.2 Physiological fundamentals 17
2.2.2.3 Recording 22
2.2.2.4 Classification of frequency 25
2.2.2.5 Artifacts 27
2.2.2.6 Data analysis: preprocessing and
event-related potentials (ERP) 30
2.2.2.7 Main auditory electrophysiological components 31
2.3 Auditory attention 35
2.3.1 Psychological theories 35
2.3.1.1 Introduction to selective attention 35
2.3.1.2 Bottleneck theories: early- versus late-selection 37
2.3.1.3 Other capacity-limitation theories 40
2.3.2 Electrophysiological findings and theories 42
2.4 Aims of this dissertation 49
3 Material and methods 54 3.1 Subjects 54
3.2 Stimuli and task 54

3.3 Procedure 57
3.4 EEG recording 57
3.5 EEG data analysis 57
3.6 Statistical analysis 58
3.6.1 Selection of applied methods 58
3.6.1.1 Analysis of variance (ANOVA) 58
3.6.1.2 Statistic permutation test 59
3.6.2 Behavioral data 60
3.6.3 ERP standards 61
3.6.4 ERP deviants 62
4 Results 64 4.1 Behavioral data 64
4.2 ERP results of standards 65
4.2.1 Main attention effect (attended versus ignored) 65
4.2.2 Influence of the memory task difficulty
on attention effects 66
4.2.3 Timing of attention facilitation and inhibition 70
4.2.4 Topographies of attention facilitation and inhibition 72
4.3 ERP results of deviants 73
4.3.1 Attention enhancement of deviant processing 73
4.3.2 Memory effect on the P3-Component 75
5 Discussion 77
6 References 82
7 List of abbreviations 90
8 Publication 92
9 Acknowledgements 93 10 Curriculum vitae 94

1
1 Summary 1.1 Summary
Objective
Auditory selective attention is a complex brain function that is still not completely
understood. The classic example is the so-called “cocktail party effect” (Cherry,
1953), which describes the impressive ability to focus one’s attention on a single
voice from a multitude of voices. This means that particular stimuli in the
environment are enhanced in contrast to other ones of lower priority that are ignored.
To be able to understand how attention can influence the perception and processing
of sound, background knowledge is essential.
One aim of this dissertation is to provide an overview of already existing literature.
Therefore, the auditory system and different methods to measure and evaluate
auditory processes are introduced at first, followed by a review about competing
theories, trying to explain how auditory attention operates.
The second aim of the dissertation is to specify the mechanisms and to elucidate how
they operate. It is generally accepted that distinct signals (top-down signals) are
important for cognitive control, enabling selective attention and leading to an
enhanced processing of task relevant information. But it is unknown whether
facilitation and inhibition of stimulus processing are based upon one (unitary gain
control mechanism of facilitation) or two mechanisms (net activity of distinct top-
down facilitation and inhibition mechanisms). Results from a visual fMRI study (de
Fockert, 2001) suggest that facilitation and inhibition rely on distinct mechanisms
that would be differentially affected by the availability of cognitive resources (i.e. for
performing a task).
To reveal that facilitation and inhibition represent distinct mechanisms in auditory
selective attention, we conducted a study, where subjects performed an auditory
attention task, while the amount of available cognitive resources was modulated (by
varying the difficulty of a memory task).
Methods
Electrophysiological experiments were conducted in young healthy adults. 16
subjects performed an attention task and a memory task of varying difficulty (no,
easy and difficult memory) at the same time (dual task protocol) while EEG was
recorded. Facilitation and inhibition were measured by comparing

2
electrophysiological responses to attended and ignored sounds with responses to the
same sounds when attention was considered to be equally distributed towards all
sounds.
Results
Two ERP-components were observed: a negative one in response to attended sound
and a positive one to ignored sounds. The two frontally distributed components had
distinct timing and scalp topographies and were differentially affected by the
difficulty of the memory load.
Conclusion
This dissertation provides an insight into the literature of auditory selective attention
and also enriches the existing knowledge with results of a new study about the
operating mechanisms of auditory selective attention. The study provides evidence
that top-down attention control can operate via distinct facilitation and inhibition
mechanisms.

3
1.2 Zusammenfassung
Hintergrund und Ziele
Selektive auditorische Aufmerksamkeit ist ein komplexer Mechanismus, der noch
nicht vollständig verstanden ist. Das klassische Beispiel ist der sogenannte „Cocktail
Party Effekt“ (Cherry, 1953). Dieser beschreibt die beeindruckende Fähigkeit, die
Aufmerksamkeit auf einen einzelnen Sprecher zu konzentrieren und andere
Unterhaltungen auszublenden. Das bedeutet, dass bestimmte Reize in unserer
Umwelt verstärkt wahrgenommen werden, wohingegen Reize von niedrigerer
Priorität ignoriert werden. Um zu verstehen, wie Aufmerksamkeit die Wahrnehmung
und Verarbeitung von Reizen beeinflusst, gibt der erste Teil dieser Dissertation einen
Überblick der Grundlagenliteratur. Dabei werden zuerst das auditorische System
vorgestellt und verschiedene Methoden zur Messung und Beurteilung auditorischer
Verarbeitungsprozesse eingeführt. Dem folgt ein kurzer Überblick über
konkurrierende Theorien, die zu erklären versuchen, wie selektive auditorische
Aufmerksamkeit funktioniert.
Der zweite Teil dieser Arbeit befasst sich genauer mit der Frage nach den
Mechanismen und wie diese arbeiten. Es ist allgemein anerkannt, dass bestimmte
Signale (top-down Signale) wichtig für die kognitive Kontrolle sind. Sie aktivieren
selektive auditorische Aufmerksamkeit und führen so zu einer verstärkten
Verarbeitung eines relevanten Reizes. Aber es ist noch ungeklärt ob die Förderung
und Hemmung der Reizverarbeitung durch einen (einheitlicher, linearer
Verstärkungsmechanismus von Förderung) oder zwei Mechanismen
(Netzwerkaktivität von unabhängiger Förderung und Hemmung) geregelt wird.
Ergebnisse einer visuellen fMRT Studie zeigen, dass das Ausmaß der Hemmung
ablenkender Reize von der Verfügbarkeit kognitiver Ressourcen (z.B. für das Lösen
von Problemen) abhängig ist (de Fockert, 2001). Die Ergebnisse deuten darauf hin,
dass Förderung und Hemmung im visuellen System auf verschiedenen Mechanismen
basieren, die von der Verfügbarkeit kognitiver Ressourcen unterschiedlich
beeinflusst werden.
Um zu zeigen, dass Förderung und Hemmung unabhängig voneinander agieren,
führten wir eine Studie durch, in der Probanden einen auditorischen
Aufmerksamkeitstest lösten, während die Verfügbarkeit von kognitiven Ressourcen
variiert wurde (verschiedene Schwierigkeitsstufen in einem Gedächtnis Test).

4
Methoden
Elektrophysiologische Versuche wurden mit 16 jungen, gesunden Erwachsenen
durchgeführt. Die Probanden lösten gleichzeitig (dual task protocol) einen
Aufmerksamkeits- und einen Gedächtnis Test mit variierenden Schwierigkeitsstufen
(no, easy und difficult memory) während elektrophysiologische Signale (EEG)
aufgezeichnet wurden. Förderung und Hemmung wurden gemessen, indem die
Antworten zu den beachteten und den ignorierten Reizen jeweils mit den Antworten
auf die gleichen Reize einer Kontrollbedingung verglichen wurden. In dieser
Kontrollbedingung wurde angenommen, dass die Aufmerksamkeit ausgewogen auf
alle Reize gerichtet war.
Ergebnisse und Beobachtungen
Zwei ERP-Komponenten wurden beobachtet: eine negative, in Antwort zu den
beachteten Reizen und eine positive, den ignorierten Reizen folgend.
Die zwei Komponenten zeigten verschiedene frontale Skalp-Topographien und
variierten auch in der zeitlichen Domäne. Außerdem wurden sie unterschiedlich von
der Schwierigkeit des Gedächtnis Tests beeinflusst.
Praktische Schlussfolgerungen
Diese Dissertation bietet einen Einblick in die Literatur über selektive auditorische
Aufmerksamkeit und bereichert das bestehende Wissen mit Ergebnissen einer neuen
Studie über die Wirkmechanismen. Die Studie erbringt den Nachweis, dass top-down
Kontrolle die Aktivität voneinander unabhängiger Förderungs- und
Hemmungsmechanismen widerspiegelt.
5
2 Introduction The auditory system processes acoustic waves, leading to auditory percepts. An
important issue is to understand how attention can influence the perception of sound,
i.e. the processing of sounds. In other words, by which mechanisms and at which
step of sound processing, auditory attention operates. To address this question,
several basic principles will be introduced first: (1) the anatomy of the auditory
system and the sequence of sound processing from the outer ear to the auditory
cortices, (2) different methods to measure and evaluate auditory processes
(especially the electroencephalography), (3) auditory attention and the attempt of
psychological and physiological theories to elucidate its influence on sound
processing. Finally, (4) the aims of the present study are introduced.
2.1 Auditory system: anatomy and function
The auditory system is a remarkable sensory organ. Both ears are involved in sound
detection from all directions regardless of the organism’s current orientation.
Processing takes place, while information about the stimuli is transmitted along
complex sub-cortical relays to the auditory cortex. The final processing and
interpretation occurs in the auditory cortex and in surrounding higher order areas.
2.1.1 Ear
Outer ear
Sound waves first reach the outer ear, which is composed of the pinna (auricle), the
ear canal (external acoustic meatus) and the eardrum (tympanic membrane). The
pinna, the visible part of the outer ear, collects and focuses sound waves, and directs
them through the ear canal (approximately 30 to 35 mm long and 7 mm in diameter)
to the eardrum, which transmits sound vibrations to the middle ear (see Figure 2.1).

6
Figure 2.1 – The anatomy of the ear (adapted from Netter, 2006).
Middle ear
The middle ear is an air filled cavity consisting of different muscles and the three
ossicles (malleus, incus and stapes). There are also two openings, linking the middle
ear to the inner ear over membranes: the oval (vestibular) window adjoining the
perilymph in the scala vestibuli and the round (cochlear) window connecting to the
perilymph in the scala tympani (see Figure 2.1).
The malleus is attached to the inner surface of the tympanic membrane and transmits
the arriving vibration to the incus and the stapes, which is attached to the membrane
of the oval window. This small bone is stabilized by the stapedius muscle, which
controls the amplitude of sound waves by pulling the stapes away from the oval
window and therefore protects the inner ear from high noise levels (Trepel, 2008).
The tensor tympani muscle functions in a similar manner by pulling the malleus, thus
tensing the tympanic membrane.
From a physical point of view, two mechanisms permit an increased
efficiency of sound transmission (Schmidt, 1993): (1) the reduced surface of the
membrane of the oval window compared to the surface of the tympanic membrane
causes an enhancement of pressure and (2) the lever system of the ossicles leads to

7
an adaptation between the low impedance of the air in the middle ear and the high
impedance of the fluid in the inner ear.
The middle ear is only functioning as long as the tympanic cavity is
ventilated and its pressure is matched to the atmosphere. This is assured by the
Eustachian tube, which links the middle ear to the nasopharynx. An upper airway
infection can cause swelling and occlusion of the tube, which can result in an ear
infection as well as in a rupture of the tympanic membrane, caused by a pathological
pressure difference (Schmidt, 1993).
Inner ear
The inner ear contains the vestibular system, dedicated to balance and spatial
orientation, and the cochlea, which is essential for hearing. The cochlea is part of the
osseous labyrinth and turns like a snail two and a half times around a core of bone
(modiolus), in which the cochlear nerve runs. This labyrinth is filled with perilymph,
a derivative of the cerebrospinal fluid, similar to extracellular fluid, and also contains
a membranous labyrinth: the cochlear duct (scala media), filled with endolymph (a
fluid with a high content of potassium, similar to intracellular fluid). The cochlear
duct is formed by the Reissner's membrane above and the basilar membrane below
and also holds the organ of Corti (organum spirale). This is the sensory organ of
hearing and is comprised of receptor cells (hair cells), different types of supporting
cells (cells of Deiters, Hensen, Claudius and Boettcher) and the basilar membrane
(see Figure 2.2 A and B). The hair cells are arranged in one row of inner and three
rows of outer hair cells and make contact with neurons on their basis (see Figure 2.2
B). Additionally, they have stereo cilia (hair bundles) on their free surface, which are
attached to each other by filamentous structures, called tip-links (Roberts, 1988). The
stereo cilia from the outer hair cells are conjoined to the tectorial membrane – a
colloidal membrane that covers the organ of Corti. Furthermore the cochlear duct
separates two structures: the scala vestibuli (above) and the scala tympani (below),
that merge at the apex of the cochlea (helicotrema) and so the perilyphm can flow
from one scala to another. The organ of Corti sits on top of the basilar membrane
along the entire length of the scala media.

8
Figure 2.2 – Models of the cochlea and the organ of Corti.
(A) Cross section through a turn of the cochlea showing the scala vestibuli, the scala
tympani and the cochlear duct with the organ of Corti. (B) The anatomical structures
of the organ of Corti (adapted from Hawkins, 1997).

9
If a sound impacts the tympanic membrane and is transmitted from malleus to
incus and stapes, the arriving vibrations cause the membrane of the oval window to
produce pressure waves within the incompressible perilymph of the scala vestibuli.
These pressure waves lead to vibrations of the Reissner's membrane and moreover to
deflections of the basilar membrane, which is also called travelling wave (Von
Bekesy, 1960). Thus, the stereo cilia of the inner hair cells are displaced, causing an
action potential in the cochlear nerve. Because the basilar membrane is more rigid at
the basal aspect of the cochlea compared to the apical part, higher frequencies lead to
a bigger deflection of the basilar membrane at basal parts of the cochlea, whereas
lower frequencies are mapped at the apical parts. These spatial arrangements of
sound information is called tonotopy (Von Bekesy, 1960) and is more or less
maintained throughout the auditory pathway, so that the frequency content of a
sound is constantly decipherable.
Especially the hair cells are essential for the generation of action potentials
because of their characteristic features: the outer hair cells operate as an (cochlear)
amplifier, ensuring the sensitivity and tuning of the cochlea. By active contractions
that displace the basilar and tectorial membrane they can enhance the endolymphatic
flow and therefore also increase the travelling wave. They are innervated by efferent
nerve fibers from the superior olivary complex (see Figure 2.3). Interestingly, a
diminutive part of the kinetic energy of the outer hair cells travels back through the
middle ear to the ear canal, where it can be recorded as sound (Kemp, 1978). This is
called otoacoustic emission (OAE) and this method is used for examining the
function of the outer hair cells and for screening newborn babies for hearing defects.
The proper stimuli for the inner hair cells are hydrodynamic forces of endolymph,
moving the freestanding hair bundles (hydrodynamic coupling) (Hudspeth, 1983).
The inner hair cell is a seconday receptor cell and cannot generate an action
potential. The mechanical stimulus rather triggers a receptor potential (mechano-
electrical transduction) that is transferred from electrical to chemical signal and
transmitted to an afferent neuron.
More detailed: if the stereocilia are moved in one direction, tensing the tip
links, mechanically gated ion channels on the top of the hair cells open and
positively charged ions (especially potassium) enter the cell and cause a
depolarization, which leads to a receptor potential that can occur up to 5000 times
per second. This receptor potential opens voltage gated calcium channels and ions

10
enter the cell and trigger the release of neurotransmitters (glutamate) at the basal end
of the inner hair cell. Another depolarization is inhibited, if the hair bundles are
deflected to the other direction, relaxing the tip links, (Schmidt, 2005). The released
glutamate diffuses through the synaptic cleft and binds to the postsynaptic receptor
(AMPA receptor), which triggers a postsynaptic potential that causes an action
potentials in the afferent neuron. This process is called transformation. The number
of axons firing and the frequency of the action potentials encode for the volume of a
sound (amplitude), i.e. high volume will result in higher frequencies of action
potentials.
2.1.2 Sub-cortical auditory relays
The signal is processed along six or more neurons consecutively forming synapses
(see Figure 2.3). Coming from the inner hair cells, the signal runs along the afferent
nerve fiber to the spiral ganglion (first order neuron), located within the central
aspects of the cochlea. Together with the vestibular nerve coming from receptor cells
of the vestibular system, the cochlear nerve forms the vestibulocochlear nerve (the
VIIIth cranial nerve), which runs through the internal acoustic meatus in the petrosus
part of the temporal bone and enters the cranium through the porus acusticus internus
(Trepel, 2008). The nerves run to the cerebellopontine angle and from there to the
brainstem, where the vestibulocochlear nerve splits again and each part runs to their
cranial nerve nuclei.
The cochlear nuclei consist of the nucleus cochlearis anterior (ventralis) and
posterior (dorsalis), both located at the inferior cerebellar peduncle, a part of the
medulla oblongata. In these nuclei not only the first relay takes place (to second
order neurons) but also the first processing of the sensory input occurs: an automatic
decoding of the basic signal (duration, intensity and frequency).
From the nucleus cochlearis anterior a minor aspect of the nerve fibers runs
on the ipsilateral side, whereas the major part decussates in the corpus trapezoideum
(located in the pons) to the contralateral side (Trepel, 2008). Moreover the corpus
trapezoideum contains the nuclei corporis trapezoidei and the nuclei olivares
superiors (superior olivary complex), where the neurons also form synapses (third
order neuron).
The fibers from the nucleus cochlearis posterior form a minor part of the
auditory system and decussate separately from the corpus trapezoideum to the

11
contralateral side, without forming any synapse with other neurons. Additionally
some of the neurons starting from the nucleus cochlearis posterior hold partly
excitatory and also partly inhibitory neurons, which can inhibit processing in
subsequent levels of the pathway (Schmidt, 2005).
On the contralateral side all auditory nerve fibers form the lemniscus lateralis,
where the neurons come together in synapses (nuclei lemnisci lateralis; fourth order
neurons) and either decussate back to the originally ipsilateral side or run to the
colliculus inferior (fifth order neuron) – part of the corpora quadrigemnia, located in
the mesencephalon (Trepel, 2008). At this location and also in the superior olivary
complex the direction of the sound is analyzed by specialized neurons, comparing
the timing of action potentials, coming from both cochleae.
From here, some nerve fibers decussate again to the contralateral side through
the brachium colliculi inferioris, but most of them continue to the corpus
geniculatum mediale of the thalamus, located in the diencephalon. The geniculate
neurons (sixth order neurons) project their axons through the capsula interna to the
primary auditory cortex (radiatio acustica).
This complex and intensely interconnected pathway is crucial to connect both
cochleae to the left and right auditory cortices, which is important for bilateral
processing and comparing sounds from the right and left side (Schmidt, 2005).

12
Figure 2.3 – Simplified scheme of the central auditory pathway.
CGM = Corpus geniculatum mediale, HG = Heschl’s gyrus (there can be two
Heschl’s gyri, HG1 and HG2), PP = planum polare, PT = planum temporale, STG =
superior temporal gyrus, MTG = medial temporal gyrus (adapted from Bidet-Caulet,
2006).

13
2.1.3 Auditory cortex
The auditory cortex consists of the primary auditory cortex and higher level
surrounding areas. The primary auditory cortex (A1, Broadmann area 41) is located
on the supratemporal plane of the temporal lobe (Pandya, 1995) and it is only visible
after removing the frontal and parietal operculum. The medial part of the gyri
temporales transversi, also called Heschl’s gyrus, named after Richard Heschl, an
Austrian anatomist (1824 – 1881), forms the major part of the primary auditory
cortex. As an expression of cerebral anatomically asymmetry, some individuals can
have two Heschl’s gyri – mostly on the right side, whereas also morphological
variations, with the left side being larger, are postulated (Geschwind, 1968).
Most neurons in A1 are organized according to the frequency of sounds they
respond the best to (Howard, 1996). Afferent fibers carrying information about low
frequencies end more anterolateral in Heschl’s gyrus, whereas high frequencies are
mapped more posteromedial (Trepel, 2008). This frequency map corresponds to the
tonotopic organization of the auditory pathway. Other than that, there is also an
organization for binaural properties. The neurons are arranged in different stripes.
For instance: one stripe is excited by both ears (EE cells) whereas the neurons in
another stripe are firing by receiving information from one ear and are inhibited by
input from the other ear (EI cells). This organization is comparable to the ocular
dominance columns in the primary visual cortex (V1) (Purves, 1997).
The higher order auditory areas (Brodmann area 42 and 22) laterally adjoin
the primary auditory cortex and are located posteriorly in the planum temporale,
aneriorly in the planum polare and laterally in the superior temporal gyrus (STG).
These areas receive the majority of the afferent information from A1. They are less
precise in their tonotopic organization and mainly operate by interpreting the
detected sounds as words, melody, rhythm or noise (Trepel, 2008). In the dominant
hemisphere within an area of the secondary auditory cortex, named Wernickes area,
the information is processed and integrated into speech comprehension. This area is
located in the posterior section of the superior temporal gyrus (Brodmann area 22).
The dominant hemisphere is the one controlling and processing speech and
understanding, which is mostly located at the opposite side of the dominant hand –
i.e. the left hemisphere for about 95 % of right-handed population, but also for 70 %
of the left-handed people (Rickheit, 2003). A lesion in this area leads to the so-called
sensory aphasia, receptive aphasia or Wernicke’s aphasia, which main symptom is

14
the disability to understand speech. The patient is still able to speak fluently, but it
makes little or no sense, because the word is not linked to its proper meaning.
The secondary auditory areas also receive afferent input from the angular gyrus that
gets it information from the secondary visual cortex. This circuit is important for the
combination of visual and auditory input to its meaning, crucial for reading and
writing.
Furthermore, there may be two major streams of information processing
comparable to the ‘what‘ and ‘where’ streams in the visual system (Kaas, 1999). To
simplify: the information about spatial location (‘where’) would run from A1 to
posterior higher order areas and continue to the parietal lobe and the posterior parts
of the dorsolateral prefrontal cortex. Object-related properties would be processed
within a ‘what’ pathway composed of the primary auditory cortex, anterior higher
order areas and ventral and medial prefrontal areas.
Given the knowledge about the complex auditory system, the obvious
questions follow: how does the brain interpret acoustic waves to produce a percept
and with what kind of methods and procedures is it possible to measure, evaluate and
interpret auditory perception and processing.
2.2 Investigation of auditory perception and processing
There are two main approaches attempting to investigate auditory perception and
processing. (1) Psychophysics analyzes the interaction between physical stimuli that
are quantitative measurable and the subjective perception, triggered by the stimuli. A
section of psychophysics is psychoacoustic describing the relationship between a
subjective auditory impression and the appropriate physical stimulus. (2) Brain
activity can be measured using four main techniques, each representing a different
approach.
Electrophysiological methods like the Electroencephalogram (EEG), on which the
following part is mainly concentrated, reveals electrical activity generated by the
brain. The recording electrodes can be placed in different locations: on the scalp
(EEG), directly on the cortex (Electrocorticogram, ECoG) or into structures deeper
in the brain (Stereotactic EEG, SEEG). ECoG and SEEG are both invasive
intracranial recording techniques.

15
Also magnetic fields produced by electrical currents can be measured using the
Magnetoencephalogram (MEG).
Other techniques using Imaging technology provide a different view of brain
activity: Important to mention is the magnetic resonance imaging (MRI). It uses
powerful magnets to excite hydrogen nuclei. These atomic nuclei emit a signal while
returning to the initial point of excitement (relaxation). The signal can be measured
and computed into structural images of the brain. It is also possible to visualize the
brain function with the functional MRI (fMRI). Neuronal activity enhances
metabolic processes resulting in changes of blood flow. Hemoglobin features
different oxygenation levels that are measurable as different MRT signals showing
different activated structures in the brain. This is called the Blood Oxygen Level
Dependency effect (BOLD-effect).
Another imaging technique, the Positron emission tomography (PET), visualizes
metabolic processes by showing the distribution of a radioactive tracer in the brain.
The tracer is attached to a biological active molecule and injected into the blood
circulation; the most commonly used is fluorodeoxyglucose (FDG).
A compatible and complimentary use of some of these methods is possible.
2.2.1 Psychophysics – psychoacoustics
The appropriate stimulus for the ear is a sound wave, which is generally comprised
of several frequencies (expressed in Hertz) and pressure oscillations. The magnitude
of a pressure wave is the amplitude and is also called sound pressure (P, 1
Pa=1N/m). The human ear can detect sounds in a wide range of amplitude and
therefore sound pressure is often expressed as a level on a logarithmic decibel (dB)
scale, also called sound pressure level (SPL, L):
L = 20 log Px/P0 [dB] (Schmidt, 2005).
The term level means, that the sound pressure measured (Px), is in a logarithmic ratio
to another sound pressure (P0), which is the absolute threshold of hearing (2*10-5
Pa). That indicates, that few decibels imply a multiplication of the sound pressure.
The most important way to examine a persons hearing ability is an
audiometry test. Different tones are presented through headphones at different levels
and the tested person has to press a button as soon as the tone is heard to determine

16
the individual threshold of audibility. The perception of loudness indicates how loud
a person perceives a sound and therefore it cannot objectively be measured. But it is
still related to the sound pressure level and the duration of a sound. If the sound
pressure increases, a sound is perceived louder and high frequencies are heard as a
high tone (and the other way around). Furthermore, at a constant sound pressure,
tones are perceived louder at frequencies between 2000 and 5000 Hz (Schmidt,
1993). Therefore the sound pressure must be adjusted to the frequencies in order to
perceive all tones at the same loudness (isophon). Thereby a chart is created (see
Figure 2.4) that shows equal loudness curves, which are also called Fletcher-Munson
curves (Fletcher, 1933). Values at 1000 Hz can also be named phon and per
definition, one phon equals one decibel at 1000 Hz. The human hearing is limited to
frequencies between 20 Hz and 16.000 Hz and loudness between 4 and 130 phon
(Schmidt, 2005). A normal spoken word would be found at around 50 to 70 decibel
and a painful tone at around 130 decibel (Schmidt, 2005).
Figure 2.4 – The Fletcher-Munson curves.
Equal loudness curves. The intensity (vertical axis) is adapted to the frequencies
(horizontal axis) to perceive all sounds at the same loudness. Values at 1000 Hz are
called phon. Phon levels of 0, 10, 20, 30,…120 are depicted (adapted from Fletcher,
1933).

17
2.2.2 Brain activity – electroencephalogram (EEG)
2.2.2.1 Introduction and history
In the 1870’s electrical activity was recorded from a mammalian brain for the first
time. Richard Caton was an English psychologist, who reported in 1875 spontaneous
activity directly from the exposed cortex of rabbits and monkeys (Millett, 2001).
This laid the groundwork for Hans Berger (1873-1941), a German psychiatrist at the
University of Jena, who first recorded the activity from a human brain in 1929. He
applied electrodes on the head of patients, who had skull defects and recorded the
first elctroencephalogram (Millett, 2001). The skull defects are comparable to a
today’s decompressive craniectomy (performed in patients with traumatic brain
injuries to reduce elevated intracranial pressure by taking out a part of the skull for a
few months). This was the invention of a technique that revolutionized the current
clinical and psychological work and research.
Even though new great inventions like the Positron emission tomography (PET), the
Magnetic resonance imaging (MRI) or the MEG provide new opportunity to
investigate the Human brain, the EEG still remains the gold standard for diagnosing
numerous diseases and it is crucial for studying the dynamics of brain activity.
2.2.2.2 Physiological fundamentals
The human brain is mostly constituted of neurons – cells specialized in transmitting
and processing information via electrical and chemical signals – and glia cells (for
example: astrocytes, oligodendrocytes, radial glia, microglia) providing support and
electrical insulation for the neurons and also maintaining ion homeostasis of the
brain. Glia cells also show electrical activity, which is probably too small to
contribute to an EEG (Araque, 2004).
Neurons show a negative intracellular membrane potential (–70mV) compared to the
extracellular space. During a depolarization, positively charged ions (especially
sodium) enter the cell, generating an action potential. Subsequently, positively
charged ions (potassium) diffuse out of the cell (repolarisation) and the voltage
returns to its initial value. The duration of an action potential is between less than a
millisecond and up to few milliseconds and it can occur over 5000 times per second
(5000 Hz). The neurons communicate over synapses. One depolarized afferent
neuron releases neurotransmitter, which opens ion channels on the postsynaptic
membrane of the subsequent neuron. There are different neurotransmitters with

18
distinct properties: glutamate (generally excitatory), GABA and glycin (generally
inhibitory) and acetylcholine (excitatory or inhibitory depending on the receptor).
The induced postsynaptic potentials (excitatory or inhibitory, EPSP or IPSP) are
relatively slow and followed by voltage fluctuations that can be measured from EEG
electrodes.
For instance, an excitatory neurotransmitter like glutamate causes a
depolarization of the dendrites, which leads to a sodium and calcium influx or to a
reduced potassium efflux. In this case, the surface of the dendrite shows a reduced
electric charge compared to a positive charge inside the cell (see Figure 2.5). This
potential difference generates a dipole. On the other hand, an inhibiting synapse
causes a hyperpolarisation of neurons and therefore a positivity of the extracellular
space. The ion flow induces a modified distribution of ions in the extracellular space
that is balanced from adjacent extracellular compartments.
Figure 2.5 – Model of a neuron generating a field potential.
The afferent fiber induces an EPSP at the dendrites of the neuron. The ion influx in
the cells results in a negative field potential and a dipole (dashed lines) (adapted from
Ebner, 2006).

19
Electrical changes from one single neuron cannot be recorded from an EEG
electrode, because the amplitude is too small and there is a considerable distance
between neurons and electrodes. The recorded electrical activity is rather a
summation of voltage fluctuations caused by EPSPs and/or IPSPs of many neurons
within a population.
Given that a neuron is part of a population, extracellular potentials are
behaving according to the orientation and the polarity of the neurons. A summation
of the field potentials happens only if the neurons are organized in parallel or serial
networks and if they have similar morphological polarization. This situation is called
open field (see Figure 2.6 A). Special neurons in the human cortex (pyramidal cells)
– mainly organized vertically – primarily generate the electrical potentials one can
see in the EEG.
On the other hand, in a closed field (see Figure 2.6 B), the current flow is canceled
out within the population. This happens if the neurons are arranged in stellate
morphology with dendrites extending radially outward, or if the neurons are
randomly oriented, for example, interneurons show closed field potentials (Ebner,
2006).
Figure 2.6 – Orientation of neurons.
(A) A parallel orientation results in a measurable signal – it is called an open field.
(B) A stellate organisation results in a marginally measurable signal- it is called a
closed field (adapted from Ebner, 2006).

20
The EEG signal recorded from the scalp is composed of frequencies between 0,5 –
80 Hz and amplitudes in a range from 1 – 100 µV (Schmidt, 2005). The spontaneous
EEG signal mostly displays noise, but nevertheless the state of arousal and the areas
of higher activity can be displayed and mapped on a scalp model. Therefore, it is
important to consider the orientation of the generator population. It can be located
vertically to the surface of the cortex (see Figure 2.7 B). In this case, the dipole
moment is presented as a radial dipole and the scalp topography shows about the
localization of the source (Ebner, 2006) (see Figure 2.7 D). A tangential dipole
would result if the neurons were arranged tangential to the cortical surface (see
Figure 2.7 A) and for this, the maximal negativity or positivity of the scalp
topography would not show the actual source (see Figure 2.7 C). The source is rather
located in between the two maxima with opposite signs on the scalp. Therefore, one
must not reason that the biggest signal in the EEG presents the location of the biggest
activity in the brain. This is called the inverse problem. Consequently, interpreting
EEG scalp results requires carefulness, especially with respect to locating the
generator.
Moreover, the further away a dipole is from the scalp, the broader the distribution
and the smaller the amplitude of the signal.

21
Figure 2.7 – Model of the localization of the neurons generating a dipole.
(A) Neurons are orientated tangential to the folded cortical surface resulting in a
tangential dipole moment (C). Neurons are orientated perpendicular to the folded
cortical surface (B) resulting in a radial dipole moment (D) (adapted from Ebner,
2006).

22
2.2.2.3 Recording
EEG corresponds to the difference of 2 electrodes potentials, one of interested
positioned on the scalp and one reference (see Figure 2.8).
Figure 2.8 – A subject set up with electrodes, ready to start the experiment
(picture taken in the testing booth of the Helen Wills Neuroscience Institute at the
University of California, Berkeley, USA).
Electrodes
Electrodes are small metal discs, which are mainly made of silver, but also platinum,
gold or tin. Mostly silver / silver chloride (Ag / AgCl) electrodes are used, because
this compound reduces the polarization effect. This is a counter voltage that arises
while the voltage on the scalp is constant or slowly changing (Ebner, 2006). These
kinds of electrodes not only record brain activity, but also interfering activity, for
instance, alternating current (AC) (see 2.2.2.5).
The electrodes are placed on the head (cap or glued) and the application of a
conductive paste, rich in electrolytes, lowers the impedance between electrode and
skin – preferably below 5 kOhm. To ensure standardized recording, the positions of

23
the scalp are identified using the International 10 / 20 system (see Figure 2.9). The
number of recording electrodes can go up to 256. Each electrode is labeled with a
letter and a number: the letter refers to a brain area (‘F’ = frontal lobe, ‘T’ = temporal
lobe, ‘P’ = parietal lobe, ‘O’ = occipital lobe, and the ‘z’ refers to the central line),
even numbers refer to the right side of the head and odd numbers to the left side.
Figure 2.9 – The layout form the International 10 / 20 system with 64 recording
electrodes (adapted from BioSemi, the Netherlands).
EEG instruments
The small amplitude of the EEG signal (1-100 µV) requires amplification. Therefore
a differential amplifier is used. The difference between two signals is amplified by a
constant factor (usually 10.000) (Ebner, 2006).
The amplified signal is digitized or sampled, i.e. the signal is converted into a
series of numeric values (Analogue-to-Digital conversion - ADC). The samples,
representing the actual value of the EEG amplitude, are measured at constant time

24
periods. Sampling rate (expressed in Hz) refers to the number of samples per second.
For clinical application a usual sampling rate is at about 250 Hz, whereas in research
studies the signal can also be sampled much higher, for instance at over 1000 Hz.
Furthermore, the sampled signal is filtered to reduce superimposed signal or
to distinguish EEG frequency bands of interest. The bandwidth of EEG signal is
from under 1 Hz up to over 50 Hz varying in relative amplitude. Different filters can
be used depending on the purpose of a study. A notch filter, or band stop filter can be
used to exclude contaminating frequencies (50 Hz or 60 Hz) caused by electrical
power. A low pass filter attenuates signal higher than a specified threshold (e.g. 35
Hz) such as high frequency artifacts, for instance muscular activity. In contrast, a
high pass filter passes high frequencies and reduces the amplitude of low frequencies
(e.g. below 1 Hz) to remove slow artifacts (Ebner, 2006). A band pass filter allows
setting a range of frequencies that remain unattenuated whereas the frequencies
outside that range are rejected.
Montage
The way a pair of electrodes is connected to the differential amplifier is called
montage. It is crucial for a study to carefully choose the reference because data
alteration or loss due to subtraction can occur. There are different montages:
referential montage, bipolar montage and (common) average reference.
The referential montage indicates that one electrode is used as a reference.
This signal is subtracted from the signal of all other electrodes. Therefore, the
reference electrode should not record brain activity or artifacts, because otherwise
subtraction could cause information loss or modification. For instance, electrodes
placed on both earlobes, the nose or the mastoids would be a reference with a minor
activity of their own.
In the bipolar montage, electrodes are subsequently linked together and
potential differences between two adjacent electrodes are measured. In general, both
montages are equally effective, but they are used for different purposes according to
the location and dimension of the potential field.
A special montage is the average reference (common average reference). The
signal from all electrodes is summed up, averaged and subtracted from every
electrode. But, since the potentials are statistically irregular distributed, big

25
deflections in the EEG of one region due to physiological or pathological activity can
falsify the EEG (Ebner, 2006). This montage is often used in ECoG recordings.
2.2.2.4 Classification of frequency
The recorded spontaneous electrical activity appears to be chaotic, but after applying
different filters, there is a rhythmic activity that can be classified into different bands
by their frequencies (typically, a negative deflection is depicted up in a graph). The
EEG of an awake, healthy adult is composed of several frequency bands: delta (< 4
Hz), theta (4 – 7 Hz), alpha (8 – 13 Hz), beta (14 – 30 Hz), and gamma (> 30Hz) (see
Figure 2.10). The amplitude is negatively correlated with the frequency, which
means that the amplitude decreases with increasing frequency (Pfurtscheller, 1999).
Furthermore, the amplitude is proportional to the number of synchronously active
neuronal populations (Elul, 1971), i.e. slow fluctuations reflect a bigger active cell
assembly than fast oscillations (Singer, 1993).
The alpha rhythm occurs with amplitude of about 50 µV, in an awake,
relaxed person with closed eyes during a low input of environmental stimulation.
This activity is bilaterally distributed mainly on occipital electrodes but also on
temporal and central electrodes. Every human being appears to have his own
individual alpha frequency that can vary according to the state of arousal. Exhaustion
can decrease the alpha to 8 Hz or below. If a tested person suddenly opens their eyes
or focuses on a mental activity (for instance, mathematical task), the alpha rhythm
disappears and is replaced by beta activity. This is called alpha block or
desynchronization.
The beta rhythm is the fastest rhythm for the main purposes of EEG
recordings but of course the brain shows activation in higher frequencies (gamma
rhythm), too. Beta is low in amplitude and shows a maximal distribution over fronto-
central sites of the scalp. It occurs during waking state and with open eyes, in
particular when the tested person focuses their attention or receives a high input of
environmental stimulation.
The theta rhythm also shows low amplitude (< 30 µV) and is mostly
distributed over parieto-occipital areas of the scalp. It is often seen in minor
occurrence in young adults. It mainly occurs in pathological states, for instance if the
patient has a lesion (e.g. tumor), an encephalopathy, or is under an antipsychotic
therapy (Ebner, 2006).

26
Big populations of synchronously oscillating neurons generate the delta
activity. It is mostly present during sleep, but also considered normal in young,
awake adults over occipital sites of the scalp. There is also a temporal theta and delta
activity in older adults (over 60 years), which is considered normal as long as there
are only single waves or short sequences of theta and certain criteria are met: the
proportion of delta should be less than 1 % and theta less than 10 % compared to the
background activity (Ebner, 2006).
Figure 2.10 – EEG frequency bands.
The profiles are obtained during various state of consciousness. The particular band
is written in brackets (adapted from Kolb, 1996).

27
2.2.2.5 Artifacts
Artifacts are deflections in the EEG that do not represent activity from the brain. A
distinction is drawn between biological and non-biological (technical) artifacts
(Cacioppo, 2005). If the artifacts show a typical shape and localization, they are easy
to identify, but artifacts can often modify the EEG in a minor way that is difficult to
notice. Therefore, observation and video monitoring are indispensable and make it
easier to identify the artifacts.
Sources for biological artifacts are: eyes, heart, arteries (pulse), tongue, skin
(sweat) and muscle activity. Especially eye movements and blinks are a problem in
experimental paradigms. The bulbus oculi (globe of the eye) forms an electrical
dipole that causes measurable potentials while the eyes move (see Figure 2.11).
Figure 2.11 – Schema of EEG artifacts due to eye movements.
The cornea is charged positive, whereas the retina is charged negative. According to
this, looking up, leads to positive potentials on frontal electrodes and looking down
to negative ones. If the person takes a look to the left, positive potentials are recorded
at left fronto-temporal electrodes (F7-T3) and negative potentials at opposite
electrodes of the right side (F8-T4). Corresponding potentials are elicited, when
looking to the right (adapted from Ebner, 2006).
28
To avoid blinks and saccades, the tested person is instructed to blink as less
as possible and for instance, to fixate the gaze on a centrally presented cross on the
testing screen. Additionally, an electrooculogram (EOG) is recorded from electrodes
placed on both external canthi and below an eye. Thus, vertical and horizontal eye
movements are recorded (see Figure 2.13 A) and can be removed later in the
analysis.
Other artifacts, coming from muscle activity, i.e. chewing, frowning or tense
face muscles can highly contaminate the EEG (see Figure 2.13 B). Especially
difficult to deal with are complex biological artifacts, i.e. prolonged movement of the
subject. The best way to reduce these artifacts is to avoid them in a prophylactic
manner by carefully instructing the person to stay as relaxed as possible during
testing.
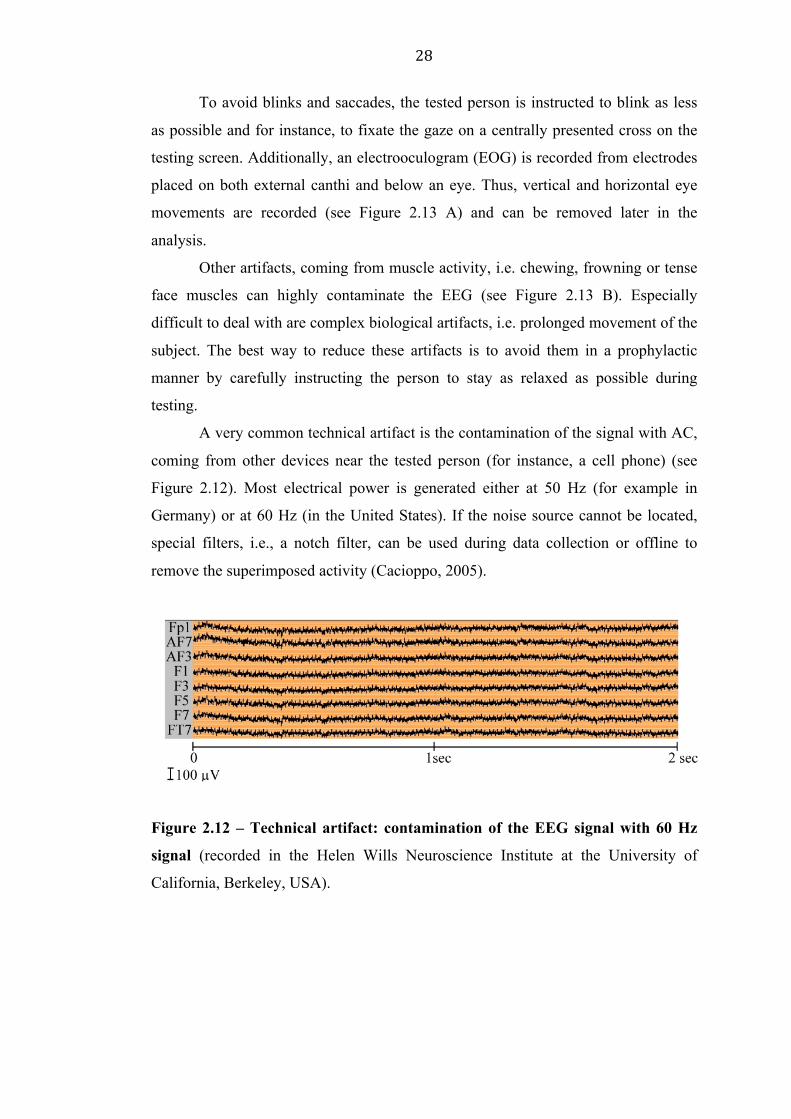
A very common technical artifact is the contamination of the signal with AC,
coming from other devices near the tested person (for instance, a cell phone) (see
Figure 2.12). Most electrical power is generated either at 50 Hz (for example in
Germany) or at 60 Hz (in the United States). If the noise source cannot be located,
special filters, i.e., a notch filter, can be used during data collection or offline to
remove the superimposed activity (Cacioppo, 2005).
Figure 2.12 – Technical artifact: contamination of the EEG signal with 60 Hz
signal (recorded in the Helen Wills Neuroscience Institute at the University of
California, Berkeley, USA).

29
Figure 2.13 – Biological artifacts. (A) Blink artifacts propagated over the frontal
scalp electrodes. The three last channels represent the EOG channels: rEOG =
electrode placed next to the lateral canthus of the right eye, lEOG = electrode placed
next to the lateral canthus of the left eye, vEOG = electrode under the left eye.
Together rEOG and lEOG record horizontal eye movements, whereas vEOG records
vertical eye movements. (B) Muscle artifact probably from chewing (recorded in the
Helen Wills Neuroscience Institute at the University of California, Berkeley, USA).

30
2.2.2.6 Data analysis: preprocessing and event-related potentials (ERP)
Preprocessing
The collected data does not provide clear information about the source of a lesion or
differences according to cognitive tasks. Therefore, it needs to be analyzed. After the
data is imported and visualized an inspection of the raw data is useful to identify
electrodes with no or poor signal or to classify artifacts and their amplitudes. So that,
thresholds are set to automatically exclude artifacts with amplitude above the cut off.
If the data suffers from major contamination with eye blinks that cannot be excluded
because of too much data loss, it can be corrected using independent component
analysis (ICA). This method separates a multivariate signal into independent
components using linear decomposition (Hoffmann, 2008). The component that
shows a scalp distribution corresponding to an eye blink can be identified and
removed. The last step is filtering the data to reject contaminated signal or to cut
down data to the frequency bands of interest (see 2.2.2.3).
Event-related potentials
Before, during and after a sensory, motor or cognitive event, specific electrical
events arise in the cerebral cortex. These effects can be measured as evoked-
potentials (EP) or event-related potentials (ERPs), which are very small signals
embedded in the ongoing EEG signal. ERPs refer to time locked perceptual,
cognitive or response potential, whereas evoked potential (EPs) refer to early sensory
responses such as the brainstem auditory evoked potentials (BAEP; see below). All
ERPs feature specific polarity, latency, localization and amplitude that characterize
the different components. ERPs reflect brain responses time-locked to an event or
stimulus in an experimental paradigm. ERPs are obtained by averaging the EEG
traces from a series of trials, aligned according to the event that is, for instance, the
onset of a stimulus or a response. Given that the background EEG is assumed to be
random, averaging random activity sums zero and the EP or ERP emerges from the
EEG. The signal to noise ratio (SNR) indicates to what extent the signal is
compromised by noise. The SNR is defined as the ratio of signal to noise power. A
ratio higher than 1:1 indicates more signal than noise. To increase the SNR, the
number of trial needs to increase as well because the SNR is proportional to the
square root of the number of sums (Schmidt, 2005). For instance, 81 trials improve
the SNR to 9:1 (given an initial SNR of 1:1). Moreover, the number of trials needed

31
for ERPs or EPs is also dependent on the amplitude of the ERP or EP of interest. For
instance, the P300 (see 2.2.2.7) can already be visible after averaging 10 trials,
whereas the BAEP requires at least more than 100 trials. Due to standardized
electrode positions, the amplitude value of the averaged signal at a favored time can
be plotted on a topographic scalp map. However, if the source of brain activity is
causing a tangential dipole, the ERPs can be mapped paradoxically. Moreover, the
activity can also reflect processes, executed in parallel. Therefore, before interpreting
activity as function or processes and allocating it to distinct brain areas, the
orientation and possible source of dipoles and underlying cognitive processes that
might be present during the experimental paradigm need to be considered.
2.2.2.7 Main auditory electrophysiological components
ERPs have found to be a powerful tool for clinicians and researchers. For instance,
tumors in the auditory system can compress auditory processing areas and therefore
compromise hearing. Even, if MRT is the goldstandard, the localization of such a
tumor could also be identified using auditory evoked potentials (AEPs) that are
generated in certain areas of the ascending auditory pathway. There are a series of
responses that index the neural activity in the brainstem, midbrain, thalamus and
cortex (Gazzaniga, 2002). Electrodes placed on the vertex and mastoid can measure
these ERPs.
The earliest AEPs are very small electrical voltage potentials that arise within the
first 10 ms. They are called the early latency ERPs or brainstem auditory evoked
potentials (BAEP) and are used to test the auditory pathway up to the inferior
colliculus (see Figure 2.14 A). The middle latency ERPs emerge after the brainstem
response at about 10 to 40 ms (Picton, 1980). The thalamus (medial geniculate
ganglion) and the auditory cortex are the related structures to the middle and long
latency ERPs (> 40 ms) (see Figure 2.14. B and C).
These ERP waveforms are referred to as exogenous components, because
they are driven from the physical features of the stimuli (Schmidt, 2005). That
means, the amplitudes of exogenous components are altered according to the
intensity of the stimulus. Endogenous components, on the other hand, show
variations according to cognitive processes.

32
Figure 2.14 – The auditory event-related potentials.
(A) The brainstem auditory evoked potentials. The anatomical locations are related
to the different waves: wave I = cochlear nerve, wave II = cochlear nuclei, wave III =
superior olivary complex, wave IV = lateral lemniscus and wave V = inferior
colliculus wave V and VI are not surely assigned to specific anatomical structures
(B) The middle-latency, and (C) the long-latency deflections of the auditory ERPs
with the main components: P50, N1 and P2. Negativity is depicted up (adapted from
Picton, 1980).
P50- N1- and P2-components
These three auditory components are exogenous evoked potentials, which are mainly
generated in the auditory cortices and result from sensory analysis of stimuli – even
in the absence of auditory attention. These potentials are assigned to the long
(>40ms) latency deflections of the auditory ERPs (Picton, 1980) and they are named
for their characterizing polarity and latency.
The P20-50- or P50-effect, is a positive potential occurring at around 20-50
ms after stimulus onset. It is thought to reflect neural activity in primary and
associative auditory cortices (Liegeois-Chauvel, 1994) and it shows a central
distribution on scalp electrodes (see Figure 2.15).

33
The N100 or N1 is one of the major components of the auditory evoked
potentials. It is a large negative component, which peaks around 80-110 ms after
stimulus onset and shows a fronto-central scalp distribution (see Figure 2.15). The
N1 was first recorded by Pauline A. Davis at Harvard University (Davis, 1939). The
origin of the wave was unknown for a long time and finally conjoint with the
auditory cortex in the 1970s (Näätänen, 1987; Vaughan, 1970). From intracranial
depth recordings in humans, it has been shown that the N1 is generated in several
primary and associative auditory areas (Liegeois-Chauvel, 1994; Yvert, 2005).
Moreover, a dynamic dipole model analysis showed that neural generators are not
only active in the auditory areas, but possibly also in the motor and supplementary
motor areas and/or the cingulate gyrus (Giard, 1994b). This response is generated
after an abrupt acoustic event, and thus is involved in detection and perception of
acoustic transitions. Furthermore, the N1 amplitude depends upon several physical
features of the stimulus e.g. rise time of sound onset, inter stimulus interval (ISI),
loudness and frequency of the stimulus and preceding sounds (Näätänen, 1999).
After reaching the peak, the N1 returns abruptly to positivity and flows into
the P200 or P2 component, which appears as a positive deflection in the ERP
waveforms with a latency of about 200 ms and it shows a positive scalp distribution
at central electrodes (see Figure 2.15). Together, N1 and P2 are often referred to as
the N100-P200 or N1-P2 complex.
In addition, there can also be a N2, which is a negative component peaking around
200-350 ms after stimulus onset (Folstein, 2008) and is present during processes
enabling cognitive control. Moreover this component is also sensitive to novel
stimuli in terms of mismatch negativity (see 2.3.2) (Schmitt, 2000).

34
Figure 2.15 – The long-latency deflections of the auditory ERPs at Fz electrode.
P50- N1- and P2-components with the corresponding scalp distributions (top views,
green represents positive amplitude and red negative amplitude) (curves and
topographies created from data collected for the current study).
P300 Component
The P300 or P3 is a positive ERP component, which reaches its maximum around
300 ms after stimulus onset. The strongest signal can be measured at parietal
electrodes. The P3 was first reported by Sutton (Sutton, 1965) in response to
unpredictable stimuli presented in an oddball paradigm. In this kind of paradigm a
rare target stimulus is presented amongst more frequent standard background stimuli
and the P3 arises when the target stimulus is detected. A larger P3 is elicited by those
events representing a low-probability category of stimuli (McCarthy, 1981).
The P3 wave is composed of two subcomponents known as P3a and P3b. These
subcomponents reflect distinct information-processing events. The P3a is usually
observed in response to non-expected meaningful stimulus, such as novels.
Therefore, it has been proposed that the P3a originates from stimulus-driven frontal
attention mechanisms. The P3b is elicited in response to detected targets and is

35
considered as target-related. The P3b arises from temporal–parietal activity
associated with top-down attention and appears to be related to subsequent memory
processing (McCarthy, 1981).
Both P3a and P3b depend on a number of variables, in particular the subject's
mental state, the task that has to be accomplished, the significance of the stimulus,
and the degree of attention. Therefore, these responses are often used as indicators of
higher-order cognitive functions such as decision-making or selective attention.
In consequence, various studies have suggested that several cortical generators of P3
may co-exist: the medial temporal cortex, the temporo-parietal junction, and the
lateral prefrontal cortex (Soltani, 2000).
2.3 Auditory attention
2.3.1 Psychological theories
2.3.1.1 Introduction to selective attention
Attention is an abstract concept, which is not easy to define; but already in
the 19th century William James, a psychologist at Harvard University, proposed a
definition of attention:
“Everyone knows what attention is. It is the taking possession by the mind, in clear
and vivid form, of one out of what seem several simultaneously possible objects or
trains of thought. Localization, concentration, of consciousness are of its essence. It
implies withdrawal from some things in order to deal effectively with others, and is a
condition which has a real opposite in the confused, dazed, scatterbrained state which
in French is called distraction, and Zerstreutheit in German.” (James, 1890)
W. James emphasized the main characteristics of attention: it is a cognitive brain
mechanism that enables processing relevant inputs, thoughts, or action while
ignoring irrelevant or distracting stimulation (Gazzaniga, 2002).
And by his statement “it is the taking possession by the mind” he also
stressed one of the two categories of attention: voluntary or endogenous attention,
which involves one choosing to focus their attention on an event of interest. This
process is driven by so-called top-down signals, which means that cognitive
influence and decisions can alter the perception of stimuli. The other category is
reflexive, automatic or exogenous attention, which occurs when an external object or
a sensory event captures our attention, also called bottom-up. The attention process is

36
based on the analysis of the stimulus characteristic (e.g. color, brightness). For
example, one red balloon in a bunch of blue balloons will grab the attention and
attract it involuntarily.
The ideas of attention W. James proposed over 100 years ago are still today’s
purpose of research. The main goal in studying attention is to investigate how
attention enables and influences detection, perception and encoding of stimulus
events (Gazzaniga, 2002). Most studies were conducted in the visual and auditory
modalities. During the last decades the number of studies in visual attention
increased and displaced the emphasis of auditory attention, predominant in the 1950s
and 1960s (Broadbent, 1958; Cherry, 1953). Auditory attention seems to be a greater
challenge because of crucial physiological differences in structure and function.
Visual attention is linked to the position of the head and eyes since the stimuli are
already mostly fully processed in the fovea (Pashler, 1998). The human cochlea on
the other side is not an equivalent to the fovea. The characteristic of auditory
selective attention is that it is mostly independent of the position of the head and the
ears, which makes it a system that is ready to receive and process stimuli from all
directions regardless of the organism’s current orientation (Pashler, 1998). On the
other side this openness to all inputs from the environment means that efficient
selection mechanisms need to distinguish relevant from irrelevant sounds.
Colin Cherry, a British psychologist, described the classic auditory example
of this phenomenon – the so-called cocktail party effect (Cherry, 1953): a person can
focus on one particular speaker while tuning out several other simultaneous
conversations. This can only be achieved by auditory selective attention: the
perception of a certain stimuli in the environment is enhanced relative to other
stimuli of lower immediate priority. In Cherry’s study, competing speech input was
provided through earphones into the two ears of a subject. The subjects were asked
to attend and verbally shadow (immediately repeat each word) a relevant input in one
ear while ignoring irrelevant information presented to the other ear; this approach is
called dichotic listening. He noticed that the subjects were only able to report the
input from the attended ear and could not report one detail from the ignored channel.
He also observed a significant decrease in performance when the subjects attempted
to attend to both input channels simultaneously in comparison to selectively
attending to one channel.

37
Cherry proposed that attention focused on one ear results in better encoding
of inputs in this channel, whereas the input of unattended channels might be
attenuated or rejected. These findings led to general models of attention, which fall
into two categories: bottleneck theories (see 2.3.1.2) and other capacity model
theories (see 2.3.1.3). The bottleneck is the most influential one. It is worth noting
that all theories are based on the idea that humans have limited information
processing capacity: i.e. it is impossible to process and react to all exogenous and
endogenous inputs that continuously excite our senses.
2.3.1.2 Bottleneck theories: early- versus late-selection
A few influential psychologists proposed different models of attention to explain
results like those from Cherry’s experiment (Broadbent, 1958; Deutsch, 1963;
Treisman, 1960). The theories all share the underlying idea, that every processing of
the brain, even sensory inputs, have a limited capacity channel (bottleneck) and
thereby, only a certain amount of information could pass (Gazzaniga, 2002).
Therefore, all sensory inputs need to be screened, sorted and filtered, to let only the
relevant stimuli pass for further processing i.e. irrelevant inputs are rejected and
relevant ones are admitted for higher order processing. The main differences between
the following models of attention are the proposed location of the processing
bottleneck that is either early or late, and the extent to what ignored inputs are
actually processed before they are rejected or admitted for further processing. Thus,
the competing theories arise: early-selection represented by Broadbent’s and
Triesman’s models and late-selection represented by Deutsch’s model.
In Boradbent’s theory (Broadbent, 1958), the incoming stimuli are
temporarily held in a sensory register, which allows attending to unanalyzed
information later on. Then, the stimuli are analyzed in parallel by a selective filter on
the basis of their physical characteristics such as spatial location (attended versus
ignored ear, the later are rejected), spectral content, and temporal features. This
filtering process happens unconsciously. The selected stimuli pass along a limited
capacity channel and, subsequently, semantic analysis takes place, which is essential
for influencing a response or entering long-term memory. The not-selected stimuli
are not further analyzed and do not reach consciousness, which is an all-or-nothing
view of perception.

38
Some features of Broadbent’s filter theory explained Cherry’s data well, but
Neville Moray showed in 1959 that high priority information in an unattended input
channel was also processed to the extent that it could break through the attentional
barrier. In his experiment, Moray found that a persons’ own name in an ignored input
channel could often direct attention to this channel (Moray, 1959). These findings led
to the assumption that all information was actually analyzed equivalently regardless
whether it was attended or ignored during testing.
Therefore, Treisman proposed a direct modification of Broadbent’s model on
which he agreed a year later. The theories are quite similar, but the main difference is
the filter. Treisman's filter passes the attended input as well through the limited
capacity channel but also allows unattended messages to go through, but in an
attenuated form, i.e. their signal strength is lowered. Accordingly, certain unattended
messages can be processed semantically and also reach consciousness, if they meet
certain criteria. Most important criteria are differing thresholds that can be variable
and also function as a filtering mechanism. For example, biologically important
signals have permanently lowered thresholds, thus, even very attenuated signals can
be facilitated and semantically analyzed. This could explain why one's own name in
an unattended message can attract attention to it. This model is, therefore, an early
selection theory, and an attenuation model of attention.
Taken together, the bottleneck in the early selection theory is located around
the level of perceptual analysis (see Figure 2.16), thus, attended input is perceptually
processed and continues to higher order processing (e.g. encoding as semantic or
categorical information), whereas unattended input is either rejected categorically
(Broadbent’s theory) or attenuated so that important messages in an unattended
channel are enabled for further processing (Treisman’s theory). So, it may be
possible, that inputs are selected or rejected even before the perceptual analysis of
the stimuli’s characteristics is fully completed (Gazzaniga, 2002).
The early selection models can be contrasted with the late selection one,
which proposes that attended and unattended stimuli are processed equivalently by
the perceptual system and both inputs reach further processing of semantic encoding.
After that, selection for further processing or for conscious awareness can take place.
Thus, selection takes place at higher stages of information processing about whether
the stimuli should gain complete access to awareness, be encoded in memory, or
initiate a response. J. A. Deutsch and D. Deutsch first proposed the most influential

39
late selection theory (Deutsch, 1963). In this model all incoming stimuli are stored in
a sensory register and fully processed even at a semantic level without any
attenuation. This perceptual analysis happens automatically and independently
whether attention was paid or not and it is accomplished before any selection due to
attention takes place. The information is then grouped by mechanisms, activated by
particular features of the incoming stimuli, i.e. importance of the stimulus. The
highest level represents a criterion by which all the other levels are compared. This
level represents a reference point enabling the appropriate output, such as a motor
response, and inhibits the output associated with other levels. Furthermore, the
general state of arousal alters the access to an output system, i.e. for a low level of
arousal (e.g. sleep), only very high-priority information will be able to alter storage
or motor response.
Figure 2.16 – Diagram of early and late selection.
This schema shows the location of the bottleneck regarding early- and late selection
theories, i.e. the extent to what a stimulus is processed before it is rejected or
admitted for further processing. The limitation of early selection is located during or
even previously to perceptual analysis. Late selection, on the other hand, occurs after
complete semantic encoding of all stimuli (adapted from Gazzaniga, 2002).

40
In summary, the early selection theories allow few automatic processing and
no semantic processing of the unattended input before the selection takes place.
Therefore, the bottleneck of these theories is located in the perceptual system. On the
contrary, in the late selection theories, the bottleneck appears to be in the response
system. Indeed, all inputs are processed rather automatically by the perceptual
system and reach the stage of semantic encoding and are therefore able to influence
the executive functions, such as decision, memory or simply making a response.
However, the theories might not be so different. One argument is that it might
be a terminological issue, because in all theories selecting mechanism operate by
similar conditions: levels of importance (Deutsch and Deutsch) or different threshold
levels (Treisman). More importantly, only the highest level of importance (Deutsch
and Deutsch) and the information with a triggered threshold (Treisman) can pass on
to further processing such as making a response. Besides, both theories propose
pattern recognition units and mechanisms selecting highly salient stimuli dependent
on bottom-up (physical features of the stimulus) and top-down (contextual features).
This shows that the theories feature major differences but also similarities.
2.3.1.3 Other capacity-limitation theories
As already mentioned, all attention theories are based on the idea that humans have
limited information processing capacity. During the fruitless discussion between
early and late selection theories other attention models based on assumptions from
this debate were developed.
Nilli Lavie, a researcher at University of London developed two theories on
attention and distraction: the perceptual load theory and the cognitive load theory.
The perceptual load theory is based on the hypothesis, that perception has limited
capacity (early selection) but processes all stimuli automatically (late selection) until
it runs out of capacity (Lavie, 2005). The idea is that the perceptual load of relevant
information determines selective processing of irrelevant information (Lavie, 1995).
That means that a high perceptual load would engage all capacities available and
would leave no spare capacity for processing irrelevant stimuli. On the other hand,
under the condition of a low perceptual load (when the relevant stimuli do not
demand all of the available capacity) irrelevant stimuli will unintentionally capture
spare capacity and be processed at the perceptual level, which would lead to an
increased distraction (Lavie, 1995). Therefore, rejection of irrelevant stimuli results
41
only from an overload of the perceptual system by relevant information, i.e. in case
the capacity limit is exceeded.
Nilli Lavie observed that the effect of load on distractor processing is mainly
depending on the type of mental process that is loaded, because load on executive
functions such as working memory had the opposite result. So, she proposed the
cognitive load theory. This theory is about the interaction between attention and
working memory, which is the ability to hold and manipulate information in mind for
a short time, or rather, actively maintain stimulus-processing priorities through out
the task (Lavie, 2005). Lavie and colleagues suggested that load on working memory
results in a reduced availability of working memory for a selective attention task (by
loading working memory in a concurrent, yet unrelated task). This in turn should
result in reduced efficiency of focusing attention on the relevant stimuli, with greater
interference by distractors. More precisely, a high cognitive load would increase the
interference by an irrelevant low-priority distractor, and a low cognitive load would
decrease distractor interference (Lavie, 2004). Therefore, load on an executive
function such as working memory has the opposite effect than perceptual load. This
idea was supported by results from de Fockert (de Fockert, 2001) showing a causal
role for working memory in the control of selective attention (see 2.4).
The effects of different types of load on distractor processing provide a better
understanding of how distractor processing is affected by capacity limits in different
mental processes. These load models also provides a more complete view at the
early- and late-selection debate: early selection depends on high perceptual load,
whereas late selection depends on cognitive control functions, available for the
selective attention task (Lavie, 2005). Thus, these capacity-limitation models also
reconcile the competing bottleneck models by combining the assumption that
perception is a limited process (early) with the view that perception is an automatic
process (late) to the extent that there is spare capacity available. This suggests that
there is no single bottleneck in the information processing system, but there are a
series of filters so that incoming stimuli can be selected at early or late stages
depending on the situation. Therefore, these are also flexible theories of selective
attention.

42
2.3.2 Electrophysiological findings and theories
Many electrophysiological studies have been conducted to investigate the electrical
changes in the brain due to selective auditory attention. Although this is difficult
enough, it is even more difficult to combine the findings with corresponding
attention theories. Especially important are studies using EEG because ERPs can
provide information about perceptual and cognitive processes and their alteration due
to the state of attention in real time. An introduction and review about the most
important studies follows.
Support for early selection theories of attention
Steven Hillyard (Hillyard, 1973) developed a selective listening task, which became
the classic auditory selective attention paradigm (see Figure 2.17), to investigate
brain mechanisms of auditory attention with scalp EEG. Streams of sounds differing
in pitch were delivered through headphones to the ears of the subjects. In one
condition they were asked to attend to the sounds in one ear and make a response to a
target sound in this ear (see Figure 2.17: the grey notes represent the targets) while
ignoring all sounds in the other ear (for instance: attend left ear and ignore right ear).
Then, in a second condition, they were asked to pay attention to the stimuli in the
other ear (in this example: attend right and ignore left). This way, Hillyard separately
got ERPs to the same stimuli when they were attended and when they were ignored.
Figure 2.17 – Scheme of the selective listening task.
The sounds occur successively to the left and the right ear. The subjects are asked to
detect stimuli of interest in one ear (for instance, grey notes in the left ear) and ignore
all stimuli presented to the other ear (adapted from Bidet-Caulet, 2008).

43
Hillyard controlled the global state of arousal during testing by engaging the subject
in this difficult task subjects. Thus, only the direction of attention varied (i.e., which
ear the subjects directed their attention to). The researcher discovered that auditory
ERPs - more precisely the N1 component - was substantially larger in amplitude for
the attended stimuli compared to ignored ones (Hillyard, 1973). Since the N1 is
known to be generated in the auditory cortex (Vaughan, 1970), Hillyard and his
colleagues interpreted their findings as an increased activity of the N1 generators, i.e.
an enhanced activation of neurons involved in automatic sensory analysis of sounds
in the auditory cortex. Consequently, they proposed that selective attention acts as a
filtering or gain mechanism that can inhibit or gate unattended stimuli at an early
stage of sensory analysis (about 100 ms). This represents a physiological version of
the psychological attenuation model of early selection (Broadbent, 1958; Treisman,
1960).
A few years later Näätänen (Näätänen, 1978) suggested that the increased
negativity observed by Hillyard could be dissociated from the N100 component.
Näätänen used a longer and constant inter stimulus interval (ISI, 800 ms) than
Hillyard (250-1250 ms) and he did not observe an enlargement of the N1, but when
he subtracted the ERPs to ignored tones from those to the same tones when they
were attended, he found a negative difference wave (Nd), or also called processing
negativity (PN). This deflection began to emerge at around 150 ms after stimulus
onset and persisted for at least 500 ms. Näätänen proposed that this wave is an
endogenous component, representing attention-specific activity, which is different
from the activity resulting from automatic sensory analysis (Näätänen, 1978). He
concluded that the N1-effect Hillyard reported was the exogenous N1 overlapped by
the endogenous Nd and thus, not an increased activity of the N1 generators.
Näätänen also observed that the Nd is composed of two subcomponents: an early
one, which could be generated in the auditory association cortices and is independent
of the ISI and a later one of larger amplitude and longer duration at frontal sites,
which is elicited with long ISI (800-2000 ms) (Näätänen, 1981).
Based on these findings, he developed the attentional trace model of selective
attention (Näätänen, 1982). This attentional trace would be an actively maintained
cortical representation of the physical features (e.g. pitch, location) of stimuli. These
features separate relevant irrelevant stimuli from ones. The model proposes that there
is an early selection in terms of a comparison between the sensory input and the

44
attentional trace in the auditory cortex. The earlier Nd component, which would
explain the attention effect at the N1 latency, would be generated by the comparison
of the stimuli features with the trace. If the sounds do not match with the trace they
would be rejected from further analysis. Accordingly, the late Nd could reflect a
frontal component controlling and maintaining the attentional trace.
Hillyard’s and Näätänen’s models led to a controversy and numerous studies
about the relationship of the processing negativity and the N1. The main difference
between the two models is that Hillyard’s filtering mechanism would represent
modulation of the exogenous components of the ERPs in addition to an endogenous
attention effect presented as a frontally distributed negativity. In Näätänen’s
attentional trace model on the other hand all ERP effects would be of endogenous
origin and modulation.
Furthermore, another important study provided evidence for the early-
selection theory. Based on the idea that the auditory cortex can be activated as early
as 20 to 25 ms after the onset of a sound, Marty Woldorff tried to find attentional
changes on the earliest components of the auditory ERP, brainstem auditory evoked
potentials (BAEP) and the middle-latency deflections (latency range 10-40ms)
(Woldorff, 1987). He also used the classic dichotic listening paradigm but modified
it to facilitate early selection attention effects: the ISI was rather short and the
subjects had to perform a difficult detection task. The targets were of a low
probability and of lower intensity than the other stimuli, which increased the
attentional load and force the participants to closely pay attention to the sounds. He
did not find any evidence for an attentional modulation on the BAEP. However, he
found attentional changes of the ERPs even prior to the N1 and the P2, that is the
affection of the mid-latency ERPs around 20-50 ms (see Figure 2.18). More
specifically, Woldorff concluded that the P50 was modulated as function of selective
attention, since it showed enlargement of the amplitude to attended sounds in
comparison to unattended sounds. In addition, he replicated the results in another
study and finally showed that neural processing of attended versus unattended
sounds can differ significantly even at 20 ms post stimulus (Woldorff, 1991). Thus,
Woldorff provided support for the early-selection theory that stimuli can be selected
or gated before perceptual processing is fully completed.

45
Figure 2.18 – ERPs to attended and ignored stimuli in a dichotic listening task
(grand average across all subjects).
Except for the N1 and P2 effect, the essential finding is the attentional modulation of
the positive deflection at around 20-50 ms post stimulus (P50 effect). Thus,
providing support for early selection theories of attention (adapted from Woldorff,
1991).
Furthermore, Aurélie Bidet-Caulet showed attention effects in the auditory
cortex at 30 ms recorded from depth electrodes implanted in the temporal cortex of
patients with pharmacologically resistant partial epilepsy (Bidet-Caulet, 2007).
Attention effects have also been shown to alter the sensory analysis of
acoustic inputs peripheral to the central auditory system. Findings from Lukas first
suggested that attention alters the sensory analysis of acoustic inputs not only in the
central auditory system but also in the brainstem. He observed that efferent axons
within the olivocochlear bundle in the brainstem even might function by attenuating
irrelevant acoustic stimuli during a visual attention task at an early stage of
processing (Lukas, 1980; Lukas, 1981). A few years later, Marie-Helene Giard
provided evidence that evoked otoacoustic emissions (EOAEs) to tones in one ear
had larger amplitude when they were attended compared to when they were ignored

46
(Giard, 1994a). These results indicate that selective attention related modulations
could occur already at the cochlear receptor, which indicates the existence of top-
down control mechanisms at a very early level. Marie-Helen Giard concluded that
selective attention could already operate as a peripheral band-pass filter at the
cochlear receptor level prior to transduction process (transduction of sound into a
neural signal).
Altogether these studies support the early selection theories of attention but
they do not answer the question by which mechanisms the attentional selection
happens.
Mechanisms of auditory attention
The studies described above addressed auditory selective attention by comparing
brain responses to attended and ignored sounds. However, another important issue is
whether selective attention is operating via one or more mechanisms and how they
interact. More precisely, do attentional mechanisms operate by facilitating the
processing of relevant sounds and/or by inhibiting the processing of irrelevant
sounds? To answer these questions, it is essential to use a baseline condition in
which all sounds are fairly similarly processed, to be able to see attentional
modulations corresponding to facilitation or inhibition effects.
Merlin Donald used the classic auditory selective attention task and also
added a baseline condition (Donald, 1987). This baseline (neutral condition) was
defined by the situation, in which the task was so difficult that ERPs to attended and
ignored standard stimuli did not differ. He obtained difference waveforms by
subtracting the ERPs of the baseline condition from those to attended stimuli or to
ignored stimuli, to distinguish the effect of attention on the processing of relevant
and irrelevant stimuli (see Figure 2.19: Difference waves attended-neutral and
ignored-neutral). The obtained difference wave for attended sounds was a negative
deflection with a very early onset (at about 25-30 ms), to which Donald referred as
the facilitation effect. The obtained difference wave for the ignored sounds was a
positive waveform starting around 125 ms that Donald considered as the rejection
effect. Donald proposed that, since the facilitation and rejection effects of attention
show different timing, they should be independent from each other.

47
Figure 2.19 – ERPs to tones in an attended, ignored and neutral condition.
ERPs to tones in the neutral condition are depicted as the dashed line, whereas
attended (left) and ignored (right) are shown as a solid line. The difference wave
between ERPs in the attended and neutral condition reflects the facilitation effect,
whereas the difference between ERPs in the unattended and neutral condition
represents the rejection effect. Both effect show different timing and polarity
(adapted from Donald, 1987).
Aurélie Bidet-Caulet (Bidet-Caulet, 2007) also found facilitation and
inhibition (Donald referred to as rejection) effects of auditory attention from direct
recordings of the human auditory cortex. The characteristic of her study was that the
subjects did not perform the classic dichotic listening task because it is not
representing a physiological situation one is confronted with in everyday life.
Instead, participants were presented with two binaural (in both ears) streams
simultaneously, to examine the influence of active selection on the processing of
overlapping binaural streams. Two concurrent streams at different pitches and
amplitude modulation frequencies (21 and 29 Hz) were presented binaurally and
changed in spatial direction at the end (left or right ear). Subjects were asked to focus
their attention on one of the two streams and to indicate the final direction (left or
right) of this attended stream. Bidet-Caulet also used a baseline condition in which
the subjects had to detect a rare noise burst, superimposed to the streams, to force the
subjects to orient their attention away from the streams (control condition). This
48
seems to be a better baseline condition than Donald’s, because he changed the
difficulty of the target detection task to influence the ERPs but he did not try to
control for the direction the subjects were paying attention to. The researchers
recorded data from epileptic patients implanted with multicontact depth electrodes in
the temporal cortex and analyzed the brain responses to the same streams in the three
different attentional conditions (attended, control and ignored). Each stream elicited
an evoked activity and a steady state response (SSR), which features the property to
occur at the same frequency than the amplitude modulation of the sound (21 or 29
Hz). The results showed that, in a situation of sound rivalry, selective auditory
attention could affect the SSR in the primary auditory cortex and modulate the
evoked responses in secondary auditory areas. These findings show that selective
attention can modulate the sensory processing of sound within distinct auditory
areas. Therefore, they are consistent with Hillyard’s gain theory (Hillyard, 1973), but
this does not rule out the existance of an attentional trace in the selection process, as
proposed by Näätänen (Näätänen, 1978). Moreover, the study provides insights in
the neural mechanisms of selective attention, because it shows that there is not only
an enhancement of neural representation of the attended stream, but also a reduction
of the neural representation of the ignored stream.
Altogether, these electrophysiological studies brought together several pieces
about auditory selective attention. It is now well accepted that auditory selective
attention can modulate the sensory analysis of relevant and irrelevant stimuli not
only in the auditory cortex (Bidet-Caulet, 2007) but also on the level of the brainstem
(Lukas, 1980; Lukas, 1981) and even at the level of the cochlear receptor (Giard,
1994a). Therefore, attention can operate as the gain mechanism Hillyard proposed,
which would operate as a filtering mechanism selecting relevant stimuli at early
stages of perceptual analysis. However, there is also evidence for the attentional trace
Naatanen porposed, observed as a sustained negative deflection (Nd). This
attentional trace would be of endogenous origin and would be an actively maintained
cortical representation of the relevant acoustic features to which incoming stimuli are
compared. Finally, auditory selective attention seems to operate via facilitation and
inhibition mechanisms, reflecting enhanced or reduced processing of relevant or
irrelevant sounds, respectively (Bidet-Caulet, 2007; Donald, 1987; Michie, 1990;
Michie, 1993).

49
However, little is known about how these mechanisms interact, in particular
if facilitation and inhibition are functionally distinct.
2.4 Aims of this dissertation
Attention is the ability to focus on external activities or internal processes while
preventing being distracted by irrelevant information. The ability to ignore irrelevant
distracting stimuli and subsequently adapt behavioral response is very important in
every day life, as the effect of distraction can have a broad range of consequences,
for instance from decreased life quality to dangerous incidents (e.g. during driving).
The mechanisms of selective attention have been extensively investigated. It
is generally accepted that selective attention is capable of modulating responses to
relevant (Hillyard, 1973) and irrelevant stimuli (Donald, 1987) at different levels of
the auditory processing including the auditory cortex (Bidet-Caulet, 2007; Jancke,
1999), the brainstem (Lukas, 1980; Lukas, 1981) and the cochlea (Giard, 1994a).
Furthermore, it has been shown that particular signals, so-called top-down signals
(see 2.3.1.1) are important for cognitive control to enable selective attention. These
top-down signals derive from knowledge about the current task and are able to
modulate the neural activity in sensory cortices. Imaging and electrophysiological
studies have found neural correlates for top-down and bottom-up signals in the
frontal and sensory cortex (Buschman, 2007; Kastner, 2000), which seems to provide
evidence for an involvement of the frontal lobe in attention and selection processes.
However, it is still unknown by which mechanism the brain activity is
regulated. Regarding the enhancement and reduction of responses to relevant and
irrelevant stimuli, there are two competing theories. One proposes that attention is a
unitary gain control mechanism that regulates activity either up or down along one
continuum (see Figure 2.20 A). The other one represents attention as a net activity of
top down distinct facilitation and inhibition mechanisms (see Figure 2.20 B).

50
Figure 2.20 – Competing theories about the regulation of brain activity in
response to stimuli.
(A) One mechanism representing a unitary gain mechanism that regulates the activity
either up or down along one continuum. (B) Two distinct mechanisms: attentional
facilitation and inhibition operating as a net activity (adapted from Bidet-Caulet,
2008).
An argument for two distinct attentional mechanisms also come from an EEG
(Gazzaley, 2008) and a fMRI (Gazzaley, 2005) study. Gazzaley found, that in the
visual modality, older adults exhibit a selective deficit in suppressing task-irrelevant
information during working memory encoding. He further showed that suppression
mechanisms are rather delayed in time than lost with age.
Attention and working memory are strongly related to each other. Lavie’s
cognitive load theory suggests that in order to direct attention and to specify which
stimuli are currently relevant, the active maintenance of stimulus properties in the
working memory is required (Lavie 2005). Therefore, a high load on working
memory should lead to less differentiation between high and low priority stimuli
(target versus distractor) and thus, increase distractor processing and thereby increase
distraction.
An fMRI study in young adults observed that the extent to which distractors
are inhibited can be determined by the availability of cognitive resources, assessing a
direct causal role for working memory in the control of selective attention (de
Fockert et al., 2001). Cognitive resources were manipulated in a dual task protocol
where subjects performed, at the same time, two unrelated tasks: an attention and a
memory tasks. In the visual attention task, subjects had to classify famous written

51
names as pop stars or politicians while ignoring distractor faces, which could be
congruent or incongruent with the target name or anonymous (see Figure 2.21 A).
In the working memory task, subjects were asked to remember a 5-digit order on
each trial at the beginning of the attention task. In order to manipulate the memory
load, subjects were asked to remember either a fixed order of digits (0 1 2 3 4) or a
random order of digits (0 3 1 4 2). After the attention task, a memory probe was
presented to the subjects, who were asked to report the digit that followed this probe
in the memory set (see Figure 2.21 A).
Functional magnetic resonance imaging (fMRI) was used to measure brain activity
while participants performed the two tasks. Distractor related activity was obtained
by comparing the activity during attention condition with a neutral condition in
which the distractor faces were absent (see Figure 2.21 B: face present versus face
absent).
De Fockert observed that a high working memory load increased the
distractor interference effect on behavioural performance of subjects. A high load
also resulted in an increase of activity elicited by the distarctor faces in visual areas,
especially in the extrastriate visual cortex and the fusiforme gyrus (known to be
selective for face processing) (see Figure 2.21 B). These findings indicate that
distractor faces were more extensively processed under high than under low working
memory load. De Fockert concluded that working memory serves to control visual
selective attention and suggested that there might be two distinct attentional
mechanisms regulating the responses to stimuli. However, this study did not assess,
to what extent the availability of cognitive resources affects the processing of
relevant information.

52
Figure 2.21 – Interaction between working memory and selective attention.
(A) Example for the dual task protocol (in order, from top to bottom): memory set,
pop star with congruent face, politician with incongruent face, memory probe. (B)
Distractor related activity in high and low memory load. Left side: views of the
ventral surface of the template brain, on which superimposed loci indicate greater
activity in the presence than in the absence of distractor faces under condition of low
(top) and high working memory load (bottom). Right side: mean signal change of the
distractor related activity (percent signal change for face presence minus face
absence) for the maxima of the interaction in the right fusiform gyrus (adapted from
de Fockert, 2001).
These results in the visual modality suggest that, facilitation and inhibition
rely on distinct mechanisms that would be differentially affected by the amount of
available cognitive resources, and thus the difficulty of a memory task in dual task
protocol. More precisely, facilitation would not to be affected by the memory task
difficulty, whereas inhibition is most likely to decrease with increasing memory task
difficulty.

53
The aim of the current article was to dissociate the two competing attentional
theories (see Figure 2.20) and to test whether facilitation and inhibition can operate
independently. To do so, a dual task protocol was also used. Subjects had to perform
an auditory selective attention task and a memory task. Electrophysiological
responses to the same sounds in three conditions were compared (attended, ignored
and a control condition) to measure facilitation and inhibition. The amount of
available cognitive resources was manipulated by varying the difficulty of a
concurrent sound memorization task. Based on the idea that facilitation and
inhibition operate independently, the hypothesis was, that they should not be
correlated, but rather feature different electrophysiological properties and should be
differentially affected by the memory task difficulty.
The following is largely content of the already published article: Bidet-Caulet, A.,
Mikyska, C., and Knight, R. T., (2010), Load effects in auditory selective attention:
evidence for distinct facilitation and inhibition mechanisms, Neuroimage, 50, (p.
277-84)

54
3 Material and methods 3.1 Subjects
Sixteen subjects (5 female, 1 left-handed, aged 18-30 years) participated in this
experiment. All subjects were free from neurological or psychiatric disorder, and had
normal hearing. They all gave written informed consent in accordance to the study
protocol approved by the University of California, Berkeley Committees on Human
Research.
3.2 Stimuli and task
Subjects had to perform an attention and a memory tasks at the same time (dual task
protocol).
In the attention task, subjects were randomly presented with 3 different kinds
of stimuli (see Figure 3.1). One was the standard (50-ms duration) and the other one
the deviant stimulus (100-ms duration), varying in duration. Both stimuli were band-
pass noises (5-semitone wide, 5 ms rise/fall times) and were successively delivered
to each ear. The third stimulus was a binaural pure tone occurring in both ears at the
same time (carrier frequency 988 Hz, 50-ms duration). In one ear, the standard and
deviant sounds were low-pitch noises (554-740 Hz). In the other ear, the standard
and deviant sounds were high-pitch noises (1319-1760 Hz). The loudness of these
noises was matched by previous subjective matching in 11 subjects. The sound
pitches presented in each ear were balanced across blocks. In each block (about 25
s), 49 sounds were played: 20 standards and 3 deviants in each ear (41% and 6%
probability in each ear, respectively), and 3 pure tones (6% probability). The inter-
stimulus-interval (ISI) between 2 successive sound onsets varied between 300 and
500 ms. Subjects had to perform 3 different detection tasks. They either had to pay
attention to the left (right) ear and press the right button of a joystick when they
heard a duration deviant in the left (right) ear; or they had to press the right button
when they heard a binaural sound (control condition). Thus, in the two first
conditions, half of the standards were considered as attended (in the attended ear)
and half were considered as ignored (in the unattended ear). In the control condition,
all standards (in right and left ear) were considered as “control” standards.

55
The memory task consisted in the memorization of a sequence of four 5-
harmonic sounds (100-ms duration, 5 ms rise/fall times). Subjects were presented
with this sequence, then performed the attention task, and finally were presented with
a second sequence they had to compare to the first one. Thus, they had to keep the
short sequence in memory while performing the attention task. To construct the
sequences, 4 different sounds were used with the following fundamental frequencies:
1724, 4023, 5747, or 8046 Hz. When the memory task was easy the first sequence
was the 4-time repetition of one of these sounds, and the second was either the same
(left button press) or a sequence of the 4 different sounds (right button press). When
the memory task was difficult the first sequence was a sequence of the 4 different
sounds, and the second was either the same (left button press) or a sequence of the 4
different sounds in a different order (right button press). Three memory conditions
were considered: no, easy or difficult memory task (see Figure 3.1).

56
Figure 3.1 – Scheme of the dual task protocol: memory and attention task.
Subjects were presented with a sequence of 4 notes. Afterwards, they had to perform
3 different attentional tasks (detection of: (1) duration deviants in the left ear and (2)
in the right ear, (3) pure tones in both ears) while they were keeping in memory the
auditory sequence. 1 attention block consisted of 20 standards and 3 duration
deviants in each ear, respectively, and 3 pure tones in both ears. After the attention
block was completed, subjects had to do an easy or difficult (easy or difficult
memory task) test of the acoustic memorization (adapted from Bidet-Caulet, 2008).

57
3.3 Procedure
Participants were seated in a sound-attenuated EEG recording room. The sounds
were delivered through earphones at an intensity level judged comfortable by the
subjects, using ‘Presentation’ software (Neurobehavioral Systems, Albany, NY,
USA). The experiment started with a familiarization with the sounds and tasks and
the participants were trained on the attention and memory tasks separately. EEG was
then recorded while subjects performed 12 blocks of the attention task (4 in each
attention condition) for each memory condition, resulting in a total of 160 attended
standards, 160 ignored standards and 160 standards in the control condition. The
blocks were run by memory condition (e.g. 12 attention blocks were run under the
condition of easy memory and so forth). The order of memory conditions was
balanced across subjects. The order of the 12 attention blocks was the same for each
memory condition, and was balanced across participants using a Latin-square design.
During all the experiment, subjects were instructed to perform as well and as fast as
possible and to favor accuracy in the memory task if it was difficult to perform both
tasks correctly. They were also asked to keep their eyes fixated on a centrally
presented cross and to minimize any eye movements and blinks while performing the
tasks.
3.4 EEG recording
EEG data were recorded from 64 electrodes using the ‘ActiveTwo’ system (BioSemi,
the Netherlands; see Figure 2.8 and 2.9). Vertical and horizontal eye movements
were recorded from electrodes placed at both external canthi and below the left eye.
Data were amplified (-3dB at ~819 Hz low-pass, DC coupled), digitized (1024 Hz),
and stored for offline analysis. Data were referenced offline to the average potential
of two earlobe electrodes (referential montage, see 2.2.2.3).
3.5 EEG data analysis
Trials contaminated with eye movements, eye blinks or excessive muscular activity
were excluded from further analysis (examples see Figure 2.12 and 2.13 A and B).
Trials corresponding to standards after a target, before or after a button press were
also excluded. In seven subjects, the flat or excessively noisy signals at one or two

58
electrodes were replaced by their values interpolated from the remaining adjacent
electrodes. Averaging, locked to standard or deviant onset, respectively, was done
separately for each attention condition (attended, ignored and control) in each
memory condition (no, easy, difficult memory task). For the standard analysis, at
least 108 trials were averaged for each participant, for each condition. For deviant
analysis, trials contaminated corresponding to missed targets were excluded from
further analysis. At least 21 to 24 trials were averaged for each participant and for
each condition.
With this procedure, the average acoustic content of the sounds was the same
for all obtained event-related potentials (ERPs), only the attention orientation and the
memory task difficulty varied. ERPs were corrected with a -100 to 0 ms baseline
before standard or deviant onset, and were digitally filtered (low-pass 35 Hz). Since
the shortest ISI was 300 ms, only the -100 to 300 ms time-window was retained for
further analysis of standards. ERP scalp topographies were computed using spherical
spline interpolation (Perrin, 1989; Perrin, 1987).
3.6 Statistical analysis
3.6.1 Selection of applied methods
Given the small sample number (16 subjects) we preferred non-parametric tests. But
for the calculation of the interference of the two factors (attention and memory) there
are no such parametric tests. Therefore, we used analysis of variance (ANOVA) with
appropriate corrections for non-sphericity.
3.6.1.1 Analysis of variance (ANOVA)
Analysis of variance is a set of statistical methods. It is a method that assigns sample
variance to different sources and therefore determines, whether the variation arises
within or among different population groups. It applies to classical linear models and
it has also been extended to generalized linear models and multilevel models
(Gelman, 2005).
We performed repeated measure ANOVA, which means that the different
measures are conducted within the same individuals. Besides, in this experiment one-
way and two-way ANOVAs were used. In a two-way ANOVA groups have two
defining characteristics instead of one. Both ANOVAS are special cases of the linear

59
model. The method assumes that the samples are normally distributed within
different population groups, each featuring the same variance. Thus, the ANOVA is
analyzing whether or not the means of several groups are all equal in order to
determine whether the groups are actually different or not. This is similar to a t-test.
But since there are more than two groups, multiple t-test would be necessary and this
in turn would increase the chance of committing a type I error. Therefore, ANOVAs
are useful for comparing more than two means.
The result of an ANOVA only states whether the tested groups are different
or not, but it does not reveal which means differ. For this reason it is necessary to
perform so called post-hoc tests like the permutation test (see 3.6.1.2). Another
important issue is the problem of multiple comparisons that arises from testing
multiple hypotheses at the same time. It means, the more tests performed the higher
the probability of obtaining at least one false positive result. For this reason it is
important to correct for the numbers of comparisons by performing statistical tests
like the Bonferroni correction.
3.6.1.2 Statistic permutation test
To limit assumption on the data distribution, we used as most as possible a test based
on randomizations (Edgington, 1995). Each randomization consisted in (1) the
random permutation of the 16 pairs (corresponding to the 16 subjects) of values, (2)
the sum of squared sums of values in the 2 obtained samples, and (3) the
computation of the difference between theses two statistic values. We did 10.000 of
such randomizations to obtain an estimate of the distribution of this difference under
the null hypothesis. We then compared the actual difference between the ERPs in the
2 conditions of interest to this distribution.
When this test was used over several time-windows and electrodes, we
corrected for multiple tests. In the temporal dimension, we used a randomization
procedure (Blair, 1993) to estimate the minimum number of consecutive 10-ms time-
windows that must be significant for the effect to be globally significant on the entire
time-window of interest (0-300 ms). For the spatial dimension, we considered the
data to be independent and therefore set the statistical threshold to P < 0.0005 (see
Figure 3.2).
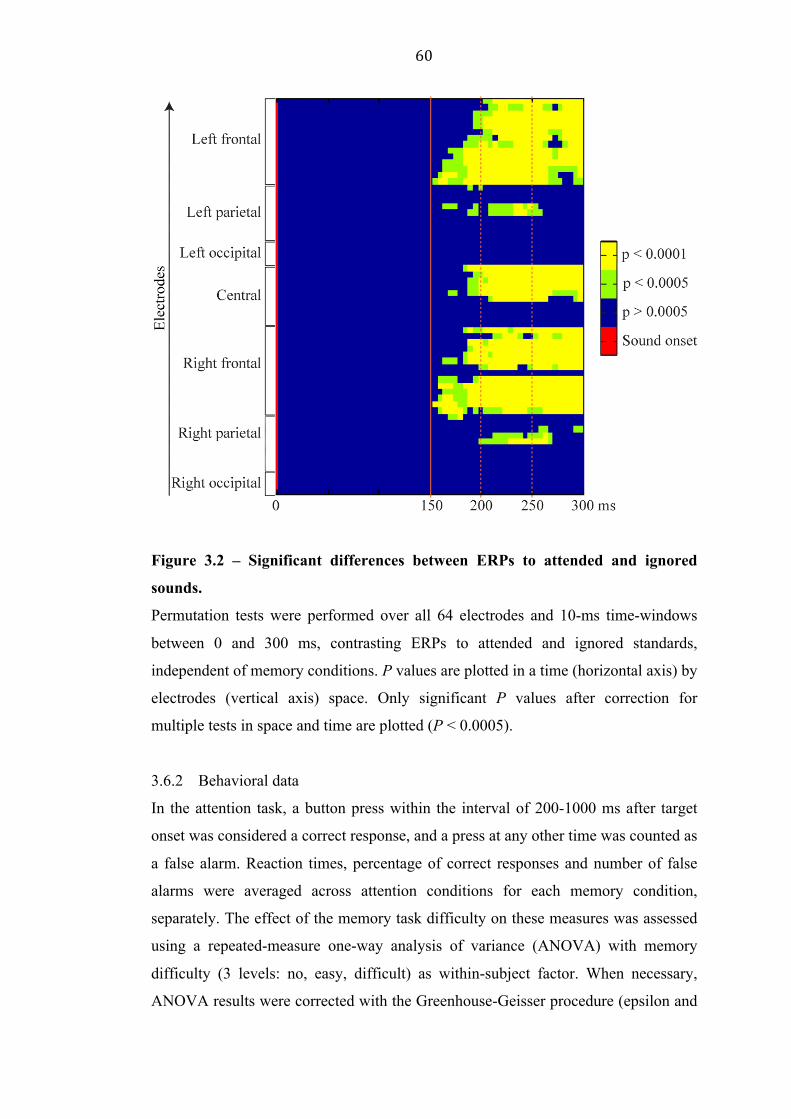
60
Figure 3.2 – Significant differences between ERPs to attended and ignored
sounds.
Permutation tests were performed over all 64 electrodes and 10-ms time-windows
between 0 and 300 ms, contrasting ERPs to attended and ignored standards,
independent of memory conditions. P values are plotted in a time (horizontal axis) by
electrodes (vertical axis) space. Only significant P values after correction for
multiple tests in space and time are plotted (P < 0.0005).
3.6.2 Behavioral data
In the attention task, a button press within the interval of 200-1000 ms after target
onset was considered a correct response, and a press at any other time was counted as
a false alarm. Reaction times, percentage of correct responses and number of false
alarms were averaged across attention conditions for each memory condition,
separately. The effect of the memory task difficulty on these measures was assessed
using a repeated-measure one-way analysis of variance (ANOVA) with memory
difficulty (3 levels: no, easy, difficult) as within-subject factor. When necessary,
ANOVA results were corrected with the Greenhouse-Geisser procedure (epsilon and

61
corrected P are reported). Significant effects were explored using 2-tailed paired t-
tests. The Bonferroni correction to was used to correct the P-value for multiple
comparisons.
3.6.3 ERP standards
To compare ERPs to attended and ignored standards, we conducted a permutation
test on the ERP mean amplitude in successive 10-ms time-windows at each electrode
between all attended and ignored standards (collapsing memory conditions) with
correction for multiple tests (see 3.6.1.2 and Figure 3.2).
Furthermore, we performed a two-way repeated-measure ANOVA with
memory difficulty (3 levels: no, easy, difficult) and attention condition (3 levels:
attended, ignored, control) as within-subjects factors, on 1 fronto-central group of
electrodes (Fz, F1, F2, FCz, FC1, FC2), in 3 successive 50-ms time-windows (150-
200, 200-250 and 250-300 ms). The selection of electrodes and time-windows of
interest was based on results in previous EEG studies on auditory selective attention
and on the permutation test results in the present study. Significant effects were
explored using post-hoc permutation tests.
We assessed topography differences on the difference between ERPs to
attended and control standards, and the difference between ERPs to control and
ignored standards (collapsing memory conditions). To avoid any bias from amplitude
effect, these difference values were first normalized for each subject using a division
by the norm of the vector in electrode space (McCarthy, 1985). We then used two
different methods to assess topographical differences. First, we performed a two-way
repeated-measure ANOVA with attention effect (2 levels: “attended – control” and
“control – ignored”) and electrode group (2 levels: anterior frontal and posterior
frontal) as within-subjects factors, on the 250–300 ms time-window. The anterior
frontal group included Fz, F1 and F2 electrodes, and the posterior frontal, FCz, FC1
and FC2 electrodes.
The second method consisted in computing the center of mass of
components. In physics, the center of mass of a system of particles is the point at
which the system's whole mass can be considered to be concentrated, and is a
function only of the positions and masses of the particles that compose the system.
Applied to ERPs, ERP amplitudes at each electrode are considered as the masses,
and the electrode coordinates as the positions of the particles (Manjarrez, 2007). We
62
computed the center of mass for “attended-control” and “ignored-control” effects
from the mean ERP value in the 250-300 ms time-window from 21 frontal electrodes
(Fpz, AFz, Fz, FCz, Cz, F1, FC1, C1, Fp1, AF3, F3, FC3, C3, F2, FC2, C2, Fp2,
AF4, F4, FC4, C4) in each subject. We used a repeated-measure ANOVA with
attention (2 levels: “attended-control” and “ignored-control”) and coordinates (3
levels: X, Y and Z) as within-subjects factors to compare the coordinates of the
centers of mass. Significant effects were explored using post-hoc permutation tests.
All data analyses were performed with ELAN-Pack software developed at
INSERM U821 (Lyon, France).
3.6.4 ERP deviants
To define latencies and electrodes of interest for further analysis, we computed the
grand-average ERP across all conditions (see Figure 3.3). Three main responses were
considered: N1 (time-window: 100-150 ms; electrode group: Fz, F1, F2, FCz, FC1,
FC2), N2b (time-window: 205-255 ms; left electrode group: F5, F7, FC5, FT7, C5,
T7; right electrode group: AF4, AF8, F4, F6, F8, FC6), and P3 (time-window: 350-
450 ms; electrode group: Pz, POz, P1, P2). The time-windows are 50-ms or 100-ms
around the maximum of N1 and N2b, or P3, respectively. Electrode groups were
chosen as electrodes with maximum amplitude on the topographies in these time-
windows.
For each response, we performed a two-way repeated-measure ANOVA with
memory difficulty (3 levels: no, easy, difficult) and attention condition (3 levels:
attended, ignored, control) as within-subjects factors, on the corresponding electrode
groups and time-windows. Significant effects were explored using post-hoc
permutation tests.

63
Figure 3.3 – Main ERPs components to deviants.
(A) Grand average ERPs across all conditions on 22 out of the 64 recorded
electrodes. Three main waves can be observed: the N1 between 100 and 150 ms
(orange shaded area), the N2b between 205 and 255 ms (red shaded area) and the P3
maximal around 350-450 ms (purple shaded area). (B) Left scalp topography of the
N2b wave (205-255 ms). (C) Top topography of the N1 wave (100-150 ms). (D)
Back topography of the P3 wave (350-450 ms). (E) Right topography of the N2b
wave (205-255 ms). The black ovals surround group of electrodes used for further
analysis of ERPs to deviants.

64
4 Results We used a dual task protocol to orthogonally manipulate attention and cognitive
resources. For the attention task, we adapted the classic auditory attention protocol
by adding a third condition (control condition) in which attention was considered as
equally distributed to all sounds. We measured with electroencephalography (EEG)
the effects of three distinct levels of attention by comparing the event-related
potentials (ERPs) to the same sounds when they were attended (in the attended ear),
ignored (in the opposite, non-attended ear) or during the control condition. The
availability of cognitive resources was modulated by varying the difficulty of a
concurrent sound memorization task (3 difficulty levels: no, easy or difficult memory
task). Our hypothesis was that if attention-mediated facilitation and inhibition are
distinct mechanisms, they would be differentially affected by the difficulty of the
memory task.
4.1 Behavioral data
Participants performed better in the easy (99.0% of correct responses) than in the
difficult (82.1%) memory task (t16 = 4.65, P = 0.0003). These results indicate that
manipulation of the memory load was effective.
We observed a significant effect of the memory task difficulty on the performance of
the attention task, both in terms of percentage of correct responses (F2,30 = 6.0, ε =
0.781, P = 0.012) and reaction times (F2,30 = 4.5, ε = 0.932, P = 0.023), but not in the
number of false alarms (F2,30 = 2.7, ε = 0.771, P = 0.098) in the attention task (see
Table 1). Post-hoc t-tests showed that the percentage of correct responses was lower
during the difficult than during the easy memory task (t16 = 3.00, P = 0.027) or when
there was no memory task (t16 = 2.88, P = 0.033). Subjects were also faster to detect
the targets when there was no memory task than when the memory task was difficult
(t16 = 3.06, P = 0.024). These results indicate that the higher the memory load, the
worse the attention performance.

65
Table 1 – Effects of the memory task difficulty on the attention task
performances.
Mean percentage of correct responses, mean number of false alarms and mean
reaction time (and their standard error to the mean, SEM) in the attention task are
indicated as a function of the memory task difficulty.
4.2 ERP results of standards
4.2.1 Main attention effect (attended versus ignored)
Previous studies investigating auditory selective attention compared ERPs to
attended and ignored (unattended) standard sounds and found a negative frontally
distributed activity (called Nd) starting around 100-150 ms (reviewed in Giard,
2000). We confirmed these results by performing an analysis of our data using
permutation tests over all 64 electrodes and 10-ms time-windows between 0 and 300
ms (with correction for multiple comparisons), comparing ERPs to attended and
ignored standards, independently of the memory conditions. We found that ERPs to
attended and ignored standards begin to differ around 150 ms (see Figure 3.2 and 4.1
A) and that this difference is reflected in a negative frontally distributed component
maximal over fronto-central electrodes (see Figure 4.1 B).
Following these and previous authors, we focused our analysis of ERPs to
standard stimuli on a fronto-central group of electrodes (Fz, F1, F2, FCz, FC1 and
FC2) and on 3 successive 50-ms time-windows between 150 and 300 ms.

66
Figure 4.1 – Main attention effect on ERPs to standards.
(A) Mean ERPs at Fz electrode. ERPs to attended and ignored standards are depicted
in green and red, respectively. The difference between ERPs to attended and ignored
standards is represented by a dashed black line; the shaded area corresponds to the
150-300 ms period, used for further analysis, when this difference is significant (see
Fig. 3.2). (B) Scalp topography (top view) of the mean difference between ERPs to
attended and ignored standards (200-300 ms). The black dot indicates the position of
the Fz electrode and the black oval surrounds the fronto-central group of electrodes
used for further analysis of ERPs to standards.
4.2.2 Influence of the memory task difficulty on attention effects
We examined the ERPs to attended, control and ignored standards across three
conditions of no, easy or difficult memory task (see Figure 4.2) and performed a two-
way ANOVA on the ERP mean amplitude, with memory difficulty (no, easy and
difficult) and attention condition (attended, control, ignored) as factors. On the three
50-ms time-windows, we found a significant main effect of attention, but not of the
memory task difficulty (see Table 2).

67
Figure 4.2 – Mean ERPs by attention and memory conditions.
Mean ERPs at the fronto-central electrode group to attended (green), control (grey)
and ignored (red) standards in the no (A), easy (B) and difficult (C) memory tasks
are depicted. Shaded areas correspond to the 3 successive 50-ms windows, in the
150-300 ms period, used for statistical analysis.
We also found a significant interaction between attention condition and the
memory task difficulty between 200 and 250 ms, but not for the other time-windows.
To assess whether these results are independent of the control condition, we
performed the same statistical analysis excluding the control condition: a two-way
ANOVA on ERP mean amplitude, with memory difficulty (no, easy and difficult)
and attention condition (attended and ignored) as factors. We obtained similar results
with and without factoring in the control condition (see Table 2).

68
Table 2 – Effect of the memory task difficulty and attention conditions on the
ERP amplitude.
Results of the two-way ANOVA on ERP mean amplitude, with memory difficulty
(no, easy and difficult) and attention condition as factors, for the three tested time-
windows. Statistical values (F, ε and P) of attention and memory difficulty main
effects and of attention by memory interaction effect are indicated with the control
condition included (attention condition factor with 3 levels: attended, control and
ignored) and with the control condition excluded (attention condition factor with 2
levels: attended and ignored). Significant effects are highlighted in grey.
To further investigate the effect of the memory task on attention modulations
between 200 and 250 ms, we assessed, for each memory difficulty, the amplitude of
the facilitatory (ERP difference between attended and control standards) and
inhibitory (ERP difference between ignored and control standards) attention effects
(see Figure 4.3 A). We found that amplitudes of ERPs to attended and control
standards were significantly different in all memory conditions (P < 0.004), whereas
the amplitudes of ERPs to ignored and control standards significantly differed in the
easy memory task only (P = 0.018). These results indicate that the memory task
difficulty differentially affects facilitation and inhibition mechanisms.

69
Figure 4.3 – Effect of the memory task difficulty on attention effects. (A) Mean
ERP amplitudes (fronto-central group, 200-250 ms) of attention-mediated facilitation
(green) and inhibition (red) effects as a function of the memory task difficulty (no,

70
easy, difficult). Facilitation and inhibition effects are represented as the mean
difference between ERPs to attended and control, and to ignored and control
standards, respectively. Error bars represent 1 SEM. Stars indicate significant
differences assessed by permutation post-hoc tests of the interaction (attention by
memory) effect (*: P < 0.05; **: P < 0.01; ***: P < 0.001). (B) Scalp topographies
(top view) of the attention effects (200-250 ms): facilitation (mean difference
between ERPs to attended and control standards) and inhibition (mean difference
between ERPs to ignored and control standards). The black oval surrounds the
fronto-central electrode group used for computation of mean amplitudes and
statistical analysis represented in (A).
4.2.3 Timing of attention facilitation and inhibition
We assessed the timing and amplitude of the facilitatory and inhibitory attention
effects, independently of the memory load. ERP amplitudes to attended and control
standards were different between 150 and 200 ms, (P = 0.001), between 200 and 250
ms (P = 0.0001), and between 250 and 300 ms (P = 0.0001). Amplitudes of ERPs to
ignored and control standards were not different between 150 and 200 ms (P = 0.85),
but were significantly different between 200 and 250 ms (P = 0.002) and between
250 and 300 ms (P = 0.0003).
These results, in combination with the ones observed in the attention by memory
interaction, suggest that facilitation and inhibition mechanisms have different timing:
facilitation starts as early as 150 ms after stimulus onset in all memory conditions,
whereas inhibition begins around 200 ms in the easy memory condition and not
before 250 ms in the other memory conditions (see Figure 4.4 A).

71
Figure 4.4 – Timing and topography of attention-mediated facilitation and
inhibition.
(A) Mean ERPs at the fronto-central electrode group to attended, control and ignored
standards are depicted in green, grey and red, respectively. The differences between
ERPs to attended and control (facilitation), and to ignored and control (inhibition)
standards are represented below by green and red lines, respectively. Yellow shaded
areas correspond to the 50-ms windows, in the 150-300 ms period, used for statistical
analysis. Stars indicate significant differences assessed by permutation post-hoc tests
of the main attention effect (**: P < 0.01; ***: P < 0.001). (B) Scalp topographies
(top view) of facilitation (mean difference between ERPs to attended and control
standards) and inhibition (mean difference between ERPs to ignored and control
standards) between 250 and 300 ms. The black oval surrounds the fronto-central
electrode group used for ERP computation and statistical analysis represented in (A).

72
4.2.4 Topographies of attention facilitation and inhibition
We also observed that the inhibitory component had a more posterior scalp
distribution than the facilitatory component (see Figure 4.3 B and 4.4 B). Since
facilitatory and inhibitory components were both found to be active between 250 and
300 ms, we used this time-window to test if the topographies of these two
components were different.
We first performed a two-way ANOVA on normalized ERP mean amplitude
(averaging across memory conditions), with electrode group (anterior or posterior
frontal) and attention effect (“attended – control” and “control – ignored”) as factors
(see Figure 4.5). We found a significant interaction between electrode groups and
attention effects (F1,15 = 15.3, P = 0.001), suggesting that facilitation and inhibition
mechanisms have distinct topographies.
Figure 4.5 – Comparison of facilitation and inhibition topographies.
Scalp topographies (left, top and right views) of the normalized mean attention
effects (250-300 ms). On the top: facilitation (mean difference between ERPs to
attended and control standards). On the bottom: inhibition (mean difference between
ERPs to control and ignored standards). The black ovals surround the anterior and
posterior frontal groups of electrodes used for statistical analysis of the topography
differences.
73
Second, we computed the center of mass for “attended – control” and
“control – ignored” effects from the mean ERP value in the 250–300 ms time-
window from 21 frontal electrodes. We obtained the mean coordinates X = 0.55,
Y = 10.16, Z = 11.00 for the facilitatory component, and X = 0.24, Y = 2.70, Z = 3.51
for the inhibitory component. Using a two-way ANOVA with attention (2 levels:
“attended – control” and “control – ignored”) and coordinates (3 levels: X, Y and Z)
as factors, we found a significant effect of attention (P = 0.050), of coordinates
(P = 0.008), and attention by coordinates interaction (P = 0.044). The centers of
mass of the facilitatory and inhibitory components were found to be different in their
Y coordinates (P < 0.05), but not in their X or Z coordinates (P > 0.26), suggesting
that the topography of the facilitatory component is more anterior than the
topography of the inhibitory one.
It is noteworthy that these results are independent of the control condition since this
condition is subtracted to extract both the facilitatory (attended – control) and the
inhibitory (control – ignored) components, and the remaining difference can only be
attributed to a difference between the ERPs to attended and ignored sounds. In this
analysis, the control condition is only used to eliminate the overlapping P2 response.
4.3 ERP results of deviants
4.3.1 Attention enhancement of deviant processing
We investigated the effect of attention condition and memory difficulty on the mean
amplitude of three classically investigated responses to deviant sounds: N1, N2b, and
P3 (see Figure 3.3). We found a significant main effect of attention for the N1 (F2,30
= 7.3, ε = 0.912, P = 0.0037) and the N2b (left: F2,30 = 16.980, ε = 0.0.911, P =
0.00003; right F2,30 = 8.370, ε = 0.952, P = 0.0016), but no memory task difficulty (P
> 0.21), nor interaction (P > 0.39) effects (see Figure 4.6). N1 was of larger
amplitude to attended than control (P = 0.016) and ignored (P = 0.0048) deviants and
N2b was actually present only when deviants were attended, i.e. targets (P < 0.02).
Interestingly, the N1 amplitude to control and ignored deviants was not significantly
different (P > 0.19).
Furthermore, the P3 was also modulated by attention (F2,30 = 62.743, ε =
0.905, P < 0.00001). Interestingly, the P3 was only present in response to attended
deviants, i.e. targets (see Figure 4.7).

74
Figure 4.6 – N1 and N2b ERPs to deviants.
(A) Mean ERPs at frontal (left), left temporal (center) and right temporal (right)
electrode groups. ERPs to attended, control and ignored deviants are depicted in
green, grey and red, respectively. The shaded areas correspond to the 100-150 ms
and 205-255 ms periods, used for N1 and N2b analysis, respectively.
(B) Scalp topographies (top views) of the N1 and N2b waves to attended, control and
ignored deviants (100-150 ms). Top views of N1 topographies between 100 and 150
ms (left). Left and right views of N2b topographies between 205 and 255 ms (center
and right panels, respectively). The black or white ovals surround the electrode group
used for N1 and N2b analysis and to compute the mean ERP in (A).

75
Figure 4.7 – P3 to targets.
(A) Mean ERPs at parietal electrode group. ERPs to attended, control and ignored
deviants are depicted in green, grey and red, respectively. The shaded area
corresponds to the 350-450 ms period, used for P3 analysis. (B) Scalp topographies
(back views) of the mean ERPs to attended, control and ignored deviants (350-450
ms). The black oval surrounds the parietal group of electrodes used for P3 analysis
and to compute the mean ERP in A. The P3 is only present in response to targets
(attended deviants).
4.3.2 Memory effect on the P3-Component
In addition, we found a significant interaction between the attention conditions and
the memory task difficulty on the P3 (F4,60 = 2.822, ε = 0.863, P = 0.041). The
amplitude of the P3 to target sounds was larger when there was no memory task than
when the memory task was difficult (P = 0.0008; see Figure 4.8).

76
Figure 4.8 – Effect of the memory task difficulty on the P3 to targets. (A) Mean
P3 amplitudes (parietal group, 350-450 ms) to attended, control and ignored deviants
(depicted in green, grey and red, respectively) as a function of the memory task
difficulty (no, easy, difficult). Error bars represent 1 SEM Stars indicate significant
differences assessed by permutation post-hoc tests of the interaction (attention by
memory) effect (***: P < 0.001). (B) Scalp topographies (back views) of the mean
ERPs to targets (attended deviants) as a function of the memory task difficulty,
between 350 and 450 ms. The black oval surrounds the parietal group of electrodes
used for P3 analysis. (C) Mean ERPs at the parietal electrode group. ERPs to targets
in the no, easy and difficult memory conditions are depicted with thick, thin and
dashed green lines, respectively. The shaded area corresponds to the 350-450 ms
period, used for P3 analysis.

77
5 Discussion
Auditory selective attention is a complex mechanism constantly operating in our
daily life: the perception of a certain stimuli in the environment is enhanced relative
to other stimuli of lesser immediate priority (cocktail party-effect). Numerous
theories and studies were put forward to explain the phenomenon and to elucidate the
operating mechanisms and the associated anatomical structures. However, to date it
is still not known exactly how auditory selective attention is operating. Nevertheless,
the studies brought together several pieces of information about the mechanisms of
auditory selective attention.
It is now well accepted that auditory attention can modulate the sensory
analysis of sounds at multiple levels. First, selective attention can operate at early
stage of sensory processing, i.e. as early as 30 ms after sound onset, of the
automatic/exogenous ERPs generated in the auditory cortices. Second, attention can
also modulate stimuli processing at late selection stages via an attentional trace
observed as a sustained negative deflection of endogenous origin, called ‘Negative
difference’ (Nd) or Processing Negativity (PN). Additionally, auditory selective
attention seems to operate via facilitation and inhibition mechanisms, reflecting an
enhanced or reduced processing of relevant or irrelevant sounds, respectively.
In this study we tried to find out whether facilitation and inhibition are
distinct mechanisms and could operate independently at a late selection stage. To do
so, we modulated the amount of cognitive resources in an auditory selective attention
task, because if facilitation and inhibition are distinct mechanisms they should be
affected differently by the variation of the cognitive load (memory task). Therefore,
we used a dual task protocol: subjects had to perform an auditory attention task and a
memory task at the same time. We compared the electrophysiological responses to
the same sounds when they were attended, ignored or under a control condition,
where attention was considered equally distributed towards all sounds.
After analyzing the data, we found two frontally distributed components: a
negative one in response to attended standard sounds (facilitatory component), and a
positive one to ignored standard sounds (inhibitory component). These frontal
electrophysiological responses have distinct timing and topographies, and are
differentially modulated by the difficulty of the memory task. These results provide

78
evidence that auditory attention is enabled by distinct facilitation and inhibition
mechanisms.
We first observed a negative frontally distributed ERP component onsetting
at about 150 ms that differentiated attended and ignored standard sounds. This
response probably corresponds to components of the Nd or PN described in several
previous studies (reviewed by Giard, 2000). This component is felt to index late
selective attention mechanisms, involved in controlling and maintaining the
representation of stimuli according to their behavioral relevance (Giard, 2000;
Näätänen, 1992; Näätänen, 1982) and can be elicited without being preceded by N1
enhancement (Näätänen, 1978), as was observed in the present experiment. Indeed,
we observed no difference in ERPs to attended and ignored sounds during the first
150 ms, probably until sufficient information is processed in order to decide whether
the sound belongs to the task-relevant or to the task-irrelevant ear, in agreement with
the findings and theory of Näätänen and colleauges (Näätänen, 1992; Näätänen,
1982).
To dissociate facilitatory and inhibitory components, we used a control
condition in which the participants had to detect binaural pure tones. We
acknowledge that the perfect control condition is elusive but we considered the
current choice better than a passive task (what is the subject actually doing?) or a
visual task (inter-modal attention is involved). Furthermore, this control task has
already been shown to be valuable in understanding the mechanisms of auditory
selective attention in intracranial recordings (Bidet-Caulet, 2007). We assume that, in
this control condition, participants' auditory attention was equally distributed towards
all monaural standard sounds. Indeed, to detect these binaural pure tones, they had to
pay attention to the auditory modality, but they did not need to actively ignore the
other sounds since the pure tones were quite salient and the task was easy. The
control condition did not require selective attention, but necessitated broad auditory
attention towards all sounds to be correctly performed. One can argue that the control
task we used actually required the inhibition of the standard monaural noises. In this
case, we might be underestimating the inhibitory component. More importantly, to
further address the issue of the control condition, we reanalyzed the data
independently of the control condition. This analysis did not affect the effect of the
memory difficulty manipulation: processing of attended and ignored sounds is

79
differentially affected by the memory difficulty. Moreover, the topographical
differences are independent of the control condition since the control condition is
subtracted to extract both the facilitatory and inhibitory components.
Using this control condition, we found that the Nd response can be
dissociated into two distinct components: (1) a negative ERP component in response
to attended standards, with onset at about 150 ms, with an anterior frontal scalp
distribution; and (2) a positive ERP component in response to ignored standards,
with onset between 200 and 250 ms, with a fronto-central scalp distribution. These
findings are consistent with results from several previous scalp EEG studies
dissociating the Nd component into two facilitatory and inhibitory sub-components,
using control conditions in the auditory modality (Donald, 1987; Melara, 2002;
Schroger, 1997) or in the visual modality (Alho, 1987; Alho, 1994; Berman, 1989;
Degerman, 2008; Michie, 1990; Michie, 1993). These researches found a positive
response or “rejection positivity” to unattended sounds compared to the control
condition, starting later in latency than the negative response to attended sounds. It
has been suggested in some of this previous work that the topographies of facilitatory
and inhibitory components are different (Degerman, 2008; Donald, 1987; Melara,
2002). In the current paper, these two components are directly compared and
dissociated. The distinct scalp topographies provide support that different brain
sources support the facilitatory and inhibitory components. However, we cannot
precisely infer the brain origin of these components from the present data. These
components most likely reflect neural activity from the auditory cortices in the
superior temporal lobes and/or from frontal areas, as it has been suggested for the Nd
components (Alcaini, 1994; Degerman, 2008; Giard, 1988; Woldorff, 1993).
To test if these facilitatory and inhibitory components correspond to two
functionally distinct mechanisms or are generated by a single control mechanism, we
manipulated the availability of cognitive resources. The hypothesis was that the
control of facilitation and inhibition mechanisms requires cognitive resources, and
that if these two mechanisms are independently controlled they should not covary
according to the amount of available cognitive resources. It has been shown,
previously, that increasing the load on executive functions, such as increasing
memory, decreases the availability of cognitive resources to perform other cognitive
task, such as an attention task (Lavie, 2005). We manipulated the availability of
cognitive resources by varying the difficulty (or load) of a concurrent sound

80
memorization task. We found that facilitation and inhibition mechanisms in auditory
selective attention are differentially modulated by the memory difficulty, providing
evidence for distinct functional roles, as reported in the visual modality (Gazzaley,
2008; Gazzaley, 2005). More precisely, we found that the availability of cognitive
resources differentially influenced the timing of attention-mediated facilitation and
inhibition mechanisms: facilitation starts at the same latency (150 ms) in all memory
loads, whereas inhibition is activated at 200 ms for low memory load (easy memory
task), and after 250 ms for no and high (difficult memory task) memory loads.
In a previous visual study employing fMRI, brain activation by distracting
sounds was found to be larger under high rather than low memory load, suggesting a
reduction of inhibition mechanisms under high memory load (de Fockert, 2001).
Accordingly, our findings show that the inhibition mechanism is delayed from low to
high memory load conditions. Thus, the less cognitive resources are available, the
later the inhibition mechanisms are activated and the more distractors are processed.
We did not observe inhibition before 250 ms in the no memory condition likely
because of the ease of the attention task. These results extend the cognitive load
theory (Lavie, 2005) to the auditory modality, but importantly, we have also shown
using the time resolution of electrophysiology, that the availability of cognitive
resources influences late selection processes (after the first steps of the sensory
analysis) which control access to memory and response. When cognitive resources
are available, distractor inhibition can be activated early (as early as 200 ms). Late
attention-mediated inhibition mechanisms also seem to be influenced by the task
difficulty: they are delayed when the task is easy even if the cognitive resources are
available.
Analysis of ERPs to deviants reveals strong effects of attention on deviant
processing, consistent with previous findings (Hansen, 1984; Näätänen, 1993). We
observed an early attention-dependent enhancement of the sensory N1 response
between 100 and 150 ms. Moreover, N2b and P3 components, known to be related to
target processing (Muller-Gass, 2002; Näätänen, 1983), were only elicited in
response to attended deviants. ERPs to ignored and control deviants were not
different, suggesting that only facilitation mechanisms are modulating deviant
processing.
The present study provides new insights on the brain mechanisms of selective
attention: late selection of the relevant stream of stimuli relies on the engagement of

81
distinct attention-mediated facilitation and inhibition mechanisms. Sustained
facilitatory and inhibitory frontally distributed components represent distinct
cognitive processing of the attended and ignored streams of sounds, enhancing the
rapid and accurate detection of targets without interference by distracting stimuli.
These findings provide evidence that, at a late selection stage, attention operates by
employing distinct facilitation and inhibition mechanisms.

82
6 References 1. Alcaini, M., Giard, M. H., Echallier, J. F., and Pernier, J., (1994), Selective
auditory attention effects in tonotopically organized cortical areas: A
topographic ERP study, Human Brain Mapping, 2, (p. 159-169).
2. Alho, K., Tottola, K., Reinikainen, K., Sams, M., and Naatanen, R., (1987),
Brain mechanism of selective listening reflected by event-related potentials,
Electroencephalogr Clin Neurophysiol, 68, (p. 458-70).
3. Alho, K., Woods, D. L., and Algazi, A., (1994), Processing of auditory
stimuli during auditory and visual attention as revealed by event-related
potentials, Psychophysiology, 31, (p. 469-79).
4. Araque, A. and Perea, G., (2004), Glial modulation of synaptic transmission
in culture, Glia, 47, (p. 241-8).
5. Berman, S. M., Heilweil, R., Ritter, W., and Rosen, J., (1989), Channel
probability and Nd: an event-related potential sign of attention strategies,
Biol Psychol, 29, (p. 107-24).
6. Bidet-Caulet, A., Mécanismes neurophysiologiques de la perception de flux
sonores chez l'Homme: Effets des contextes acoustiques et attentionnels,
Dissertation, Université Claude Bernard, Lyon, 2006.
7. Bidet-Caulet, A., Fischer, C., Besle, J., Aguera, P. E., Giard, M. H., and
Bertrand, O., (2007), Effects of selective attention on the electrophysiological
representation of concurrent sounds in the human auditory cortex, J Neurosci,
27, (p. 9252-61).
8. Bidet-Caulet, A. and Mikyska, C., Facilitation and inhibition mechanisms in
auditory selective attention, in Society for Neuroscience, 2008, Washington
DC.
9. Blair, R. C. and Karniski, W., (1993), An alternative method for significance
testing of waveform difference potentials, Psychophysiology, 30, (p. 518-24).
10. Broadbent, D. E., (1958), Perception and communication, Pergamon Press,
London.
11. Buschman, T. J. and Miller, E. K., (2007), Top-down versus bottom-up
control of attention in the prefrontal and posterior parietal cortices, Science,
315, (p. 1860-2).

83
12. Cacioppo, J., Tassinary, L., and Berntson, G., (2005), Handbook of
psychophysiology, 3 ed., Cambridge University Press, New York, (p. 908).
13. Cherry, E. C., (1953), Some exmeriments on the recognition of speech, with
one and with 2 ears, Journal of the Acoustical Society of America, 25, (p.
975-979).
14. Davis, P. A., (1939), Effects of acoustic stimuli on the waking human brain,
Journal of Neurophysiology, 2, (p. 494-499).
15. de Fockert, J. W., Rees, G., Frith, C. D., and Lavie, N., (2001), The role of
working memory in visual selective attention, Science, 291, (p. 1803-6).
16. Degerman, A., Rinne, T., Sarkka, A. K., Salmi, J., and Alho, K., (2008),
Selective attention to sound location or pitch studied with event-related brain
potentials and magnetic fields, Eur J Neurosci, 27, (p. 3329-41).
17. Deutsch, J. A. and Deutsch, D., (1963), Some theoretical considerations,
Psychol Rev, 70, (p. 80-90).
18. Donald, M. W., (1987), The timing and polarity of different attention-related
ERP changes inside and outside of the attentional focus, Electroencephalogr
Clin Neurophysiol Suppl, 40, (p. 81-6).
19. Ebner, A., (2006), EEG, 1 ed., Georg Thieme Verlag, Stuttgart, (p. 1-8).
20. Edgington, E. S., (1995), Randomization Tests, Third edition : revised and
expanded ed., Marcel Dekker, New York, USA.
21. Elul, R., (1971), The genesis of the EEG, Int Rev Neurobiol, 15, (p. 227-72).
22. Fletcher, H. and A., M. W., (1933), Loudness, Its Definition, Measurement
and Calculation, J. Acoust. Soc. Am., 5, (p. 82-108).
23. Folstein, J. R. and Van Petten, C., (2008), Influence of cognitive control and
mismatch on the N2 component of the ERP: a review, Psychophysiology, 45,
(p. 152-70).
24. Gazzaley, A., Clapp, W., Kelley, J., McEvoy, K., Knight, R. T., and
D'Esposito, M., (2008), Age-related top-down suppression deficit in the early
stages of cortical visual memory processing, Proc Natl Acad Sci U S A, 105,
(p. 13122-6).
25. Gazzaley, A., Cooney, J. W., Rissman, J., and D'Esposito, M., (2005), Top-
down suppression deficit underlies working memory impairment in normal
aging, Nat Neurosci, 8, (p. 1298-300).

84
26. Gazzaniga, M., Ivry, R., and Mangun, G., (2002), Cognitive Neuroscience, 2
ed., W. W. Norton & Company, New York City, (p. 244-251).
27. Gelman, A., (2005), Analysis of variance - Why it is more important than
ever, Annals of Statistics, 33, (p. 1-31).
28. Geschwind, N. and Levitsky, W., (1968), Human brain: left-right
asymmetries in temporal speech region, Science, 161, (p. 186-7).
29. Giard, M. H., Collet, L., Bouchet, P., and Pernier, J., (1994a), Auditory
selective attention in the human cochlea, Brain Res, 633, (p. 353-6).
30. Giard, M. H., Fort, A., Mouchetant-Rostaing, Y., and Pernier, J., (2000),
Neurophysiological mechanisms of auditory selective attention in humans,
Front Biosci, 5, (p. D84-94).
31. Giard, M. H., Perrin, F., Echallier, J. F., Thevenet, M., Froment, J. C., and
Pernier, J., (1994b), Dissociation of temporal and frontal components in the
human auditory N1 wave: a scalp current density and dipole model analysis,
Electroencephalogr Clin Neurophysiol, 92, (p. 238-52).
32. Giard, M. H., Perrin, F., Pernier, J., and Peronnet, F., (1988), Several
attention-related wave forms in auditory areas: a topographic study,
Electroencephalogr Clin Neurophysiol, 69, (p. 371-84).
33. Hansen, J. C. and Hillyard, S. A., (1984), Effects of stimulation rate and
attribute cuing on event-related potentials during selective auditory attention,
Psychophysiology, 21, (p. 394-405).
34. Hawkins, J. E., Human ear, in Britannica Ecyclopaedia. 1997, Encyclopedia
Britannica Inc.
35. Hillyard, S. A., Hink, R. F., Schwent, V. L., and Picton, T. W., (1973),
Electrical signs of selective attention in the human brain, Science, 182, (p.
177-80).
36. Hoffmann, S. and Falkenstein, M., (2008), The correction of eye blink
artefacts in the EEG: a comparison of two prominent methods, PLoS One, 3,
(p. e3004).
37. Howard, M. A., 3rd, Volkov, I. O., Abbas, P. J., Damasio, H., Ollendieck, M.
C., and Granner, M. A., (1996), A chronic microelectrode investigation of the
tonotopic organization of human auditory cortex, Brain Res, 724, (p. 260-4).
38. Hudspeth, A. J., (1983), Mechanoelectrical transduction by hair cells in the
acousticolateralis sensory system, Annu Rev Neurosci, 6, (p. 187-215).
85
39. James, W., (1890), The Principles of Psychology, New York: Henry Holt, 1,
(p. 403-404).
40. Jancke, L., Mirzazade, S., and Shah, N. J., (1999), Attention modulates
activity in the primary and the secondary auditory cortex: a functional
magnetic resonance imaging study in human subjects, Neurosci Lett, 266, (p.
125-8).
41. Kaas, J. H. and Hackett, T. A., (1999), 'What' and 'where' processing in
auditory cortex, Nat Neurosci, 2, (p. 1045-7).
42. Kastner, S. and Ungerleider, L. G., (2000), Mechanisms of visual attention in
the human cortex, Annu Rev Neurosci, 23, (p. 315-41).
43. Kemp, D. T., (1978), Stimulated acoustic emissions from within the human
auditory system, J Acoust Soc Am, 64, (p. 1386-91).
44. Kolb, B. and Whishaw, I. Q., (1996), Fundamentals of human
neuropsychology, 4th ed., W.H. Freeman, New York, N.Y.
45. Lavie, N., (2005), Distracted and confused?: selective attention under load,
Trends Cogn Sci, 9, (p. 75-82).
46. Lavie, N., (1995), Perceptual load as a necessary condition for selective
attention, J Exp Psychol Hum Percept Perform, 21, (p. 451-68).
47. Lavie, N., Hirst, A., de Fockert, J. W., and Viding, E., (2004), Load theory of
selective attention and cognitive control, J Exp Psychol Gen, 133, (p. 339-
54).
48. Liegeois-Chauvel, C., Musolino, A., Badier, J. M., Marquis, P., and Chauvel,
P., (1994), Evoked potentials recorded from the auditory cortex in man:
evaluation and topography of the middle latency components,
Electroencephalogr Clin Neurophysiol, 92, (p. 204-14).
49. Lukas, J. H., (1980), Human auditory attention: the olivocochlear bundle may
function as a peripheral filter, Psychophysiology, 17, (p. 444-52).
50. Lukas, J. H., (1981), The role of efferent inhibition in human auditory
attention: an examination of the auditory brainstem potentials, Int J Neurosci,
12, (p. 137-45).
51. Malmivuo, J., (2004), Comparison of the properties of EEG and MEG,
International Journal of Bioelectromagnetism, 6, (p. 1-14).

86
52. Manjarrez, E., Vazquez, M., and Flores, A., (2007), Computing the center of
mass for traveling alpha waves in the human brain, Brain Res, 1145, (p. 239-
47).
53. McCarthy, G. and Donchin, E., (1981), A metric for thought: a comparison of
P300 latency and reaction time, Science, 211, (p. 77-80).
54. McCarthy, G. and Wood, C. C., (1985), Scalp distributions of event-related
potentials: an ambiguity associated with analysis of variance models,
Electroencephalogr Clin Neurophysiol, 62, (p. 203-8).
55. Melara, R. D., Rao, A., and Tong, Y., (2002), The duality of selection:
excitatory and inhibitory processes in auditory selective attention, J Exp
Psychol Hum Percept Perform, 28, (p. 279-306).
56. Michie, P. T., Bearpark, H. M., Crawford, J. M., and Glue, L. C., (1990), The
nature of selective attention effects on auditory event-related potentials, Biol
Psychol, 30, (p. 219-50).
57. Michie, P. T., Solowij, N., Crawford, J. M., and Glue, L. C., (1993), The
effects of between-source discriminability on attended and unattended
auditory ERPs, Psychophysiology, 30, (p. 205-20).
58. Millett, D., (2001), Hans Berger: from psychic energy to the EEG, Perspect
Biol Med, 44, (p. 522-42).
59. Moray, N., (1959), Attention in dichotic listening: Affective cues and the
influence of instructions, Quarterly Journal of Experimental Psychology, (p.
56-60).
60. Muller-Gass, A. and Campbell, K., (2002), Event-related potential measures
of the inhibition of information processing: I. Selective attention in the
waking state, Int J Psychophysiol, 46, (p. 177-95).
61. Näätänen, R., (1992), Attention and Brain Function, Erlbaum, Hilldale, NJ.
62. Näätänen , R., (1982), Processing negativity: an evoked-potential reflection
of selective attention, Psychol Bull, 92, (p. 605-40).
63. Näätänen , R., Gaillard, A. W., and Mantysalo, S., (1978), Early selective-
attention effect on evoked potential reinterpreted, Acta Psychol (Amst), 42,
(p. 313-29).
64. Näätänen, R., Gaillard, A. W., and Varey, C. A., (1981), Attention effects on
auditory EPs as a function of inter-stimulus interval, Biol Psychol, 13, (p.
173-87).

87
65. Näätänen , R., Gaillard, A. W. K., Anthony, W. K. G., and Walter, R., The
Orienting Reflex and the N2 Deflection of the Event-Related Potential (ERP),
in Advances in Psychology. 1983, North-Holland. (p. 119-141).
66. Näätänen , R., Paavilainen, P., Tiitinen, H., Jiang, D., and Alho, K., (1993),
Attention and mismatch negativity, Psychophysiology, 30, (p. 436-50).
67. Näätänen , R. and Picton, T., (1987), The N1 wave of the human electric and
magnetic response to sound: a review and an analysis of the component
structure, Psychophysiology, 24, (p. 375-425).
68. Näätänen , R. and Winkler, I., (1999), The concept of auditory stimulus
representation in cognitive neuroscience, Psychol Bull, 125, (p. 826-59).
69. Netter, F., (2006), Atlas of human Anatomy, 4 ed., Saunders Elsevier,
Philadelphia, (p. 640).
70. Pandya, D. N., (1995), Anatomy of the auditory cortex, Rev Neurol (Paris),
151, (p. 486-94).
71. Pashler, H., (1998), The Psychology of Attention, MA: MIT Press,
Cambridge, (p. 75-77).
72. Perrin, F., Pernier, J., Bertrand, O., and Echallier, J. F., (1989), Spherical
splines for scalp potential and current density mapping,
Electroencephalography and Clinical Neurophysiology, 72, (p. 184-7).
73. Perrin, F., Pernier, J., Bertrand, O., Giard, M. H., and Echallier, J. F., (1987),
Mapping of scalp potentials by surface spline interpolation,
Electroencephalography and Clinical Neurophysiology, 66, (p. 75-81).
74. Pfurtscheller, G. and Lopes da Silva, F. H., (1999), Event-related EEG/MEG
synchronization and desynchronization: basic principles, Clin Neurophysiol,
110, (p. 1842-57).
75. Picton, T. W., Stuss, D. T., Kornhubek, H. H., and Deecke, L., The
Component Structure of the Human Event-Related Potentials, in Progress in
Brain Research. 1980, Elsevier. (p. 17-49).
76. Purves, D., Augustine, G. J., Katz, L. C., LaMantia, A. S., and McNamara, J.
O., (1997), Neuroscience, MA: Sinauer Associates, Sunderland.
77. Rickheit, G., Herrmann, T., and Deutsch, W., (2003), Psycholinguistik: Ein
internationales Handbuch, Walter de Gruyter, Berlin/New York, (p. 67).

88
78. Roberts, W. M., Howard, J., and Hudspeth, A. J., (1988), Hair cells:
transduction, tuning, and transmission in the inner ear, Annu Rev Cell Biol,
4, (p. 63-92).
79. Schmidt, R. F. and Schaible, H., (1993), Neuro- und Sinnesphysiologie, 5 ed.,
Springer, Berlin, (p. 287-311).
80. Schmidt, R. F., Thews, G., and Lang, F., (2005), Physiologie des Menschen,
25 ed., Springer, Heidelberg, (p. 334-357).
81. Schmitt, B. M., Munte, T. F., and Kutas, M., (2000), Electrophysiological
estimates of the time course of semantic and phonological encoding during
implicit picture naming, Psychophysiology, 37, (p. 473-84).
82. Schroger, E. and Eimer, M., (1997), Endogenous covert spatial orienting in
audition: "Cost-benefit" analyses of reaction times and event-related
potentials., Quarterly Journal of Experimental Psychology - A, (p. 457-474).
83. Singer, W., (1993), Synchronization of cortical activity and its putative role
in information processing and learning, Annu Rev Physiol, 55, (p. 349-74).
84. Soltani, M. and Knight, R. T., (2000), Neural origins of the P300, Crit Rev
Neurobiol, 14, (p. 199-224).
85. Sutton, S., Braren, M., Zubin, J., and John, E. R., (1965), Evoked-potential
correlates of stimulus uncertainty, Science, 150, (p. 1187-8).
86. Treisman, A. M., (1960), Contextual cues in selective listening, Quarterly
Journal of Experimental Psychology, 12, (p. 242-248).
87. Trepel, M., (2008), Neuroanatomie: Struktur und Fuktion, 4 ed., Urban &
Fischer, München, (p. 358-370).
88. Vaughan, H. G., Jr. and Ritter, W., (1970), The sources of auditory evoked
responses recorded from the human scalp, Electroencephalogr Clin
Neurophysiol, 28, (p. 360-7).
89. Von Bekesy, G., (1960), Experiments in hearing, McGraw-Hill, New York.
90. Woldorff, M. G., Gallen, C. C., Hampson, S. A., Hillyard, S. A., Pantev, C.,
Sobel, D., and Bloom, F. E., (1993), Modulation of early sensory processing
in human auditory cortex during auditory selective attention, Proc Natl Acad
Sci U S A, 90, (p. 8722-6).
91. Woldorff, M. G., Hansen, J. C., and Hillyard, S. A., (1987), Evidence for
effects of selective attention in the mid-latency range of the human auditory

89
event-related potential, Electroencephalogr Clin Neurophysiol Suppl, 40, (p.
146-54).
92. Woldorff, M. G. and Hillyard, S. A., (1991), Modulation of early auditory
processing during selective listening to rapidly presented tones,
Electroencephalogr Clin Neurophysiol, 79, (p. 170-91).
93. Yvert, B., Fischer, C., Bertrand, O., and Pernier, J., (2005), Localization of
human supratemporal auditory areas from intracerebral auditory evoked
potentials using distributed source models, Neuroimage, 28, (p. 140-53).

90
7 List of abbreviations A1 primary auditory cortex
AC alternating current
ADC analogue to digital conversion
AEP auditory evoked potential
Ag/Cl silver chloride
ANOVA analysis of variances
BAEP brainstem auditory evoked potential
BOLD blood oxygen level dependency
CGM corpus geniculatum mediale
dB decibel
ECoG electrocorticogram
EEG electroencephalogram
(r/l/v) EOG (right/left/vertical) electrooculogram
EP evoked potential
EPSP excitatory postsynaptic potential
ERP event related potential
FDG fluorodeoxyglucose
fMRI functional magnetic resonance imagining
GABA gamma aminobutyric acid
HG Heschl’s gyrus
Hz Hertz
ICA independent component analysis
ISI inter stimulus interval
IPSP inhibitory postsynaptic potential
kOhm kilo Ohm
mm millimeter
mV millivolt
mmol/l millimol per liter
N1/N100 auditory ERP at around 100 ms post stimulus (negative deflection)
Nd negative difference wave
(E)OAE (evoked) otoacoustic emission
MEG magnetencephalogram

91
MRI magnetic resonance imaging
MTG medial temporal gyrus
P20-50/P50 auditory ERP at around 20-50 ms post stimulus (positive deflection)
P2/P200 auditory ERP at around 200 ms post stimulus (positive deflection)
P3/P300 auditory ERP at around 300 ms post stimulus (positive deflection)
Pa Pascal (1 Newton/meter)
P pressure
PET positron emission tomography
PN processing negativity
PP planum polare
PT planum temporale
SEEG stereotactic electroencephalogram
SEM standard error to the mean
SNR signal to noise ratio
SPL sound pressure level
SSR steady state response
STG superior temporal gyrus
V1 primary visual cortex
µV microvolt

92
8 Publication Results from this study are already published:
Bidet-Caulet, A., Mikyska, C., and Knight, R. T., (2010), Load effects in auditory
selective attention: evidence for distinct facilitation and inhibition mechanisms,
Neuroimage, 50, (p. 277-84)

93
9 Acknowledgements I would like to express my gratitude to everyone, who contributed to this thesis.
Especially I would like to thank Aurélie for introducing me to the world of science
and showing me everything she knew. It was a pleasure working with her and
learning from her. But more important, during the time in Berkeley, she became a
close friend. Thank you for the support (e.g. lab meeting, SfN, CNS), guidance,
advice, corrections, good music in the pod, French food and wine….
Also I would like to thank Robert T. Knight, M.D. for giving me the opportunity to
spend a year at Berkeley and do research at the Helen Wills Neuroscience Institute.
I am also grateful to Prof. Dr. H. Stefan, for supporting the cooperation with UC
Berkeley, for corrections and advices and for encouraging me to finish writing.
A very special appreciation goes to Prof. Dr. H-J Heinze, for the initial idea and the
support and initiative to bring it to life.
My deepest thank you is for my family, without you I would not be where I am now.
Thank you for all your love and support.
Nic, you always believe in me. Thank you for your love and understanding.

94
10 Curriculum vitae
Personal
Name Mikyska
First name Constanze Elisabeth Anna
Date and place of birth December 06th, 1984 in Munich, Germany
Parents Dr. med. Veit Mikyska
Dr. med. Maria-Magdalena Mikyska, nee Mittermair
Siblings Christoph Maximilian Vitus Mikyska
Education
School
2004 University-entrance diploma (Abitur), Heimschule
Kloster Wald, Wald (secondary school and boarding
school)
Professional education
2000 – 2004 Apprenticeship as a tailor, Heimschule Kloster Wald,
Wald
University
2004 – 2011 Medical student at the Friedrich-Alexander University
of Erlangen-Nuremberg
09/2006 Preliminary medical examination
12/2011 Final medical licensing examination
Research experience
05/2008 – 09/2009 Visiting researcher, Helen Wills Neuroscience
Institute, University of California, Berkeley, USA
Employment
12/2009 – 10/2010 Student assistant, Epilepsiezentrum (ZEE), Department
of Neurology, University hospital Erlangen-
Nuremberg