
AUDITED ANNUAL FINANCIAL STATEMENTS · Declaration by the company secretary 1 Audit and risk ......
62
AUDITED ANNUAL FINANCIAL STATEMENTS
Transcript of AUDITED ANNUAL FINANCIAL STATEMENTS · Declaration by the company secretary 1 Audit and risk ......

A U D I T E D A N N U A L F I N A N C I A L S TAT E M E N T S

Directors’ responsibility report 1Declaration by the company secretary 1Audit and risk committee report 2Independent auditor’s report 4
CORONATION FUND MANAGERS LIMITED GROUPDirectors’ report 5Consolidated statement of comprehensive income 8Consolidated statement of financial position 9Consolidated statement of changes in equity 10Consolidated statement of cash flows 12Accounting policies 13
NOTES TO THE CONSOLIDATED FINANCIAL STATEMENTSOperating segments 22Revenue 25Finance and dividend income and expense 25Other income 25Operating expenses 25Share-based payment expense 26Income tax expense 28Earnings per share 29Intangible assets 31Equipment 31Investment in equity-accounted investees 32Deferred tax 33Investments backing policyholder funds and investments
held through investment partnerships 34Policyholder investment contract liabilities and liabilities
to holders of interests in investment partnerships 34Financial assets and financial liabilities 35Long-term borrowings 36Share capital 37Financial risk disclosures 38Commitments and contingent liabilities 44Related parties 44Principal subsidiaries, associates and unconsolidated
structured entities 45Non-cash and other adjustments 47Cash flows from policyholders and investment partnerships 47
CORONATION FUND MANAGERS LIMITED COMPANYCompany statement of comprehensive income 48Company statement of financial position 49Company statement of changes in equity 50Company statement of cash flows 51Notes to Coronation Fund Managers Limited company accounts 52Analysis of shareholders 54Glossary of financial reporting terms 56Shareholders’ diary and corporate information 59
CONTENTS

AUDITED ANNUAL FINANCIAL STATEMENTS 2015 1
DIRECTORS’ RESPONSIBILITY REPORT
The directors are responsible for the preparation and fair presentation of the consolidated and separate annual financial statements of Coronation Fund Managers Limited, comprising the statement of financial position at 30 September 2015, and the statement of comprehensive income, the statement of changes in equity and statement of cash flows for the year then ended, and the notes to the financial statements, which include a summary of significant accounting policies, the directors’ report and the audit and risk committee report, in accordance with International Financial Reporting Standards and in the manner required by the Companies Act of South Africa.
The directors’ responsibility includes: designing, implementing and maintaining internal control relevant to the preparation and fair presentation of these financial statements that are free from material misstatement, whether due to fraud or error; selecting and applying appropriate accounting policies; and making accounting estimates that are reasonable in the circumstances. The board reviews the operation of the system of internal control primarily through the audit and risk committee of Coronation Fund Managers Limited and various other risk monitoring committees.
The directors’ responsibility also includes maintaining adequate accounting records and an effective system of risk management, as well as the preparation of the supplementary schedules included in these financial statements.
The directors have made an assessment of the group’s and company’s ability to continue as a going concern and there is no reason to believe the businesses will not be going concerns in the year ahead.
The auditor is responsible for reporting on whether the consolidated and separate annual financial statements of Coronation Fund Managers Limited are fairly presented in accordance with International Financial Reporting Standards and the Companies Act of South Africa.
APPROVAL OF CONSOLIDATED AND SEPARATE ANNUAL FINANCIAL STATEMENTS
The consolidated and separate annual financial statements of Coronation Fund Managers Limited as identified in the first paragraph for the year ended 30 September 2015 set out on pages 5 to 53 were approved by the board of directors on 19 November 2015 and are signed on its behalf by:
Shams Pather Anton PillayChairman Chief executive officer19 November 2015 19 November 2015
DECLARATION BY THE COMPANY SECRETARY
In terms of the Companies Act of South Africa (the Act), and for the year ended 30 September 2015, I certify that Coronation Fund Managers Limited has lodged all returns required by the Act with the Companies and Intellectual Property Commission and that all such returns are true, correct and up to date.
Lee-Anne ParenzeeCompany secretary19 November 2015

2 CORONATION FUND MANAGERS
AUDIT AND RISK COMMITTEE REPORTTO THE SHAREHOLDERS OF CORONATION FUND MANAGERS LIMITED
The group audit and risk committee of Coronation Fund Managers, which acts as the audit and risk committee for all its subsidiaries, is a committee of the board of directors that serves in an advisory capacity to the board and assists the directors to discharge their duties relating to the safeguarding of assets, the operation of adequate systems, risk management and internal controls, the review of financial information and the preparation of the annual financial statements. This includes satisfying the board that adequate internal, operating and financial controls are in place and that material risks have been identified and are being effectively managed and monitored. In addition to the above, the audit and risk committee also has its own statutory responsibilities.
TERMS OF REFERENCE
The audit and risk committee has adopted a formal audit committee charter that has been updated and approved by the board of directors, and has executed its duties during the past financial year in compliance with the terms of reference.
Composition of the audit and risk committee and meeting processThe committee, chaired by Professor Alexandra Watson, an independent director, has two additional independent directors as members (Shams Pather and Jock McKenzie), one of whom is the chairman of the board. The committee met three times during the year with senior management, which included the chief executive officer, certain senior executive management, the chief financial officer, internal auditor, the group compliance officer and the risk officer.
The external and internal auditors attend these meetings and have unrestricted access to the committee and to its chairman. Ad hoc meetings are held as required.
DutiesIn execution of its statutory duties during the past financial year, the audit and risk committee has:
■■ Ensured the appointment as external auditor of the company and its subsidiaries of a registered auditor who, in the opinion of the audit and risk committee, was independent of the company and its subsidiaries.
■■ Determined the fees to be paid to the external auditor and such auditor’s terms of engagement.
■■ Ensured that the appointment of the external auditor complies with any legislation relating to the appointment of such auditors.
■■ Determined the nature and extent of any non-audit services which the auditor may provide to the company and its subsidiaries.
■■ Pre-approved any proposed contract with the auditor for the provision of non-audit services to the company and its subsidiaries.
■■ Considered the independence of the external auditors and has concluded that the external auditor has been independent of the company and its subsidiaries throughout the year taking into account all other non-audit services performed and circumstances known to the committee.
■■ Received and dealt appropriately with any complaints relating to the accounting practices and internal audit of the company and its subsidiaries, the content or auditing of its financial statements, the internal financial controls of the company and its subsidiaries, or to any related matter.
■■ Made submissions to the board on any matter concerning the company’s accounting policies, financial control, records and reporting.
AUDITED ANNUAL FINANCIAL STATEMENTS 2015 3
LEGAL REQUIREMENTS
The audit and risk committee has complied with all applicable legal, regulatory and other responsibilities for the financial year.
ANNUAL FINANCIAL STATEMENTS
Following our review of the consolidated and separate annual financial statements for the year ended 30 September 2015, we are of the opinion that, in all material respects, they comply with the relevant provisions of the Companies Act of South Africa and International Financial Reporting Standards and that they fairly present the financial position at 30 September 2015 for Coronation Fund Managers Limited and the results of operations and cash flows for the year then ended.
In compliance with requirements of the King Report on Governance for South Africa 2009, an integrated annual report has been compiled for the 2015 financial year in addition to these annual financial statements.
Alexandra Watson Chairman of the audit and risk committee19 November 2015
4 CORONATION FUND MANAGERS
INDEPENDENT AUDITOR’S REPORTTO THE SHAREHOLDERS OF CORONATION FUND MANAGERS LIMITED
We have audited the consolidated and separate financial statements of Coronation Fund Managers Limited, set out on page 8 to 53, which comprise the statements of financial position as at 30 September 2015, and the statements of comprehensive income, statements of changes in equity and statements of cash flows for the year then ended, and the notes, comprising a summary of significant accounting policies and other explanatory information.
DIRECTORS’ RESPONSIBILITY FOR THE CONSOLIDATED FINANCIAL STATEMENTS
The company’s directors are responsible for the preparation and fair presentation of these consolidated and separate financial statements in accordance with International Financial Reporting Standards and the requirements of the Companies Act of South Africa, and for such internal control as the directors determine is necessary to enable the preparation of consolidated and separate financial statements that are free from material misstatement, whether due to fraud or error.
AUDITOR’S RESPONSIBILITY
Our responsibility is to express an opinion on these consolidated and separate financial statements based on our audit. We conducted our audit in accordance with International Standards on Auditing. Those standards require that we comply with ethical requirements and plan and perform the audit to obtain reasonable assurance about whether the consolidated and separate financial statements are free from material misstatement.
An audit involves performing procedures to obtain audit evidence about the amounts and disclosures in the financial statements. The procedures selected depend on the auditor’s judgement, including the assessment of the risks of material misstatement of the financial statements, whether due to fraud or error. In making those risk assessments, the auditor considers internal control relevant to the entity’s preparation and fair presentation of the financial statements in order to design audit procedures that are appropriate in the circumstances, but not for the purpose of expressing an opinion on the effectiveness of the entity’s internal control. An audit also includes evaluating the appropriateness of accounting policies used and the reasonableness of accounting estimates made by management, as well as evaluating the overall presentation of the financial statements.
We believe that the audit evidence we have obtained is sufficient and appropriate to provide a basis for our audit opinion.
OPINION
In our opinion, the consolidated and separate financial statements present fairly, in all material respects, the consolidated and separate financial position of Coronation Fund Managers Limited as at 30 September 2015, and its consolidated and separate financial performance and consolidated and separate cash flows for the year then ended in accordance with International Financial Reporting Standards, and the requirements of the Companies Act of South Africa.
OTHER REPORTS REQUIRED BY THE COMPANIES ACT
As part of our audit of the consolidated and separate financial statements for the year ended 30 September 2015, we have read the Directors’ Responsibility Report, the Declaration by the Company Secretary, the Audit and Risk Committee Report and the Directors’ Report for the purpose of identifying whether there are any material inconsistencies between these reports and the audited consolidated and separate financial statements. These reports are the responsibility of the respective preparers. Based on reading these reports, we have not identified material inconsistencies between these reports and the audited consolidated and separate financial statements. However, we have not audited these reports and accordingly do not express an opinion on these reports.
Ernst & Young Inc.Malcolm Peter RapsonDirectorRegistered AuditorChartered Accountant (SA)19 November 2015
Ernst & Young House35 Lower Long StreetCape Town8001
AUDITED ANNUAL FINANCIAL STATEMENTS 2015 5
DIRECTORS’ REPORT
BUSINESS ACTIVITIES
Coronation Fund Managers Limited (registration number 1973/009318/06) is one of southern Africa’s most successful third-party fund management companies. It is a pure fund management business which offers both individual and institutional investors access to local and global expertise across all asset classes.
Clients include some of the largest retirement funds, medical schemes and multi-manager companies in South Africa, many of the major banking and insurance groups, selected investment advisory businesses, prominent independent financial advisors, high-net-worth individuals and direct unit trust accounts.
GROUP RESULTS
Despite a challenging market environment, Coronation Fund Managers delivered a credible set of results for the 12 months to 30 September 2015. Market volatility intensified throughout the year, reflecting the deterioration in the outlook for global growth and an assault on emerging market equities and currencies. The MSCI World Index returned -6.2%, while the MSCI Emerging Markets Index declined by 19.0% (in US dollar terms) for the year. The FTSE/JSE All Share delivered a US dollar return of -14.5%, which translated into a positive return of 4.8% in rand terms for the year. Albeit not the worst among the emerging market currency grouping, the rand fell 18.4% against the US dollar (to close at R13.82) and 7.9% against the euro (to close at R15.46) over the period.
Coronation has a proven philosophy of long-term investing, which has added significant value to investors over our 22-year history. The long-term success of our investment approach is best illustrated by the annualised alpha of 2.9% delivered by our flagship domestic equity fund, Houseview Equity, since inception in 1993.
Assets under management increased by 3.7% to R610 billion for the 12 months to end September (2014: R588 billion) against a backdrop of meaningful declines in global markets and total net outflows of R15.3 billion. We attracted strong inflows to our international products and retail business, and in line with management expectations, recorded net outflows in our established South African institutional business. These outflows are a result of our decision to close to new institutional investors in our SA Equity and Multi-asset portfolios three years ago. This active decision in a shrinking formal occupational retirement fund market means that stakeholders should expect continued institutional outflows in the years ahead. Coronation has a sizeable share of the South African institutional savings market, and given the above overall market share will decline to a normal level in coming years.
Coronation is a cyclical business and hence its annual revenue stream is highly geared to both the returns of the markets and the level of outperformance it generates on behalf of clients across its fund range.
Due to a decline in the abnormally high level of performance fees generated in the prior financial year, revenue for the current period declined by 7.0% to R4.4 billion. This, in turn, led to a 9.7% decline in diluted headline earnings per share of 516.0 cents (2014: 571.6 cents) compared with the record high earnings base achieved in the prior financial year.
FINANCIAL STATEMENTS
The financial statements for the year ended 30 September 2015 have been prepared in accordance with the requirements of International Financial Reporting Standards (IFRS) and the Companies Act of South Africa.
CASH RETURNED TO SHAREHOLDERS
We continue to reward shareholders through regular and significant distributions of free cash flow generated. We endeavour to distribute at least 75% of after-tax cash profit. After assessing any projected future cash requirements, a final gross dividend of 270 cents per share has been declared for the year ended 30 September 2015, resulting in a final net dividend of 229.5 cents per share for shareholders subject to Dividends Tax. Together with the interim gross dividend of 246.0 cents per share, this amounts to a total gross dividend of 516 cents per share for the year.
6 CORONATION FUND MANAGERS
DIRECTORS’ REPORT CONTINUED
SUBSIDIARY AND ASSOCIATE COMPANIES
Details of the principal subsidiary and associate companies are set out in note 21.
The group consolidated its 51% shareholding in Coronation Fund Managers (Botswana) Proprietary Limited, until the entity was liquidated on 25 June 2015.
The group equity accounts its 48% shareholding in Namibia Asset Management Limited.
Coronation Investment Management Proprietary Limited has been renamed to Coronation Investment Management SA Proprietary Limited.
Coronation Treasury Company Proprietary Limited has been renamed to Coronation Investment Management International Proprietary Limited.
The group consolidates the Coronation Global Equity Select Fund and the Coronation Global Frontiers Fund due to the seed capital invested in these funds being significant relative to the total fund size.
DIRECTORS AND SECRETARY
Lulama Boyce was appointed as independent non-executive director effective 7 October 2014.
Profiles of directors are provided in the integrated annual report.
Details of the company secretary and the company’s registered address are set out on the inside back cover of this report. The business address of the company secretary is the same as the company’s registered address.
Executive directors are not employed on fixed-term contracts and have standard employment service agreements with a notice period of at least three months.
DIRECTORS’ INTEREST
There were no material contracts entered into during the financial year in which a director or officer of the company had any interest.
The directors’ direct and indirect beneficial interests in the issued share capital of the company were:
BeneficialDirect Indirect %
2015Ordinary sharesAnton Pillay 343 889 4 087 403 1.27John Snalam 547 473 – 0.16
2014Ordinary sharesAnton Pillay 343 889 4 087 403 1.27John Snalam 547 473 – 0.16Alexandra Watson – 2 382 0.00
There have been no changes in directors’ interest subsequent to year-end up to the date of signing the financial statements.
DIRECTORS’ EMOLUMENTS
Emoluments for services rendered for the year ended 30 September 2015 were as follows:
Salary and Total Totalother benefits Bonus 2015 2014
Executive directors R’000 R’000 R’000 R’000
Anton Pillay 1 414 11 275 12 689 15 271 John Snalam 1 414 2 183 3 597 3 403
Total 2 828 13 458 16 286 18 674
For non-cash emoluments, refer to the share-based payments and related party notes in the annual financial statements.

AUDITED ANNUAL FINANCIAL STATEMENTS 2015 7
Basicfee
Boardmeetings
Audit and riskcommittee
meetings
Remunerationand
nominationscommittee
meetings
Social, ethics and
transformationcommittee
meetingsTotal2015
Total2014
Non-executive directors R’000 R’000 R’000 R’000 R’000 R’000 R’000
Shams Pather 90 375 129 129 – 723 601 Alexandra Watson 90 215 210 – 43 558 467 Judith February 90 215 21 – 45 371 328 Jock McKenzie 90 215 129 135 – 569 446 Lulama Boyce 90 129 – – – 219 –
Total 450 1 149 489 264 88 2 440 1 842
In addition emoluments for services rendered to subsidiary companies for the year ended 30 September were as follows:
Basicfee
Boardmeetings
Total2015
Total2014
Non-executive directors R’000 R’000 R’000 R’000
Shams Pather – 60 60 60 Alexandra Watson – 60 60 60 Lulama Boyce – 60 60 87
Total – 180 180 207
SPECIAL RESOLUTIONS
At the annual general meeting of the company held on 15 January 2015 the following special resolutions were passed:
■■ The company was authorised to generally provide any direct or indirect financial assistance contemplated in and subject to the provisions of section 44 and 45 of the Companies Act of South Africa.
■■ The company’s remuneration to non-executive directors in respect of the financial year ending 30 September 2015 was approved.
■■ The directors received general authority to repurchase up to 20% of the company’s issued share capital, subject to certain conditions.
EVENTS SUBSEQUENT TO THE REPORTING DATE
The final cash dividend for the 2015 financial year of R944 million (270 cents per share) was declared based on the actual shares in issue of 349 799 102.

8 CORONATION FUND MANAGERS
CONSOLIDATED STATEMENT OF COMPREHENSIVE INCOMEFOR THE YEAR ENDED 30 SEPTEMBER 2015
2015 2014Note R million R million
Fund management activitiesRevenue 2 4 442 4 774
Financial income 60 56
Finance and dividend income 3.1 32 42 Other income 4 28 14
Operating expenses 5 (2 090) (2 171)
Share-based payment expense 6 (11) (1)Other expenses (2 079) (2 170)
Finance expense 3.2 (15) (4)Share of profit of equity-accounted investees 11 8 7 Profit from fund management 2 405 2 662
Income attributable to policyholder linked assets and investment partnerships 25 41
Net fair value gains on policyholder and investment partnership financial instruments 13 54 59 Administration expenses borne by policyholders and investors in investment partnerships 14 (29) (18)
Profit before income tax 2 430 2 703
Income tax expense 7 (620) (699)
Taxation on shareholder profits 7 (595) (658)Taxation on policyholder investment contracts 7 (25) (41)
Profit for the year 1 810 2 004
Other comprehensive income (to be reclassified to profit and loss in future periods) 53 31
Foreign currency translation differences for foreign operations 99 22 Net change in fair value of available-for-sale financial assets (46) 9
Total comprehensive income for the year 1 863 2 035
Profit attributable to:– equity holders of the company 1 812 2 001 – non-controlling interest (2) 3
Profit for the year 1 810 2 004
Total comprehensive income attributable to:– equity holders of the company 1 865 2 032 – non-controlling interest (2) 3
Total comprehensive income for the year 1 863 2 035
Earnings per share (cents)– basic 8 517.9 572.1 – diluted 8 517.9 572.1

AUDITED ANNUAL FINANCIAL STATEMENTS 2015 9
CONSOLIDATED STATEMENT OF FINANCIAL POSITIONAS AT 30 SEPTEMBER 2015
2015 2014Note R million R million
AssetsIntangible assets 9 1 088 1 088 Equipment 10 37 22 Investments in equity-accounted investees 11 41 38 Deferred tax asset 12 145 166 Investments backing policyholder funds and investments held through investment
partnerships 13 66 256 73 721 Investment securities 15.2 751 234 Taxation receivable 2 – Trade and other receivables 18 509 760 Cash and cash equivalents 728 832
Total assets 69 557 76 861
LiabilitiesLong-term borrowings 16 300 152 Deferred tax liabilities 12 78 76 Policyholder investment contract liabilities and liabilities to holders of interests in
investment partnerships 14 66 181 73 647 External investors in consolidated funds 124 – Taxation payable – 59 Trade and other payables 18 705 731
Total liabilities 67 388 74 665
Net assets 2 169 2 196
EquityShare capital and premium 17 256 256 Retained earnings 1 757 1 841 Reserves 156 92 Total equity attributable to equity holders of the company 2 169 2 189 Non-controlling interest – 7
Total equity 2 169 2 196

10 CORONATION FUND MANAGERS
CONSOLIDATED STATEMENT OF CHANGES IN EQUITYFOR THE YEAR ENDED 30 SEPTEMBER 2015
Share capitaland premium
Foreigncurrency
translation reserve
Retained earnings
Share-based payment
reserveRevaluation
reserve
Issued capitaland reserves
attributable toequity holders
of the company
Non-controlling
interest Total
equityR million R million R million R million R million R million R million R million
Balance at 30 September 2013 256 42 1 570 127 8 2 003 4 2 007
Total comprehensive income for the yearProfit for the year 2 001 2 001 3 2 004 Other comprehensive income (available to be recycled to profit and loss in future periods)Currency translation differences 22 22 22 Revaluation of available-for-sale financial assets 9 9 9 – Net change in fair value 9 9 9 – Reclassified to profit or loss on disposal – – –
Total other comprehensive income 22 9 31 31
Total comprehensive income for the year – 22 2 001 – 9 2 032 3 2 035
Transactions with owners recorded directly in equityShare-based payments 1 1 1 Transfer to retained earnings 117 (117) – Dividends paid (1 847) (1 847) – (1 847)
Total transactions with owners – – (1 730) (116) – (1 846) – (1 846)
Balance at 30 September 2014 256 64 1 841 11 17 2 189 7 2 196
Total comprehensive income for the yearProfit for the year 1 812 1 812 (2) 1 810 Other comprehensive income (available to be recycled to profit or loss in future periods)Currency translation differences 99 99 99 Revaluation of available-for-sale financial assets (46) (46) (46)– Net change in fair value (40) (40) (40)– Reclassified to profit or loss on disposal (6) (6) (6)
Total other comprehensive income 99 (46) 53 53
Total comprehensive income for the year – 99 1 812 – (46) 1 865 (2) 1 863
Transactions with owners recorded directly in equityShare-based payments 11 11 11 Dividends paid (1 896) (1 896) – (1 896)Closure of subsidiary (5) (5)
Total transactions with owners – – (1 896) 11 – (1 885) (5) (1 890)
Balance at 30 September 2015 256 163 1 757 22 (29) 2 169 – 2 169

AUDITED ANNUAL FINANCIAL STATEMENTS 2015 11
Share capitaland premium
Foreigncurrency
translation reserve
Retained earnings
Share-based payment
reserveRevaluation
reserve
Issued capitaland reserves
attributable toequity holders
of the company
Non-controlling
interest Total
equityR million R million R million R million R million R million R million R million
Balance at 30 September 2013 256 42 1 570 127 8 2 003 4 2 007
Total comprehensive income for the yearProfit for the year 2 001 2 001 3 2 004 Other comprehensive income (available to be recycled to profit and loss in future periods)Currency translation differences 22 22 22 Revaluation of available-for-sale financial assets 9 9 9 – Net change in fair value 9 9 9 – Reclassified to profit or loss on disposal – – –
Total other comprehensive income 22 9 31 31
Total comprehensive income for the year – 22 2 001 – 9 2 032 3 2 035
Transactions with owners recorded directly in equityShare-based payments 1 1 1 Transfer to retained earnings 117 (117) – Dividends paid (1 847) (1 847) – (1 847)
Total transactions with owners – – (1 730) (116) – (1 846) – (1 846)
Balance at 30 September 2014 256 64 1 841 11 17 2 189 7 2 196
Total comprehensive income for the yearProfit for the year 1 812 1 812 (2) 1 810 Other comprehensive income (available to be recycled to profit or loss in future periods)Currency translation differences 99 99 99 Revaluation of available-for-sale financial assets (46) (46) (46)– Net change in fair value (40) (40) (40)– Reclassified to profit or loss on disposal (6) (6) (6)
Total other comprehensive income 99 (46) 53 53
Total comprehensive income for the year – 99 1 812 – (46) 1 865 (2) 1 863
Transactions with owners recorded directly in equityShare-based payments 11 11 11 Dividends paid (1 896) (1 896) – (1 896)Closure of subsidiary (5) (5)
Total transactions with owners – – (1 896) 11 – (1 885) (5) (1 890)
Balance at 30 September 2015 256 163 1 757 22 (29) 2 169 – 2 169

12 CORONATION FUND MANAGERS
CONSOLIDATED STATEMENT OF CASH FLOWSFOR THE YEAR ENDED 30 SEPTEMBER 2015
2015 2014Note R million R million
Cash flows from operating activities Profit from fund management 2 405 2 662 Non-cash and other adjustments 22 (21) (38)
Operating profit before changes in working capital 2 384 2 624 Working capital changes 238 271 Decrease in trade and other receivables 264 186 (Decrease)/increase in trade and other payables (26) 85
Cash flows from policyholders and investment partnership activities 23 (6 171) (772)
Cash (utilised by)/generated from operations (3 549) 2 123 Interest paid (15) (2)Income taxes paid (634) (664)
Net cash from operating activities (4 198) 1 457
Cash flows from investing activitiesFinance and dividend income 3.1 32 42 Acquisition of equipment (27) (18)Net acquisition of investment securities (435) (40)
Net cash from investing activities (430) (16)
Cash flows from financing activitiesIssue of preference shares 150 150Dividends paid (1 896) (1 847)
Net cash from financing activities (1 746) (1 697)
Decrease in cash and cash equivalents (6 374) (256)Net (decrease)/increase in cash and cash equivalents – shareholders (203) 516 Net decrease in cash and cash equivalents – policyholders and investment partnerships (6 171) (772)
Cash and cash equivalents at beginning of year 14 842 15 076 Cash and cash equivalents at beginning of year – shareholders 832 294 Cash and cash equivalents at beginning of year – policyholders and investment partnerships 14 010 14 782
Effect of exchange rate fluctuations on cash held 99 22
Cash and cash equivalents at end of year 8 567 14 842 Cash and cash equivalents at end of year – shareholders 728 832 Cash and cash equivalents at end of year – policyholders and investment partnerships 7 839 14 010
The above cash flows include the policyholder and investment partnership activities. These cash flows represent net contributions and withdrawals by policyholders and investment partnerships and the related investing activities. Cash and cash equivalents of policyholders and investment partnerships are not available for use by the shareholders of the group.

AUDITED ANNUAL FINANCIAL STATEMENTS 2015 13
ACCOUNTING POLICIESFOR THE YEAR ENDED 30 SEPTEMBER 2015
Coronation Fund Managers Limited (Coronation) is incorporated in South Africa. The consolidated financial statements for the year ended 30 September 2015 include the company and its subsidiaries and the group’s interest in associates. The financial statements were authorised for issue by the directors on 19 November 2015.
STATEMENT OF COMPLIANCE
The financial statements have been prepared in accordance with IFRS and its interpretations issued by the International Accounting Standards Board (IASB) and in the manner required by the Companies Act of South Africa and the SAICA Financial Reporting Guide as issued by the Accounting Practices Committee and Financial Pronouncements as issued by the Financial Reporting Standards Council.
BASIS OF PREPARATION
The financial statements are presented in South African rand, rounded to the nearest million. They are prepared on the going concern and historical cost basis except that the following assets and liabilities are stated at fair value: financial assets and liabilities at fair value through profit or loss and financial assets classified as available-for-sale.
The accounting policies applied in the preparation of these financial statements are set out below. These policies have been consistently applied to all the years presented.
These financial statements have been prepared under the supervision of H Rawoot CA(SA).
BASIS OF CONSOLIDATION
SubsidiariesThe financial statements of subsidiaries are included in the consolidated financial statements from the date that control commences until the date that control ceases.
In the case of the company, investments in subsidiaries are carried at fair value as available-for-sale financial assets.
ConsolidationCoronation applies IFRS 10 Consolidated Financial Statements. The consolidated financial statements combine the financial statements of Coronation and all its subsidiaries. Subsidiaries are entities over which Coronation has control.
The group has control over another entity when the group has all of the following:
■■ power over the relevant activities of the investee, for example through voting or other rights;
■■ exposure to, or rights to, variable returns from its involvement with the investee; and
■■ the ability to affect those returns through its power over the investee.
The assessment of control is based on the consideration of all facts and circumstances. The group reassesses whether it controls an investee if facts and circumstances indicate that there are changes to one or more of the three elements of control.
Intra-group transactions and balances are eliminated on consolidation and consistent accounting policies are used throughout the group for the purposes of the consolidation.
Changes in ownership interests in subsidiaries are accounted for as equity transactions if they occur after control has already been obtained and they do not result in loss of control. Details of the principal subsidiaries are given in note 21.
AssociatesThe consolidated financial statements include the group’s share of the income and expenses and equity movements of associates on an equity- accounted basis, from the date that significant influence commences until the date that significant influence ceases. When the group’s share of losses exceeds its interest in an associate, the group’s carrying amount is reduced to nil and recognition of further losses is discontinued except to the extent that the group has incurred legal or constructive obligations or made payments on behalf of an associate.
Investments in associates are initially recognised at cost.
In the case of the company, investments in associates are carried at cost less impairments.
Unrealised gains arising from transactions with associates are eliminated to the extent of the group’s interest in the entity. Unrealised losses are eliminated in the same way as unrealised gains, to the extent that there is no evidence of impairment.
14 CORONATION FUND MANAGERS
ACCOUNTING POLICIESFOR THE YEAR ENDED 30 SEPTEMBER 2015 CONTINUED
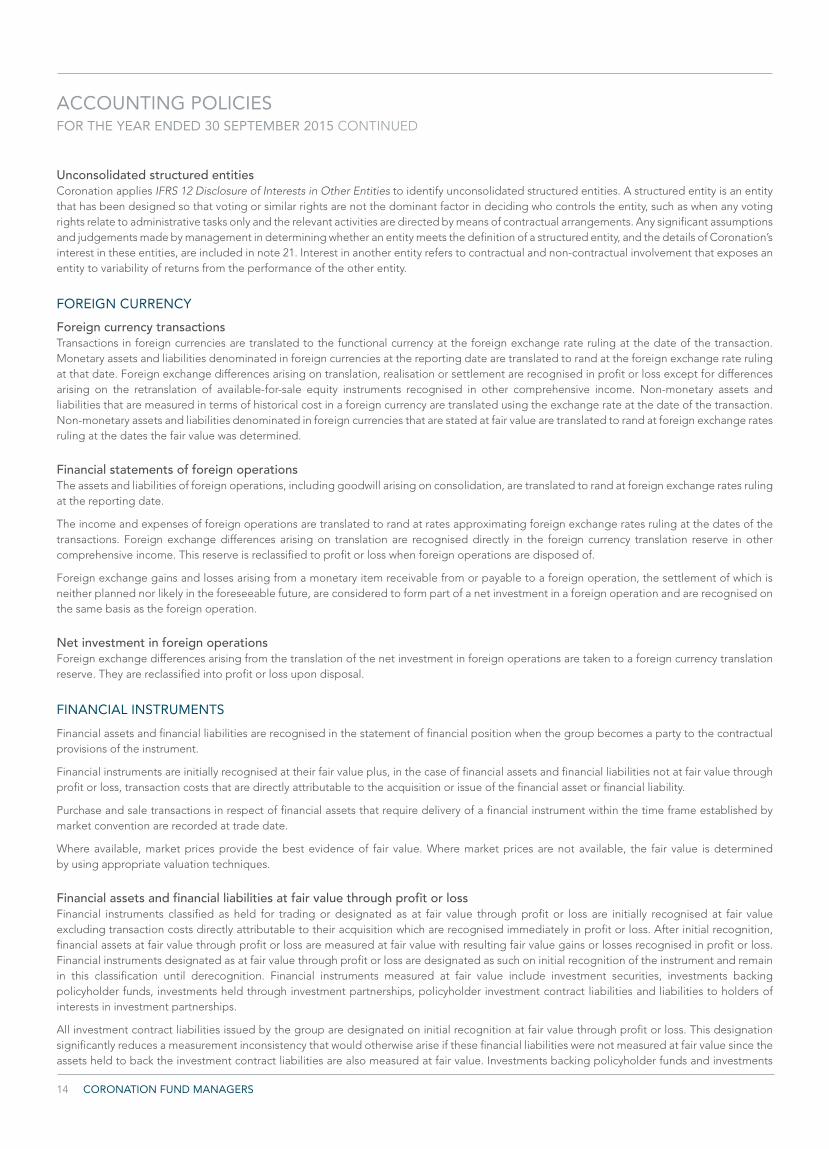
Unconsolidated structured entitiesCoronation applies IFRS 12 Disclosure of Interests in Other Entities to identify unconsolidated structured entities. A structured entity is an entity that has been designed so that voting or similar rights are not the dominant factor in deciding who controls the entity, such as when any voting rights relate to administrative tasks only and the relevant activities are directed by means of contractual arrangements. Any significant assumptions and judgements made by management in determining whether an entity meets the definition of a structured entity, and the details of Coronation’s interest in these entities, are included in note 21. Interest in another entity refers to contractual and non-contractual involvement that exposes an entity to variability of returns from the performance of the other entity.
FOREIGN CURRENCY
Foreign currency transactionsTransactions in foreign currencies are translated to the functional currency at the foreign exchange rate ruling at the date of the transaction. Monetary assets and liabilities denominated in foreign currencies at the reporting date are translated to rand at the foreign exchange rate ruling at that date. Foreign exchange differences arising on translation, realisation or settlement are recognised in profit or loss except for differences arising on the retranslation of available-for-sale equity instruments recognised in other comprehensive income. Non-monetary assets and liabilities that are measured in terms of historical cost in a foreign currency are translated using the exchange rate at the date of the transaction. Non-monetary assets and liabilities denominated in foreign currencies that are stated at fair value are translated to rand at foreign exchange rates ruling at the dates the fair value was determined.
Financial statements of foreign operationsThe assets and liabilities of foreign operations, including goodwill arising on consolidation, are translated to rand at foreign exchange rates ruling at the reporting date.
The income and expenses of foreign operations are translated to rand at rates approximating foreign exchange rates ruling at the dates of the transactions. Foreign exchange differences arising on translation are recognised directly in the foreign currency translation reserve in other comprehensive income. This reserve is reclassified to profit or loss when foreign operations are disposed of.
Foreign exchange gains and losses arising from a monetary item receivable from or payable to a foreign operation, the settlement of which is neither planned nor likely in the foreseeable future, are considered to form part of a net investment in a foreign operation and are recognised on the same basis as the foreign operation.
Net investment in foreign operationsForeign exchange differences arising from the translation of the net investment in foreign operations are taken to a foreign currency translation reserve. They are reclassified into profit or loss upon disposal.
FINANCIAL INSTRUMENTS
Financial assets and financial liabilities are recognised in the statement of financial position when the group becomes a party to the contractual provisions of the instrument.
Financial instruments are initially recognised at their fair value plus, in the case of financial assets and financial liabilities not at fair value through profit or loss, transaction costs that are directly attributable to the acquisition or issue of the financial asset or financial liability.
Purchase and sale transactions in respect of financial assets that require delivery of a financial instrument within the time frame established by market convention are recorded at trade date.
Where available, market prices provide the best evidence of fair value. Where market prices are not available, the fair value is determined by using appropriate valuation techniques.
Financial assets and financial liabilities at fair value through profit or lossFinancial instruments classified as held for trading or designated as at fair value through profit or loss are initially recognised at fair value excluding transaction costs directly attributable to their acquisition which are recognised immediately in profit or loss. After initial recognition, financial assets at fair value through profit or loss are measured at fair value with resulting fair value gains or losses recognised in profit or loss. Financial instruments designated as at fair value through profit or loss are designated as such on initial recognition of the instrument and remain in this classification until derecognition. Financial instruments measured at fair value include investment securities, investments backing policyholder funds, investments held through investment partnerships, policyholder investment contract liabilities and liabilities to holders of interests in investment partnerships.
All investment contract liabilities issued by the group are designated on initial recognition at fair value through profit or loss. This designation significantly reduces a measurement inconsistency that would otherwise arise if these financial liabilities were not measured at fair value since the assets held to back the investment contract liabilities are also measured at fair value. Investments backing policyholder funds and investments

AUDITED ANNUAL FINANCIAL STATEMENTS 2015 15
held through investment partnerships are held for trading or are designated at fair value through profit or loss since the financial assets are managed and its performance evaluated on a fair value basis, in accordance with a documented risk management or investment strategy, and information about the group is provided internally on that basis to the entity’s key management personnel.
The fair value of linked investment contract liabilities is determined based on the fair value of the associated linked financial assets and is net of the taxation payable on investment gains. Changes in the fair value of these financial instruments are recognised in profit or loss in the period in which they arise. Contributions received from policyholders and benefit payments made to policyholders are not recognised in profit or loss but are accounted for as deposits. The taxation payable is separately disclosed as part of taxation in the statement of comprehensive income.
A financial liability is recognised, and classified as at fair value through profit or loss, for the fair value of external investors’ interest in consolidated funds where the issued units of the fund are classified as financial liabilities in terms of IFRS. The fair value of the external investors in consolidated funds is determined with reference to the quoted prices in an active market of the investments underlying the liability. Changes in the fair value of the external investors in consolidated funds liability are recognised in profit or loss.
Fair value hierarchyFair value is the price that would be received to sell an asset or paid to transfer a liability in an orderly transaction between market participants at the measurement date.
The fair value measurement is based on the presumption that the transaction to sell the asset or transfer the liability takes place either in the principal market for the asset or liability or, in the absence of a principal market, the most advantageous market for the asset or liability. The principal or the most advantageous market must be accessible to the Fund.
Fair values are determined according to the following hierarchy based on the requirements of IFRS 13: ‘Fair Value Measurement’:– Level 1: Quoted prices (unadjusted) in active markets for identical assets or liabilities. The fair value of policyholder and investment partnership
liabilities that are included in Level 1 of the hierarchy, are measured with reference to the quoted prices in an active market of the investments underlying the liabilities. There are no other significant unobservable inputs that impact the valuation basis of these liabilities.
– Level 2: Inputs other than quoted prices included in Level 1 that are observable for the asset or liability, either directly (i.e. as closing prices) or indirectly (i.e. derived from closing prices). The majority of Level 2 investments are deposits held with financial institutions. The fair values of these deposits are determined using a discounted cash flow valuation methodology based on market rates, reflecting the time value of money and counter party credit risk. The fair values of the policyholder and investment partnership liabilities included in Level 2, are measured with reference to the fair values of the mentioned assets underlying these liabilities.
– Level 3: Inputs for the asset or liability that are not based on observable market data (unobservable inputs).
Held-to-maturity investmentsIf the group has the positive intent and ability to hold debt securities to maturity, then such financial assets are classified as held-to-maturity. Held-to-maturity financial assets are recognised initially at fair value plus any directly attributable transaction costs.
Subsequent to initial recognition, held-to-maturity investments are measured at amortised cost using the effective interest method, less impairment losses.
Loans and receivablesLoans and receivables are financial assets with fixed or determinable payments that are not quoted in an active market. Such assets are recognised initially at fair value plus any directly attributable transaction costs.
Subsequent to initial recognition, loans and receivables are measured at amortised cost using the effective interest method, less impair ment losses.
The amortised cost of a financial asset or liability is the amount at which the financial asset or liability is measured on initial recognition, minus principal repayments, plus or minus the cumulative amortisation using the effective interest method of any difference between the initial amount recognised and the maturity amount, minus any reductions for impairment of financial assets.
Financial assets held at amortised cost comprise cash and cash equivalents, trade and other receivables.
Cash and cash equivalents comprise balances held with banks that are not held for investment purposes.
Financial assets available-for-saleSubsequent to initial recognition, financial assets classified as available-for-sale are measured at fair value on the statement of financial position, with unrealised gains and losses recognised in other comprehensive income, except for impairment losses and foreign exchange gains and losses on available-for-sale monetary items which are recognised in profit or loss. Cumulative realised gains and losses are reclassified to profit or loss in the period in which the asset is realised. If an available-for-sale financial asset is to be impaired, the respective cumulative losses previously recognised in equity are reclassified to profit or loss in the period in which the impairment is identified.
16 CORONATION FUND MANAGERS
ACCOUNTING POLICIESFOR THE YEAR ENDED 30 SEPTEMBER 2015 CONTINUED
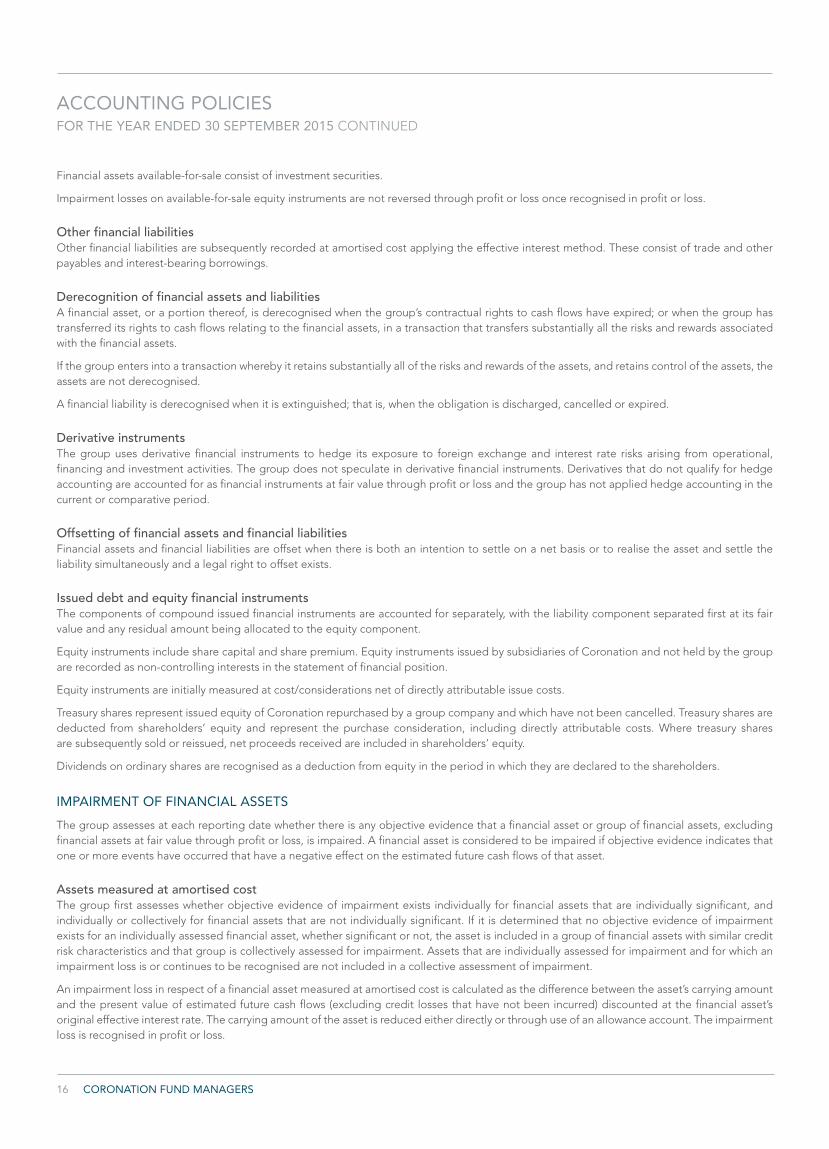
Financial assets available-for-sale consist of investment securities.
Impairment losses on available-for-sale equity instruments are not reversed through profit or loss once recognised in profit or loss.
Other financial liabilitiesOther financial liabilities are subsequently recorded at amortised cost applying the effective interest method. These consist of trade and other payables and interest-bearing borrowings.
Derecognition of financial assets and liabilitiesA financial asset, or a portion thereof, is derecognised when the group’s contractual rights to cash flows have expired; or when the group has transferred its rights to cash flows relating to the financial assets, in a transaction that transfers substantially all the risks and rewards associated with the financial assets.
If the group enters into a transaction whereby it retains substantially all of the risks and rewards of the assets, and retains control of the assets, the assets are not derecognised.
A financial liability is derecognised when it is extinguished; that is, when the obligation is discharged, cancelled or expired.
Derivative instruments The group uses derivative financial instruments to hedge its exposure to foreign exchange and interest rate risks arising from operational, financing and investment activities. The group does not speculate in derivative financial instruments. Derivatives that do not qualify for hedge accounting are accounted for as financial instruments at fair value through profit or loss and the group has not applied hedge accounting in the current or comparative period.
Offsetting of financial assets and financial liabilitiesFinancial assets and financial liabilities are offset when there is both an intention to settle on a net basis or to realise the asset and settle the liability simultaneously and a legal right to offset exists.
Issued debt and equity financial instrumentsThe components of compound issued financial instruments are accounted for separately, with the liability component separated first at its fair value and any residual amount being allocated to the equity component.
Equity instruments include share capital and share premium. Equity instruments issued by subsidiaries of Coronation and not held by the group are recorded as non-controlling interests in the statement of financial position.
Equity instruments are initially measured at cost/considerations net of directly attributable issue costs.
Treasury shares represent issued equity of Coronation repurchased by a group company and which have not been cancelled. Treasury shares are deducted from shareholders’ equity and represent the purchase consideration, including directly attributable costs. Where treasury shares are subsequently sold or reissued, net proceeds received are included in shareholders’ equity.
Dividends on ordinary shares are recognised as a deduction from equity in the period in which they are declared to the shareholders.
IMPAIRMENT OF FINANCIAL ASSETS
The group assesses at each reporting date whether there is any objective evidence that a financial asset or group of financial assets, excluding financial assets at fair value through profit or loss, is impaired. A financial asset is considered to be impaired if objective evidence indicates that one or more events have occurred that have a negative effect on the estimated future cash flows of that asset.
Assets measured at amortised costThe group first assesses whether objective evidence of impairment exists individually for financial assets that are individually significant, and individually or collectively for financial assets that are not individually significant. If it is determined that no objective evidence of impairment exists for an individually assessed financial asset, whether significant or not, the asset is included in a group of financial assets with similar credit risk characteristics and that group is collectively assessed for impairment. Assets that are individually assessed for impairment and for which an impairment loss is or continues to be recognised are not included in a collective assessment of impairment.
An impairment loss in respect of a financial asset measured at amortised cost is calculated as the difference between the asset’s carrying amount and the present value of estimated future cash flows (excluding credit losses that have not been incurred) discounted at the financial asset’s original effective interest rate. The carrying amount of the asset is reduced either directly or through use of an allowance account. The impairment loss is recognised in profit or loss.

AUDITED ANNUAL FINANCIAL STATEMENTS 2015 17
If, in a subsequent period, the amount of impairment loss decreases and the decrease can be related objectively to an event occurring after the impairment was recognised, the previously recognised impairment loss is reversed. Any subsequent reversal of an impairment loss is recognised in profit or loss, limited to what the carrying value would have been had no impairment loss been recognised in the past.
Available-for-sale financial assetsIf an available-for-sale financial asset is impaired, an amount comprising the difference between its cost (net of any principal payment and amortisation, where relevant) and its current value, less any impairment loss previously recognised in profit or loss, is transferred from other comprehensive income to profit or loss. Reversals of impairment in respect of equity instruments classified as available-for-sale are recognised directly in other comprehensive income.
Reversals of impairment losses on available-for-sale debt instruments are recognised in profit or loss, if the increase in fair value of the instrument can be objectively related to an event occurring after the impairment loss was recognised in profit or loss.
EQUIPMENT
Equipment is measured at cost less accumulated depreciation and impairment losses. Cost includes expenditure that is directly attributable to the acquisition of the asset. Purchased software that is integral to the functionality of the equipment is capitalised as part of the equipment. When parts of an item of equipment have different useful lives, they are accounted for as separate items (major components) of equipment.
Depreciation is provided on the depreciable amount of each component on a straight-line basis over the estimated useful life of the component. The depreciable amount related to each component is determined as the difference between the cost and the residual value of the component. The residual value is the estimated amount, net of disposal costs that the group would currently obtain from the disposal of a component of similar age and condition as expected at the end of its useful life. The residual values, estimated useful lives and depreciation methods of equipment are reassessed at each reporting date.
The estimated depreciation rates for each class of equipment for the current and comparative periods are as follows:
– Computer equipment 33% – 50%
– Furniture and fittings 10% – 20%
– Office equipment 20%
Leasehold improvement depreciation rates are determined by reference to the appropriate useful life of its separate components, limited to the period of the operating lease.
Routine maintenance of assets is expensed as incurred. Subsequent expenditure is only capitalised if it is probable that future economic benefits associated with the item will flow to the group.
The carrying amount of an item of equipment is derecognised on disposal or when no future economic benefits are expected from its use or disposal. Any gain or loss on derecognition, determined as the difference between the net disposal proceeds and the carrying amount of the item, is recognised in profit or loss when the item is derecognised.
IMPAIRMENT OF NON-FINANCIAL ASSETS
At each reporting date, the group assesses whether there is any indication that an asset (excluding deferred tax assets) may be impaired. The recoverable amount, being the higher of fair value less costs to sell and value in use, is determined for any asset for which an indication of impairment is identified. For goodwill and intangible assets that have indefinite lives or that are not yet available for use, the recoverable amount is estimated at each reporting date. If the recoverable amount of an asset is less than its carrying value, the carrying value of the asset is reduced to its recoverable amount.
For the purpose of impairment testing, assets are grouped together into the smallest group of assets that generate cash inflows from continuing use that are largely independent of cash inflows of other assets or groups of assets (the ’cash-generating unit’). If there is any indication that an asset may be impaired, the recoverable amount is estimated for the individual asset. If it is not possible to estimate the recoverable amount for the individual asset, the recoverable amount of the cash-generating unit to which the asset belongs will be determined. An impairment loss is recognised if the carrying amount of an asset or its cash-generating unit exceeds its estimated recoverable amount.
Impairment losses are recognised as an expense in profit or loss in the period in which they are identified. An impairment loss in respect of goodwill is not reversed. In respect of other assets, reversal of impairment losses is recognised in profit or loss in the period in which the reversal is identified, to the extent that the asset is not increased to a carrying value higher than it would have been had no impairment loss been recognised for the asset in prior years.

18 CORONATION FUND MANAGERS
ACCOUNTING POLICIESFOR THE YEAR ENDED 30 SEPTEMBER 2015 CONTINUED
LEASES
Leases in terms of which the group as the lessee assumes substantially all the risks and rewards of ownership are classified as finance leases. Other leases are operating leases.
Payments made under operating leases are recognised in profit or loss on a straight-line basis over the term of the lease. Lease incentives are recognised in profit or loss on a straight-line basis over the term of the lease as an integral part of the total lease expense.
INTANGIBLE ASSETS AND GOODWILL
GoodwillAll business combinations are accounted for by applying the purchase method. Goodwill represents amounts arising on acquisition of subsidiaries and associates. Goodwill represents the difference between the cost of the acquisition and the fair value of the net identifiable assets acquired.
Goodwill is stated at cost less any accumulated impairment losses. Goodwill is allocated to cash-generating units and is not amortised but is tested annually for impairment. In respect of equity-accounted investees, the carrying amount of goodwill is included in the carrying amount of the investment in the equity-accounted investee.
A gain on a bargain purchase arising on an acquisition is recognised directly in profit or loss.
Intangible assetsIntangible assets that are acquired by the group are stated at cost less accumulated amortisation and impairment losses.
Expenditure on internally generated goodwill and brands is recognised in profit or loss as an expense as incurred.
Subsequent expenditureSubsequent expenditure on capitalised intangible assets is capitalised only when it increases the future economic benefits embodied in the specific asset to which it relates. All other expenditure is expensed as incurred.
AmortisationAmortisation is charged to profit or loss on a straight-line basis over the estimated useful lives of intangible assets, unless such lives are indefinite, from the date they are available for use.
DerecognitionAn intangible asset is derecognised on disposal or when no future economic benefits are expected from its use or disposal.
EMPLOYEE BENEFITS
Short-term employee benefitsThe cost of all short-term employee benefits is recognised as an expense during the period in which the employee renders the related service. The accrual for employee entitlements to remuneration and annual leave represents the amount which the group has a present obligation to pay as a result of employees’ services provided by the reporting date. These accruals have been calculated at undiscounted amounts based on current salary rates.
Defined contribution plansA defined contribution plan is a benefit plan under which an entity pays fixed contributions into a separate legal entity and will have no legal or constructive obligation to pay further amounts. Contributions to defined contribution plans are recognised as an expense in profit or loss as incurred.
Share-based payment transactions with employeesThe group engages in equity-settled share-based payment transactions in respect of services received from employees.
The fair value of the services received in respect of equity-settled share-based payment transactions is determined by reference to the fair value of the shares or share options on the grant date to the employee. The cost of the share-based payment is recognised as an expense, with a corresponding increase in equity, over the vesting period of the grant. The amount recognised as an expense is adjusted to reflect the actual number of instruments that are expected to vest.
The increase in equity arising on the recognition of the share-based payments expense is recorded in the share-based payments reserve. Subsequently, once the transaction which gave rise to the initial expense has reached its conclusion, the portion of the share-based payments reserve which arose as a result of that particular transaction is transferred to retained earnings.

AUDITED ANNUAL FINANCIAL STATEMENTS 2015 19
The grant date fair value measurement is based on option pricing models, taking into account the risk-free interest rate, volatility of the underlying equity instrument, expected dividends, share price as at grant date and any market-based performance conditions attaching to the grant.
PROVISIONS, CONTINGENT LIABILITIES AND CONTINGENT ASSETS
Provisions are liabilities of uncertain timing or amount, and are recognised if, as a result of a past event, the group has created a legal or constructive obligation that can be estimated reliably and it is probable that an outflow of economic benefits will be required to settle the obligation. Provisions are determined by discounting the expected future cash flows at a pre-tax rate that reflects current market assessments of the time value of money and the risks specific to the liability.
Contingent assets and contingent liabilities are not recognised.
REVENUE
Revenue from fund management activities comprises fund management fees, service fees and initial charges.
Revenue from services rendered is recognised in profit or loss in proportion to the stage of completion of the transaction at the reporting date. The stage of completion is determined by reference to services rendered to date in terms of the relevant agreements.
Performance fee income is included in management fee income and is recognised as and when the group is unconditionally entitled to the revenue and no contingency with respect to future performance exists.
Revenue is measured at the fair value of the consideration received or receivable, net of value added tax and rebates.
Financial and other incomeFinancial income comprises interest and dividend income. Other income comprises realised and unrealised profits and losses on disposal or gains or losses on revaluation of financial assets, realised and unrealised foreign exchange gains and losses and other sundry income.
Interest income is recognised in profit or loss as it accrues, using the effective interest method. Dividend income is recognised in profit or loss on the date the entity’s right to receive payment is established.
EXPENSES
Finance expenseFinance expense comprises interest payable on borrowings calculated using the effective interest method.
Income tax expenseIncome tax on the profit or loss for the year comprises current and deferred tax. Income tax is recognised in profit or loss unless the underlying transaction is recognised in other comprehensive income or equity, in which case the related tax is also recognised in other comprehensive income or equity.
Current tax is the expected tax payable on the taxable income for the year, using tax rates enacted or substantively enacted at the reporting date, and any adjustment to tax payable in respect of previous years.
Deferred tax is recognised in respect of temporary differences between the carrying amounts of assets and liabilities for financial reporting purposes and the amounts used for taxation purposes. The following temporary deductible and taxable differences are not provided for: initial recognition of goodwill not deductible for tax purposes; the initial recognition of assets or liabilities in a transaction that is not a business combination that affects neither accounting nor taxable profit; and differences relating to investments in subsidiaries and associates to the extent that the company is able to control the timing of the reversal of the temporary differences and it is probable that the temporary differences will not reverse in the foreseeable future. The amount of deferred tax provided is based on the expected manner of realisation or settlement of the carrying amount of assets and liabilities, using tax rates that are expected to apply to the period when the asset is realised or the liability is settled, based on the tax rates (and laws) that have been enacted or substantively enacted by the end of the reporting period.
Deferred tax assets and liabilities are offset if there is a legally enforceable right to offset current tax assets and liabilities, and they relate to income taxes levied by the same tax authority on the same taxable entity, or different tax entities, but they intend to settle current tax assets and liabilities on a net basis or if their tax assets and liabilities will be realised simultaneously in each future period in which significant amounts of deferred tax liabilities or assets are expected to be settled or recorded.
A deferred tax asset is recognised only to the extent that it is probable that future taxable profits will be available against which the asset can be utilised. Deferred tax assets are reviewed at the end of each reporting period and are reduced to the extent that it is no longer probable that the related tax benefit will be realised.
20 CORONATION FUND MANAGERS
ACCOUNTING POLICIESFOR THE YEAR ENDED 30 SEPTEMBER 2015 CONTINUED
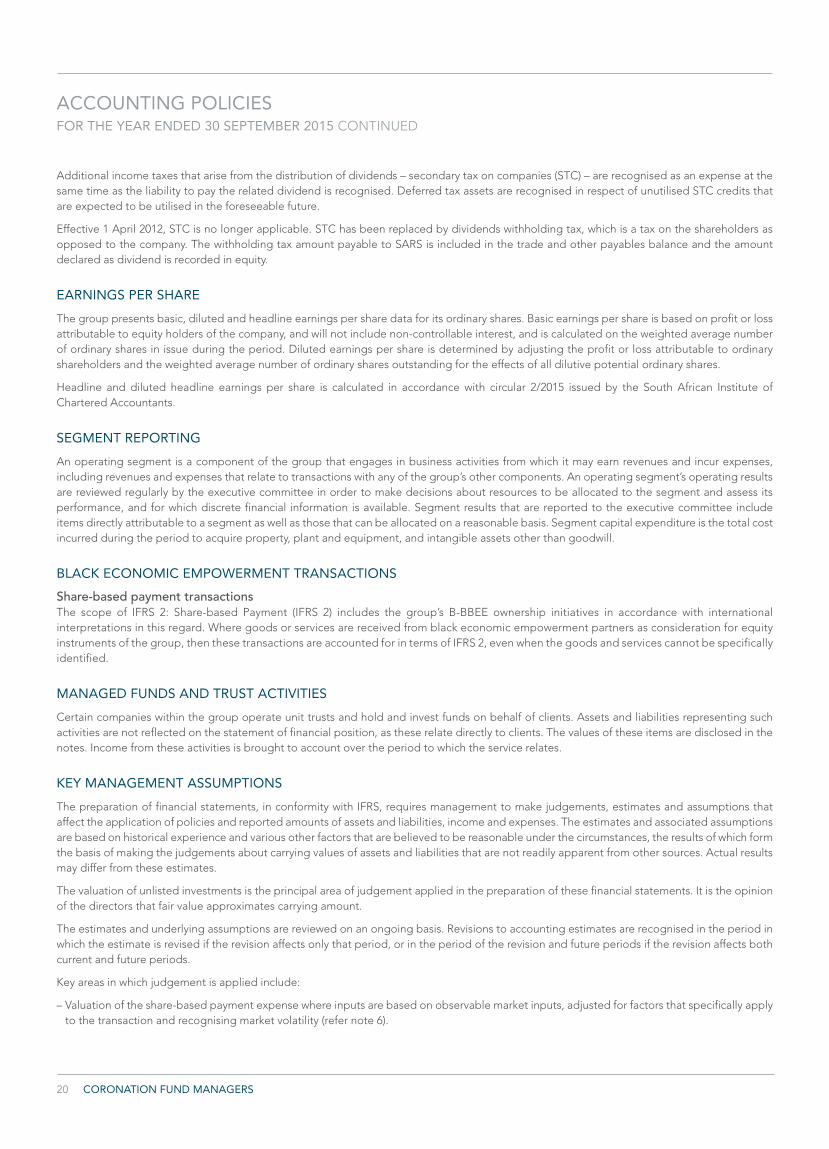
Additional income taxes that arise from the distribution of dividends – secondary tax on companies (STC) – are recognised as an expense at the same time as the liability to pay the related dividend is recognised. Deferred tax assets are recognised in respect of unutilised STC credits that are expected to be utilised in the foreseeable future.
Effective 1 April 2012, STC is no longer applicable. STC has been replaced by dividends withholding tax, which is a tax on the shareholders as opposed to the company. The withholding tax amount payable to SARS is included in the trade and other payables balance and the amount declared as dividend is recorded in equity.
EARNINGS PER SHARE
The group presents basic, diluted and headline earnings per share data for its ordinary shares. Basic earnings per share is based on profit or loss attributable to equity holders of the company, and will not include non-controllable interest, and is calculated on the weighted average number of ordinary shares in issue during the period. Diluted earnings per share is determined by adjusting the profit or loss attributable to ordinary shareholders and the weighted average number of ordinary shares outstanding for the effects of all dilutive potential ordinary shares.
Headline and diluted headline earnings per share is calculated in accordance with circular 2/2015 issued by the South African Institute of Chartered Accountants.
SEGMENT REPORTING
An operating segment is a component of the group that engages in business activities from which it may earn revenues and incur expenses, including revenues and expenses that relate to transactions with any of the group’s other components. An operating segment’s operating results are reviewed regularly by the executive committee in order to make decisions about resources to be allocated to the segment and assess its performance, and for which discrete financial information is available. Segment results that are reported to the executive committee include items directly attributable to a segment as well as those that can be allocated on a reasonable basis. Segment capital expenditure is the total cost incurred during the period to acquire property, plant and equipment, and intangible assets other than goodwill.
BLACK ECONOMIC EMPOWERMENT TRANSACTIONS
Share-based payment transactionsThe scope of IFRS 2: Share-based Payment (IFRS 2) includes the group’s B-BBEE ownership initiatives in accordance with international interpretations in this regard. Where goods or services are received from black economic empowerment partners as consideration for equity instruments of the group, then these transactions are accounted for in terms of IFRS 2, even when the goods and services cannot be specifically identified.
MANAGED FUNDS AND TRUST ACTIVITIES
Certain companies within the group operate unit trusts and hold and invest funds on behalf of clients. Assets and liabilities representing such activities are not reflected on the statement of financial position, as these relate directly to clients. The values of these items are disclosed in the notes. Income from these activities is brought to account over the period to which the service relates.
KEY MANAGEMENT ASSUMPTIONS
The preparation of financial statements, in conformity with IFRS, requires management to make judgements, estimates and assumptions that affect the application of policies and reported amounts of assets and liabilities, income and expenses. The estimates and associated assumptions are based on historical experience and various other factors that are believed to be reasonable under the circumstances, the results of which form the basis of making the judgements about carrying values of assets and liabilities that are not readily apparent from other sources. Actual results may differ from these estimates.
The valuation of unlisted investments is the principal area of judgement applied in the preparation of these financial statements. It is the opinion of the directors that fair value approximates carrying amount.
The estimates and underlying assumptions are reviewed on an ongoing basis. Revisions to accounting estimates are recognised in the period in which the estimate is revised if the revision affects only that period, or in the period of the revision and future periods if the revision affects both current and future periods.
Key areas in which judgement is applied include:
– Valuation of the share-based payment expense where inputs are based on observable market inputs, adjusted for factors that specifically apply to the transaction and recognising market volatility (refer note 6).

AUDITED ANNUAL FINANCIAL STATEMENTS 2015 21
IFRS, AMENDMENTS AND IFRIC INTERPRETATIONS ISSUED BUT NOT YET EFFECTIVE
The following IFRS and amendments that are relevant to the group have been issued but are not yet effective for the current financial year. The group will adopt these no later than their effective dates, to the extent that they are applicable to its activities. The impact of these is still being assessed.
■■ IFRS 9: Financial Instruments: Classification and Measurement
Effective for annual periods beginning on or after 1 January 2018
The chapters regarding classification and measurement of financial instruments have been issued by the International Accounting Standards Board (IASB). This phase of the new standard will have an impact on the classification and measurement of financial assets and a change in reporting regarding financial liabilities designated at fair value through profit or loss using the fair value option.
■■ IFRS 15: Revenue for contracts with customers
Effective for annual periods beginning on or after 1 January 2018
The standard emphasises how and when an IFRS reporter will recognise revenue as well as requiring such entities to provide users of financial statements with more informative, relevant disclosures. The standard applies a single, principle-based five-step model to be applied to all contracts with customers.
■■ IAS 1: Presentation of Financial Statements
Effective for annual periods beginning on or after 1 January 2016
These amendments are intended to assist entities in applying judgement when meeting the presentation and disclosure requirements in IFRS, and do not affect recognition and measurement. Although these amendments clarify existing requirements of IAS 1, the clarifications may facilitate enhanced disclosure effectiveness.
■■ IAS 16: Property, Plant and Equipment
Effective for annual periods beginning on or after 1 January 2016
The amendments clarify the principle in IAS 16 Property, Plant and Equipment and IAS 38 Intangible Assets that revenue reflects a pattern of economic benefits that are generated from operating a business (of which the asset is part) rather than the economic benefits that are consumed through use of the asset.
■■ IAS 19: Employee Benefits
Effective for annual periods beginning on or after 1 January 2016
The amendment to IAS 19 clarifies that market depth of high quality corporate bonds is assessed based on the currency in which the obligation is denominated, rather than the country where the obligation is located.
■■ IAS 27: Equity Method in Separate Financial Statements
Effective for annual periods beginning on or after 1 January 2016
The amendments to IAS 27 Separate Financial Statements allow an entity to use the equity method as described in IAS 28 to account for its investments in subsidiaries, joint ventures and associates in its separate financial statements.
■■ IAS 38: Intangible Assets – Revaluation method – proportionate restatement of accumulated depreciation/amortisation
Effective for annual periods beginning on or after 1 January 2016
The amendments clarify the principle in IAS 16 Property, Plant and Equipment and IAS 38 Intangible Assets that revenue reflects a pattern of economic benefits that are generated from operating a business (of which the asset is part) rather than the economic benefits that are consumed through use of the asset.
■■ ■IFRS 10, IFRS 12 and IAS 28: Consolidated Financial Statements, Disclosure of Interests in Other Entities, Investments in Associates
Effective for annual periods beginning on or after 1 January 2016
The amendments to IFRS 10 clarify that the exemption from presenting consolidated financial statements applies to a parent entity that is a subsidiary of an investment entity, when the investment entity measures all of its subsidiaries at fair value. Furthermore, only a subsidiary of an investment entity that is not an investment entity itself and that provides support services to the investment entity is consolidated. All other subsidiaries of an investment entity are measured at fair value. The amendments to IAS 28 allow the investor, when applying the equity method, to retain the fair value measurement applied by the investment entity associate or joint venture to its interests in subsidiaries.

22 CORONATION FUND MANAGERS
NOTES TO THE CONSOLIDATED FINANCIAL STATEMENTSFOR THE YEAR ENDED 30 SEPTEMBER 2015
1 Operating segments Segment information is presented in respect of the group’s operating segments based on geographical location. The international segment
consists of internationally domiciled funds and clients as well as South African clients with international mandates.
Inter-segment pricing is determined on an arm’s length basis.
Segment results, assets and liabilities include items directly attributable to a segment as well as those that can be allocated on a reasonable basis. Segment capital expenditure is the total cost incurred during the year to acquire segment assets that are expected to be used for more than one period.
Each segment’s operating profitability is measured based on segment results and the segment’s income from fund management.

AUDITED ANNUAL FINANCIAL STATEMENTS 2015 23
Africa International Group
2015 2014 2015 2014 2015 2014R million R million R million R million R million R million
1 Operating segments (continued)Segment reportFund management Segment external revenue 3 008 3 260 1 434 1 514 4 442 4 774
Segment operating expenses (1 356) (1 427) (734) (744) (2 090) (2 171)Share-based payment expense (11) (1) – – (11) (1)Other expenses (1 345) (1 426) (734) (744) (2 079) (2 170)
Segment result 1 652 1 833 700 770 2 352 2 603
Segment financial income 42 60 18 (4) 60 56 Finance and dividend income 32 42 – – 32 42 Other income/(expense) 10 18 18 (4) 28 14
Segment finance expense (15) (4) – – (15) (4)Share of profit of equity-accounted
investees 8 7 – – 8 7 Segment income from fund
management 1 687 1 896 718 766 2 405 2 662
Income attributable to policyholder linked assets and investment partnerships 25 41
Net fair value gains on policyholder and investment partnership financial instruments 54 59
Administration expenses borne by policyholders and investors in investment partnerships (29) (18)
Profit before income tax 2 430 2 703 Income tax expense (620) (699)Taxation on shareholder profits (595) (658)Taxation on policyholder investment
contracts (25) (41)
Profit for the year 1 810 2 004
Attributable to:– equity holders of the company 1 812 2 001 – non-controlling interest (2) 3
Profit for the year 1 810 2 004
NOTES TO THE CONSOLIDATED FINANCIAL STATEMENTSFOR THE YEAR ENDED 30 SEPTEMBER 2015 CONTINUED
NOTES TO THE CONSOLIDATED FINANCIAL STATEMENTSFOR THE YEAR ENDED 30 SEPTEMBER 2015 CONTINUED
24 CORONATION FUND MANAGERS
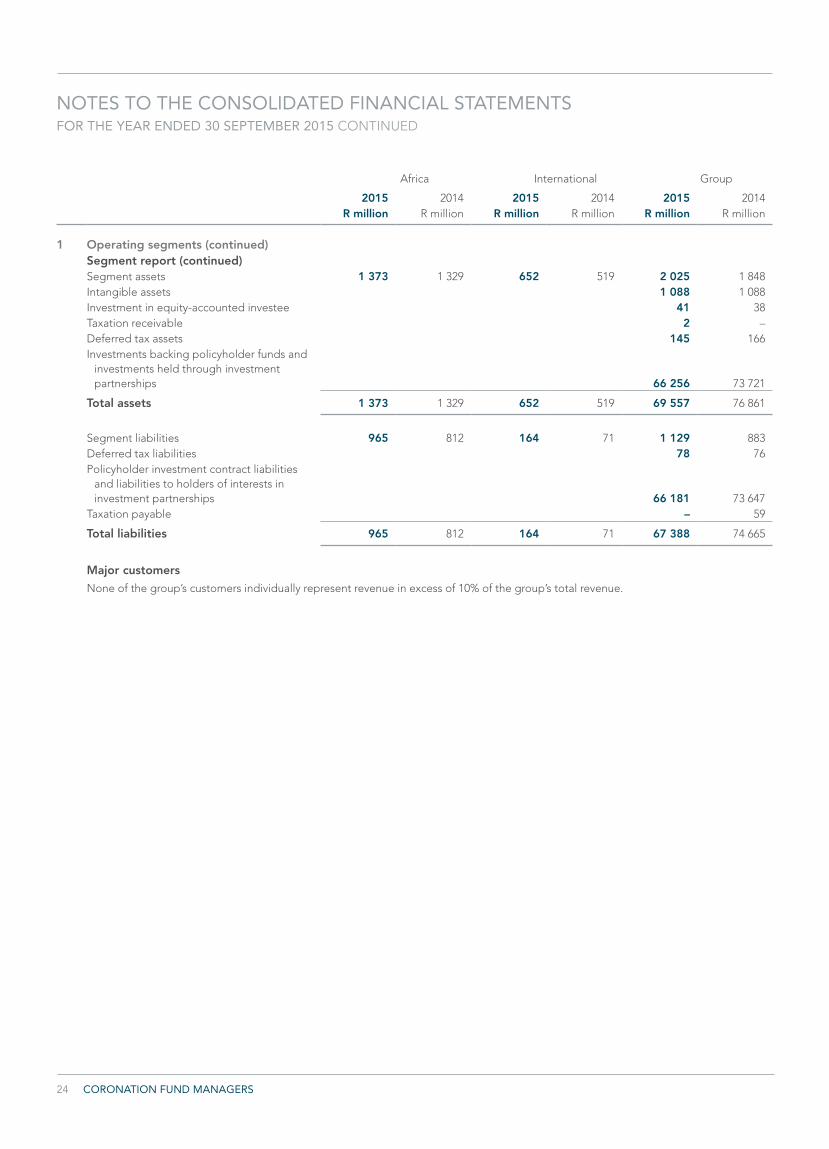
Africa International Group
2015 2014 2015 2014 2015 2014R million R million R million R million R million R million
1 Operating segments (continued)Segment report (continued)Segment assets 1 373 1 329 652 519 2 025 1 848 Intangible assets 1 088 1 088 Investment in equity-accounted investee 41 38 Taxation receivable 2 – Deferred tax assets 145 166 Investments backing policyholder funds and
investments held through investment partnerships 66 256 73 721
Total assets 1 373 1 329 652 519 69 557 76 861
Segment liabilities 965 812 164 71 1 129 883 Deferred tax liabilities 78 76 Policyholder investment contract liabilities
and liabilities to holders of interests in investment partnerships 66 181 73 647
Taxation payable – 59
Total liabilities 965 812 164 71 67 388 74 665
Major customers
None of the group’s customers individually represent revenue in excess of 10% of the group’s total revenue.
AUDITED ANNUAL FINANCIAL STATEMENTS 2015 25
2015 2014R million R million
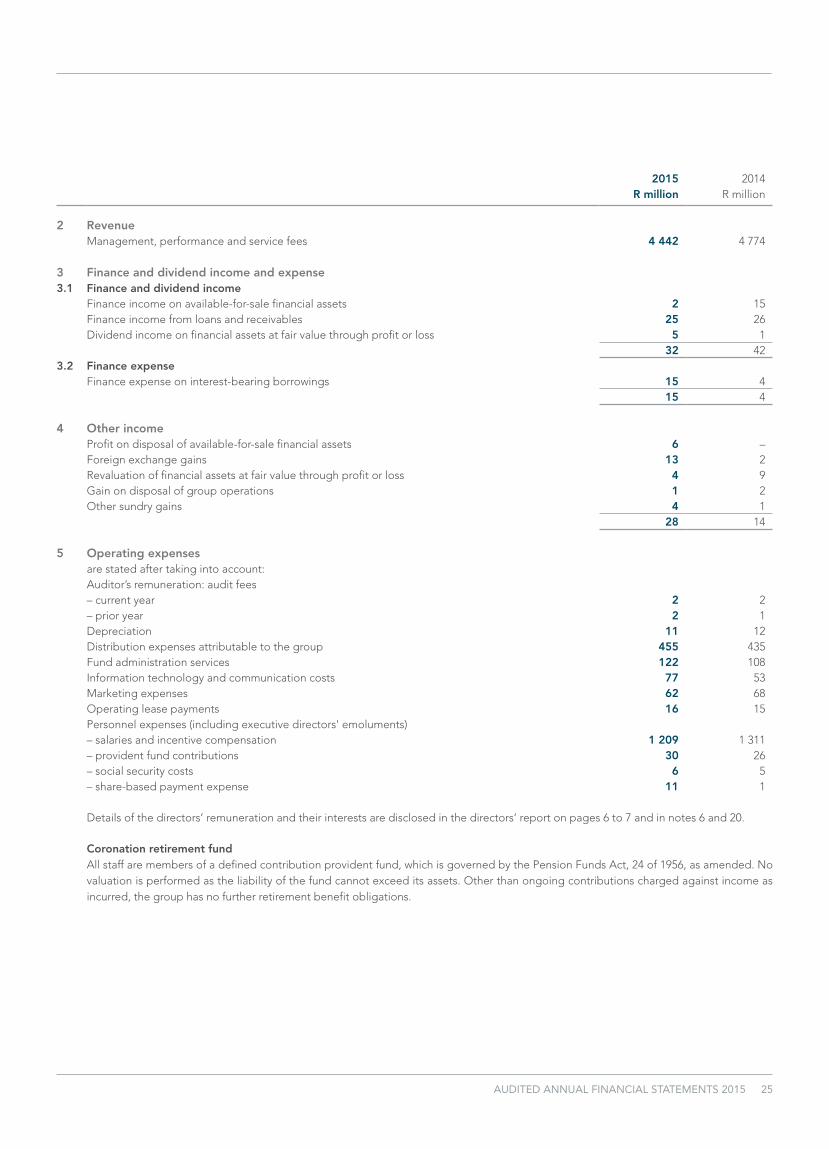
2 RevenueManagement, performance and service fees 4 442 4 774
3 Finance and dividend income and expense3.1 Finance and dividend income
Finance income on available-for-sale financial assets 2 15 Finance income from loans and receivables 25 26 Dividend income on financial assets at fair value through profit or loss 5 1
32 42 3.2 Finance expense
Finance expense on interest-bearing borrowings 15 4 15 4
4 Other incomeProfit on disposal of available-for-sale financial assets 6 – Foreign exchange gains 13 2 Revaluation of financial assets at fair value through profit or loss 4 9 Gain on disposal of group operations 1 2 Other sundry gains 4 1
28 14
5 Operating expensesare stated after taking into account:Auditor’s remuneration: audit fees– current year 2 2– prior year 2 1Depreciation 11 12 Distribution expenses attributable to the group 455 435 Fund administration services 122 108 Information technology and communication costs 77 53 Marketing expenses 62 68 Operating lease payments 16 15 Personnel expenses (including executive directors' emoluments)– salaries and incentive compensation 1 209 1 311 – provident fund contributions 30 26 – social security costs 6 5 – share-based payment expense 11 1
Details of the directors’ remuneration and their interests are disclosed in the directors’ report on pages 6 to 7 and in notes 6 and 20.
Coronation retirement fund All staff are members of a defined contribution provident fund, which is governed by the Pension Funds Act, 24 of 1956, as amended. No valuation is performed as the liability of the fund cannot exceed its assets. Other than ongoing contributions charged against income as incurred, the group has no further retirement benefit obligations.

26 CORONATION FUND MANAGERS
6 Share-based payment expenseShare transactions Coronation Investments and Trading Limited (CIT) offered Coronation shares to employees of the group. The sale of shares is restricted while an employee is employed by Coronation. The compensation benefit which was required to be spread over the vesting period was approximated by the intrinsic value of the offer, being the difference between the market share price and the offer price on grant date.
1 February 2005– Assumed employee turnover rate per annum 5.0%– Number of shares 11 193 336 – Vesting period 31 January 2008 to 31 January 2010– Closing share price on grant date (cents per share) 402– Offer price (cents per share) 150– Restriction on sale while employed one third
1 April 2005– Assumed employee turnover rate per annum 5.0%– Number of shares 13 600 000– Vesting period 15 April 2008 to 15 April 2010– Closing share price on grant date (cents per share) 395– Offer price (cents per share) 150– Restriction on sale while employed 13 600 000
2015 2014Number Number
Details of number of restricted shares held during the year
At beginning of year 23 960 001 24 793 336 Forfeited during the year – –Exercised during the year (428 333) (833 335)At end of year 23 531 668 23 960 001
B-BBEE transactionCoronation established the Imvula Trust to facilitate its B-BBEE transactions. On 1 April 2005, the Imvula Trust acquired 10% of Coronation Investment Management Proprietary Limited from Coronation. The acquisition consideration amounted to R147 million, based on a price per Coronation share of R3.85, and was funded by the issue of redeemable preference shares to a third party financier. The funding was guaranteed by Coronation and the Imvula Trust was consolidated into the group’s financial statements.
The Imvula Trust was no longer consolidated into the group as from 28 February 2013. The impact on the group is insignificant.
A board of trustees was established to nominate the beneficiaries of the Imvula II Trust who will, upon fulfilment of certain conditions, have an interest in the underlying shares held by the Imvula Trust. Performance and service conditions impact the vesting period of the shares, which ranges from three to five years. The majority of these units have been allocated to beneficiaries as at 30 September 2015.
The fair value was estimated at the date of the sale in 2005 using an option valuation model. The inputs into the model were as follows:– Assumed employee forfeiture rate per annum 5%– Dividend yield 6.50%– Fair value at grant date (cents per share) 385
During 2014 the Imvula II Trust was formed to house unallocated units.
NOTES TO THE CONSOLIDATED FINANCIAL STATEMENTSFOR THE YEAR ENDED 30 SEPTEMBER 2015 CONTINUED

AUDITED ANNUAL FINANCIAL STATEMENTS 2015 27
2015 2014R million R million
6 Share-based payment expense (continued)Expense charged to profit or lossB-BBEE transaction 11 1
Total expense 11 1
Equity-based remuneration of executive directors
CIT transaction (Coronation shares)
Restricted balance
1 October 2014 Granted Vested Vesting date
Restricted balance
30 September 2015
Market value30 September 2015
R’000
2015Anton Pillay 125 000 – – – 125 000 8 161
Restricted balance
1 October 2013 Granted Vested Vesting date
Restricted balance
30 September 2014
Market value30 September 2014
R’000
2014Anton Pillay 125 000 – – – 125 000 12 081
Black economic empowerment schemes Imvula Trust (units)
Restricted balance
1 October 2014 Granted Vested Vesting date
Restricted balance
30 September 2015
Market value30 September 2015
R’000
IFRS 2 chargeR’000
2015Anton Pillay 47 188 – (47 188) 3 November 2014 – – 94
Restricted balance
1 October 2013 Granted Vested Vesting date
Restricted balance
30 September 2014
Market value30 September 2014
R’000
IFRS 2 chargeR’000
2014Anton Pillay 194 576 – (147 388) 1 February 2014 47 188 4 611 129

28 CORONATION FUND MANAGERS
2015 2014R million R million
7 Income tax expenseTaxation on shareholder profitsCurrent taxSouth Africa – current tax on income for the year 461 604 – adjustments in respect of prior years (2) –
Other – International – current tax on income for the year 105 108 – adjustments in respect of prior years – (1)
Total current tax 564 711
Deferred taxSouth Africa 32 (52)– origination and reversal of temporary difference 32 (52)
International (1) (1)
Total deferred tax 31 (53)
Taxation on shareholder profits 595 658 Taxation on policyholder investment contracts 25 41
Income tax expense 620 699
The rates of corporation tax for the relevant years are:South Africa 28% 28%International (average) 16% 19%
Profit from fund management before tax 2 405 2 662
Taxation on shareholder profits 595 658
Effective tax rate excluding policyholder tax 25% 25%
Effective tax rate including policyholder tax 26% 26%
NOTES TO THE CONSOLIDATED FINANCIAL STATEMENTSFOR THE YEAR ENDED 30 SEPTEMBER 2015 CONTINUED

AUDITED ANNUAL FINANCIAL STATEMENTS 2015 29
2015 2014R million R million
7 Income tax expense (continued)Reconciliation of taxation on shareholder profits The tax charge is different to the standard rate as detailed below:Tax on profit from fund management before tax, at SA rate of 28% 673 745 Effect of tax rates in foreign jurisdictions (82) (82)Share-based payment expense 3 –Non-deductible expenses 8 4Tax exempt income (3) (6) Overprovided in prior years (2) (1)Effect of equity-accounted profits included net of tax (2) (2)
Taxation on shareholder profits 595 658
Tax on policyholder investment contractsCurrent taxSouth Africa– current tax on income for the year 27 44
Deferred taxSouth Africa (2) (3)
Tax on policyholder investment contracts 25 41
Income tax expense 620 699
8 Earnings per shareBasic earnings per share (cents) Cents Cents
Basic earnings per share is calculated by dividing the earnings attributable to ordinary shareholders by the weighted number of ordinary shares in issue during the year. 517.9 572.1
Number’000
Number’000
Issued ordinary shares at beginning of year 349 799 349 799 Weighted average number of ordinary shares in issue during the year 349 799 349 799
Adjusted weighted number of ordinary shares potentially in issue 349 799 349 799
R million R million
Earnings attributable to shareholders 1 810 2 004 Non-controlling interest 2 (3)
Earnings attributable to ordinary shareholders 1 812 2 001

30 CORONATION FUND MANAGERS
2015 2014Cents Cents
8 Earnings per share (continued)Diluted earnings per share (cents)Diluted earnings per share is calculated by dividing the earnings attributable to ordinary shareholders, adjusted for the effects of dilutive ordinary potential shares, by the weighted average number of shares in issue during the year plus the weighted average number of ordinary shares potentially in issue. 517.9 572.1
R million R million
Earnings attributable to shareholders 1 812 2 001
Diluted earnings attributable to ordinary shareholders 1 812 2 001
Headline earnings per share (cents)Headline earnings per share has been calculated in accordance with circular 2/2015 issued by the South African Institute of Chartered Accountants
Earnings Non- attributable
Profit controlling to ordinary before tax Tax interest shareholders Per share R million R million R million R million Cents
2015Per the financial statements 2 430 (620) 2 1 812 517.9 Adjustments:– Gain on disposal of subsidiary (1) – – (1) (0.2)– Profit on disposal of investments (6) – – (6) (1.7)
Headline earnings 2 423 (620) 2 1 805 516.0
Diluted headline earnings per share (cents) 1 805 516.0
2014Per the financial statements 2 703 (699) (3) 2 001 572.1 Adjustments:– Gain on disposal of associate (2) – – (2) (0.5)
Headline earnings 2 701 (699) (3) 1 999 571.6
Diluted headline earnings per share (cents) 1 999 571.6
Dividends per share 2015 2014Cents Cents
Dividend distribution– interim: declared 19 May 2015 (2014: 20 May 2014) 246 275– final: declared 10 November 2015 (2014: 11 November 2014) 270 296
Total dividend 516 571
NOTES TO THE CONSOLIDATED FINANCIAL STATEMENTSFOR THE YEAR ENDED 30 SEPTEMBER 2015 CONTINUED
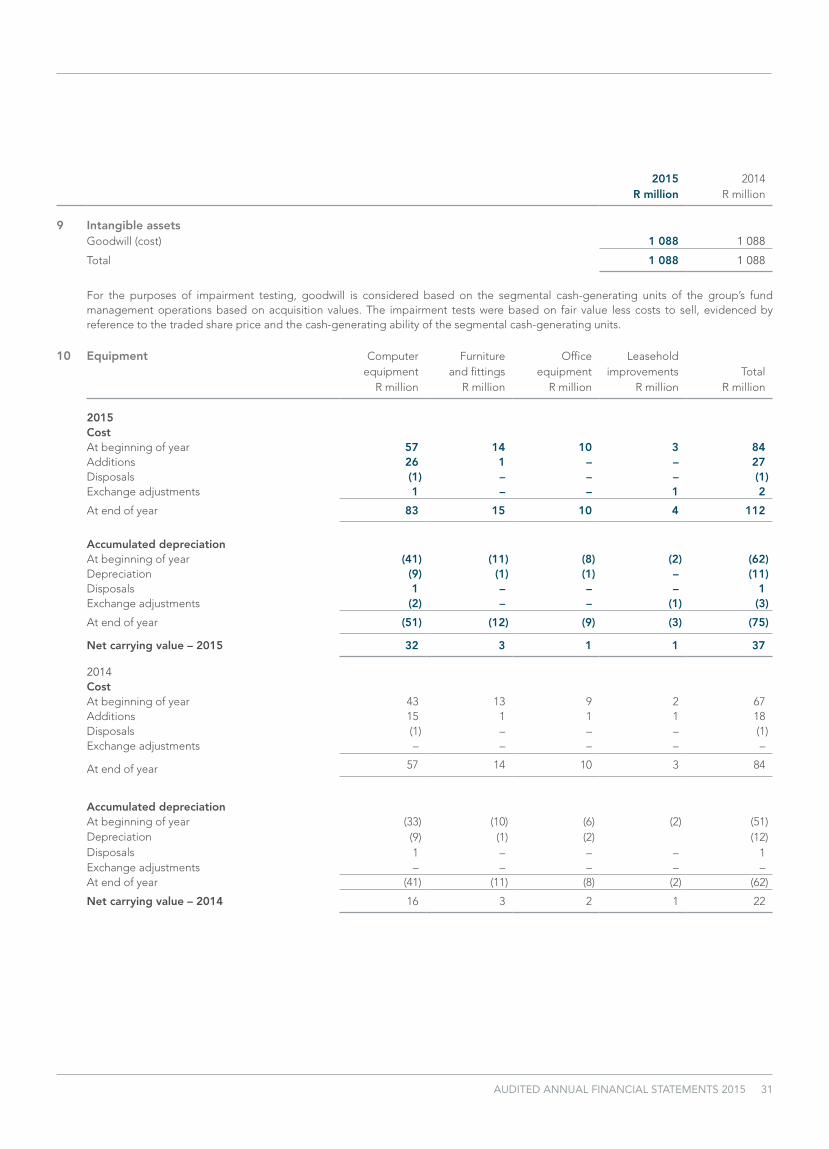
AUDITED ANNUAL FINANCIAL STATEMENTS 2015 31
2015 2014R million R million
9 Intangible assetsGoodwill (cost) 1 088 1 088
Total 1 088 1 088
For the purposes of impairment testing, goodwill is considered based on the segmental cash-generating units of the group’s fund management operations based on acquisition values. The impairment tests were based on fair value less costs to sell, evidenced by reference to the traded share price and the cash-generating ability of the segmental cash-generating units.
10 Equipment Computer Furniture Office Leaseholdequipment and fittings equipment improvements Total
R million R million R million R million R million
2015CostAt beginning of year 57 14 10 3 84 Additions 26 1 – – 27Disposals (1) – – – (1) Exchange adjustments 1 – – 1 2
At end of year 83 15 10 4 112
Accumulated depreciationAt beginning of year (41) (11) (8) (2) (62)Depreciation (9) (1) (1) – (11)Disposals 1 – – – 1 Exchange adjustments (2) – – (1) (3)
At end of year (51) (12) (9) (3) (75)
Net carrying value – 2015 32 3 1 1 37
2014CostAt beginning of year 43 13 9 2 67 Additions 15 1 1 1 18 Disposals (1) – – – (1)Exchange adjustments – – – – –
At end of year 57 14 10 3 84
Accumulated depreciationAt beginning of year (33) (10) (6) (2) (51)Depreciation (9) (1) (2) (12)Disposals 1 – – – 1 Exchange adjustments – – – – –At end of year (41) (11) (8) (2) (62)
Net carrying value – 2014 16 3 2 1 22

32 CORONATION FUND MANAGERS
2015 2014R million R million
11 Investment in equity-accounted investeesAnalysis of the movement in our share of net assets:At beginning of year 38 34Share of profit from equity-accounted investee 8 7Dividends received (5) (3)
At end of year 41 38
Summary financial information of equity-accounted investees:
Ownership Assets Liabilities Equity Revenue Profit2015 Country % R million R million R million R million R million
Namibia Asset Management Limited Namibia 48.05 31 15 16 47 8
Ownership Assets Liabilities Equity Revenue Profit2014 Country % R million R million R million R million R million
Namibia Asset Management Limited Namibia 48.05 22 12 10 43 7
NOTES TO THE CONSOLIDATED FINANCIAL STATEMENTSFOR THE YEAR ENDED 30 SEPTEMBER 2015 CONTINUED
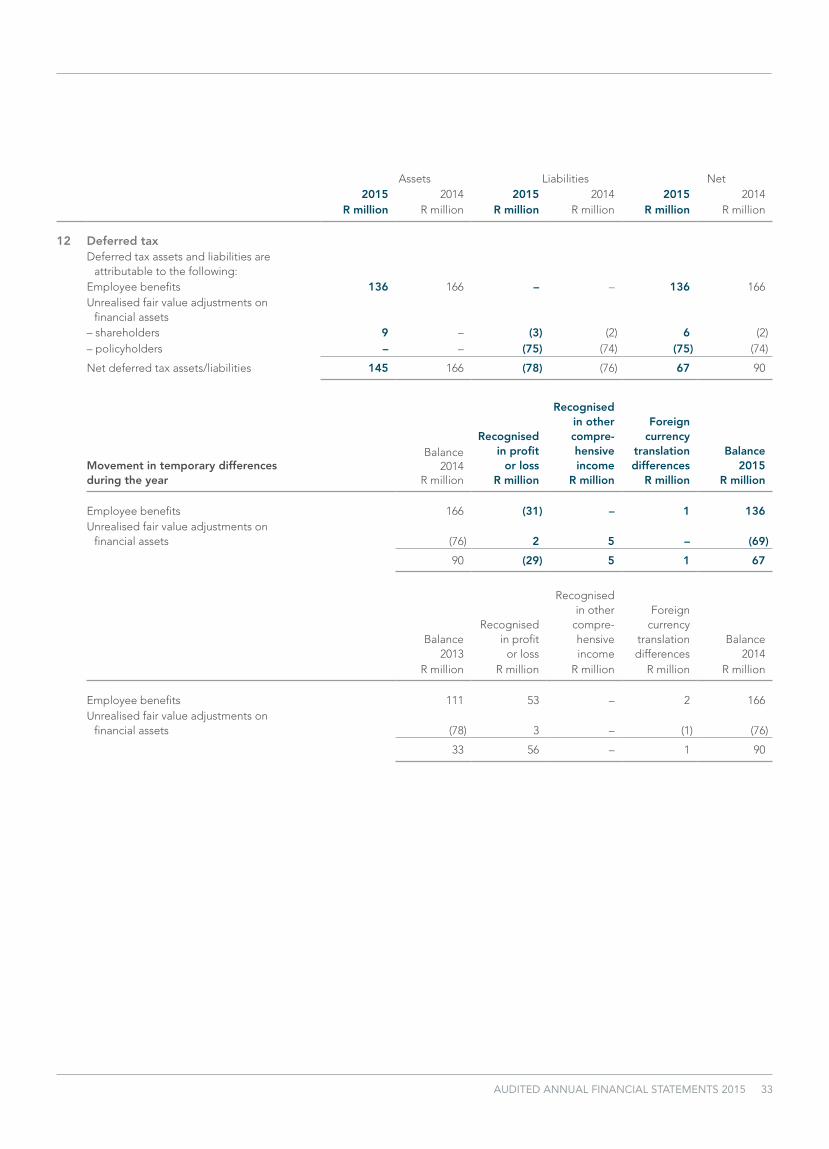
AUDITED ANNUAL FINANCIAL STATEMENTS 2015 33
Assets Liabilities Net2015 2014 2015 2014 2015 2014
R million R million R million R million R million R million
12 Deferred tax Deferred tax assets and liabilities are
attributable to the following:Employee benefits 136 166 – – 136 166Unrealised fair value adjustments on
financial assets– shareholders 9 – (3) (2) 6 (2)– policyholders – – (75) (74) (75) (74)
Net deferred tax assets/liabilities 145 166 (78) (76) 67 90
Movement in temporary differences during the year
Balance2014
R million
Recognised in profit
or lossR million
Recognised in other compre-hensive income
R million
Foreigncurrency
translationdifferences
R million
Balance2015
R million
Employee benefits 166 (31) – 1 136 Unrealised fair value adjustments on
financial assets (76) 2 5 – (69)
90 (29) 5 1 67
Balance2013
Recognised in profit
or loss
Recognised in other
compre-hensive income
Foreigncurrency
translationdifferences
Balance2014
R million R million R million R million R million
Employee benefits 111 53 – 2 166 Unrealised fair value adjustments on
financial assets (78) 3 – (1) (76)
33 56 – 1 90
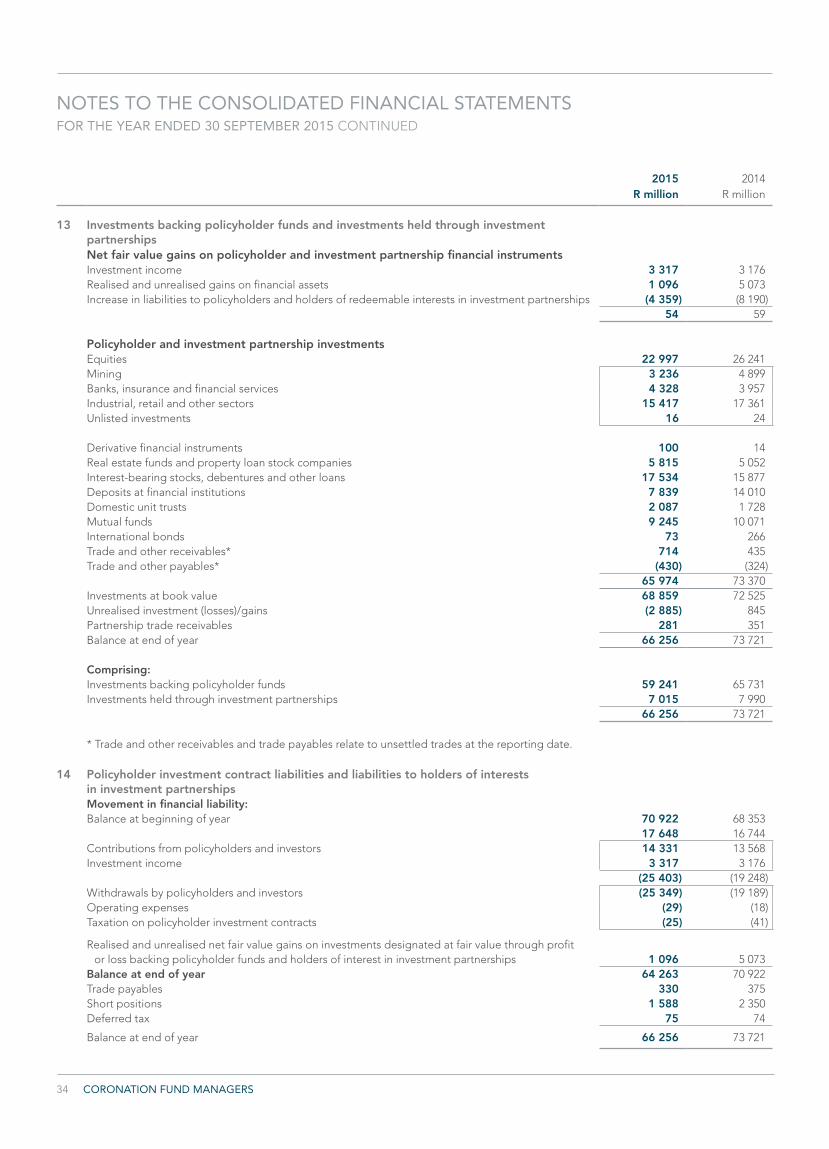
34 CORONATION FUND MANAGERS
2015 2014R million R million
13 Investments backing policyholder funds and investments held through investment partnershipsNet fair value gains on policyholder and investment partnership financial instrumentsInvestment income 3 317 3 176 Realised and unrealised gains on financial assets 1 096 5 073 Increase in liabilities to policyholders and holders of redeemable interests in investment partnerships (4 359) (8 190)
54 59
Policyholder and investment partnership investmentsEquities 22 997 26 241Mining 3 236 4 899 Banks, insurance and financial services 4 328 3 957 Industrial, retail and other sectors 15 417 17 361 Unlisted investments 16 24
Derivative financial instruments 100 14 Real estate funds and property loan stock companies 5 815 5 052 Interest-bearing stocks, debentures and other loans 17 534 15 877 Deposits at financial institutions 7 839 14 010 Domestic unit trusts 2 087 1 728 Mutual funds 9 245 10 071 International bonds 73 266 Trade and other receivables* 714 435 Trade and other payables* (430) (324) 65 974 73 370Investments at book value 68 859 72 525 Unrealised investment (losses)/gains (2 885) 845 Partnership trade receivables 281 351 Balance at end of year 66 256 73 721
Comprising:Investments backing policyholder funds 59 241 65 731 Investments held through investment partnerships 7 015 7 990
66 256 73 721
* Trade and other receivables and trade payables relate to unsettled trades at the reporting date.
14 Policyholder investment contract liabilities and liabilities to holders of interests in investment partnershipsMovement in financial liability:Balance at beginning of year 70 922 68 353
17 648 16 744 Contributions from policyholders and investors 14 331 13 568 Investment income 3 317 3 176
(25 403) (19 248)Withdrawals by policyholders and investors (25 349) (19 189)Operating expenses (29) (18)Taxation on policyholder investment contracts (25) (41)
Realised and unrealised net fair value gains on investments designated at fair value through profit or loss backing policyholder funds and holders of interest in investment partnerships 1 096 5 073
Balance at end of year 64 263 70 922 Trade payables 330 375 Short positions 1 588 2 350 Deferred tax 75 74
Balance at end of year 66 256 73 721
NOTES TO THE CONSOLIDATED FINANCIAL STATEMENTSFOR THE YEAR ENDED 30 SEPTEMBER 2015 CONTINUED

AUDITED ANNUAL FINANCIAL STATEMENTS 2015 35
2015 2014R million R million
14 Policyholder investment contract liabilities and liabilities to holders of interests in investment partnerships (continued)Comprising:Liability to policyholders in respect of investment contracts 59 166 65 657 Liability to holders of redeemable interests in investment partnerships 7 015 7 990
66 181 73 647Deferred tax liabilities 75 74
66 256 73 721
The amount of cash placed as collateral in respect of scrip borrowings amounts to R216 million (2014: R472 million). This amount is recognised as a receivable by the investment partnerships. In addition to this, the investment partnerships have placed scrip as collateral amounting to R1.48 billion (2014: R2.0 billion). This collateral relates to the short sale transactions.
Policyholder liabilities are payable on demand. Trade payables relate to costs incurred on behalf of policyholders.
15 Financial assets and financial liabilities15.1 Accounting classifications and fair values
The table below sets out the group’s classification of each class of financial assets and financial liabilities, and their fair values.
Designated Financialat fair value liabilities at
through Loans and Available- amortised Carrying R million Note profit or loss receivables for-sale cost amount Fair value
2015Cash and cash equivalents – 728 – – 728 728 Trade and other receivables – 509 – – 509 509 Investments backing
policyholder funds 13 59 241 – – – 59 241 59 241 Investments held through
investment partnerships 13 7 015 – – – 7 015 7 015 Investment securities 15.2 140 – 611 – 751 751
66 396 1 237 611 – 68 244 68 244
Trade and other payables – – – 705 705 705 Liability to policyholders in respect
of investment contracts 59 166 – – – 59 166 59 166 Liability to holders of redeemable
interests in investment partnerships 7 015 – – – 7 015 7 015 External investors in consolidated
funds 124 – – – 124 124Long-term borrowings – – – 300 300 300
66 305 – – 1 005 67 310 67 310

36 CORONATION FUND MANAGERS
NOTES TO THE CONSOLIDATED FINANCIAL STATEMENTSFOR THE YEAR ENDED 30 SEPTEMBER 2015 CONTINUED
15 Financial assets and financial liabilities (continued)15.1 Accounting classifications and fair values (continued)
Designated Financialat fair value liabilities at
through Loans and Available- amortised Carrying R million Note profit or loss receivables for-sale cost amount Fair value
2014Cash and cash equivalents – 832 – – 832 832 Trade and other receivables – 760 – – 760 760 Investments backing
policyholder funds 13 65 731 – – – 65 731 65 731 Investments held through
investment partnerships 13 7 990 – – – 7 990 7 990 Investment securities 15.2 – – 234 – 234 234
73 721 1 592 234 – 75 547 75 547
Trade and other payables – – – 731 731 731 Liability to policyholders in respect
of investment contracts 65 657 – – – 65 657 65 657 Liability to holders of redeemable
interest in investment partnerships 7 990 – – – 7 990 7 990 Long-term borrowings – – – 152 152 152
73 647 – – 883 74 530 74 530
2015 2014R million R million
15.2 Investment securitiesFinancial assets available-for-sale
– Mutual funds and unit trusts 250 234
– Listed equities and bonds in respect of consolidated funds 361 –
Financial assets at fair value through profit and loss– Unit trusts 140 –
751 234
16 Long-term borrowingsBalance at beginning of year 152 –Received during the year 150 150 Interest accrued 15 4 Interest paid (17) (2)
300 152
Two tranches of cumulative redeemable preference shares were issued as follows:Cumulative redeemable preference shares were issued by Coronation Investment Management SA (Pty) Ltd on 31 March 2015 in order to seed the launch of the new international funds. Dividends, linked to prime, are payable on a quarterly basis with capital repayment due on 31 March 2018.
Cumulative redeemable preference shares were issued by Coronation Investment Management SA (Pty) Ltd on 31 March 2014 in order to recapitalise licensed subsidiary companies for regulatory capital adequacy requirements. Dividends, linked to prime, are payable on a quarterly basis with capital repayment being due on 31 March 2017.
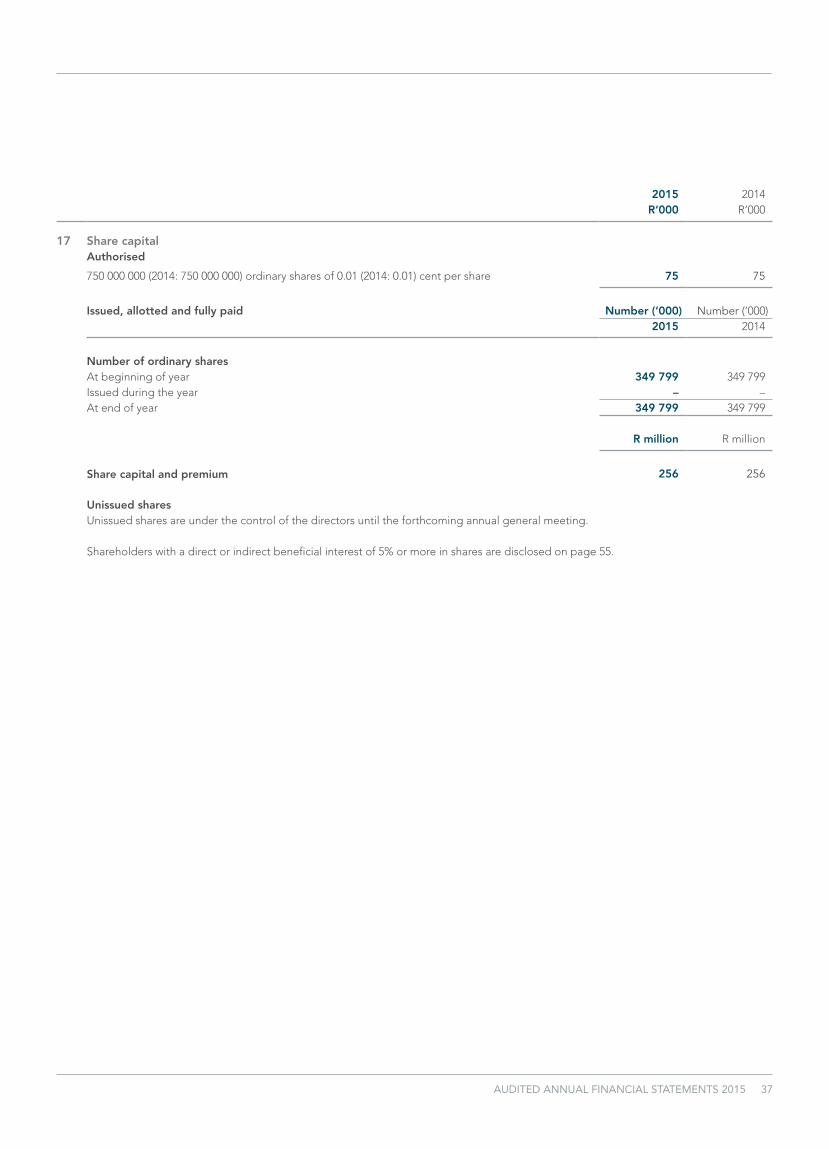
AUDITED ANNUAL FINANCIAL STATEMENTS 2015 37
2015 2014R‘000 R‘000
17 Share capitalAuthorised
750 000 000 (2014: 750 000 000) ordinary shares of 0.01 (2014: 0.01) cent per share 75 75
Issued, allotted and fully paid Number (‘000) Number (‘000)2015 2014
Number of ordinary sharesAt beginning of year 349 799 349 799Issued during the year – – At end of year 349 799 349 799
R million R million
Share capital and premium 256 256
Unissued sharesUnissued shares are under the control of the directors until the forthcoming annual general meeting.
Shareholders with a direct or indirect beneficial interest of 5% or more in shares are disclosed on page 55.

38 CORONATION FUND MANAGERS
18 Financial risk disclosuresThe group is exposed to market risk, credit risk, liquidity risk, price risk, interest rate risk and currency risk through a combination of the nature of its operations, the financial instruments of which it is a party and the location of its operations.
This note represents information about the group’s exposure to each of the above risks, the group’s objectives, policies and processes for measuring and managing risk, and the group’s management of capital. Further quantitative disclosures are included throughout these consolidated financial statements.
Risk management and control are integral to the governance of the group as more fully explained in the integrated report. There has been no change in the documented risk and control policies in the current year.
The board of directors has overall responsibility for the establishment and oversight of the group’s risk management framework. The board has established the audit and risk committee, which is responsible for developing and monitoring the group’s risk management policies. The committee reports regularly to the board of directors on its activities.
The group’s risk management policies are established to identify and analyse the risks faced by the group, to set appropriate risk limits and controls, and to monitor risks and adherence to limits. Risk management policies and systems are reviewed regularly to reflect changes in market conditions, products and services offered. The group, through its training and management standards and procedures, aims to develop a disciplined and constructive control environment, in which all employees understand their roles and obligations.
The group audit and risk committee is responsible for monitoring compliance with the group’s risk management policies and procedures, and for reviewing the adequacy of the risk management framework in relation to the risks faced by the group. The group audit and risk committee is assisted in these functions by internal audit. Internal audit undertakes both regular and ad hoc reviews of risk management controls and procedures, the results of which are reported to the audit and risk committee.
The market and credit risk associated with the financial assets held to back investment contract liabilities issued by a group company is borne in its entirety by policyholders. The liquidity risk associated with the company being contractually obligated to repay policyholders on demand, is managed through the investment composition of assets included in the policyholder portfolios and by contract with the policyholders. Such contracts mitigate the liquidity risk faced by the company and passes this on to policyholders in the ordinary course of business and in the event that substantial withdrawals require large scale disinvestment of the assets in these portfolios. The investment composition at 30 September is provided in note 13.
The assets held through limited liability investment partnerships which the group is deemed to control and which are therefore consolidated, are held to back the investors’ interests in these partnerships. The financial assets within these investment partnerships are subject to a variety of financial risks (market and credit risk), all of which are borne by the investors into these partnerships. Fluctuations in the values of these assets directly impact the carrying value of the group’s financial liabilities to the holders of redeemable interests in these partnerships. By virtue of the fact that these investment partnerships are permitted in terms of their investment mandates to use leverage in their investment strategies and the fact that certain companies in the group are the general partner to these partnerships, exposes the group to the residual risk of any shortfall in the net assets of the partnerships – refer note 13. This risk is considered remote and a financial loss to the group would require the limited partners or investors into these partnerships to lose all of the capital they have contributed, together with investment returns earned.
As explained above, the group’s exposure to financial risk arising from the financial assets and liabilities relating to investment partnerships is negligible and these financial instruments are therefore excluded from the analysis presented below.
Credit riskCredit risk is the risk of financial loss to the group if a customer or counterparty to a financial instrument fails to meet its contractual obligations.
Financial assets which are subject to credit risk consist principally of cash and receivables. Management has a credit policy in place and the exposure to credit risk is monitored on an ongoing basis.
Investments are allowed only in liquid securities and only with counterparties that have high credit ratings.
At the reporting date, the majority of cash and cash equivalents were held with one financial institution. The maximum exposure to credit risk is represented by the carrying amount of each financial asset in the statement of financial position.
NOTES TO THE CONSOLIDATED FINANCIAL STATEMENTSFOR THE YEAR ENDED 30 SEPTEMBER 2015 CONTINUED
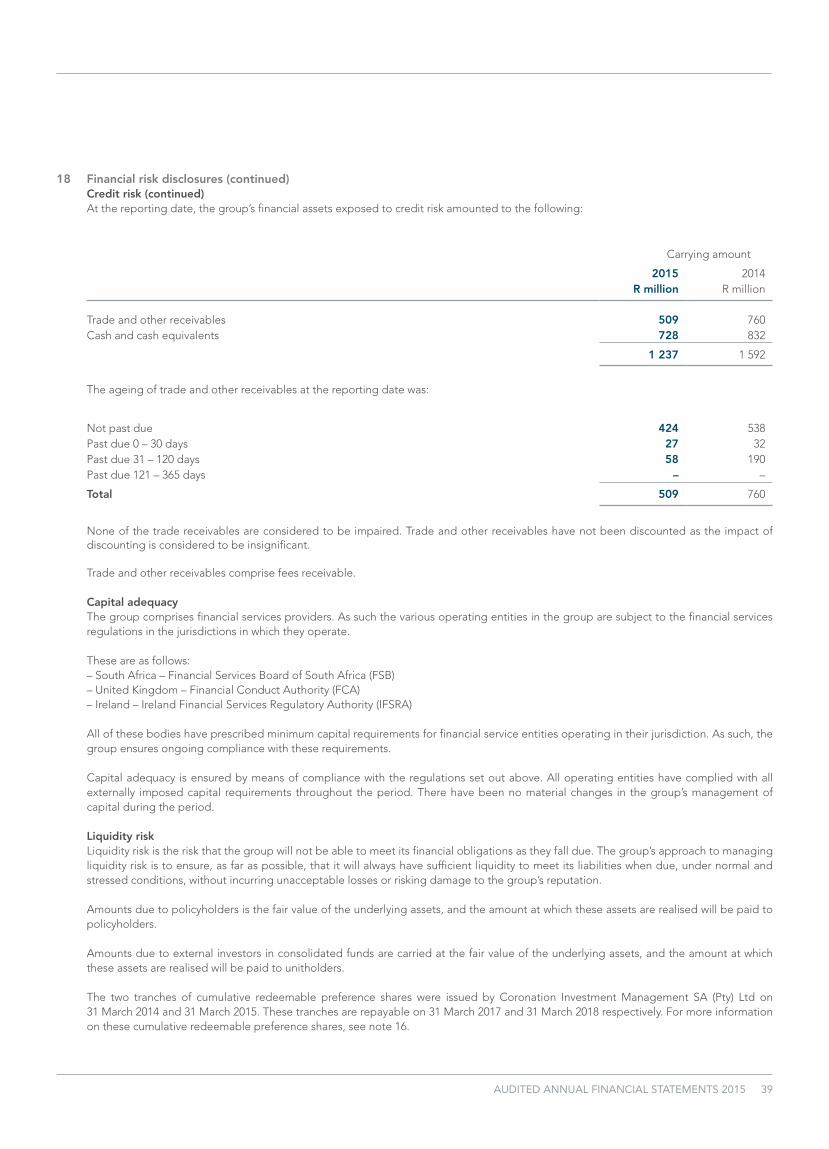
AUDITED ANNUAL FINANCIAL STATEMENTS 2015 39
18 Financial risk disclosures (continued)Credit risk (continued)At the reporting date, the group’s financial assets exposed to credit risk amounted to the following:
Carrying amount
2015 2014
R million R million
Trade and other receivables 509 760 Cash and cash equivalents 728 832
1 237 1 592
The ageing of trade and other receivables at the reporting date was:
Not past due 424 538 Past due 0 – 30 days 27 32 Past due 31 – 120 days 58 190 Past due 121 – 365 days – –
Total 509 760
None of the trade receivables are considered to be impaired. Trade and other receivables have not been discounted as the impact of discounting is considered to be insignificant.
Trade and other receivables comprise fees receivable.
Capital adequacy The group comprises financial services providers. As such the various operating entities in the group are subject to the financial services
regulations in the jurisdictions in which they operate. These are as follows: – South Africa – Financial Services Board of South Africa (FSB) – United Kingdom – Financial Conduct Authority (FCA) – Ireland – Ireland Financial Services Regulatory Authority (IFSRA)
All of these bodies have prescribed minimum capital requirements for financial service entities operating in their jurisdiction. As such, the group ensures ongoing compliance with these requirements.
Capital adequacy is ensured by means of compliance with the regulations set out above. All operating entities have complied with all externally imposed capital requirements throughout the period. There have been no material changes in the group’s management of capital during the period.
Liquidity risk Liquidity risk is the risk that the group will not be able to meet its financial obligations as they fall due. The group’s approach to managing
liquidity risk is to ensure, as far as possible, that it will always have sufficient liquidity to meet its liabilities when due, under normal and stressed conditions, without incurring unacceptable losses or risking damage to the group’s reputation.
Amounts due to policyholders is the fair value of the underlying assets, and the amount at which these assets are realised will be paid to policyholders.
Amounts due to external investors in consolidated funds are carried at the fair value of the underlying assets, and the amount at which these assets are realised will be paid to unitholders.
The two tranches of cumulative redeemable preference shares were issued by Coronation Investment Management SA (Pty) Ltd on 31 March 2014 and 31 March 2015. These tranches are repayable on 31 March 2017 and 31 March 2018 respectively. For more information on these cumulative redeemable preference shares, see note 16.

40 CORONATION FUND MANAGERS
18 Financial risk disclosures (continued) Liquidity risk (continued) The following are the contractual maturities of short-term financial liabilities, including estimated interest payments and excluding the
impact of netting agreements:
6 months 6 – 12R million Carrying Contractual or less months
2015Non-derivative financial liabilities 705 (705) (705) –Trade and other payables
705 (705) (705) –
2014Non-derivative financial liabilitiesTrade and other payables 731 (731) (731) –
731 (731) (731) –
Trade and other payables relate to operating expenses incurred in the ordinary course of business.
Market risk Market risk is the risk that changes in market prices, such as foreign exchange rates, interest rates and equity prices will affect the group’s
income or the value of its holdings of financial instruments. The objective of market risk management is to manage and control market risk exposures within acceptable parameters, while optimising the return on the risk.
The revenues and profit generation of the group are linked to the value of assets under management. Movements in equity markets and interest rates, currency exchange rates and commodity prices that adversely affect the value of assets under management will impact the group’s revenues and reported profits. In the event that performance benchmarks are not met, the group may be exposed to underperformance rebates. The group manages this risk through its structured investment process. The value of assets under management at the reporting date is as follows:
2015 2014R billion R billion
Assets under management
Fair value of assets under management – by geographical regionAfrica 469 461 International 141 127
610 588
The group earned an average revenue margin of 64 basis points (2014: 79 basis points) on assets under management.
NOTES TO THE CONSOLIDATED FINANCIAL STATEMENTSFOR THE YEAR ENDED 30 SEPTEMBER 2015 CONTINUED

AUDITED ANNUAL FINANCIAL STATEMENTS 2015 41
18 Financial risk disclosures (continued) Interest rate risk The following table provides an analysis of the financial assets and liabilities of the group and indicates those categories that are interest
sensitive and their contractual maturities.
Non-1 year interest-
R million Total or less 1 – 5 years bearing
2015 AssetsTrade and other receivables 509 – – 509Cash and cash equivalents 728 728 – –
1 237 728 – 509
LiabilitiesLong-term borrowings 300 – 300 –Trade and other payables 705 – – 705
1 005 – 300 705
2014 AssetsTrade and other receivables 760 – – 760 Cash and cash equivalents 832 832 – –
1 592 832 – 760
LiabilitiesLong-term borrowings 152 – 152 – Trade and other payables 731 – – 731
883 – 152 731
South African cash balances earn interest at a rate of prime minus 4.5% per annum. Foreign cash balances earn negligible interest rates.
Price risk The group is exposed to other price risks in respect of its investments in mutual funds and unit trusts and listed equities and bonds as per
note 15.2 and consequently for external investors in consolidated funds. A reasonable possible change in the price of the investments as per note 15.2 of 10%, with other variables held constant, would result in a 10% gain or loss recognised in profit or loss in the case of financial instruments designated as fair value through profit and loss or other comprehensive income in the case of financial assets designated as available for sale.

42 CORONATION FUND MANAGERS
18 Financial risk disclosures (continued) Foreign currency risk
In respect of other monetary assets and liabilities held in currencies other than the rand, the group ensures that the net exposure is kept to an acceptable level by buying or selling foreign currencies at spot rates where necessary to address short-term imbalances.
The following currency profile analyses the group’s financial assets and liabilities according to the currencies in which they are held at 30 September 2015. The totals are then expressed in the equivalent rand amount (in millions). In addition, the vast majority of the liability for external investors in consolidated funds of R124 million is exposed to USD.
2015Currency ZAR PULA EUR GBP USD Total
Exchange rate 1.000 1.3149 15.5001 20.9764 13.8633
AssetsTrade and other receivables 448 – 3 10 48 509Cash and cash equivalents 521 – 19 31 157 728
969 – 22 41 205 1 237
LiabilitiesLong-term borrowings 300 – – – – 300Trade and other payables 658 – 2 21 24 705
958 – 2 21 24 1 005
2014Currency ZAR PULA EUR GBP USD Total
Exchange rate 1.0000 1.2201 14.2693 18.3155 11.2970
AssetsTrade and other receivables 699 2 7 8 44 760 Cash and cash equivalents 398 14 28 63 329 832
1 097 16 35 71 373 1 592
LiabilitiesLong-term borrowings 152 – – – – 152 Trade and other payables 681 2 – 27 21 731
833 2 – 27 21 883
NOTES TO THE CONSOLIDATED FINANCIAL STATEMENTSFOR THE YEAR ENDED 30 SEPTEMBER 2015 CONTINUED
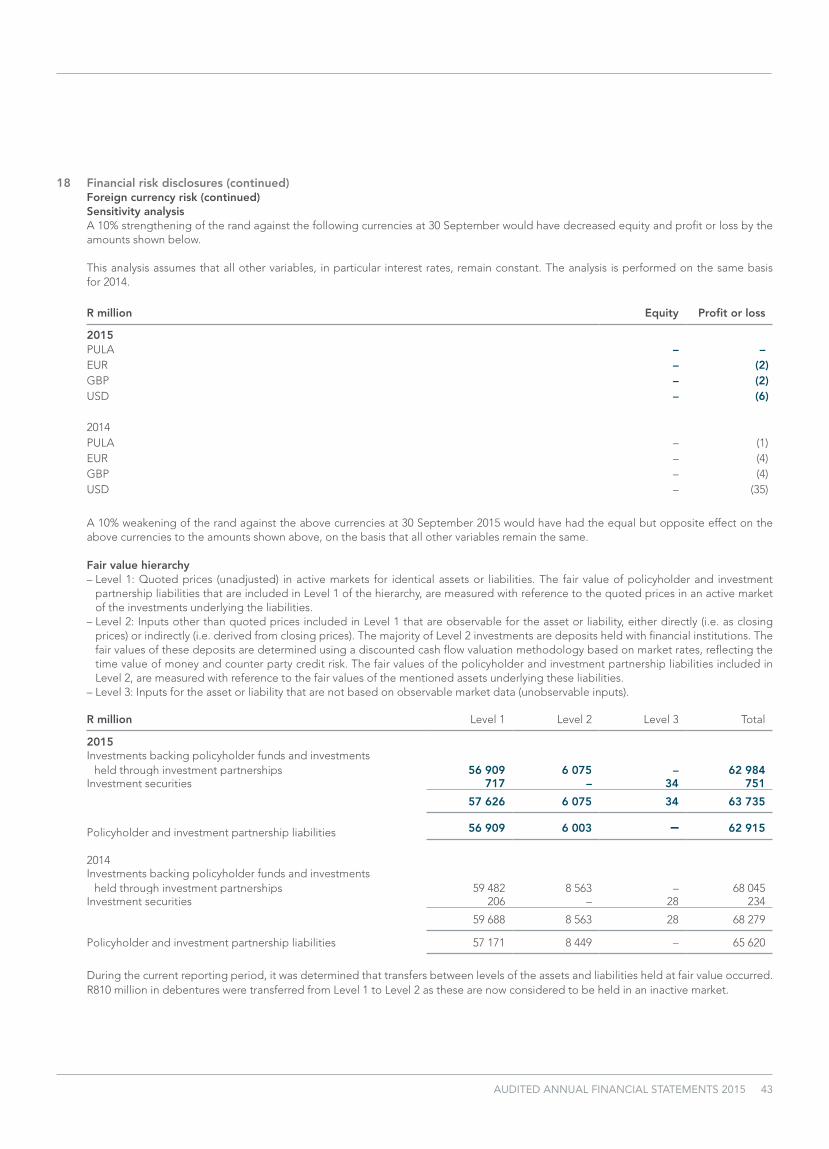
AUDITED ANNUAL FINANCIAL STATEMENTS 2015 43
18 Financial risk disclosures (continued) Foreign currency risk (continued) Sensitivity analysis A 10% strengthening of the rand against the following currencies at 30 September would have decreased equity and profit or loss by the
amounts shown below.
This analysis assumes that all other variables, in particular interest rates, remain constant. The analysis is performed on the same basis for 2014.
R million Equity Profit or loss
2015PULA – –EUR – (2)GBP – (2)USD – (6)
2014PULA – (1)EUR – (4)GBP – (4)USD – (35)
A 10% weakening of the rand against the above currencies at 30 September 2015 would have had the equal but opposite effect on the above currencies to the amounts shown above, on the basis that all other variables remain the same.
Fair value hierarchy – Level 1: Quoted prices (unadjusted) in active markets for identical assets or liabilities. The fair value of policyholder and investment
partnership liabilities that are included in Level 1 of the hierarchy, are measured with reference to the quoted prices in an active market of the investments underlying the liabilities.
– Level 2: Inputs other than quoted prices included in Level 1 that are observable for the asset or liability, either directly (i.e. as closing prices) or indirectly (i.e. derived from closing prices). The majority of Level 2 investments are deposits held with financial institutions. The fair values of these deposits are determined using a discounted cash flow valuation methodology based on market rates, reflecting the time value of money and counter party credit risk. The fair values of the policyholder and investment partnership liabilities included in Level 2, are measured with reference to the fair values of the mentioned assets underlying these liabilities.
– Level 3: Inputs for the asset or liability that are not based on observable market data (unobservable inputs).
R million Level 1 Level 2 Level 3 Total
2015Investments backing policyholder funds and investments
held through investment partnerships 56 909 6 075 – 62 984Investment securities 717 – 34 751
57 626 6 075 34 63 735
Policyholder and investment partnership liabilities 56 909 6 003 – 62 915
2014Investments backing policyholder funds and investments
held through investment partnerships 59 482 8 563 – 68 045 Investment securities 206 – 28 234
59 688 8 563 28 68 279
Policyholder and investment partnership liabilities 57 171 8 449 – 65 620
During the current reporting period, it was determined that transfers between levels of the assets and liabilities held at fair value occurred. R810 million in debentures were transferred from Level 1 to Level 2 as these are now considered to be held in an inactive market.

44 CORONATION FUND MANAGERS
2015 2014R million R million
19 Commitments and contingent liabilitiesOperating lease commitmentsNon-cancellable operating lease rentals are payable as follows:Less than one year 17 14 Between one and five years 74 75 More than five years 112 133
Future sublease payments expected to be received under non-cancellable subleases amount to R2 million as at 30 September 2015.
At 30 September 2015, the group was obligated under a number of operating leases for properties, computer equipment and office equipment for which the future minimum lease payments extend over a number of years. The annual escalation clauses range between 7% and 8% per annum.
GuaranteesCoronation Investment Management SA Proprietary Limited and Coronation Asset Management Proprietary Limited, are the disclosed partners in the Coronation Granite Fixed Income, the Coronation Multi-Strategy Arbitrage, Coronation Presidio and Coronation Enhanced Income Fund Limited Liability partnerships. As the disclosed partners, they are liable to third parties for all the liabilities of the partnership over and above the capital contributions, and future income which accrues to the partners as well as the retained and current profits and assets of the partnerships. The other partners have no further liability for further contributions, or to incur any liability to any third party over and above their contributions. Based on current performance the probability of payment is insignificant.
All portfolio risk inherent within the investment partnerships is managed within the general risk parameters and controls as set out in the Risk Management and Control section of the group’s integrated report.
20 Related parties Identity of related parties The group has related party relationships with its subsidiaries, associates and with its key management personnel.
Transactions with key management personnel Key management personnel is defined as the board of directors, directors of subsidiary companies and senior management of Coronation.
There were no material transactions with key management personnel or their families during the current or previous year other than normal remuneration for employee services and personal investments.
Key management compensation2015 2014
R million R million
Short-term remuneration 224 275 Long-term remuneration 237 325
Total 461 600
Key management compensation excludes fees paid to non-executive directors for services rendered as directors. Fees paid to non-executive directors are disclosed on page 7.
NOTES TO THE CONSOLIDATED FINANCIAL STATEMENTSFOR THE YEAR ENDED 30 SEPTEMBER 2015 CONTINUED

AUDITED ANNUAL FINANCIAL STATEMENTS 2015 45
20 Related parties (continued)Other related party balances at year-endDirectors’ interest in share capital and directors’ emoluments (refer directors’ report)
Loans from related parties (refer note 21)
Share transactions with employees and Coronation Investments and Trading Limited (refer note 6)
2015 2014Deferred bonuses R million R million
Executive directorsAnton Pillay 10 15 John Snalam 4 5
14 20
Directors’ payments include deferred bonuses from prior years that have vested in the current year. The deferred bonuses were invested in a combination of Coronation shares and Coronation unit trusts in previous years. In the current year, directors’ disclosed deferred bonus payments have been enhanced by significant gains that have been achieved in the mark to market of those investments.
21 Principal subsidiaries, associates and unconsolidated structured entitiesThe following represent the subsidiary and associate companies of Coronation:
Indebtedness by/(to)
Company Country of Functional Stated/issued 2015 2014(% of equity capital held) incorporation currency share capital R million R million
Coronation Fund Managers Limited100 Coronation Investment Management SA
Proprietary Limited South Africa ZAR 100 – –100 Coronation Asset Management
Proprietary Limited South Africa ZAR 250 000 1 8100 Coronation Management
Company (RF) Proprietary Limited South Africa ZAR 2 000 000 – –100 Coronation Life Assurance
Company Limited South Africa ZAR 1 800 – –100 CFM (Isle of Man) Limited British Virgin
Islands USD 20 000 – –100 Coronation International Limited United
Kingdom GBP 1 000 002 – –100 Coronation Global Fund Managers
(Ireland) Limited Ireland USD 136 538 – –100 Coronation Investment Services Proprietary
Limited South Africa ZAR 10 – –100 Coronation Investment Management
International Proprietary Limited South Africa ZAR 1 000 – –48 Namibia Asset Management Limited Namibia NAD 2 000 000 – –
46 CORONATION FUND MANAGERS
21 Principal subsidiaries, associates and unconsolidated structured entities (continued)All transactions with related parties occur on an arm’s length basis. All balances are interest-free, unsecured and repayable on demand.
Intercompany loans arise as a result of transactions such as dividend payments and other cash requirements of the various group entities as cash management is conducted on a group basis.
Coronation Life Assurance Company Limited is restricted in its ability to borrow in that borrowings require approval of the Registrar of Insurance, in terms of the South African Long-term Insurance Act, 52 of 1998.
Principal subsidiariesThe group has access to the assets and liabilities of all principal subsidiaries other than policyholder assets and liabilities. Details of policyholder assets and liabilities are included in note 13 and 14.
Structured entitiesA structured entity is an entity in which voting or similar rights are not the dominant factor in deciding control. Structured entities are generally created to achieve a narrow and well-defined objective with restrictions around their ongoing activities.
Depending on the group’s power over the activities of the entity and its exposure to and ability to influence its own returns, it may consolidate the entity. In other cases it may sponsor or have exposure to such an entity but not consolidate it.
Consolidated structured entitiesThe hedge fund partnerships as listed in note 19 are consolidated structured entities within the group. Details regarding the group’s contractual commitments to these partnerships is included in note 19.
The group has no equity interest in the following entities, which are consolidated based on control: – Coronation Granite Fixed Income Fund Partnership – Coronation Multi-Strategy Arbitrage Fund Partnership – Coronation Presidio Fund Partnership – Coronation Enhanced Income Fund Partnership (consolidated from 1 July 2014)
The group also consolidates the Coronation Global Equity Select Fund as well as the Coronation Global Frontiers Fund due to the seed capital invested in these funds relative to the total fund size being significant.
Unconsolidated structured entitiesThe CFM Bonus Pool Trust, the Imvula Trust and the Imvula II Trust are unconsolidated structured entities of the group.
Refer to note 6 for information relating to the Imvula Trust and The Imvula II Trust.
The CFM Bonus Pool Trust (the Trust) is not consolidated as it is a completely separate entity from the group and decisions are made by independent trustees solely for the benefit of beneficiaries (employees). Trustees consider guidance from the Coronation remuneration and nominations committee when making such decisions. The objective of the Trust is to incentivise the employees of the group by acquiring restricted equity instruments (either CFM shares and/or other products that are managed by Coronation) for the benefit of the employees.The group transfers 30% of its profits before tax, after deducting amounts allocated for cash bonuses and restraint of trade payments, to the Trust.
NOTES TO THE CONSOLIDATED FINANCIAL STATEMENTSFOR THE YEAR ENDED 30 SEPTEMBER 2015 CONTINUED
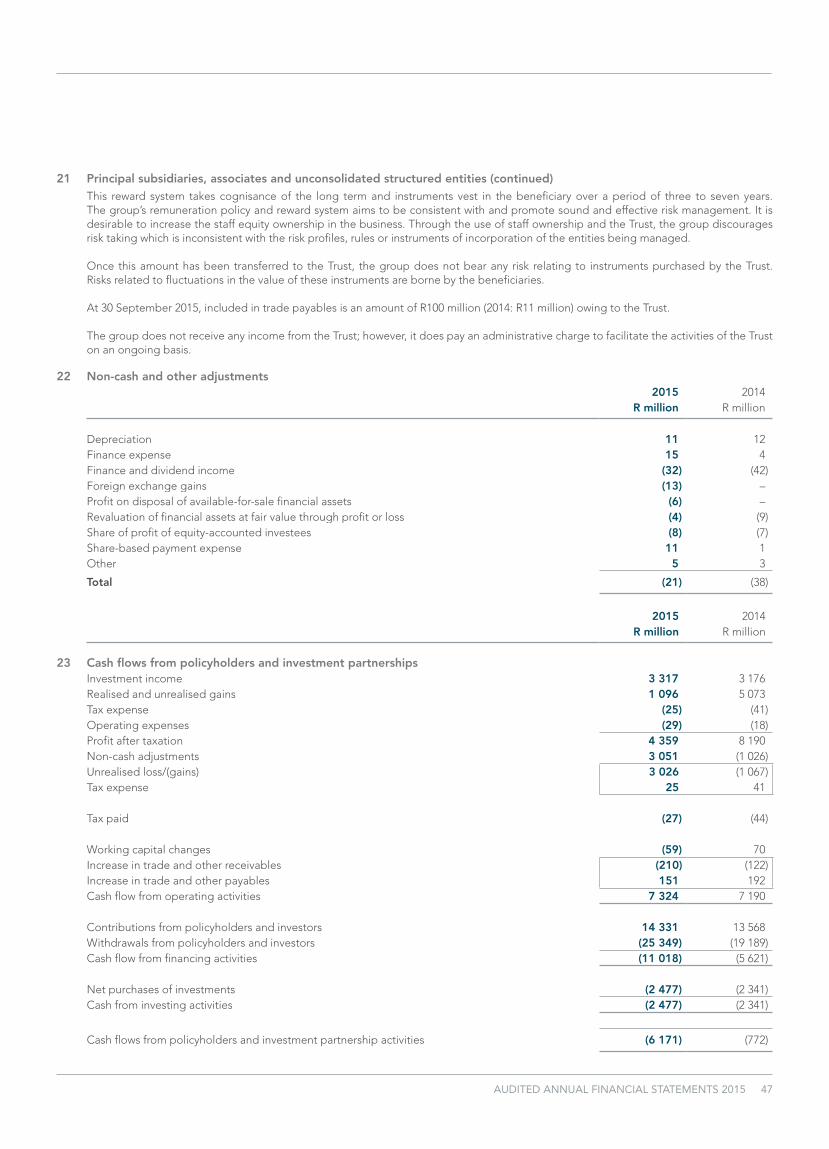
AUDITED ANNUAL FINANCIAL STATEMENTS 2015 47
2015 2014R million R million
23 Cash flows from policyholders and investment partnershipsInvestment income 3 317 3 176 Realised and unrealised gains 1 096 5 073 Tax expense (25) (41)Operating expenses (29) (18)Profit after taxation 4 359 8 190 Non-cash adjustments 3 051 (1 026)Unrealised loss/(gains) 3 026 (1 067)Tax expense 25 41
Tax paid (27) (44)
Working capital changes (59) 70 Increase in trade and other receivables (210) (122)Increase in trade and other payables 151 192 Cash flow from operating activities 7 324 7 190
Contributions from policyholders and investors 14 331 13 568 Withdrawals from policyholders and investors (25 349) (19 189)Cash flow from financing activities (11 018) (5 621)
Net purchases of investments (2 477) (2 341)Cash from investing activities (2 477) (2 341)
Cash flows from policyholders and investment partnership activities (6 171) (772)
21 Principal subsidiaries, associates and unconsolidated structured entities (continued) This reward system takes cognisance of the long term and instruments vest in the beneficiary over a period of three to seven years.
The group’s remuneration policy and reward system aims to be consistent with and promote sound and effective risk management. It is desirable to increase the staff equity ownership in the business. Through the use of staff ownership and the Trust, the group discourages risk taking which is inconsistent with the risk profiles, rules or instruments of incorporation of the entities being managed.
Once this amount has been transferred to the Trust, the group does not bear any risk relating to instruments purchased by the Trust. Risks related to fluctuations in the value of these instruments are borne by the beneficiaries.
At 30 September 2015, included in trade payables is an amount of R100 million (2014: R11 million) owing to the Trust.
The group does not receive any income from the Trust; however, it does pay an administrative charge to facilitate the activities of the Trust on an ongoing basis.
22 Non-cash and other adjustments2015 2014
R million R million
Depreciation 11 12 Finance expense 15 4 Finance and dividend income (32) (42)Foreign exchange gains (13) –Profit on disposal of available-for-sale financial assets (6) – Revaluation of financial assets at fair value through profit or loss (4) (9)Share of profit of equity-accounted investees (8) (7)Share-based payment expense 11 1 Other 5 3
Total (21) (38)
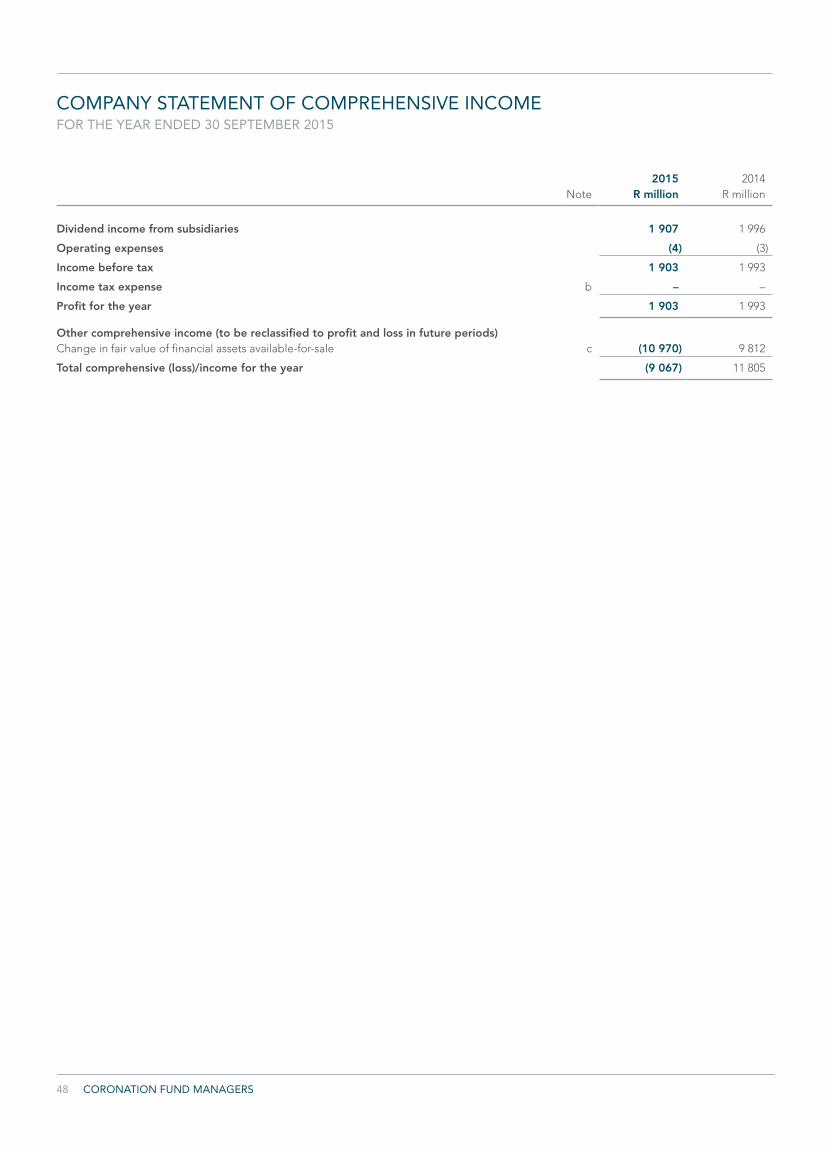
48 CORONATION FUND MANAGERS
COMPANY STATEMENT OF COMPREHENSIVE INCOMEFOR THE YEAR ENDED 30 SEPTEMBER 2015
2015 2014Note R million R million
Dividend income from subsidiaries 1 907 1 996
Operating expenses (4) (3)
Income before tax 1 903 1 993
Income tax expense b – –
Profit for the year 1 903 1 993
Other comprehensive income (to be reclassified to profit and loss in future periods)Change in fair value of financial assets available-for-sale c (10 970) 9 812
Total comprehensive (loss)/income for the year (9 067) 11 805
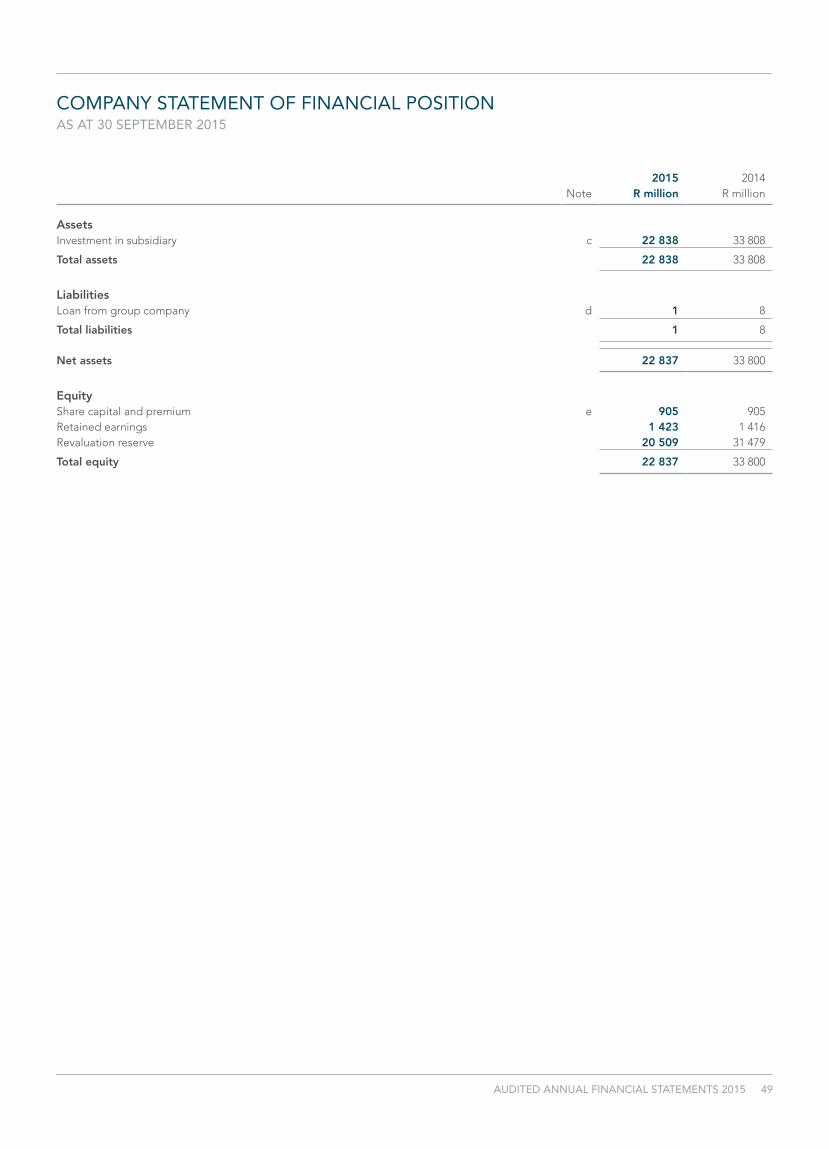
AUDITED ANNUAL FINANCIAL STATEMENTS 2015 49
COMPANY STATEMENT OF FINANCIAL POSITIONAS AT 30 SEPTEMBER 2015
2015 2014Note R million R million
AssetsInvestment in subsidiary c 22 838 33 808
Total assets 22 838 33 808
LiabilitiesLoan from group company d 1 8
Total liabilities 1 8
Net assets 22 837 33 800
EquityShare capital and premium e 905 905 Retained earnings 1 423 1 416 Revaluation reserve 20 509 31 479
Total equity 22 837 33 800

50 CORONATION FUND MANAGERS
COMPANY STATEMENT OF CHANGES IN EQUITY FOR THE YEAR ENDED 30 SEPTEMBER 2015
Share capital Retained Revaluation Totaland premium earnings reserve equity
R million R million R million R million
Balance at 30 September 2013 905 1 270 21 667 23 842
Total comprehensive income for the yearProfit for the year – 1 993 – 1 993
Other comprehensive income (available to be recycled to profit and loss in future periods)Revaluation of financial assets available-for-sale – – 9 812 9 812 Total comprehensive income for the year – 1 993 9 812 11 805
Transactions with owners recorded directly to equityDividends paid – (1 847) – (1 847)Shares issued – – – –
Total transactions with owners – (1 847) – (1 847)
Balance at 30 September 2014 905 1 416 31 479 33 800
Total comprehensive income for the yearProfit for the year – 1 903 – 1 903
Other comprehensive loss (available to be recycled to profit and loss in future periods)Revaluation of financial assets available-for-sale – – (10 970) (10 970)Total comprehensive loss for the year – 1 903 (10 970) (9 067)
Transactions with owners recorded directly to equityDividends paid – (1 896) – (1 896)Shares issued – – – –
Total transactions with owners – (1 896) – (1 896)
Balance at 30 September 2015 905 1 423 20 509 22 837

AUDITED ANNUAL FINANCIAL STATEMENTS 2015 51
COMPANY STATEMENT OF CASH FLOWSFOR THE YEAR ENDED 30 SEPTEMBER 2015
2015 2014R million R million
Cash flows from operating activitiesProfit for the year 1 903 1 993
Non-cash and other adjustments (1 907) (1 996)Dividends received (1 907) (1 996)
Operating loss before changes in working capital (4) (3) Working capital changes (7) (146)Decrease in trade payables and loan from group company (7) (146)
Cash utilised by operations (11) (149)Dividends received 1 907 1 996
Net cash from operating activities 1 896 1 847
Cash flows from investing activities – –
Cash flows from financing activities (1 896) (1 847)Dividends paid (1 896) (1 847)
Net increase/(decrease) in cash and cash equivalents – –Cash and cash equivalents at beginning of year – –
Cash and cash equivalents at end of year – –

52 CORONATION FUND MANAGERS
NOTES TO CORONATION FUND MANAGERS LIMITED COMPANY ACCOUNTS FOR THE YEAR ENDED 30 SEPTEMBER 2015
a Accounting policies Statement of compliance The financial statements are prepared in accordance with International Financial Reporting Standards (IFRS) and its interpretations adopted
by the IASB together with the Companies Act of South Africa.
Basis of preparation The financial statements are presented in South African rand, rounded to the nearest million. They are prepared on the going concern and
historic cost basis except that the following assets and liabilities are stated at fair value: financial assets designated at fair value through profit or loss and financial assets classified as available for sale.
The accounting policies set out on pages 13 to 21 have been applied consistently to all periods presented in these financial statements.
2015 2014R million R million
b Income tax expenseThe standard rate of corporation tax for the year is: 28% 28%Profit before tax 1 903 1 993Tax on profit – –Effective tax rate 0% 0%
The tax charge for the year is different to the standard rate as detailed below:Tax on profit before tax, at SA rate of 28% 533 558Secondary tax on companies – –Non-deductible expenses 1 1 Tax exempt revenues (534) (559)
Total income tax expense for the year – –
2015 2014R million R million
c Investment in group companiesInvestment in subsidiaryBalance at beginning of the year 33 808 23 996 Revaluation adjustment (10 970) 9 812
Balance at the end of the year 22 838 33 808
The fair value of the investment in subsidiary is classified as a level 2 instrument. The investment in subsidiary is valued using the Coronation Fund Managers share price as a proxy.

AUDITED ANNUAL FINANCIAL STATEMENTS 2015 53
NOTES TO CORONATION FUND MANAGERS LIMITED COMPANY ACCOUNTS FOR THE YEAR ENDED 30 SEPTEMBER 2015 CONTINUED
d Loan from group companiesThese loans are unsecured, not subject to interest and payable or repayable on demand. They are Level 2 financial instruments and are carried at amortised cost.
e Share capital The company’s share capital is detailed in note 17 of the group accounts.
f Related parties Details of related parties are disclosed in notes 20 and 21 to the consolidated financial statements.
g Price riskThe company is exposed to price risk through its investment in subsidiary which is carried at fair value. The fair value of the investment in subsidiary is primarily determined by reference to the listed share price of Coronation Fund Managers Limited shares. Movements in the listed price will impact the fair value movements of the investment in subsidiary recorded through other comprehensive income.
A reasonable possible change of 10% (2014: 10%), in the quoted price of Coronation Fund Managers Limited shares, with other variables held constant, could lead to the following increase or decrease in fair values:– R2.3 billion (2014: R3.4 billion) in the fair value of the investment in subsidiary with the corresponding movement in other
comprehensive income
h Events subsequent to the reporting date The unbundling of Coronation Investment Management International Proprietary Limited by Coronation Investment Management SA
Proprietary Limited to Coronation Fund Managers Limited was effective 1 October 2015. The unbundling had no effect on the consolidated financial statements and will have no material effect on the company’s total comprehensive income.

54 CORONATION FUND MANAGERS
ANALYSIS OF SHAREHOLDERSAS AT 30 SEPTEMBER 2015
Number ofNumber of shares
Distribution of shareholders shareholders % ‘000 %
1 – 1 000 shares 8 743 54.86 3 842 1.10 1 001 – 10 000 shares 6 065 38.06 19 696 5.63 10 001 – 100 000 shares 914 5.74 25 931 7.41 100 001 – 1 000 000 shares 173 1.09 60 448 17.28 1 000 001 shares and over 42 0.26 239 882 68.58
15 937 100.00 349 799 100.00
Number ofNumber of shares
Distribution of shareholders shareholders % ‘000 %
Banks 122 0.77 73 548 21.03 Brokers 33 0.21 10 212 2.92 Close corporations 152 0.95 612 0.18 Endowment funds 47 0.30 337 0.10 Individuals 12 183 76.45 30 355 8.67 Insurance companies 66 0.41 4 394 1.26 Investment companies 14 0.09 671 0.19 Medical aid schemes 16 0.10 184 0.05 Mutual funds 235 1.47 41 706 11.92 Nominees and trusts 2 296 14.41 18 346 5.24 Other corporations 84 0.52 454 0.13
Pension funds 194 1.21 48 521 13.87 Private companies 304 1.91 4 975 1.42 Public companies 20 0.13 17 158 4.91 Staff holdings 167 1.04 87 123 24.91 Sovereign wealth funds 4 0.03 11 203 3.20
15 937 100.00 349 799 100.00
Number ofNumber of shares
Public/non-public shareholders shareholders % ‘000 %
Non-public shareholders 167 1.05 87 123 24.91
Directors* 5 0.03 5 614 1.61Shares held by staff 162 1.02 81 509 23.30
Public shareholders 15 770 98.95 262 676 75.09
15 937 100.00 349 799 100.00
* Includes directors of subsidiary companies

AUDITED ANNUAL FINANCIAL STATEMENTS 2015 55
Number ofNumber of shares
Geographical ownership shareholders % ‘000 %
South Africa 15 537 97.49 240 645 68.80 International 400 2.51 109 154 31.20
15 937 100.00 349 799 100.00
Number ofshares
Shareholders with direct or indirect beneficial interest of 5% or more in shares ‘000 %
Government Employees Pension Fund 40 193 11.49 The Imvula Trust 24 902 7.12 Louis Stassen 17 495 5.00

56 CORONATION FUND MANAGERS
GLOSSARY OF FINANCIAL REPORTING TERMS
GROUP STRUCTURES
Company A legal business entity registered in terms of the applicable legislation of that country.
Entity Coronation Fund Managers Limited, a subsidiary or associate.
Equity-accounted investee
An entity, other than a subsidiary or joint venture, in which the group has significant influence over the financial and operating policies.
Group Coronation Fund Managers Limited and its subsidiaries and associate.
Operation A component of the group that:– represents a separate major line of business or geographical area of operation; and– can be distinguished separately for financial and operating purposes.
Subsidiary Any entity over which the group has control.
GENERAL ACCOUNTING TERMS
Acquisition date of a business
The date on which control in respect of subsidiaries and significant influence in respect of associates commences.
Consolidated financial statements
The financial results of the group which comprise the financial results of Coronation Fund Managers Limited and its subsidiaries and its interests in associates.
Control An investor controls an investee when it is exposed, or has rights, to variable returns from its involvement with the investee and has the ability to affect those returns through its power over the investee.
Disposal date The date on which the control in respect of subsidiaries and significant influence in respect of associates ceases.
Fair value The price that would be received to sell an asset or paid to transfer a liability in an orderly transaction between market participants at the measurement date.
Financial results Comprise the financial position (assets, liabilities and equity), financial performance (revenue and expenses) and cash flows of the group or an entity within the group.
Functional currency The currency of the primary economic environment in which the entity operates.
Long term A period longer than twelve months from reporting date.
Other comprehensive income
Comprises items of income and expenses (including reclassification adjustments) that are not recognised in profit or loss as required or permitted by other IFRSs.
Presentation currency The currency in which the financial statements are presented.
Reclassification Amounts reclassified to profit or loss in the current period that were recognised in other comprehensive income in the current or previous period.
Recoverable amount The amount that reflects the greater of the fair value less costs to sell and value in use that can be attributed to a non-financial asset as a result of its ongoing use by the entity. In determining the value in use, expected pre-tax future cash flows are discounted to their present values using the appropriate discount rate.

AUDITED ANNUAL FINANCIAL STATEMENTS 2015 57
Related parties The following entities or parties are considered related parties to the reporting entity:– a subsidiary, fellow subsidiary, associate, jointly controlled entity or an entity having joint control in relation to the
reporting entity; – key management personnel and their close members of family and entities which they control, jointly control or over
which they exercise significant influence; and– post-employment benefit plan for the benefit of employees of the entity or any related party.
Significant influence The power to participate in the financial and operating policy decisions of the investee but is not control or joint control of those policies.
FINANCIAL INSTRUMENT TERMS
Available-for-sale financial assets
A non-derivative financial asset that is designated as available-for-sale or is not classified as: – a loan or receivable;– a held-to-maturity investment; or– a financial asset at fair value through profit or loss.
Cash and cash equivalents
Cash and cash equivalents comprise cash balances and call deposits. Bank overdrafts that are repayable on demand and form an integral part of the group’s cash management are included as a component of cash and cash equivalents for the purpose of the statement of cash flows.
Derivative instrument A financial instrument:– whose value changes in response to movements in a specified interest rate, commodity price, instrument price,
foreign exchange rate or similar variable, provided in the case of a non-financial variable that the variable is not specific to a party of the contract;
– that requires minimal initial net investment; and– is settled at a future date.
Effective interest rate The rate that discounts the expected future cash flows to the net carrying amount of the financial asset or financial liability.
Equity instrument Any financial instrument (including investments) that evidences a residual interest in the assets of an enterprise after deducting all of its liabilities.
Financial asset Cash or cash equivalents, a right to receive cash or cash equivalents, an equity instrument of another entity, a right to exchange a financial instrument under favourable conditions.
Financial guarantee contract
A contract that requires the issuer to make specified payments to reimburse the holder for the loss it incurs, because a specified debtor fails to make payment when due in accordance with the original or modified terms of the debt instrument.
Financial liability A contractual obligation to pay cash or transfer other benefits or an obligation to exchange a financial instrument under unfavourable conditions.
Financial instruments classified as held for trading
Derivatives or instruments that are held principally with the intention of short-term disposal.

58 CORONATION FUND MANAGERS
Financial assets and liabilities at fair value through profit or loss
Financial instruments held at fair value through profit or loss include all instruments classified as held for trading and those instruments designated as held at fair value through profit or loss on initial recognition.
Financial instruments issued by the group classified as financial liabilities
Financial instruments issued by the group are classified as liabilities if they contain a contractual obligation to transfer cash or another financial asset or to exchange financial assets or liabilities under potentially unfavourable conditions.
Financial instruments issued by the group classified as equity
Financial instruments issued by the group are classified as equity where they confer on the holder a residual interest in the net assets of the group.
Held-to-maturity investments
Non-derivative financial assets, with a fixed maturity and fixed or determinable future payments, that the entity has the positive intent and ability to hold to maturity, other than those designated upon initial recognition as at fair value through profit or loss, those designated as available-for-sale and those that meet the definition of loans and receivables.
Loans and receivables Loans and receivables are non-derivative financial assets with fixed or determinable payments that are not quoted in an active market and exclude:– those that the group intends to trade in, which are classified as held for trading, and those that the group designates
as at fair value through profit or loss;– those that the group designates as available-for-sale; and – those for which the holder may not recover substantially all of its initial investment, other than because of credit
deterioration, which are classified as available-for-sale.
Monetary asset Units of currency held or an asset which will be received in a fixed or determinable amount of money.
Monetary liability A liability which will be settled in a fixed or easily determinable amount of money.
Structured entity An entity that has been designed so that voting or similar rights are not the dominant factor in deciding who controls the entity, such as when any voting rights relate to administrative tasks only and the relevant activities are directed by means of contractual arrangement.
Transaction date The date when the entity becomes a party to the contractual provisions of an instrument.
GLOSSARY OF FINANCIAL REPORTING TERMS CONTINUED

AUDITED ANNUAL FINANCIAL STATEMENTS 2015 59
SHAREHOLDERS’ DIARY AND CORPORATE INFORMATION
Annual general meeting Tuesday, 12 January 2016 at 10:00
Share code (ordinary shares): CML ISIN number: ZAE000047353
BOARD OF DIRECTORSShams Pather (independent non-executive chairman)Anton Pillay (chief executive officer) John Snalam (chief financial officer) Lulama Boyce Appointed 7 October 2014Judith February Jock McKenzieAlexandra Watson
TRANSFER SECRETARIESComputershare Investor Services Proprietary Limited70 Marshall StreetJohannesburg 2001
POSTAL ADDRESSPO Box 61051Marshalltown 2107
COMPANY SECRETARYLee-Anne Parenzee
REGISTERED OFFICE7th Floor, MontClare PlaceCnr Campground and Main RoadsClaremont 7708Cape Town POSTAL ADDRESSPO Box 44684Claremont 7735Cape Town
AUDITORSErnst & Young Inc.35 Lower Long StreetCape Town 8001

CAPE TOWN 7th Floor, MontClare Place, Cnr Campground and Main Roads, Claremont 7708 PO Box 44684, Claremont 7735 Telephone: +27 (0)21 680 2000 Fax: +27 (0)21 680 2100
JOHANNESBURG 1st Floor, Unit 7B, 3 Melrose Boulevard, Melrose Arch 2196 PO Box 652643, Benmore 2010 Telephone: +27 (0)11 328 8200 Fax: +27 (0)11 684 2187
PRETORIA 1st Floor, Block 4, The Boardwalk Office Park, Eros Street, Faerie Glen 0043 Postnet Suite 502, Private Bag X18, Lynnwood Ridge 0040 Telephone: +27 (0)12 990 9040 Fax: +27 (0)12 991 6079
DURBAN Suite 6, 15 The Boulevard, Westway Office Park, Westville 3635 Telephone: +27 (0)87 354 0508
LONDON 7th Floor, St Albans House, 57–59 Haymarket, London, SW1Y 4QX United Kingdom Telephone: +44 (0)207 389 8840 Fax: +44 (0)207 389 8899
DUBLIN 11 Central Hotel Chambers, Dame Court, Dublin 2, Ireland Telephone: +353 (0)1 674 5410 Fax: +353 (0)1 674 5411