Audit of the Public Buildings Service’s Effectiveness in ...
33
A190066/P/2/R21009 Audit of the Public Buildings Service’s Effectiveness in Managing Deferred Maintenance Report Number A190066/P/2/R21009 September 30, 2021 Office of Audits Office of Inspector General U.S. General Services Administration
Transcript of Audit of the Public Buildings Service’s Effectiveness in ...
A190066/P/2/R21009
Audit of the Public Buildings Service’s Effectiveness in Managing Deferred Maintenance
Report Number A190066/P/2/R21009 September 30, 2021
Office of Audits Office of Inspector General U.S. General Services Administration

A190066/P/2/R21009 i
Executive Summary Audit of the Public Buildings Service’s Effectiveness in Managing Deferred Maintenance Report Number A190066/P/2/R21009 September 30, 2021 Why We Performed This Audit GSA’s Public Buildings Service (PBS) acts as a caretaker for more than 8,800 federally owned or leased properties across the country and approximately 369 million square feet of rentable space, providing facility and workspace solutions to more than 50 federal agencies.1 In Fiscal Year 2019, PBS’s portfolio included over 1,600 federally owned assets with approximately 180 million square feet of rentable space. In its 2019 Agency Financial Report, GSA reported a total estimated cost of deferred maintenance and repairs (deferred maintenance) for its building inventory of approximately $1.93 billion. This was a 32 percent increase over its Fiscal Year 2018 backlog and a 57 percent increase over the previous 5 fiscal years’ backlog. Deferred maintenance is defined as maintenance and repairs that were not performed when scheduled or delayed for a future period. These are activities categorized as work needing to be performed immediately to restore or maintain the building inventory in an acceptable condition. This audit was included in our Fiscal Year 2018 Audit Plan. Our objectives were to determine whether PBS: (1) accurately reports deferred maintenance estimates for its building inventory in GSA’s fiscal year Agency Financial Report and (2) has information systems in place to accurately plan and track the remediation of immediate building liabilities from year to year. What We Found We found that the accuracy of GSA’s reported deferred maintenance cost estimate is affected by data shortcomings and errors, including over $280 million in duplicative costs applied to the reported deferred maintenance cost estimate for Fiscal Year 2019. We also found that while PBS has a national maintenance strategy associated with its Capital Program, this strategy has not been effective to reduce its deferred maintenance backlog. As a result, PBS is vulnerable to rising maintenance and repair costs and an increased risk of building system failure, accelerated deterioration of systems and structures, and potential life safety hazards.
1 GSA 2019 Agency Financial Report, signed November 13, 2019.

A190066/P/2/R21009 ii
What We Recommend We recommend that the PBS Commissioner develop a comprehensive plan to ensure that PBS:
1. Establishes a national policy and training program that provides personnel with guidance on how to conduct building surveys, accurately enter results into the Building Assessment Tool system, and account for interim remediation of building liabilities.
2. Updates the Building Assessment Tool pricing module to generate estimates more closely aligned to external and regional cost estimates.
3. Corrects the duplicate entries identified above and reviews its deferred maintenance
reports to identify and correct any additional errors.
4. Improves its national maintenance strategy to place greater emphasis on its growing list of immediate liabilities by prioritizing projects to reduce them.
The PBS Commissioner agreed with Recommendations 1–3 and partially agreed with Recommendation 4. PBS also provided technical comments to Findings 1 and 2. PBS’s response can be found in its entirety in Appendix D.

A190066/P/2/R21009 iii
Table of Contents Introduction ....................................................................................................................... 1
Results
Finding 1 – The accuracy of GSA’s reported deferred maintenance cost estimate is affected by data shortcomings and errors, including over $280 million in duplicative costs. .................................................................................................. 7
Finding 2 – PBS’s national maintenance strategy has not been effective to reduce its deferred maintenance backlog. ......................................................................... 12
Conclusion ........................................................................................................................ 16
Recommendations .................................................................................................................. 16
GSA Comments ........................................................................................................................ 16
Appendixes
Appendix A – Scope and Methodology ........................................................................... A-1
Appendix B – Sample of Deferred Immediate Liabilities ................................................. B-1
Appendix C – Examples of Increasing Cost Estimates for Deferred Immediate Liabilities .................................................................................................. C-1
Appendix D – GSA Comments ......................................................................................... D-1
Appendix E – Report Distribution .................................................................................... E-1
A190066/P/2/R21009 1
Introduction We performed an audit of the GSA Public Buildings Service’s (PBS’s) effectiveness in managing deferred maintenance and repair (deferred maintenance) of an aging real property inventory. Purpose This audit was included in our Fiscal Year 2018 Audit Plan. Our audit focused on how effectively PBS is reporting and managing the deferred maintenance of its real property inventory. Objectives Our objectives were to determine whether PBS: (1) accurately reports deferred maintenance estimates for its building inventory in GSA’s fiscal year Agency Financial Report (AFR) and (2) has information systems in place to accurately plan and track the remediation of immediate building liabilities from year to year. See Appendix A – Scope and Methodology for additional details. Background PBS manages more than 8,800 federally owned or leased properties across the country, providing facility and workspace solutions to more than 50 federal agencies. In Fiscal Year (FY) 2019, PBS’s portfolio included over 1,600 federally owned assets with approximately 180 million square feet of rentable space. The average age of GSA buildings is 49 years old.2 PBS’s management of building operations includes overseeing the maintenance and repair of federally owned facilities. Maintenance and repair activities are considered to be deferred when they are not performed when scheduled or are delayed to a future period.3 PBS is required under federal accounting standards to publicly report a realistic estimate of all costs of deferred maintenance related to its building inventory. The deferred maintenance costs include preventive maintenance; replacement of parts, systems, or components; and other activities needed to be performed immediately to preserve, restore, or maintain a real property asset in an acceptable condition.
2 GSA 2019 Agency Financial Report, signed November 13, 2019. 3 Statement of Federal Financial Accounting Standards 42: Deferred Maintenance and Repairs: Amending Statements of Federal Financial Accounting Standards 6, 14, 29 and 32, issued April 25, 2012.

A190066/P/2/R21009 2
PBS’s Building Assessment Tool PBS’s Building Assessment Tool Survey Execution Guidance document states that GSA requires a building assessment survey for all active or excess government-owned, leased, or delegated real property assets for which GSA has repair and alteration responsibility. PBS’s Building Assessment Tool (BAT) is a web-based module within PBS’s Inventory Reporting Information System (IRIS) that is comprised of a 38-question facility condition survey designed to assess the condition of a building’s structure and major system components. PBS personnel must complete an updated survey for each building at least every 2 years. Based on the survey responses and system entries, the BAT develops a cost estimate to repair or replace any identified building deficiencies. When other estimates are available, PBS staff can manually input their own cost estimates rather than relying on BAT-generated cost estimates. This data plays an important role in PBS’s assessment of its inventory needs and development of its investment, asset management, external reporting, and disposal decisions. PBS’s regional teams use the BAT database to make budgetary decisions, track the condition of their building inventory, and develop an overall investment strategy to address building deficiencies. On a national level, PBS management uses the cost information it compiles in the BAT database as its source for reporting deferred maintenance in GSA’s fiscal year AFR. Specifically, GSA reports deferred maintenance as the total estimated costs for all of its immediate building liabilities each year. In order to estimate the total costs of deferred maintenance, PBS’s regional teams assess and assign a priority level to each building liability identified and reported in a BAT building survey. The teams consider the estimated useful life cycle, age of components, recent performance history of operable systems, frequency and length of equipment downtime, and other relevant indicators in assigning priority levels to building liabilities. Figure 1 below presents the BAT priority levels PBS uses to indicate when a building liability should be addressed.
Figure 1 – BAT Building Liability Priority Levels
Priority Level Description
Immediate
The issue is critical and requires immediate investment to restore the system to normal operation, stop accelerated deterioration, or correct a life safety hazard. If the issue is not restored immediately, it is considered deferred for the purpose of deferred maintenance reporting in GSA’s fiscal year AFR.
Within 1–2 Years The issue is anticipated to be critical within the next 2 fiscal years, but does not represent an immediate funding priority.
Within the Next 3–5 Years
The issue is anticipated to become critical within 3–5 years. An investment need is evident, but it has not caused any downtime or posed a life safety hazard.
Within the Next 6 or More Years
Systems need to be repaired or replaced at some point in the future, but it is not deemed a problem at the time of survey completion.

A190066/P/2/R21009 3
Annual Deferred Maintenance Reporting As noted in Figure 1, if an immediate priority building liability is not restored immediately, it is considered deferred for the purpose of deferred maintenance reporting in GSA’s fiscal year AFR. In its 2019 AFR, GSA reported:
At the end of FYs 2019 and 2018, based on the analysis of the BAT results, GSA estimates the total cost of [deferred maintenance] to be approximately $1.93 billion and $1.455 billion respectively, for activities categorized as work needing to be performed immediately to restore or maintain acceptable condition [sic] of the building inventory.
As shown in Figure 2 below, GSA’s reported deferred maintenance rose from $1.23 billion in FY 2014 to $1.93 billion in FY 2019—an increase of 57 percent.
Figure 2 – GSA’s Reported Deferred Maintenance (in billions of U.S. dollars)
Budget Activities to Fund Projects that Repair Reported Liabilities In accordance with 40 U.S.C. 592, PBS funds its repair needs and all of its real property activities through the Federal Buildings Fund (FBF). The FBF operates as a revolving fund, whereby building operation expenditures are financed through fund deposits; however, unlike typical revolving funds, it is subject to annual enactment of new obligational authority by Congress. As part of the annual appropriations process, Congress authorizes FBF funding for GSA’s operations and repair and alterations functions.

A190066/P/2/R21009 4
GSA is authorized to use three different budget activities to draw funds from the FBF for projects to address identified building liabilities (see Figure 3 below).
Figure 3 – GSA’s Budget Activities
Budget Activity (BA) Uses Threshold 61 Day-to-Day Building Operations Below $25,000 54 Minor Repairs and Alterations $25,000–$3,095,000 55 Major Repairs and Alterations Above $3,095,000
As illustrated in Figure 4 below, since FY 2015, GSA has received approximately 62.46 percent of its requests for new obligational authority under BA54 and BA55, on average.
Figure 4 – GSA’s BA54 and BA55 Requests: FY 2015 through FY 2020
Fiscal Year Requested Authorized Difference % Funded A B C=A-B D=(B/A)x100
2015 $1,256,738,000 $818,160,000 $438,578,000 65.10% 2016 $1,247,067,000 $735,331,000 $511,736,000 58.96% 2017 $841,617,000 $676,035,000 $165,582,000 80.33% 2018 $1,444,494,000 $666,335,000 $778,159,000 46.13% 2019 $909,746,000 $673,970,000 $235,776,000 74.08% 2020 $1,662,410,000 $833,752,000 $828,658,000 50.15%
Total: $7,362,072,000 $4,403,583,000 $2,958,489,000 59.81% Average: 62.46%
In recent years, GSA has expressed concern over the gap between requested and authorized spending levels. For example, in its Fiscal Year 2020 Congressional Justification, GSA noted:
Full funding of the FBF is integral to sound portfolio management. Anything less means the agency will be unable to fund necessary repairs and improvements to the GSA inventory, which reduces the value of the public’s assets over time, results in unnecessary costs due to repairs, and missed opportunities to improve efficiency through the consolidations of space.
PBS’s Process to Identify and Remediate Building Liabilities PBS uses a variety of information systems to identify and address the liabilities in its aging building inventory. The BAT system is the first system in the remediation process, as PBS surveyors physically inspect the entire building inventory every 2 years to identify existing liabilities and complete a BAT survey. The BAT surveys provide a snapshot in time; every time a BAT survey is completed, the building’s liabilities are re-assessed and re-prioritized. The building deficiency information in the BAT is shared with IRIS. IRIS is an application that GSA uses to manage estimated repair and alteration costs for building projects and new

A190066/P/2/R21009 5
construction, capture and feed key data elements to downstream financial systems, and track the status of safety and risk deficiencies identified during survey inspections. IRIS generates an accounting system identification (ASID) number for each project, which acts as a project identifier throughout PBS’s other information systems, including Pegasys, Asset Business Plan (ABP), Electronic Project Management (ePM), and Capital Projects Application (CPA). Figure 5 below presents the information technology systems that are included in this process and the information flow between them.
Figure 5 – Information Technology Systems to Identify and Track Liabilities
System General Process Role Inter-System Information Flow Building Assessment Tool (BAT)
Records building liabilities that are later used for developing multi-year plans for repair and alteration projects.
Building liability information flows to IRIS and ABP.
Inventory Reporting Information System (IRIS)
Manages estimated repair and alteration costs for building projects and new construction, tracks the status of safety and risk deficiencies identified during survey inspections, and generates an ASID number.
Liabilities from BAT flow into a “parking lot” comprised of potential projects in IRIS. However, projects are not based exclusively on these liabilities.
Pegasys GSA’s financial system IRIS project ASIDs flow to Pegasys.
Asset Business Plan (ABP) A comprehensive depository of information about each of PBS’s assets. It provides relevant/current asset information to asset business teams, regional and national PBS managers, the U.S. Government Accountability Office, the Office of Management and Budget, and tenant agencies.
Building and project information from BAT and IRIS is summarized in ABP. IRIS project ASIDs flow to ABP.
Decision Lens Used to rank the priority of potential projects for congressional funding requests.
N/A
Capital Projects Application (CPA)
Maintains and provides project-related financial data concerning BA51 (Construction and Acquisition), BA55 (Major Repairs and Alterations), and BA64 (Historic Preservation Projects).
IRIS project ASIDs and project completion plan dates flow to CPA.
Electronic Project Management (ePM)
Manages BA54 (Minor Repairs and Alterations) and BA55 projects once they are approved.
IRIS project ASIDs flow to ePM.

A190066/P/2/R21009 6
Each year, PBS regional teams submit an annual priority spreadsheet listing of all identified building liabilities and related projects to PBS Central Office. Central Office compares the submitted liabilities to the ABP to confirm project requests. Central Office prioritizes these requests using a software solution called Decision Lens. Central Office uses the results to compile a 5-year Capital Investment Plan that assists GSA in developing its annual fiscal year repair and alteration funding request to Congress. Appropriated BA54 and BA61 funds are disbursed to the PBS regions for use; any projects funded with this money do not require further congressional approval. GSA also submits a prospectus for each prioritized project estimated to be above $3.095 million for separate congressional review and approval. Those projects are funded through BA55. Once Congress has appropriated funds to GSA, PBS manages the projects it selected to fund in the ePM system. Additionally, funded prospectus-level projects are entered into the CPA. The CPA identifies funding sources and the distribution of funds, allowing Central Office to manage how and when funds are used. While the BAT is used by Central Office to identify and assess total building liabilities and estimate the associated remediation costs, the process for initiating projects to repair or replace those liabilities is not solely tied to the BAT surveys. Individual building liabilities are often grouped into larger projects or building modernization plans. Additionally, the deferred maintenance estimate reported in GSA’s fiscal year AFR is not necessarily representative of the project’s actual remediation costs. It is simply an estimate for the activities categorized as work needing to be performed immediately to restore or maintain an acceptable condition of the building inventory. Actual project remediation costs often address various immediate issues and other building liabilities, whereby some of the reported immediate building liabilities may remain deferred.

A190066/P/2/R21009 7
Results We found that the accuracy of GSA’s reported deferred maintenance cost estimate is affected by data shortcomings and errors, including over $280 million in duplicative costs applied to the reported deferred maintenance cost estimate for FY 2019. We also found that while PBS has a national maintenance strategy associated with its Capital Program, this strategy has not been effective to reduce its deferred maintenance backlog. As a result, PBS is vulnerable to rising maintenance and repair costs and an increased risk of building system failure, accelerated deterioration of systems and structures, and potential life safety hazards. Finding 1 – The accuracy of GSA’s reported deferred maintenance cost estimate is affected by data shortcomings and errors, including over $280 million in duplicative costs. Under federal accounting standards, GSA is required to publicly report a realistic estimate of all costs of deferred maintenance related to its building inventory. In its FY 2019 AFR, GSA reported $1.93 billion in estimated deferred maintenance for its buildings. This was a 57 percent increase over GSA’s reported deferred maintenance estimate of $1.23 billion in FY 2014. However, the accuracy of GSA’s reported deferred maintenance cost estimate is affected by shortcomings and errors in the data used as the basis for the reports. We found that the BAT-generated estimates used as the basis for reporting the deferred maintenance costs may not accurately represent the cost of deferred maintenance projects. We also found that GSA’s reported deferred maintenance costs for FY 2019 erroneously included costs for maintenance and repair projects that were already completed as well as duplicative cost estimates of over $280 million. GSA’s Deferred Maintenance Reporting is Based on Estimates That May Not Accurately Represent the Cost of Deferred Maintenance Projects In FY 2019, GSA reported $1.93 billion in estimated deferred maintenance for its buildings. GSA’s estimate is based on cost estimates in the BAT system. The BAT system is used to record building deficiencies and repair needs that have been identified by building surveys. These surveys are conducted every 2 years for each building in PBS’s owned inventory. After the building deficiencies are recorded, the BAT system develops cost estimates to repair the deficiencies. PBS personnel can also manually input a cost estimate when other estimates are available. However, in discussions with PBS regional staff, we were told that they do not consider the BAT-generated estimates accurate or reliable. They commonly described the BAT-generated liability cost estimates as overly broad, outdated, unrealistic, and inaccurate. As a result, PBS regional staff told us that they generally do not use them when establishing the estimated cost

A190066/P/2/R21009 8
to repair building liabilities. Instead, they favor estimates prepared by outside engineering firms or PBS’s internal estimators to obtain more precise repair project pricing. We compared a sample of 10 BAT system cost estimates to other external estimates, such as cost estimation workbooks, prospectus proposals, and feasibility studies. The comparison showed significant differences between the BAT cost estimate and the external estimates, with variances ranging from negative 87 percent to positive 32 percent. Figure 6 below presents a summary of our comparisons.
Figure 6 – Comparison of BAT Liability Cost Estimates to External Estimates
Building Name BAT Section BAT Estimate External Estimate
Actual Variance $
Actual Variance %
Absolute Value Variance %4
A B C=A-B D=C/B E=D as a positive number
John F. Kennedy Federal Building Elevators $11,979,099 $23,544,650 -$11,565,551 -49% 49%
John F. Kennedy Federal Building
Chillers, Condensing Units, and Packaged Cooling Equipment
$6,688,210 $51,258,241 -$44,570,031 -87% 87%
IRS Service Center Holtsville, NY Site Civil (Paved Areas) $13,978,148 $14,000,000 -$21,852 -0.16% 0.16%
Metcalfe Federal Building Elevators $10,470,483 $16,482,124 -$6,011,641 -36% 36%
Metcalfe Federal Building Cooling Towers $3,251,160 $2,460,677 $790,483 32% 32%
John F. Seiberling Federal Building Basement Walls $21,346,220 $20,086,000 $1,260,220 6% 6%
Milwaukee Federal Building Exterior Walls $29,074,924 $26,151,000 $2,923,924 11% 11%
Charles Evans Whittaker Courthouse Exterior Walls $55,167,968 $57,029,740 -$1,861,772 -3% 3%
Washington National Records Center Air Handling Units $11,139,305 $39,264,000 -$28,124,695 -72% 72%
Washington National Records Center Electrical (Switchgear) $8,800,027 $14,659,689 -$5,859,662 -40% 40%
Average: -$9,304,058 -24% 34%
According to PBS regional personnel, the BAT-generated cost estimates do not take into account all of the critical cost factors necessary to provide an accurate estimate. The BAT system uses RSMeans data to calculate the estimated cost to repair building deficiencies.5
4 The absolute value shows the estimate variance as a positive number, regardless of whether it was over or understated. 5 RSMeans data is a commercial reference database of more than 92,000 line items of detailed construction costs.

A190066/P/2/R21009 9
While the RSMeans data are adjusted for basic building and space usage type, security levels, and historic status, the BAT-generated estimate does not take into account all pertinent information for a specific building. For example, the BAT-generated estimate does not factor in multiple building systems that are designed to operate together, including air handlers; exhaust fans; and heating, ventilation, and air conditioning systems. Additionally, the BAT-generated estimate does not account for specific building conditions that can impact repair costs, such as removal of asbestos or other hazardous materials prior to repair. As a result, the BAT system may not provide an accurate estimate. GSA’s Reported Deferred Maintenance Costs for FY 2019 Erroneously Included Costs for Completed Maintenance and Repair Projects and Duplicative Cost Estimates GSA’s reported deferred maintenance costs for FY 2019 erroneously included costs for completed maintenance and repair projects, as well as duplicative cost estimates totaling over $280 million. We found that GSA’s reported deferred maintenance estimate for FY 2019 included the costs for repairs that had already been completed—in some cases years ago. When a BAT building survey is conducted, the results from the prior survey, if one had been performed, pre-populate the survey and must be updated to reflect any changes. However, we found that PBS personnel did not always update the BAT building surveys to reflect completed maintenance and repair projects, resulting in overstated deferred maintenance costs. We identified two examples where PBS continued to report immediate liabilities after they were remediated through completed maintenance and repair projects.
• Daniel P. Moynihan U.S. Courthouse, New York, New York – This building had an immediate liability for two aging air chillers, costing $2.4 million, listed on its 2019 BAT survey. However, the building manager told us these chillers were replaced in 2017, and they should have been removed during the 2019 survey of this building.
• Herbert C. Hoover Federal Building, Washington, D.C. – This building had an immediate liability for air handling units, costing $28.7 million, listed on its 2019 BAT survey. A number of these units were replaced during phases 1 through 4 of a building modernization project, with the most recent replacement occurring in 2014. However, these replacements were not reflected in the succeeding building surveys. The project manager told us that it was too difficult to ascertain the value of the replaced air handling units. This particular immediate liability has been listed on BAT surveys for the building since 2009, and the cost estimates have increased by approximately 192 percent.

A190066/P/2/R21009 10
Further, we found that GSA’s reported deferred maintenance estimate for FY 2019 included duplicative estimates for two buildings, resulting in over $288 million in overstated costs reported for FY 2019. In both cases, as discussed below, projects were being developed to address multiple issues identified in the building surveys recorded in the BAT system. PBS regional personnel entered the overall estimated cost for the projects for each building survey line item. As a result, the estimated total project cost was duplicated multiple times, overstating the total deferred maintenance costs for the buildings.
• Jacob K. Javits Federal Building, New York, New York – As shown in Figure 7 below, three projects were being developed for the Jacob K. Javits Federal Building. PBS regional personnel entered the total project cost estimates into multiple sections of the BAT building survey as observed issues. As a result, the total project costs were duplicated multiple times, overstating the deferred maintenance for the building.
Figure 7 – Duplicate Immediate Liability Cost Estimates –
Jacob K. Javits Federal Building
BAT Section
Cost Estimate Per BAT Survey
Total Project Cost Estimate
Overstated Cost
A B C=A-B A10 Substructure – Footings and Foundations – Observed Issue $71,400,000 A1030 Substructure (Slab on Grade) – Observed Issue $71,400,000 A2020 Basement Walls – Observed Issue $71,400,000 B1010 Superstructure (Columns and Beams) – Observed Issue $71,400,000 G2030 Site Civil (Plaza Surfaces) – Observed Issue $71,400,000
Total Cost Estimate $357,000,000 $71,400,000 $285,600,000
B3010 Roofing – Observed Issue $1,785,000 D3040 Mechanical (Steam Converters) – Observed Issue $1,785,000
Total Cost Estimate $3,570,000 $1,785,000 $1,785,000
D2020 Domestic Water Distribution – Observed Issue $357,000 D3030 Chillers, Condensing Units, and Packaged Cooling Equipment – Observed Issue
$357,000
Total Cost Estimate $714,000 $357,000 $357,000 Totals $361,284,000 $73,542,000 $287,742,000
The PBS branch chief and surveyor both confirmed that each of these observed issues were part of larger repair projects with total project cost estimates as illustrated in Figure 7. As a result, the total cost estimates for the same repair projects were entered multiple times, thereby overstating the immediate liabilities for this survey by $287,742,000.
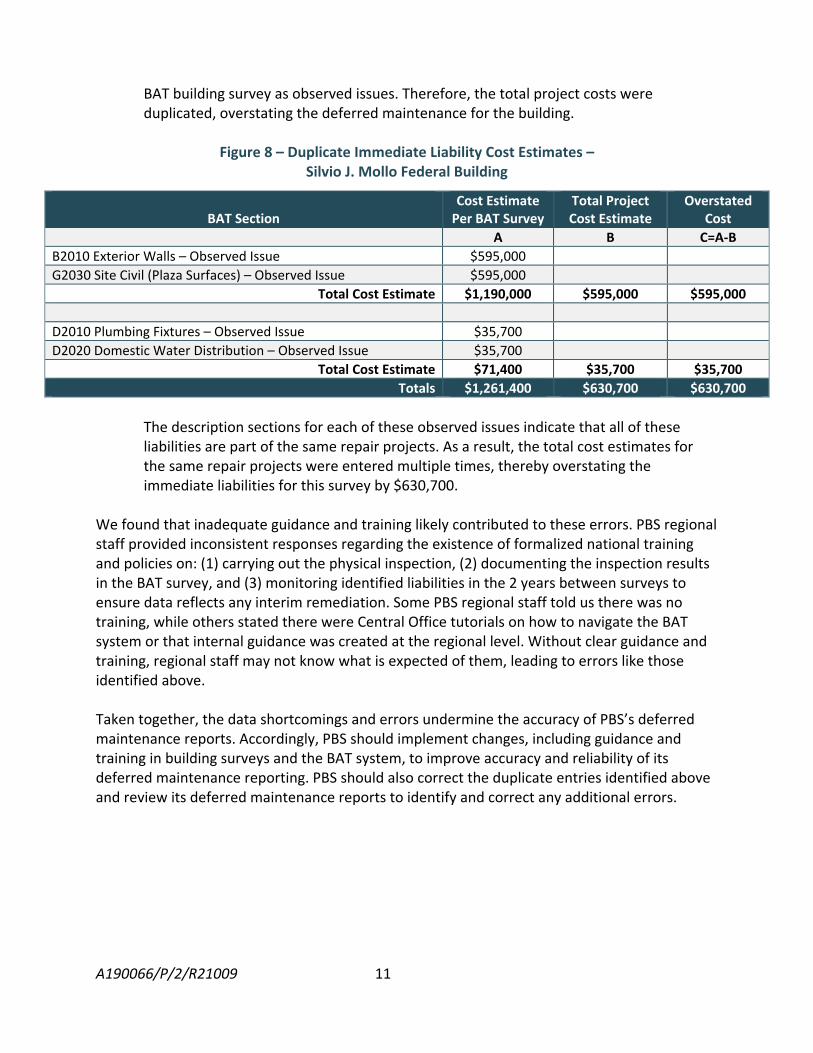
• Silvio J. Mollo Federal Building, New York, New York – As shown in Figure 8 on the next
page, two projects were being developed for the Silvio J. Mollo Federal Building. PBS regional personnel entered the total project cost estimates into multiple sections of the
A190066/P/2/R21009 11
BAT building survey as observed issues. Therefore, the total project costs were duplicated, overstating the deferred maintenance for the building.
Figure 8 – Duplicate Immediate Liability Cost Estimates –
Silvio J. Mollo Federal Building
BAT Section
Cost Estimate Per BAT Survey
Total Project Cost Estimate
Overstated Cost
A B C=A-B B2010 Exterior Walls – Observed Issue $595,000 G2030 Site Civil (Plaza Surfaces) – Observed Issue $595,000
Total Cost Estimate $1,190,000 $595,000 $595,000 D2010 Plumbing Fixtures – Observed Issue $35,700 D2020 Domestic Water Distribution – Observed Issue $35,700
Total Cost Estimate $71,400 $35,700 $35,700 Totals $1,261,400 $630,700 $630,700
The description sections for each of these observed issues indicate that all of these liabilities are part of the same repair projects. As a result, the total cost estimates for the same repair projects were entered multiple times, thereby overstating the immediate liabilities for this survey by $630,700.
We found that inadequate guidance and training likely contributed to these errors. PBS regional staff provided inconsistent responses regarding the existence of formalized national training and policies on: (1) carrying out the physical inspection, (2) documenting the inspection results in the BAT survey, and (3) monitoring identified liabilities in the 2 years between surveys to ensure data reflects any interim remediation. Some PBS regional staff told us there was no training, while others stated there were Central Office tutorials on how to navigate the BAT system or that internal guidance was created at the regional level. Without clear guidance and training, regional staff may not know what is expected of them, leading to errors like those identified above. Taken together, the data shortcomings and errors undermine the accuracy of PBS’s deferred maintenance reports. Accordingly, PBS should implement changes, including guidance and training in building surveys and the BAT system, to improve accuracy and reliability of its deferred maintenance reporting. PBS should also correct the duplicate entries identified above and review its deferred maintenance reports to identify and correct any additional errors.

A190066/P/2/R21009 12
Finding 2 – PBS’s national maintenance strategy has not been effective to reduce its deferred maintenance backlog. PBS’s national maintenance strategy has not been effective to reduce its deferred maintenance backlog. As a result, PBS is vulnerable to rising maintenance and repair costs and an increased risk of building system failure, accelerated deterioration of systems and structures, and potential life safety hazards. PBS Does Not Specifically Target its Deferred Maintenance Backlog While PBS has developed a national maintenance strategy as part of its Capital Program, this strategy has not effectively addressed PBS’s increasing deferred maintenance backlog. PBS’s strategy is focused broadly on repair and alteration projects. According to GSA’s Fiscal Year 2021 Congressional Justification, PBS considers reductions to its deferred maintenance backlog and the following criteria when prioritizing repair and alteration projects:
• Serving PBS’s partners; • Promoting savings and economic development; • Reducing the federal footprint; • Ensuring a safe, secure, and responsible work environment; and • Asset performance.
In balancing these criteria, PBS does not consistently target immediate liabilities as part of its repair and alteration projects, contributing to PBS’s growing deferred maintenance backlog. For example, we found that PBS had no plans to address long-standing immediate liabilities for site civil (paved area) and electrical switchgear repairs at the IRS Service Center in Holtsville, New York. PBS has reported these liabilities since 2017 and 2013, respectively. During that time, the estimated cost of the repairs to the paved area alone has increased by 364 percent to $14 million. Nonetheless, the PBS supervisory engineer told us that there are no current or planned projects to address these immediate liabilities. As shown in the examples below, we also found that even when PBS has obtained prospectus funding, it is not fully addressing critical deferred maintenance as part of those projects.
• Frances Perkins Building, Washington, D.C. – This building has had immediate liabilities for air handling units and heating ductwork since 2017. The current estimated costs to remediate these liabilities are $23.7 million and $6.4 million, respectively. PBS proposed a $29 million modernization project to replace 31 elevators in this building; however, this project did not include remediating the air handling units or the heating ductwork. The PBS asset manager told us the air handling and heating ductwork liabilities have not been fully evaluated, so the PBS asset team has been focusing on what they consider more pressing issues, such as garage repairs and elevator and electrical systems.

A190066/P/2/R21009 13
• Sam Nunn Atlanta Federal Center, Atlanta, Georgia – This building has had immediate liabilities for exterior windows, cooling towers, and interior wall finishes since 2018. The current estimated costs to remediate these liabilities are $14.6 million, $2.5 million, and $1.8 million, respectively. PBS proposed a $202 million modernization project to replace a subgrade tunnel, generators, electrical systems, and chillers in this building; however, this project does not include work to remediate the exterior windows, cooling towers, and interior wall finishes. The PBS regional director of the Office of Portfolio Management told us that there are no current or planned projects to address these immediate liabilities.
The examples above demonstrate that PBS’s national maintenance strategy has not been effective to address its deferred maintenance backlog. Deferred Maintenance Has Led to Escalating Costs Without an effective national maintenance strategy, PBS is vulnerable to rising maintenance and repair costs and an increased risk of building system failure, accelerated deterioration of systems and structures, and potential life safety hazards. GSA’s deferred maintenance has been increasing since FY 2014. We found that while new issues contribute to the increase, the escalating costs for long-term deferred maintenance are also contributing to the cost growth. For example, Figure 9 on the next page shows increases in cost estimates for five deferred immediate liabilities from the fiscal year PBS first reported them as immediate through FY 2019. On average, the estimated costs for these deferred maintenance liabilities increased by 173 percent.

A190066/P/2/R21009 14
Figure 9 – Increases in Cost Estimates for Select Deferred Maintenance6
Beyond the increase in cost estimates over time demonstrated above, deferred maintenance is known to result in higher costs. For example, deferred maintenance causes increases in operational costs because improperly maintained building systems will work less efficiently. As a result, these systems use more energy to produce the expected level of output, leading to higher utility costs. Long-term deferred maintenance can also lead to more costly emergency repair or replacement projects. While estimates vary, emergency repairs can cost 3 to 10 times more than a good maintenance program. Depending on the nature of the emergency repair work, these emergency projects often result in hidden costs, such as lost productivity if building occupants are not allowed into the building while the repair work is ongoing.
6 Comparisons are based on FY 2019 cost estimates against cost estimates for deferred immediate liabilities in the year they were originally reported as immediate. Appendix B presents all of the immediate liabilities we sampled and how long PBS has prioritized them as immediate. Appendix C presents examples of immediate liabilities and the extent at which the cost estimates have increased.

A190066/P/2/R21009 15
PBS Needs to Improve its National Maintenance Strategy to Reduce its Deferred Maintenance Backlog PBS considers multiple factors as part of its national maintenance strategy to address the needs of its entire portfolio. However, PBS needs to improve this strategy to more effectively target—and reduce—its deferred maintenance backlog. In recent years, PBS has expressed concern that the gap between requested and authorized spending levels has limited its ability to fund necessary maintenance and repairs. As noted in the Background section, since FY 2015, GSA has received approximately 62.46 percent of its requests for new obligational authority under BA54 and BA55, on average. PBS asserted that the combination of escalating deferred maintenance costs and funding constraints has adversely affected the long-term sustainability of its portfolio of federally owned buildings. Specifically, PBS’s position is that:
Deferred maintenance escalates faster than regular inflation partly due to the cascading effects of not making needed replacements. PBS has been underfunded for over 10 years and that is resulting in an exponential increase in our liabilities.7
We recognize PBS’s concerns. Nonetheless, PBS has opportunities to improve its national maintenance strategy to place greater emphasis on the reduction of its deferred maintenance backlog in its decision-making process. While we acknowledge that deferred maintenance cannot be the sole focus of a comprehensive strategy, the escalating costs associated with the deferred maintenance backlog demonstrate that adjustments are necessary. For example, PBS could target non-prospectus-level immediate building liabilities as priority projects for its BA54 program. In doing so, PBS should emphasize the need to remediate as many non-prospectus-level liabilities as possible to make inroads into its deferred maintenance backlog. PBS could also take a more targeted approach to addressing prospectus-level immediate liabilities through its major repairs and alterations program. For example, when planning prospectus projects, PBS could ensure that immediate liabilities are prioritized over less-critical repairs or modernization needs. In sum, PBS’s national maintenance strategy has not been effective to reduce the deferred maintenance backlog associated with its aging real property inventory. As a result, PBS is vulnerable to rising maintenance and repair costs and an increased risk of building system failure, accelerated deterioration of systems and structures, and potential life safety hazards. Accordingly, PBS should improve its national maintenance strategy and place an increased emphasis on addressing its growing list of immediate liabilities. 7 PBS provided this information in its response to our discussion draft report.

A190066/P/2/R21009 16
Conclusion We found that the accuracy of GSA’s reported deferred maintenance cost estimate is affected by data shortcomings and errors, including over $280 million in duplicative costs applied to the reported deferred maintenance cost estimate for FY 2019. To improve accuracy and reliability of its deferred maintenance reporting, PBS should implement changes, including providing personnel with guidance and training in building surveys and the BAT system. PBS should also correct the duplicative costs identified in our report and conduct a review to identify and correct any additional errors in its deferred maintenance reports. We also found that while PBS has a national maintenance strategy associated with its Capital Program, this strategy has not been effective to reduce its deferred maintenance backlog. As a result, PBS is vulnerable to rising maintenance and repair costs and an increased risk of building system failure, accelerated deterioration of systems and structures, and potential life safety hazards. Accordingly, PBS should improve its maintenance strategy and place an increased emphasis on addressing its growing list of immediate liabilities. Recommendations We recommend that the PBS Commissioner develop a comprehensive plan to ensure that PBS:
1. Establishes a national policy and training program that provides personnel with guidance on how to conduct building surveys, accurately enter results into the BAT system, and account for interim remediation of building liabilities.
2. Updates the BAT pricing module to generate estimates more closely aligned to external and regional cost estimates.
3. Corrects the duplicate entries identified above and reviews its deferred maintenance
reports to identify and correct any additional errors.
4. Improves its national maintenance strategy to place greater emphasis on its growing list of immediate liabilities by prioritizing projects to reduce them.
GSA Comments The PBS Commissioner agreed with Recommendations 1–3, and partially agreed with Recommendation 4. PBS also provided technical comments to Findings 1 and 2. We made certain revisions to the report in response to PBS’s comments; however, those revisions did not change the findings and conclusions reached in our report.

A190066/P/2/R21009 17
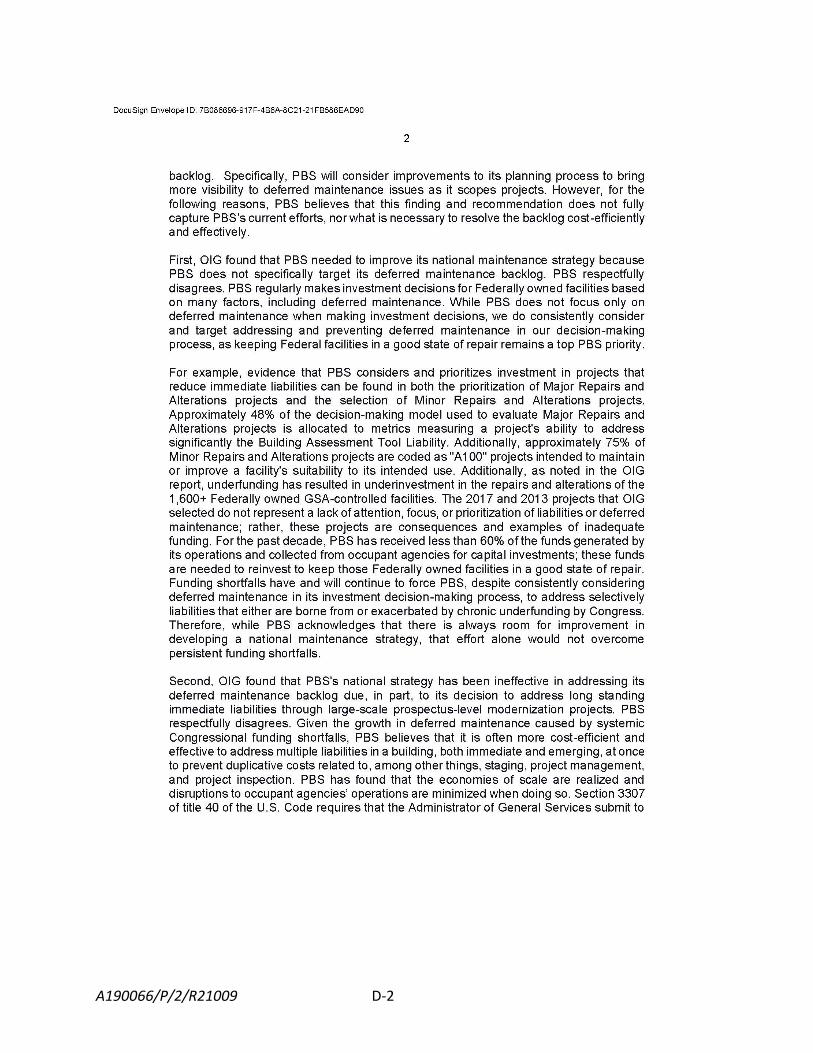
PBS’s Response to Finding 2 and Recommendation 4 PBS commented that Finding 2 and Recommendation 4 do not “fully capture [its] current efforts, nor what is necessary to efficiently and effectively resolve the deferred maintenance backlog.” PBS cited two reasons for this assertion. First, PBS disagreed with our finding that it does not specifically target its deferred maintenance backlog. PBS asserted that, while it does not focus solely on deferred maintenance when making investment decisions, it consistently considers and targets deferred maintenance needs in its decision-making process. However, we found instances where PBS had no plans to address long-standing immediate liabilities. For example, as described in the report, PBS had no current or planned projects to address site civil (paved area) and electrical switchgear liabilities at the IRS Service Center in Holtsville, New York. Accordingly, we reaffirm our finding. Second, PBS disagreed that its national strategy has been ineffective in addressing its deferred maintenance backlog due, in part, to its decision to address long-standing immediate liabilities through large-scale, prospectus-level modernization projects. PBS notes:
[I]t is often more cost-efficient and effective to address multiple liabilities in a building, both immediate and emerging, at once to prevent duplicative costs related to, among other things, staging, project management, and project inspection.
PBS’s assertion is based on language included in our draft report, in which we cited increases in deferred maintenance cost estimates driven by the long lead times associated with the process for obtaining congressional approval for prospectus projects. After assessing PBS’s comments, we agreed that PBS’s practice of addressing long-term deferred maintenance liabilities is sound and deleted this language from this final report. Nonetheless, as we note on page 15 in this final report, “when planning prospectus projects, PBS could ensure that immediate liabilities are prioritized over less-critical repairs or modernization needs.” For example, we found that while PBS obtained prospectus funding for projects to modernize the Frances Perkins Building in Washington, D.C., and the Sam Nunn Atlanta Federal Center in Atlanta, Georgia, these projects did not fully address critical deferred maintenance needs. In conclusion, we maintain that PBS has opportunities to improve its national maintenance strategy to place greater emphasis on the reduction of deferred maintenance liabilities. We are encouraged that, in line with our recommendation, PBS acknowledges that “there is always room for improvement in developing a national maintenance strategy,” and asserts that it “will consider improvements to its planning process to bring more visibility as it scopes projects.”

A190066/P/2/R21009 18
Technical Comments to Findings 1 and 2 PBS also provided two technical comments to our draft report. Our responses to these comments are detailed below.
• Jacob K. Javits Federal Building: As described in Finding 1, we found that PBS regional personnel entered the total project cost estimate of $71.4 million into multiple sections of the BAT building survey as observed issues. In its technical comments, PBS asserts that “[T]he total known project cost of [$357 million] was evenly broken into five separate BAT sections … with each estimating a cost of [$71.4 million].” PBS’s assertions directly contradict those of the PBS branch chief and surveyor responsible for entering the BAT estimate for the Javits Building, both of whom confirmed that the total project cost was $71,400,000—not $357,000,000. Accordingly, we reaffirm our finding that the deferred maintenance liabilities for the building were overstated by $287.7 million.
• Denver Federal Center, Building 20: We included this building in Finding 2 of our discussion draft report as an example of a long-standing deferred maintenance liability that PBS planned to address through a prospectus project. However, as noted in PBS’s technical comments, PBS has decided to dispose of this building, rendering a prospectus-level project unnecessary. Therefore, we removed the Denver Federal Center example from the report finding.
PBS’s response can be found in its entirety in Appendix D. Audit Team This audit was managed out of the Northeast and Caribbean Region Audit Office and conducted by the individuals listed below:
Arthur F. Maisano Regional Inspector General for Auditing Kyle Donaldson Auditor-In-Charge Michael Vaccarelli Auditor

A190066/P/2/R21009 A-1
Appendix A – Scope and Methodology This audit assessed PBS’s effectiveness in managing deferred maintenance of an aging real property inventory. Specifically, our audit focused on whether PBS is accurately reporting the deferred maintenance estimates for its building inventory in GSA’s fiscal year AFR and if it has information systems in place to accurately plan and track the remediation of immediate building liabilities from year to year. To accomplish our objectives, we:
• Requested, obtained, and reviewed program, policy, and process documentation; • Obtained access to applicable information systems to pull a detailed database of
present liabilities in PBS’s real property inventory; • Analyzed the database and reconciled total immediate liabilities to the total deferred
maintenance figure of $1.93 billion reported in GSA’s 2019 Agency Financial Report; • Sorted all buildings from highest to lowest immediate liability costs and selected a
judgmental audit sample of the top 20 buildings by immediate liability costs. These 20 buildings represented approximately 56 percent of total immediate liability costs nationwide ($1.074 billion divided by $1.93 billion times 100); the sample consisted the following:
o 2 buildings from the New England Region (Region 1) o 5 buildings from the Northeast and Caribbean Region (Region 2) o 1 building from the Mid-Atlantic Region (Region 3) o 1 building from the Southeast Sunbelt Region (Region 4) o 3 buildings from the Great Lakes Region (Region 5) o 1 building from the Heartland Region (Region 6) o 1 building from the Rocky Mountain Region (Region 8) o 2 buildings from the Pacific Rim Region (Region 9) o 4 buildings from the National Capital Region (Region 11)
• Conducted two in-person site inspections, including phone interviews and documentation analysis involving the overall BAT survey process for sample buildings in Region 2;
• Conducted 18 virtual site visits due to the COVID-19 pandemic, including phone interviews and documentation analysis involving the overall BAT survey process for the remaining sample buildings;
• Reviewed current and past BAT surveys for all sampled buildings; • Reconciled large immediate liabilities in each building’s BAT report to more detailed
documented estimates, surveys, and studies, where available; • Traced large immediate liabilities back through past BAT surveys to determine when
they were first categorized as immediate and quantified the impact of time on cost estimates for those that were not addressed;

A190066/P/2/R21009 A-2
• Interviewed PBS Central Office personnel to better understand: o The approval and funding process for major and minor alteration and repair
projects, and o The flow of information through PBS’s relevant information systems concerning
buildings, their liabilities, and projects created to address those liabilities; and • Used follow-up phone interviews and email questions to obtain missing documents and
fill in any remaining gaps in our understanding of the subject areas under review.
We conducted the audit between March 2019 and August 2020 in accordance with generally accepted government auditing standards. Those standards require that we plan and perform the audit to obtain sufficient, appropriate evidence to provide a reasonable basis for our findings and conclusions based on our audit objectives. We believe that the evidence obtained provides a reasonable basis for our findings and conclusions based on our audit objectives. Internal Controls Our assessment of internal controls was limited to those necessary to address the objectives of the audit.

A190066/P/2/R21009 B-1
Appendix B – Sample of Deferred Immediate Liabilities
This appendix presents the immediate liabilities we sampled and how long they have been prioritized as immediate.
Building #
Liability Section
Current Survey
First Time Immediate
Years Listed Immediate
Cycles Old
CA0199MM 6 - B1010 2018 2018 0 0 CO0511AA 18 - D2010 2019 2009 10 5 CO0511AA 19 - D2020 2019 2009 10 5 CO0511AA 26 - D3040 2019 2009 10 5 CO0511AA 22 - D3020 2019 2009 10 5 CO0511AA 34 - D5022 2019 2009 10 5 CO0511AA 31 - D5010 2019 2009 10 5 CO0511AA 20 - D2030 2019 2011 8 4 CO0511AA 23 -D3023 2019 2009 10 5 CO0511AA 10 - B3010 2019 2009 10 5 CO0511AA 6 - B1010 2019 2019 0 0 CO0511AA 13 - C3010 2019 2019 0 0 CO0511AA 14 - C3020 2019 2019 0 0 CO0511AA 15 - C3030 2019 2019 0 0 CO0511AA 32 - D5010 2019 2009 10 5 CO0511AA 7 - B2010 2019 2009 10 5 DC0013ZZ 26 - D3040 2019 2008 11 5.5 DC0021ZZ 7 - B2010 2010 2008 2 1 DC0021ZZ 30 - D3050 2010 2008 2 1 DC0021ZZ 26 - D3040 2010 2008 2 1 DC0021ZZ 24 - D3030 2010 2008 2 1 DC0082ZZ 18 - D2020 2018 2018 0 0 DC0082ZZ 15 - C3030 2018 2018 0 0 DC0082ZZ 32 - D5010 2018 2018 0 0 DC0116ZZ 16 - D1010 2019 2017 2 1 DC0116ZZ 26 - D3040 2019 2017 2 1 DC0116ZZ 30 - D3050 2019 2017 2 1 GA1007ZZ 8 - B2020 2018 2018 0 0 GA1007ZZ 13 - C3010 2018 2018 0 0 GA1007ZZ 25 - D3031 2018 2018 0 0 IL0303ZZ 16 - D1010 2018 2018 0 0 IL0303ZZ 24 - D3030 2018 2018 0 0 IL0303ZZ 25 - D3031 2018 2018 0 0
MA0131ZZ 24 - D3030 2018 2016 2 1 MA0131ZZ 16 - D1010 2018 2018 0 0 MD0056AG 26 - D3040 2019 2008 11 5.5

A190066/P/2/R21009 B-2
Building #
Liability Section
Current Survey
First Time Immediate
Years Listed Immediate
Cycles Old
MD0056AG 32 - D5010 2019 2015 4 2 MO0050ZZ 5 - B1010 2018 2012 6 3 NH0036ZZ 16 - D1010 2019 2008 11 5.5 NH0036ZZ 6 - B1010 2019 2008 11 5.5 NH0036ZZ 8 - B2020 2019 2011 8 4 NH0036ZZ 32 - D5010 2019 2017 2 1 NH0036ZZ 26 - D3040 2019 2015 4 2 NV0294ZZ 6 - B1010 2018 2018 0 0 NY0128ZZ 32 - D5010 2018 2016 2 1 NY0282ZZ 2 - A10 2019 2017 2 1 NY0282ZZ 32 - D5010 2019 2017 2 1 NY0282ZZ 16 - D1010 2019 2019 0 0 NY0282ZZ 26 - D3040 2019 2017 2 1 NY0323ZZ 7 - B2010 2018 2010 8 4 NY0323ZZ 30 - D3050 2018 2012 6 3 NY0323ZZ 34 - D5022 2018 2010 8 4 NY0323ZZ 26 - D3040 2018 2010 8 4 NY0323ZZ 15 - C3030 2018 2010 8 4 NY0323ZZ 19 -D2020 2018 2010 8 4 NY0351ZZ 34 - D5022 2019 2013 6 3 NY0351ZZ 2 - A10 2019 2011 8 4 NY0351ZZ 24 - D3030 2019 2015 4 2 NY0351ZZ 4 - A2020 2019 2015 4 2 NY0351ZZ 30 - D3050 2019 2015 4 2 NY0351ZZ 8 - B2020 2019 2011 8 4 NY0376ZZ 35 - G2020 2019 2017 2 1 NY0376ZZ 32 - D5010 2019 2013 6 3 OH0194ZZ 4 - A2020 2019 2019 0 0 OH0194ZZ 7 - B2010 2019 2019 0 0 WI0044ZZ 7 - B2010 2019 2017 2 1
Total Liabilities
% of Sampled Liabilities
6+ Years Deferred
27 40.91%
10+ Years Deferred
14 21.54%
A190066/P/2/R21009 C-1
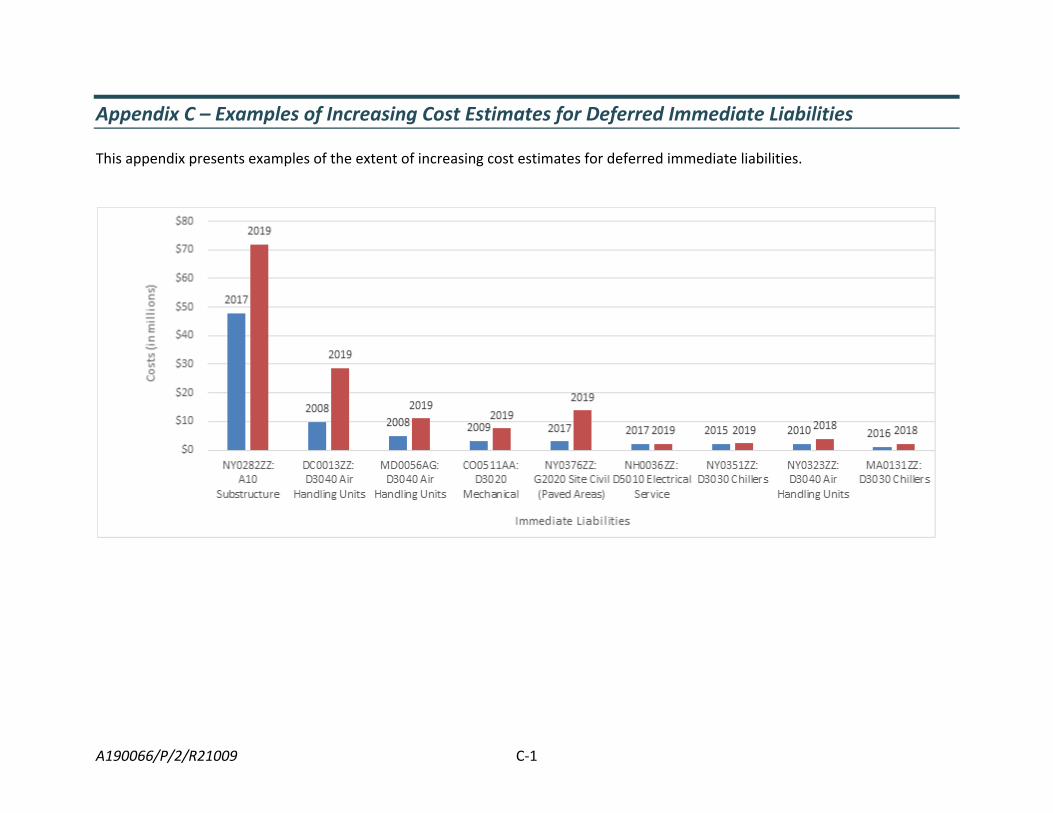
Appendix C – Examples of Increasing Cost Estimates for Deferred Immediate Liabilities This appendix presents examples of the extent of increasing cost estimates for deferred immediate liabilities.

A190066/P/2/R21009 C-2
The percentage increases for the deferred immediate liabilities are listed in the table below:
Building Number
BAT Section
Cost Estimate Increase
Percent Increase
NY0282ZZ A10
Substructure $23,861,971 50%
DC0013ZZ D3040 Air
Handling Units $18,906,441 192%
MD0056AG D3040
Air Handling Units $6,233,716 127%
CO0511AA D3020
Mechanical $4,364,748 134%
NY0376ZZ G2020 Site Civil (Paved Areas)
$10,965,446 364%
NH0036ZZ D5010
Electrical Service $150,131 7%
NY0351ZZ D3030 Chillers $336,960 16%
NY0323ZZ D3040
Air Handling Units $1,868,866 90%
MA0131ZZ D3030 Chillers $1,115,038 95%

A190066/P/2/R21009 D-1
Appendix D – GSA Comments
A190066/P/2/R21009 D-2

A190066/P/2/R21009 D-3

A190066/P/2/R21009 D-4

A190066/P/2/R21009 E-1
Appendix E – Report Distribution GSA Administrator (A) GSA Deputy Administrator (AD) Commissioner (P) Deputy Commissioner (PD) Chief of Staff (PB) Deputy Chief of Staff (PB) Assistant Commissioner for Strategy and Engagement (PS) Assistant Commissioner, Office of Facilities Management (PM) Chief Financial Officer (B) Office of Audit Management and Accountability (BA) Assistant Inspector General for Auditing (JA) Director, Audit Planning, Policy, and Operations Staff (JAO)