Audit of the Department of Parks - Honolulu
56
Office of the City Auditor City and County of Honolulu State of Hawai`i Report to the Mayor and the City Council of Honolulu Audit of the Department of Parks and Recreation’s Performance Metrics FY 2015 - FY 2017 Report No. 18-02 May 2018 (rev. 06/06/18)
Transcript of Audit of the Department of Parks - Honolulu

Office of the City Auditor
City and County of Honolulu
State of Hawai`i
Report to the Mayor and the
City Council of Honolulu
Audit of the Department of Parks
and Recreation’s Performance Metrics
FY 2015 - FY 2017
Report No. 18-02 May 2018 (rev. 06/06/18)


i
Chapter 1 Introduction and Background
Introduction ...........................................................................................................................1Background ............................................................................................................................1Audit Objectives, Scope and Methodology .......................................................................5Audit Results .........................................................................................................................5
Chapter 2 DPR Did Not Achieve Its Seven Performance Metrics
Performance Metric 1: DPR Did Not Reduce Potable Water Usage ..............................................9
Performance Metrics 2, 4 and 5: Three Performance Metrics Related to Filling Important Staff Positions Were Not Met ....................................................................12
Performance Metric 3: Public Awareness, Satisfaction, and Planning Goals Were Not Fully Attained .........................................................................................................17
Performance Metric 6: New Registration and Point-Of-Sale Systems for Class Registration and Facilities Use Were Not Implemented ..........................................18
Performance Metric 7: New Street and Park Tree Inventory and Work Order Programs Were Not Implemented ..............................................................................18
Chapter 3 The Department of Parks and Recreation Did Not Develop Measurable and Achievable Goals Because it Did Not Follow Best Practices
Best Practices for Performance Measurement in Government Established ...............25The Department of Budget and Fiscal Services Can Provide Better Guidance .........26DPR’s Performance Metrics Were Not Linked to the Department’s Mission or
Specific Plans ..................................................................................................................27Performance Metrics are Not Always Measureable or Sufficiently Monitored .........28DPR Needs to Include Staff and Park Users When Developing Performance
Metrics .............................................................................................................................28DPR Needs to Consider External Constraints Prior to Developing Performance
Metrics .............................................................................................................................29Other Parks and Recreation Jurisdictions Have Established Appropriate
Performance Metrics ......................................................................................................30
Chapter 4 Conclusions and Recommendations
Recommendations ..............................................................................................................34Management Response ......................................................................................................35
Table of Contents

ii
Appendices
Appendix A Performance Metrics Best Practices ..................................................................................39Appendix B Example of Performance Metrics and Reporting (Kirkland, Washington) .................41Appendix C Example of Performance Metrics and Reporting (San Mateo, California) .................43Appendix D Example of Performance Metrics and Reporting (Williamsburg, Virginia) ...............45Appendix E Example of Performance Metrics and Reporting (Dallas,, Texas) ................................47Appendix F Example of Performance Metrics and Reporting (Maui, Hawai`i) ..............................49
List of Exhibits
Exhibit 1.1 Performance Metrics (FY2015, FY2017) ..............................................................................2Exhibit 1.2 Department of Parks and Recreation Organizational Chart ...........................................4Exhibit 2.1 DPR Potable Water Usage Analysis ..................................................................................10Exhibit 2.2 Estimated Cost Savings Analysis ......................................................................................10Exhibit 2.3 Example of Signage for Recycled Water at Kapolei Regional Park .............................12Exhibit 2.4 This Non-Potable Water Pipe at Ocean Pointe Park is One of Only Five City
Parks with Non-Potable Water .....................................................................................12Exhibit 2.5 Total Number of DPR Temporary Unbudgeted Position Requests .............................15Exhibit 2.6 Total Number of DPR Temporary Unbudgeted Position Requests Which Consist
of Groundskeeper Positions .........................................................................................17Exhibit 2.7 Citizen Forestry Volunteers Inventorying Trees ............................................................21Exhibit 2.8 DPR Tree Work Order Process ..........................................................................................23Exhibit 3.1 External Constraints Which Influenced DPR Performance Metrics ............................30

Chapter 1: Introduction and Background
1
Chapter 1 Introduction and Background
This Audit of the Department of Parks and Recreation’s Performance Metrics FY 2015 - FY 2017 was initiated by the Office of the City Auditor pursuant to Section 3-502.1(c) of the Revised Charter of Honolulu and the Office of the Auditor’s Annual Work Plan for FY 2017-18. The office of the city auditor determined this audit was warranted because the development of meaningful performance metrics has the potential to improve operational efficiency and drive accountability. We felt it beneficial to determine whether the performance metrics were achieved and how the department utilized the results to improve operations, efficiency, and transparency to stakeholders.
In addition, the city needs to collect appropriate data and be able to analyze performance data for the new What Works Cities initiative1.
The objectives of the Audit of Department of Parks and Recreation’s Performance Metrics FY 2015-17 were to: (1) determine whether the Department of Parks and Recreation (DPR) met its performance metrics for FY 2015 – FY 2017; and (2) evaluate the effectiveness of the Department of Parks and Recreation’s process for establishing performance metrics.
Every year, city departments must compile an operating budget for their respective department. In August 2014, city guidelines to all agencies regarding the FY 2016 operating budget required departments to develop meaningful performance metrics focused on programs which supported the mayor’s priorities.
Introduction
Background
1 The City and County of Honolulu was recently selected as one of five new cities to participate in Bloomberg Philanthropies’ national What Works Cities Initiative. This national initiative helps 100 mid-size American Cities enhance their use of data and evidence to improve services, inform local decision-making, and engage residents.

Chapter 1: Introduction and Background
2
These performance metrics were intended to help evaluate programs and allocate resources to priority areas. The guidelines effectively served to reset FY 2015 performance metrics, and, in our opinion, marked an improvement from prior budgetary practices for establishing departmental performance metrics. These same guidelines were carried forward from FY 2017 through FY 2019.
DPR established seven performance metrics in FY 2015 and FY 2017. They included noteworthy operational areas such as potable water reduction, staff vacancies and hiring processes, developing medium and long-range plans, establishing a new registration and point-of-sale system for class registrations, and implementing a new street and park tree inventory and work order system. Exhibit 1.1 describes the performance metrics and their associated goals.
• The Department of Parks and Recreation established seven performance metrics
Exhibit 1.1Performance Metrics (FY2015, FY2017)
Source: FY 2017 Operating and Program Budget for the City and County of Honolulu
FY2015Performance Metric for Fiscal
Year 2015 Goal1 Decrease the amount of potable
water used at City parks.Decrease the amount of potable water used at City parks by 5% per year.
2 Increase efficiency in filling vacant job positions.
Complete 90% of the E-forms submitted within 10 days of the position becoming vacant. Complete 90% of the packets for positions interviewed within 10 days after receiving the list of eligible candidates.
3
Identify public awareness and satisfaction with City parksfacilities and recreational programs, and collect data to assist in developing medium and long-range plans.
Establish a strategic plan to identify public perception and develop a plan to address issues.
FY2017Performance Metric for Fiscal
Year 2017 Goal4 Create and fill positions requested
in FY17. FY17: Fill 29 positions by January 2018.
5Attain a 90% fill rate for Park Maintenance and Recreation Service Division.
FY17: Attain a 90% fill rate by June 2017.
6
Complete implementation of new registration and point-of-sale systems for class registration and use of facilities.
FY17: Complete by January 2018.
7Complete implementation of new street and park tree inventory and work order program in FY17.
FY17: Establish a street and park tree inventory and work order program for the Division of Urban Forestry by June 2017.
Chapter 1: Introduction and Background
3
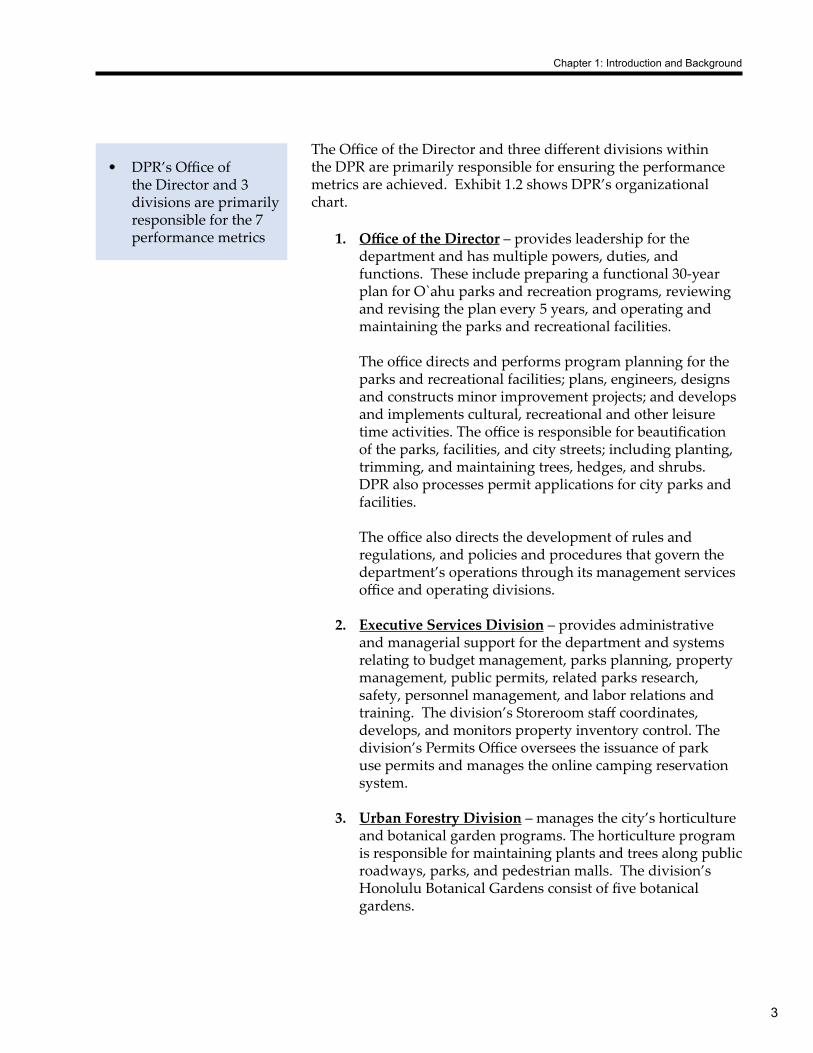
The Office of the Director and three different divisions within the DPR are primarily responsible for ensuring the performance metrics are achieved. Exhibit 1.2 shows DPR’s organizational chart.
1. Office of the Director – provides leadership for the department and has multiple powers, duties, and functions. These include preparing a functional 30-year plan for O`ahu parks and recreation programs, reviewing and revising the plan every 5 years, and operating and maintaining the parks and recreational facilities. The office directs and performs program planning for the parks and recreational facilities; plans, engineers, designs and constructs minor improvement projects; and develops and implements cultural, recreational and other leisure time activities. The office is responsible for beautification of the parks, facilities, and city streets; including planting, trimming, and maintaining trees, hedges, and shrubs. DPR also processes permit applications for city parks and facilities. The office also directs the development of rules and regulations, and policies and procedures that govern the department’s operations through its management services office and operating divisions.
2. Executive Services Division – provides administrative and managerial support for the department and systems relating to budget management, parks planning, property management, public permits, related parks research, safety, personnel management, and labor relations and training. The division’s Storeroom staff coordinates, develops, and monitors property inventory control. The division’s Permits Office oversees the issuance of park use permits and manages the online camping reservation system.
3. Urban Forestry Division – manages the city’s horticulture and botanical garden programs. The horticulture program is responsible for maintaining plants and trees along public roadways, parks, and pedestrian malls. The division’s Honolulu Botanical Gardens consist of five botanical gardens.
• DPR’s Office of the Director and 3 divisions are primarily responsible for the 7 performance metrics

Chapter 1: Introduction and Background
4
4. Park Maintenance and Recreation Services Division – administers a comprehensive and diversified community recreation and park maintenance program for the city, and coordinates the activities of five geographical districts. The division’s Maintenance Support Services provides expertise in repair and maintenance projects for parks and park facilities. The division’s Recreation Support Services administers programs such as the People’s Open Market, Senior Citizens Section, Therapeutic Recreation Unit, and events such as Senior Clubs, Lei Day, Na Hula Festival, aquatics, and sports tournaments.
Exhibit 1.2Department of Parks and Recreation Organizational Chart
Source: Office of the City Auditor and Department of Parks and Recreation (DPR)
OFFICE OF THE DIRECTOR
EXECUTIVE SERVICES DIVISION
PARK MAINTENANCE AND RECREATION SERVICES
DIVISION
DIVISION OF URBAN FORESTRY
OFFICE OF THE ADMINISTRATOR
DISTRICT I
DISTRICT III
DISTRICT V
DISTRICT II
DISTRICT IV
RECREATION SUPPORT SERVICES
MAINTENANCE SUPPORT SERVICES

Chapter 1: Introduction and Background
5
The audit objectives were to: (1) determine whether the Department of Parks and Recreation met its performance metrics for Fiscal Year 2015 to Fiscal Year 2017; and (2) evaluate the effectiveness of the Department of Parks and Recreation’s process for establishing performance metrics.
In order to meet the audit objectives, we reviewed the City Charter and analyzed relevant ordinances, resolutions, committee reports, and department communications. We also reviewed applicable city administrative rules, policies, and procedures. We examined internal controls over the process for initiating and approving e-forms for hiring and the tree work order process.
We reviewed federal, state, and city policies and procedures related to performance metrics; city reports related to the budget process; and past OCA audit reports. We also reviewed DPR organizational charts, its mission statement, and the DPR website for information on parks and park programs.
We identified best practices related to developing and establishing performance metrics. We interviewed key management and staff responsible for DPR performance metrics and observed citizen forestry volunteers conduct tree inventories on behalf of the city. We also identified and reviewed reports related to the budget process, DPR, and performance metrics. We also reviewed relevant media articles and reviewed performance metrics programs from other local and state jurisdictions.
Although the Office of the City Auditor has conducted three prior audits involving DPR, we are unaware of any audits of DPR specifically related to their performance metrics.
This audit was performed in accordance with generally accepted government auditing standards from August 2017 to February 2018. These standards require that we plan and perform the audit to obtain sufficient and appropriate evidence to provide a reasonable basis for our findings and conclusions based on our audit objectives. We believe that the evidence obtained provides a reasonable basis for our findings and conclusions based on our audit objectives.
The Department of Parks and Recreation (DPR) developed performance metrics to support the mayor’s priorities and to help evaluate its programs, but did not achieve its performance metrics.
Audit Objectives, Scope and Methodology
Audit Results

Chapter 1: Introduction and Background
6
We believe the department could improve its performance metrics by following best practices, receiving better guidance and developing performance metrics linked to its mission or plans. Many of the performance metrics are not measurable or monitored, and external constraints inhibit department performance. For example:
• DPR did not attain its goal for reducing potable water usage. Instead of saving $833,907, water costs increased by over $2.08 million. We found that only 7 of the city’s 440 water sources are non-potable and that there are no specific plans for water reduction solutions.
• DPR did not achieve its three performance metrics related to filling job position vacancies. More specifically, the department only filled 22 (76%) of the 29 positions requested in FY 2017. Although vacancies in critical positions existed in park maintenance, the department had to use alternative methods to fill the positions. The department used personal services contracts to fill the vacancies in order to expedite the hiring process, properly maintain parks, make necessary repairs, and to fulfill the mayor’s priority of re-establishing pride in city parks2. In fiscal years 2015 and 2016, the department used personal services contracts to fill 64 temporary, unbudgeted position requests at a cost of $1.5 million, which is nearly 22 percent of the city’s original cost savings of $7.1 million from an initiative to deactivate positions starting in FY 2015. We question the effectiveness of utilizing personal services contracts for long-term staffing needs.
2 In 2013, when guidelines for the Fiscal Year 2015 operating budget were released, the mayor’s priority was park beautification. Park beautification was also the mayor’s priority in 2014, when guidelines for the Fiscal Year 2016 operating budget were released. In 2015, when guidelines for the Fiscal Year 2017 operating budget were released, the mayor’s priority was maintaining and beautifying our parks. Currently, the mayor’s priority is re-establishing pride in city parks.

Chapter 1: Introduction and Background
7
• Although DPR conducted a customer satisfaction survey in 2015, it has not yet developed medium and long-range plans for department operations although the plans were due in FY 2016.
• The department’s plan to establish a new registration and point-of-sale system for class registration and facilities use was not implemented by January 2018. The department estimates that the project is only 20%-30% complete.
• DPR’s metric to complete its new street and park tree inventory and work order programs were not achieved. The department is relying on a group of citizen volunteers to conduct the tree inventory which will take an estimated 10-20 years to complete. DPR relied on an outdated and inefficient work order program to manage the city’s tree inventory. A new automated, work order system was supposed to be completed by June 2017; we found that DPR was not timely and did not submit a work order request to DIT until November 2017.

Chapter 1: Introduction and Background
8
This page intentionally left blank.

Chapter 2: DPR Did Not Achieve Its Seven Performance Metrics
9
Chapter 2 DPR Did Not Achieve Its Seven Performance Metrics
The Department of Parks and Recreation (DPR) did not fully achieve the seven performance metrics it established in FY 2015 and FY 2017. The metrics were not achieved because the department did not adequately develop the metrics, collect data and monitor performance, or utilize the information to improve operations, efficiency, or transparency to stakeholders. As a result, the department missed an opportunity to contribute more toward meeting the mayor’s priorities to beautify and re-establish pride in city parks.
DPR did not meet its goal to decrease the amount of potable water used at city parks by 5% per year because DPR did not make it a high-priority metric. DPR did not take any formal actions or develop plans to change operations, reduce potable water usage at parks, or collect data to track potable water usage. Potable water usage was not reduced between FY 2015 and FY 2017. Instead, potable water usage increased by 13.1% during this three-year period. DPR also did not collect the data to track potable water usage and relied on another city department to obtain this information. If DPR had focused on reducing potable water usage by 5% between FY 2015 and FY 2017, we believe DPR could have reduced potable water consumption by over 173 million gallons.
By achieving this metric the city could have also saved money. However, instead of realizing cost savings of $833,907, potable water costs increased by over $2.08 million between FY 2015 and FY 2017. Exhibit 2.1 shows DPR’s potable water usage between FY 2015 and FY 2017, with FY 2014 data serving as the baseline for the metric. Exhibit 2.2 shows the cost savings which could have been realized if DPR had met the performance metric to reduce potable water by 5% each fiscal year.
Performance Metric 1: DPR Did Not Reduce Potable Water Usage
• Potable Water Consumption Increased 13.1% Over a Three-Year Period

Chapter 2: DPR Did Not Achieve Its Seven Performance Metrics
10
In our view, there are several ways to actively reduce potable water use—install water-conserving fixtures or irrigation equipment, xeriscape landscaping, or use an alternate water source such as non-potable water. We found no evidence that DPR planned to implement any of these alternatives to specifically reduce potable water consumption by 5%.
Exhibit 2.1DPR Potable Water Usage Analysis1
Source: OCA analysis of DPR data
Annual Grand Total
Expended ($ millions)
Cost per 1,000 gallons
($/1,000 gallons)
Total Actual Usage
(billion-gallons)
5% water usage reduction
(million-gallons) Target Usage
(billion-gallons)
FY14 (Baseline) 4.8$ 4.13$ 1.2 57.7 -FY15 5.6$ 4.53$ 1.2 57.7 1.1FY16 6.3$ 4.96$ 1.3 57.7 1.1FY17 6.0$ 4.96$ 1.2 57.7 1.1Total FY15-FY17 17.9$ ----- 3.7 173.0 3.3
Exhibit 2.2Estimated Cost Savings Analysis
Source: OCA analysis of DPR data
Estimated Cost Savings
FY15 $261,426 $629,939FY16 $286,241 $909,897FY17 $286,241 $536,879Total FY15-FY17 $833,907 $2,076,716
Actual Cost Increase
1 Figures included in this table were rounded wherever possible.

Chapter 2: DPR Did Not Achieve Its Seven Performance Metrics
11
For example, although DPR did not have a formal plan to increase use of non-potable water sources for city parks, this alternative resource is currently available and could be a viable solution to potable water reduction. We obtained an inventory of non-potable water sources in parks from the Board of Water Supply (BWS)2. This inventory revealed that only 1.6 percent of park water sources (7 out of 440) are a non-potable or recycled water source.
Expanding non-potable water use to other parks would go a long way in helping DPR achieve its goals. Without alternative non-potable water sources or water reduction solutions, it will be very difficult for DPR to reduce potable water by 5% annually. Although DPR is working with the Board of Water Supply (BWS), at present, there are no formal plans to install non-potable water fixtures at city parks. DPR therefore lacked realistic approaches and methods for meeting the 5% reduction in water consumption and costs.
2 The Board of Water Supply (BWS) manages Oahu’s municipal water resources and distribution system, providing residents with a safe, dependable, and affordable drinking water supply. As the largest municipal water utility in the state of Hawaii, they delivered potable and non-potable water to approximately one million customers on Oahu in Fiscal Year 2016. It proactively manages 94 active potable water sources, 171 reservoirs, and nearly 2,100 miles of pipeline.
• Only 7 of 440 city parks have access to non-potable or recycled water sources

Chapter 2: DPR Did Not Achieve Its Seven Performance Metrics
12
DPR did not achieve its three performance metrics related to filling job position vacancies:
• completing 90% of the e-forms submitted within 10 days of the position becoming vacant and completing 90% of the required personnel documents for positions interviewed within 10 days after receiving the list of eligible candidates;
• filling 29 positions by January 2018; and
• attaining a 90% fill rate for the Park Maintenance and Recreation Services Division by June 2017.
The department did not achieve these metrics primarily because it did not have complete control over the hiring processes. The Department of Human Resources’ (DHR) hiring guidelines were not fully considered. If DPR considered the outside constraints imposed by DHR, it could have adjusted its performance metric
Exhibit 2.3Example of Signage for Recycled Water at Kapolei Regional Park
Exhibit 2.4This Non-Potable Water Pipe at Ocean Pointe Park is One of Only Five City Parks with Non-Potable Water
Source: Office of the City Auditor Source: Board of Water Supply
Performance Metrics 2, 4 and 5: Three Performance Metrics Related to Filling Important Staff Positions Were Not Met

Chapter 2: DPR Did Not Achieve Its Seven Performance Metrics
13
to a more achievable benchmark or eliminated the metric. As a result, DPR continues to face challenges in filling and maintaining sufficient staff to properly maintain parks and make necessary repairs in support of the mayor’s priority of re-establishing pride in city parks3.
DPR has long-term and high-volume vacancies in critical positions such as park maintenance and in management level positions. As a result, DPR is challenged to properly maintain parks and make necessary repairs; ensure parks are run effectively and efficiently; and adequately support the mayor’s priority of re-establishing pride in city parks.
DPR performance metrics for filling job position vacancies included increasing efficiency in filling vacant job positions; creating and filling positions requested in FY17; and attaining a 90% fill rate for the Park Maintenance and Recreation Service Division.
Originally, DPR had planned to complete 90% of the e-forms4
submitted within 10 days of the position vacancy and planned to complete 90% of the required personnel documents for positions interviewed within 10 days after receiving a list of eligible candidates from DHR.
The department reported it partially met its goal by having 93% of the e-forms submitted within 10 days. To support the department’s claim, we asked for verification. The department’s personnel division could not provide the original reports that reflected 93% of the e-forms were submitted within 10 days.
• Our analysis of data provided by DPR indicated that only 29 of the 52 total positions listed by DPR were entry-level positions and indicated that the long-term vacancies were not all attributable to internal promotions as reported by management.
3 In 2013, when guidelines for the Fiscal Year 2015 operating budget were released, the mayor’s priority was park beautification. Park beautification was also the mayor’s priority in 2014, when guidelines for the Fiscal Year 2016 operating budget were released. In 2015, when guidelines for the Fiscal Year 2017 operating budget were released,
4 The city uses an eform (an internal electronic form) to request to fill a position.
Background
DPR has not been successful in increasing its efficiency in filling vacant job positions
• Only 29 positions of 52 (56%) were entry level

Chapter 2: DPR Did Not Achieve Its Seven Performance Metrics
14
• We further reviewed DPR’s employee roster for 2015. DPR had approximately 1,784 employees and we determined that only about 52 of 1,784 employees (3%) were affected by promotional opportunities.
In our analysis, we found that DPR is dependent on DHR5 for listings of eligible candidates for vacant job positions. The external constraints affected the hiring process and prevented DPR from achieving its performance metric. If DPR had sufficiently considered the potential constraints imposed by DHR’s hiring processes, it could have revised its performance metric to account for these constrains or eliminated them altogether.
DPR established a performance metric to create and fill 29 requested positions by January 2018. As of February 2018, DPR filled only 22 (76%) of the 29 positions requested. According to DPR, this performance metric was not met due to personnel turnover and promotions. We identified only 4 (18%) of the 22 positions involved personnel changes and concluded DPR did not achieve this metric due to constraints in the DHR hiring process.
In our opinion, the DPR vacancies in critical positions such as park maintenance and in management level positions have made it difficult for DPR to sustain adequate park maintenance and repair. The vacancies may affect its ability to administer and maintain the quality of parks as detailed in the mayor’s priority for re-establishing pride in city parks. Furthermore, the reliance on personal services contract positions does not ensure continuity as the positions are temporary and incumbents often seek permanent positions elsewhere in the system.
DPR established a goal of attaining a 90% fill rate in its Park Maintenance and Recreation Service Division by June 2017. DPR did not achieve its performance metric. Based on our analysis, DPR achieved an 86.9% fill rate in FY 2016 and an 86.0% fill rate in FY 2017. The department did not achieve a consistent 90% fill
5 The Department of Human Resources (DHR) is the central personnel agency for the city. It is responsible for a comprehensive personnel management program that is based on merit principles and generally accepted methods for the classification of positions and the employment of city employees. This department is charged with building a career service designed to attract, select, and train the best qualified civil servants.
DPR filled only 22 of 29 positions in FY 2017
DPR did not achieve its goal to attain a 90% fill rate
• Only 3% of staff might have been affected by promotional opportunities
• This is only 76% of the total number of positions it aimed to fill in FY 2017
• DPR achieved an 86.9% fill rate in FY 2016 and an 86.0% fill rate in FY 2017

Chapter 2: DPR Did Not Achieve Its Seven Performance Metrics
15
rate because of high turnover in entry-level positions. The high turnover in entry-level positions was exacerbated by the use of personal services contracts to meet staffing needs.
We found that DPR relies heavily on personal services contracts to fill its staffing needs. The use of personal services contracts is not effective in retaining staff, encourages high turnover, and may increase personnel costs going forward. In FY 2015, efforts began to right size the city government by the administration. Each department identified which positions could be deactivated and the managing director determined the number of deactivated positions. For FY 2015 and FY 2016, DPR authorized staffing was reduced by 87 Full Time Equivalents (FTE) which should have resulted in cost savings to the city of $7.1 million. (See exhibit 2.5.) However, in order to meet its operational needs, DPR relied on filling temporary unbudgeted positions that cost the city nearly $1.5 million, nearly 22 percent of the original cost savings of $7.1 million from deactivating the positions.
Exhibit 2.5 Total Number of DPR Temporary Unbudgeted Position Requests
Source: Office of the City Auditor analysis of City and County of Honolulu DocuShare data
Fiscal Year
% Change from Prior
Year% Change from
Prior YearDeactivated
PositionsTotal Salary
Cost Savings 2015 9.5 - $343,969.80 - 87 $3,579,023.002016 54.5 473.68% $1,186,853.56 245.05% 87 $3,501,228.00Total 64 $1,530,823.36 $7,080,251.00
Total # of Temporary Unbudgeted Positions
Requested
Total Costs Associated with Temporary
Unbudgeted Position Requests
The department used temporary positions to fill critical staffing needs that reduced the cost savings from deactivated positions and created an environment which does not support employee retention. For example, to fill vacancies, DPR requested 64 unbudgeted, temporary positions in the form of personal services contracts that did not lead to permanent positions. The temporary hires were recruited because DPR’s authorized, budgeted staffing was reduced by 87 positions in FY 2015 and FY 2016, respectively. Per city budget guidance and state law, personal services contracts should be used only for critical operational requirements.
• DPR relies heavily on personal services contracts to fill staffing needs

Chapter 2: DPR Did Not Achieve Its Seven Performance Metrics
16
DPR’s unbudgeted temporary positions requests trended upward in FY 2016, increasing by 45 positions which cost the city $842,884 more than the prior fiscal year. From FY 2015 to FY 2016, 64 temporary unbudgeted positions cost the city $1.5 million. In other words, nearly 22 percent of cost savings realized by reducing permanent FTE staffing was offset by the cost for temporary hires. Although the department claims it was able to absorb the increasing salary costs within its existing budget, we question whether the department can sustain it over time.
In our opinion, this alternative method of recruitment is conducive to high turnover. For example, for personal service contract positions, the limited-term workers would seek more permanent positions with better benefits and more employment security. They would also seek other city jobs with a better career path. If the department continues to rely on temporary, unbudgeted positions to meet its personnel needs, it is unlikely to retain employees and maintain a 90% fill-rate.
Example: Groundskeepers are needed
Of the 64 temporary, unbudgeted positions requested between FY 2012 and FY 2016, we found that 56 of them were for groundskeeper positions which cost the city about $1.3 million. In our opinion, the vacancies in park maintenance affected DPR’s ability to properly maintain parks, make necessary repairs, and support the mayor’s park priorities. DPR noted that filling positions has not kept pace with the resignation rate. DPR managers stated it has experimented with a mass recruitment for groundskeepers to offset the resignation rate, but it is still analyzing the efficiency of this recruitment method. Exhibit 2.6 details the number and cost of temporary groundskeepers.
• Nearly 22% of cost savings realized by reducing permanent FTE staffing was offset by the cost for temporary hires
• 62 groundskeepers cost the city about $1.4 million

Chapter 2: DPR Did Not Achieve Its Seven Performance Metrics
17
The DPR performance metric was to identify public awareness and satisfaction with City parks facilities and recreational programs; and to collect data to assist in developing medium and long-range plans. DPR’s original performance metric included establishing a strategic plan to identify public perceptions and to develop medium and long-range plans that addressed these issues in FY 2016. The department subsequently clarified that the strategic plan would be completed in 2017.
As of February 2018, DPR had not attained these goals. The delay was caused by the survey vendor needing additional time to analyze data, obtain input from department personnel, and draft the requisite plans. More specifically:
• DPR contracted a vendor, SMS Research and Marketing Services, Inc., to conduct a survey at a cost of nearly $100,000. The vendor initiated the survey in October 2015 of 8,000 residents on O`ahu (2,000 per park district), and a total of 1,577 surveys were completed.
• The vendor is currently gathering input from DPR management, staff, and community stakeholders to assist in drafting the medium and long-range strategic plans.
Because of the extra time needed by the vendor, DPR lacks medium and long range plans for improving city park facilities and recreational programs. As a result, DPR will not be able to focus its efforts on improving operations as was originally intended, and park customers (i.e. taxpayers) will not see timely improvements in parks and park programs.
Exhibit 2.6 Total Number of DPR Temporary Unbudgeted Position Requests Which Consist of Groundskeeper Positions
Source: Office of the City Auditor analysis of City and County of Honolulu DocuShare data
Performance Metric 3: Public Awareness, Satisfaction, and Planning Goals Were Not Fully Attained
Fiscal Year
% Change from Prior Year
% Change from Prior Year
2015 6 - $215,838.00 -2016 50 733.3% $1,048,530.00 385.8%Total 56 $1,264,368.00
Total # of Temporary Unbudgeted Positions
Requested for Groundskeepers
Total Costs Associated with Temporary Unbudgeted Position Requests for
Groundskeepers
• DPR lacks strategic plans to improve city parks and recreation programs

Chapter 2: DPR Did Not Achieve Its Seven Performance Metrics
18
The DPR performance metric to complete implementation of new registration and point-of-sale systems for class registration and use of facilities by January 2018 was not achieved.
The current DPR registration and point-of-sale software, Safari, is no longer supported by the vendor and is obsolete. DPR is working with the Department of Information Technology (DIT)6 to develop and implement the new Parks and Recreation Online System (PROs) which is supposed to provide new registration and point-of-sale system for class registration. PROs is meant to be rolled out as part of the city’s Lokahi project7.
DPR estimated that the new PROs project was approximately 20% to 30% complete. However, DIT estimated more conservatively that the project was only 10% complete. No milestones for completion have been established for the project and DIT cautioned that the needs of DPR kept changing. As a result, DPR cannot ensure the systems will be in place for collecting future revenues, improved customer services, or streamlined operations.
The Department of Parks and Recreation created a performance metric that would establish a street and park tree inventory and work order program for the Division of Urban Forestry (DUF) by June 2017. DPR did not achieve its metric to complete implementation of a street and park tree inventory and work order program by June 2017.
The city currently has three incomplete and obsolete inventories. DPR did not submit a work request to begin automation of its work order program until November 2017, after the June 2017 deadline. As a result, DPR does not have an accurate inventory of city street and park trees, and does not have a reliable work order
Performance Metric 6: New Registration and Point-Of-Sale Systems for Class Registration and Facilities Use Were Not Implemented
6 The Department of Information Technology (DIT) manages all of the city’s IT resources, and develops and directs an integrated system of computer resources that provides data processing and telecommunications services to all city agencies and authorized users.
7 Lokahi aims to integrate departmental management and workflows for city agencies into a single tool, fostering collaboration and reducing silos. It provides transaction processing, monitoring, research, training, testing, and automation in a single tool.
Performance Metric 7: New Street and Park Tree Inventory and Work Order Programs Were Not Implemented
• The project is only 10% - 30% complete
• DPR lacks an inventory of its street and park trees

Chapter 2: DPR Did Not Achieve Its Seven Performance Metrics
19
system. These deficiencies could create problems for DPR and the city. More specifically:
• The DPR Department of Urban Forestry (DUF) does not have sufficient resources and internal controls to effectively manage the city’s tree inventory and to protect the city from potential liability claims.
• DPR cannot ensure that tree safety actions are adequate to reduce potential liability to the City.
• DPR cannot realize cost savings and operations are efficient or effective without a searchable street and tree inventory database.
• DPR cannot quickly ensure projects are completed without an automated, centralized work order program that can provide the present status of individual trees.
The lack of a comprehensive tree inventory could have a financial impact to the city. Between July 2008 and June 2017, the city paid a total of $239,430 for 316 tree-related claims. These 316 tree-related claims were 51% of 627 total claims made against DPR between July 2008 and June 2017. Although we were unable to definitively tie the tree-related claims and lawsuits to the lack of an accurate tree inventory, we believe if DPR had a current street and park tree inventory and an automated work order program to handle tree emergencies, the city could avoid potential, future liability claims.
Currently, the city has two separate databases for its tree inventory. Neither are accurate or properly updated. More specifically:
• According to DPR, the city had 241,974 trees in its inventory as of FY 2016. DPR staff said the FY 2016 count was likely inaccurate because the original number of trees (baseline) is unknown.
• DPR staff used historical data and added or subtracted trees from the inventory based on the number of trees that were removed or added that year.
• The city’s GIS database (ARCGIS) reports that the city has 82,163 trees in its inventory. However, the database has not been updated since 2002; is limited to specific areas
The Division of Urban Forestry does not have an accurate database of city-owned trees

Chapter 2: DPR Did Not Achieve Its Seven Performance Metrics
20
(from Hawaii Kai to Makaha; Wahiawa; and Kahalu`u to Kailua); and does not cover the entire island of O`ahu.
Additionally, partnered with citizen volunteers 8,, DPR began a pilot project in 2016 to establish an inventory of city-owned trees. The group began by inventorying trees along city streets in Kailua.
• The group of 8 to 10 volunteers canvased neighborhoods to inventory, inspect, and catalogue trees. According to a volunteer, their Kailua inventory contained approximately 4,000 trees as of January 2018.
• A volunteer estimated the volunteer group can inventory about 2,000 trees a year and estimated that it would take 10-20 years to inventory all city-owned trees on O`ahu.
The following exhibits show Citizen Forestry volunteers taking an inventory of trees. While the volunteer group has done a commendable job in cataloging trees and assisting the city with its tree inventory, in our opinion this is not an efficient way for the city to inventory its trees. DPR could use drone or satellite technology, as well as statistical methods, to establish a more accurate and timely inventory of trees and to achieve its performance goal sooner. The citizen volunteer estimated that utilizing drone technology, which could be operational in two years, has the potential to inventory 100,000 trees at a cost of $25,000.
8 The Citizen Forester program looks to use citizen volunteers to help develop an urban tree inventory. A formal inventory of trees currently does not exist in Hawaii. The inventory would be used to manage, maintain, and replace trees; and plan for disasters in the urban forest. The Citizen Forester program trains and supports community volunteers to collect urban tree inventory data. Certified Arborists support the volunteers and ensure quality control of the data. Volunteers work in small teams with a trained Team Leader to collect data. The program was piloted in 2016 in Kailua and is now expanding to new communities. The project includes a systematic inventory of city trees in urban areas, such as along commercial and residential streets and in parks.
• At the current rate it will take 10-20 years to inventory all street and park trees

Chapter 2: DPR Did Not Achieve Its Seven Performance Metrics
21
Exhibit 2.7 Citizen Forestry Volunteers Inventorying Trees
Source: Office of the City Auditor
The DPR performance metric was to complete the automated work order system by June 2017. To automate the manual tree work order process DPR must submit a work request to DIT. DPR did not submit the work request to DIT until November 2017, after the goal deadline. In addition, other city and DIT priorities contributed to the project’s delay. As a result, the DPR Urban Forestry Division (DUF) continues to rely on an outdated manual process that lacks accountability.
The current work order process for tree maintenance and repair is based on manual forms that staff complete in the field. We observed the DUF office and found that paper forms (three-
DPR did not transition to an automated work order system and continues to rely on an antiquated manual system
• The current work order process is very manual and cumbersome

Chapter 2: DPR Did Not Achieve Its Seven Performance Metrics
22
part carbon copy) are disbursed among various staff for review, execution, and filing. The forms are not always kept sequentially or chronologically. This makes it difficult for staff to know the status of various trees throughout the city’s inventory. For example, we asked a staff person if we could know when a particular coconut tree on Kalakaua Avenue in Waikiki was last serviced. We also asked to review the tree maintenance record. The staff member stated, although possible, there was no comprehensive way to determine the history of the tree. Staff would have to sort through manual slips of paper to put together a timeline and a maintenance record.
Exhibit 2.8 describes Urban Forestry Division’s current manual tree work order process. In our opinion, an automated, technology-based work order system would improve the process, increase accountability, and allow the division to more effectively manage tree maintenance.

Chapter 2: DPR Did Not Achieve Its Seven Performance Metrics
23
Exhibit 2.8 DPR Tree Work Order Process
Source: Office of the City Auditor analysis of DPR information

Chapter 2: DPR Did Not Achieve Its Seven Performance Metrics
24
This page intentionally left blank.

Chapter 3: The Department of Parks and Recreation Did Not Develop Measurable and Achievable Goals Because it Did Not Follow Best Practices
25
Chapter 3 The Department of Parks and Recreation Did Not Develop Measurable and Achievable Goals Because it Did Not Follow Best Practices
We found that the Department of Parks and Recreation did not achieve its performance metrics because it did not follow best practices in developing appropriate performance metrics. As a result, the department established metrics that were not measureable, were dependent on other city agencies to achieve success, and were unrealistic to achieve. Going forward, the department should consider established best practices to develop appropriate performance metrics that can be used to improve operations, efficiency, and transparency to stakeholders.
We identified two resources useful for developing performance metrics (see Appendix A.)
• A National State Auditor’s Association best practices document, Best Practices in Performance Measurement: Part 1: Developing Performance Measures, 2004.
• The National Performance Management Advisory Commission, A Performance Management Framework for State and Local Government, 2010 and
The best practices provide a framework for developing measurable and achievable performance metrics and goals.
• According to Best Practices in Performance Measurement: Part 1: Developing Performance Measures, before beginning the process of developing performance measures, public program managers must first know what they are measuring. This involves developing a mission statement, establishing goals, setting objectives, and developing an action plan1. We found no evidence that DPR considered these basic strategic elements when it developed its performance metrics.
Best Practices for Performance Measurement in Government Established
1 An action plan is also known as an operational plan or a business plan.

Chapter 3: The Department of Parks and Recreation Did Not Develop Measurable and Achievable Goals Because it Did Not Follow Best Practices
26
• Standards state the metrics must be measurable or monitored. Three of seven DPR performance metrics could not be measured and five of seven are not sufficiently monitored.
• Best practices state external constraints must not inhibit department performance. DPR did not consider external constraints such as the Human Resources and Information Technology departments and the processes that delayed the department’s ability to meet its performance metrics.
If DPR is to achieve its current or future performance metrics, DPR will need to implement best practices such as linking performance metrics to its mission or plans; using performance metrics that are measurable or can be monitored; and identifying external constraints that inhibit department performance.
The Department of Budget and Fiscal Services (BFS) required city agencies to establish performance metrics. We found that BFS did not provide sufficient references and resources to provide guidance or best practices for DPR to follow when developing performance metrics. As a result, DPR did not develop measureable and achievable performance metrics, and missed an opportunity to utilize performance metrics to improve operations, efficiency, and transparency to stakeholders.
In an August 2014 memo to all city departments, the Budget and Fiscal Services Department issued a guideline to all city agencies related to the FY 2016 Operating Budget Request Guidelines:
Agencies are to develop meaningful performance measures which are focused on customer service and programs which support other priorities such as park beautification, sewer and road improvements, bus services, addressing homelessness and transit-oriented development (TOD). These performance metrics will help to evaluate the programs and the need for resources for these priority areas.
We found that there were no guidelines, specifications, or templates provided to establish performance metrics related to best practices. As a result, DPR performance metrics, in our opinion, did not conform to best practices and the performance metrics were insufficient to help improve operations, customer service, or accountability. If DPR is to achieve its current or future
The Department of Budget and Fiscal Services Can Provide Better Guidance

Chapter 3: The Department of Parks and Recreation Did Not Develop Measurable and Achievable Goals Because it Did Not Follow Best Practices
27
performance metrics, BFS will need to provide better guidance and reference materials that ensure DPR follows best practices.
Best practices in establishing performance metrics suggest:
• Performance measurement should be built on a clear organizational mission.
• Agency managers should develop clear goals for the organization as a whole and its individual programs that follow the organization’s mission.
• Objectives should be established which are more specific than goals in that they provide measurable targets to be accomplished. Those objectives should include a degree or type of action to be taken along with a timetable for accomplishment. Results for each objective must be measureable and each must be realistic and achievable.
• Objectives should be established through the development of action plans. Performance metrics should be developed as part of the action plan, with at least one outcome measure being established for each objective.
Although DPR stated a consultant provided training in performance metrics, we could not relate the DPR metrics to the best practices. For example, the DPR performance metrics are not linked to its mission statement. The Department of Parks and Recreation’s mission is to provide parks and recreational services and programs that enhance the quality of life for the people in the City and County of Honolulu. We found that the DPR performance metrics did not directly relate to this mission. Rather, the performance metrics established by the department appeared to focus on its internal operations rather than direct benefits for park users.
DPR did not follow best practices to have performance metrics related to action plans. DPR did not have any plans. As a result, the organizational and program goals were not related to medium and long-term plans. We found no evidence that DPR had developed performance metrics recommended by the best practices.
DPR’s Performance Metrics Were Not Linked to the Department’s Mission or Specific Plans
• Performance metrics should be based on department’s mission or business plans

Chapter 3: The Department of Parks and Recreation Did Not Develop Measurable and Achievable Goals Because it Did Not Follow Best Practices
28
According to A Performance Management Framework, performance management should overarch department priorities; objectives should be set through a planning process; and the department should establish high-level performance measures and targets. Strategies for achieving the objectives are set through strategic planning or budgeting processes. Program, service, or organizational unit objectives and measures are developed that align with the overarching objectives and strategies.
A complete performance management system must include a performance approach to budgeting. Rather than developing budgets from the previous year’s expenditures, funding is allocated according to priorities and information about what actions are effective in reaching desired results. Although DPR claimed that their performance metrics could be linked back to their budget, we could not find evidence linking the department performance metrics to its budget.
Management should also establish a baseline by which to monitor performance metrics and should perform ongoing monitoring and separate evaluations. Ongoing monitoring is built into the entity’s operations, performed continually, and is responsive to change.
• We found three of the seven metrics could not be measured (identify public awareness and satisfaction with city park facilities and recreational programs and collect data to assist in developing medium and long-range plans; create fill positions requested in FY 2017; and attain a 90 percent fill rate for Park Maintenance and Recreational Service Division).
• We also found five of the seven metrics were not adequately tracked or monitored.
According to Best Practices in Performance Measurement: Part 1: Developing Performance Measures, input should be obtained from staff members at all levels when the department is developing performance measures. According to the Director of DPR, all levels of the staff were involved in establishing DPR’s performance metrics, starting with the division heads down to the entry level staff. The process was informal, with the executives shaping it at the end.
Performance Metrics are Not Always Measureable or Sufficiently Monitored
DPR Needs to Include Staff and Park Users When Developing Performance Metrics
• 3 of 7 metrics could not be measured
• 5 of 7 metrics were not tracked or monitored

Chapter 3: The Department of Parks and Recreation Did Not Develop Measurable and Achievable Goals Because it Did Not Follow Best Practices
29
However, in our discussions with DPR division heads, two indicated that performance metrics were established from the top-down by senior managers who focused on operations and excluded any input from lower level staff2. During our interviews, middle-level staff and lower-level staff confirmed the department performance metrics were established without any input from them. As a result, DPR staff were not aware of the department performance metrics and were not actively working to achieve the metrics.
According to Best Practices in Performance Measurement: Part 1: Developing Performance Measures, input should be obtained from customers when management is developing performance measures. We found DPR did not solicit customer input when DPR developed its performance metrics. As a result, DPR cannot ensure the park services, facilities, and programs are compatible, adequate, or satisfy the needs of park users, local residents, and others.
According to Best Practices in Performance Measurement in Government, when developing performance measures, the department should consider whether there are any external constraints to implementation of the objective which is related to a performance measure.
Most of DPR’s performance metrics (6 out of 7) were constrained by the resources of other city departments. For instance, DPR was dependent on the Department of Human Resources (DHR) to achieve its three performance metrics focused on filling position vacancies. DPR was also dependent on the Department of Information Technology (DIT) for the automated projects listed in the DPR performance metrics - i.e. the new registration and point-of-sale systems, the street and park tree inventory, and the work order program.
Although DPR stated a consultant provided training in performance metrics, DPR did not follow best practices related to identifying and considering external constraints prior to developing their performance metrics. As a result, DPR performance metrics did not incorporate potential DHR or DIT constraints (e.g. time, resources, and competing priorities) that prevented DPR from achieving its goals.
2 One division head was not familiar with the process as this person was new to the role.
DPR Needs to Consider External Constraints Prior to Developing Performance Metrics
• DPR does not solicit input from staff or customers about its metrics
• 6 of 7 metrics are constrained by other city departments

Chapter 3: The Department of Parks and Recreation Did Not Develop Measurable and Achievable Goals Because it Did Not Follow Best Practices
30
Exhibit 3.1External Constraints Which Influenced DPR Performance Metrics
Source: Office of the City Auditor analysis
Performance Metric for FY15 Goal Constraint
1 Decrease the amount of potable water used at City parks.
Decrease the amount of potable water used at City parks by 5% per year.
Managing Director’s Office (MDO) & Board of Water Supply (BWS)
2 Increase efficiency in filling vacant job positions.
Complete 90% E-forms submitted within 10 days of the position becoming vacant. Complete 90% of the packets for positions interviewed within 10 days after receiving the list of eligible candidates.
Dependent on Department of Human Resources (DHR) to achieve.
3
Identify public awareness and satisfaction with City parks facilities and recreational programs, and collect data to assist in developing medium and long-range plans.
Establish a strategic plan to identify public perception and develop a plan to address issues.
Outside Vendor contracted to conduct the survey and draft medium and long-range plans
Performance Metric for FY17 Goal Constraint
4 Create and fill positions requested in FY17.
FY17: Fill 29 positions by January 2018.
Dependent on Department of Human Resources (DHR) to achieve.
5Attain a 90% fill rate for Park Maintenance and Recreation Service Division
FY17: Attain a 90% fill rate by June 2017.
Dependent on Department of Human Resources (DHR) to achieve.
6
Complete implementation of new registration and point-of-sale systems for class registration and use of facilities.
FY17: Completed by January 2018.
Department of Information Technology (DIT)
7Complete implementation of new street and park tree inventory and work order program in FY17
FY17: Establish a street and park tree inventory and work order program for the Division of Urban Forestry by June 2017.
Department of Information Technology (DIT)
Other Parks and Recreation Jurisdictions Have Established Appropriate Performance Metrics
Other jurisdictions (Appendices B to F) report performance metrics can be value-added if they are:
• Measureable
• Reported over time

Chapter 3: The Department of Parks and Recreation Did Not Develop Measurable and Achievable Goals Because it Did Not Follow Best Practices
31
• Relevant to the stakeholders (such as city departments, taxpayers, city councils, etc.)
• Formally reported for the public to review.
For example:
The City of San Mateo, CA established three performance metrics for its County Parks that were measureable, benchmarked, and reported over time. These included the:
• Number of annual park visits: benchmark of 2.5 million visitors for FY16-FY18. Visitor counts were published since FY14.
• Number of annual volunteer hours: benchmark of 30,000 hours. In FY18, the department recorded 40,275 hours, which exceeded its benchmark goal. The department also estimated the value of those volunteer hours at nearly $1.15 million, with a disclosed methodology of the hourly volunteer rate of $28.46 per hour.
• Percent of customer survey respondents rating service good or better: benchmark goal of 85% for FY17; 90% for FY18. In addition to disclosing the survey methodology, the department shared that it had a 93% satisfaction rating in FY18 (90% was the target). Comparatively, Honolulu’s metric to identify public awareness and satisfaction with city parks facilities and recreational programs, and collect data to assist in developing medium and long-range programs does not have the same measurable elements over time.
The City of Williamsburg Parks, Recreation, and Culture department established performance metrics that were measureable:
• Increase Farmer’s Market Sales by 5% from $1 million by December 2016. The department reported that its June 2017 sales of $1,109,453 exceeded its target of $1,050,000. The dashboard showed monthly sales figures for the public to see.
• Increase average Waller Mill Park attendance by 5% from 8,800 visitors by June 2018. In December 2017, the department reported 8,889.67 visitors. Overall trend shows a decline in park visitors and the department can
San Mateo, CA
Williamsburg, VA

Chapter 3: The Department of Parks and Recreation Did Not Develop Measurable and Achievable Goals Because it Did Not Follow Best Practices
32
take action to reverse that trend, rather than merely report that it missed its mark.
• Increase total recreation program participation by 3% from 5,086 users by June 2018. As of December 2017, department reported 17,495 users, well ahead of its June 2018 goal.
The City of Dallas, TX’s parks department established three measureable performance metrics:
• Established a target for Revenue per Reservation for athletic fields ($31.37). The city reports monthly performance. In December 2014, the average revenue per reservation was $55.84; in April 2015 it was $38.30. This information provides the department important information to improve operations and adjust marketing.
• Established a target for percent of survey respondents who rate overall visitor experience as good or excellent (85%). Monthly reports showed a range of 89.5% in November 2014 to 86.9% in April 2015.
• Established a target of percentage of monthly graffiti requests resolved within 3 working days (95%). Monthly reports show a range of 99.29% to 100% within a one-year period.
These examples show how other jurisdictions are establishing, and reporting, measurable performance metrics that are important to stakeholders. The information is useful to park management so that they can improve operations and allocate resources to high need areas.
The governing bodies (i.e. city councils and other elected officials) use the information to guide allocation of resources (budgets); gauge how government is providing services to its citizens; and determine what the public thinks about those services. For taxpayers, performance metric reports provide information needed to evaluate government services based on the taxes expended, and provide transparency in government expenditures and services provided. (See Appendices A through E for detailed examples of performance metrics and reporting.)
Dallas, TX

Chapter 4: Conclusions and Recommendations
33
Chapter 4 Conclusions and Recommendations
Measureable performance metrics are important to all city departments because they enable them to set achievable goals that can help improve operations, strategic planning, transparency, and accountability. This means that it is also important that these metrics serve the interests of DPR’s customers, or taxpayers, as well.
Incorporating performance metrics into agency operations, budgeting, and strategic planning is a progressive trend for municipalities today. They have the potential to maximize use of resources, streamline operations, improve customer service, elevate transparency to taxpayers, and ensure that the mayor’s priority for re-establishing pride in city parks is met.
Focusing on DPR’s performance metrics and how they were developed is perhaps more significant due to the recent announcement that the City and County of Honolulu was selected as one of five new cities to participate in Bloomberg Philanthropies’ national What Works Cities Initiative. This initiative is one of the largest-ever philanthropic efforts to enhance the use of data and evidence in the public sector. This makes ensuring that city departments are collecting appropriate data to perform analysis in order to gauge their performance even more relevant.
We commend the department for incorporating performance metrics into its operations. However, improvements are needed if the department is to realize any meaningful change in operational effectiveness or efficiency. A good place to start is utilizing best practices to develop their performance metrics.
The department should be focused on guiding, educating, and training staff at all levels in order to foster employee ownership over performance goals and metrics which will better benefit the organization and the taxpayer by improving the quality of parks and park programs. This would also improve overall government accountability to the public.
DPR has set many performance metrics that are constrained by external factors, which leaves the department in a position where it is unable to control whether or not it achieves set metrics. Achieving priority metrics such as filling vacant positions, implementing point-of-sale and registration systems, and implementing a street park and tree inventory and work order

Chapter 4: Conclusions and Recommendations
34
program depends largely on other departments such as DHR and DIT and their respective time, resources, and priorities.
Because it has not followed best practices when developing performance metrics, DPR has not achieved any of the performance metrics it has set. At times, the department has set performance metrics that are not measureable, such as developing strategic plans, implementing a new registration and point-of-sale system, and implementing a new street and park tree inventory and work order program. These are more akin to projects in need of milestones than measureable performance metrics. There are also many metrics that are not tracked or monitored sufficiently, or at all, such as potable water usage, increasing efficiency in filling vacant job positions, creating and filling positions requested in FY 2017, establishing a new registration and point-of-sale system, and implementing a new street and park tree inventory and work order program.
DPR’s metrics do not follow existing guidelines to focus on serving the interests of the taxpayer to improve overall park quality, and instead favor departmental operations because they were largely developed by senior management without significant input from lower-level employees. We encourage the department to establish performance metrics that are relevant and important to park users.
We recommend that the Department of Parks and Recreation:
1. Follow best practices when developing performance metrics such as:
a. ensuring elements of strategic planning (i.e. mission, goals) are considered and connecting metrics to the budget and/or strategic or operational plans;
b. ensuring all metrics can be measured and are base lined;
c. ensuring that staff from all levels are involved;
d. ensuring customer input (i.e. taxpayer) is solicited and metrics are customer-driven;
Recommendations

Chapter 4: Conclusions and Recommendations
35
e. ensuring there are methods to track and monitor on an ongoing bases whether metrics will be achieved; and
f. ensuring that external constraints are considered prior to the establishment of departmental performance metrics.
2. establish metrics which are possible to achieve and realistic given current resources;
3. establish performance metrics that can be measured over time, rather than establishing projects as metrics;
4. develop action plans, benchmarks, and milestones to achieve performance metrics; and
5. report on the status of performance metrics at regular intervals so that stakeholders (department staff, administration, city council, and park users) can monitor the department’s progress in meeting performance metric goals.
We recommend that the Department of Budget and Fiscal Services:
6. provide departments references and resources that provide detailed guidelines or training for establishing, monitoring, and reporting performance metrics that are consistent with best practices.
The Managing Director agreed with our recommendations and indicated that our methodology for establishing performance metrics was sound. On behalf of the Department of Budget and Fiscal Services, the Managing Director stated future guidance, resources, and assistance would be provided to departments in order to ensure effective performance metrics are developed. The Managing Director and Department of Parks and Recreation comments were responsive to the audit recommendations.
We made technical, non-substantive changes to the draft report for purposes of accuracy, clarity, and style. We thank the Managing Director, the Department of Parks and Recreation, and the Department of Budget and Fiscal Services for their assistance during the audit. A copy of management’s full response can be found on page 36.
Management Response

Chapter 4: Conclusions and Recommendations
36

Chapter 4: Conclusions and Recommendations
37

Chapter 4: Conclusions and Recommendations
38

Appendix A: Performance Metrics Best Practices
39
Appendix A Performance Metrics Best Practices
A National State Auditor’s Association best practices document, Best Practices in Performance Measurement: Part 1: Developing Performance Measures, 2004
• A system of performance measurement should be built on a clear organizational mission.
• Agency managers should develop clear goals for the organization as a whole and its individual programs that follow the organization’s mission.
• Objectives are more specific than goals in that they provide measurable targets to be accomplished. Good objectives should flow from the established goals and include a degree or type of action to be taken along with a timetable for accomplishment.
o Results for each objective must be measureable, and
o Each objective must be realistic and achievable.
• We should ask if there are any external constraints to implementation to ensure that objectives are clear, concise, measureable, and can be implemented.
• Strategic objectives should be established through the development of action plans.
• Performance measures should be developed as part of the action plan. There should be at least one outcome measure for each objective.
• A good process for developing performance measures would include:
o Obtain input from staff members at all levels;
o Obtain input from customers; and
o Obtain input from policy makers.
These best practices can be found at: https://www.doh.wa.gov/Portals/1/Documents/1000/PMCBest_Practices_in_Performance_Measurement_Part_1.pdf.

Appendix A: Performance Metrics Best Practices
40
The National Performance Management Advisory Commission, A Performance Management Framework for State and Local Government, 2010:
Overarching priorities are set through a planning process, along with high-level performance measures and targets. Strategies for achieving the objectives are set through strategic planning or budgeting processes. Program, service, or organizational unit objectives and measures are developed that align with the overarching objectives and strategies.
A complete performance management system must include a performance approach to budgeting. Rather than developing budgets from the previous year’s expenditures, funding is allocated according to priorities and information about what actions are effective in reaching desired results.
This framework can be found at: http://www.gfoa.org/sites/default/files/APerformanceManagementFramework.pdf.

Appendix B: Example of Performance Metrics and Reporting
41
Appendix B Example of Performance Metrics and Reporting
Kirkland, Washington
MEASURE 2012 2013 2014 2015 2016 Target
FTE staff for parks maintenance and recreation programs
49.43 56.24 59.69 59.76 60.15 N/A
Park maintenance FTE’s per 100 acres developed land
4.65 5.05 5.44 5.48 5.48 N/A
Number of volunteers 2,439 2,306 3,012 3,216 3,196 N/A
Volunteer hours 13,901 17,997 19,266 19,431 20,417 N/A
Parks Capital Improve-ment Program $1,028,000 $3,537,578 $3,823,583 $3,552,615 $3,677,400 N/A
Parks Operating & Maintenance Funding $4,135,489 $4,969,719 $5,097,601 $5,900,339 $5,951,738 N/A
Recreation Operating & Maintenance Funding $2,067,630 $2,176,292 $2,198,858 $2,326,789 $2,788,816 N/A
Residents with neighbor-hood park within 1/4 mile radius
68% 68% 68% 68% 68% 100%
Acres of natural area in restoration 40.3 48.5 58.6 64.5 80
487 acres by
2035
Percent of recreation classes meeting mini-mum enrollment
83% 81.6% 85.4% 87.3% 82% 80%
Residents rate City parks as satisfactory or better 96% * 95% * 95% 95%
* Community Survey occurs in even years
HOW DO WE MEASURE PARKS AND RECREATION SERVICES?The budget and number of FTE staff available to the Parks Department helps measure how often the City is able to maintain the parks. Given the important contribution that volunteers make to the City’s work, the number of volunteers and their total number of hours are also tracked.
The Park, Recreation and Open Space (PROS) Plan sets targets that provide benchmarks by which to measure the development and mainte-nance of Kirkland’s parks and natural spaces, including:
• Residents should have access to a neighborhood park within a quarter mile of their home
• All 487 acres of natural areas should be restored to their natural state by 2035
Recreation services are measured by subscription rates. Tracking recreation class attendance demonstrates how well they match residents’ preferences.
Community satisfaction with the parks, as determined by the Community Survey, provides another measure of how well the park system meets the community’s needs.
Provide and maintain natural areas and recreational facilities and opportunities that enhance the health and well-being of the community.
Parks and Recreation
Staff and volunteers maintain parks
and manage recreation programs
City invests in parks and recreational programs
City progresses on the Park, Recreation and Open
Space Plan
Kirkland has an exceptional parks and recreation system
So that...
So that...
So that...
GOAL
16
Appendix B: Example of Performance Metrics and Reporting
42
Source: City of Kirkland, Washington website
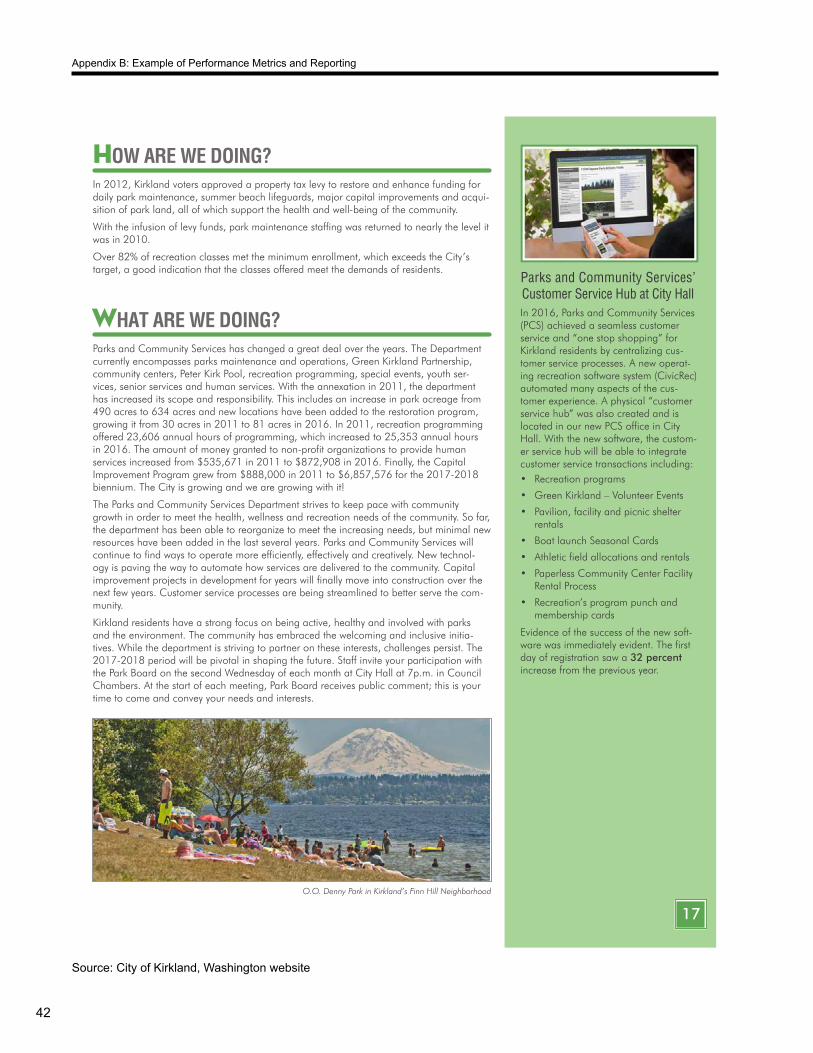
In 2016, Parks and Community Services (PCS) achieved a seamless customer service and “one stop shopping” for Kirkland residents by centralizing cus-tomer service processes. A new operat-ing recreation software system (CivicRec) automated many aspects of the cus-tomer experience. A physical “customer service hub” was also created and is located in our new PCS office in City Hall. With the new software, the custom-er service hub will be able to integrate customer service transactions including: • Recreation programs
• Green Kirkland – Volunteer Events
• Pavilion, facility and picnic shelter rentals
• Boat launch Seasonal Cards
• Athletic field allocations and rentals
• Paperless Community Center Facility Rental Process
• Recreation’s program punch and membership cards
Evidence of the success of the new soft-ware was immediately evident. The first day of registration saw a 32 percent increase from the previous year.
In 2012, Kirkland voters approved a property tax levy to restore and enhance funding for daily park maintenance, summer beach lifeguards, major capital improvements and acqui-sition of park land, all of which support the health and well-being of the community.
With the infusion of levy funds, park maintenance staffing was returned to nearly the level it was in 2010.
Over 82% of recreation classes met the minimum enrollment, which exceeds the City’s target, a good indication that the classes offered meet the demands of residents.
Parks and Community Services has changed a great deal over the years. The Department currently encompasses parks maintenance and operations, Green Kirkland Partnership, community centers, Peter Kirk Pool, recreation programming, special events, youth ser-vices, senior services and human services. With the annexation in 2011, the department has increased its scope and responsibility. This includes an increase in park acreage from 490 acres to 634 acres and new locations have been added to the restoration program, growing it from 30 acres in 2011 to 81 acres in 2016. In 2011, recreation programming offered 23,606 annual hours of programming, which increased to 25,353 annual hours in 2016. The amount of money granted to non-profit organizations to provide human services increased from $535,671 in 2011 to $872,908 in 2016. Finally, the Capital Improvement Program grew from $888,000 in 2011 to $6,857,576 for the 2017-2018 biennium. The City is growing and we are growing with it!
The Parks and Community Services Department strives to keep pace with community growth in order to meet the health, wellness and recreation needs of the community. So far, the department has been able to reorganize to meet the increasing needs, but minimal new resources have been added in the last several years. Parks and Community Services will continue to find ways to operate more efficiently, effectively and creatively. New technol-ogy is paving the way to automate how services are delivered to the community. Capital improvement projects in development for years will finally move into construction over the next few years. Customer service processes are being streamlined to better serve the com-munity.
Kirkland residents have a strong focus on being active, healthy and involved with parks and the environment. The community has embraced the welcoming and inclusive initia-tives. While the department is striving to partner on these interests, challenges persist. The 2017-2018 period will be pivotal in shaping the future. Staff invite your participation with the Park Board on the second Wednesday of each month at City Hall at 7p.m. in Council Chambers. At the start of each meeting, Park Board receives public comment; this is your time to come and convey your needs and interests.
HOW ARE WE DOING?
WHAT ARE WE DOING?
17
O.O. Denny Park in Kirkland’s Finn Hill Neighborhood
Parks and Community Services’ Customer Service Hub at City Hall

Appendix C: Example of Performance Metrics and Reporting
43
Appendix C Example of Performance Metrics and Reporting
San Mateo, California
Source: County of San Mateo, California website
County Parks: Administration (3900B)
Program Outcome StatementEnsure access to open space and park facilities and manage natural and cultural resources
Program Services• Strategic/Master Parks Planning
• Administration and Support
OverviewParks is projecting that about 2.8 million visitors will visit the County's 20 parks through the end of the fiscal year. Visitors come to picnic, camp, use the meeting facilities, tour three historic sites, visit two education centers, hike, bike, and ride horses on 196 miles of trails.The Department also provides support to the Parks and Recreation Commission, the Granada Community Services District, and the San Bruno Mountain Habitat Conservation Plan.
Number of Annual Volunteer Hours Exceeding Target
Percent of Customer Survey Respondents Rating Services Good or Better Exceeding Target
Number of Annual Park Visits Increasing
FY 2017-18 Mid-Year Story Behind PerformanceNumber of Volunteer Hours
It is projected that about 40,275 hours of volunteer time will be donated to Parks by end of FY 2017-18. The increase is attributed to expansion in almost volunteer program. Several Friends groups added programming or special events that generated more volunteer hours. At the same time, the Department's Stewardship Corps, which is in its second year, continues to draw returning and new volunteers. The dollar value for the volunteer hours equates to about $1.15 million based on the independent sector's hourly volunteer rate of $28.46 (as of April 2016 for California).
Number of Annual Park Visitors
Parks is projecting approximately 2.8 million visits to County parks, exceeding the target of 2.5 million for FY 2017-2018. Improved weather conditions and park improvements are the main reasons for exceeding the FY 2017-18 target.
Percent of Customer Survey Respondents Rating Service Good or Better
The Parks Department will begin collecting surveys from park visitors beginning February 2018. Survey results will be reported in time for the FY 2017-18 year-end performance update.
Future Priorities• Use visitor study results to inform management decisions
View Source Data View Source Data
View Source Data
0
20,000
40,000
60,000
MEASURE VALUE FY 2016-18 Target = 30,000 Hours
0
50
100

Appendix C: Example of Performance Metrics and Reporting
44
This page intentionally left blank.

Appendix D: Example of Performance Metrics and Reporting
45
Appendix D Example of Performance Metrics and Reporting
Williamsburg, Virginia
Source: City of Williamsburg, Virginia website

Appendix D: Example of Performance Metrics and Reporting
46
This page intentionally left blank.

Appendix E: Example of Performance Metrics and Reporting
47
Appendix E Example of Performance Metrics and Reporting
Dallas, Texas
* $ Revenue per Reservation (Park & Recreation)
DescriptionAverage revenue per athletic field reservation
NotesIndex Colors / Ranges Legend: • Blue 5 – Excellent 105%• Green 4 – Good 90% • Yellow 3 – Caution 80%• Orange 2 – Poor 75%• Red 1 – Very Poor
Data Table: Previous Year and This Year by Month
Dollars Actual TargetTarget
% Variance
Target Index
Previous Year
Previous Year %
Variance
Previous Year Index
2014/04 -- -- -- -- -- -- --
2014/05 -- -- -- -- -- -- --
2014/06 -- -- -- -- -- -- --
2014/07 -- -- -- -- -- -- --
2014/08 -- -- -- -- -- -- --
2014/09 -- -- -- -- -- -- --
2014/10 $49.63 $31.37 58.2% 158.2% -- -- --
2014/11 $53.97 $31.37 72.0% 172.0% -- -- --
2014/12 $55.84 $31.37 78.0% 178.0% -- -- --
2015/01 $45.50 $31.37 45.0% 145.0% -- -- --
2015/02 $39.37 $31.37 25.5% 125.5% -- -- --
2015/03 $38.19 $31.37 21.7% 121.7% -- -- --
2015/04 $38.30 $31.37 22.1% 122.1% -- -- --
2015/05* $31.37 --
2015/06* $31.37 --
2015/07* $31.37 --
2015/08* $31.37 --
2015/09* $31.37 --
Data Chart: Previous Year and This Year by Month
Index Chart: Previous Year and This Year by Month
Published on: 6/9/2015 11:57:47 AM
Page 1 of 1BIRT Performance Scorecard Measure Details
5/1/2018http://www3.dallascityhall.com/scs/measures/details/84D83BDEAF870D03FD691E05.html
Source: City of Dallas, Texas website

Appendix E: Example of Performance Metrics and Reporting
48
* % Graffiti Reports Resolved (Park & Recreation)
DescriptionPercentage of monthly graffiti requests resolved within 3 working days
NotesIndex Colors / Ranges Legend: • Blue 5 – Excellent 105%• Green 4 – Good 90% • Yellow 3 – Caution 80%• Orange 2 – Poor 75%• Red 1 – Very Poor
Data Table: Previous Year and This Year by Month
Percentage Actual TargetTarget
% Variance
Target Index
Previous Year
Previous Year %
Variance
Previous Year Index
2014/04 99.29% 95.00% 4.5% 104.5% -- -- --
2014/05 99.38% 95.00% 4.6% 104.6% -- -- --
2014/06 99.44% 95.00% 4.7% 104.7% -- -- --
2014/07 99.50% 95.00% 4.7% 104.7% -- -- --
2014/08 99.55% 95.00% 4.8% 104.8% -- -- --
2014/09 99.58% 95.00% 4.8% 104.8% -- -- --
2014/10 100.00% 95.00% 5.3% 105.3% 95.00% 5.3% 105.3%
2014/11 100.00% 95.00% 5.3% 105.3% 97.50% 2.6% 102.6%2014/12 100.00% 95.00% 5.3% 105.3% 98.33% 1.7% 101.7%
2015/01 100.00% 95.00% 5.3% 105.3% 98.75% 1.3% 101.3%
2015/02 100.00% 95.00% 5.3% 105.3% 99.00% 1.0% 101.0%
2015/03 100.00% 95.00% 5.3% 105.3% 99.17% 0.8% 100.8%2015/04 100.00% 95.00% 5.3% 105.3% 99.29% 0.7% 100.7%
2015/05* 95.00% 99.38%
2015/06* 95.00% 99.44%
2015/07* 95.00% 99.50%2015/08* 95.00% 99.55%
2015/09* 95.00% 99.58%
Data Chart: Previous Year and This Year by Month
Index Chart: Previous Year and This Year by Month
Published on: 6/9/2015 11:57:47 AM
Page 1 of 1BIRT Performance Scorecard Measure Details
5/1/2018http://www3.dallascityhall.com/scs/measures/details/C213627CAF870D03FD691E05.html
Source: City of Dallas, Texas website

Appendix F: Example of Performance Metrics and Reporting
49
Appendix F Example of Performance Metrics and Reporting
Maui, Hawai`i
Source: Performance Maui County website

Appendix F: Example of Performance Metrics and Reporting
50
This page intentionally left blank.