Audience profiling report
18
AUDIENCE PROFILING REPORT Steve Mangion Valletta 2018 Foundation 64
Transcript of Audience profiling report

AUDIENCE PROFILING REPORT
Steve MangionValletta 2018 Foundation
64

INTRODUCTION
HEADLINES
The Audience Profiling exercise was undertaken by the Research Department within the Valletta 2018 Foundation, with the purpose of building a comprehensive profile of the audiences attending various Valletta 2018-related events throughout 2018. This profile is based upon an understanding of the sociodemographic characteristics of respondents, as well as their patterns of cultural consumption.
This study took place over a one-year period throughout 2018, using on-site data collection carried out during the events themselves. Detailed results are contained in the appendix, with the main conclusions and implications outlined in the body of the report. To summarise, this report will show the main audience profile per strand.
This study intends to provide a body of data which can have real-world implications upon the local cultural sector, allowing for further understanding of local audiences, their different characteristics and motivating factors, and their basic behavioural patterns in relation to cultural activity.
The headlines from this report are the following:
(a) With just over 30,000 individual responses this is one of the largest and most comprehensive quantitative research project conducted during cultural events.(b) The study analysed audiences at over 80 events across 9 different strands. A full list of events that participated in this study can be found in Annex 1.
The findings are the following:
(a) Most audiences who participated in this exercise were Maltese (61% or 18,594). The remaining 39% of the respondents were non-Maltese of which only 6% were non-European.
With regards to the implications of this project on future research, the following conclusions arise:
(a) The way in which artists and companies undertake or benefit from the research needs further consideration. (b) Several areas have been identified for further research.
65

METHODOLOGY
Pilot Study
A pilot study was carried out by the Research Department prior to 2018. A number of activities were identified throughout 2016 and 2017 and a pilot survey was conducted consisting of 4 demographic questions, 1 marketing question and 5 event-specific linked questions. These surveys were distributed across the identified events using a number of Tal-Kultura volunteers, in collaboration with project managers and organisers.
From this pilot study it emerged that a number of changes were required, both in terms of the format of the survey, as well as in terms of the data collection method. It was decided that the survey would be changed to focus exclusively on the development of an audience profile, rather than the examination of the particular event under survey. Furthermore, a private research company was engaged to coordinate the logistics of the data collection, using data collectors engaged for this specific purpose.
Survey design A conscious decision was taken to focus the survey exclusively upon the audience profiling element, thereby eliminating additional questions related to assessing the quality or perception of the specific event under question. In conjunction with this, it was decided to keep the survey length to a minimum, thereby allowing for minimal disruption to participants’ experiences during the events themselves.
The survey questions themselves were kept homogenous throughout the year in order to ensure comparability between audiences at different events. The survey was composed of ten questions in total, divided as follows:
(a) Core set of 4 standard demographic questions, comparable with other sectorial surveys (b) 1 question related to the marketing and promotion of the event (c) 5 questions related to pull and push factors related to attending events
Data collection
The target population for this survey consisted of an audience of all ages, genders, and nationalities, provided they are part of the audience for the particular Valletta 2018-related event. The collection period was throughout the main cultural events happening in 2018, which started on 20th January 2018 with the Valletta 2018 Opening Ceremony (Erba’ Pjazez) and ended with the Valletta New Year’s Eve Party on the 31st December 2018.
The data collection process was assigned to a private research agency, which engaged data collectors for the specific purpose of collecting data related to this survey. All surveys were collected via the use of e-surveys on tablets given out to audience pre/during/post events, depending on the type of event. The collection of data was done as a supervised self-completion survey with guidance provided to support this process.
The results presented here are not weighted but in summarising most questions either an average (mean) overall results or, occasionally, an ‘average of averages’ has been used in order to provide a fair representation of the different sizes and types of events to strip out unusual outliers or other biases. We are confident that the good responses and samples received across all events make this a rigorous set of results.
66

MAIN FINDINGS
Here we will concentrate on the key findings which have been identified and have relevance for stakeholders and those working in the sector.
Chart 1: All survey responses collected during events, sorted by strand. The majority of the surveys (15,936 or 52%) were collected during the Foundation’s large-scale events, such as the Valletta 2018 Opening Ceremony, the Closing Spectacle, the Valletta Green Festival and other established events such as Notte Bianca and Earth Garden Festival. The remaining (14,456 or 48%) were collected from the various other events within the Foundation’s cultural programme.
Chart 2: Gender mix of the survey participants. 54% (or 16,474) of participants were female, and 45% (or 13,617) of participants were male.
4) The Main Findings Here we will concentrate on the key findings which have been identified and have relevance for stakeholders and those working in the sector. Chart 1: All survey responses collected during events, sorted by strand. The majority of the surveys (15,936 or 52%) were collected during the Foundation’s large-scale events, such as the Valletta 2018 Opening Ceremony, the Closing Spectacle, the Valletta Green Festival and other established events such as Notte Bianca and Earth Garden Festival. The remaining (14,456 or 48%) were collected from the various other events within the Foundation’s cultural programme.
Chart2:Gendermixof thesurveyparticipants.54%(or16,474)ofparticipantswere female,and45%(or13,617)ofparticipantsweremale.
Children&YoungPeople
Community Event Exhibition Film Music Opera Performance VisualArts
StrandCount 973 1783 15936 2640 958 6240 897 862 193
StrandCount% 3% 6% 52% 9% 3% 20% 3% 3% 1%
020004000600080001000012000140001600018000
SurveyParticipation
SurveysCollectedbyStrand
Chart 3: Distribution of survey participants by age group. 67% of respondents (or 20,251) were between 16 and 44 years of age. The highest collection rate was between the ages of 16-30 with 10,665 or 35% of the total respondents. More than a quarter (7,820 or 26%) of participants were over the age of 45.
Chart 4: Nationalities of survey respondents. As expected, the highest percentage of surveys were collected from Maltese nationals (18,277 or 61%).
Female; 16474; 54%
Male; 13617; 45%
Other;320;1%
SurveysCollectedbyGender
16-3035%
31-4432%
45-6018%
61+8%
Under167%
SurveysCollectedbyAgeRange
67

Chart 3: Distribution of survey participants by age group. 67% of respondents (or 20,251) were between 16 and 44 years of age. The highest collection rate was between the ages of 16-30 with 10,665 or 35% of the total respondents. More than a quarter (7,820 or 26%) of participants were over the age of 45.
Chart 4: Nationalities of survey respondents. As expected, the highest percentage of surveys were collected from Maltese nationals (18,277 or 61%). Other respondents identified as British (2,217 or 7%), followed by Italian, German, French and Spanish, which altogether total 7,219 or 17%..
Chart 3: Distribution of survey participants by age group. 67% of respondents (or 20,251) were between 16 and 44 years of age. The highest collection rate was between the ages of 16-30 with 10,665 or 35% of the total respondents. More than a quarter (7,820 or 26%) of participants were over the age of 45.
Chart 4: Nationalities of survey respondents. As expected, the highest percentage of surveys were collected from Maltese nationals (18,277 or 61%).
Female; 16474; 54%
Male; 13617; 45%
Other;320;1%
SurveysCollectedbyGender
16-3035%
31-4432%
45-6018%
61+8%
Under167%
SurveysCollectedbyAgeRange
Other respondents identified as British (2,217 or 7%), followed by Italian, German, French and Spanish, which altogether total 7,219 or 17%.
Chart 5: Comparison between European and non-European respondents (excluding Maltese nationals). From a total of 11,443 non-Maltese respondents, 9,561 or 81% were from the European continent.
Chart 6: Participants’ distribution by locality. Participants were distributed across most localities in Malta, with Birkirkara (7%), Sliema (7%) and Valletta (6%) leading the way.
Maltese British Italian German French Spanish OtherCount 18277 2217 1612 1485 1073 832 4420Count% 61% 7% 5% 5% 4% 3% 15%
02000400060008000
100001200014000160001800020000
SurveyParticipation
SurveysCollectedbyNationality
Count Count%European 9561 81%Non- European 1882 16%
0
2000
4000
6000
8000
10000
12000
SurveyParticipation
SurveysCollectedbyNationalityMix
68

Chart 5: Comparison between European and non-European respondents (excluding Maltese nationals). From a total of 11,443 non-Maltese respondents, 9,561 or 81% were from the European continent.
Chart 6: Participants’ distribution by locality. Participants were distributed across most localities in Malta, with Birkirkara (7%), Sliema (7%) and Valletta (6%) leading the way.
Other respondents identified as British (2,217 or 7%), followed by Italian, German, French and Spanish, which altogether total 7,219 or 17%.
Chart 5: Comparison between European and non-European respondents (excluding Maltese nationals). From a total of 11,443 non-Maltese respondents, 9,561 or 81% were from the European continent.
Chart 6: Participants’ distribution by locality. Participants were distributed across most localities in Malta, with Birkirkara (7%), Sliema (7%) and Valletta (6%) leading the way.
Maltese British Italian German French Spanish OtherCount 18277 2217 1612 1485 1073 832 4420Count% 61% 7% 5% 5% 4% 3% 15%
02000400060008000
100001200014000160001800020000
SurveyParticipation
SurveysCollectedbyNationality
Count Count%European 9561 81%Non- European 1882 16%
0
2000
4000
6000
8000
10000
12000
SurveyParticipation
SurveysCollectedbyNationalityMix
Chart 7: Reasons why survey participants attended events. The main three reasons for attending were, “Type of Event” (10,489 or 34%), “Activity for the Whole Family” (8,793 or 29%) and because it is a “Valletta 2018 Event” (8,157 or 27%).
Birkirkara Sliema Valletta Attard Birzebbuga Bugibba Marsaskal
a Mosta SanGiljan Other
Count 1891 1944 1709 1078 802 770 746 892 930 20490
Count% 7% 7% 6% 4% 3% 3% 3% 3% 3% 62%
0
5000
10000
15000
20000
25000
SurveyParticipation
SurveysCollectedbyLocality
Typeofevent
Valletta2018event
Activityforthewholefamily
Priceofevent Passingby Knowing
Participant Other
Count 10489 8157 8793 1959 3548 3721 1922Count% 34% 27% 29% 6% 12% 12% 6%
0
2000
4000
6000
8000
10000
12000
SurveyParticipation
SurveysCollectedbyMotivation(Q5)
69

Chart 7: Reasons why survey participants attended events. The main three reasons for attending were, “Type of Event” (10,489 or 34%), “Activity for the Whole Family” (8,793 or 29%) and because it is a “Valletta 2018 Event” (8,157 or 27%).
Chart 8: How participants found out about the event. 14,297 or 47% of survey participants stated that they learnt about events, mostly through “Facebook/Social Media”.
Chart 7: Reasons why survey participants attended events. The main three reasons for attending were, “Type of Event” (10,489 or 34%), “Activity for the Whole Family” (8,793 or 29%) and because it is a “Valletta 2018 Event” (8,157 or 27%).
Birkirkara Sliema Valletta Attard Birzebbuga Bugibba Marsaskal
a Mosta SanGiljan Other
Count 1891 1944 1709 1078 802 770 746 892 930 20490
Count% 7% 7% 6% 4% 3% 3% 3% 3% 3% 62%
0
5000
10000
15000
20000
25000
SurveyParticipation
SurveysCollectedbyLocality
Typeofevent
Valletta2018event
Activityforthewholefamily
Priceofevent Passingby Knowing
Participant Other
Count 10489 8157 8793 1959 3548 3721 1922Count% 34% 27% 29% 6% 12% 12% 6%
0
2000
4000
6000
8000
10000
12000
SurveyParticipation
SurveysCollectedbyMotivation(Q5)
Chart 8: How participants found out about the event. 14,297 or 47% of survey participants stated that they learnt about events, mostly through “Facebook/Social Media”.
Chart 9: From the data collected, it shows that the preferred cultural activities are Music (19,155 or 63%), followed by Festivals (13,103 or 43%) and Performances (12,819 or 42%).
Chart 10: We asked our participants if they feel they are the Primary Decision Maker or not when deciding whether to attend an event or otherwise. 22,018 or
Facebook/SocialMedia
TV Radio Newspaper
Emailmailshot
Poster/Banner
Valletta2018
website
Valletta2018
Newspaper
Wordofmouth
Count 14297 4540 2321 2005 1110 3192 2845 881 2676
Count% 47% 15% 8% 7% 4% 10% 9% 3% 9%
0
2000
4000
6000
8000
10000
12000
14000
Surv
eyPar
ticipat
ion
SurveyscollectedbyMarketingEfforts
Performance Music Literature Visualarts/
exhibition Community Festival Design Film
Count 12819 19155 6291 10710 5564 13103 6492 8836
Count% 42% 63% 21% 35% 18% 43% 21% 29%
0
5000
10000
15000
20000
25000
Surv
eyPar
ticipat
ion
SurveysCollectedbyWhatotherCulturalActivitiesdotheyattendto?
70

Chart 9: From the data collected, it shows that the preferred cultural activities are Music (19,155 or 63%), followed by Festivals (13,103 or 43%) and Performances (12,819 or 42%).
Chart 10: We asked our participants if they feel they are the Primary Decision Maker or not when deciding whether to attend an event or otherwise. 22,018 or 73% of respondents stated that they are the primary decision maker. Females lead with 12,196 or 40%.
Chart 8: How participants found out about the event. 14,297 or 47% of survey participants stated that they learnt about events, mostly through “Facebook/Social Media”.
Chart 9: From the data collected, it shows that the preferred cultural activities are Music (19,155 or 63%), followed by Festivals (13,103 or 43%) and Performances (12,819 or 42%).
Chart 10: We asked our participants if they feel they are the Primary Decision Maker or not when deciding whether to attend an event or otherwise. 22,018 or
Facebook/SocialMedia
TV Radio Newspaper
Emailmailshot
Poster/Banner
Valletta2018
website
Valletta2018
Newspaper
Wordofmouth
Count 14297 4540 2321 2005 1110 3192 2845 881 2676
Count% 47% 15% 8% 7% 4% 10% 9% 3% 9%
0
2000
4000
6000
8000
10000
12000
14000
Surv
eyPar
ticipat
ion
SurveyscollectedbyMarketingEfforts
Performance Music Literature Visualarts/
exhibition Community Festival Design Film
Count 12819 19155 6291 10710 5564 13103 6492 8836
Count% 42% 63% 21% 35% 18% 43% 21% 29%
0
5000
10000
15000
20000
25000
Surv
eyPar
ticipat
ion
SurveysCollectedbyWhatotherCulturalActivitiesdotheyattendto?
73% of respondents stated that they are the primary decision maker. Females lead with 12,196 or 40%.
Chart 11: Delving deeper into the previous question, 7,709 or 35% of respondents of those who said “Yes” to whether or not they were the primary decision makers when deciding whether or not to attend events were between 16 and 30 years of age. This was followed by those who were between 31 to 45 years of age, making up 7,125 participants or 33%.
.
No YesCount 8216 22018Count% 27% 73%
0
5000
10000
15000
20000
25000
SurveysC
ollected
AreyouthePrimaryDecisionMaker
Under16 16-30 31-45 46-60 60+Yes Yes Yes Yes Yes
Count% 5% 35% 33% 19% 8%
Count 1153 7709 7125 4035 1765
0100020003000400050006000700080009000
Títulodeleje
AreyouthePrimaryDecisionMaker 71
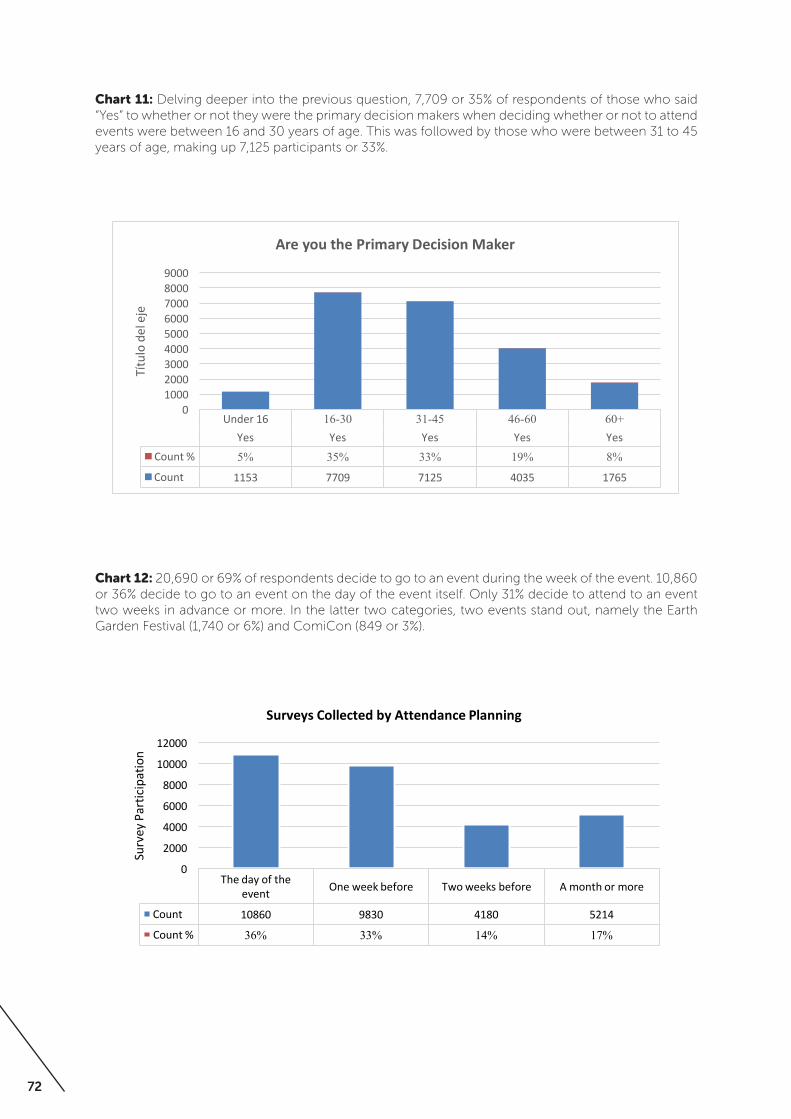
Chart 11: Delving deeper into the previous question, 7,709 or 35% of respondents of those who said “Yes” to whether or not they were the primary decision makers when deciding whether or not to attend events were between 16 and 30 years of age. This was followed by those who were between 31 to 45 years of age, making up 7,125 participants or 33%.
Chart 12: 20,690 or 69% of respondents decide to go to an event during the week of the event. 10,860 or 36% decide to go to an event on the day of the event itself. Only 31% decide to attend to an event two weeks in advance or more. In the latter two categories, two events stand out, namely the Earth Garden Festival (1,740 or 6%) and ComiCon (849 or 3%).
73% of respondents stated that they are the primary decision maker. Females lead with 12,196 or 40%.
Chart 11: Delving deeper into the previous question, 7,709 or 35% of respondents of those who said “Yes” to whether or not they were the primary decision makers when deciding whether or not to attend events were between 16 and 30 years of age. This was followed by those who were between 31 to 45 years of age, making up 7,125 participants or 33%.
.
No YesCount 8216 22018Count% 27% 73%
0
5000
10000
15000
20000
25000
SurveysC
ollected
AreyouthePrimaryDecisionMaker
Under16 16-30 31-45 46-60 60+Yes Yes Yes Yes Yes
Count% 5% 35% 33% 19% 8%
Count 1153 7709 7125 4035 1765
0100020003000400050006000700080009000
Títulodeleje
AreyouthePrimaryDecisionMaker
Chart 12: 20,690 or 69% of respondents decide to go to an event during the week of the event. 10,860 or 36% decide to go to an event on the day of the event itself. Only 31% decide to attend to an event two weeks in advance or more. In the latter two categories, two events stand out, namely the Earth Garden Festival (1,740 or 6%) and ComiCon (849 or 3%)
Chart 13: The survey’s final question examined the main factors influencing the respondents’ decision on whether or not to attend an event. The most common factors were “Event is Innovative” (32%), “Theme or Topic” (30%) and “Artist or Speaker” (27%).
Thedayoftheevent Oneweekbefore Twoweeksbefore Amonthormore
Count 10860 9830 4180 5214Count% 36% 33% 14% 17%
0
2000
4000
6000
8000
10000
12000
Survey
Partic
ipation
SurveysCollectedbyAttendancePlanning
Eventisinnovative
Themeortopic
Artistorspeaker
LastMinuteTickets
Priceofevent
Dinner/drinksbefore/after
Timeofevent Venue Communit
yTransport&Parking
Physicalaccess
Count 9688 9096 8116 6857 6765 6508 6167 6120 5790 4481 3300
Count% 32% 30% 27% 22% 22% 21% 20% 20% 19% 15% 11%
0
2000
4000
6000
8000
10000
12000
Survey
Partic
ipation
SurveysCollectedbyInfluencingFactors
72

Chart 13: The survey’s final question examined the main factors influencing the respondents’ decision on whether or not to attend an event. The most common factors were “Event is Innovative” (32%), “Theme or Topic” (30%) and “Artist or Speaker” (27%).
Chart 12: 20,690 or 69% of respondents decide to go to an event during the week of the event. 10,860 or 36% decide to go to an event on the day of the event itself. Only 31% decide to attend to an event two weeks in advance or more. In the latter two categories, two events stand out, namely the Earth Garden Festival (1,740 or 6%) and ComiCon (849 or 3%)
Chart 13: The survey’s final question examined the main factors influencing the respondents’ decision on whether or not to attend an event. The most common factors were “Event is Innovative” (32%), “Theme or Topic” (30%) and “Artist or Speaker” (27%).
Thedayoftheevent Oneweekbefore Twoweeksbefore Amonthormore
Count 10860 9830 4180 5214Count% 36% 33% 14% 17%
0
2000
4000
6000
8000
10000
12000
Survey
Partic
ipation
SurveysCollectedbyAttendancePlanning
Eventisinnovative
Themeortopic
Artistorspeaker
LastMinuteTickets
Priceofevent
Dinner/drinksbefore/after
Timeofevent Venue Communit
yTransport&Parking
Physicalaccess
Count 9688 9096 8116 6857 6765 6508 6167 6120 5790 4481 3300
Count% 32% 30% 27% 22% 22% 21% 20% 20% 19% 15% 11%
0
2000
4000
6000
8000
10000
12000
Survey
Partic
ipation
SurveysCollectedbyInfluencingFactors
RESULTS
AUDIENCE PROFILING CUMULATIVE
This study illustrates the following main audience profile for cultural events:
(a) Maltese (b) Female (c) Between the ages of “16-30”(d) The main reason for attending depends on the “The Type of Event” and because it is a “Valletta 2018 Event”(e) They learn about the event through “Facebook/Social Media” and “Word of Mouth”.(f) They are the decision makers when it comes to deciding whether or not to attend to events (g) They decide during the “Week of the Event” but mostly during the “Day of the Event”(h) They prefer “Music” & “Performances”(i) They are likely to attend if “Event is innovative” or they like the “Theme or Topic”
73

AUDIENCE PROFILING BY STRAND
6) Results: Audience Profiling by Strand
Strand Children &
Young People Community Event
Gender Female Female Female Gender % 58% 57% 54%
Age
31-44 16-30 Age %
40% 34%
Nationality
Maltese Maltese Nationality %
79% 60%
Reasons For Attending (1st) Activity for
Family Type of Event Valletta 2018 Event Reasons For Attending % 35% 32% 28%
Reasons For Attending (2nd) Type of Event Activity for Family Activity for Family
Reasons For Attending % 23% 29% 26%
Marketing Efforts FB/Social
Media FB/Social Media FB/Social Media
Marketing Efforts % 39% 43% 32%
Marketing Efforts (1st) Word of Mouth
Word of Mouth Word of Mouth
Marketing Efforts % (2nd) 30% 28% 20% Decision Maker (1st) Female Female Female
Decision Maker % 41% 43% 39% Decision Maker (2nd) Male Male Male
Decision Maker % 25% 28% 32%
Attendance Planning (1st) One Week
Before One Week Before Day of Event
Attendance Planning % 41% 37% 41% Attendance Planning (2nd) Day of Event Day of Event One Week Before
Attendance Planning % 33% 34% 33% Other Cultural activities (1st) Music Music Music
Other Cultural activities % 2% 3% 30% Other Cultural activities (2nd) Performance Performance Festivals
Other Cultural activities % 2% 3% 22%
Influencing Factors (1st) Theme or
Topic Theme or Topic Event is Innovative
Influencing Factors % 14% 14% 14%
Influencing Factors (2nd) Event is Innovative Event is Innovative Theme or Topic
Influencing Factors % 13% 12% 11%
74

Strand Exhibition Film Music
Gender Female Female Female Gender % 52% 56% 54%
Age 31-44 31-44 16-30 Age % 35% 37% 46%
Nationality Maltese Maltese Maltese Nationality % 55% 72% 58%
Reasons For Attending (1st) Activity for
Family Type of Event Type of Event Reasons For Attending % 25% 35% 41%
Reasons For Attending (2nd) Valletta 2018
Event Activity for
Family Knowing
Participants Reasons For Attending % 22% 20% 41%
Marketing Efforts (1st) FB/Social
Media FB/Social Media FB/Social Media
Marketing Efforts % 30% 49% 40%
Marketing Efforts (2nd) Word of Mouth
Word of Mouth Word of Mouth
Marketing Efforts % 27% 28% 34% Decision Maker (1st) Female Female Female
Decision Maker % 38% 43% 41% Decision Maker (2nd) Male Male Male
Decision Maker % 31% 29% 35%
Attendance Planning (1st) Day of Event One Week
Before One Week
Before Attendance Planning % 50% 39% 28%
Attendance Planning (2nd) One Week
Before Day of Event Day of Event Attendance Planning % 29% 30% 24%
Other Cultural activities (1st) Music Performance Music Other Cultural activities % 5% 2% 16%
Other Cultural activities (2nd) Performance Music Festivals
Other Cultural activities % 4% 2% 10%
Influencing Factors (1st) Event is
Innovative Event is
Innovative Artist or Speaker Influencing Factors % 13% 14% 14%
Influencing Factors (2nd) Theme or
topic Theme or Topic
Theme or Topic Influencing Factors % 12% 13% 13%
75

Strand Opera Performance Visual Arts Gender Female Female Female
Gender % 54% 60% 56% Age 45-60 31-44 16-30
Age % 29% 32% 37% Nationality Maltese Maltese Maltese
Nationality % 60% 64% 48%
Reasons For Attending (1st) Type of Event Type of Event
Activity for Family
Reasons For Attending % 34% 36% 36%
Reasons For Attending (2nd) Valletta 2018
Event Valletta 2018
Event Valletta 2018
Event Reasons For Attending % 22% 22% 20%
Marketing Efforts (1st) Word of Mouth
FB/Social Media FB/Social Media
Marketing Efforts % 28% 33% 36%
Marketing Efforts (2nd) FB / Social
Media Word of Mouth Word of Mouth
Marketing Efforts % 27% 29% 22% Decision Maker (1st) Female Female Female
Decision Maker % 43% 45% 38% Decision Maker (2nd) Male Male Male
Decision Maker % 28% 25% 20%
Attendance Planning (1st) One Week
Before One Week
Before Day of Event
Attendance Planning % 35% 45% 43%
Attendance Planning (2nd) A month or
more Day of Event
One Week Before
Attendance Planning % 24% 22% 34%
Other Cultural activities (1st) Music Music Music
Other Cultural activities % 2% 2% 0.3% Other Cultural activities
(2nd) Performanc
e Performance Performance
Other Cultural activities % 2% 2% 0.3%
Influencing Factors (1st) Theme or
Topic Event is
Innovative Theme or Topic Influencing Factors % 16% 17% 12%
Influencing Factors (2nd) Event is
Innovative Theme or Topic
Last Minute Tickets
Influencing Factors % 13% 15% 12%
76

APPENDIX 1
EVENT LIST AND SURVEY COLLECTION FIGURESAppendix 1: Event List and Survey Collection Figures
Month Event Type
EVENT NAME Surveys
Collected Estimated Audience
Estimate Collection Rate %
January Mass Opening Ceremony 1561 N/A N/A
February Confined Años Luz 32 150 21%
February Confined Icon Island 76 100 76%
February Confined Mokadelic 74 102 73%
February Confined The Other Europeans 139 250 56%
March Confined Años Luz 32 50 64%
March Confined Ida Kelarova 51 125 41%
April Mass Il-Festa l-Kbira 1644 N/A N/A
April Mass Malta Robotics Olympiad 1435 N/A N/A
April Mass Dal-Baħar Madwarha 519 N/A N/A
April Confined Apocalypse Trio 64 80 80%
April Confined European Eyes on Japan 79 120 66%
May Mass Dal-Baħar Madwarha 517 N/A N/A
May Mass Valletta Green Festival 3225 N/A N/A
May Confined Altofest 87 120 73%
May Confined Amalgama 46 80 58%
May Confined Cantina 161 200 81%
May Confined Carlos Bojarski 148 200 74%
May Confined Hush 275 350 79%
May Confined Rulina 73 100 73%
May Confined Solar Cinema 206 300 69%
June Mass Earth Garden Festival 2896 N/A N/A
June Mass Pageant of the Seas 1115 N/A N/A
June Confined Cendrillon 113 150 75%
June Confined GħanaFest 474 800 59%
June Confined Japanese Choir 39 80 49%
June Confined From Malta to Motor City 40 60 67%
June Confined Modern Music Days 58 100 58%
June Confined Sky Classics 71 150 47%
June Confined Solar Cinema 80 120 67%
June Confined Taf X'Naf 57 80 71%
June Confined Valletta Film Festival 187 250 75%
July Mass Malta Jazz Festival 676 N/A N/A
July Confined Aria 74 120 62%
July Confined Burhan Ocal 113 150 75%
July Confined Choir of Claire's College 46 60 77%
July Confined Daqxejn ta’ Requim 57 80 71%
July Confined Divina Commedia 132 350 38%
July Confined Il-Ħanina Maddalena 64 180 36%
July Confined Le Mer MPO 34 80 43%
77

Month Event Type
EVENT NAME Surveys
Collected Estimated Audience
Estimate Collection Rate %
July Confined Modern Music Days 72 125 58%
July Confined Phantom of the Opera 69 125 55%
July Confined Solar Cinema 76 120 63%
August Mass Baħħ Blu 207 N/A N/A
August Mass Serata Għana u Lejla Rap 116 N/A N/A
August Confined Aħna Refuġjati 459 700 66%
August Confined Corto Maltese 147 250 59%
August Confined Ġewwa Barra 205 350 59%
August Confined Ira Losco and Friends 204 400 51%
August Confined Solar Cinema 312 450 69%
August Confined Utopian Nights 151 250 60%
August Confined Wooden Circus 109 170 64%
September Mass Science in the City 525 N/A N/A
September Confined Aida 178 250 71%
September Confined Aubergine Performance 86 120 72%
September Confined BE-WYLD Festival 81 120 68%
September Confined Curatorial School 19 35 54%
September Confined Hofesh Shechter 61 120 51%
September Confined Każin Barokk 120 250 48%
September Confined Malta Mediterranean Literature Festival 205 400 51%
September Confined Mewġa Mużika 225 450 50%
September Confined Modern Music Days 34 80 43%
September Confined Rock the City 65 120 54%
October Mass Notte Bianca 1559 N/A N/A
October Mass Orfeo & Majnun Parade 1111 N/A N/A
October Confined Cliff Zammit Stevens 208 500 42%
October Confined Sharing the Legacy Conference 2018 40 80 50%
October Confined Constellations 29 50 58%
October Confined Design for the City 85 250 34%
October Confined Orfeo & Majnun Performance 135 719 19%
October Confined Rima 76 125 61%
October Confined Malta International Doom Festival 114 250 46%
November Mass ComiCon 1533 N/A N/A
November Mass Military Mtarfa 207 N/A N/A
November Confined Island Lights 28 80 35%
November Confined Malta International Organ Festival 25 80 31%
November Confined Malta Philharmonic Orchestra Concert 58 150 39%
November Confined Public Lecture 222 300 74%
November Confined The Book Festival 1098 2500 44%
78

Month Event Type
EVENT NAME Surveys
Collected Estimated Audience
Estimate Collection Rate %
November Confined Utopian Nights - Santa Lucia 31 60 52%
December. Mass NYE 2019 1977 N/A N/A
December. Mass Valletta 2018 Closing Ceremony 1416 N/A N/A
December. Confined (In)vizibility 34 100 34% Grand Total 30482
APPENDIX 2
Audience Profiling Valletta 2018 Foundation____________________________________Audience Profiling
1) What gender do you identify as?( ) Male( ) Female( ) Other
2) Which of the following age ranges do you belong to?( ) Under 16( ) 16-30( ) 31-44( ) 45-60( ) 61+
3) What is your nationality? ( ) Maltese( ) British( ) Italian( ) German( ) Spanish( ) French( ) American (USA)( ) Japanese( ) Polish( ) Australian( ) Dutch( ) Bulgarian( ) Other - Write In: ________________________________________________________________
4) Where do you live (locality)? ( ) Valletta ( ) Floriana( ) Birkirkara( ) Sliema( ) Birgu( ) Bormla( ) Isla( ) Attard( ) Balzan( ) Birzebbugia( ) Bugibba( ) Dingli( ) Fgura( ) Gharghur( ) Ghaxaq( ) Gudja( ) Gzira( ) Hamrun( ) Zebbug( ) Ibragg( ) Iklin( ) Kalkara( ) Kirkop( ) Lija( ) Luqa( ) Madliena( ) Marsa( ) Marsascala( ) Marsaxlokk( ) Mellieha( ) Mgarr( ) Mosta( ) Mqabba
SURVEY TEMPLATE
79

( ) Msida( ) Mtarfa( ) Naxxar( ) Rahal Gdid( ) Pieta( ) Qawra( ) Qormi( ) Rabat( ) St Julians( ) San Gwann( ) St Paul’s Bay( ) Santa Venera( ) Santa Lucia( ) Swieqi( ) Siggiewi( ) Swatar( ) Tarxien( ) Ta’ Xbiex( ) Xghajra( ) Zabbar( ) Zejtun( ) Safi( ) Zurrieq( ) Qrendi( ) Sannat( ) Rabat, Gozo( ) Mgarr, Gozo( ) Kercem( ) Marsalforn( ) Xlendi( ) Manikata( ) Xemxija( ) Mdina( ) Other - Write In: ________________________________________________________________
5) What were your reasons for attending thisevent? (Tick any that apply)[ ] Type of event[ ] Valletta 2018 event[ ] Activity for the whole family[ ] Price of event[ ] Passing by[ ] Knowing participant[ ] Other - Write In: ________________________________________________________________
6) How did you find out about this event? (Tickany that apply)[ ] Facebook/Social Media[ ] TV[ ] Radio[ ] Newspaper[ ] Email mailshot[ ] Poster/Banner[ ] Valletta 2018 website[ ] Valletta 2018 newspaper[ ] Word of mouth
7) What other cultural activities would you beinterested in attending? (Tick any that apply)[ ] Performance[ ] Music[ ] Literature[ ] Visual arts/exhibition[ ] Community[ ] Festival[ ] Design[ ] Film
8) Are you the primary decision maker to go toan event?( ) Yes( ) No
9) How far in advance did you plan yourattendance to this activity?( ) The day of the event( ) One week before( ) Two weeks before( ) A month or more
10) What factors influence your decision onwhether or not to go to an event? (Tick any thatapply)[ ] Theme or topic[ ] Artist or speaker[ ] Event is innovative[ ] Ability to buy tickets at the last minute[ ] Transportation & Parking[ ] Venue[ ] Physical accessibility[ ] Ability to go out for dinner and drinks beforeor after[ ] Time of event[ ] Price of event[ ] I feel part of a community attending
________________________________________Thank You For Your Time.
80

The studies presented throughout this theme are amongst the most directly pertinent to the overall
development of the ECoC title in Valletta. Dealing directly with issues such as the cultural programme,
the audiences nurtured throughout the years, perceptions of Valletta, and the impacts on identity, these
studies enable a more holistic understanding of the impact of the ECoC on the cultural sector.
The Valletta Participation Survey provides a unique snapshot of participation across various forms of
cultural activity over a number of years, along with tracing perceptions of the changes taking place in
Valletta in the run-up to the ECoC title. When read alongside the study on the impact of Valletta 2018 on
European identity, these reports map out the patterns of behaviours and attitudes towards Valletta 2018
over the past years.
The audience profiling study within this report fills a crucial gap in knowledge in the local cultural sector,
by outlining the various different audiences that chose to attend cultural activities throughout 2018. For
the first time, the local cultural sector is able to avail itself of the findings of a large-scale, year-long survey
into the choices and preferences of its audiences. Although the paper in this report presents some of the
main findings, this represents only the tip of the iceberg, with the data available to provide more detailed
and segregated analyses, where necessary.
The analysis of the Valletta 2018 cultural programme frames all these studies, providing a more detailed
understanding of the development of the programme itself, and contextualising all the developments
noted in the other studies within this report. This study provides a crucial glimpse into the conceptual
and thematic growth of the programmes, as well as outlining the practical and occasionally unexpected
challenges faced throughout the planning and implementation of the programme.
CONCLUDING REMARKS