Audience 2 - NEA National Endowment for the Arts • Audience 2.0: ... virtual version of something...
150
Audience 2.0 How Technology Influences Arts Participation
-
Upload
nguyenthien -
Category
Documents
-
view
224 -
download
4
Transcript of Audience 2 - NEA National Endowment for the Arts • Audience 2.0: ... virtual version of something...
Audience 2.0
How Technology Influences Arts Participation

National Endowment for the Arts • Audience 2.0: How Technology Influences Arts Participation2
Message from the Chairman
National Endowment for the Arts • Audience 2.0: How Technology Influences Arts Participation 3
Message from the Chairman
In the arts, we are deeply invested in the primacy of the object and the necessity of the live experience. Technology is often seen as our nemesis—a cheaper, easier, virtual version of something real.
Many of us in the arts battle the technology invasion; performing our own version of the refrain that those who do not remember their own history are condemned to repeat it.
The radio and the record album were once thought to herald the death of live music. The VHS tape and cable television were going to end film. Photography was going to replace painting, and color catalogues were going to obviate the need for museums.
None of these innovations led to the death of the art form, but instead contributed to its spread and helped create new audiences.
So now we are faced with the Internet, social media, and other new technologies, and I believe the arts field must embrace them and integrate them into our work. Not to replace it, but to extend it.
This latest offering from the NEA’s Office of Research and Analysis explores the ways that technology and media drive arts participation, and it is meant to spark exactly those conversations.
After you have had a chance to spend some time with this report, I encourage you to log on to our Art Works blog at arts.gov, and tell us your thoughts.
Rocco Landesman Chairman, National Endowment for the Arts

Preface ................................................................................................................................................................... 7
CHAPTEr 1Executive Summary .......................................................................................................................................... 9Executive Summary .............................................................................................................................................10Conclusions ..........................................................................................................................................................14
CHAPTEr 2Background, Goals and Methods ................................................................................................................. 19Objectives of the Present Research ....................................................................................................................20Methodology for the Present Research ..............................................................................................................22Previous Research ...............................................................................................................................................24
CHAPTEr 3Electronic and Digital Media Participation in the Arts .......................................................................29Arts Participation through Electronic Media .......................................................................................................30Arts Participation by Participant Segment ..........................................................................................................38Electronic Media Participation in Individual Benchmark Arts Activities ............................................................50Latin Music Participation through Electronic Media ...........................................................................................56Arts Participation through the Internet ................................................................................................................59Literature through Electronic Media ....................................................................................................................66Summary and Implications ..................................................................................................................................70
CHAPTEr 4Comparing Media-Based Arts Participation with Participation by Other Means ............................................................................................................75Arts Participation through Electronic Media and by Other Means ....................................................................76Arts Participation through Electronic Media and the Frequency and Breadth of Live Arts Attendance .........................................................................................89Summary and Implications ..................................................................................................................................91
CHAPTEr 5recommendations for Future research ...................................................................................................99Future Research on Arts Participation through Electronic Media ...................................................................100Methods to Address Future Research Questions ............................................................................................102Summary ............................................................................................................................................................104
APPENDICESA. Chronological Trends in Arts Participation through Electronic Media from 1982 to 2002 .......................................................................................107
B. 2008 Survey of Public Participation in the Arts (SPPA) ...............................................................121
C. Technical Appendix ..................................................................................................................................129
Table of Contents

National Endowment for the Arts • Audience 2.0: How Technology Influences Arts Participation6
Preface
National Endowment for the Arts • Audience 2.0: How Technology Influences Arts Participation 7
Preface
A udience 2.0 examines how Americans participate in the arts via electronic and digital media. This new report is based on the NEA’s 2008 Survey of Public Participation in the Arts, which asked more than 18,000 adults about
their participation in various arts activities over a one-year period.
One of the surprises in this report is that people who engage with art through media technologies attend live performances or arts exhibits at two to three times the rate of non-media arts participants.
In 2007-2008, Americans used the Internet to view paintings, sculpture, and photography; to read literature; to enjoy music, theater, or dance performances; and to post their own art—including music, films, video, and creative writing. They used electronic media, new and old, to observe certain kinds of arts events—jazz, classical music, dance, theater, and opera. Whether using a cell phone or another handheld device, or just a radio or TV set, they viewed or listened to programs about artists, artworks, and museums.
Media technologies connect Americans from diverse backgrounds to artworks that otherwise might be unavailable to them. This report shows that older Americans, rural communities, and people from racial or ethnic minority groups are more likely to experience certain art forms through media than through live attendance.
Yet the report also shows that half of all Americans do not experience these art forms at all—whether through live attendance or through media. Traditional and media-based arts organizations have a mutual imperative: to continue innovating new approaches for building audiences, tapping each other’s strengths to produce a richer, more complex, and ultimately more rewarding arts experience for the public.
Not only do such collaborations make good business sense—there’s now an empirical reason to believe that media-based arts participation helps to reinforce other types of arts participation, even after accounting for other factors. It’s clear now, if it wasn’t before, that electronic media can be a gateway and not a barrier to greater arts participation.
Sunil Iyengar Director, Research & Analysis National Endowment for the Arts
Executive Summary
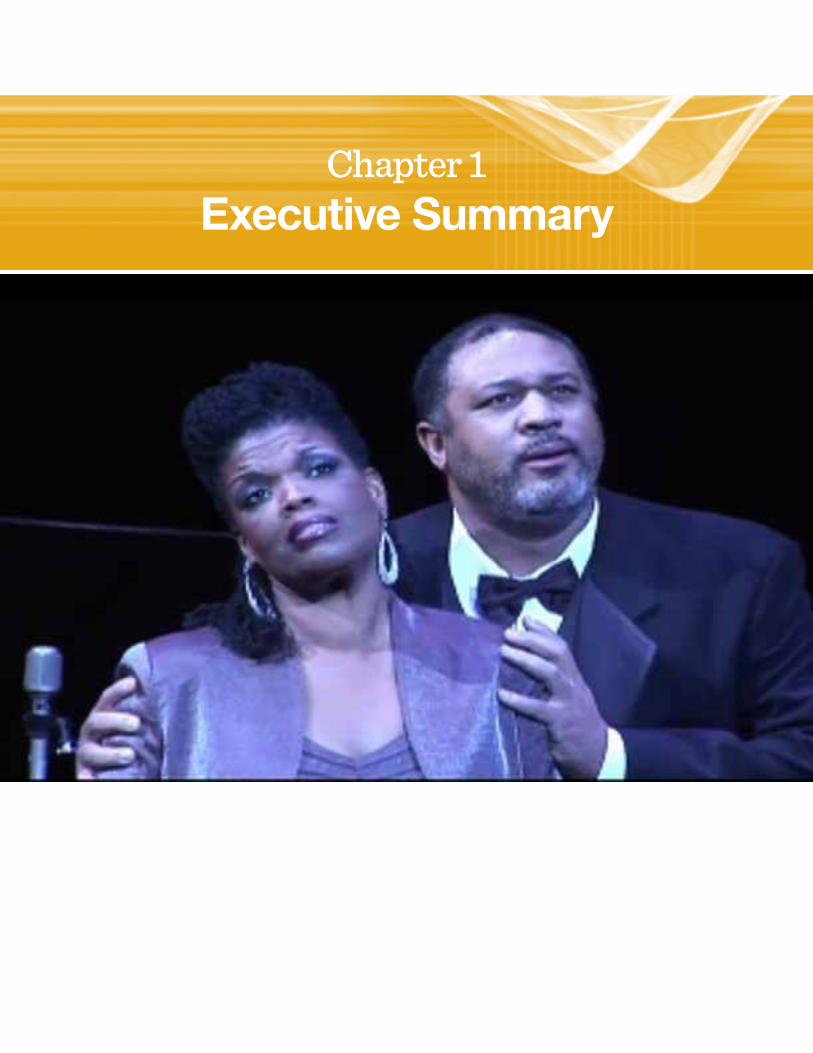
This is an excerpt of a performance from the 2009 NEA Opera Honors awards ceremony,
featuring Angela Brown and Gordon Hawkins. The NEA is making its audio and video material available to the public for
free through its website, YouTube, iTunes U, and FaceBook.
Chapter 1Executive Summary
National Endowment for the Arts • Audience 2.0: How Technology Influences Arts Participation10
The opportunities for arts participation via media are various and constantly evolving. New technologies and art forms pose challenges to research methods built upon traditional metrics of arts participation. Nevertheless, the NEA’s
2008 Survey of Public Participation in the Arts (SPPA) permits researchers to study American adults’ patterns of arts participation involving a broad range of electronic and digital media — radio, TV, CDs/DVDs, the Internet, and portable media devices. 1
The findings in this report focus primarily on electronic media use for participation in certain “benchmark” arts activities. The NEA tracks participation in the benchmark activities as an indicator of U.S. adults’ participation in the arts overall. Data about participation in those activities stem from questions that have been consistently included in all or most iterations of the SPPA. 2
The report also examines electronic media use for participating in many other kinds of arts activity, including Latin music concerts, literary reading, and personal performance and creation of art. Specific questions about Internet use also allowed reporting on certain non-benchmark arts activities.
Our analysis of the 2008 SPPA data on arts participation via electronic media (inclusive of digital media) yields several key findings.
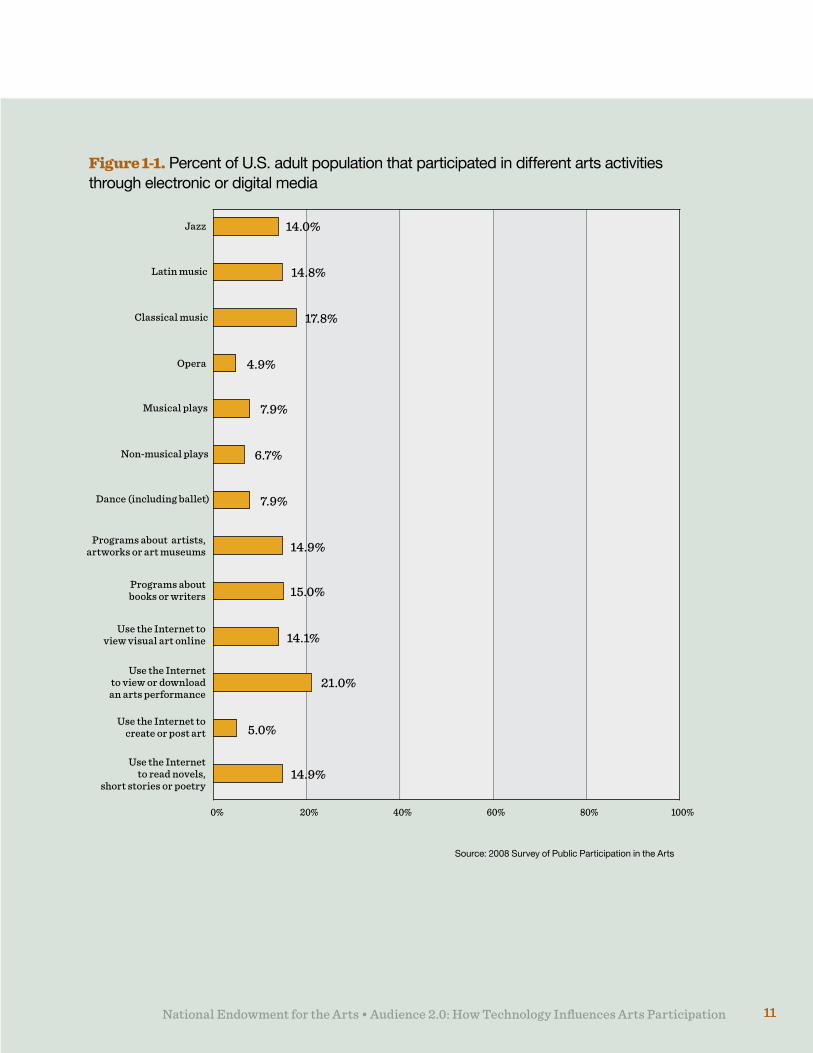
1. Over half of all U.S. adults (53%, or 118 million) participate in the arts through electronic and digital media. They did one or more of the following at least once in the 12 months prior to May 2008 (see Figure 1-1):
• UsedTV,radio,CDs/DVDs,acomputer,oraportable media device to view or listen to an arts performance, a program about artists, artworks, or museums, or a program about books or writers;
• UsedtheInternettoviewpaintings,sculptures, photography, or other visual arts;
• UsedtheInternettovieworlistentoalive or recorded music, theater, or dance performance;
• UsedtheInternettoreadordownloadanovel, short story, or poem; or
• Createdorpostedtheirownartonline(including music, films, video, and creative writing).
2. More than one-third of U.S. adults (37%) participate in “benchmark” arts activities through electronic media.3
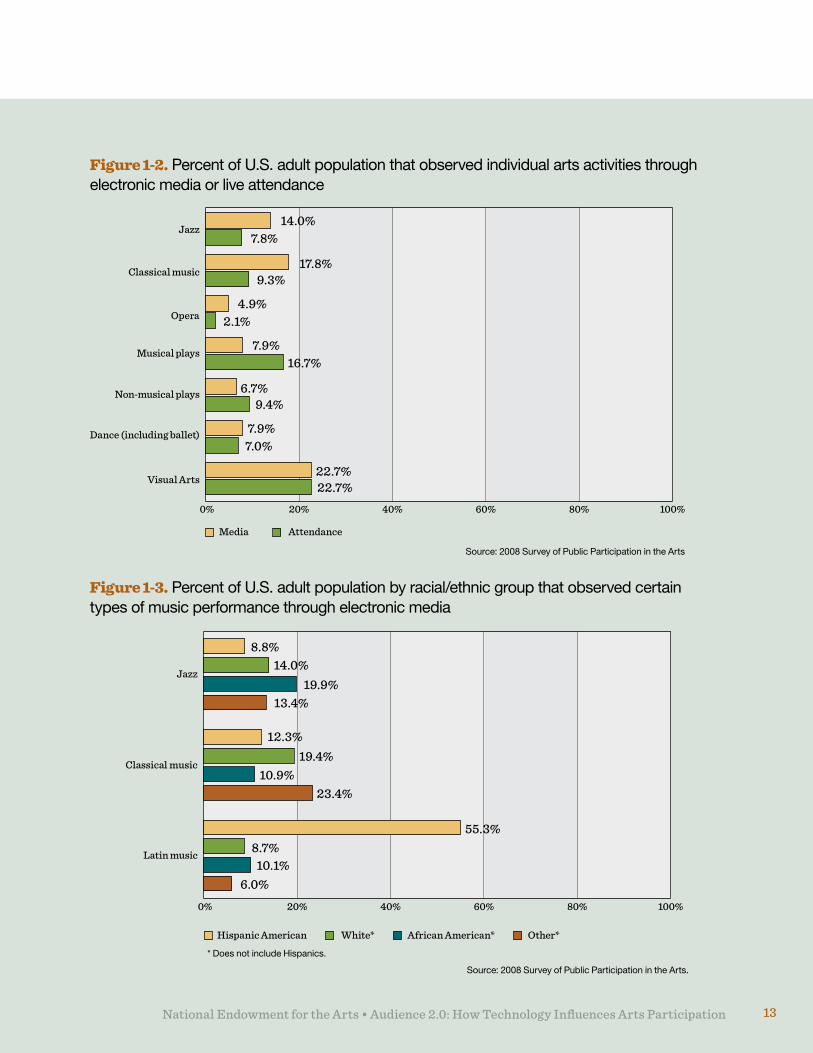
• TheproportionofU.S.adultsthatvisited art museums and galleries was comparable to the proportion that enjoyed visual artworks or programs through media (23%; see Figure 1-2).
• Still,foreverytypeofartsperformancebesides theater, adults were more likely to view or listen through electronic media than to attend live events.
• Theproportionofadultsthatviewedorlistened to a music, theater, or dance performance online exceeded the proportion that viewed visual art on the Internet alone (21% vs. 14%).
National Endowment for the Arts • Audience 2.0: How Technology Influences Arts Participation 1111
0% 20% 40% 60% 80% 100%
Jazz
Latin music
Classical music
Opera
Musical plays
Non-musical plays
Dance (including ballet)
Programs about artists,artworks or art museums
Programs aboutbooks or writers
Use the Internet toview visual art online
Use the Internetto view or downloadan arts performance
Use the Internet tocreate or post art
Use the Internetto read novels,
short stories or poetry
Figure 1-1. Percent of U.S. adult population that participated in different arts activities through electronic or digital media
14.0%
14.8%
14.9%
14.9%
14.1%
21.0%
15.0%
17.8%
4.9%
5.0%
7.9%
7.9%
6.7%
Source: 2008 Survey of Public Participation in the Arts
National Endowment for the Arts • Audience 2.0: How Technology Influences Arts Participation 11
National Endowment for the Arts • Audience 2.0: How Technology Influences Arts Participation12
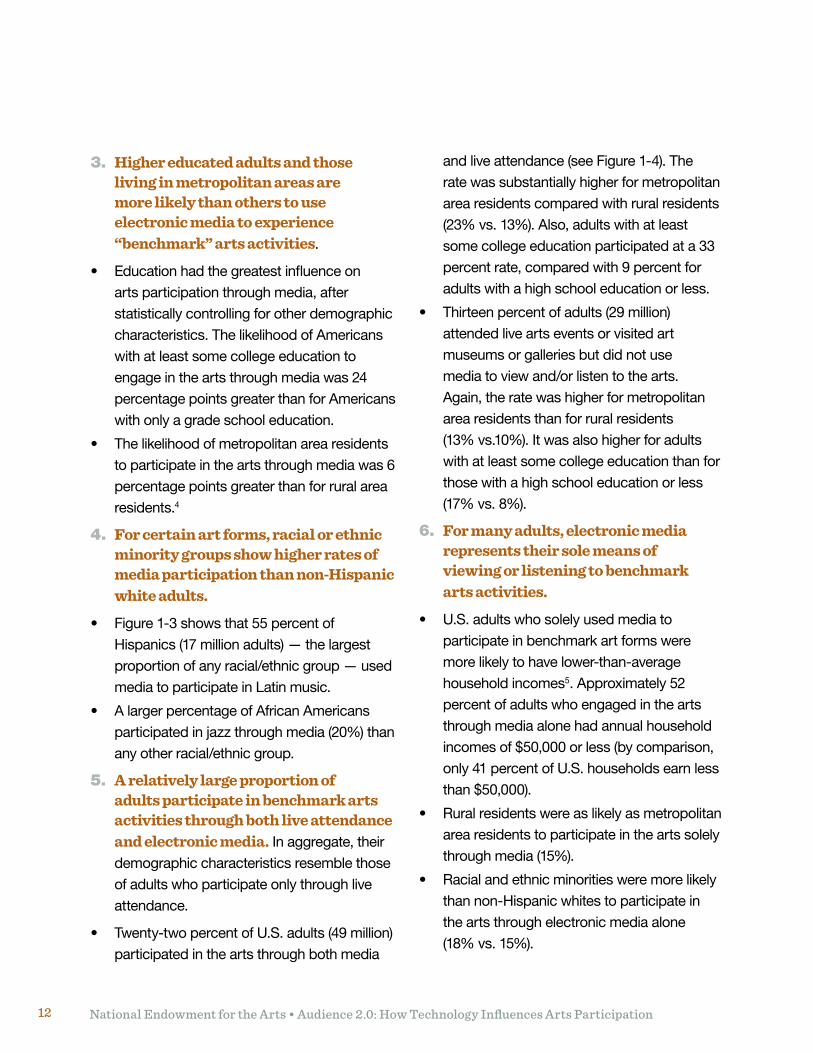
3. Higher educated adults and those living in metropolitan areas are more likely than others to use electronic media to experience “benchmark” arts activities.
• Educationhadthegreatestinfluenceonarts participation through media, after statistically controlling for other demographic characteristics. The likelihood of Americans with at least some college education to engage in the arts through media was 24 percentage points greater than for Americans with only a grade school education.
• Thelikelihoodofmetropolitanarearesidentsto participate in the arts through media was 6 percentage points greater than for rural area residents.4
4. For certain art forms, racial or ethnic minority groups show higher rates of media participation than non-Hispanic white adults.
• Figure1-3showsthat55percentofHispanics (17 million adults) — the largest proportionofanyracial/ethnicgroup—usedmedia to participate in Latin music.
• AlargerpercentageofAfricanAmericansparticipated in jazz through media (20%) than anyotherracial/ethnicgroup.
5. A relatively large proportion of adults participate in benchmark arts activities through both live attendance and electronic media. In aggregate, their demographic characteristics resemble those of adults who participate only through live attendance.
• Twenty-twopercentofU.S.adults(49million)participated in the arts through both media
and live attendance (see Figure 1-4). The rate was substantially higher for metropolitan area residents compared with rural residents (23% vs. 13%). Also, adults with at least some college education participated at a 33 percent rate, compared with 9 percent for adults with a high school education or less.
• Thirteenpercentofadults(29million)attended live arts events or visited art museums or galleries but did not use mediatoviewand/orlistentothearts. Again, the rate was higher for metropolitan area residents than for rural residents (13% vs.10%). It was also higher for adults with at least some college education than for those with a high school education or less (17% vs. 8%).
6. For many adults, electronic media represents their sole means of viewing or listening to benchmark arts activities.
• U.S.adultswhosolelyusedmediatoparticipate in benchmark art forms were more likely to have lower-than-average household incomes5. Approximately 52 percent of adults who engaged in the arts through media alone had annual household incomes of $50,000 or less (by comparison, only 41 percent of U.S. households earn less than $50,000).
• Ruralresidentswereaslikelyasmetropolitanarea residents to participate in the arts solely through media (15%).
• Racialandethnicminoritiesweremorelikelythan non-Hispanic whites to participate in the arts through electronic media alone (18% vs. 15%).
National Endowment for the Arts • Audience 2.0: How Technology Influences Arts Participation 13National Endowment for the Arts • Audience 2.0: How Technology Influences Arts Participation 13
0% 20% 40% 60% 80% 100%
Jazz
Classical music
Latin music
Hispanic American White* African American* Other*
Figure 1-3.PercentofU.S.adultpopulationbyracial/ethnicgroupthatobservedcertaintypes of music performance through electronic media
* Does not include Hispanics.
Source: 2008 Survey of Public Participation in the Arts.
Figure 1-2. Percent of U.S. adult population that observed individual arts activities through electronic media or live attendance
0% 20% 40% 60% 80% 100%
Jazz
Classical music
Opera
Musical plays
Non-musical plays
Dance (including ballet)
Visual Arts
Media Attendance
14.0%
8.8%
8.7%
14.0%19.9%
13.4%
12.3%19.4%
10.9%
10.1%6.0%
23.4%
55.3%
17.8%9.3%
4.9%
7.9%16.7%
22.7%22.7%
6.7%9.4%
7.9%7.0%
2.1%
7.8%
Source: 2008 Survey of Public Participation in the Arts
National Endowment for the Arts • Audience 2.0: How Technology Influences Arts Participation14
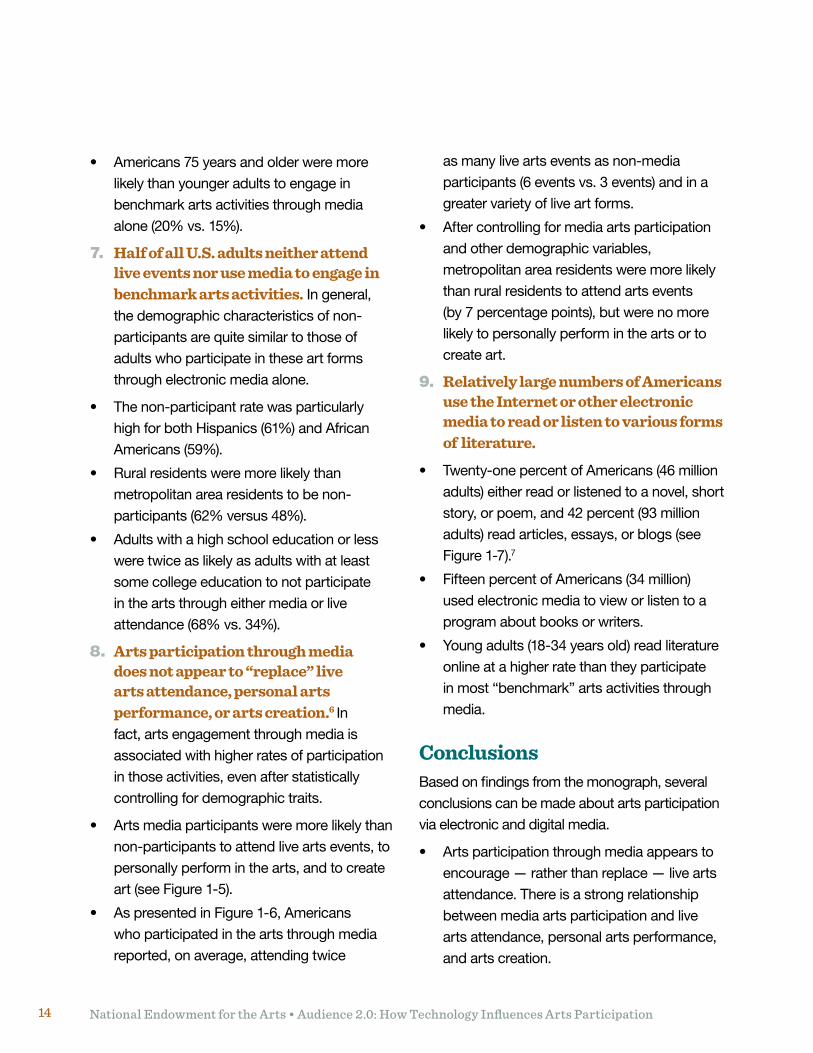
• Americans75yearsandolderweremorelikely than younger adults to engage in benchmark arts activities through media alone (20% vs. 15%).
7. Half of all U.S. adults neither attend live events nor use media to engage in benchmark arts activities. In general, the demographic characteristics of non-participants are quite similar to those of adults who participate in these art forms through electronic media alone.
• Thenon-participantratewasparticularlyhigh for both Hispanics (61%) and African Americans (59%).
• Ruralresidentsweremorelikelythanmetropolitan area residents to be non-participants (62% versus 48%).
• Adultswithahighschooleducationorlesswere twice as likely as adults with at least some college education to not participate in the arts through either media or live attendance (68% vs. 34%).
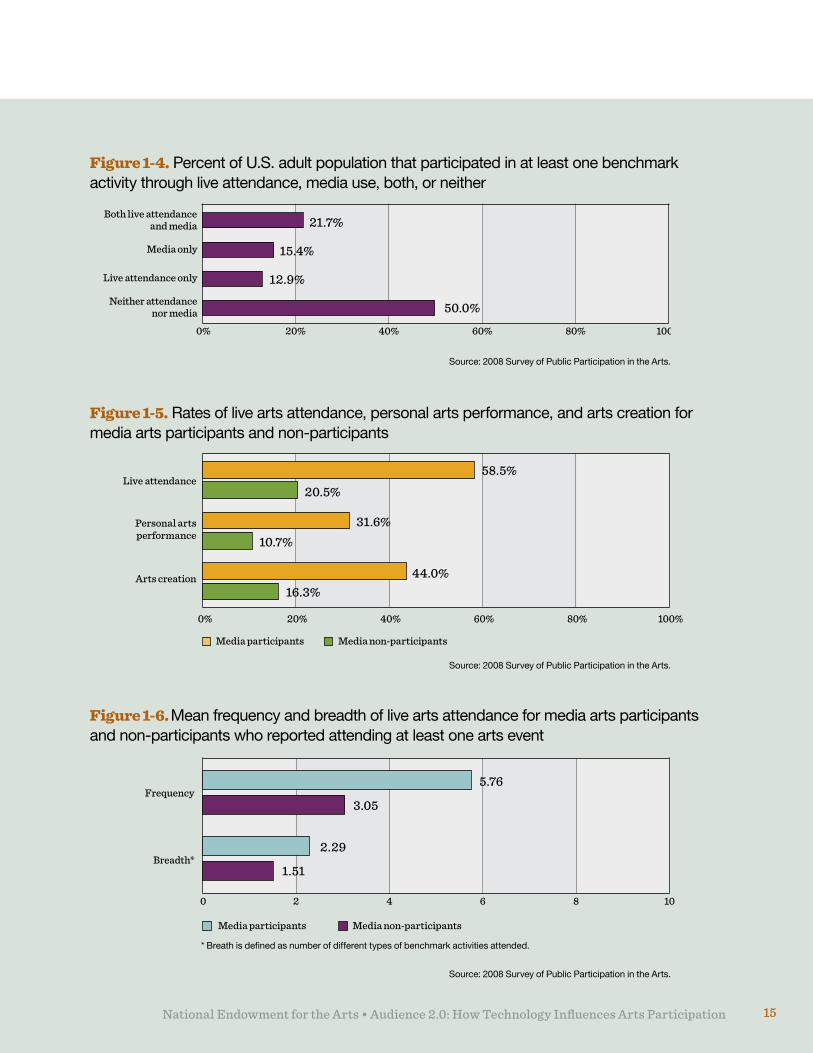
8. Arts participation through media does not appear to “replace” live arts attendance, personal arts performance, or arts creation.6 In fact, arts engagement through media is associated with higher rates of participation in those activities, even after statistically controlling for demographic traits.
• Artsmediaparticipantsweremorelikelythannon-participants to attend live arts events, to personally perform in the arts, and to create art (see Figure 1-5).
• AspresentedinFigure1-6,Americanswho participated in the arts through media reported, on average, attending twice
as many live arts events as non-media participants (6 events vs. 3 events) and in a greater variety of live art forms.
• Aftercontrollingformediaartsparticipationand other demographic variables, metropolitan area residents were more likely than rural residents to attend arts events (by 7 percentage points), but were no more likely to personally perform in the arts or to create art.
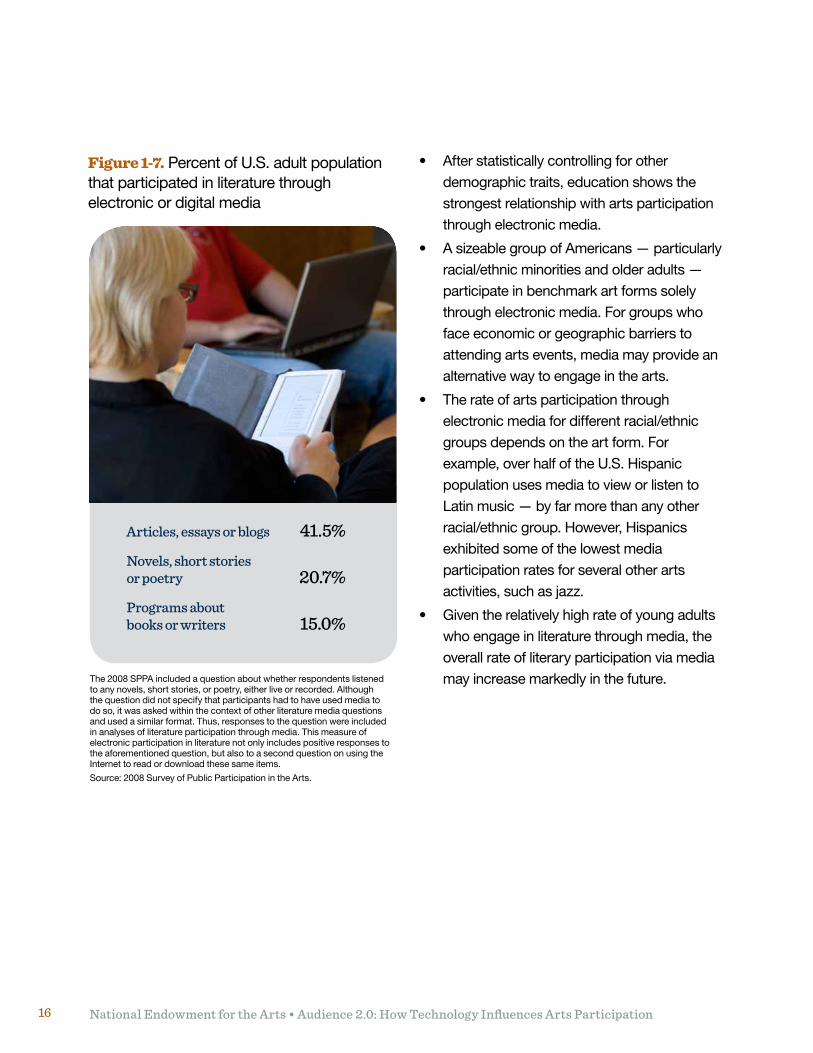
9. Relatively large numbers of Americans use the Internet or other electronic media to read or listen to various forms of literature.
• Twenty-onepercentofAmericans(46millionadults) either read or listened to a novel, short story, or poem, and 42 percent (93 million adults) read articles, essays, or blogs (see Figure 1-7).7
• FifteenpercentofAmericans(34million)used electronic media to view or listen to a program about books or writers.
• Youngadults(18-34yearsold)readliteratureonline at a higher rate than they participate in most “benchmark” arts activities through media.
ConclusionsBased on findings from the monograph, several conclusions can be made about arts participation via electronic and digital media.
• Artsparticipationthroughmediaappearstoencourage — rather than replace — live arts attendance. There is a strong relationship between media arts participation and live arts attendance, personal arts performance, and arts creation.
National Endowment for the Arts • Audience 2.0: How Technology Influences Arts Participation 15National Endowment for the Arts • Audience 2.0: How Technology Influences Arts Participation 15
Figure 1-5. Rates of live arts attendance, personal arts performance, and arts creation for media arts participants and non-participants
Figure 1-6. Mean frequency and breadth of live arts attendance for media arts participants and non-participants who reported attending at least one arts event
0% 20% 40% 60% 80% 100%
Live attendance
Personal artsperformance
Arts creation
Media participants Media non-participants
Frequency
Breadth*
Media participants Media non-participants
0 2 4 6 8 10
Source: 2008 Survey of Public Participation in the Arts.
Source: 2008 Survey of Public Participation in the Arts.
* Breath is defined as number of different types of benchmark activities attended.
0% 20% 40% 60% 80% 100%
Both live attendanceand media
Media only
Neither attendancenor media
Live attendance only
Figure 1-4. Percent of U.S. adult population that participated in at least one benchmark activity through live attendance, media use, both, or neither
Source: 2008 Survey of Public Participation in the Arts.
21.7%
15.4%
12.9%
50.0%
58.5%
5.76
3.05
2.29
1.51
20.5%
16.3%
31.6%
44.0%
10.7%
National Endowment for the Arts • Audience 2.0: How Technology Influences Arts Participation16
Figure 1-7. Percent of U.S. adult population that participated in literature through electronic or digital media
The 2008 SPPA included a question about whether respondents listened to any novels, short stories, or poetry, either live or recorded. Although the question did not specify that participants had to have used media to do so, it was asked within the context of other literature media questions and used a similar format. Thus, responses to the question were included in analyses of literature participation through media. This measure of electronic participation in literature not only includes positive responses to the aforementioned question, but also to a second question on using the Internet to read or download these same items.
Source: 2008 Survey of Public Participation in the Arts.
Articles, essays or blogs 41.5%
Novels, short stories or poetry 20.7%
Programs about books or writers 15.0%
• Afterstatisticallycontrollingforotherdemographic traits, education shows the strongest relationship with arts participation through electronic media.
• AsizeablegroupofAmericans—particularlyracial/ethnicminoritiesandolderadults—participate in benchmark art forms solely through electronic media. For groups who face economic or geographic barriers to attending arts events, media may provide an alternative way to engage in the arts.
• Therateofartsparticipationthroughelectronicmediafordifferentracial/ethnicgroups depends on the art form. For example, over half of the U.S. Hispanic population uses media to view or listen to Latin music — by far more than any other racial/ethnicgroup.However,Hispanicsexhibited some of the lowest media participation rates for several other arts activities, such as jazz.
• Giventherelativelyhighrateofyoungadultswho engage in literature through media, the overall rate of literary participation via media may increase markedly in the future.
National Endowment for the Arts • Audience 2.0: How Technology Influences Arts Participation 17
Notes1 Throughout this report, the use of any of these technologies
is characterized as “electronic media” participation. “Portable media devices” may have included iPods, cell phones, or portable DVD players.
2 Benchmark arts activities include jazz, classical music, opera, musical plays, non-musical plays, ballet performances, and visual arts. The electronic media measurement of participation in those activities includes all dance, and not just ballet.
3 Visual arts participation includes those who either observed programs about artworks, artists, or museums through electronicmediaand/orwhoviewedartworksonline.
4 Rural is defined as residing outside a metropolitan area. The definition of metropolitan areas can be found at: http://www.census.gov/population/www/cps/cpsdef.html
5 TheMay2008CPSmeasureofhousehold/familyincomeused in this analysis does not include the earnings of household members that are not related to the respondent.
6 Among all types of personal arts creation, only photography, videography, and filmmaking increased in 2008 compared with previous years. Fifteen percent of adults engaged in one of these activities in 2008, compared with only 11 percent in 1982.
7 The 2008 SPPA included a question about whether respondents listened to any novels, short stories, or poetry, either live or recorded. Although the question did not specify that participants had to have used media to do so, it was asked within the context of other literature media questions and used a similar format. Thus, responses to the question were included in analyses of literature participation through media.
Background, Goals, and Methods
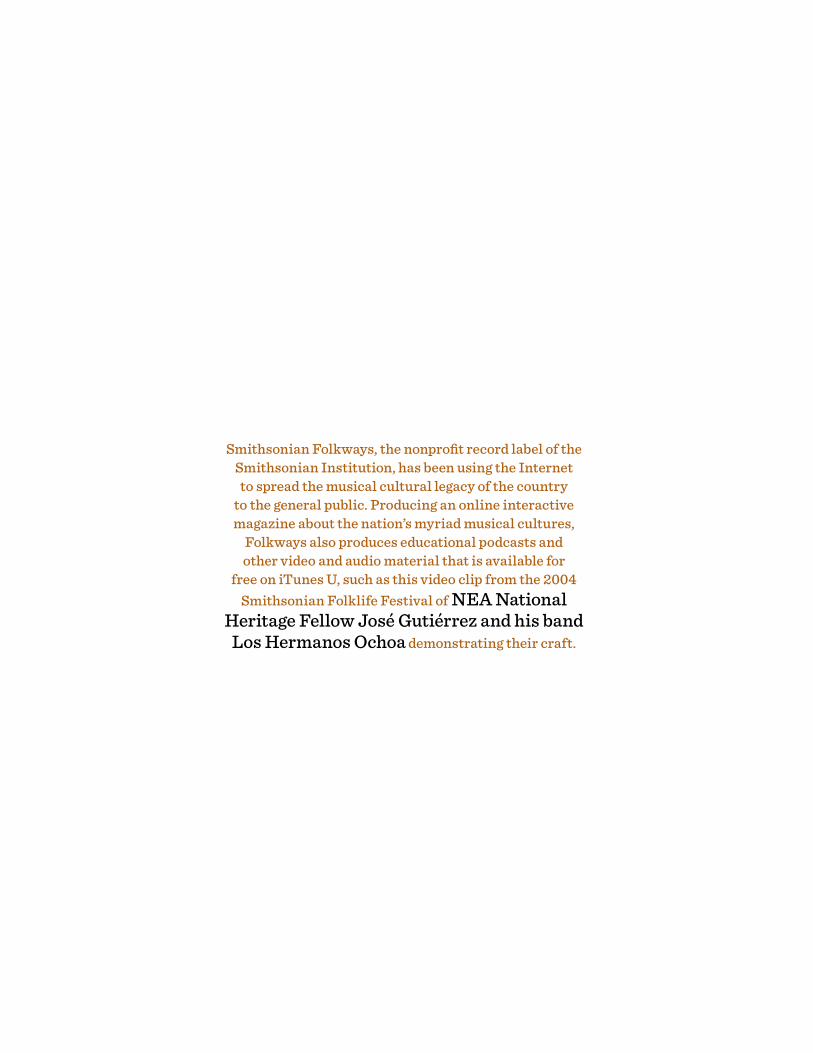
Smithsonian Folkways, the nonprofit record label of the Smithsonian Institution, has been using the Internet to spread the musical cultural legacy of the country
to the general public. Producing an online interactive magazine about the nation’s myriad musical cultures,
Folkways also produces educational podcasts and other video and audio material that is available for
free on iTunes U, such as this video clip from the 2004 Smithsonian Folklife Festival of NEA National
Heritage Fellow José Gutiérrez and his band Los Hermanos Ochoa demonstrating their craft.
Chapter 2Background, Goals, and Methods
National Endowment for the Arts • Audience 2.0: How Technology Influences Arts Participation20
Now more than ever, electronic and digital media play a central role in the lifestyles and leisure activities of many Americans. Beginning in 1982, researchers have used data from the NEA’s Survey of Public Participation
in the Arts (SPPA) to understand and analyze arts participation through electronic media and other means. Since 1982, the NEA has periodically conducted the SPPA in partnership with the U.S. Census Bureau. The survey collects self-reported data on participation in a broad range of arts activities such as jazz, musical and non-musical plays, and visual arts. It represents the largest, most detailed source of arts participation data in the country.
Givenrecentadvancementsinelectronicmedia,the 2008 SPPA provides an opportunity to reexamine how people use media to participate in the arts. The survey allows researchers to understand:
• Whoisparticipatingintheartsthroughelectronic media;
• Whatfactorsaffectartsparticipationthroughelectronic media; and
• Howartsparticipationthroughelectronicmedia relates to activities such as live arts attendance, personal art performance, and art creation.
Research using SPPA data from previous years has examined trends in arts participation via electronic media and has identified the following:
• Artsparticipationthroughelectronicmediamay increase overall interest in the arts (e.g., Andreasen, 1991).1
• Thereisapositivecorrelationbetweenartsparticipation rates through electronic media and through live attendance (e.g., DeVeaux, 1995).2
• Ingeneral,therearekeydemographicdifferences between adults who participate in
the arts through electronic media and those who participate through live attendance (e.g., Gray,1995).3
Objectives of the Present ResearchThis monograph builds on previous studies to examine current trends in arts participation through electronic media. The report further explores the relationship between arts participation through electronic media and arts participation through other means. Starting questions include:
• Givencontinuinggrowthinelectronicmediause and accessibility to the Internet, what are current national rates of participation in the arts through electronic media and how do they compare with rates of live attendance? In addition, who is participating in the arts through electronic media, and what are their demographic characteristics? (Chapter 3)
• Whatistherelationshipbetweenartsparticipation through electronic media and arts participation through live attendance, personal performance and arts creation? (Chapter 4)
National Endowment for the Arts • Audience 2.0: How Technology Influences Arts Participation 21
• Inlightofpreviousstudiesandthepresentresearch, what are some remaining questions about arts participation through electronic media? How can the next iteration of the SPPA help answer those questions? (Chapter 5)
Chapter 3. The 2008 SPPA examined different forms of electronic media that Americans used to participate in the arts, including:
• TheInternet;
• Television;
• Radio;
• CDsandDVDs;and
• Portablemediadevices.
Chapter 3 relies on data from the 2008 SPPA to determine the extent to which U.S. adults use electronic media to participate in the arts and the demographic characteristics of adults most likely to do so.
Overall participation rates. Chapter 3 presents rates of media-based arts participation for “benchmark” arts activities — selected arts activities that can be viewed as representative of arts engagement overall.4 Rates are presented for all benchmark arts activities considered together and for individual art forms.
Participant segments. In addition, Chapter 3 examines rates of benchmark arts through electronic media participation for different segments of arts participants:
• Adultswhoreportedparticipatinginbenchmark arts activities via both electronic media and attendance;
• Adultswhoreportedparticipatinginbenchmark arts activities via electronic media alone;
• Adultswhoreportedparticipatinginbenchmark arts activities via attendance alone; and
• Adultswhoreportednoparticipationin benchmark activities through either electronic media or attendance.
Latin music. For the first time in the SPPA’s history, the 2008 survey included questions about Latin music participation. Chapter 3 examines current rates of participation in Latin music via electronic media and live attendance. As with benchmark arts activities, rates also appear separately for different demographic groups.
Arts participation via Internet. The 2008 SPPA included questions about using the Internet to participate in various arts activities — for example, using the Internet to watch, listen to, or download arts performances; viewing visual art; obtaining arts information; and posting or creating art online. (These questions were separate from those related to “electronic media” in general.) Chapter 3 discusses overall participation rates in these Internet-based arts activities and rates for different demographic groups.
Chapter 4. In addition to asking about arts participation through electronic media, the 2008 SPPA asked about live arts attendance, personal arts performance, and arts creation. Chapter 4 explores the relationship between arts participation via electronic media and arts participation through those other means.
Live attendance, personal arts performance, and art creation. Chapter 4 compares rates of live attendance, personal performance, and arts creation between respondents who used electronic media to participate in the arts and those who did not. In addition, Chapter 4 presents
National Endowment for the Arts • Audience 2.0: How Technology Influences Arts Participation22
results of statistical models that predict rates of live attendance, personal performance, and arts creation. The models explore the independent relationships between arts participation through electronic media and arts participation through those other means, after statistically controlling for demographic characteristics of respondents.
Breadth and frequency of live arts attendance. Chapter 4 also examines whether arts participation through electronic media is related to the number of live arts events (frequency) and the number of different art forms (breadth) for which people attend activities. Chapter 4 compares the mean number of art events and arts forms that electronic media arts participants and non-participants reported attending in the 2008 SPPA.
In addition, Chapter 4 presents the results of statistical models that predict frequency and breadth of arts attendance while accounting for arts participation through electronic media and various demographic characteristics.
Chapter 5. Chapter 5 suggests possible avenues for future research on arts participation through electronic media and presents ideas for how the 2012 SPPA can address new questions related to such arts participation. Chapter 5 also discusses alternative data collection methods that would support future analyses.
Appendix A. Since 1982, each SPPA has included questions about arts participation using available electronic media. It is informative to examine how arts participation through electronic media may have changed across the 1982, 1992, and 2002 SPPAs.5
Benchmark arts activities. Appendix A presents changes in the overall rates of arts participation through electronic media across the 1982, 1992,
and 2002 SPPAs for all benchmark arts activities considered together. Trends are presented for all adults considered together and for different demographic groups.
Individual art forms. Appendix A also reports changes in rates for arts participation through electronic media for individual benchmark arts activities between 1982 and 2002. Trends are presented for all adults considered together and for different demographic groups.
Methodology for the Present ResearchThis monograph relied on data from the 1982, 1992, 2002, and 2008 SPPAs to examine questions related to arts participation using electronic media.
Survey approach. The U.S. Census Bureau surveys approximately 60,000 households per month via the Current Population Survey (CPS). The 2002 and 2008 SPPAs were conducted as supplements to the CPS. The 1982 and 1992 SPPAs were collected as supplements to the U.S. Census Bureau’s National Crime Survey.
Survey sample. The U.S. Census Bureau administers the SPPA to a random sample of U.S adults, asking respondents for information about themselves and, if applicable, about their spouses or partners. Using that method for the 2008 SPPA, interviewers collected arts participation information on 18,444 adults. The data consists of 12,518 self-responses and 5,926 obtained through spouses/partners.
Appendices A and B of the 2008 SPPA report and the2008SPPAUser’sGuideprovideadditionalbackground about the survey.6 For an overview
National Endowment for the Arts • Audience 2.0: How Technology Influences Arts Participation 23
of the CPS survey methodology, see the U.S. Census Bureau’s technical brief.7
Survey questions. The 2008 SPPA asked questions about arts participation in the 12 months ending in May 2008. Each survey respondent answered “core” arts participation questions along with two of four other survey modules, one of which included questions about how people use electronic media to participate in the arts. Interviewers collected information from approximately 5,700 adults for the survey module that focused on arts participation through electronic media.
The survey also asked questions about demographic characteristics including gender, income,educationallevel,age,andrace/ethnicity.The U.S. Census Bureau used that information to weight the survey data so that overall results corresponded with characteristics of the total U.S. adult population in aggregate.
Appendix B of this monograph presents the questions included in the 2008 SPPA.
Comparisons between the 2008 SPPA and previous SPPAs. Although the 1982, 1992, 2002, and 2008 SPPAs were similar in many ways, there were a number of key differences between the surveys.8
Question content. Unlike previous SPPAs, the 2008 survey contained questions about Latin music participation and detailed questions about arts participation via Internet. In addition, the 2008 SPPA included questions about a broader range of electronic media than the 1982, 1992, and 2002 SPPAs (see Chapter 3).
Question format. The 2008 SPPA differed from previous SPPAs in how media-related arts participation questions were asked. Rather than
asking separate questions about each type of electronic media for each arts activity, the 2008 SPPA asked one question for each art form that addressed all available types of electronic media.
For example, the 2002 SPPA asked three separate questions about using television, compact discs, and the Internet to participate in opera. By contrast, the 2008 SPPA asked about all available types of media with a single question:
During the last 12 months, did you watch or listen to a recorded or live broadcasted opera on television, radio, or on your computer, including watching or listening on a portable media device such as an iPod, cell phone or portable DVD player?
Due to the differences across SPPAs in how questions about arts participation through electronic media were asked, chronological trends presented in Appendix A do not include data from the 2008 SPPA.
Exclusions. Some SPPA survey responses were excluded from the arts participation analyses in this report as they were in the 2008 SPPA report referenced earlier.
Live attendance data. Data from participants who failed to give a response (or responded “I don’t know”) to any question about participating in benchmark arts activities through live attendance were excluded from calculations of live attendance rates. Thus, live attendance rates for benchmark arts activities included data only from those participants who responded “yes” or “no” to each question about attending a benchmark art form.
Data on arts participation through electronic media. Data from participants who failed to give a response (or responded “I don’t know”) to any
National Endowment for the Arts • Audience 2.0: How Technology Influences Arts Participation24
questions about participating in benchmark arts activities through live attendance or through electronic media were excluded from analyses involving arts participation.
Latin music, Internet-based arts activities, and literature. Analyses from the 2008 SPPA related to participation in Latin music, Internet-based arts activities, and literature excluded data from respondents who did not give a response (or responded “I don’t know”) to the particular question involved in the analysis.
Appendix C provides more information about how respondent samples were defined and how arts participation rates were computed for the monograph.
Previous ResearchA great deal of past research has addressed various questions related to arts participation through electronic media. Some of that research focused on a single art form, whereas other research examined overall trends in arts participation through electronic media.
Do people who participate in the arts through media differ demographically from those who participate through attendance? Previous research has shown key demographic differences between people who engage in arts activities through electronic media and those who attend live arts events. For example,using1982and1992SPPAdata,Gray(1995) explored the relationship between multiple demographic variables — such as education level and location — and arts-participation rates through media and attendance. Several interesting findings emerged.
• Botheducationandincomelevelswerepositively correlated with arts participation through attendance, but only education was positively correlated with arts participation though media.
• Althoughmetropolitanarearesidentsweresubstantially more likely than rural residents to attend live arts performances, geographic location was unrelated to arts participation through electronic media.
Gray’sfindingsindicatethatdifferentdemographiccharacteristics predict arts participation through electronic media than through live attendance. He concluded that electronic media may enable different types of people to engage in the arts than typically do through live attendance.
Is arts participation through media related to live attendance? Andreasen (1991) argued that an interest in art develops as part of a multistage process that eventually leads to live attendance. Andreasen examined the role that electronic media plays in cultivating a broader interest in the arts.
• Andreasenobservedapositivecorrelationbetween arts participation through electronic media and through live attendance.
• Andreasen’sstudycouldnotdeterminewhether arts participation electronic media was a causal factor in live arts attendance.
Ateca-Amestoy (2009) also studied whether there is a relationship between arts participation via electronic media and live attendance, but did so after statistically controlling for various demographic variables, including sex, age, ethnicity and geographic location.9 Ateca-Amestoy observed a number of interesting
National Endowment for the Arts • Audience 2.0: How Technology Influences Arts Participation 25
relationships between arts participation through electronic media, personal arts performance, and live attendance.
• Participatingintheartsthroughelectronicmedia was related to higher rates of arts participation through live attendance.
• Artsparticipationthroughpersonalperformance was also related to live arts attendance.
• Individualswhoreportedparticipatinginthe arts through electronic media were less likely to report never participating in the arts through live attendance.
Is arts participation through electronic media related to live attendance for individual art forms? The question of whether there is a relationship between attending arts events and using electronic media to engage in the arts has been studied for several individual arts activities. For example, DeVeaux (1995) used data from the 1982 and 1992 SPPA to investigate the relationship between arts participation through attendance and through electronic media, showing that attendance at jazz performances was associated with jazz participation through electronic media.
• Overall,morepeoplereportedparticipatingin jazz through electronic media than through live attendance.
• Adultswhoattendedajazzperformancewere substantially more likely than those who had not to report participating in jazz through electronic media.
Ateca-Amestoy (2008) relied on data from the 2002 SPPA to examine whether theater participation through electronic media is related
to live theater attendance.10 After statistically controlling for individual characteristics — including art preferences, financial constraints, and exposure to the arts — Ateca-Amestoy observed a number of relationships between theater attendance and other participation in theater:
• Participationinplaysthroughmediaandpersonal performance was positively correlated with live theater attendance.
• Readingplaysandattendingdramaclasseswere also related to live theater attendance.
• Economicandtimeconstraintswererelatedto lower rates of live theater attendance.
DeVeaux’s (1995) and Ateca-Amestoy’s (2008) findings indicate a relationship between arts participation through attendance and arts participation through electronic media for individual art forms. More broadly, their research suggests that similar relationships may exist for other arts forms such as classical music, ballet and visual arts.
It is unclear from previous work — such as Andreasen (1991) and Ateca-Amestoy (2008) — whether participating in the arts through electronic media directly leads to live attendance at arts events. Previous research raises other possibilities:
• Liveattendanceleadstoartsparticipationthrough electronic media;
• Artsparticipationthroughelectronicmediaand arts participation through other means reinforce one another; and
• Otherfactors—suchasartseducation or personal arts creation — help explain those relationships.
National Endowment for the Arts • Audience 2.0: How Technology Influences Arts Participation26
Does electronic media participation increase overall involvement in the arts? At least one study has explored arts participation through electronic media from the perspective of artists. Madden (2004) queried artists about whether electronic media has cultivated a greater interest in the arts overall.11 She also assessed artists’ attitudes about how the Internet has affected their careers. For example, did the Internet increase the exposure of artists to the public?
Relying on data from a national survey of artists and from an online survey of musicians, Madden found that, in general, artists believe that the Internet has increased the public’s involvement in the arts. According to Madden:
• TheInternetimprovesconnectionsbetweenartists, art communities, and audiences.
• TheInternetimprovesartists’abilitytoreachaudiences.
• VeryfewartistsreportedthattheInternethashurt their careers.
Madden’s findings suggest that the Internet has helped to cultivate public interest in the arts and allows artists to reach a broader range of potential participants. It is reasonable to ask whether public interest in the arts has increased even more during the past decade with greater accessibility to the Internet.
What role does electronic media play in the lives of U.S. adults and children? The Kaiser Family Foundation (2010) examined how and to what degree children and young adults between the ages of 8 and 18 use electronic media in their everyday lives. Overall, the study
found that electronic media use has increased dramatically over the past five years. Average daily usage among children and young adults increased substantially — in some cases by as much as 50 percent — for nearly all forms of electronic media. The Kaiser study also found that children and young adults are using a larger variety of electronic devices, with large increases in the use of portable devices and the Internet.
The Pew Internet & American Life Project (2005) examined how the Internet affects families, communities, education, politics and other aspects of people’s lives.13 Between 2000 and 2004, the number of American adults that used the Internet on a typical day increased by approximately 37 percent. The study described how that increase has affected Americans’ lives. For example, the study found that widespread Internet use increased the dissemination of information and increased opportunities for participation in various community activities.
Another important finding from the study related tohowhigh-speedInternetaccessinfluencesonline behavior. About 21 percent of broadband Internet users reported having viewed videos or listening to audio clips online, compared to only 9 percent of dial-up Internet users. As high-speed Internet access has continued to expand in recent years, one would expect that even more people use the Internet to view or listen to recorded or live arts performances.
National Endowment for the Arts • Audience 2.0: How Technology Influences Arts Participation 27
Notes1 Andreasen, Alan R. Expanding the Audience for the
Performing Arts. National Endowment for the Arts. Research Report #24, 1991.
2 DeVeaux, Scott. Jazz in America: Who’s listening. National Endowment for the Arts. Research Report #31, 1995.
3 Gray,CharlesM.Turning On and Tuning In: Media Participation in the Arts. National Endowment for the Arts. Research Report #33, 1995.
4 Benchmark arts activities include jazz, classical music, opera, musical plays, non-musical plays, ballet performances, and visual arts.
5 Because the 2008 SPPA included questions that differed substantially from previous surveys, more recent data on arts participation through electronic media could not be compared.
6 The full 2008 SPPA report can be found online at: http://www.nea.gov/research/2008-SPPA.pdf The 2008 SPPA User’s guide can be found online at: http://arts.endow.gov/research/SPPA/users-guide.pdf
7 The U.S. Census Bureau’s technical brief on the CPS can be found online at: http://www.bls.census.gov /cps/tp/tp63.htm
8 The U.S. Census Bureau encourages researchers to exercise caution when comparing population data across surveys, as changes in estimates may differ by more than what could be attributed to actual changes in the population.
9 Ateca-Amestoy, Victoria.“Participation through media and through practice as complements to live attendance.” University of the Basque Country, 2009.
10 Ateca-Amestoy, Victoria. “Determining heterogeneous behavior for theatre attendance.” Journal of Cultural Economics (2008) 32: 127-151.
11 Madden, Mary. “Arts, Musicians, and the Internet.” Pew Internet and American Life Project, 5 December 2004.
12 Generation M2: Media in the Lives of 8- to 18-Year-Olds. The Kaiser Family Foundation. January 2010.
13 “How the Internet has woven itself into American life.” Pew Internet and American Life Project. January 2005.
Arts Participation through Electronic Media
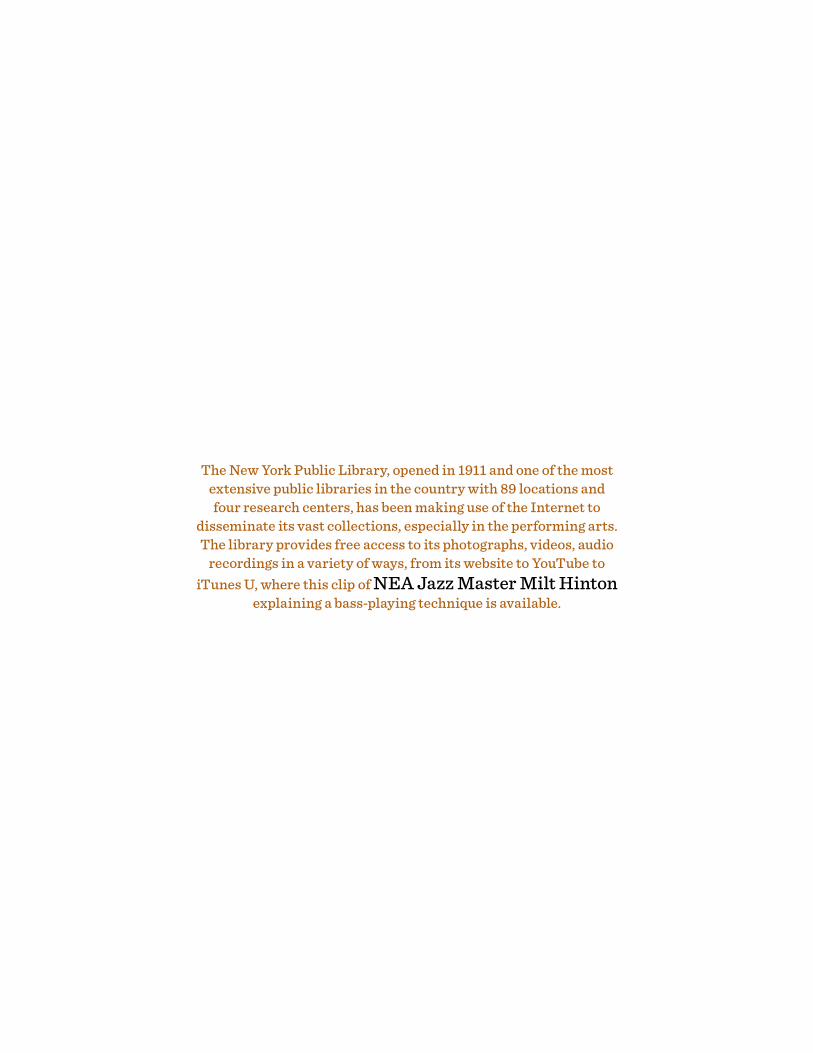
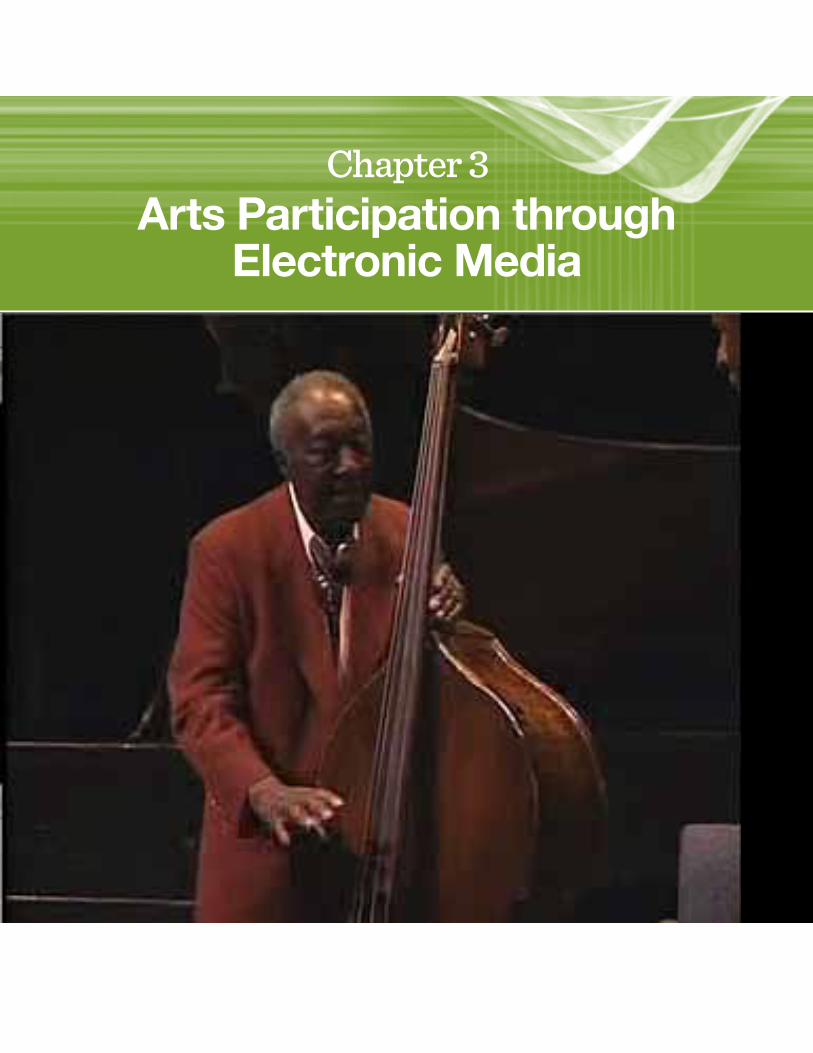
The New York Public Library, opened in 1911 and one of the most extensive public libraries in the country with 89 locations and four research centers, has been making use of the Internet to
disseminate its vast collections, especially in the performing arts. The library provides free access to its photographs, videos, audio
recordings in a variety of ways, from its website to YouTube to iTunes U, where this clip of NEA Jazz Master Milt Hinton
explaining a bass-playing technique is available.
Chapter 3Arts Participation through
Electronic Media
National Endowment for the Arts • Audience 2.0: How Technology Influences Arts Participation30
The NEA’s Survey of Public Participation in the Arts (SPPA) has tracked arts participation through electronic and digital media since its inception in 1982. Over the past three decades, the NEA has expanded the types of electronic
media considered in the SPPA to reflect the new forms of electronic media participation that have emerged during that time.
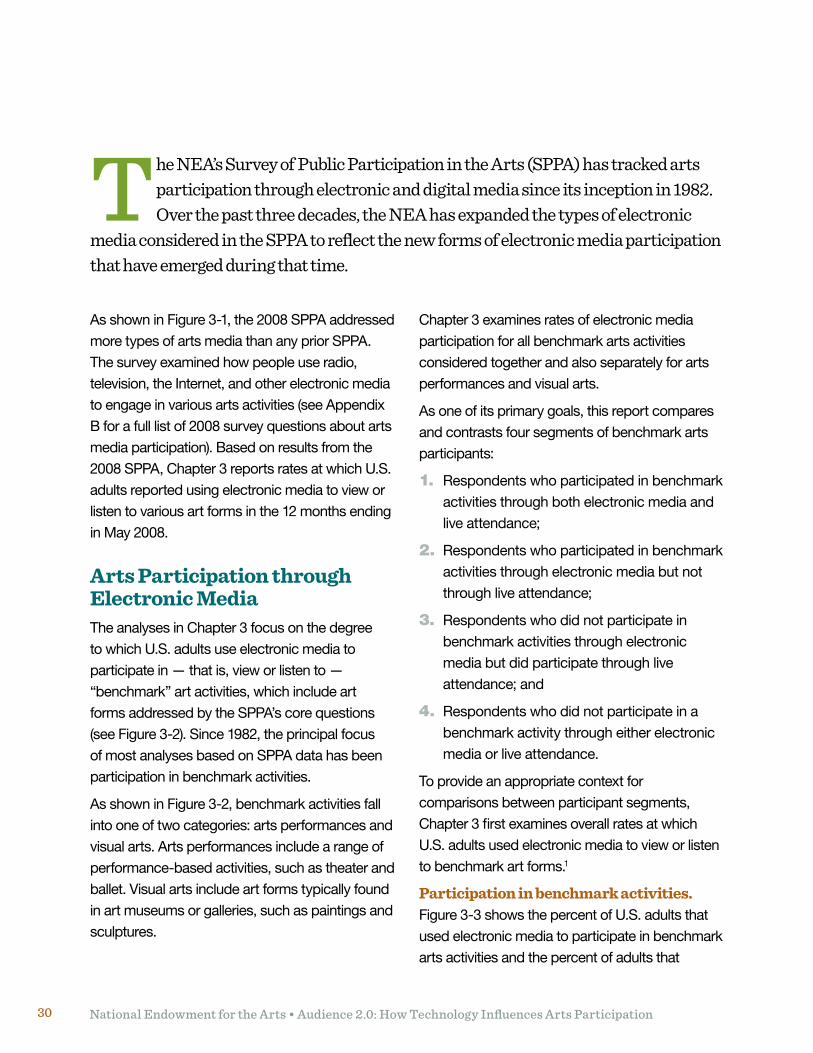
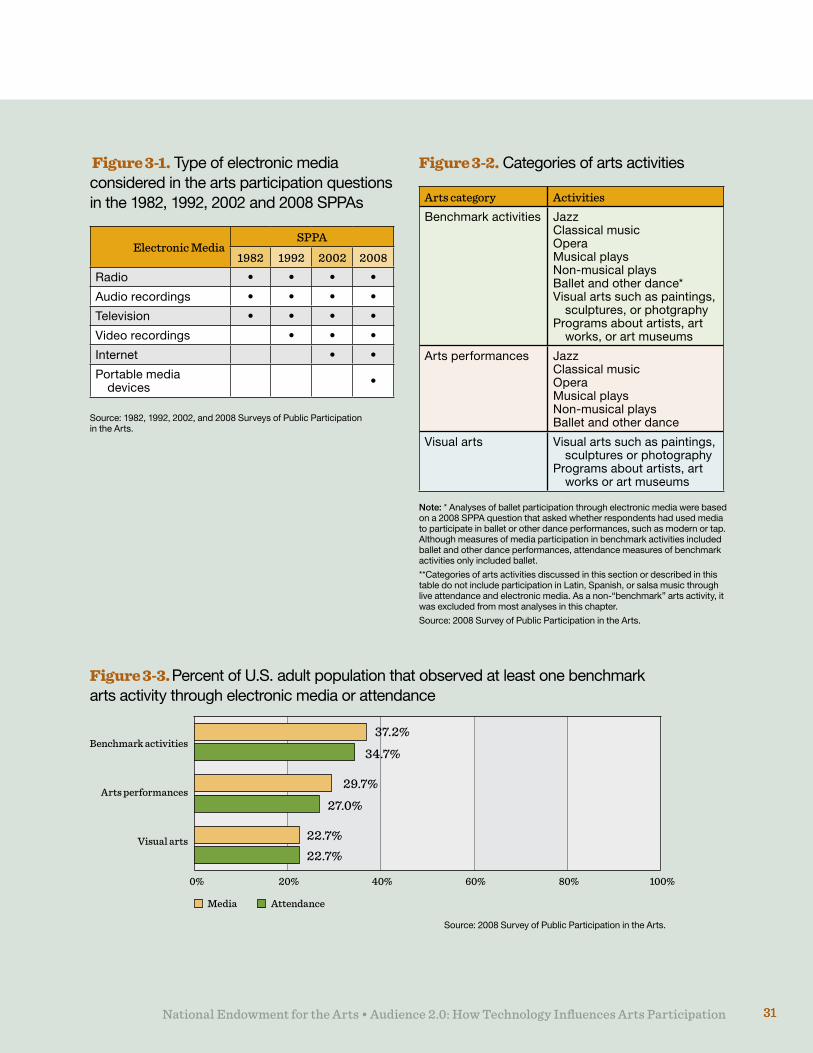
As shown in Figure 3-1, the 2008 SPPA addressed more types of arts media than any prior SPPA. The survey examined how people use radio, television, the Internet, and other electronic media to engage in various arts activities (see Appendix B for a full list of 2008 survey questions about arts media participation). Based on results from the 2008 SPPA, Chapter 3 reports rates at which U.S. adults reported using electronic media to view or listen to various art forms in the 12 months ending in May 2008.
Arts Participation through Electronic MediaThe analyses in Chapter 3 focus on the degree to which U.S. adults use electronic media to participate in — that is, view or listen to — “benchmark” art activities, which include art forms addressed by the SPPA’s core questions (see Figure 3-2). Since 1982, the principal focus of most analyses based on SPPA data has been participation in benchmark activities.
As shown in Figure 3-2, benchmark activities fall into one of two categories: arts performances and visual arts. Arts performances include a range of performance-based activities, such as theater and ballet. Visual arts include art forms typically found in art museums or galleries, such as paintings and sculptures.
Chapter 3 examines rates of electronic media participation for all benchmark arts activities considered together and also separately for arts performances and visual arts.
As one of its primary goals, this report compares and contrasts four segments of benchmark arts participants:
1. Respondents who participated in benchmark activities through both electronic media and live attendance;
2. Respondents who participated in benchmark activities through electronic media but not through live attendance;
3. Respondents who did not participate in benchmark activities through electronic media but did participate through live attendance; and
4. Respondents who did not participate in a benchmark activity through either electronic media or live attendance.
To provide an appropriate context for comparisons between participant segments, Chapter 3 first examines overall rates at which U.S. adults used electronic media to view or listen to benchmark art forms.1
Participation in benchmark activities. Figure 3-3 shows the percent of U.S. adults that used electronic media to participate in benchmark arts activities and the percent of adults that
National Endowment for the Arts • Audience 2.0: How Technology Influences Arts Participation 3131
Figure 3-1. Type of electronic media considered in the arts participation questions in the 1982, 1992, 2002 and 2008 SPPAs
Electronic MediaSPPA
1982 1992 2002 2008
Radio • • • •
Audio recordings • • • •
Television • • • •
Video recordings • • •
Internet • •
Portable media devices •
Source: 1982, 1992, 2002, and 2008 Surveys of Public Participation in the Arts.
Figure 3-2. Categories of arts activities
Note: * Analyses of ballet participation through electronic media were based on a 2008 SPPA question that asked whether respondents had used media to participate in ballet or other dance performances, such as modern or tap. Although measures of media participation in benchmark activities included ballet and other dance performances, attendance measures of benchmark activities only included ballet.
**Categories of arts activities discussed in this section or described in this table do not include participation in Latin, Spanish, or salsa music through live attendance and electronic media. As a non-“benchmark” arts activity, it was excluded from most analyses in this chapter.
Source: 2008 Survey of Public Participation in the Arts.
Figure 3-3. Percent of U.S. adult population that observed at least one benchmark arts activity through electronic media or attendance
0% 20% 40% 60% 80% 100%
Benchmark activities
Arts performances
Visual arts
Media Attendance
Source: 2008 Survey of Public Participation in the Arts.
Arts category Activities
Benchmark activities JazzClassical musicOperaMusical playsNon-musical playsBallet and other dance*Visual arts such as paintings,
sculptures, or photgraphyPrograms about artists, art
works, or art museums
Arts performances JazzClassical musicOperaMusical playsNon-musical playsBallet and other dance
Visual arts Visual arts such as paintings, sculptures or photography
Programs about artists, art works or art museums
37.2%
34.7%
29.7%
27.0%
22.7%
22.7%
National Endowment for the Arts • Audience 2.0: How Technology Influences Arts Participation32
Live attendance
Media participation
All benchmark activities Arts performances Visual artsAll adults 34.7 % 37.2 % 29.7 % 22.7 %
Gender
Male 32.4 % 35.6 % 27.8 % 21.9 %
Female 36.9 38.6 31.4 23.5
Location
Metro 36.8 % 38.7 % 31.0 % 23.8 %
Rural 24.4 28.6 22.5 16.8
Race and ethnicity
Hispanic 21.1 % 29.2 % 23.9 % 15.7 %
White* 39.8 39.6 30.6 25.8
African American* 21.6 33.3 30.5 12.2
Other* 31.9 35.0 29.4 22.5
Age
18-24 32.6 % 36.9 % 27.1 % 25.9 %
25-34 36.1 36.0 26.9 24.5
35-44 37.5 35.2 26.6 23.6
45-54 36.3 38.1 30.0 22.7
55-64 37.0 42.6 35.4 25.4
65-74 33.6 37.7 35.3 17.1
75 and over 21.2 32.2 30.1 12.3
Education
Gradeschool 6.5 % 20.4 % 16.1 % 9.0 %
Some high school 14.5 20.2 16.4 10.9
High school graduate 19.1 25.7 20.7 12.1
Some college 38.1 41.6 32.0 25.8
College graduate 57.8 53.4 42.9 36.4
Graduateschool 67.6 60.6 50.3 45.1
Income
Less than $10K 16.2 % 33.0 % 25.9 % 18.2 %
$10K to $20K 16.7 24.9 21.5 12.4
$20K to $30K 19.3 31.9 28.3 14.7
$30K to $40K 27.1 30.9 24.9 16.6
$40K to $50K 31.7 39.1 31.3 23.4
$50K to $75K 36.3 38.1 29.3 23.3
$75K to $100K 46.6 45.5 35.9 29.5
$100K to $150K 55.2 47.7 36.7 35.5
$150K and over 68.3 58.1 44.3 41.4
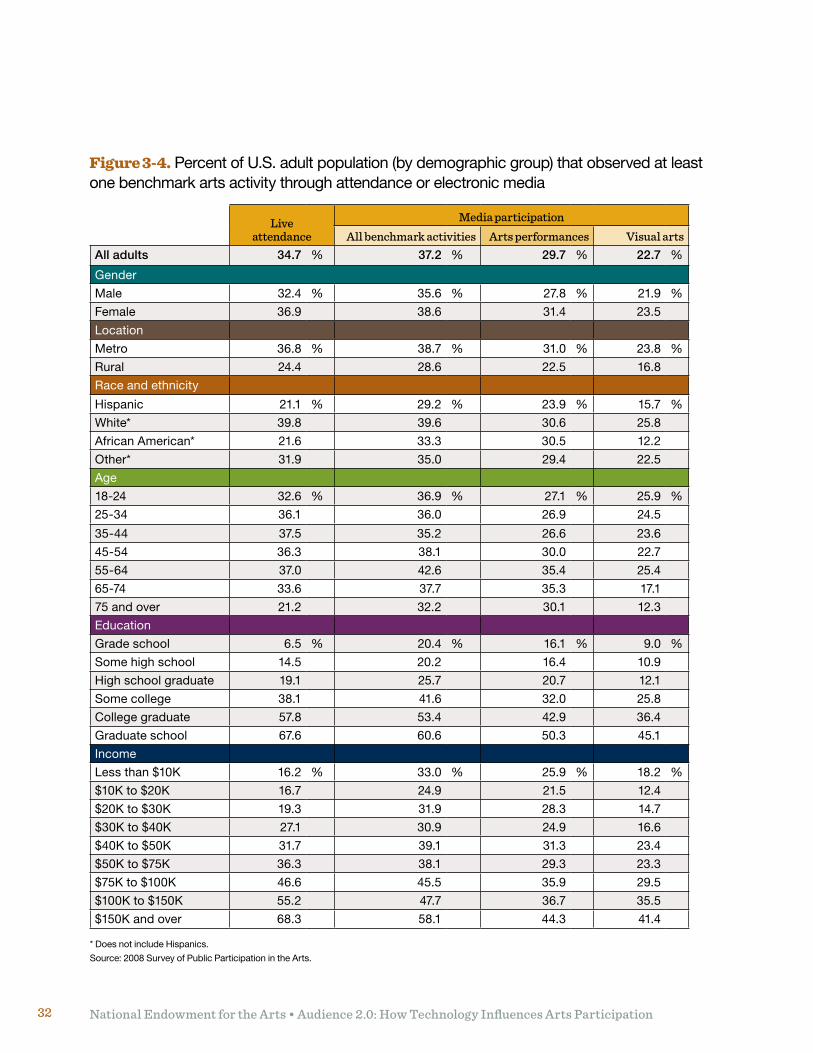
Figure 3-4. Percent of U.S. adult population (by demographic group) that observed at least one benchmark arts activity through attendance or electronic media
* Does not include Hispanics.
Source: 2008 Survey of Public Participation in the Arts.
National Endowment for the Arts • Audience 2.0: How Technology Influences Arts Participation 33
reported attending benchmark arts events.2 Data are shown for all benchmark activities considered together and separately for arts performances and visual arts.
Respondents were considered to have participated in a benchmark arts activity through electronic media if they used electronic media to view or listen to a recorded or live broadcasted jazz, classical music, opera or dance (including ballet) performance; a musical or non-musical play; a program about artists, art works, or art museums; or used the Internet to view visual art online.3
As shown in Figure 3-3, 37 percent of U.S. adults reported having used television, computers, the Internet or other media to view or listen to at least one benchmark art form in the 12 months ending in May 2008 — just slightly higher than the rate of attendance at benchmark arts events during the same time period (35%).4
Participation in arts performances. Respondents were considered to have used electronic media to participate in performance-based benchmark activities if they reported using electronic media to view or listen to a recorded or live broadcasted jazz, classical music, opera, or dance performance (including ballet), or a musical or non-musical play.
More U.S. adults viewed or listened to arts performances through electronic media than through live attendance (30% versus 27%).
Participation in visual arts. Respondents were considered to have participated in visual arts through electronic media if they used the Internet to view visual arts online or used electronic media to view or listen to a program about artists, art
works, or art museums in the 12 months ending in May 2008.
As shown in Figure 3-3, the same percentage of U.S. adults reported using electronic media to participate in visual arts as adults who reported attending art museums or galleries (23%).5
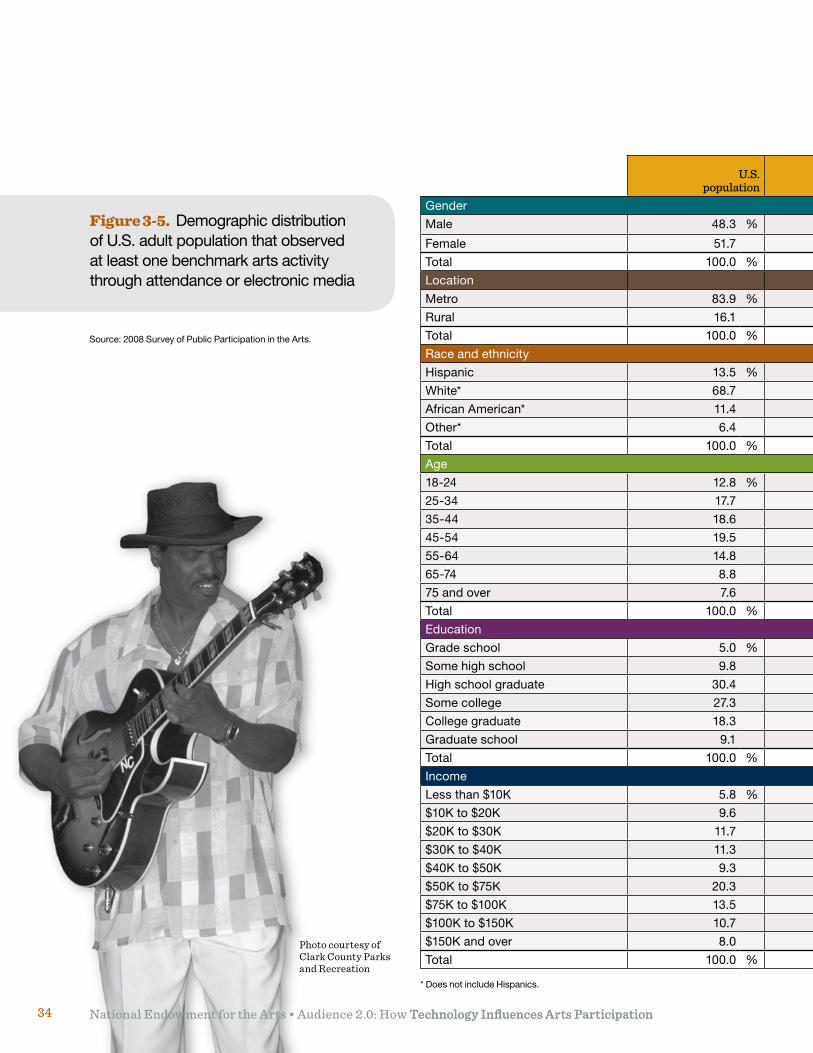
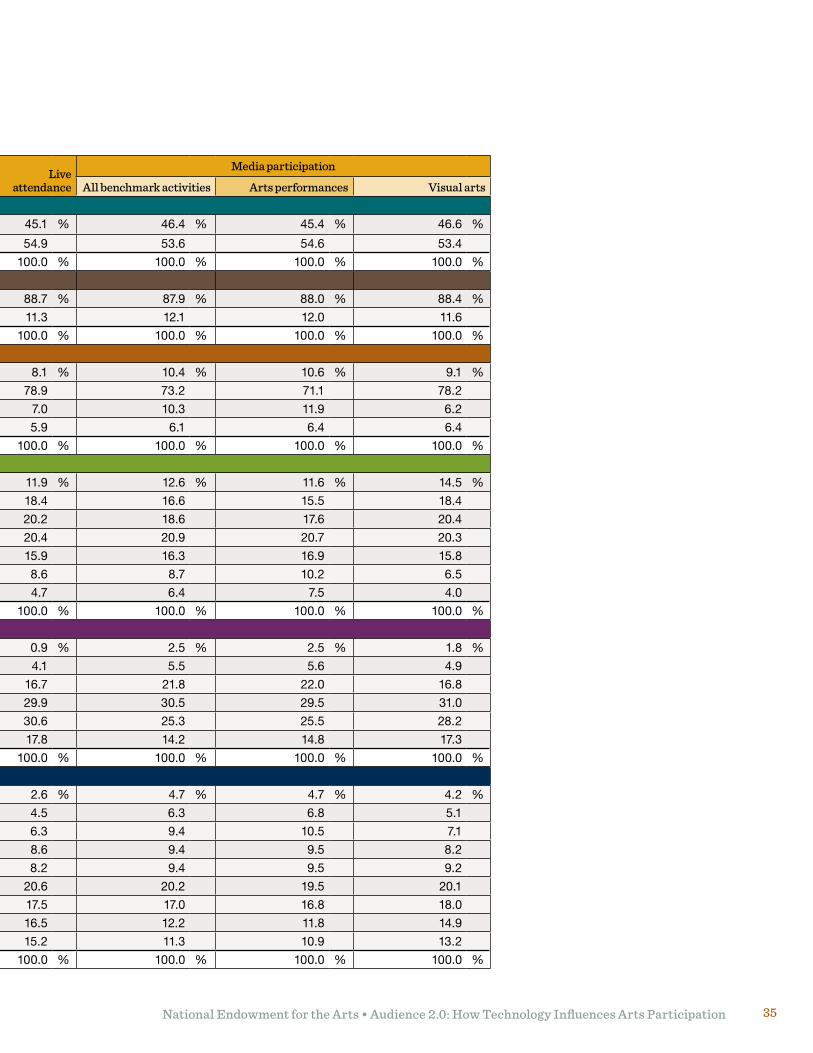
Demographic characteristics of people who viewed or listened to the arts through electronic media. Understanding who uses electronic media to participate in the arts is important in examining whether electronic media is changing how people do so. Figures 3-4 and 3-5 show demographic information about U.S. adults who reported using electronic media to participate in benchmark activities, arts performances, and visual arts in the 2008 SPPA.
Figure 3-4 presents overall rates of arts participation through electronic media by demographic group. For example, it answers the question: what percent of the male population used media to view or listen to at least one benchmark art form? The answer: 36%.
Figure 3-5 shows demographic distributions of U.S. adults who reported participating in each type of benchmark arts activity. For example, it answers the question: of U.S. adults who used media to view or listen to at least one benchmark art form, what percent were male? That answer: 46%.
Location. As shown in Figure 3-4, U.S. metropolitan area residents were more likely than rural residents to participate in benchmark activities through electronic media (39% versus 29%). This result was found when all benchmark activities were considered together and when arts performances and visual arts were considered separately.
National Endowment for the Arts • Audience 2.0: How Technology Influences Arts Participation34 National Endowment for the Arts • Audience 2.0: How Technology Influences Arts Participation34
U.S. population
Live attendance
Media participation
All benchmark activities Arts performances Visual artsGender
Male 48.3 % 45.1 % 46.4 % 45.4 % 46.6 %
Female 51.7 54.9 53.6 54.6 53.4
Total 100.0 % 100.0 % 100.0 % 100.0 % 100.0 %
Location
Metro 83.9 % 88.7 % 87.9 % 88.0 % 88.4 %
Rural 16.1 11.3 12.1 12.0 11.6
Total 100.0 % 100.0 % 100.0 % 100.0 % 100.0 %
Race and ethnicity
Hispanic 13.5 % 8.1 % 10.4 % 10.6 % 9.1 %
White* 68.7 78.9 73.2 71.1 78.2
African American* 11.4 7.0 10.3 11.9 6.2
Other* 6.4 5.9 6.1 6.4 6.4
Total 100.0 % 100.0 % 100.0 % 100.0 % 100.0 %
Age
18-24 12.8 % 11.9 % 12.6 % 11.6 % 14.5 %
25-34 17.7 18.4 16.6 15.5 18.4
35-44 18.6 20.2 18.6 17.6 20.4
45-54 19.5 20.4 20.9 20.7 20.3
55-64 14.8 15.9 16.3 16.9 15.8
65-74 8.8 8.6 8.7 10.2 6.5
75 and over 7.6 4.7 6.4 7.5 4.0
Total 100.0 % 100.0 % 100.0 % 100.0 % 100.0 %
Education
Gradeschool 5.0 % 0.9 % 2.5 % 2.5 % 1.8 %
Some high school 9.8 4.1 5.5 5.6 4.9
High school graduate 30.4 16.7 21.8 22.0 16.8
Some college 27.3 29.9 30.5 29.5 31.0
College graduate 18.3 30.6 25.3 25.5 28.2
Graduateschool 9.1 17.8 14.2 14.8 17.3
Total 100.0 % 100.0 % 100.0 % 100.0 % 100.0 %
Income
Less than $10K 5.8 % 2.6 % 4.7 % 4.7 % 4.2 %
$10K to $20K 9.6 4.5 6.3 6.8 5.1
$20K to $30K 11.7 6.3 9.4 10.5 7.1
$30K to $40K 11.3 8.6 9.4 9.5 8.2
$40K to $50K 9.3 8.2 9.4 9.5 9.2
$50K to $75K 20.3 20.6 20.2 19.5 20.1
$75K to $100K 13.5 17.5 17.0 16.8 18.0
$100K to $150K 10.7 16.5 12.2 11.8 14.9
$150K and over 8.0 15.2 11.3 10.9 13.2
Total 100.0 % 100.0 % 100.0 % 100.0 % 100.0 %
Figure 3-5. Demographic distribution of U.S. adult population that observed at least one benchmark arts activity through attendance or electronic media
Source: 2008 Survey of Public Participation in the Arts.
* Does not include Hispanics.
Photo courtesy of Clark County Parks and Recreation
National Endowment for the Arts • Audience 2.0: How Technology Influences Arts Participation 35
U.S. population
Live attendance
Media participation
All benchmark activities Arts performances Visual artsGender
Male 48.3 % 45.1 % 46.4 % 45.4 % 46.6 %
Female 51.7 54.9 53.6 54.6 53.4
Total 100.0 % 100.0 % 100.0 % 100.0 % 100.0 %
Location
Metro 83.9 % 88.7 % 87.9 % 88.0 % 88.4 %
Rural 16.1 11.3 12.1 12.0 11.6
Total 100.0 % 100.0 % 100.0 % 100.0 % 100.0 %
Race and ethnicity
Hispanic 13.5 % 8.1 % 10.4 % 10.6 % 9.1 %
White* 68.7 78.9 73.2 71.1 78.2
African American* 11.4 7.0 10.3 11.9 6.2
Other* 6.4 5.9 6.1 6.4 6.4
Total 100.0 % 100.0 % 100.0 % 100.0 % 100.0 %
Age
18-24 12.8 % 11.9 % 12.6 % 11.6 % 14.5 %
25-34 17.7 18.4 16.6 15.5 18.4
35-44 18.6 20.2 18.6 17.6 20.4
45-54 19.5 20.4 20.9 20.7 20.3
55-64 14.8 15.9 16.3 16.9 15.8
65-74 8.8 8.6 8.7 10.2 6.5
75 and over 7.6 4.7 6.4 7.5 4.0
Total 100.0 % 100.0 % 100.0 % 100.0 % 100.0 %
Education
Gradeschool 5.0 % 0.9 % 2.5 % 2.5 % 1.8 %
Some high school 9.8 4.1 5.5 5.6 4.9
High school graduate 30.4 16.7 21.8 22.0 16.8
Some college 27.3 29.9 30.5 29.5 31.0
College graduate 18.3 30.6 25.3 25.5 28.2
Graduateschool 9.1 17.8 14.2 14.8 17.3
Total 100.0 % 100.0 % 100.0 % 100.0 % 100.0 %
Income
Less than $10K 5.8 % 2.6 % 4.7 % 4.7 % 4.2 %
$10K to $20K 9.6 4.5 6.3 6.8 5.1
$20K to $30K 11.7 6.3 9.4 10.5 7.1
$30K to $40K 11.3 8.6 9.4 9.5 8.2
$40K to $50K 9.3 8.2 9.4 9.5 9.2
$50K to $75K 20.3 20.6 20.2 19.5 20.1
$75K to $100K 13.5 17.5 17.0 16.8 18.0
$100K to $150K 10.7 16.5 12.2 11.8 14.9
$150K and over 8.0 15.2 11.3 10.9 13.2
Total 100.0 % 100.0 % 100.0 % 100.0 % 100.0 %
National Endowment for the Arts • Audience 2.0: How Technology Influences Arts Participation36 National Endowment for the Arts • Audience 2.0: How Technology Influences Arts Participation36
Finding that people from metropolitan areas participate in the arts via electronic media at a higher rate than people from rural areas is consistent with live attendance data from the 2008 SPPA; metropolitan area residents reported participating in the arts via live attendance at a higher rate than rural residents.
Race and ethnicity. Non-Hispanic white adults (40%) were more likely than African-American (33%) and Hispanic (29%) adults to report using electronic media to view or listen to benchmark art forms. Adults of “other” races or ethnicities (35%) did not differ significantly from non-Hispanic white adults in terms of arts media participation.
African-American, Hispanic, and “other” adults were all more likely to report having participated in the arts through electronic media than through live attendance.
Age. As shown in Figure 3-4, U.S. adults between the ages of 55 and 64 (43%) were more likely than several other age groups — both younger and older — to report having participated in benchmark activities through electronic media.
When considering arts performances and visual arts separately, the relationship between age and arts participation through electronic media differed for the two types of arts activities. For arts performances, participation through electronic media tended to increase with age. For visual arts, participation through electronic media tended to decrease with age.
Education. The 2008 SPPA showed a strong relationship between educational attainment and arts participation through electronic media — respondents with more education tended to show higher rates of arts electronic media
participation. Live arts attendance exhibited a similar relationship with education.
Further comparisons between education and participation through electronic media indicated that adults with college or graduate degrees were less likely to use electronic media to view or listen to benchmark activities than to attend benchmark arts events. However, people without college degrees were more likely to participate in benchmark activities through electronic media than through live attendance.
Income. As with education, arts participation through electronic media appears to be strongly related to income — respondents who reported higher incomes tend to show higher rates of arts participation through electronic media than respondents with lower incomes.
Comparisons between attendance and media participation show that people with household incomes of $75,000 or more were less likely to participate in benchmark activities through electronic media than through live attendance. People with incomes of less than $75,000 were more likely to participate in benchmark activities through electronic media than through attendance.
Statistical relationships between arts participation through electronic media and various demographic factors. The demographic differences in arts participation through electronic media suggest that certain respondent characteristics predict the degree to which people use electronic media to engage in arts activities. To further examine whether these relationships exist, a regression analysis was conducted in which arts media participation was predicted from the demographic variables shown
National Endowment for the Arts • Audience 2.0: How Technology Influences Arts Participation 37
in Figures 3-4 and 3-5. The model measured the independent relationship between arts participation through electronic media and each demographic characteristic, after statistically controlling for other demographic factors included in the model.6
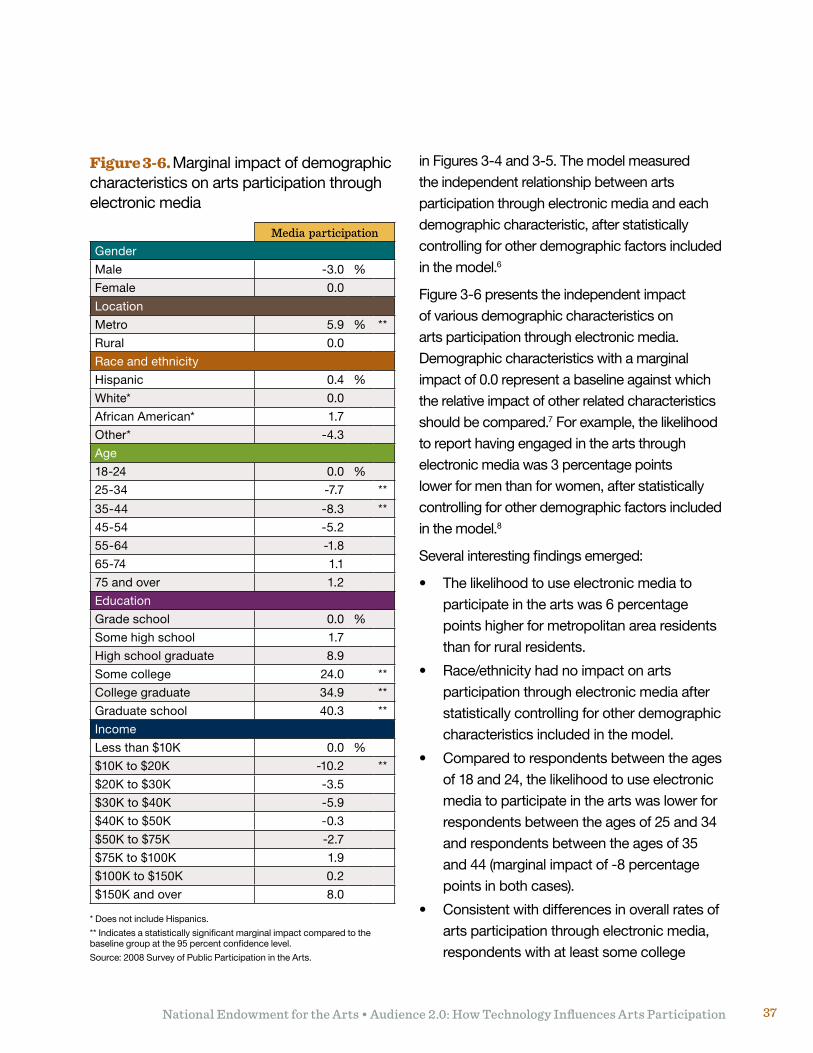
Figure 3-6 presents the independent impact of various demographic characteristics on arts participation through electronic media. Demographic characteristics with a marginal impact of 0.0 represent a baseline against which the relative impact of other related characteristics should be compared.7 For example, the likelihood to report having engaged in the arts through electronic media was 3 percentage points lower for men than for women, after statistically controlling for other demographic factors included in the model.8
Several interesting findings emerged:
• Thelikelihoodtouseelectronicmediatoparticipate in the arts was 6 percentage points higher for metropolitan area residents than for rural residents.
• Race/ethnicityhadnoimpactonartsparticipation through electronic media after statistically controlling for other demographic characteristics included in the model.
• Comparedtorespondentsbetweentheagesof 18 and 24, the likelihood to use electronic media to participate in the arts was lower for respondents between the ages of 25 and 34 and respondents between the ages of 35 and 44 (marginal impact of -8 percentage points in both cases).
• Consistentwithdifferencesinoverallratesofarts participation through electronic media, respondents with at least some college
Figure 3-6. Marginal impact of demographic characteristics on arts participation through electronic media
Media participationGender
Male -3.0 %
Female 0.0
Location
Metro 5.9 % **
Rural 0.0
Race and ethnicity
Hispanic 0.4 %
White* 0.0
African American* 1.7
Other* -4.3
Age
18-24 0.0 %
25-34 -7.7 **
35-44 -8.3 **
45-54 -5.2
55-64 -1.8
65-74 1.1
75 and over 1.2
Education
Gradeschool 0.0 %
Some high school 1.7
High school graduate 8.9
Some college 24.0 **
College graduate 34.9 **
Graduateschool 40.3 **
Income
Less than $10K 0.0 %
$10K to $20K -10.2 **
$20K to $30K -3.5
$30K to $40K -5.9
$40K to $50K -0.3
$50K to $75K -2.7
$75K to $100K 1.9
$100K to $150K 0.2
$150K and over 8.0
* Does not include Hispanics.
** Indicates a statistically significant marginal impact compared to the baseline group at the 95 percent confidence level.
Source: 2008 Survey of Public Participation in the Arts.
National Endowment for the Arts • Audience 2.0: How Technology Influences Arts Participation38
education were more likely than respondents with a grade school education to have used electronic media to participate in the arts.
• Incomehadlittleimpactonartsparticipationthrough electronic media after statistically controlling for other demographic characteristics included in the model.
Arts Participation by Participant SegmentAs discussed earlier, 2008 SPPA respondents can be grouped into four distinct participant segments:
1. Respondents who participated in benchmark arts activities through both electronic media and live attendance;
2. Respondents who participated in benchmark arts activities through electronic media alone and not through live attendance;
3. Respondents who participated in benchmark arts activities through live attendance alone and not through electronic media; and
4. Respondents who did not participate in a benchmark arts activity through either electronic media or live attendance.
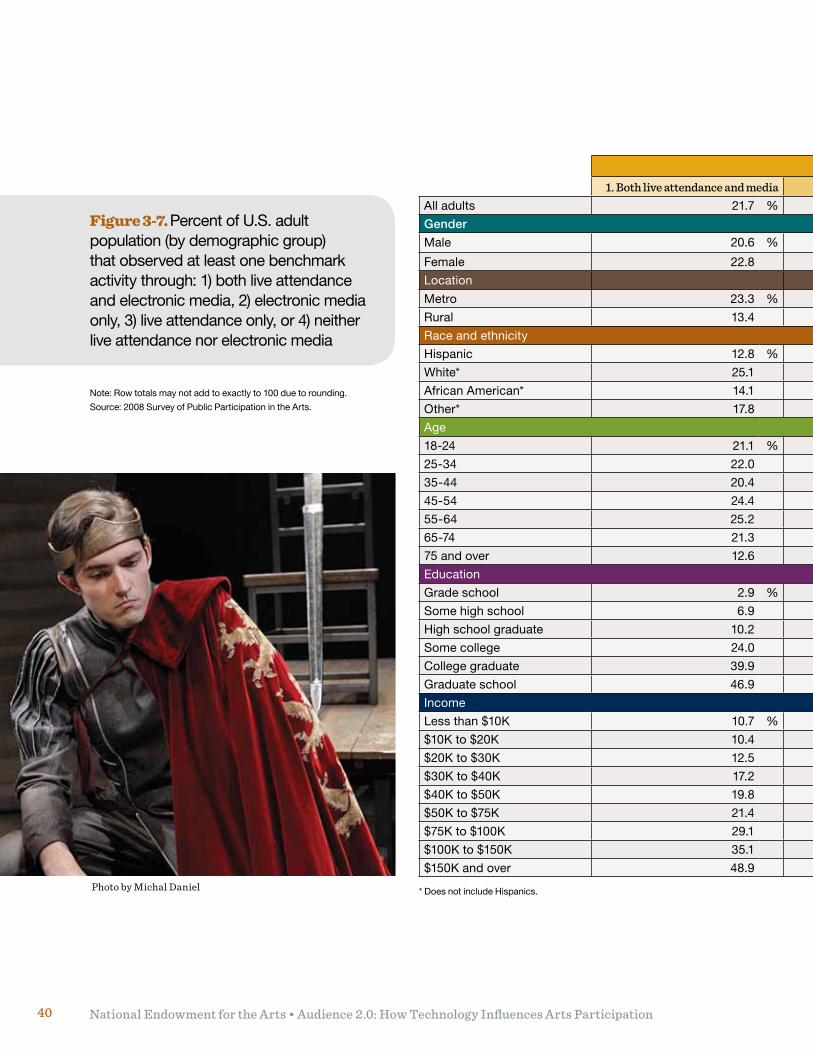
Examining the four participant segments provides important information about adults who are inclined (or disinclined) to participate in the arts through media, live attendance, or both. Figures 3-7 through 3-12 present overall rates and demographic information about the four participant segments. Figure 3-7 shows the percent of respondents by demographic group that fell into each of the four participant segments for all benchmark activities considered together, and Figure 3-8 shows corresponding demographic distributions.
Figure 3-9 presents the percent of respondents by demographic group that reported participating in benchmark arts performances through electronic media alone or through live attendance alone (demographic distributions are shown in Figure 3-10). Figure 3-11 shows the percent of respondents by demographic group that reported participating in visual arts through electronic media alone or through live attendance alone (demographic distributions are shown in Figure 3-12).9
1. Respondents who participated in benchmark arts activities through both electronic media and live attendance. Figure 3-7 presents the percent of U.S. adults that viewed or listened to benchmark art forms through electronic media and that also attended an arts event, according to the 2008 SPPA.
Participation rates. Respondents were considered to have participated in a benchmark activity through both electronic media and live attendance if they reported that, in the 12 months ending in May 2008, they had:
• Usedelectronicmediatovieworlistentoarecorded or live broadcasted jazz, classical music, opera, or dance performance (including ballet); a musical or non-musical play; a program about artists, art works, or art museums; or used the Internet to view visual art online; and
• Attendedajazz,classicalmusic,opera,orballet performance, a musical or non-musical play, or visited an art museum or gallery.
As illustrated in Figure 3-7, 22 percent of 2008 SPPA respondents reported having participated in at least one benchmark activity though both
National Endowment for the Arts • Audience 2.0: How Technology Influences Arts Participation 39
electronic media and live attendance in the 12 months ending in May 2008.
Demographic characteristics. Figures 3-7 shows that the percent of respondents that participated in benchmark activities through both electronic media and live attendance varied substantially across demographic groups.
Location. As shown in Figure 3-7, more respondents living in metropolitan areas (23%) reported participating in benchmark activities through both electronic media and live attendance than respondents living in rural areas (13%).
Race and ethnicity. More non-Hispanic white adults (25%) reported participating in benchmark activities through both electronic media and live attendancethanotherracial/ethnicgroups.
Age. U.S. adults 75 and older reported participating in benchmark activities through both electronic media and live attendance at a lower rate than adults between the ages of 18 and 64.
Education and income. People with more education and income tended to show higher rates of participation in benchmark arts activities through both electronic media and attendance than people with less education and income.
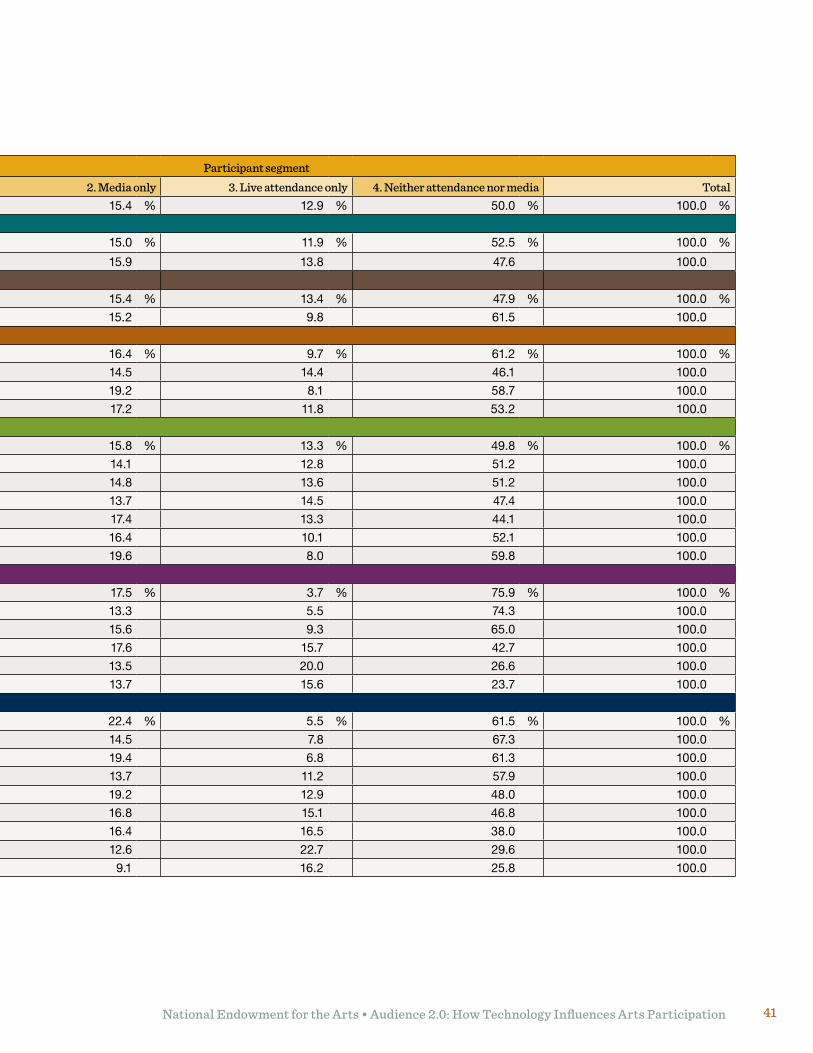
2. Respondents who participated in benchmark activities arts through electronic media alone and not live attendance. Figure 3-13 presents the percent of U.S. adults that reported viewing or listening to benchmark art forms through electronic media alone and not through live attendance.
Participation rates. Respondents were considered to have participated in a benchmark activity through electronic media but not live
attendance if they reported that, in the 12 months ending in May 2008, they had:
• Usedelectronicmediatovieworlistentoarecorded or live broadcasted jazz, classical music, opera, or dance (including ballet) performance; a musical or non-musical play; a program about artists, art works, or art museums; or used the Internet to view visual art online; but
• Didnotattendajazz,classicalmusic, opera, or ballet performance, a musical or non-musical play, or visit an art museum or gallery.
Figure 3-13 shows that 15 percent of 2008 SPPA respondents reported participating in at least one benchmark activity through electronic media only. Overall, 12 percent of respondents reported participating in an arts performances activity through electronic media only, whereas 8 percent reported participating in a visual arts activity through media only.
Demographic characteristics. The percent of U.S. adults that reported participating in benchmark arts activities through electronic media alone varied substantially by demographic group.
Location. As illustrated in Figure 3-7, metropolitan area residents were no more likely than rural area respondents participate in benchmark activities through electronic media alone. Approximately 15 percent of respondents from both groups reported viewing or listening to at least one benchmark art form through electronic media but not through live attendance.
Race and ethnicity. Non-Hispanic white adults werelesslikelythanotherracial/ethnicgroups
National Endowment for the Arts • Audience 2.0: How Technology Influences Arts Participation40
Participant segment
1. Both live attendance and media 2. Media only 3. Live attendance only 4. Neither attendance nor media TotalAll adults 21.7 % 15.4 % 12.9 % 50.0 % 100.0 %
Gender
Male 20.6 % 15.0 % 11.9 % 52.5 % 100.0 %
Female 22.8 15.9 13.8 47.6 100.0
Location
Metro 23.3 % 15.4 % 13.4 % 47.9 % 100.0 %
Rural 13.4 15.2 9.8 61.5 100.0
Race and ethnicity
Hispanic 12.8 % 16.4 % 9.7 % 61.2 % 100.0 %
White* 25.1 14.5 14.4 46.1 100.0
African American* 14.1 19.2 8.1 58.7 100.0
Other* 17.8 17.2 11.8 53.2 100.0
Age
18-24 21.1 % 15.8 % 13.3 % 49.8 % 100.0 %
25-34 22.0 14.1 12.8 51.2 100.0
35-44 20.4 14.8 13.6 51.2 100.0
45-54 24.4 13.7 14.5 47.4 100.0
55-64 25.2 17.4 13.3 44.1 100.0
65-74 21.3 16.4 10.1 52.1 100.0
75 and over 12.6 19.6 8.0 59.8 100.0
Education
Gradeschool 2.9 % 17.5 % 3.7 % 75.9 % 100.0 %
Some high school 6.9 13.3 5.5 74.3 100.0
High school graduate 10.2 15.6 9.3 65.0 100.0
Some college 24.0 17.6 15.7 42.7 100.0
College graduate 39.9 13.5 20.0 26.6 100.0
Graduateschool 46.9 13.7 15.6 23.7 100.0
Income
Less than $10K 10.7 % 22.4 % 5.5 % 61.5 % 100.0 %
$10K to $20K 10.4 14.5 7.8 67.3 100.0
$20K to $30K 12.5 19.4 6.8 61.3 100.0
$30K to $40K 17.2 13.7 11.2 57.9 100.0
$40K to $50K 19.8 19.2 12.9 48.0 100.0
$50K to $75K 21.4 16.8 15.1 46.8 100.0
$75K to $100K 29.1 16.4 16.5 38.0 100.0
$100K to $150K 35.1 12.6 22.7 29.6 100.0
$150K and over 48.9 9.1 16.2 25.8 100.0
Figure 3-7. Percent of U.S. adult population (by demographic group) that observed at least one benchmark activity through: 1) both live attendance and electronic media, 2) electronic media only, 3) live attendance only, or 4) neither live attendance nor electronic media
Note: Row totals may not add to exactly to 100 due to rounding.
Source: 2008 Survey of Public Participation in the Arts.
* Does not include Hispanics. Photo by Michal Daniel
National Endowment for the Arts • Audience 2.0: How Technology Influences Arts Participation 41
Participant segment
1. Both live attendance and media 2. Media only 3. Live attendance only 4. Neither attendance nor media TotalAll adults 21.7 % 15.4 % 12.9 % 50.0 % 100.0 %
Gender
Male 20.6 % 15.0 % 11.9 % 52.5 % 100.0 %
Female 22.8 15.9 13.8 47.6 100.0
Location
Metro 23.3 % 15.4 % 13.4 % 47.9 % 100.0 %
Rural 13.4 15.2 9.8 61.5 100.0
Race and ethnicity
Hispanic 12.8 % 16.4 % 9.7 % 61.2 % 100.0 %
White* 25.1 14.5 14.4 46.1 100.0
African American* 14.1 19.2 8.1 58.7 100.0
Other* 17.8 17.2 11.8 53.2 100.0
Age
18-24 21.1 % 15.8 % 13.3 % 49.8 % 100.0 %
25-34 22.0 14.1 12.8 51.2 100.0
35-44 20.4 14.8 13.6 51.2 100.0
45-54 24.4 13.7 14.5 47.4 100.0
55-64 25.2 17.4 13.3 44.1 100.0
65-74 21.3 16.4 10.1 52.1 100.0
75 and over 12.6 19.6 8.0 59.8 100.0
Education
Gradeschool 2.9 % 17.5 % 3.7 % 75.9 % 100.0 %
Some high school 6.9 13.3 5.5 74.3 100.0
High school graduate 10.2 15.6 9.3 65.0 100.0
Some college 24.0 17.6 15.7 42.7 100.0
College graduate 39.9 13.5 20.0 26.6 100.0
Graduateschool 46.9 13.7 15.6 23.7 100.0
Income
Less than $10K 10.7 % 22.4 % 5.5 % 61.5 % 100.0 %
$10K to $20K 10.4 14.5 7.8 67.3 100.0
$20K to $30K 12.5 19.4 6.8 61.3 100.0
$30K to $40K 17.2 13.7 11.2 57.9 100.0
$40K to $50K 19.8 19.2 12.9 48.0 100.0
$50K to $75K 21.4 16.8 15.1 46.8 100.0
$75K to $100K 29.1 16.4 16.5 38.0 100.0
$100K to $150K 35.1 12.6 22.7 29.6 100.0
$150K and over 48.9 9.1 16.2 25.8 100.0
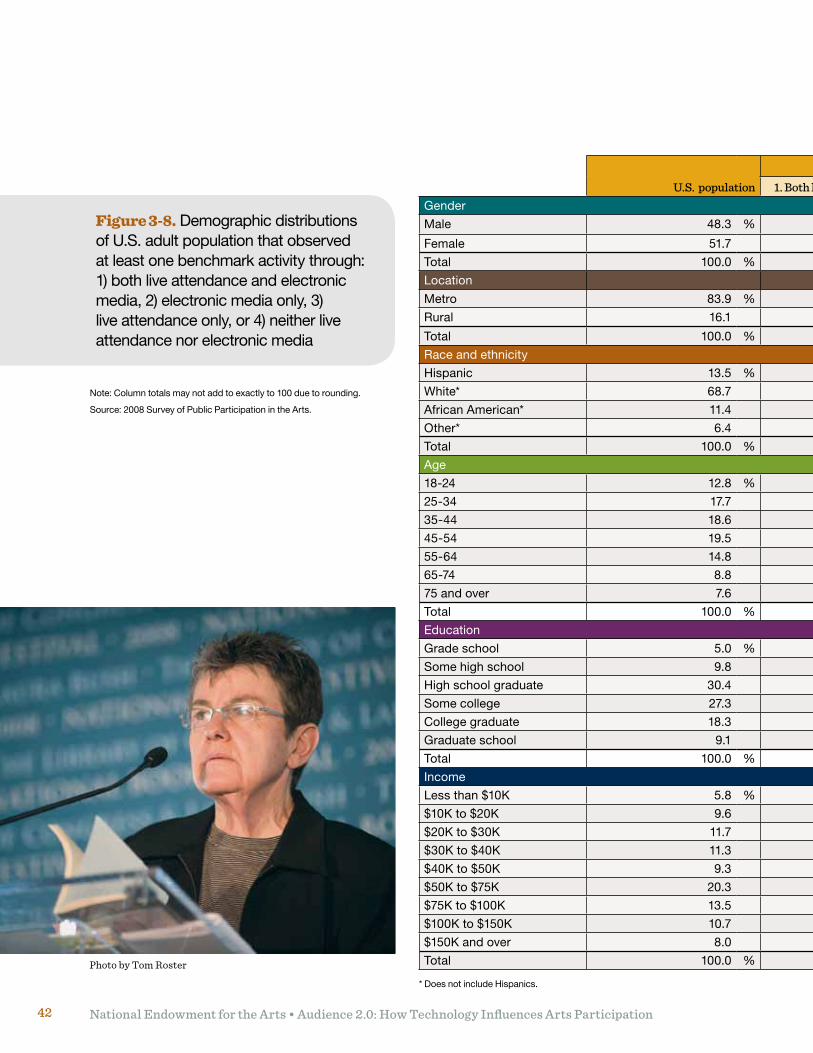
National Endowment for the Arts • Audience 2.0: How Technology Influences Arts Participation42
U.S. population
Media participation
1. Both live attendance and media 2. Media only 3. Live attendance only 4. Neither attendance nor mediaGender
Male 48.3 % 46.0 % 47.0 % 44.7 % 50.9 %
Female 51.7 54.0 53.0 55.3 49.1
Total 100.0 % 100.0 % 100.0 % 100.0 % 100.0 %
Location
Metro 83.9 % 90.3 % 84.5 % 87.9 % 80.6 %
Rural 16.1 9.7 15.5 12.1 19.4
Total 100.0 % 100.0 % 100.0 % 100.0 % 100.0 %
Race and ethnicity
Hispanic 13.5 % 7.8 % 14.0 % 9.9 % 16.1 %
White* 68.7 79.4 64.5 76.9 63.4
African American* 11.4 7.5 14.4 7.3 13.6
Other* 6.4 5.3 7.2 6.0 6.9
Total 100.0 % 100.0 % 100.0 % 100.0 % 100.0 %
Age
18-24 12.8 % 12.4 % 13.0 % 13.2 % 12.7 %
25-34 17.7 17.3 15.6 17.0 17.5
35-44 18.6 18.4 18.8 20.8 20.1
45-54 19.5 22.8 18.2 23.0 19.4
55-64 14.8 16.4 16.0 14.7 12.5
65-74 8.8 8.4 9.1 6.7 8.9
75 and over 7.6 4.3 9.4 4.6 8.9
Total 100.0 % 100.0 % 100.0 % 100.0 % 100.0 %
Education
Gradeschool 5.0 % 0.6 % 5.3 % 1.3 % 7.0 %
Some high school 9.8 3.2 8.8 4.3 15.1
High school graduate 30.4 14.8 31.8 22.8 41.0
Some college 27.3 30.2 31.1 33.5 23.3
College graduate 18.3 32.4 15.4 27.5 9.4
Graduateschool 9.1 18.8 7.7 10.6 4.1
Total 100.0 % 100.0 % 100.0 % 100.0 % 100.0 %
Income
Less than $10K 5.8 % 2.6 % 7.7 % 2.3 % 7.1 %
$10K to $20K 9.6 4.5 8.9 5.7 13.6
$20K to $30K 11.7 6.3 13.8 5.8 14.6
$30K to $40K 11.3 8.9 10.0 9.9 14.1
$40K to $50K 9.3 8.1 11.2 9.0 9.3
$50K to $75K 20.3 19.4 21.5 23.3 19.9
$75K to $100K 13.5 18.5 14.8 17.9 11.4
$100K to $150K 10.7 15.4 7.8 16.9 6.1
$150K and over 8.0 16.3 4.3 9.2 4.0
Total 100.0 % 100.0 % 100.0 % 100.0 % 100.0 %
Figure 3-8. Demographic distributions of U.S. adult population that observed at least one benchmark activity through: 1) both live attendance and electronic media, 2) electronic media only, 3) live attendance only, or 4) neither live attendance nor electronic media
Note: Column totals may not add to exactly to 100 due to rounding.
Source: 2008 Survey of Public Participation in the Arts.
* Does not include Hispanics.
Photo by Tom Roster
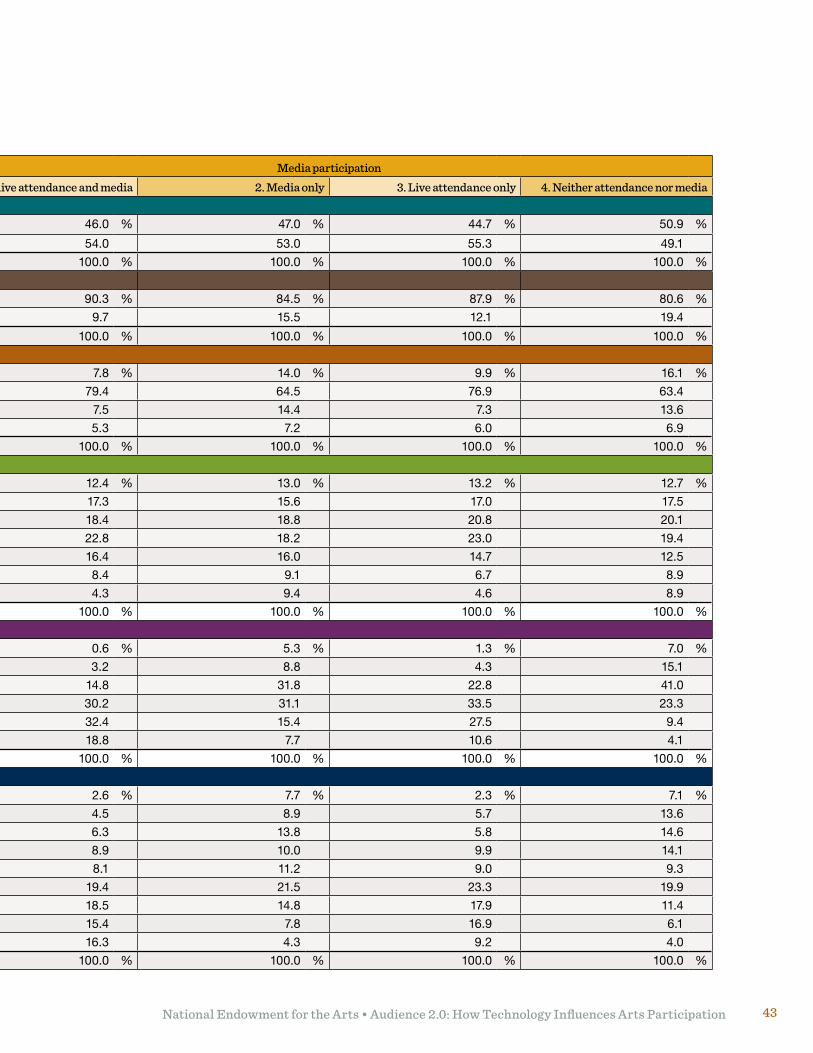
National Endowment for the Arts • Audience 2.0: How Technology Influences Arts Participation 43
U.S. population
Media participation
1. Both live attendance and media 2. Media only 3. Live attendance only 4. Neither attendance nor mediaGender
Male 48.3 % 46.0 % 47.0 % 44.7 % 50.9 %
Female 51.7 54.0 53.0 55.3 49.1
Total 100.0 % 100.0 % 100.0 % 100.0 % 100.0 %
Location
Metro 83.9 % 90.3 % 84.5 % 87.9 % 80.6 %
Rural 16.1 9.7 15.5 12.1 19.4
Total 100.0 % 100.0 % 100.0 % 100.0 % 100.0 %
Race and ethnicity
Hispanic 13.5 % 7.8 % 14.0 % 9.9 % 16.1 %
White* 68.7 79.4 64.5 76.9 63.4
African American* 11.4 7.5 14.4 7.3 13.6
Other* 6.4 5.3 7.2 6.0 6.9
Total 100.0 % 100.0 % 100.0 % 100.0 % 100.0 %
Age
18-24 12.8 % 12.4 % 13.0 % 13.2 % 12.7 %
25-34 17.7 17.3 15.6 17.0 17.5
35-44 18.6 18.4 18.8 20.8 20.1
45-54 19.5 22.8 18.2 23.0 19.4
55-64 14.8 16.4 16.0 14.7 12.5
65-74 8.8 8.4 9.1 6.7 8.9
75 and over 7.6 4.3 9.4 4.6 8.9
Total 100.0 % 100.0 % 100.0 % 100.0 % 100.0 %
Education
Gradeschool 5.0 % 0.6 % 5.3 % 1.3 % 7.0 %
Some high school 9.8 3.2 8.8 4.3 15.1
High school graduate 30.4 14.8 31.8 22.8 41.0
Some college 27.3 30.2 31.1 33.5 23.3
College graduate 18.3 32.4 15.4 27.5 9.4
Graduateschool 9.1 18.8 7.7 10.6 4.1
Total 100.0 % 100.0 % 100.0 % 100.0 % 100.0 %
Income
Less than $10K 5.8 % 2.6 % 7.7 % 2.3 % 7.1 %
$10K to $20K 9.6 4.5 8.9 5.7 13.6
$20K to $30K 11.7 6.3 13.8 5.8 14.6
$30K to $40K 11.3 8.9 10.0 9.9 14.1
$40K to $50K 9.3 8.1 11.2 9.0 9.3
$50K to $75K 20.3 19.4 21.5 23.3 19.9
$75K to $100K 13.5 18.5 14.8 17.9 11.4
$100K to $150K 10.7 15.4 7.8 16.9 6.1
$150K and over 8.0 16.3 4.3 9.2 4.0
Total 100.0 % 100.0 % 100.0 % 100.0 % 100.0 %
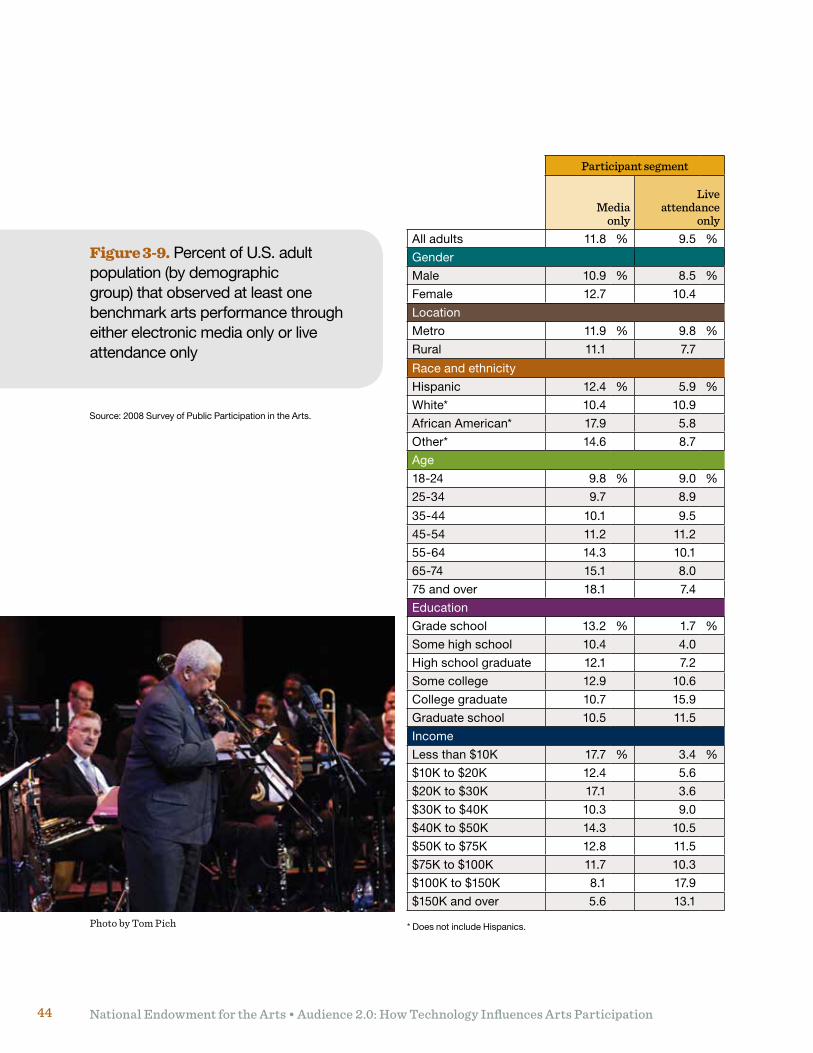
National Endowment for the Arts • Audience 2.0: How Technology Influences Arts Participation44
Figure 3-9. Percent of U.S. adult population (by demographic group) that observed at least one benchmark arts performance through either electronic media only or live attendance only
Participant segment
Media only
Live attendance
onlyAll adults 11.8 % 9.5 %
Gender
Male 10.9 % 8.5 %
Female 12.7 10.4
Location
Metro 11.9 % 9.8 %
Rural 11.1 7.7
Race and ethnicity
Hispanic 12.4 % 5.9 %
White* 10.4 10.9
African American* 17.9 5.8
Other* 14.6 8.7
Age
18-24 9.8 % 9.0 %
25-34 9.7 8.9
35-44 10.1 9.5
45-54 11.2 11.2
55-64 14.3 10.1
65-74 15.1 8.0
75 and over 18.1 7.4
Education
Gradeschool 13.2 % 1.7 %
Some high school 10.4 4.0
High school graduate 12.1 7.2
Some college 12.9 10.6
College graduate 10.7 15.9
Graduateschool 10.5 11.5
Income
Less than $10K 17.7 % 3.4 %
$10K to $20K 12.4 5.6
$20K to $30K 17.1 3.6
$30K to $40K 10.3 9.0
$40K to $50K 14.3 10.5
$50K to $75K 12.8 11.5
$75K to $100K 11.7 10.3
$100K to $150K 8.1 17.9
$150K and over 5.6 13.1
Source: 2008 Survey of Public Participation in the Arts.
* Does not include Hispanics. Photo by Tom Pich
National Endowment for the Arts • Audience 2.0: How Technology Influences Arts Participation 45
considered together to participate in the arts through electronic media (15% versus 18%).
Age. Adults 75 and older were more likely than adults between the ages of 18 and 74 to participate in benchmark art forms through electronic media alone (18% versus 15%).
As shown in Figures 3-9 through 3-12, when considering arts performances and visual arts separately, different relationships emerged between age and arts participation through electronic media alone. Participation in arts performances through electronic media alone tended to increase with respondent age, but participation in visual arts through electronic media alone tended to decrease with respondent age.
Education. There was no relationship between level of education and arts participation through electronic media alone, either when benchmark arts activities were considered together or when arts performances and visual arts were considered separately. However, people who did not graduate high school were substantially more likely to participate in the arts through electronic media alone than through both electronic media and attendance or through attendance alone.
Income. The 2008 SPPA showed a strong inverse relationship between income and arts participation through electronic media alone — people with lower incomes tended to show higher rates of viewing or listening to benchmark art forms through electronic media alone than people with higher incomes.
3. Respondents who participated in benchmark arts activities through live attendance alone and not electronic media. Figure 3-14 presents the percent of U.S. adults that reported attending at
least one benchmark arts event but did not use electronic media to participate in a benchmark art form in the 12-month period ending in May 2008.
Participation rates. Respondents were considered to have participated in a benchmark activity through live attendance but not through electronic media if they had:
• Attendedajazz,classicalmusic,opera,orballet performance, a musical or non-musical play, or visited an art museum or gallery; but
• Didnotuseelectronicmediatovieworlisten to a recorded or live broadcasted jazz, classical music, opera, or dance (including ballet) performance; a musical or non-musical play; a program about artists, art works, or art museums; and did not use the Internet to view visual art online.
As shown in Figure 3-14, 13 percent of 2008 SPPA respondents participated in benchmark activities through live attendance alone and did not use electronic media to view or listen to benchmark art forms. More non-media arts participants attended live performances than visual arts activities (10% versus 6%).
Demographic characteristics. Figures 3-7 through 3-12 present demographic information about U.S. adults who reported participating in benchmark activities through live attendance but not through electronic media.
Location. Figure 3-7 shows that metropolitan area residents were more likely than rural residents to report participating in benchmark activities through live attendance alone and not through media (13% versus 10%). Figure 3-11 shows a similar pattern for visual arts (7% versus 4%), but the same pattern was not observed for arts performances.
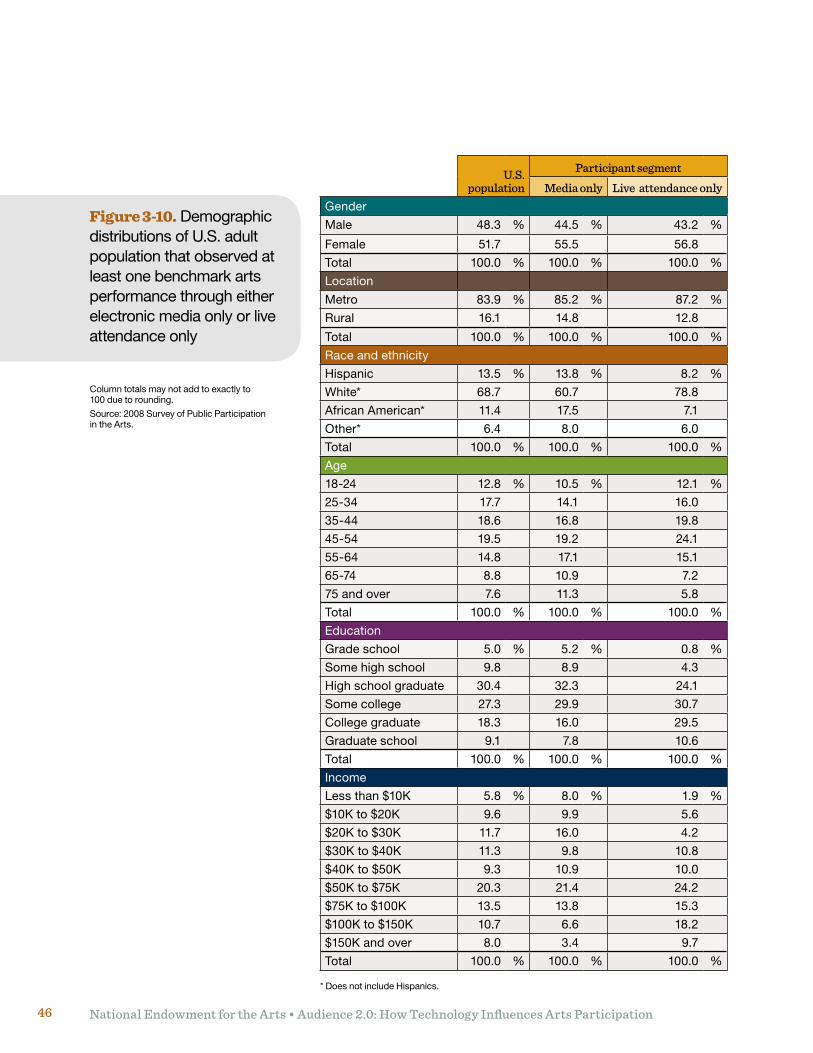
National Endowment for the Arts • Audience 2.0: How Technology Influences Arts Participation46
Figure 3-10. Demographic distributions of U.S. adult population that observed at least one benchmark arts performance through either electronic media only or live attendance only
Column totals may not add to exactly to 100 due to rounding.
Source: 2008 Survey of Public Participation in the Arts.
U.S. population
Participant segment
Media only Live attendance onlyGender
Male 48.3 % 44.5 % 43.2 %
Female 51.7 55.5 56.8
Total 100.0 % 100.0 % 100.0 %
Location
Metro 83.9 % 85.2 % 87.2 %
Rural 16.1 14.8 12.8
Total 100.0 % 100.0 % 100.0 %
Race and ethnicity
Hispanic 13.5 % 13.8 % 8.2 %
White* 68.7 60.7 78.8
African American* 11.4 17.5 7.1
Other* 6.4 8.0 6.0
Total 100.0 % 100.0 % 100.0 %
Age
18-24 12.8 % 10.5 % 12.1 %
25-34 17.7 14.1 16.0
35-44 18.6 16.8 19.8
45-54 19.5 19.2 24.1
55-64 14.8 17.1 15.1
65-74 8.8 10.9 7.2
75 and over 7.6 11.3 5.8
Total 100.0 % 100.0 % 100.0 %
Education
Gradeschool 5.0 % 5.2 % 0.8 %
Some high school 9.8 8.9 4.3
High school graduate 30.4 32.3 24.1
Some college 27.3 29.9 30.7
College graduate 18.3 16.0 29.5
Graduateschool 9.1 7.8 10.6
Total 100.0 % 100.0 % 100.0 %
Income
Less than $10K 5.8 % 8.0 % 1.9 %
$10K to $20K 9.6 9.9 5.6
$20K to $30K 11.7 16.0 4.2
$30K to $40K 11.3 9.8 10.8
$40K to $50K 9.3 10.9 10.0
$50K to $75K 20.3 21.4 24.2
$75K to $100K 13.5 13.8 15.3
$100K to $150K 10.7 6.6 18.2
$150K and over 8.0 3.4 9.7
Total 100.0 % 100.0 % 100.0 %
* Does not include Hispanics.
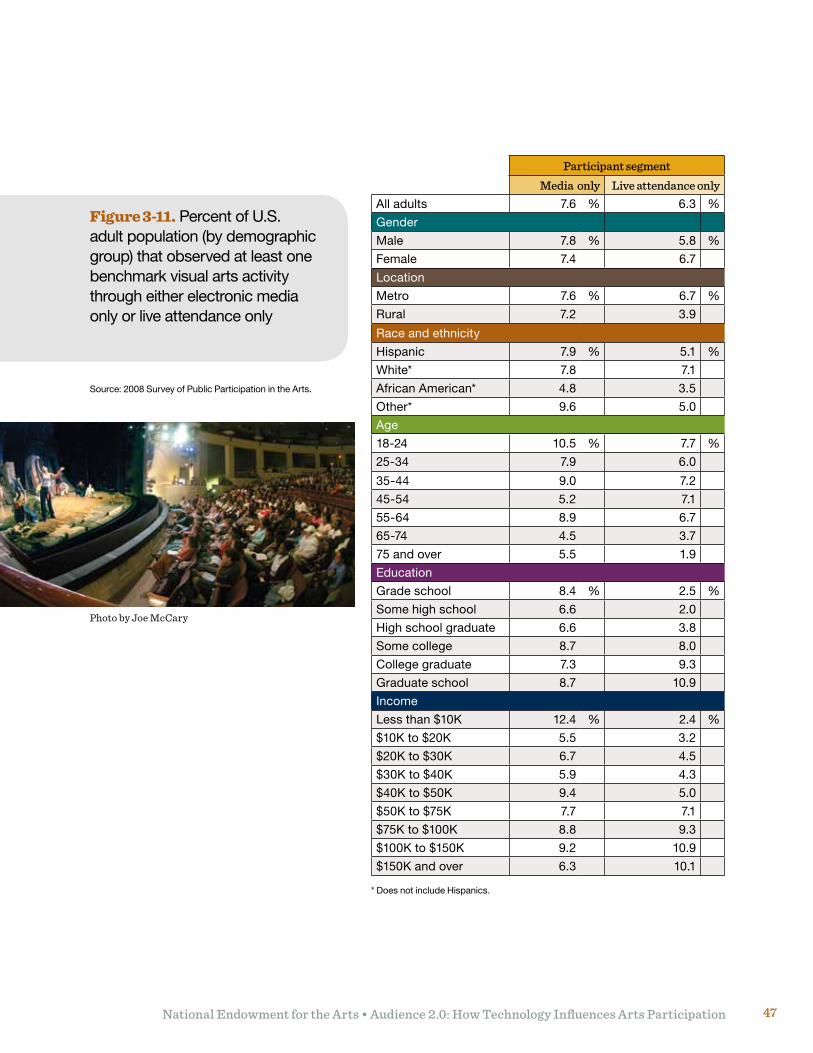
National Endowment for the Arts • Audience 2.0: How Technology Influences Arts Participation 47
Figure 3-11. Percent of U.S. adult population (by demographic group) that observed at least one benchmark visual arts activity through either electronic media only or live attendance only
Participant segment
Media only Live attendance onlyAll adults 7.6 % 6.3 %
Gender
Male 7.8 % 5.8 %
Female 7.4 6.7
Location
Metro 7.6 % 6.7 %
Rural 7.2 3.9
Race and ethnicity
Hispanic 7.9 % 5.1 %
White* 7.8 7.1
African American* 4.8 3.5
Other* 9.6 5.0
Age
18-24 10.5 % 7.7 %
25-34 7.9 6.0
35-44 9.0 7.2
45-54 5.2 7.1
55-64 8.9 6.7
65-74 4.5 3.7
75 and over 5.5 1.9
Education
Gradeschool 8.4 % 2.5 %
Some high school 6.6 2.0
High school graduate 6.6 3.8
Some college 8.7 8.0
College graduate 7.3 9.3
Graduateschool 8.7 10.9
Income
Less than $10K 12.4 % 2.4 %
$10K to $20K 5.5 3.2
$20K to $30K 6.7 4.5
$30K to $40K 5.9 4.3
$40K to $50K 9.4 5.0
$50K to $75K 7.7 7.1
$75K to $100K 8.8 9.3
$100K to $150K 9.2 10.9
$150K and over 6.3 10.1
Source: 2008 Survey of Public Participation in the Arts.
* Does not include Hispanics.
Photo by Joe McCary
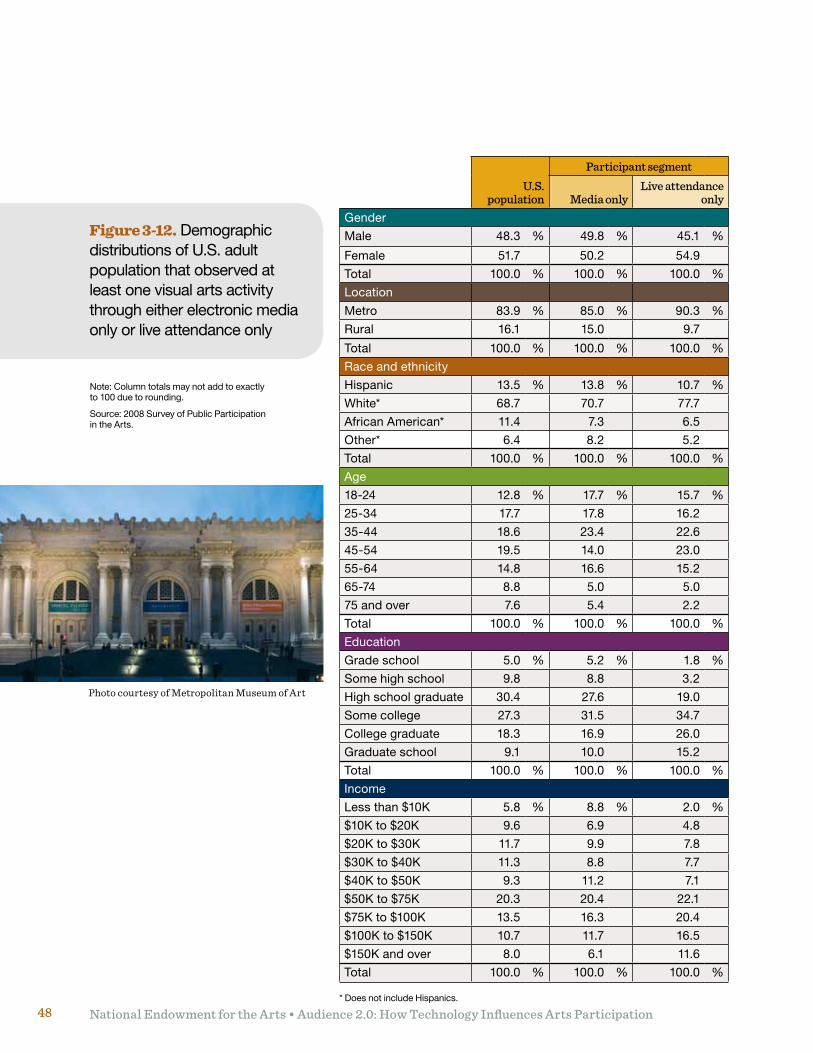
National Endowment for the Arts • Audience 2.0: How Technology Influences Arts Participation48
U.S. population
Participant segment
Media onlyLive attendance
onlyGender
Male 48.3 % 49.8 % 45.1 %
Female 51.7 50.2 54.9
Total 100.0 % 100.0 % 100.0 %
Location
Metro 83.9 % 85.0 % 90.3 %
Rural 16.1 15.0 9.7
Total 100.0 % 100.0 % 100.0 %
Race and ethnicity
Hispanic 13.5 % 13.8 % 10.7 %
White* 68.7 70.7 77.7
African American* 11.4 7.3 6.5
Other* 6.4 8.2 5.2
Total 100.0 % 100.0 % 100.0 %
Age
18-24 12.8 % 17.7 % 15.7 %
25-34 17.7 17.8 16.2
35-44 18.6 23.4 22.6
45-54 19.5 14.0 23.0
55-64 14.8 16.6 15.2
65-74 8.8 5.0 5.0
75 and over 7.6 5.4 2.2
Total 100.0 % 100.0 % 100.0 %
Education
Gradeschool 5.0 % 5.2 % 1.8 %
Some high school 9.8 8.8 3.2
High school graduate 30.4 27.6 19.0
Some college 27.3 31.5 34.7
College graduate 18.3 16.9 26.0
Graduateschool 9.1 10.0 15.2
Total 100.0 % 100.0 % 100.0 %
Income
Less than $10K 5.8 % 8.8 % 2.0 %
$10K to $20K 9.6 6.9 4.8
$20K to $30K 11.7 9.9 7.8
$30K to $40K 11.3 8.8 7.7
$40K to $50K 9.3 11.2 7.1
$50K to $75K 20.3 20.4 22.1
$75K to $100K 13.5 16.3 20.4
$100K to $150K 10.7 11.7 16.5
$150K and over 8.0 6.1 11.6
Total 100.0 % 100.0 % 100.0 %
Figure 3-12. Demographic distributions of U.S. adult population that observed at least one visual arts activity through either electronic media only or live attendance only
Note: Column totals may not add to exactly to 100 due to rounding.
Source: 2008 Survey of Public Participation in the Arts.
* Does not include Hispanics.
Photo courtesy of Metropolitan Museum of Art
National Endowment for the Arts • Audience 2.0: How Technology Influences Arts Participation 49
Race and ethnicity. Non-Hispanic white adults (14%) were more likely than Hispanics (10%) and African Americans (8%) to report participating in benchmark arts activities through live attendance alone. Adults of other races and ethnicities (12%) reported having participated in benchmark activities via attendance alone at a rate comparable with that of non-Hispanic white adults.
Age. About 9 percent of U.S. adults 65 and older reported participating in benchmark arts activities through live attendance alone and not through electronic media, a lower rate than for adults between the ages of 18 and 64 (14%). Results for specific age groups are shown in Figure 3-7.
Education and income. Data from the 2008 SPPA indicate that people with more education and higher incomes tend to exhibit higher rates of arts participation through live attendance alone than people with less education and lower incomes. This pattern was observed when considering all benchmark arts activities together and when considering arts performances and visual arts separately.
4. Respondents who did not participate in benchmark arts activities through either electronic media or live attendance. A relatively large number of U.S. adults did not participate in the benchmark arts through either electronic media or live attendance according to the 2008 SPPA. Respondents were considered to have not participated in a benchmark activity through either electronic media or attendance if they:
• Didnotuseelectronicmediatovieworlisten to a recorded or live broadcasted jazz,
classical music, opera, or dance (including ballet) performances; a musical or non-musical play; a program about artists, art works, or art museums; and did not use the Internet to view visual art online; and
• Didnotattendajazz,classicalmusic, opera, or ballet performance, a musical or non-musical play, or visit an art museum or gallery.
Fifty percent of respondents reported that they did not participate in a benchmark arts activity through either electronic media or live attendance.
Demographic characteristics. Figures 3-7 and 3-8 present demographic information about U.S. adults who did not participate in benchmark arts activities through either electronic media or attendance.
Location. As shown in Figure 3-7, a higher percentage of adults from rural areas than metropolitan areas reported that they neither used electronic media to view or listen to benchmark art forms nor attended a benchmark arts event (62% versus 48%).
Race and ethnicity. A relatively high proportion of Hispanic (61%) and African-American (59%) adults reported not having participated in benchmark activities through either electronic media or live attendance in the 12 months ending in May 2008. Non-Hispanic white Americans (46%) exhibited a lower non-participation rate than both groups.
Age. U.S. adults 65 and older were more likely than younger age groups to report not having participated in benchmark activities through either electronic media or live attendance.
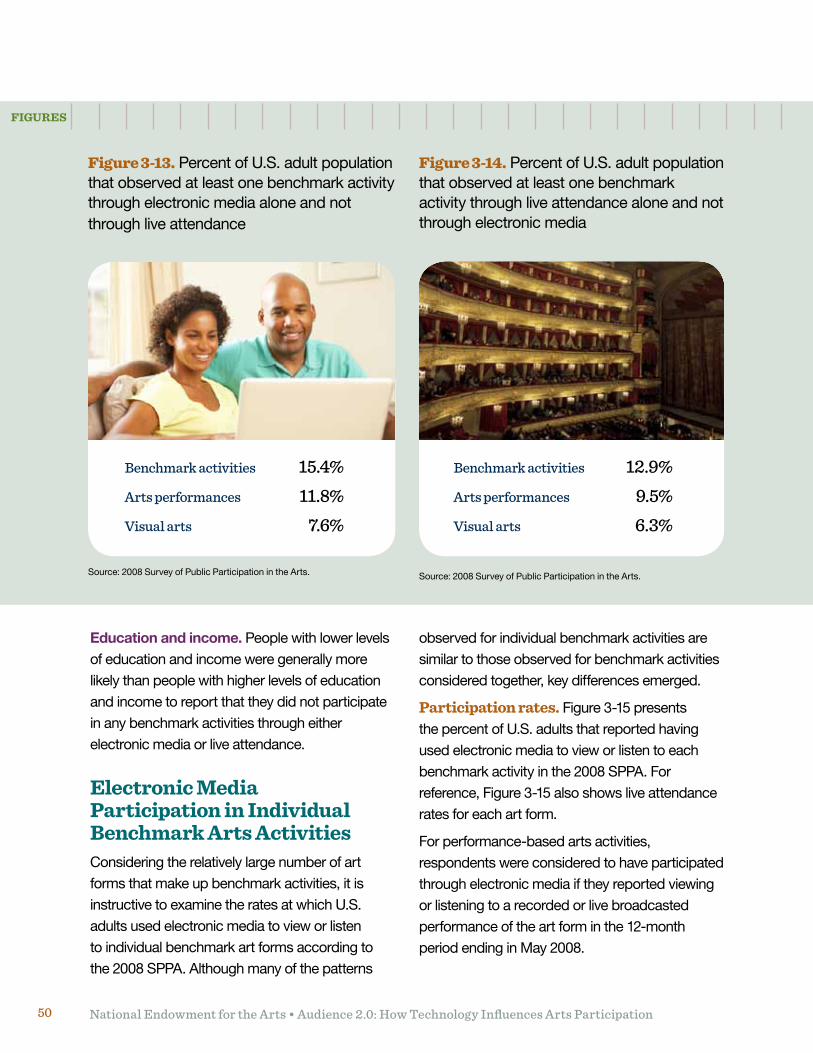
National Endowment for the Arts • Audience 2.0: How Technology Influences Arts Participation50
FIgURES
Education and income. People with lower levels of education and income were generally more likely than people with higher levels of education and income to report that they did not participate in any benchmark activities through either electronic media or live attendance.
Electronic Media Participation in Individual Benchmark Arts ActivitiesConsidering the relatively large number of art forms that make up benchmark activities, it is instructive to examine the rates at which U.S. adults used electronic media to view or listen to individual benchmark art forms according to the 2008 SPPA. Although many of the patterns
Figure 3-13. Percent of U.S. adult population that observed at least one benchmark activity through electronic media alone and not through live attendance
Figure 3-14. Percent of U.S. adult population that observed at least one benchmark activity through live attendance alone and not through electronic media
Source: 2008 Survey of Public Participation in the Arts.
Benchmark activities 15.4%
Arts performances 11.8%
Visual arts 7.6%
Benchmark activities 12.9%
Arts performances 9.5%
Visual arts 6.3%
Source: 2008 Survey of Public Participation in the Arts.
observed for individual benchmark activities are similar to those observed for benchmark activities considered together, key differences emerged.
Participation rates. Figure 3-15 presents the percent of U.S. adults that reported having used electronic media to view or listen to each benchmark activity in the 2008 SPPA. For reference, Figure 3-15 also shows live attendance rates for each art form.
For performance-based arts activities, respondents were considered to have participated through electronic media if they reported viewing or listening to a recorded or live broadcasted performance of the art form in the 12-month period ending in May 2008.
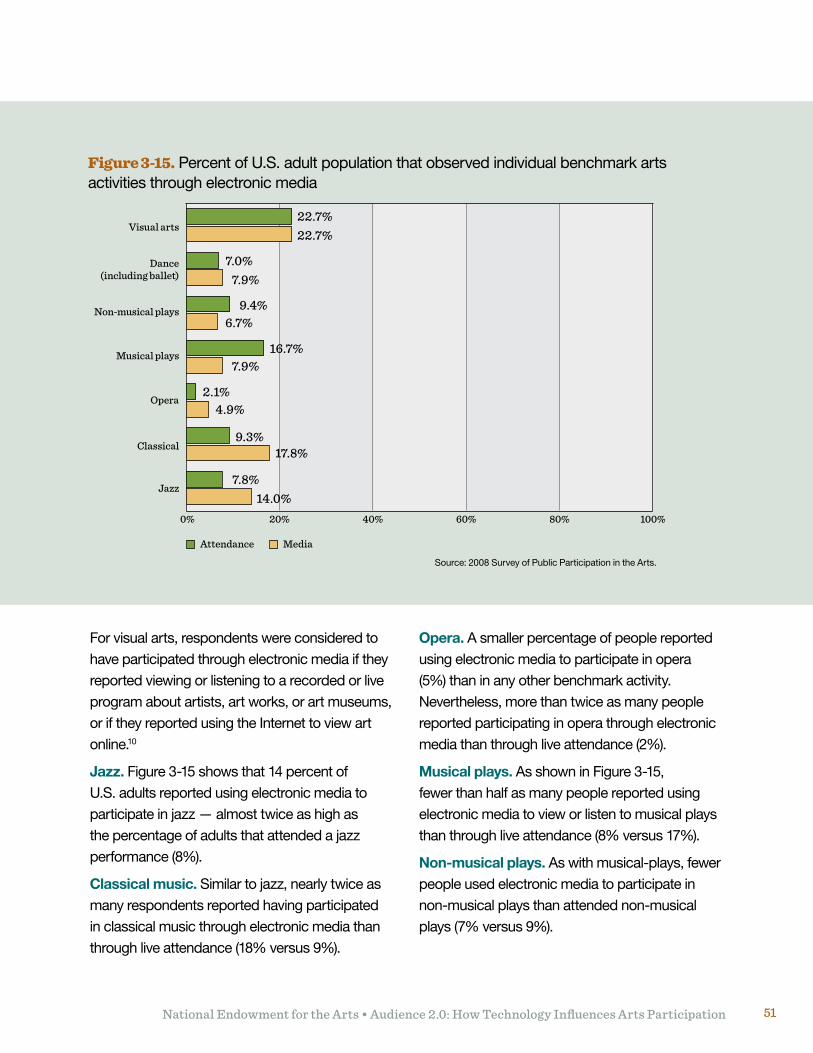
National Endowment for the Arts • Audience 2.0: How Technology Influences Arts Participation 51
For visual arts, respondents were considered to have participated through electronic media if they reported viewing or listening to a recorded or live program about artists, art works, or art museums, or if they reported using the Internet to view art online.10
Jazz. Figure 3-15 shows that 14 percent of U.S. adults reported using electronic media to participate in jazz — almost twice as high as the percentage of adults that attended a jazz performance (8%).
Classical music. Similar to jazz, nearly twice as many respondents reported having participated in classical music through electronic media than through live attendance (18% versus 9%).
Figure 3-15. Percent of U.S. adult population that observed individual benchmark arts activities through electronic media
Source: 2008 Survey of Public Participation in the Arts.
Visual arts
Dance(including ballet)
Non-musical plays
Musical plays
Opera
Classical
Jazz
MediaAttendance
0% 20% 40% 60% 80% 100%
Opera. A smaller percentage of people reported using electronic media to participate in opera (5%) than in any other benchmark activity. Nevertheless, more than twice as many people reported participating in opera through electronic media than through live attendance (2%).
Musical plays. As shown in Figure 3-15, fewer than half as many people reported using electronic media to view or listen to musical plays than through live attendance (8% versus 17%).
Non-musical plays. As with musical-plays, fewer people used electronic media to participate in non-musical plays than attended non-musical plays (7% versus 9%).
22.7%22.7%
7.0%7.9%
9.4%6.7%
16.7%7.9%
2.1%4.9%
9.3%17.8%
7.8%14.0%
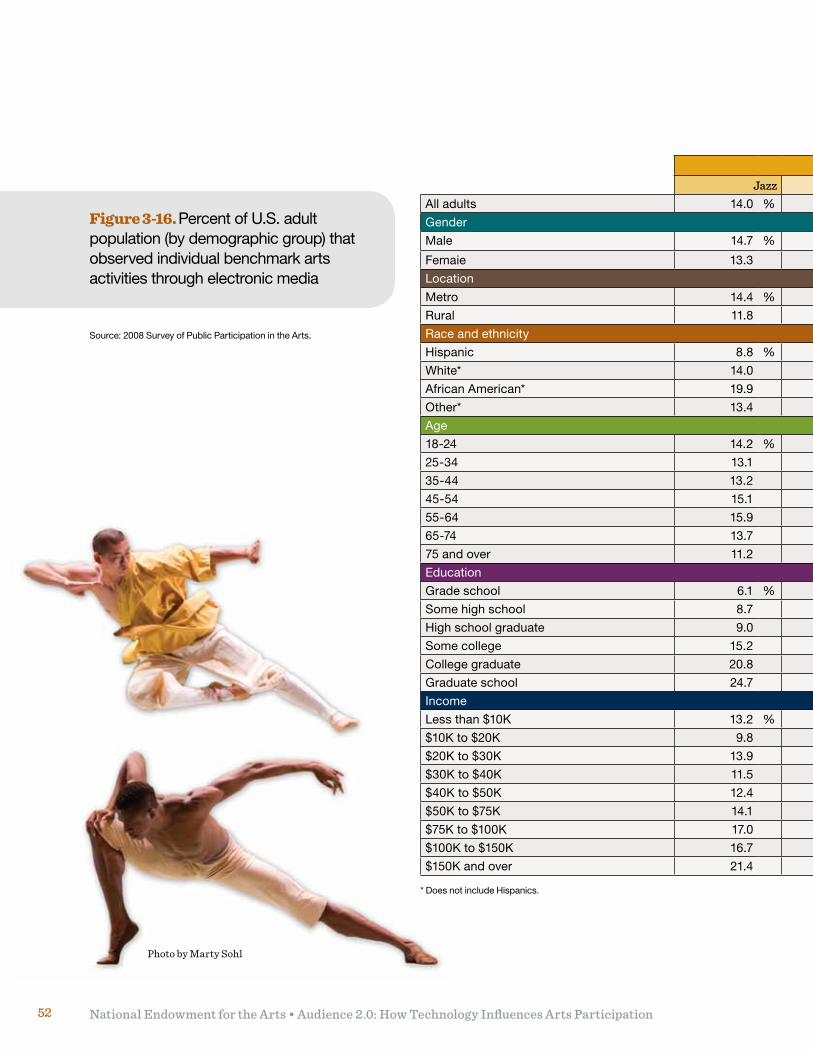
National Endowment for the Arts • Audience 2.0: How Technology Influences Arts Participation52
Benchmark activities
Jazz Classical Opera Musical plays Non-musical plays Dance Visual artsAll adults 14.0 % 17.8 % 4.9 % 7.9 % 6.7 % 7.9 % 22.7 %
Gender
Male 14.7 % 16.7 % 4.2 % 6.5 % 5.7 % 5.9 % 21.9 %
Femaie 13.3 18.8 5.5 9.3 7.7 9.8 23.5
Location
Metro 14.4 % 18.6 % 5.2 % 8.4 % 6.9 % 7.8 % 23.8 %
Rural 11.8 13.5 2.9 5.4 5.7 8.6 16.8
Race and ethnicity
Hispanic 8.8 % 12.3 % 3.6 % 5.7 % 6.9 % 4.1 % 15.7 %
White* 14.0 19.4 5.4 8.8 6.4 8.9 25.8
African American* 19.9 10.9 2.5 7.0 8.5 6.7 12.2
Other* 13.4 23.4 5.7 5.3 6.3 7.2 22.5
Age
18-24 14.2 % 17.1 % 4.0 % 6.8 % 8.4 % 7.6 % 25.9 %
25-34 13.1 14.4 3.7 6.3 5.7 5.4 24.5
35-44 13.2 14.7 2.8 7.8 5.0 5.9 23.6
45-54 15.1 17.1 4.4 8.3 7.1 8.8 22.7
55-64 15.9 24.7 8.7 9.8 7.0 9.6 25.4
65-74 13.7 19.5 6.8 9.7 8.3 12.2 17.1
75 and over 11.2 21.2 6.3 7.7 6.9 9.2 12.3
Education
Gradeschool 6.1 % 8.4 % 3.3 % 4.2 % 4.5 % 4.5 % 9.0 %
Some high school 8.7 8.7 2.4 3.7 4.1 3.2 10.9
High school graduate 9.0 9.6 2.3 4.0 4.9 5.2 12.1
Some college 15.2 18.8 4.7 9.6 7.7 9.5 25.8
College graduate 20.8 27.9 7.5 14.2 9.0 10.7 36.4
Graduateschool 24.7 39.1 12.8 11.1 9.3 14.7 45.1
Income
Less than $10K 13.2 % 11.1 % 5.3 % 6.5 % 5.9 % 8.9 % 18.2 %
$10K to $20K 9.8 12.7 4.1 5.1 5.4 6.3 12.4
$20K to $30K 13.9 14.4 3.9 7.4 8.2 8.5 14.7
$30K to $40K 11.5 14.1 2.3 4.1 5.9 6.5 16.6
$40K to $50K 12.4 18.3 4.3 9.2 6.5 9.4 23.4
$50K to $75K 14.1 16.8 4.8 8.2 6.1 7.1 23.3
$75K to $100K 17.0 21.7 5.3 8.6 7.7 8.6 29.5
$100K to $150K 16.7 25.7 7.4 12.4 6.7 11.2 35.5
$150K and over 21.4 32.4 8.9 13.6 10.4 9.6 41.4
Figure 3-16. Percent of U.S. adult population (by demographic group) that observed individual benchmark arts activities through electronic media
Source: 2008 Survey of Public Participation in the Arts.
* Does not include Hispanics.
Photo by Marty Sohl
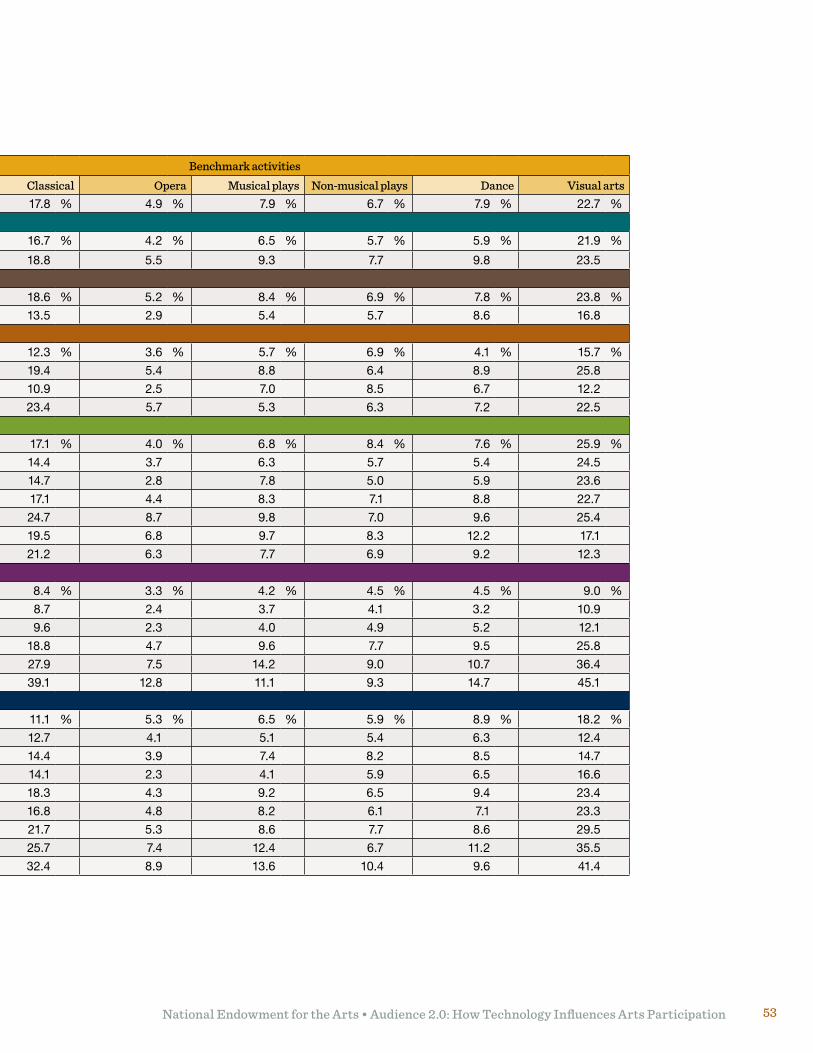
National Endowment for the Arts • Audience 2.0: How Technology Influences Arts Participation 53
Benchmark activities
Jazz Classical Opera Musical plays Non-musical plays Dance Visual artsAll adults 14.0 % 17.8 % 4.9 % 7.9 % 6.7 % 7.9 % 22.7 %
Gender
Male 14.7 % 16.7 % 4.2 % 6.5 % 5.7 % 5.9 % 21.9 %
Femaie 13.3 18.8 5.5 9.3 7.7 9.8 23.5
Location
Metro 14.4 % 18.6 % 5.2 % 8.4 % 6.9 % 7.8 % 23.8 %
Rural 11.8 13.5 2.9 5.4 5.7 8.6 16.8
Race and ethnicity
Hispanic 8.8 % 12.3 % 3.6 % 5.7 % 6.9 % 4.1 % 15.7 %
White* 14.0 19.4 5.4 8.8 6.4 8.9 25.8
African American* 19.9 10.9 2.5 7.0 8.5 6.7 12.2
Other* 13.4 23.4 5.7 5.3 6.3 7.2 22.5
Age
18-24 14.2 % 17.1 % 4.0 % 6.8 % 8.4 % 7.6 % 25.9 %
25-34 13.1 14.4 3.7 6.3 5.7 5.4 24.5
35-44 13.2 14.7 2.8 7.8 5.0 5.9 23.6
45-54 15.1 17.1 4.4 8.3 7.1 8.8 22.7
55-64 15.9 24.7 8.7 9.8 7.0 9.6 25.4
65-74 13.7 19.5 6.8 9.7 8.3 12.2 17.1
75 and over 11.2 21.2 6.3 7.7 6.9 9.2 12.3
Education
Gradeschool 6.1 % 8.4 % 3.3 % 4.2 % 4.5 % 4.5 % 9.0 %
Some high school 8.7 8.7 2.4 3.7 4.1 3.2 10.9
High school graduate 9.0 9.6 2.3 4.0 4.9 5.2 12.1
Some college 15.2 18.8 4.7 9.6 7.7 9.5 25.8
College graduate 20.8 27.9 7.5 14.2 9.0 10.7 36.4
Graduateschool 24.7 39.1 12.8 11.1 9.3 14.7 45.1
Income
Less than $10K 13.2 % 11.1 % 5.3 % 6.5 % 5.9 % 8.9 % 18.2 %
$10K to $20K 9.8 12.7 4.1 5.1 5.4 6.3 12.4
$20K to $30K 13.9 14.4 3.9 7.4 8.2 8.5 14.7
$30K to $40K 11.5 14.1 2.3 4.1 5.9 6.5 16.6
$40K to $50K 12.4 18.3 4.3 9.2 6.5 9.4 23.4
$50K to $75K 14.1 16.8 4.8 8.2 6.1 7.1 23.3
$75K to $100K 17.0 21.7 5.3 8.6 7.7 8.6 29.5
$100K to $150K 16.7 25.7 7.4 12.4 6.7 11.2 35.5
$150K and over 21.4 32.4 8.9 13.6 10.4 9.6 41.4
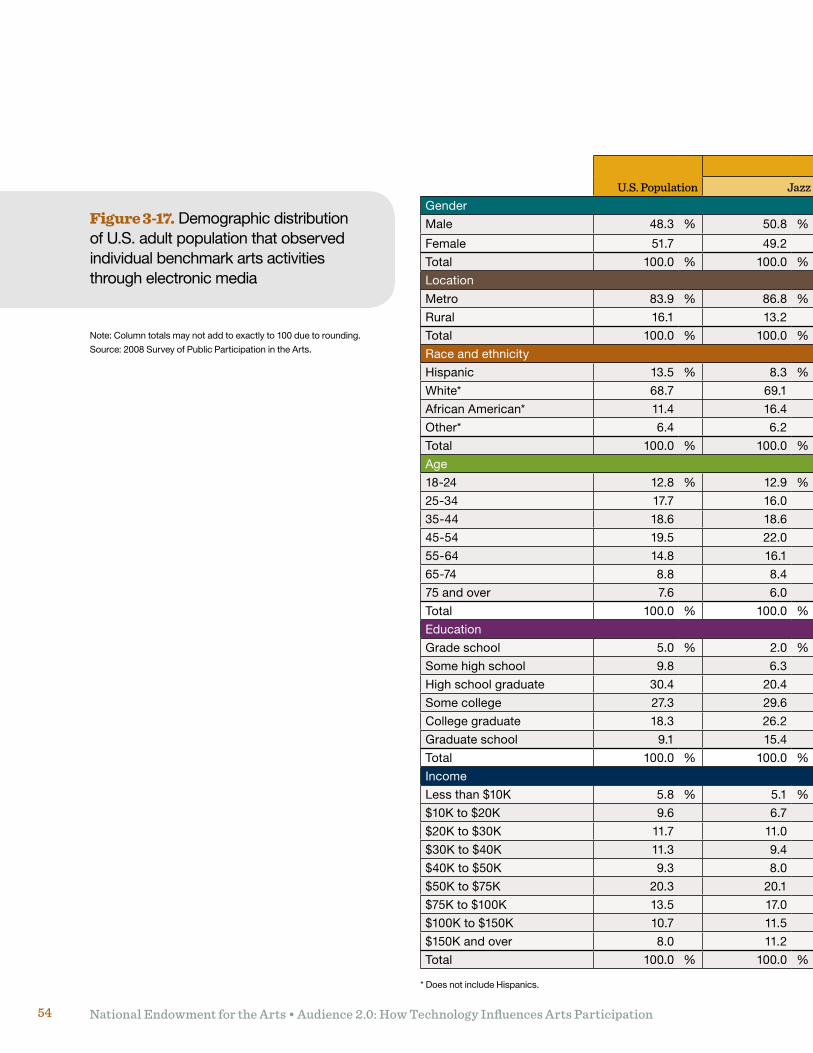
National Endowment for the Arts • Audience 2.0: How Technology Influences Arts Participation54
U.S. Population
Benchmark activities
Jazz Classical Opera Musical plays Non-musical plays Dance Visual artsGender
Male 48.3 % 50.8 % 45.5 % 41.5 % 39.8 % 41.0 % 36.1 % 46.6 %
Female 51.7 49.2 54.5 58.5 60.2 59.0 63.9 53.4
Total 100.0 % 100.0 % 100.0 % 100.0 % 100.0 % 100.0 % 100.0 % 100.0 %
Location
Metro 83.9 % 86.8 % 88.0 % 90.6 % 89.4 % 86.6 % 82.9 % 88.4 %
Rural 16.1 13.2 12.0 9.4 10.6 13.4 17.1 11.6
Total 100.0 % 100.0 % 100.0 % 100.0 % 100.0 % 100.0 % 100.0 % 100.0 %
Race and ethnicity
Hispanic 13.5 % 8.3 % 9.1 % 9.7 % 9.4 % 13.5 % 6.8 % 9.1 %
White* 68.7 69.1 75.3 76.6 76.0 65.7 77.5 78.2
African American* 11.4 16.4 7.1 6.0 10.2 14.7 9.8 6.2
Other* 6.4 6.2 8.5 7.6 4.4 6.1 5.9 6.4
Total 100.0 % 100.0 % 100.0 % 100.0 % 100.0 % 100.0 % 100.0 % 100.0 %
Age
18-24 12.8 % 12.9 % 12.3 % 10.4 % 10.9 % 16.0 % 12.2 % 14.5 %
25-34 17.7 16.0 13.9 13.0 13.5 14.7 11.6 18.4
35-44 18.6 18.6 16.2 11.1 19.2 14.6 14.6 20.4
45-54 19.5 22.0 19.7 18.3 21.3 21.6 22.6 20.3
55-64 14.8 16.1 19.7 25.5 17.5 14.8 17.2 15.8
65-74 8.8 8.4 9.4 12.0 10.4 10.7 13.2 6.5
75 and over 7.6 6.0 8.8 9.6 7.2 7.6 8.6 4.0
Total 100.0 % 100.0 % 100.0 % 100.0 % 100.0 % 100.0 % 100.0 % 100.0 %
Education
Gradeschool 5.0 % 2.0 % 2.2 % 3.2 % 2.5 % 3.1 % 2.6 % 1.8 %
Some high school 9.8 6.3 5.0 5.0 4.8 6.3 4.1 4.9
High school graduate 30.4 20.4 17.0 15.1 15.8 23.2 20.6 16.8
Some college 27.3 29.6 28.9 26.6 33.2 31.5 32.7 31.0
College graduate 18.3 26.2 27.7 27.1 31.6 23.8 23.9 28.2
Graduateschool 9.1 15.4 19.2 23.0 12.2 12.1 16.2 17.3
Total 100.0 % 100.0 % 100.0 % 100.0 % 100.0 % 100.0 % 100.0 % 100.0 %
Income
Less than $10K 5.8 % 5.1 % 3.3 % 5.9 % 4.4 % 4.7 % 6.0 % 4.2 %
$10K to $20K 9.6 6.7 6.7 8.1 6.1 7.7 7.4 5.1
$20K to $30K 11.7 11.0 9.0 9.0 10.2 13.6 11.8 7.1
$30K to $40K 11.3 9.4 9.0 5.5 5.8 10.0 9.3 8.2
$40K to $50K 9.3 8.0 9.2 8.0 10.4 8.8 10.6 9.2
$50K to $75K 20.3 20.1 18.7 19.9 20.5 18.2 17.7 20.1
$75K to $100K 13.5 17.0 17.0 15.4 15.1 16.1 15.0 18.0
$100K to $150K 10.7 11.5 13.8 14.7 15.0 9.5 13.5 14.9
$150K and over 8.0 11.2 13.3 13.5 12.5 11.3 8.8 13.2
Total 100.0 % 100.0 % 100.0 % 100.0 % 100.0 % 100.0 % 100.0 % 100.0 %
Figure 3-17. Demographic distribution of U.S. adult population that observed individual benchmark arts activities through electronic media
Note: Column totals may not add to exactly to 100 due to rounding.
Source: 2008 Survey of Public Participation in the Arts.
* Does not include Hispanics.
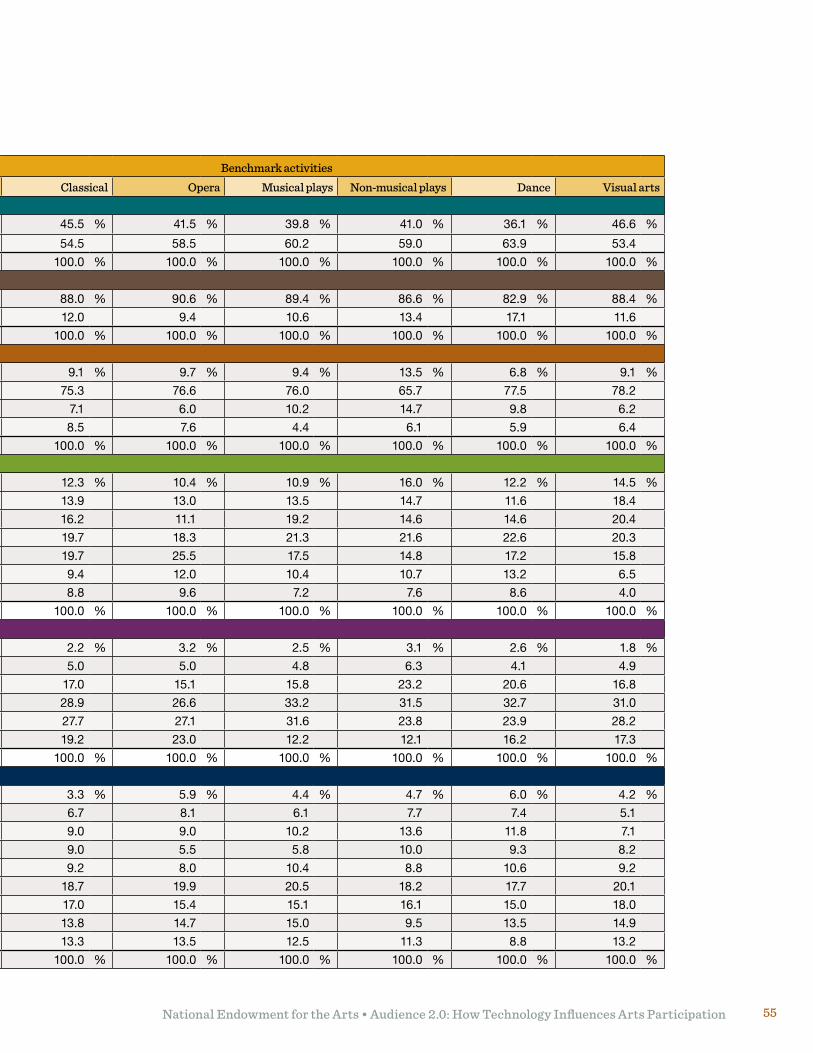
National Endowment for the Arts • Audience 2.0: How Technology Influences Arts Participation 55
U.S. Population
Benchmark activities
Jazz Classical Opera Musical plays Non-musical plays Dance Visual artsGender
Male 48.3 % 50.8 % 45.5 % 41.5 % 39.8 % 41.0 % 36.1 % 46.6 %
Female 51.7 49.2 54.5 58.5 60.2 59.0 63.9 53.4
Total 100.0 % 100.0 % 100.0 % 100.0 % 100.0 % 100.0 % 100.0 % 100.0 %
Location
Metro 83.9 % 86.8 % 88.0 % 90.6 % 89.4 % 86.6 % 82.9 % 88.4 %
Rural 16.1 13.2 12.0 9.4 10.6 13.4 17.1 11.6
Total 100.0 % 100.0 % 100.0 % 100.0 % 100.0 % 100.0 % 100.0 % 100.0 %
Race and ethnicity
Hispanic 13.5 % 8.3 % 9.1 % 9.7 % 9.4 % 13.5 % 6.8 % 9.1 %
White* 68.7 69.1 75.3 76.6 76.0 65.7 77.5 78.2
African American* 11.4 16.4 7.1 6.0 10.2 14.7 9.8 6.2
Other* 6.4 6.2 8.5 7.6 4.4 6.1 5.9 6.4
Total 100.0 % 100.0 % 100.0 % 100.0 % 100.0 % 100.0 % 100.0 % 100.0 %
Age
18-24 12.8 % 12.9 % 12.3 % 10.4 % 10.9 % 16.0 % 12.2 % 14.5 %
25-34 17.7 16.0 13.9 13.0 13.5 14.7 11.6 18.4
35-44 18.6 18.6 16.2 11.1 19.2 14.6 14.6 20.4
45-54 19.5 22.0 19.7 18.3 21.3 21.6 22.6 20.3
55-64 14.8 16.1 19.7 25.5 17.5 14.8 17.2 15.8
65-74 8.8 8.4 9.4 12.0 10.4 10.7 13.2 6.5
75 and over 7.6 6.0 8.8 9.6 7.2 7.6 8.6 4.0
Total 100.0 % 100.0 % 100.0 % 100.0 % 100.0 % 100.0 % 100.0 % 100.0 %
Education
Gradeschool 5.0 % 2.0 % 2.2 % 3.2 % 2.5 % 3.1 % 2.6 % 1.8 %
Some high school 9.8 6.3 5.0 5.0 4.8 6.3 4.1 4.9
High school graduate 30.4 20.4 17.0 15.1 15.8 23.2 20.6 16.8
Some college 27.3 29.6 28.9 26.6 33.2 31.5 32.7 31.0
College graduate 18.3 26.2 27.7 27.1 31.6 23.8 23.9 28.2
Graduateschool 9.1 15.4 19.2 23.0 12.2 12.1 16.2 17.3
Total 100.0 % 100.0 % 100.0 % 100.0 % 100.0 % 100.0 % 100.0 % 100.0 %
Income
Less than $10K 5.8 % 5.1 % 3.3 % 5.9 % 4.4 % 4.7 % 6.0 % 4.2 %
$10K to $20K 9.6 6.7 6.7 8.1 6.1 7.7 7.4 5.1
$20K to $30K 11.7 11.0 9.0 9.0 10.2 13.6 11.8 7.1
$30K to $40K 11.3 9.4 9.0 5.5 5.8 10.0 9.3 8.2
$40K to $50K 9.3 8.0 9.2 8.0 10.4 8.8 10.6 9.2
$50K to $75K 20.3 20.1 18.7 19.9 20.5 18.2 17.7 20.1
$75K to $100K 13.5 17.0 17.0 15.4 15.1 16.1 15.0 18.0
$100K to $150K 10.7 11.5 13.8 14.7 15.0 9.5 13.5 14.9
$150K and over 8.0 11.2 13.3 13.5 12.5 11.3 8.8 13.2
Total 100.0 % 100.0 % 100.0 % 100.0 % 100.0 % 100.0 % 100.0 % 100.0 %
National Endowment for the Arts • Audience 2.0: How Technology Influences Arts Participation56
Dance (including ballet). Eight percent of U.S. adults reported having participated in dance performances (including ballet) through media, slightly higher than the percentage of adults that participated in dance performances through live attendance (7%).
Visual arts. As shown in Figure 3-15, more respondents reported having used electronic media to participate in visual arts (23%) than in any other benchmark arts activity.
Two activities made up visual arts participation through media — viewing art online and viewing or listening to a recorded or live program about artists, art works, or art museums. A comparable percentage of respondents reported participating in each activity (14% and 15%, see Figure 1-1).
Demographic characteristics. Figures 3-16 and 3-17 present demographic information about U.S. adults who reported using electronic media to view or listen to individual benchmark art forms in the 2008 SPPA. Figure 3-16 shows the percent of adults that reported participating in each benchmark activity through electronic media by demographic group, and Figure 3-17 shows the demographic distribution of adults who reported participating in each activity.
Location. Figure 3-16 shows that metropolitan area residents were more likely than rural residents to report having used electronic media to view or listen to classical music, opera, musical plays, and visual arts. The groups did not differ significantly for jazz, non-musical plays, or dance performances (including ballet).
Race and ethnicity. African Americans were morelikelythanotherracial/ethnicgroupstoreport using electronic media to participate in
jazz (20%). Non-Hispanic white adults were more likelythanallotherracial/ethnicgroupsconsideredtogether to participate in musical plays through electronic media (9% versus 6%).
Age. U.S. adults 55 and older were more likely than younger adults to report electronic media participation in classical music, opera, and dance performances. Compared to other age groups, a relatively high number of adults between the ages of 18 and 24 reported using electronic media to participate in jazz (14%) and non-musical plays (8%).
Education. For each benchmark arts activity shown in Figure 3-16, respondents with more education tended to show higher rates of arts participation through electronic media than respondents with less education.
Income. Respondents with higher incomes were more likely than respondents with lower incomes to report having used electronic media to participate in each art form. However, that relationship was not observed for dance performances.
Latin Music Participation through Electronic MediaPartly to address the growing Hispanic-American population and the growing popularity of a distinctive art form, the 2008 SPPA asked respondents whether they had attended Latin, salsa, or Spanish music events and whether they had viewed or listened to such music via electronic and digital media.11
Participation rates. Figure 3-18 shows the percent of U.S. adults that reported using electronic media to view or listen to Latin music in
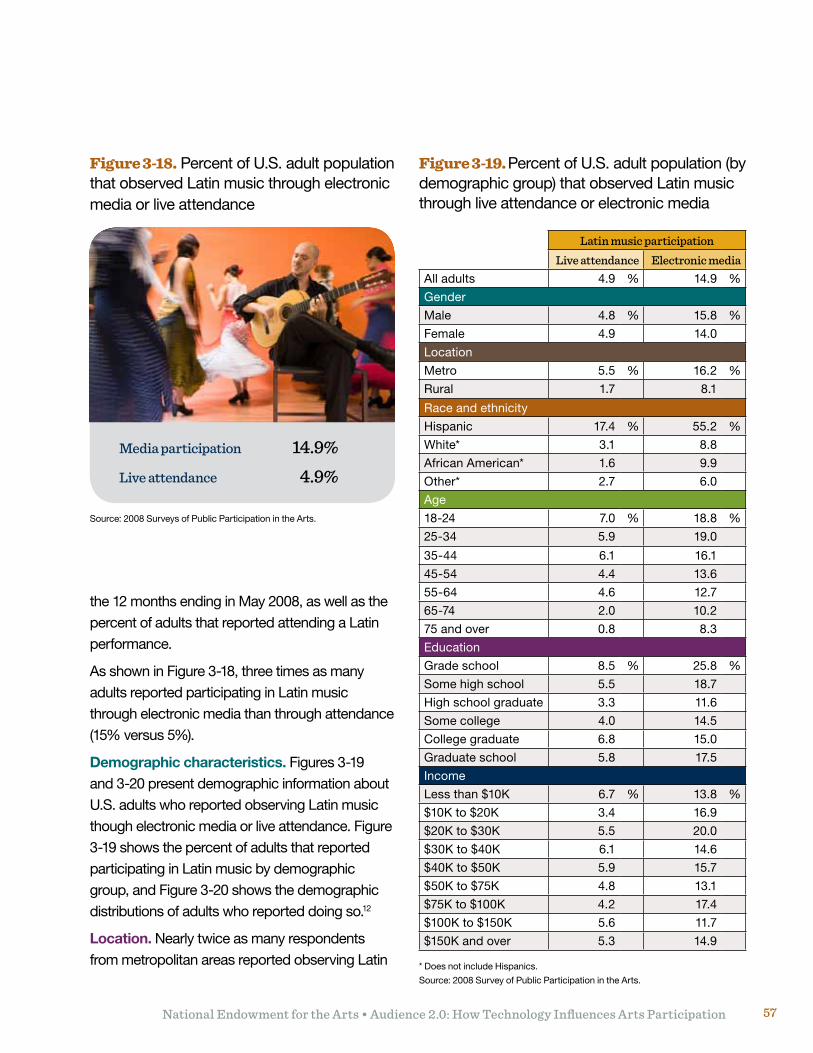
National Endowment for the Arts • Audience 2.0: How Technology Influences Arts Participation 57
the 12 months ending in May 2008, as well as the percent of adults that reported attending a Latin performance.
As shown in Figure 3-18, three times as many adults reported participating in Latin music through electronic media than through attendance (15% versus 5%).
Demographic characteristics. Figures 3-19 and 3-20 present demographic information about U.S. adults who reported observing Latin music though electronic media or live attendance. Figure 3-19 shows the percent of adults that reported participating in Latin music by demographic group, and Figure 3-20 shows the demographic distributions of adults who reported doing so.12
Location. Nearly twice as many respondents from metropolitan areas reported observing Latin
Figure 3-18. Percent of U.S. adult population that observed Latin music through electronic media or live attendance
Source: 2008 Surveys of Public Participation in the Arts.
Media participation 14.9%
Live attendance 4.9%
Figure 3-19. Percent of U.S. adult population (by demographic group) that observed Latin music through live attendance or electronic media
Latin music participation
Live attendance Electronic mediaAll adults 4.9 % 14.9 %
Gender
Male 4.8 % 15.8 %
Female 4.9 14.0
Location
Metro 5.5 % 16.2 %
Rural 1.7 8.1
Race and ethnicity
Hispanic 17.4 % 55.2 %
White* 3.1 8.8
African American* 1.6 9.9
Other* 2.7 6.0
Age
18-24 7.0 % 18.8 %
25-34 5.9 19.0
35-44 6.1 16.1
45-54 4.4 13.6
55-64 4.6 12.7
65-74 2.0 10.2
75 and over 0.8 8.3
Education
Gradeschool 8.5 % 25.8 %
Some high school 5.5 18.7
High school graduate 3.3 11.6
Some college 4.0 14.5
College graduate 6.8 15.0
Graduateschool 5.8 17.5
Income
Less than $10K 6.7 % 13.8 %
$10K to $20K 3.4 16.9
$20K to $30K 5.5 20.0
$30K to $40K 6.1 14.6
$40K to $50K 5.9 15.7
$50K to $75K 4.8 13.1
$75K to $100K 4.2 17.4
$100K to $150K 5.6 11.7
$150K and over 5.3 14.9
* Does not include Hispanics.
Source: 2008 Survey of Public Participation in the Arts.
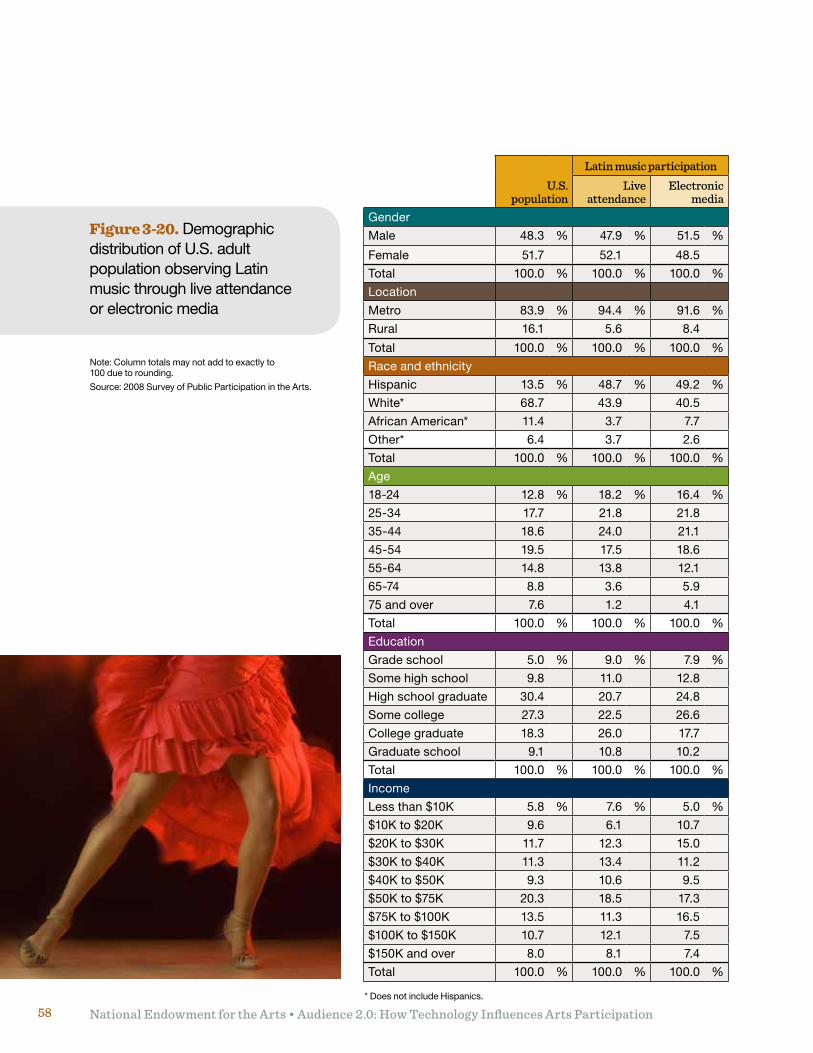
National Endowment for the Arts • Audience 2.0: How Technology Influences Arts Participation58
Note: Column totals may not add to exactly to 100 due to rounding.
Source: 2008 Survey of Public Participation in the Arts.
U.S. population
Latin music participation
Live attendance
Electronic media
Gender
Male 48.3 % 47.9 % 51.5 %
Female 51.7 52.1 48.5
Total 100.0 % 100.0 % 100.0 %
Location
Metro 83.9 % 94.4 % 91.6 %
Rural 16.1 5.6 8.4
Total 100.0 % 100.0 % 100.0 %
Race and ethnicity
Hispanic 13.5 % 48.7 % 49.2 %
White* 68.7 43.9 40.5
African American* 11.4 3.7 7.7
Other* 6.4 3.7 2.6
Total 100.0 % 100.0 % 100.0 %
Age
18-24 12.8 % 18.2 % 16.4 %
25-34 17.7 21.8 21.8
35-44 18.6 24.0 21.1
45-54 19.5 17.5 18.6
55-64 14.8 13.8 12.1
65-74 8.8 3.6 5.9
75 and over 7.6 1.2 4.1
Total 100.0 % 100.0 % 100.0 %
Education
Gradeschool 5.0 % 9.0 % 7.9 %
Some high school 9.8 11.0 12.8
High school graduate 30.4 20.7 24.8
Some college 27.3 22.5 26.6
College graduate 18.3 26.0 17.7
Graduateschool 9.1 10.8 10.2
Total 100.0 % 100.0 % 100.0 %
Income
Less than $10K 5.8 % 7.6 % 5.0 %
$10K to $20K 9.6 6.1 10.7
$20K to $30K 11.7 12.3 15.0
$30K to $40K 11.3 13.4 11.2
$40K to $50K 9.3 10.6 9.5
$50K to $75K 20.3 18.5 17.3
$75K to $100K 13.5 11.3 16.5
$100K to $150K 10.7 12.1 7.5
$150K and over 8.0 8.1 7.4
Total 100.0 % 100.0 % 100.0 %
Figure 3-20. Demographic distribution of U.S. adult population observing Latin music through live attendance or electronic media
* Does not include Hispanics.
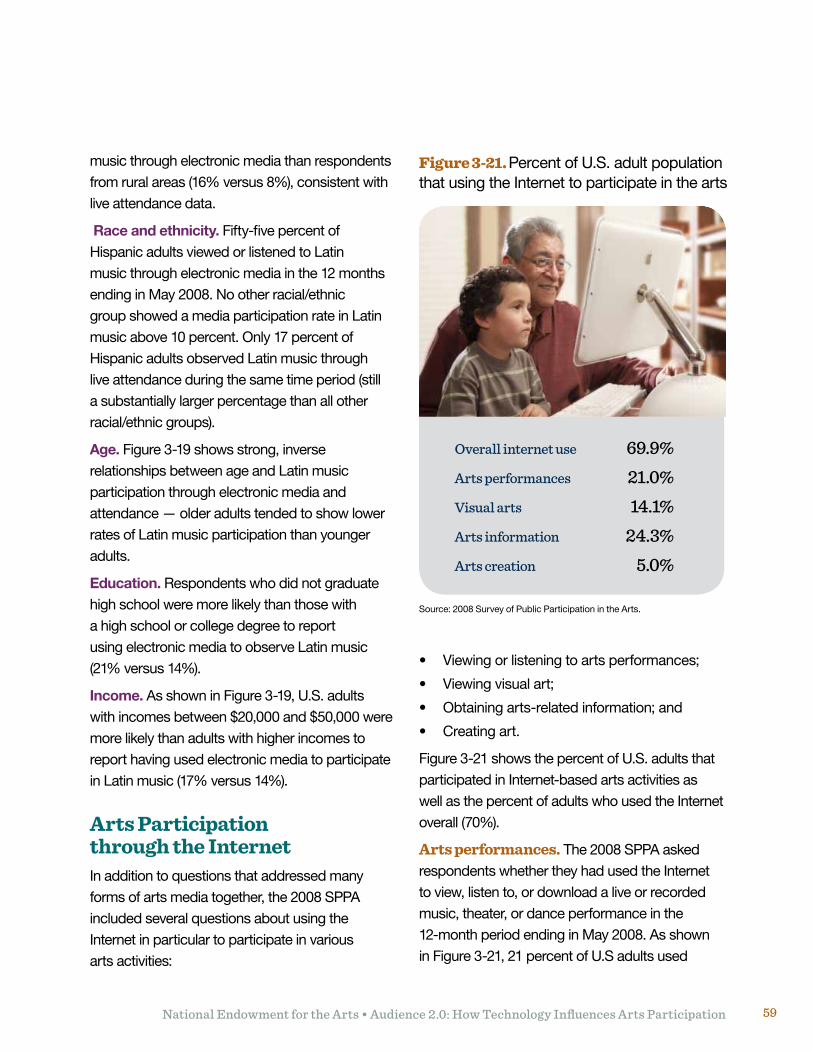
National Endowment for the Arts • Audience 2.0: How Technology Influences Arts Participation 59
music through electronic media than respondents from rural areas (16% versus 8%), consistent with live attendance data.
Race and ethnicity. Fifty-five percent of Hispanic adults viewed or listened to Latin music through electronic media in the 12 months endinginMay2008.Nootherracial/ethnicgroup showed a media participation rate in Latin music above 10 percent. Only 17 percent of Hispanic adults observed Latin music through live attendance during the same time period (still a substantially larger percentage than all other racial/ethnicgroups).
Age. Figure 3-19 shows strong, inverse relationships between age and Latin music participation through electronic media and attendance — older adults tended to show lower rates of Latin music participation than younger adults.
Education. Respondents who did not graduate high school were more likely than those with a high school or college degree to report using electronic media to observe Latin music (21% versus 14%).
Income. As shown in Figure 3-19, U.S. adults with incomes between $20,000 and $50,000 were more likely than adults with higher incomes to report having used electronic media to participate in Latin music (17% versus 14%).
Arts Participation through the InternetIn addition to questions that addressed many forms of arts media together, the 2008 SPPA included several questions about using the Internet in particular to participate in various arts activities:
• Viewingorlisteningtoartsperformances;
• Viewingvisualart;
• Obtainingarts-relatedinformation;and
• Creatingart.
Figure 3-21 shows the percent of U.S. adults that participated in Internet-based arts activities as well as the percent of adults who used the Internet overall (70%).
Arts performances. The 2008 SPPA asked respondents whether they had used the Internet to view, listen to, or download a live or recorded music, theater, or dance performance in the 12-month period ending in May 2008. As shown in Figure 3-21, 21 percent of U.S adults used
Figure 3-21. Percent of U.S. adult population that using the Internet to participate in the arts
Source: 2008 Survey of Public Participation in the Arts.
Overall internet use 69.9%
Arts performances 21.0%
Visual arts 14.1%
Arts information 24.3%
Arts creation 5.0%
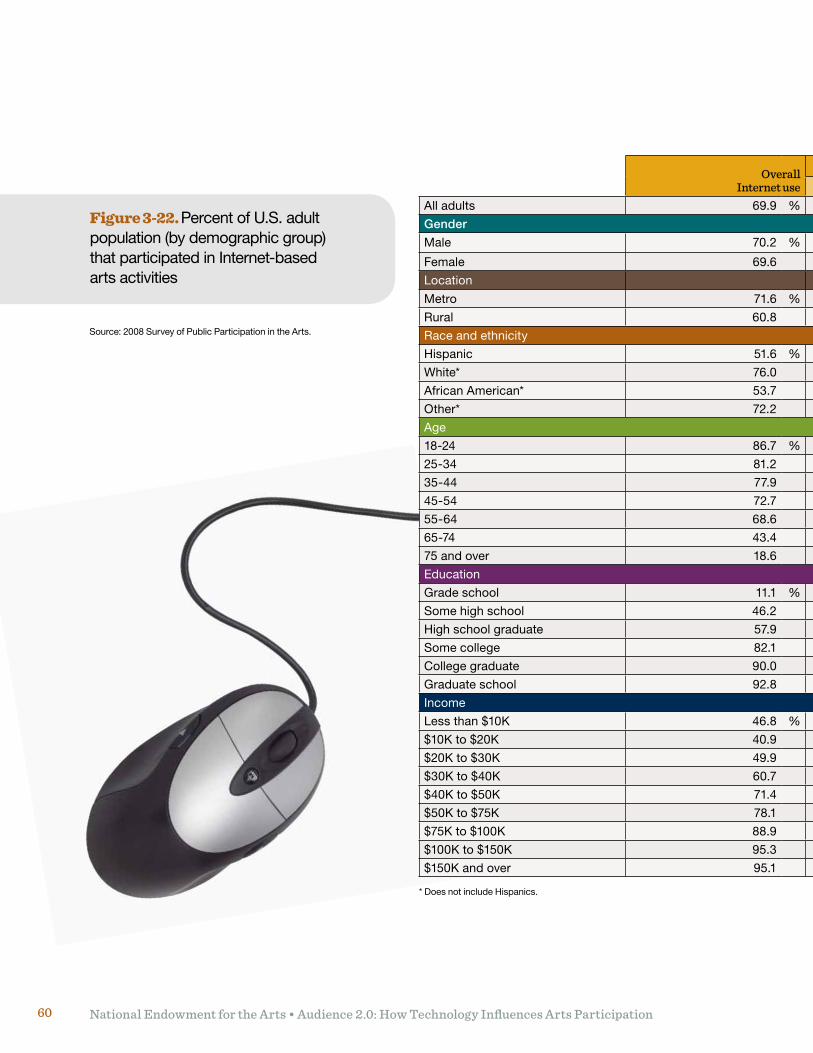
National Endowment for the Arts • Audience 2.0: How Technology Influences Arts Participation60
Overall Internet use
Internet-based arts activity
Arts performances Visual arts Arts information Arts creationAll adults 69.9 % 21.0 % 14.1 % 24.3 % 5.0 %
Gender
Male 70.2 % 23.0 % 13.6 % 24.4 % 5.6 %
Female 69.6 19.1 14.5 24.3 4.5
Location
Metro 71.6 % 22.4 % 15.0 % 26.1 % 5.3 %
Rural 60.8 13.5 9.6 14.9 3.7
Race and ethnicity
Hispanic 51.6 % 18.0 % 7.4 % 15.2 % 3.7 %
White* 76.0 22.3 16.4 28.3 5.4
African American* 53.7 16.4 7.9 13.9 3.1
Other* 72.2 21.7 14.6 19.7 7.6
Age
18-24 86.7 % 42.3 % 20.1 % 30.5 % 10.9 %
25-34 81.2 33.2 19.2 33.5 7.6
35-44 77.9 23.4 16.5 28.6 5.6
45-54 72.7 15.7 12.9 24.7 2.7
55-64 68.6 11.5 12.0 21.2 3.5
65-74 43.4 4.4 5.5 10.0 1.9
75 and over 18.6 1.3 2.7 3.3 0.2
Education
Gradeschool 11.1 % 1.6 % 1.1 % 1.1 % 0.0 %
Some high school 46.2 15.1 5.1 8.1 2.7
High school graduate 57.9 12.8 5.9 11.6 2.4
Some college 82.1 27.3 17.3 29.7 6.6
College graduate 90.0 29.3 24.0 42.6 8.3
Graduateschool 92.8 31.0 31.1 47.9 8.5
Income
Less than $10K 46.8 % 19.5 % 10.2 % 11.8 % 6.4 %
$10K to $20K 40.9 7.9 5.5 10.4 2.2
$20K to $30K 49.9 15.9 8.1 12.1 4.5
$30K to $40K 60.7 15.6 10.2 15.9 3.2
$40K to $50K 71.4 20.6 14.7 19.1 3.4
$50K to $75K 78.1 21.3 14.0 27.7 6.0
$75K to $100K 88.9 28.7 20.7 35.0 7.1
$100K to $150K 95.3 38.4 23.9 46.5 8.0
$150K and over 95.1 34.6 29.1 50.0 6.6
Figure 3-22. Percent of U.S. adult population (by demographic group) that participated in Internet-based arts activities
Source: 2008 Survey of Public Participation in the Arts.
* Does not include Hispanics.
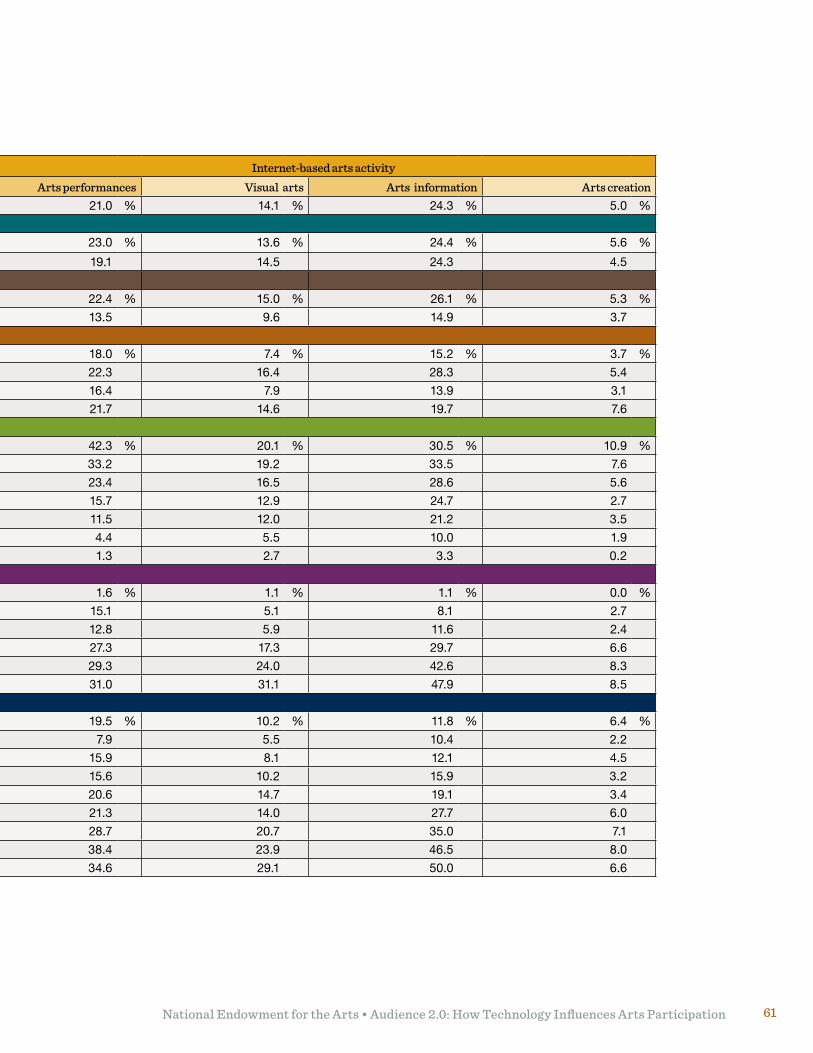
National Endowment for the Arts • Audience 2.0: How Technology Influences Arts Participation 61
Overall Internet use
Internet-based arts activity
Arts performances Visual arts Arts information Arts creationAll adults 69.9 % 21.0 % 14.1 % 24.3 % 5.0 %
Gender
Male 70.2 % 23.0 % 13.6 % 24.4 % 5.6 %
Female 69.6 19.1 14.5 24.3 4.5
Location
Metro 71.6 % 22.4 % 15.0 % 26.1 % 5.3 %
Rural 60.8 13.5 9.6 14.9 3.7
Race and ethnicity
Hispanic 51.6 % 18.0 % 7.4 % 15.2 % 3.7 %
White* 76.0 22.3 16.4 28.3 5.4
African American* 53.7 16.4 7.9 13.9 3.1
Other* 72.2 21.7 14.6 19.7 7.6
Age
18-24 86.7 % 42.3 % 20.1 % 30.5 % 10.9 %
25-34 81.2 33.2 19.2 33.5 7.6
35-44 77.9 23.4 16.5 28.6 5.6
45-54 72.7 15.7 12.9 24.7 2.7
55-64 68.6 11.5 12.0 21.2 3.5
65-74 43.4 4.4 5.5 10.0 1.9
75 and over 18.6 1.3 2.7 3.3 0.2
Education
Gradeschool 11.1 % 1.6 % 1.1 % 1.1 % 0.0 %
Some high school 46.2 15.1 5.1 8.1 2.7
High school graduate 57.9 12.8 5.9 11.6 2.4
Some college 82.1 27.3 17.3 29.7 6.6
College graduate 90.0 29.3 24.0 42.6 8.3
Graduateschool 92.8 31.0 31.1 47.9 8.5
Income
Less than $10K 46.8 % 19.5 % 10.2 % 11.8 % 6.4 %
$10K to $20K 40.9 7.9 5.5 10.4 2.2
$20K to $30K 49.9 15.9 8.1 12.1 4.5
$30K to $40K 60.7 15.6 10.2 15.9 3.2
$40K to $50K 71.4 20.6 14.7 19.1 3.4
$50K to $75K 78.1 21.3 14.0 27.7 6.0
$75K to $100K 88.9 28.7 20.7 35.0 7.1
$100K to $150K 95.3 38.4 23.9 46.5 8.0
$150K and over 95.1 34.6 29.1 50.0 6.6
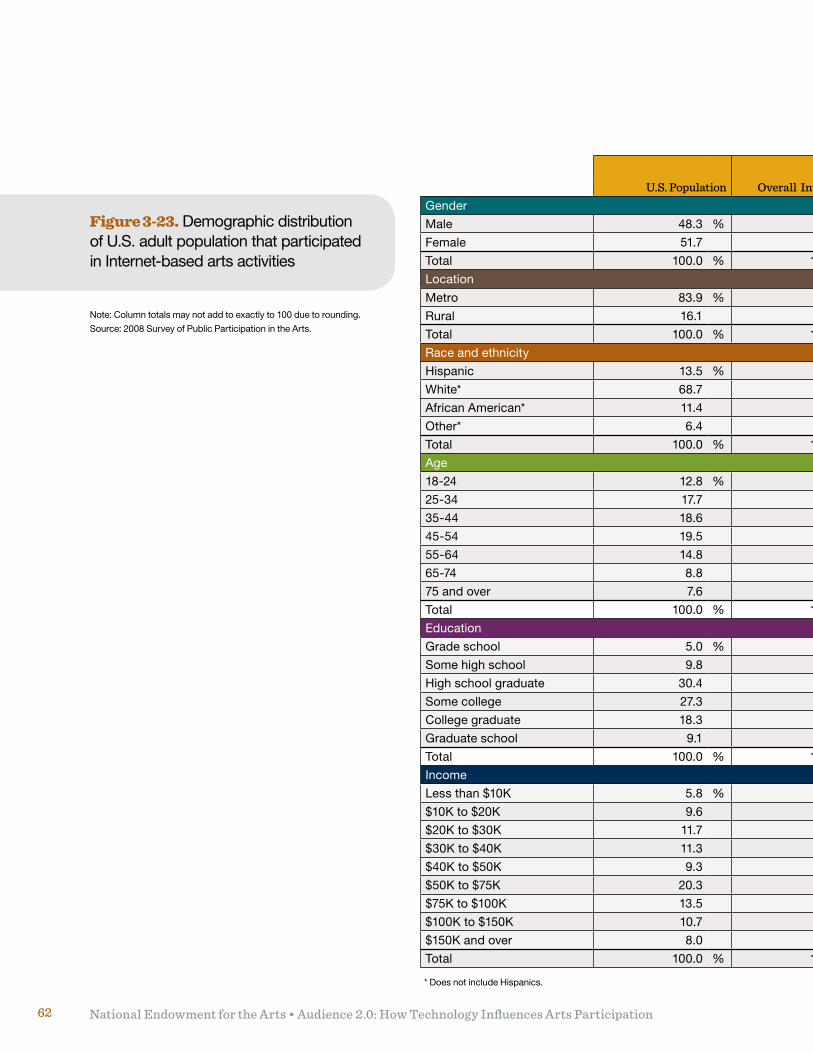
National Endowment for the Arts • Audience 2.0: How Technology Influences Arts Participation62
Note: Column totals may not add to exactly to 100 due to rounding.
Source: 2008 Survey of Public Participation in the Arts.
U.S. Population Overall Internet use
Internet-based arts activity
Arts performances Visual arts Arts information Arts creationGender
Male 48.3 % 48.7 % 53.0 % 46.9 % 48.5 % 53.7 %
Female 51.7 51.3 47.0 53.1 51.5 46.3
Total 100.0 % 100.0 % 100.0 % 100.0 % 100.0 % 100.0 %
Location
Metro 83.9 % 86.5 % 90.0 % 89.4 % 90.5 % 88.5 %
Rural 16.1 13.5 10.0 10.6 9.5 11.5
Total 100.0 % 100.0 % 100.0 % 100.0 % 100.0 % 100.0 %
Race and ethnicity
Hispanic 13.5 % 9.8 % 11.4 % 7.0 % 8.2 % 9.6 %
White* 68.7 74.7 73.0 79.9 80.0 73.6
African American* 11.4 8.9 9.0 6.4 6.6 7.1
Other* 6.4 6.6 6.7 6.6 5.2 9.8
Total 100.0 % 100.0 % 100.0 % 100.0 % 100.0 % 100.0 %
Age
18-24 12.8 % 16.1 % 26.0 % 18.4 % 16.2 % 28.0 %
25-34 17.7 20.0 27.0 23.2 23.4 25.9
35-44 18.6 21.7 21.8 22.9 22.9 21.7
45-54 19.5 21.0 15.2 18.6 20.6 11.0
55-64 14.8 13.9 7.8 12.1 12.4 9.9
65-74 8.8 5.3 1.8 3.4 3.5 3.3
75 and over 7.6 2.0 0.5 1.4 10.2 0.3
Total 100.0 % 100.0 % 100.0 % 100.0 % 100.0 % 100.0 %
Education
Gradeschool 5.0 % 0.7 % 0.3 % 0.4 % 0.2 % 0.0 %
Some high school 9.8 6.8 7.3 3.6 3.4 5.4
High school graduate 30.4 26.1 19.2 13.2 15.0 14.8
Some college 27.3 32.1 35.7 33.5 33.5 35.9
College graduate 18.3 22.8 24.7 30.2 30.8 29.3
Graduateschool 9.1 11.5 12.8 19.1 17.1 14.6
Total 100.0 % 100.0 % 100.0 % 100.0 % 100.0 % 100.0 %
Income
Less than $10K 5.8 % 3.6 % 4.8 % 3.7 % 2.5 % 6.6 %
$10K to $20K 9.6 5.6 3.4 3.6 4.0 4.0
$20K to $30K 11.7 8.0 8.2 6.2 5.4 9.6
$30K to $40K 11.3 10.0 8.2 8.0 7.3 7.1
$40K to $50K 9.3 9.3 8.6 9.2 6.9 6.0
$50K to $75K 20.3 22.2 19.3 18.9 21.8 22.9
$75K to $100K 13.5 18.1 18.8 20.1 19.7 19.4
$100K to $150K 10.7 13.1 17.0 15.7 17.8 14.9
$150K and over 8.0 10.1 11.7 14.7 14.7 9.4
Total 100.0 % 100.0 % 100.0 % 100.0 % 100.0 % 100.0 %
Figure 3-23. Demographic distribution of U.S. adult population that participated in Internet-based arts activities
* Does not include Hispanics.
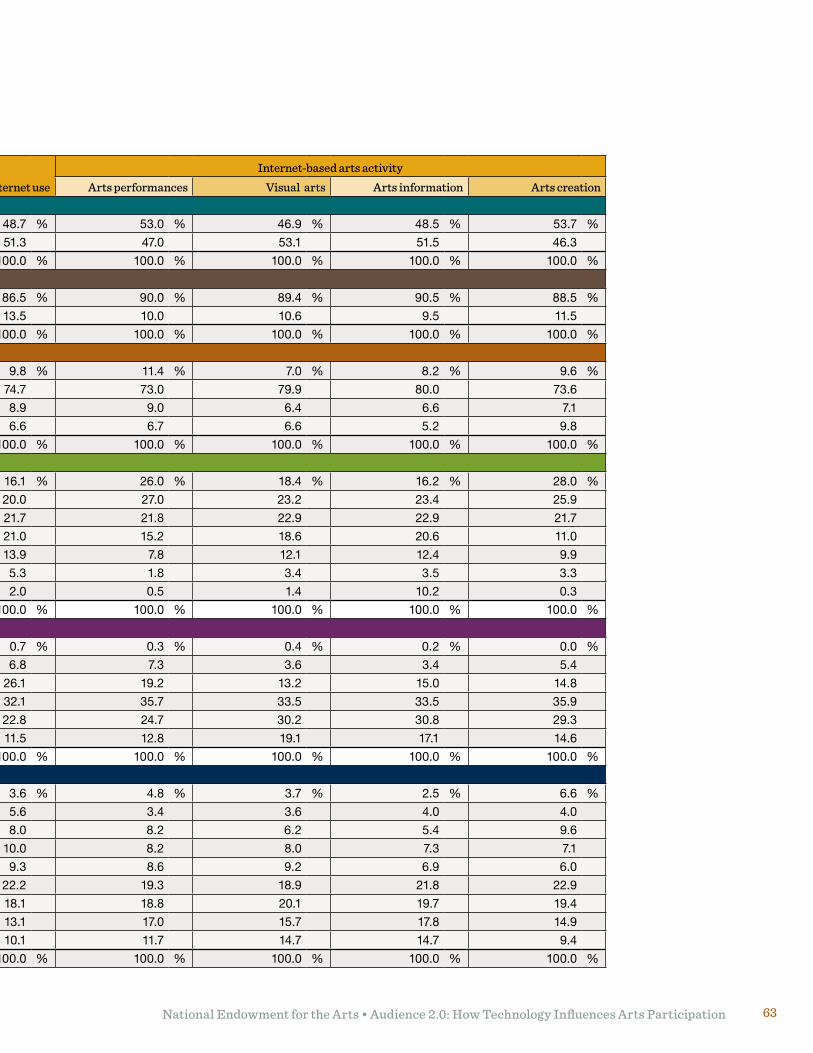
National Endowment for the Arts • Audience 2.0: How Technology Influences Arts Participation 63
U.S. Population Overall Internet use
Internet-based arts activity
Arts performances Visual arts Arts information Arts creationGender
Male 48.3 % 48.7 % 53.0 % 46.9 % 48.5 % 53.7 %
Female 51.7 51.3 47.0 53.1 51.5 46.3
Total 100.0 % 100.0 % 100.0 % 100.0 % 100.0 % 100.0 %
Location
Metro 83.9 % 86.5 % 90.0 % 89.4 % 90.5 % 88.5 %
Rural 16.1 13.5 10.0 10.6 9.5 11.5
Total 100.0 % 100.0 % 100.0 % 100.0 % 100.0 % 100.0 %
Race and ethnicity
Hispanic 13.5 % 9.8 % 11.4 % 7.0 % 8.2 % 9.6 %
White* 68.7 74.7 73.0 79.9 80.0 73.6
African American* 11.4 8.9 9.0 6.4 6.6 7.1
Other* 6.4 6.6 6.7 6.6 5.2 9.8
Total 100.0 % 100.0 % 100.0 % 100.0 % 100.0 % 100.0 %
Age
18-24 12.8 % 16.1 % 26.0 % 18.4 % 16.2 % 28.0 %
25-34 17.7 20.0 27.0 23.2 23.4 25.9
35-44 18.6 21.7 21.8 22.9 22.9 21.7
45-54 19.5 21.0 15.2 18.6 20.6 11.0
55-64 14.8 13.9 7.8 12.1 12.4 9.9
65-74 8.8 5.3 1.8 3.4 3.5 3.3
75 and over 7.6 2.0 0.5 1.4 10.2 0.3
Total 100.0 % 100.0 % 100.0 % 100.0 % 100.0 % 100.0 %
Education
Gradeschool 5.0 % 0.7 % 0.3 % 0.4 % 0.2 % 0.0 %
Some high school 9.8 6.8 7.3 3.6 3.4 5.4
High school graduate 30.4 26.1 19.2 13.2 15.0 14.8
Some college 27.3 32.1 35.7 33.5 33.5 35.9
College graduate 18.3 22.8 24.7 30.2 30.8 29.3
Graduateschool 9.1 11.5 12.8 19.1 17.1 14.6
Total 100.0 % 100.0 % 100.0 % 100.0 % 100.0 % 100.0 %
Income
Less than $10K 5.8 % 3.6 % 4.8 % 3.7 % 2.5 % 6.6 %
$10K to $20K 9.6 5.6 3.4 3.6 4.0 4.0
$20K to $30K 11.7 8.0 8.2 6.2 5.4 9.6
$30K to $40K 11.3 10.0 8.2 8.0 7.3 7.1
$40K to $50K 9.3 9.3 8.6 9.2 6.9 6.0
$50K to $75K 20.3 22.2 19.3 18.9 21.8 22.9
$75K to $100K 13.5 18.1 18.8 20.1 19.7 19.4
$100K to $150K 10.7 13.1 17.0 15.7 17.8 14.9
$150K and over 8.0 10.1 11.7 14.7 14.7 9.4
Total 100.0 % 100.0 % 100.0 % 100.0 % 100.0 % 100.0 %
National Endowment for the Arts • Audience 2.0: How Technology Influences Arts Participation64
the Internet to download, watch or listen to arts performances online.
Visual arts. The 2008 SPPA also asked respondents whether they had used the Internet to view visual art online, including paintings, sculpture, and photography. Figure 3-21 shows that 14 percent of U.S. adults reported viewing visual arts online.
Arts creation. Respondents were asked whether they had used the Internet to create or post art online, including design, music, photography, films, videos, and creative writing (outside of school or work). As illustrated in Figure 3-21, 5 percent of U.S. adults reported having used the Internet to create or post art online in the 12-month period ending in May 2008.
Arts information. The SPPA included a question concerning the use of the Internet to obtain information about a music, theater, dance performance, or an art exhibit (including purchasing tickets online). Almost one-quarter of respondents indicated that they used the Internet to obtain such information — more than any other Internet activity shown in Figure 3-21.
Demographic characteristics of people who participated in the arts through the Internet. Figures 3-22 and 3-23 present demographic information about U.S. adults who reported participating in Internet-based arts activities. Figure 3-22 shows the percent of adults by demographic group that reported participating in Internet-based arts activities, and Figure 3-23 presents the corresponding demographic distributions.
Location. Figure 3-22 shows that people living in metropolitan areas were more likely than people living in rural areas to participate in Internet-based
arts activities, mirroring Internet use overall.
Race and ethnicity. Non-Hispanic white adults were generally more likely than African-American and Hispanic adults to report using the Internet to participate in the arts. The only exception to that pattern was for arts creation — African Americans (3%) and Hispanic adults (4%) reported creating art online at a rate comparable to non-Hispanic white adults (5%). Non-Hispanic white adults and other-race adults also generally showed comparable participation rates for Internet-based arts activities.
Age. In general, the older the respondent, the less likely he or she was to report having participated in Internet-based arts activities (or to use the Internet at all). For example, 42 percent of 18-24 year olds used the Internet to download, watch, or listen to arts performances in the 12 months ending in May 2008. By contrast, fewer than 4 percent of adults 65 or older reported doing so.
Education and income. People with more education and income tended to show higher rates of participation in Internet-based arts activities than people with less education and lower income.
Frequency of participation in Internet-based arts activities. For respondents who reported participating in Internet-based arts activities, the 2008 SPPA also asked how often they did so. Figure 3-24 shows the frequency of participation for those respondents who reported that they had participated in an Internet-based arts activity.
As shown in Figure 3-24, nearly three-fourths of adults who reported using the Internet, reported doing so at least once a day. More than half of the respondents who reported participating in arts
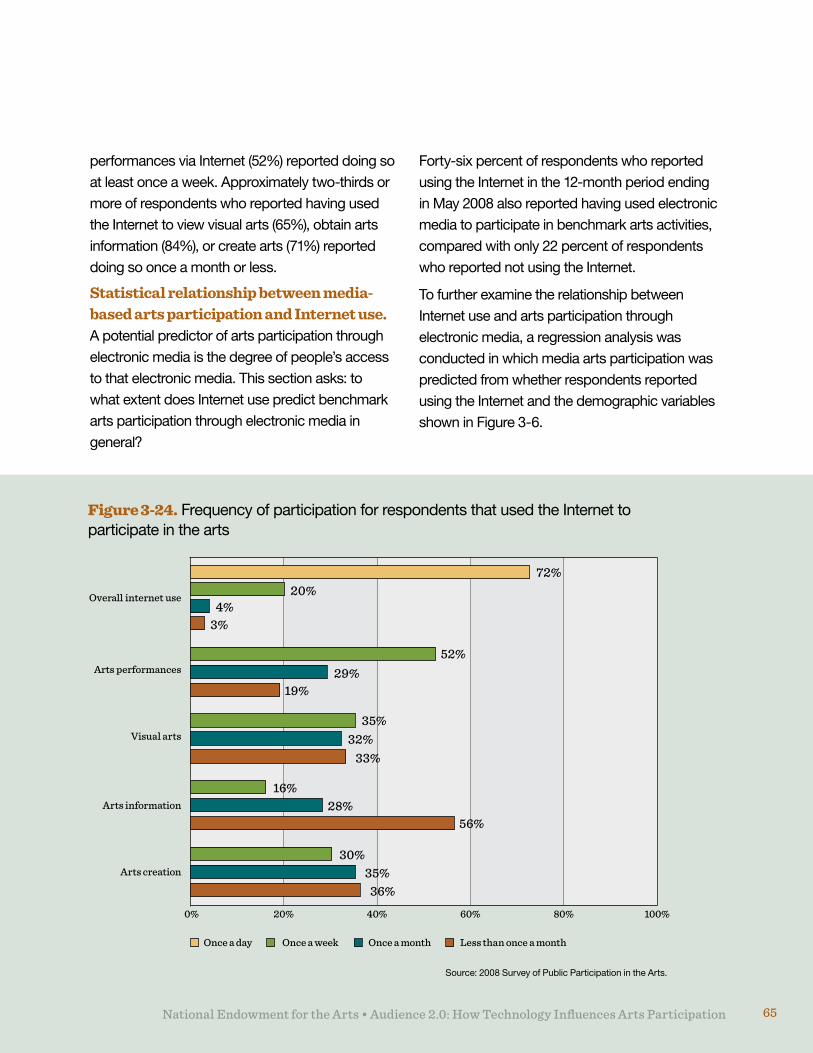
National Endowment for the Arts • Audience 2.0: How Technology Influences Arts Participation 65National Endowment for the Arts • Audience 2.0: How Technology Influences Arts Participation 65
performances via Internet (52%) reported doing so at least once a week. Approximately two-thirds or more of respondents who reported having used the Internet to view visual arts (65%), obtain arts information (84%), or create arts (71%) reported doing so once a month or less.
Statistical relationship between media-based arts participation and Internet use. A potential predictor of arts participation through electronic media is the degree of people’s access to that electronic media. This section asks: to what extent does Internet use predict benchmark arts participation through electronic media in general?
Forty-six percent of respondents who reported using the Internet in the 12-month period ending in May 2008 also reported having used electronic media to participate in benchmark arts activities, compared with only 22 percent of respondents who reported not using the Internet.
To further examine the relationship between Internet use and arts participation through electronic media, a regression analysis was conducted in which media arts participation was predicted from whether respondents reported using the Internet and the demographic variables shown in Figure 3-6.
Figure 3-24. Frequency of participation for respondents that used the Internet to participate in the arts
0% 20% 40% 60% 80% 100%
Overall internet use
Arts performances
Visual arts
Arts information
Arts creation
Once a day Once a week Once a month Less than once a month
Source: 2008 Survey of Public Participation in the Arts.
72%
52%
56%
20%
29%
35%32%
33%
30%35%
36%
19%
16%28%
4%3%
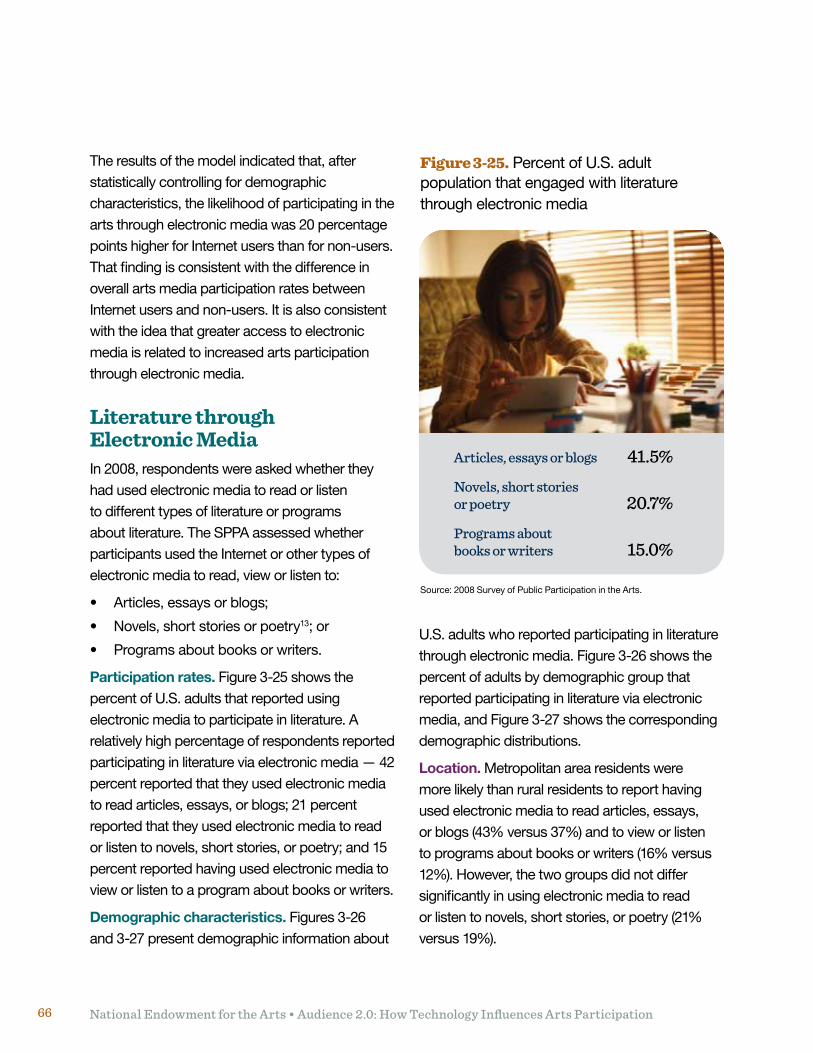
National Endowment for the Arts • Audience 2.0: How Technology Influences Arts Participation66
The results of the model indicated that, after statistically controlling for demographic characteristics, the likelihood of participating in the arts through electronic media was 20 percentage points higher for Internet users than for non-users. That finding is consistent with the difference in overall arts media participation rates between Internet users and non-users. It is also consistent with the idea that greater access to electronic media is related to increased arts participation through electronic media.
Literature through Electronic MediaIn 2008, respondents were asked whether they had used electronic media to read or listen to different types of literature or programs about literature. The SPPA assessed whether participants used the Internet or other types of electronic media to read, view or listen to:
• Articles,essaysorblogs;
• Novels,shortstoriesorpoetry13; or
• Programsaboutbooksorwriters.
Participation rates. Figure 3-25 shows the percent of U.S. adults that reported using electronic media to participate in literature. A relatively high percentage of respondents reported participating in literature via electronic media — 42 percent reported that they used electronic media to read articles, essays, or blogs; 21 percent reported that they used electronic media to read or listen to novels, short stories, or poetry; and 15 percent reported having used electronic media to view or listen to a program about books or writers.
Demographic characteristics. Figures 3-26 and 3-27 present demographic information about
U.S. adults who reported participating in literature through electronic media. Figure 3-26 shows the percent of adults by demographic group that reported participating in literature via electronic media, and Figure 3-27 shows the corresponding demographic distributions.
Location. Metropolitan area residents were more likely than rural residents to report having used electronic media to read articles, essays, or blogs (43% versus 37%) and to view or listen to programs about books or writers (16% versus 12%). However, the two groups did not differ significantly in using electronic media to read or listen to novels, short stories, or poetry (21% versus 19%).
Figure 3-25. Percent of U.S. adult population that engaged with literature through electronic media
Source: 2008 Survey of Public Participation in the Arts.
Articles, essays or blogs 41.5%
Novels, short stories or poetry 20.7%
Programs about books or writers 15.0%
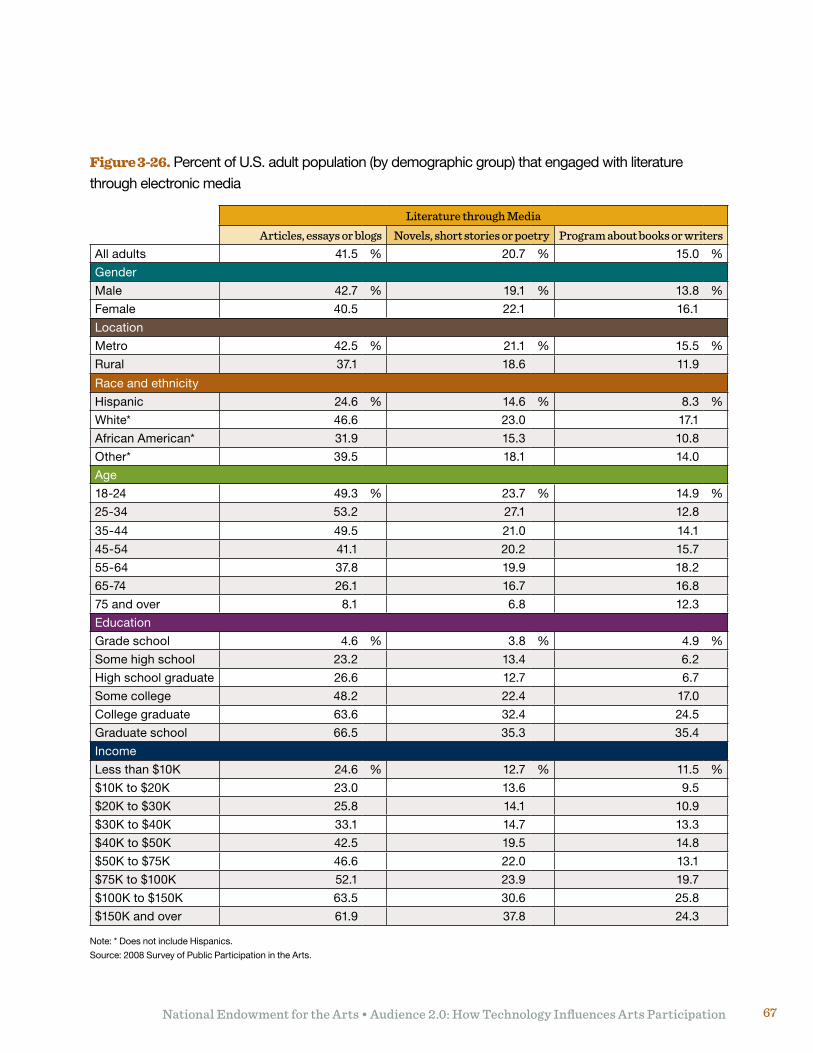
National Endowment for the Arts • Audience 2.0: How Technology Influences Arts Participation 67
Figure 3-26. Percent of U.S. adult population (by demographic group) that engaged with literature through electronic media
Note: * Does not include Hispanics.
Source: 2008 Survey of Public Participation in the Arts.
Literature through Media
Articles, essays or blogs Novels, short stories or poetry Program about books or writersAll adults 41.5 % 20.7 % 15.0 %
Gender
Male 42.7 % 19.1 % 13.8 %
Female 40.5 22.1 16.1
Location
Metro 42.5 % 21.1 % 15.5 %
Rural 37.1 18.6 11.9
Race and ethnicity
Hispanic 24.6 % 14.6 % 8.3 %
White* 46.6 23.0 17.1
African American* 31.9 15.3 10.8
Other* 39.5 18.1 14.0
Age
18-24 49.3 % 23.7 % 14.9 %
25-34 53.2 27.1 12.8
35-44 49.5 21.0 14.1
45-54 41.1 20.2 15.7
55-64 37.8 19.9 18.2
65-74 26.1 16.7 16.8
75 and over 8.1 6.8 12.3
Education
Gradeschool 4.6 % 3.8 % 4.9 %
Some high school 23.2 13.4 6.2
High school graduate 26.6 12.7 6.7
Some college 48.2 22.4 17.0
College graduate 63.6 32.4 24.5
Graduateschool 66.5 35.3 35.4
Income
Less than $10K 24.6 % 12.7 % 11.5 %
$10K to $20K 23.0 13.6 9.5
$20K to $30K 25.8 14.1 10.9
$30K to $40K 33.1 14.7 13.3
$40K to $50K 42.5 19.5 14.8
$50K to $75K 46.6 22.0 13.1
$75K to $100K 52.1 23.9 19.7
$100K to $150K 63.5 30.6 25.8
$150K and over 61.9 37.8 24.3
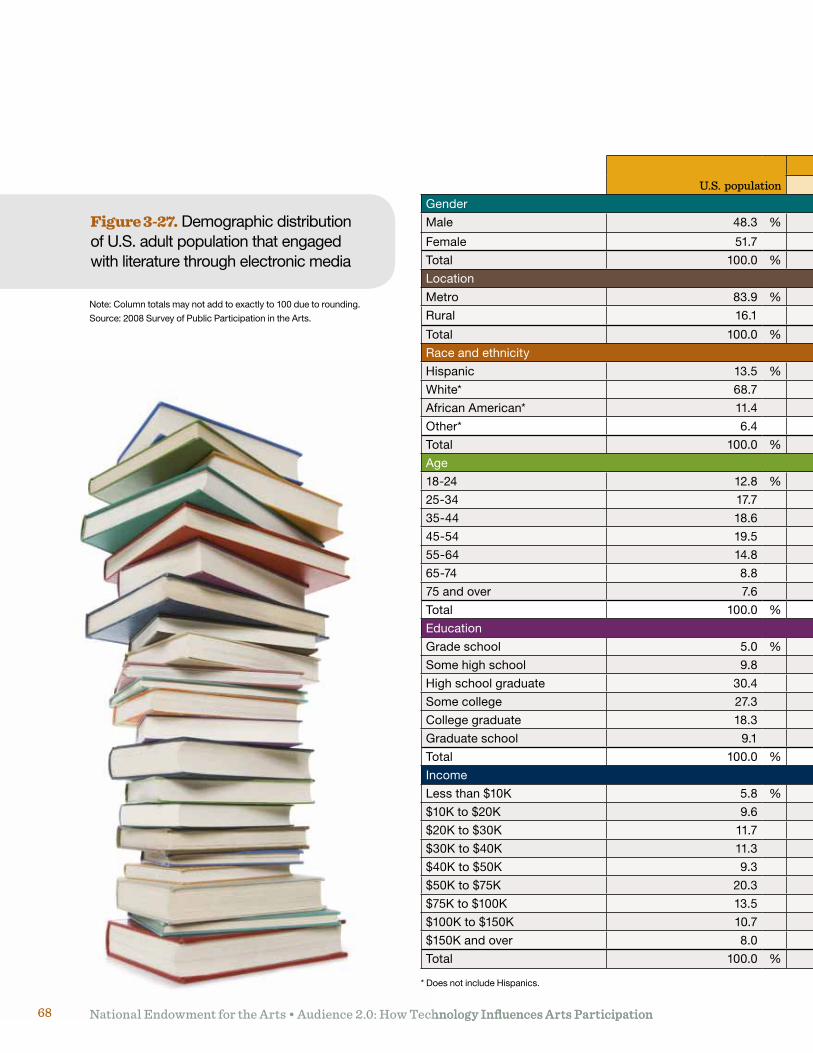
National Endowment for the Arts • Audience 2.0: How Technology Influences Arts Participation68 National Endowment for the Arts • Audience 2.0: How Technology Influences Arts Participation68
U.S. population
Literature through Media
Articles, essays or blogs Novels, short stories or poetry Program about books or writersGender
Male 48.3 % 49.7 % 44.9 % 44.9 %
Female 51.7 50.3 55.1 55.1
Total 100.0 % 100.0 % 100.0 % 100.0 %
Location
Metro 83.9 % 85.5 % 85.4 % 87.6 %
Rural 16.1 14.5 14.6 12.4
Total 100.0 % 100.0 % 100.0 % 100.0 %
Race and ethnicity
Hispanic 13.5 % 7.7 % 9.3 % 7.4 %
White* 68.7 76.7 76.0 78.3
African American* 11.4 8.7 8.4 8.3
Other* 6.4 6.8 6.3 6.0
Total 100.0 % 100.0 % 100.0 % 100.0 %
Age
18-24 12.8 % 15.6 % 15.0 % 12.8 %
25-34 17.7 22.4 22.9 14.6
35-44 18.6 22.0 18.8 18.3
45-54 19.5 19.4 19.2 21.3
55-64 14.8 13.3 14.1 17.4
65-74 8.8 5.8 7.5 9.6
75 and over 7.6 1.4 2.4 6.0
Total 100.0 % 100.0 % 100.0 % 100.0 %
Education
Gradeschool 5.0 % 0.6 % 1.0 % 1.5 %
Some high school 9.8 5.4 6.3 4.2
High school graduate 30.4 19.3 18.4 14.2
Some college 27.3 31.0 28.9 30.9
College graduate 18.3 29.1 29.8 28.7
Graduateschool 9.1 14.6 15.6 20.5
Total 100.0 % 100.0 % 100.0 % 100.0 %
Income
Less than $10K 5.8 % 3.5 % 3.6 % 4.0 %
$10K to $20K 9.6 5.3 6.3 5.9
$20K to $30K 11.7 7.2 7.9 7.8
$30K to $40K 11.3 8.4 7.5 10.0
$40K to $50K 9.3 9.2 8.4 8.9
$50K to $75K 20.3 21.8 20.7 17.0
$75K to $100K 13.5 16.2 15.0 18.3
$100K to $150K 10.7 16.7 16.2 16.1
$150K and over 8.0 11.7 14.3 11.9
Total 100.0 % 100.0 % 100.0 % 100.0 %
Figure 3-27. Demographic distribution of U.S. adult population that engaged with literature through electronic media
Note: Column totals may not add to exactly to 100 due to rounding.
Source: 2008 Survey of Public Participation in the Arts.
* Does not include Hispanics.
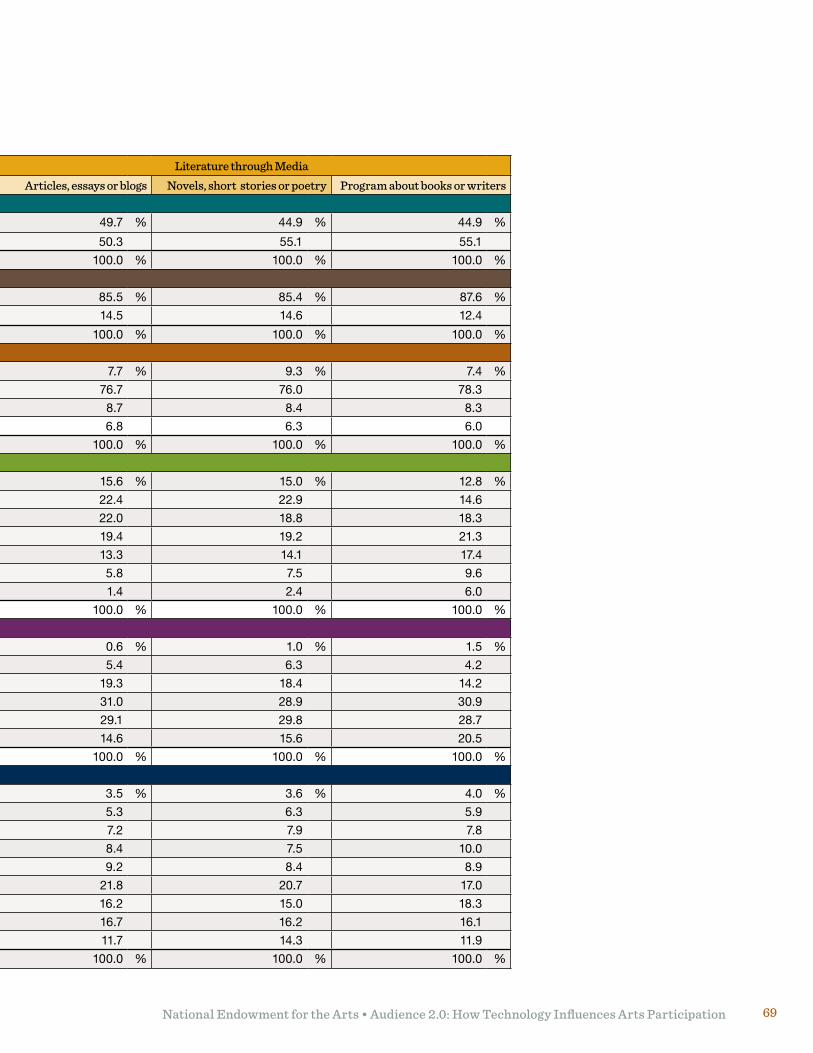
National Endowment for the Arts • Audience 2.0: How Technology Influences Arts Participation 69
U.S. population
Literature through Media
Articles, essays or blogs Novels, short stories or poetry Program about books or writersGender
Male 48.3 % 49.7 % 44.9 % 44.9 %
Female 51.7 50.3 55.1 55.1
Total 100.0 % 100.0 % 100.0 % 100.0 %
Location
Metro 83.9 % 85.5 % 85.4 % 87.6 %
Rural 16.1 14.5 14.6 12.4
Total 100.0 % 100.0 % 100.0 % 100.0 %
Race and ethnicity
Hispanic 13.5 % 7.7 % 9.3 % 7.4 %
White* 68.7 76.7 76.0 78.3
African American* 11.4 8.7 8.4 8.3
Other* 6.4 6.8 6.3 6.0
Total 100.0 % 100.0 % 100.0 % 100.0 %
Age
18-24 12.8 % 15.6 % 15.0 % 12.8 %
25-34 17.7 22.4 22.9 14.6
35-44 18.6 22.0 18.8 18.3
45-54 19.5 19.4 19.2 21.3
55-64 14.8 13.3 14.1 17.4
65-74 8.8 5.8 7.5 9.6
75 and over 7.6 1.4 2.4 6.0
Total 100.0 % 100.0 % 100.0 % 100.0 %
Education
Gradeschool 5.0 % 0.6 % 1.0 % 1.5 %
Some high school 9.8 5.4 6.3 4.2
High school graduate 30.4 19.3 18.4 14.2
Some college 27.3 31.0 28.9 30.9
College graduate 18.3 29.1 29.8 28.7
Graduateschool 9.1 14.6 15.6 20.5
Total 100.0 % 100.0 % 100.0 % 100.0 %
Income
Less than $10K 5.8 % 3.5 % 3.6 % 4.0 %
$10K to $20K 9.6 5.3 6.3 5.9
$20K to $30K 11.7 7.2 7.9 7.8
$30K to $40K 11.3 8.4 7.5 10.0
$40K to $50K 9.3 9.2 8.4 8.9
$50K to $75K 20.3 21.8 20.7 17.0
$75K to $100K 13.5 16.2 15.0 18.3
$100K to $150K 10.7 16.7 16.2 16.1
$150K and over 8.0 11.7 14.3 11.9
Total 100.0 % 100.0 % 100.0 % 100.0 %
National Endowment for the Arts • Audience 2.0: How Technology Influences Arts Participation70
Race and ethnicity. Non-Hispanic white adults weremorelikelythanallotherracial/ethnicgroupsto report having used electronic media to read articles, essays, or blogs and to read or listen to novels, short stories, or poetry. They were also morelikelythanallotherracial/ethnicgroupstoreport having used electronic media to view or listen to a program about books or writers.
Age. Respondents 65 and older were less likely than respondents between the ages of 18 and 64 to report using electronic media to read articles, essays, or blogs or to read or listen to novels, short stories, or poetry.
Education and income. The 2008 SPPA showed a strong relationship between education and income and using electronic media to electronic participate in literature — people with more education and income tended to show higher rates of literature participation through electronic media than people with less education and income. That pattern was observed for all of the literature-related activities shown in Figure 3-26.
Summary and ImplicationsThe 2008 SPPA provides important information about how U.S. adults use electronic media to participate in various arts activities, including the performing arts, visual arts, and literature. Key findings and their implications are summarized below.
Overall arts participation through electronic media. Thirty-seven percent of U.S. adults used electronic media to view or listen to a benchmark arts activity in the 12 months ending in May 2008, slightly more than the percentage of adults that attended a benchmark activity (35%) during the same time period.
In general, U.S. adults who participated in benchmark activities through electronic media resembled those who attend live benchmark arts events. Both groups tended to be comprised of:
• Metropolitanarearesidents;
• Non-Hispanicwhiteandother-raceadults;
• Adultswhoattendedcollege;and
• Adultswithincomesgreaterthan$100,000.14
Implications. Findings from the 2008 SPPA have important implications for anyone trying to understand who participates in the arts through electronic and digital media.
• Overall,peopleareparticipatinginthearts through electronic media at higher rates than through live attendance. This pattern especially holds for demographic groups such as African Americans, adults 75 and older, and adults with relatively low incomes.15 Although these groups typically have low live attendance rates, among those participating solely through electronic media their rates are among the highest. These findings suggest that arts participation for many U.S. adults would not occur without electronic media.
• Demographicdifferencesinartsparticipationrates appear much smaller when considering participation through electronic media than live attendance. This finding is further evidence that electronic media provides alternative ways for certain groups who do not typically attend arts events to still engage in arts activities.
• Severalsegmentsofthepopulationexhibitlow rates of arts participation through electronic media overall. Further efforts should be made to determine why those
National Endowment for the Arts • Audience 2.0: How Technology Influences Arts Participation 71
groups — including Hispanics, older Americans, and adults who did not attend college — do not use electronic media to participate in the arts as much as others.
Overall arts participation by different participant segments. Individuals who were most likely to report participating in benchmark activities through both live attendance and electronic media were similar to those who reported arts participation through live attendance alone. Both groups tended to be:
• Metropolitanarearesidents;
• Non-Hispanicwhiteorother-raceadults;
• Youngerthan65yearsofage;
• Adultswithrelativelyhighlevelsofeducation;and
• Adultswithrelativelyhighlevelsofincome.
By contrast, people who participated in the arts through electronic media alone were much more similar to people who did not participate in the arts through either media or live attendance. They were more likely to be:
• Ruralarearesidents;
• Racialandethnicminorities;
• Olderadults;
• Adultswithrelativelylowlevelsof education; and
• Adultswithrelativelylowlevelsofincome.
Implications. Data regarding arts participation through electronic media alone indicate that certain groups — including racial and ethnic minorities, older adults, rural residents, and adults with relatively low incomes — have an interest in participating in the arts but may be disinclined to attend arts events or face barriers in doing so.
Research efforts might examine potential barriers to attending arts events such as those associated with ticket prices or accessibility. In addition, certain electronic media — such as television and the Internet — could be used to encourage arts participation among demographic groups who are less likely to attend arts events.
Participation in individual arts activities through electronic media. There are a number of benchmark and other arts activities in which people participate through electronic media at a higher rate than through attendance, including jazz, classical music, opera, and Latin music. However, there are other activities — such as musical and non-musical plays and visual arts — for which attendance rates are as high or higher than rates of participation through electronic media.
An examination of electronic media participation in various individual arts activities revealed several differences:
• AlthoughAfricanAmericansexhibitedrelatively low overall rates of arts participation through electronic media (see Figure 3-4), they showed higher media participation rates thanallotherracial/ethnicgroupsforjazz.
• Ruralresidentsdidnotdifferfrommetropolitan area residents in media participation in dance performances (including ballet) through electronic media, despite the fact that metropolitan residents were more likely to report using electronic media to participate in every other arts activity.
• Morethan50percentofHispanicrespondents reported using electronic media to participate in Latin music, more than five
National Endowment for the Arts • Audience 2.0: How Technology Influences Arts Participation72
times the proportion of any other race and ethnicity group.
• ArelativelylargeproportionofAmericansreported participating in literature through electronic media, consistent with findings from a NEA report that showed an increase in reading rates among U.S. adults between 2002 and 2008.16
Implications. Findings from the 2008 SPPA regarding electronic media participation in individual arts activities have implications for understanding current levels of participation and for developing future research.
• Peoplearemorelikelytoparticipateincertainarts activities — such as jazz, classical music and opera — through electronic media and in other arts activities — such as musical and non-musical plays — through live attendance. Those findings suggest that there may be certain characteristics of arts activities — for example, degree of accessibility through electronic media and cost of attendance — that make participation through electronic media more or less likely. Further efforts should be made to determine why people are more likely to participate in certain arts activities through media than others.
• Severaldifferentdemographicgroups—such as African Americans, Hispanics, older adults and rural area residents — show relatively low overall rates of arts participation through media but nonetheless exhibit relatively high rates of media participation for specific arts activities. Those findings suggest that such groups still have an interest in the arts and that their interest should be further explored.
National Endowment for the Arts • Audience 2.0: How Technology Influences Arts Participation 73
Notes1 Chapter 3 also provides information about live attendance
rates as a reference point against which to compare participation rates through electronic media. For a more detailed discussion of live attendance data, see the Arts Participation 2008: Highlights from a National Survey. The full 2008 SPPA report can be found online at: http://www.nea.gov/research/2008-SPPA.pdf
2 Unless otherwise noted, differences discussed in text of Chapter 3 are statistically significant.
3 The 2008 SPPA included a question that asked whether respondents had used the Internet to watch, listen to or download live or recorded music, theater or dance performances (without specifying types of performance). That question was not included in the benchmark activities category (or the arts performances category) because it was too broad to compare with live attendance questions. Responses to the question are analyzed in the “Arts Participation through the Internet” section of Chapter 3.
4 The rate of arts media participation reported in the monograph differs from the arts media participation rate reported in 2008 Survey of Public Participation in the Arts Research Report #49 (41%). Whereas the monograph includes only benchmark arts activities in its arts media participation rate, the 2008 SPPA report also included Latin music and literary participation and did not include viewing visual arts online.
5 Note that participation rates for arts performances and visual arts do not sum to participation rates for all benchmark arts activities because many respondents who reported participating in benchmark activities participated in both arts performances and visual arts.
6 For model specifications, see Appendix C.
7 A factor with a “marginal impact of 0.0” is the point of comparison for other demographic groups. It does not indicate that the factor has no impact on the arts participation measure.
8 The marginal impact of being male on arts media participation did not differ significantly from zero.
9 To be included in the segment of respondents who participated in the arts through both media and live attendance, respondents could have reported participating in the same benchmark activity through both media and attendance or reported participating in one activity through media and a different activity through attendance. As a result of that definition, arts performances and visual arts were not separately analyzed for that participant segment.
10 Visual arts data are also presented in Figures 3-4 and 3-5.
11 From 2002 to 2008, the number of Hispanic-American adults grew by 33 percent (to 30.4 million adults), compared with a 10 percent growth rate for all adults.
12 Many of the differences in Latin music participation by demographicgroupreflectthedemographicprofileofHispanic Americans.
13 The 2008 SPPA included a question about whether respondents listened to any novels, short stories, or poetry, either live or recorded. Although the question did not specify that participants had to have used electronic media to do so, it was asked within the context of other literature media questions and used a similar format. Thus, responses to the question were included here in analyses of literature participation through media.
14 Note that the effects of race and income were found to be minimal after controlling for other demographic traits.
15 Note that the effects of race and income were found to be minimal after controlling for other demographic traits.
16 For a more detailed discussion of reading data, see the Reading on the Rise: A New Chapter in American Literacy. The full report can be found online at: http://www.arts.gov/research/readingonRise.pdf
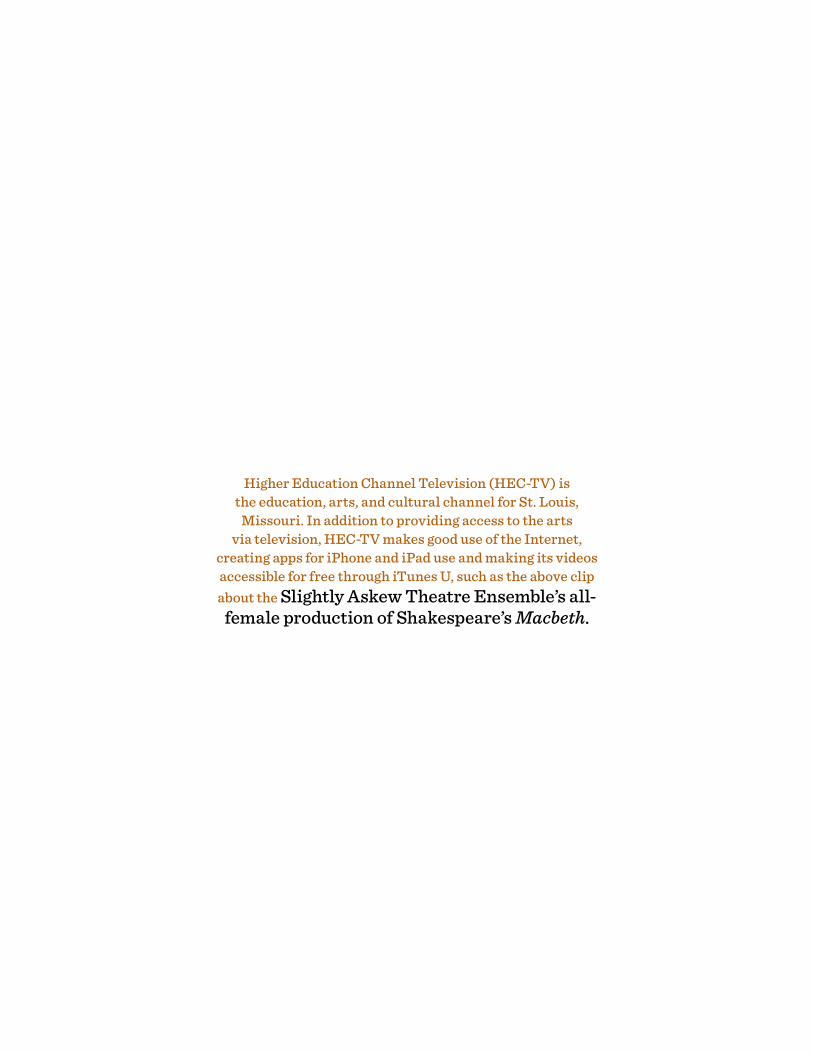
Higher Education Channel Television (HEC-TV) is the education, arts, and cultural channel for St. Louis,
Missouri. In addition to providing access to the arts via television, HEC-TV makes good use of the Internet,
creating apps for iPhone and iPad use and making its videos accessible for free through iTunes U, such as the above clip about the Slightly Askew Theatre Ensemble’s all-
female production of Shakespeare’s Macbeth.
Chapter 4Comparing Media-Based
Arts Participation with Participation by Other Means
National Endowment for the Arts • Audience 2.0: How Technology Influences Arts Participation76
One of the key findings from the 2008 SPPA summary report was that rates of live attendance at arts events had fallen substantially since 2002 for most benchmark arts activities. Longer-term declines persisted for classical
music, theater, and ballet. At the same time, dramatic growth occurred in the variety, quality, and affordability of electronic media options available to arts participants and the quality of those options (cf.., Kaiser Family Foundation, 2010; Pew Internet and American Life Project, 2005).
A critical question regarding media-based arts participation is whether such activity is related to arts participation through live attendance, as well as through other means such as personal artsperformanceandartscreation.Giventheimprovements in electronic media in recent years, it is possible that people rely more heavily on electronic media to engage in arts activities at the expense of arts participation through other means. That is, greater levels of arts participation through electronic media may be “replacing” other types of arts engagement.1
Many previous studies have shown strong correlations between arts participation through electronic media and through live attendance, indicating that perhaps using electronic media to participate in the arts leads to increased involvement in the arts overall (for a review, see Chapter 2). However, recent improvements in the quality and accessibility of electronic media give reason to reexamine the relationship between participation through electronic media and arts participation through other means, based on the most current arts participation data from the 2008 SPPA.
Arts Participation through Electronic Media and Other Means As a first step in exploring the relationship between media-based participation and arts participation through other means, it is instructive to revisit the overall rate at which U.S. adults reported using electronic media to participate in benchmark arts activities in the 2008 SPPA. As shown in Figure 3-3 of Chapter 3, overall, more than one-third of all respondents reported using electronic media to view or listen to benchmark arts forms (37%).
Figure 4-1 shows overall rates of arts participation through electronic media and non-participation by demographic group, and Figure 4-2 shows the demographic distributions of those respondents.2 Key findings include3:
• Adultswithatleastacollegedegreeweremore likely to report having used electronic media to participate in the arts than to report not having done so.
• Nearly80percentofrespondentswho did not graduate from high school reported not using electronic media to participate in the arts.
National Endowment for the Arts • Audience 2.0: How Technology Influences Arts Participation 77
• Ruralresidentswerelesslikelythanmetropolitan area residents to report having used electronic media to participate in the arts.
Differences between arts participants through electronic media and non-participants in arts engagement through other means. In examining the relationship between participation in the arts through electronic media and through other means, it is useful to compare rates at which media-based arts participants and non-media-based arts participants engage with art through live arts attendance, personal arts performance, and art creation.
Participation rates. Figure 4-3 shows the percent of media-based arts participants through electronic media and non-media-based arts participants that reported engaging with art through live attendance, personal performance and creation.
Live attendance. Respondents were considered to have participated in the arts through live attendance if they reported that, in the 12 months ending in May 2008, they attended a jazz, classical music, opera, or ballet performance, a musical or non-musical play, or visited an art museum or gallery.
As shown in Figure 4-3, more than twice as many arts participants through electronic media as non-participants reported attending an arts event (59% versus 21%). Consistent with previous research, this finding indicates that arts participation through electronic media may predict arts participation through live attendance.
Personal arts performance. Respondents were considered to have personally performed in the
arts if they reported that, in the 12-month period ending in May 2008, they:
• Performedorrehearsedjazz,classicalmusic,opera, or dance (including ballet);
• Sangoractedinamusicalplayoractedinanon-musical play;
• Sanginachorale,choir,gleeclub,orothervocal group; or
• Playedamusicalinstrument.
Rates of personal performance were nearly three times higher for arts participants through electronic media than non-participants (32% versus 11%). Those results further suggest that arts participation through electronic media may be related to an increase in arts participation through other means.
Arts creation. Respondents were considered to have created art if they reported that, in the 12-month period ending in May 2008, they:
• Madephotographs,movies,orvideotapesasan artistic activity;
• Weaved,crocheted,quilted,needle-pointed,or sewed;
• Painted,drew,sculpted,orengagedinprintmaking;
• Workedwithpottery,ceramics,jewelry,leather, or metal; or
• Wrotestories,poems,orplays(outsideofschool or work).
As with both live attendance and personal arts performance, people who reported having participated in the arts through electronic media were substantially more likely than people who had not reported doing so to have engaged in arts creation (48% versus 18%).
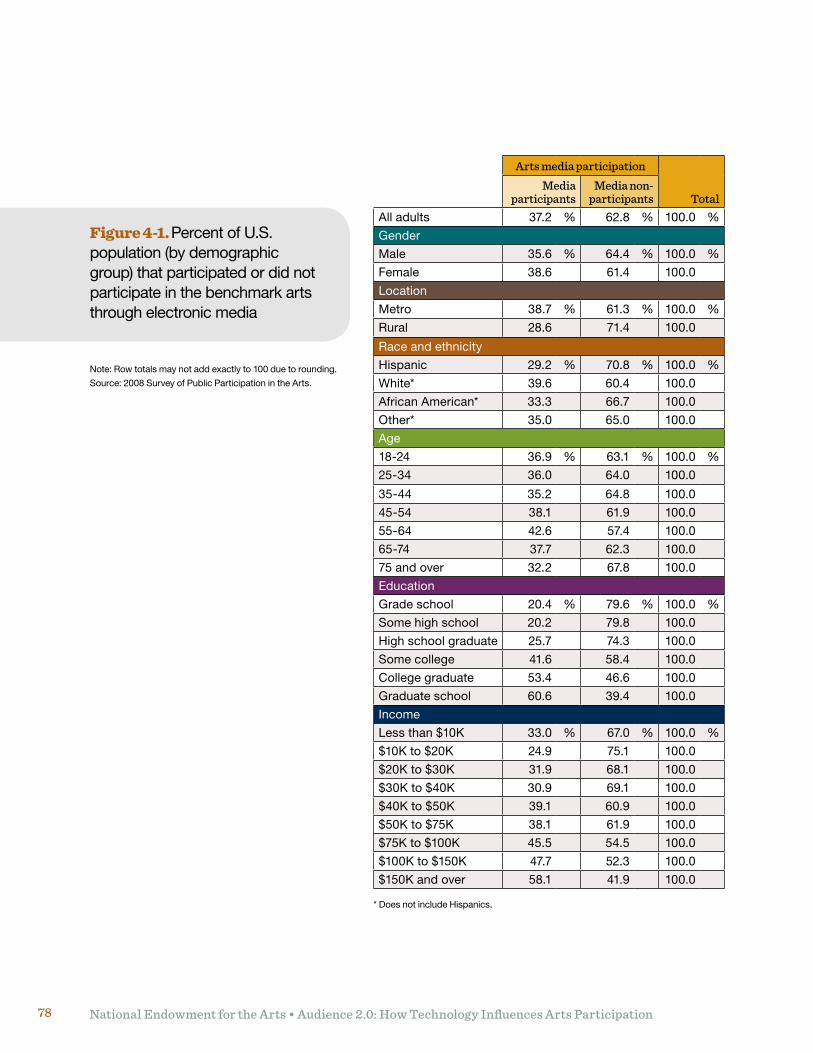
National Endowment for the Arts • Audience 2.0: How Technology Influences Arts Participation78
Arts media participation
TotalMedia
participantsMedia non-
participantsAll adults 37.2 % 62.8 % 100.0 %
Gender
Male 35.6 % 64.4 % 100.0 %
Female 38.6 61.4 100.0
Location
Metro 38.7 % 61.3 % 100.0 %
Rural 28.6 71.4 100.0
Race and ethnicity
Hispanic 29.2 % 70.8 % 100.0 %
White* 39.6 60.4 100.0
African American* 33.3 66.7 100.0
Other* 35.0 65.0 100.0
Age
18-24 36.9 % 63.1 % 100.0 %
25-34 36.0 64.0 100.0
35-44 35.2 64.8 100.0
45-54 38.1 61.9 100.0
55-64 42.6 57.4 100.0
65-74 37.7 62.3 100.0
75 and over 32.2 67.8 100.0
Education
Gradeschool 20.4 % 79.6 % 100.0 %
Some high school 20.2 79.8 100.0
High school graduate 25.7 74.3 100.0
Some college 41.6 58.4 100.0
College graduate 53.4 46.6 100.0
Graduateschool 60.6 39.4 100.0
Income
Less than $10K 33.0 % 67.0 % 100.0 %
$10K to $20K 24.9 75.1 100.0
$20K to $30K 31.9 68.1 100.0
$30K to $40K 30.9 69.1 100.0
$40K to $50K 39.1 60.9 100.0
$50K to $75K 38.1 61.9 100.0
$75K to $100K 45.5 54.5 100.0
$100K to $150K 47.7 52.3 100.0
$150K and over 58.1 41.9 100.0
Note: Row totals may not add exactly to 100 due to rounding.
Source: 2008 Survey of Public Participation in the Arts.
Figure 4-1. Percent of U.S. population (by demographic group) that participated or did not participate in the benchmark arts through electronic media
* Does not include Hispanics.
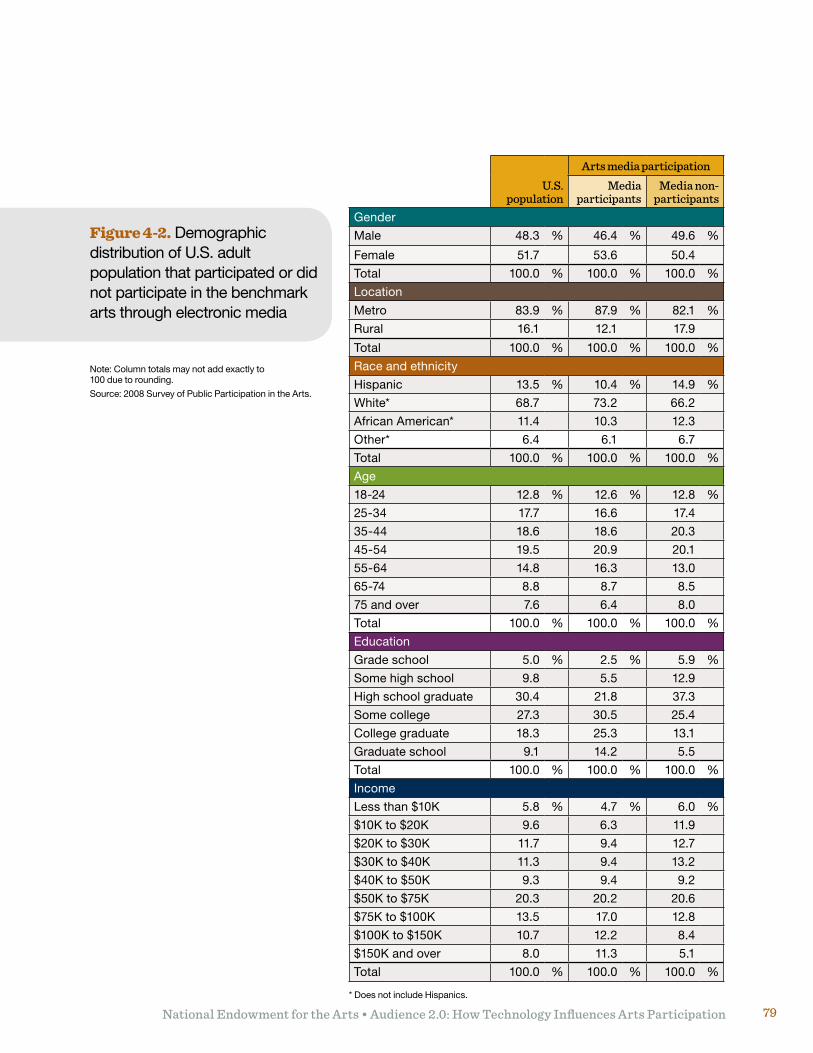
National Endowment for the Arts • Audience 2.0: How Technology Influences Arts Participation 79
Figure 4-2. Demographic distribution of U.S. adult population that participated or did not participate in the benchmark arts through electronic media
Note: Column totals may not add exactly to 100 due to rounding.
Source: 2008 Survey of Public Participation in the Arts.
U.S. population
Arts media participation
Media participants
Media non-participants
Gender
Male 48.3 % 46.4 % 49.6 %
Female 51.7 53.6 50.4
Total 100.0 % 100.0 % 100.0 %
Location
Metro 83.9 % 87.9 % 82.1 %
Rural 16.1 12.1 17.9
Total 100.0 % 100.0 % 100.0 %
Race and ethnicity
Hispanic 13.5 % 10.4 % 14.9 %
White* 68.7 73.2 66.2
African American* 11.4 10.3 12.3
Other* 6.4 6.1 6.7
Total 100.0 % 100.0 % 100.0 %
Age
18-24 12.8 % 12.6 % 12.8 %
25-34 17.7 16.6 17.4
35-44 18.6 18.6 20.3
45-54 19.5 20.9 20.1
55-64 14.8 16.3 13.0
65-74 8.8 8.7 8.5
75 and over 7.6 6.4 8.0
Total 100.0 % 100.0 % 100.0 %
Education
Gradeschool 5.0 % 2.5 % 5.9 %
Some high school 9.8 5.5 12.9
High school graduate 30.4 21.8 37.3
Some college 27.3 30.5 25.4
College graduate 18.3 25.3 13.1
Graduateschool 9.1 14.2 5.5
Total 100.0 % 100.0 % 100.0 %
Income
Less than $10K 5.8 % 4.7 % 6.0 %
$10K to $20K 9.6 6.3 11.9
$20K to $30K 11.7 9.4 12.7
$30K to $40K 11.3 9.4 13.2
$40K to $50K 9.3 9.4 9.2
$50K to $75K 20.3 20.2 20.6
$75K to $100K 13.5 17.0 12.8
$100K to $150K 10.7 12.2 8.4
$150K and over 8.0 11.3 5.1
Total 100.0 % 100.0 % 100.0 %
* Does not include Hispanics.
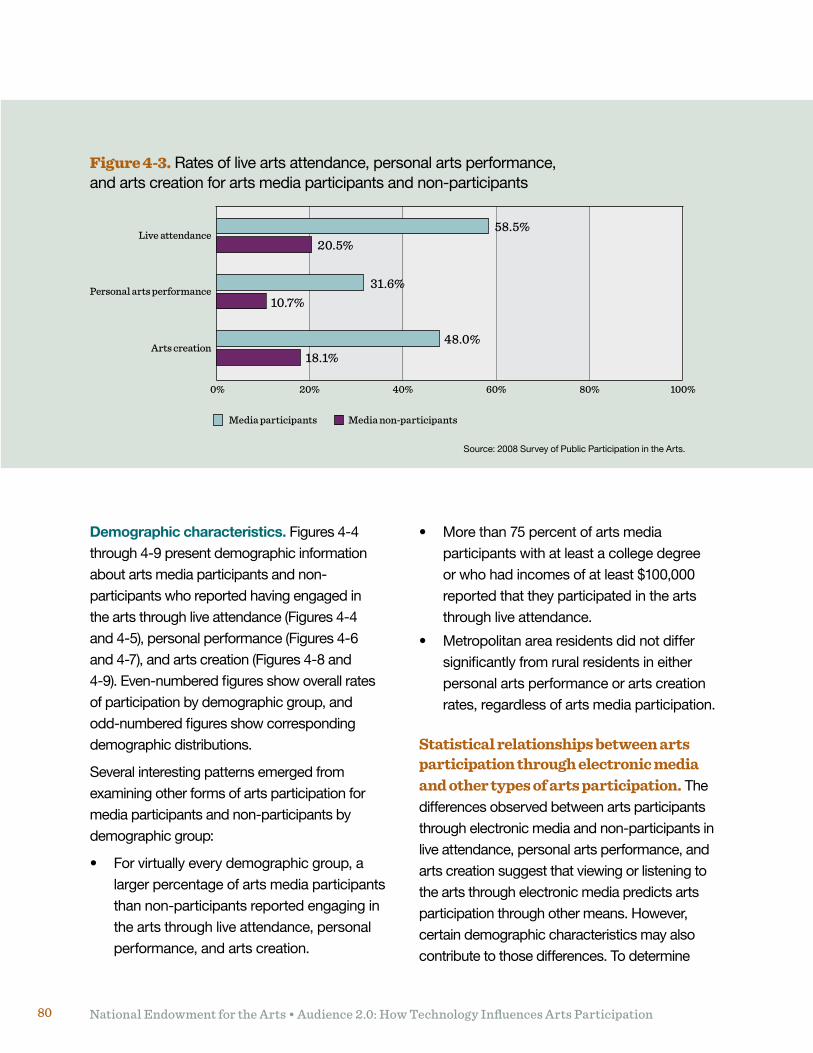
National Endowment for the Arts • Audience 2.0: How Technology Influences Arts Participation80
Demographic characteristics. Figures 4-4 through 4-9 present demographic information about arts media participants and non-participants who reported having engaged in the arts through live attendance (Figures 4-4 and 4-5), personal performance (Figures 4-6 and 4-7), and arts creation (Figures 4-8 and 4-9). Even-numbered figures show overall rates of participation by demographic group, and odd-numbered figures show corresponding demographic distributions.
Several interesting patterns emerged from examining other forms of arts participation for media participants and non-participants by demographic group:
• Forvirtuallyeverydemographicgroup,alarger percentage of arts media participants than non-participants reported engaging in the arts through live attendance, personal performance, and arts creation.
• Morethan75percentofartsmediaparticipants with at least a college degree or who had incomes of at least $100,000 reported that they participated in the arts through live attendance.
• Metropolitanarearesidentsdidnotdiffersignificantly from rural residents in either personal arts performance or arts creation rates, regardless of arts media participation.
Statistical relationships between arts participation through electronic media and other types of arts participation. The differences observed between arts participants through electronic media and non-participants in live attendance, personal arts performance, and arts creation suggest that viewing or listening to the arts through electronic media predicts arts participation through other means. However, certain demographic characteristics may also contribute to those differences. To determine
Figure 4-3. Rates of live arts attendance, personal arts performance, and arts creation for arts media participants and non-participants
0% 20% 40% 60% 80% 100%
Arts creation
Live attendance
Personal arts performance
Media participants Media non-participants
Source: 2008 Survey of Public Participation in the Arts.
58.5%
48.0%18.1%
20.5%
31.6%10.7%
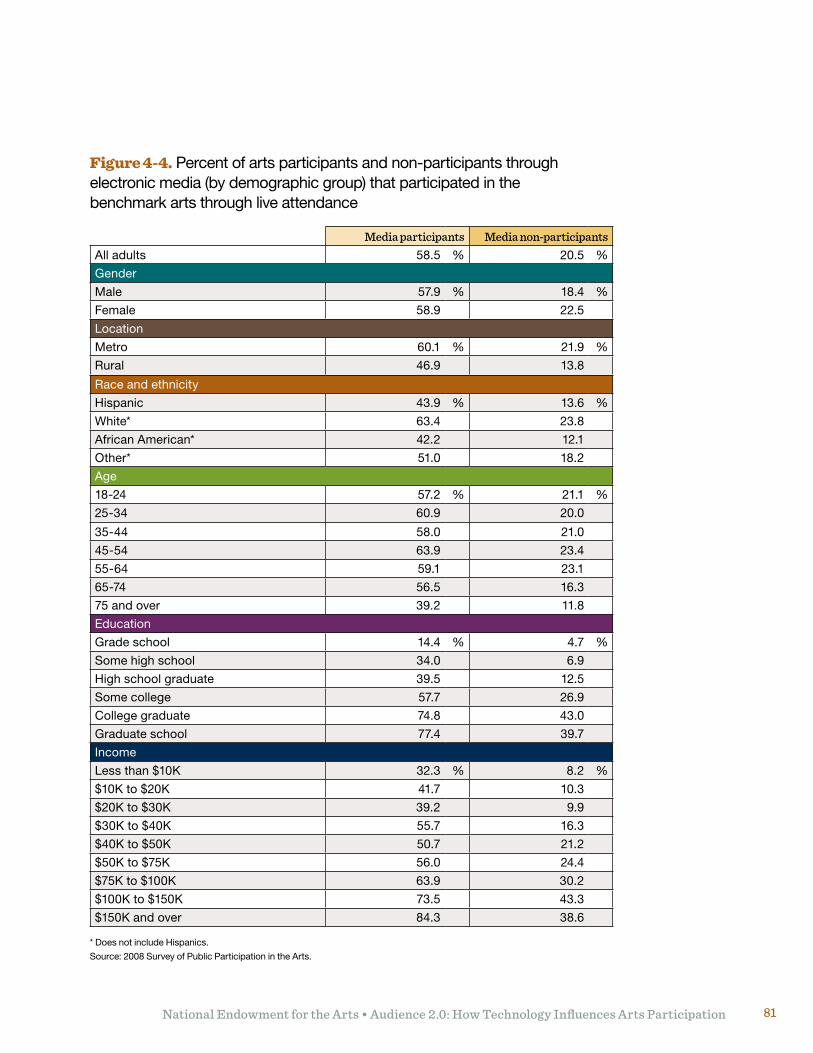
National Endowment for the Arts • Audience 2.0: How Technology Influences Arts Participation 81
Figure 4-4. Percent of arts participants and non-participants through electronic media (by demographic group) that participated in the benchmark arts through live attendance
* Does not include Hispanics.
Source: 2008 Survey of Public Participation in the Arts.
Media participants Media non-participantsAll adults 58.5 % 20.5 %
Gender
Male 57.9 % 18.4 %
Female 58.9 22.5
Location
Metro 60.1 % 21.9 %
Rural 46.9 13.8
Race and ethnicity
Hispanic 43.9 % 13.6 %
White* 63.4 23.8
African American* 42.2 12.1
Other* 51.0 18.2
Age
18-24 57.2 % 21.1 %
25-34 60.9 20.0
35-44 58.0 21.0
45-54 63.9 23.4
55-64 59.1 23.1
65-74 56.5 16.3
75 and over 39.2 11.8
Education
Gradeschool 14.4 % 4.7 %
Some high school 34.0 6.9
High school graduate 39.5 12.5
Some college 57.7 26.9
College graduate 74.8 43.0
Graduateschool 77.4 39.7
Income
Less than $10K 32.3 % 8.2 %
$10K to $20K 41.7 10.3
$20K to $30K 39.2 9.9
$30K to $40K 55.7 16.3
$40K to $50K 50.7 21.2
$50K to $75K 56.0 24.4
$75K to $100K 63.9 30.2
$100K to $150K 73.5 43.3
$150K and over 84.3 38.6
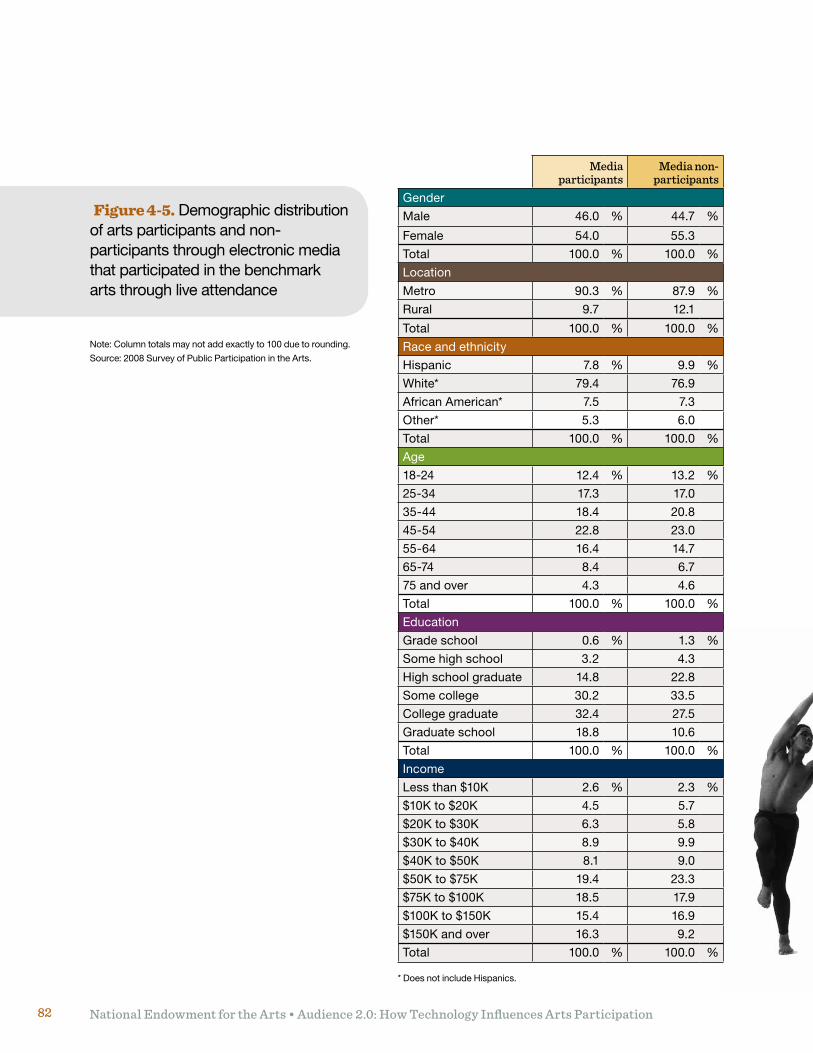
National Endowment for the Arts • Audience 2.0: How Technology Influences Arts Participation82
Figure 4-5. Demographic distribution of arts participants and non-participants through electronic media that participated in the benchmark arts through live attendance
Note: Column totals may not add exactly to 100 due to rounding.
Source: 2008 Survey of Public Participation in the Arts.
Media participants
Media non-participants
Gender
Male 46.0 % 44.7 %
Female 54.0 55.3
Total 100.0 % 100.0 %
Location
Metro 90.3 % 87.9 %
Rural 9.7 12.1
Total 100.0 % 100.0 %
Race and ethnicity
Hispanic 7.8 % 9.9 %
White* 79.4 76.9
African American* 7.5 7.3
Other* 5.3 6.0
Total 100.0 % 100.0 %
Age
18-24 12.4 % 13.2 %
25-34 17.3 17.0
35-44 18.4 20.8
45-54 22.8 23.0
55-64 16.4 14.7
65-74 8.4 6.7
75 and over 4.3 4.6
Total 100.0 % 100.0 %
Education
Gradeschool 0.6 % 1.3 %
Some high school 3.2 4.3
High school graduate 14.8 22.8
Some college 30.2 33.5
College graduate 32.4 27.5
Graduateschool 18.8 10.6
Total 100.0 % 100.0 %
Income
Less than $10K 2.6 % 2.3 %
$10K to $20K 4.5 5.7
$20K to $30K 6.3 5.8
$30K to $40K 8.9 9.9
$40K to $50K 8.1 9.0
$50K to $75K 19.4 23.3
$75K to $100K 18.5 17.9
$100K to $150K 15.4 16.9
$150K and over 16.3 9.2
Total 100.0 % 100.0 %
* Does not include Hispanics.
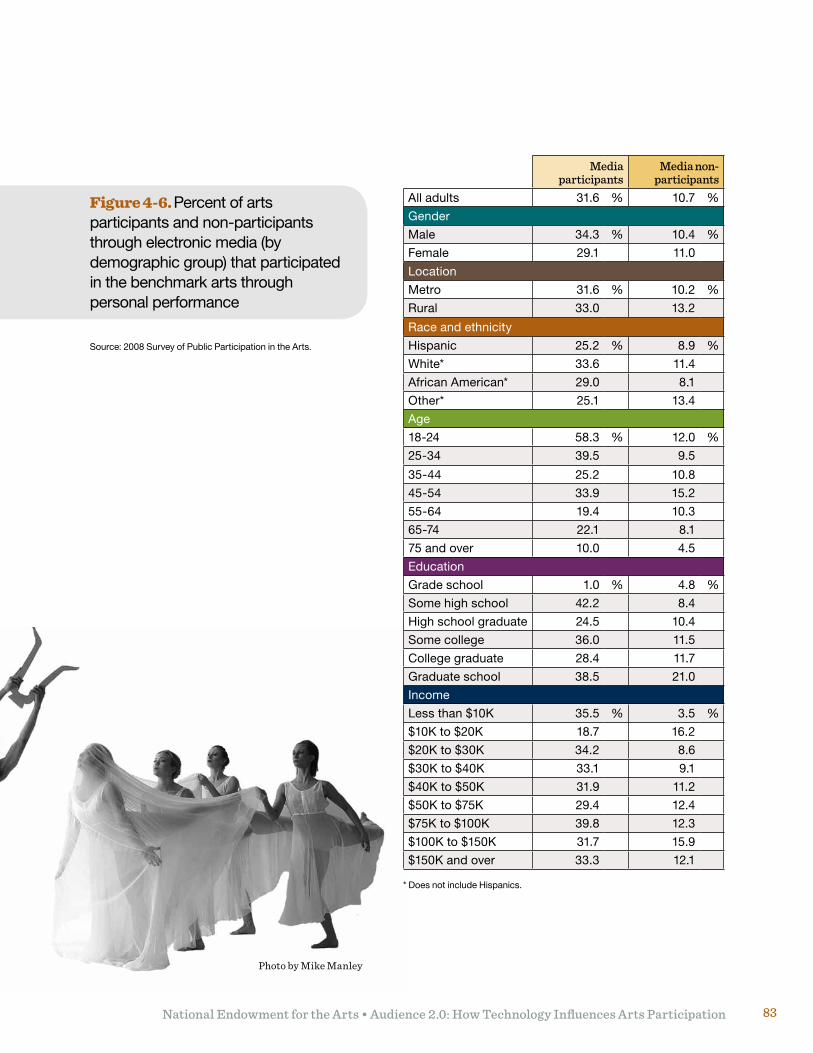
National Endowment for the Arts • Audience 2.0: How Technology Influences Arts Participation 83
Media participants
Media non-participants
All adults 31.6 % 10.7 %
Gender
Male 34.3 % 10.4 %
Female 29.1 11.0
Location
Metro 31.6 % 10.2 %
Rural 33.0 13.2
Race and ethnicity
Hispanic 25.2 % 8.9 %
White* 33.6 11.4
African American* 29.0 8.1
Other* 25.1 13.4
Age
18-24 58.3 % 12.0 %
25-34 39.5 9.5
35-44 25.2 10.8
45-54 33.9 15.2
55-64 19.4 10.3
65-74 22.1 8.1
75 and over 10.0 4.5
Education
Gradeschool 1.0 % 4.8 %
Some high school 42.2 8.4
High school graduate 24.5 10.4
Some college 36.0 11.5
College graduate 28.4 11.7
Graduateschool 38.5 21.0
Income
Less than $10K 35.5 % 3.5 %
$10K to $20K 18.7 16.2
$20K to $30K 34.2 8.6
$30K to $40K 33.1 9.1
$40K to $50K 31.9 11.2
$50K to $75K 29.4 12.4
$75K to $100K 39.8 12.3
$100K to $150K 31.7 15.9
$150K and over 33.3 12.1
Figure 4-6. Percent of arts participants and non-participants through electronic media (by demographic group) that participated in the benchmark arts through personal performance
Source: 2008 Survey of Public Participation in the Arts.
* Does not include Hispanics.
Photo by Mike Manley
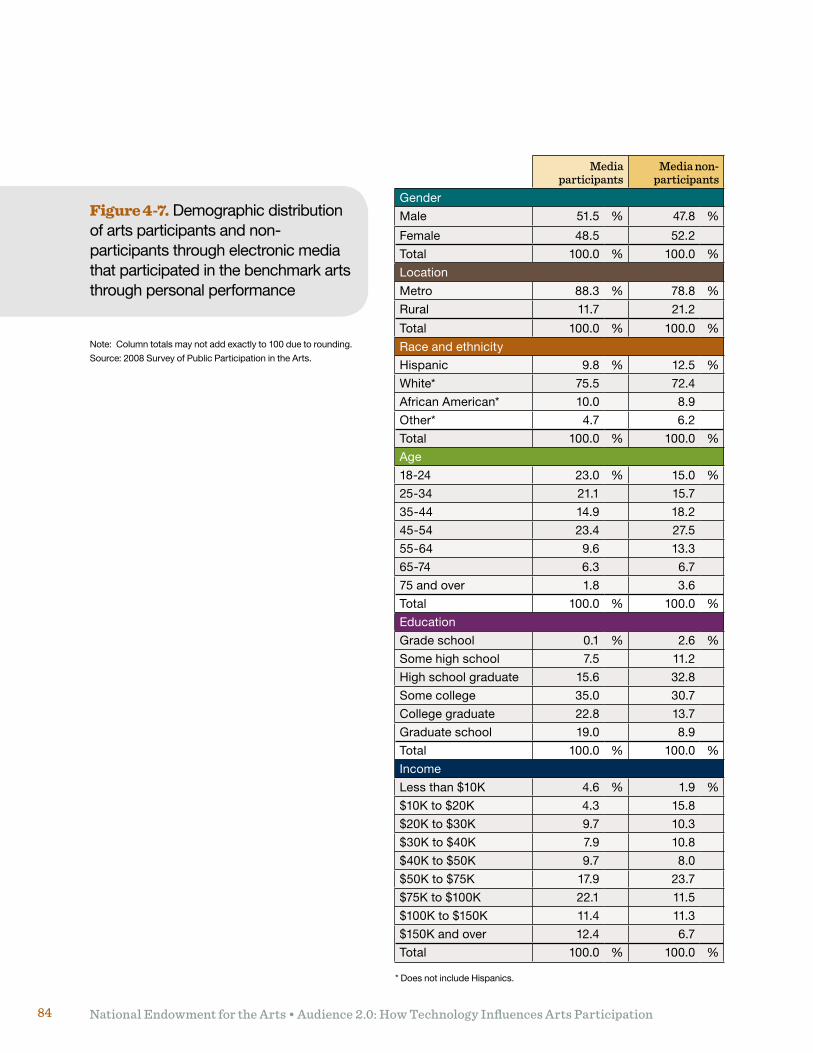
National Endowment for the Arts • Audience 2.0: How Technology Influences Arts Participation84
Media participants
Media non-participants
Gender
Male 51.5 % 47.8 %
Female 48.5 52.2
Total 100.0 % 100.0 %
Location
Metro 88.3 % 78.8 %
Rural 11.7 21.2
Total 100.0 % 100.0 %
Race and ethnicity
Hispanic 9.8 % 12.5 %
White* 75.5 72.4
African American* 10.0 8.9
Other* 4.7 6.2
Total 100.0 % 100.0 %
Age
18-24 23.0 % 15.0 %
25-34 21.1 15.7
35-44 14.9 18.2
45-54 23.4 27.5
55-64 9.6 13.3
65-74 6.3 6.7
75 and over 1.8 3.6
Total 100.0 % 100.0 %
Education
Gradeschool 0.1 % 2.6 %
Some high school 7.5 11.2
High school graduate 15.6 32.8
Some college 35.0 30.7
College graduate 22.8 13.7
Graduateschool 19.0 8.9
Total 100.0 % 100.0 %
Income
Less than $10K 4.6 % 1.9 %
$10K to $20K 4.3 15.8
$20K to $30K 9.7 10.3
$30K to $40K 7.9 10.8
$40K to $50K 9.7 8.0
$50K to $75K 17.9 23.7
$75K to $100K 22.1 11.5
$100K to $150K 11.4 11.3
$150K and over 12.4 6.7
Total 100.0 % 100.0 %
Note: Column totals may not add exactly to 100 due to rounding.
Source: 2008 Survey of Public Participation in the Arts.
Figure 4-7. Demographic distribution of arts participants and non-participants through electronic media that participated in the benchmark arts through personal performance
* Does not include Hispanics.
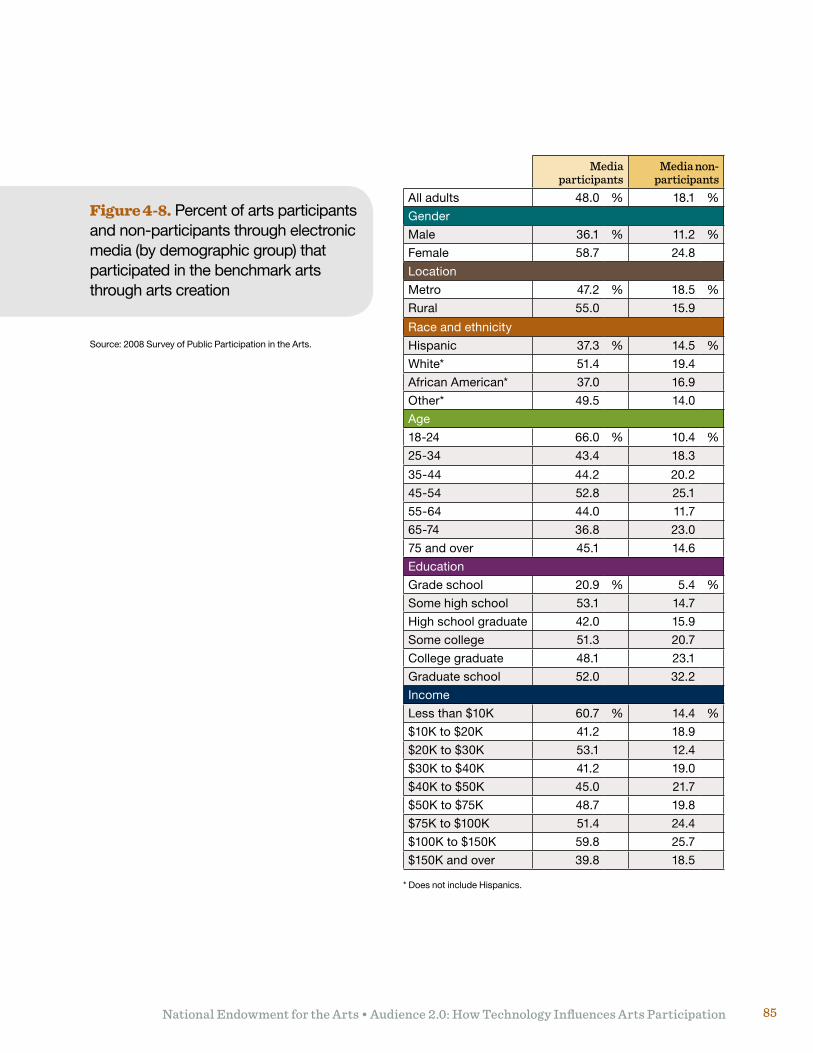
National Endowment for the Arts • Audience 2.0: How Technology Influences Arts Participation 85
Media participants
Media non-participants
All adults 48.0 % 18.1 %
Gender
Male 36.1 % 11.2 %
Female 58.7 24.8
Location
Metro 47.2 % 18.5 %
Rural 55.0 15.9
Race and ethnicity
Hispanic 37.3 % 14.5 %
White* 51.4 19.4
African American* 37.0 16.9
Other* 49.5 14.0
Age
18-24 66.0 % 10.4 %
25-34 43.4 18.3
35-44 44.2 20.2
45-54 52.8 25.1
55-64 44.0 11.7
65-74 36.8 23.0
75 and over 45.1 14.6
Education
Gradeschool 20.9 % 5.4 %
Some high school 53.1 14.7
High school graduate 42.0 15.9
Some college 51.3 20.7
College graduate 48.1 23.1
Graduateschool 52.0 32.2
Income
Less than $10K 60.7 % 14.4 %
$10K to $20K 41.2 18.9
$20K to $30K 53.1 12.4
$30K to $40K 41.2 19.0
$40K to $50K 45.0 21.7
$50K to $75K 48.7 19.8
$75K to $100K 51.4 24.4
$100K to $150K 59.8 25.7
$150K and over 39.8 18.5
Figure 4-8. Percent of arts participants and non-participants through electronic media (by demographic group) that participated in the benchmark arts through arts creation
Source: 2008 Survey of Public Participation in the Arts.
* Does not include Hispanics.
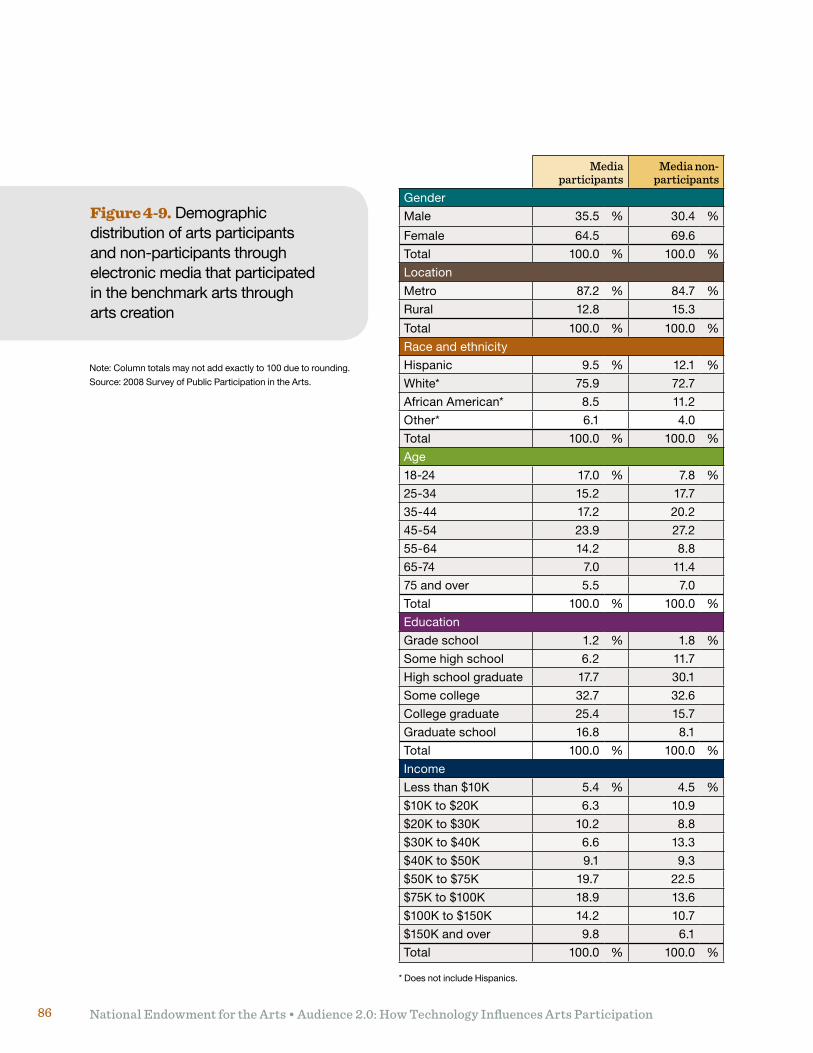
National Endowment for the Arts • Audience 2.0: How Technology Influences Arts Participation86
Note: Column totals may not add exactly to 100 due to rounding.
Source: 2008 Survey of Public Participation in the Arts.
Media participants
Media non-participants
Gender
Male 35.5 % 30.4 %
Female 64.5 69.6
Total 100.0 % 100.0 %
Location
Metro 87.2 % 84.7 %
Rural 12.8 15.3
Total 100.0 % 100.0 %
Race and ethnicity
Hispanic 9.5 % 12.1 %
White* 75.9 72.7
African American* 8.5 11.2
Other* 6.1 4.0
Total 100.0 % 100.0 %
Age
18-24 17.0 % 7.8 %
25-34 15.2 17.7
35-44 17.2 20.2
45-54 23.9 27.2
55-64 14.2 8.8
65-74 7.0 11.4
75 and over 5.5 7.0
Total 100.0 % 100.0 %
Education
Gradeschool 1.2 % 1.8 %
Some high school 6.2 11.7
High school graduate 17.7 30.1
Some college 32.7 32.6
College graduate 25.4 15.7
Graduateschool 16.8 8.1
Total 100.0 % 100.0 %
Income
Less than $10K 5.4 % 4.5 %
$10K to $20K 6.3 10.9
$20K to $30K 10.2 8.8
$30K to $40K 6.6 13.3
$40K to $50K 9.1 9.3
$50K to $75K 19.7 22.5
$75K to $100K 18.9 13.6
$100K to $150K 14.2 10.7
$150K and over 9.8 6.1
Total 100.0 % 100.0 %
Figure 4-9. Demographic distribution of arts participants and non-participants through electronic media that participated in the benchmark arts through arts creation
* Does not include Hispanics.
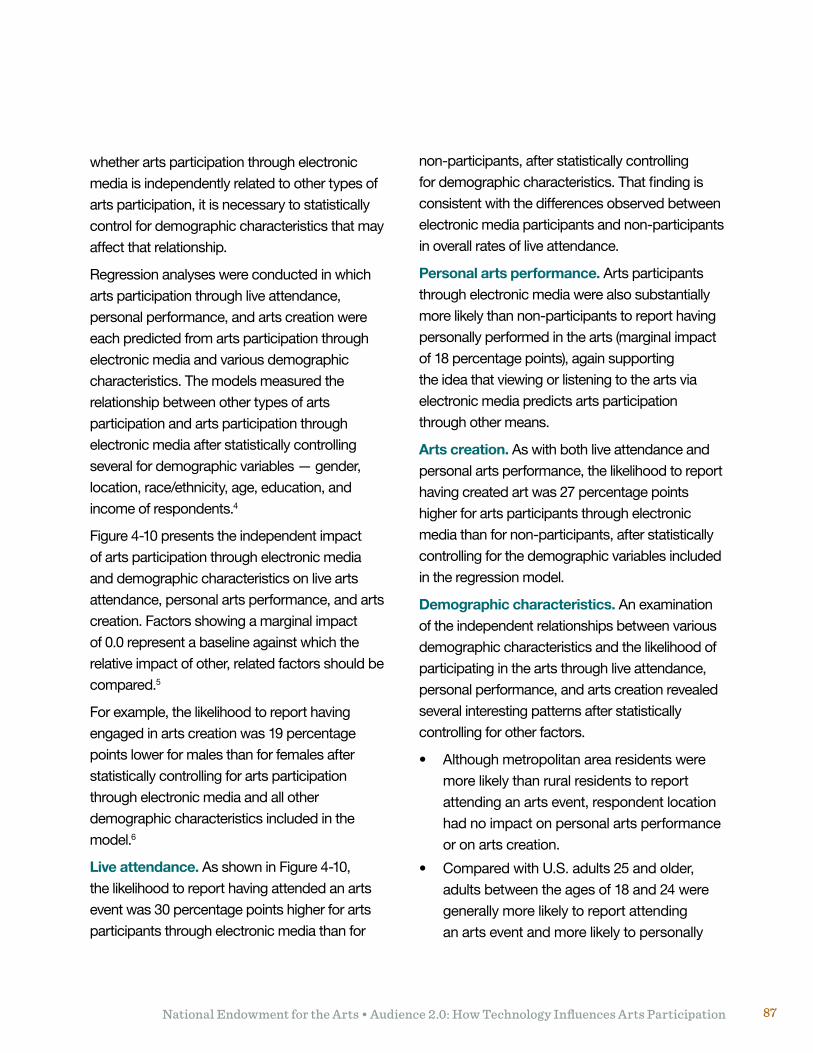
National Endowment for the Arts • Audience 2.0: How Technology Influences Arts Participation 87
whether arts participation through electronic media is independently related to other types of arts participation, it is necessary to statistically control for demographic characteristics that may affect that relationship.
Regression analyses were conducted in which arts participation through live attendance, personal performance, and arts creation were each predicted from arts participation through electronic media and various demographic characteristics. The models measured the relationship between other types of arts participation and arts participation through electronic media after statistically controlling several for demographic variables — gender, location,race/ethnicity,age,education,andincome of respondents.4
Figure 4-10 presents the independent impact of arts participation through electronic media and demographic characteristics on live arts attendance, personal arts performance, and arts creation. Factors showing a marginal impact of 0.0 represent a baseline against which the relative impact of other, related factors should be compared.5
For example, the likelihood to report having engaged in arts creation was 19 percentage points lower for males than for females after statistically controlling for arts participation through electronic media and all other demographic characteristics included in the model.6
Live attendance. As shown in Figure 4-10, the likelihood to report having attended an arts event was 30 percentage points higher for arts participants through electronic media than for
non-participants, after statistically controlling for demographic characteristics. That finding is consistent with the differences observed between electronic media participants and non-participants in overall rates of live attendance.
Personal arts performance. Arts participants through electronic media were also substantially more likely than non-participants to report having personally performed in the arts (marginal impact of 18 percentage points), again supporting the idea that viewing or listening to the arts via electronic media predicts arts participation through other means.
Arts creation. As with both live attendance and personal arts performance, the likelihood to report having created art was 27 percentage points higher for arts participants through electronic media than for non-participants, after statistically controlling for the demographic variables included in the regression model.
Demographic characteristics. An examination of the independent relationships between various demographic characteristics and the likelihood of participating in the arts through live attendance, personal performance, and arts creation revealed several interesting patterns after statistically controlling for other factors.
• Althoughmetropolitanarearesidentsweremore likely than rural residents to report attending an arts event, respondent location had no impact on personal arts performance or on arts creation.
• ComparedwithU.S.adults25andolder,adults between the ages of 18 and 24 were generally more likely to report attending an arts event and more likely to personally
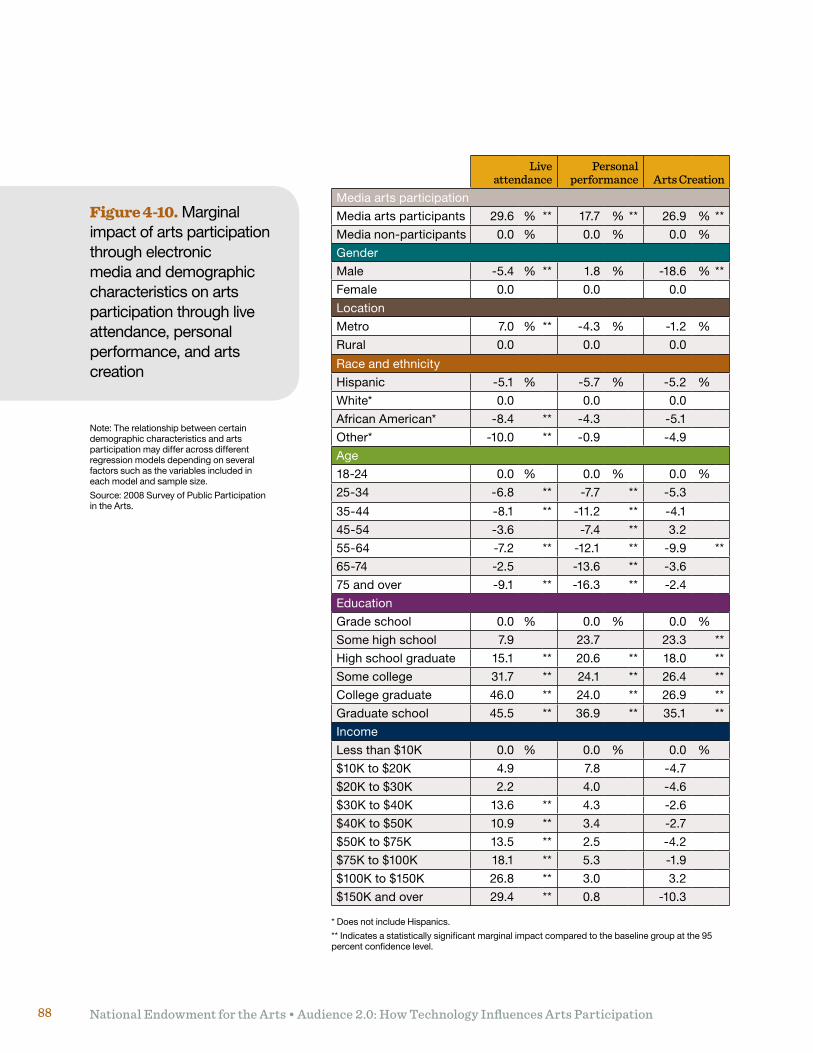
National Endowment for the Arts • Audience 2.0: How Technology Influences Arts Participation88
Note: The relationship between certain demographic characteristics and arts participation may differ across different regression models depending on several factors such as the variables included in each model and sample size.
Source: 2008 Survey of Public Participation in the Arts.
Figure 4-10. Marginal impact of arts participation through electronic media and demographic characteristics on arts participation through live attendance, personal performance, and arts creation
Live attendance
Personal performance Arts Creation
Media arts participation
Media arts participants 29.6 % ** 17.7 % ** 26.9 % **
Media non-participants 0.0 % 0.0 % 0.0 %
Gender
Male -5.4 % ** 1.8 % -18.6 % **
Female 0.0 0.0 0.0
Location
Metro 7.0 % ** -4.3 % -1.2 %
Rural 0.0 0.0 0.0
Race and ethnicity
Hispanic -5.1 % -5.7 % -5.2 %
White* 0.0 0.0 0.0
African American* -8.4 ** -4.3 -5.1
Other* -10.0 ** -0.9 -4.9
Age
18-24 0.0 % 0.0 % 0.0 %
25-34 -6.8 ** -7.7 ** -5.3
35-44 -8.1 ** -11.2 ** -4.1
45-54 -3.6 -7.4 ** 3.2
55-64 -7.2 ** -12.1 ** -9.9 **
65-74 -2.5 -13.6 ** -3.6
75 and over -9.1 ** -16.3 ** -2.4
Education
Gradeschool 0.0 % 0.0 % 0.0 %
Some high school 7.9 23.7 23.3 **
High school graduate 15.1 ** 20.6 ** 18.0 **
Some college 31.7 ** 24.1 ** 26.4 **
College graduate 46.0 ** 24.0 ** 26.9 **
Graduateschool 45.5 ** 36.9 ** 35.1 **
Income
Less than $10K 0.0 % 0.0 % 0.0 %
$10K to $20K 4.9 7.8 -4.7
$20K to $30K 2.2 4.0 -4.6
$30K to $40K 13.6 ** 4.3 -2.6
$40K to $50K 10.9 ** 3.4 -2.7
$50K to $75K 13.5 ** 2.5 -4.2
$75K to $100K 18.1 ** 5.3 -1.9
$100K to $150K 26.8 ** 3.0 3.2
$150K and over 29.4 ** 0.8 -10.3
* Does not include Hispanics.
** Indicates a statistically significant marginal impact compared to the baseline group at the 95 percent confidence level.
National Endowment for the Arts • Audience 2.0: How Technology Influences Arts Participation 89
perform in the arts, after statistically controlling for arts participation through electronic media and other demographic characteristics.
• Therewerenoindependentrelationshipsbetween income and personal arts performance or between income and arts creation.
Arts Participation through Electronic Media and the Frequency and Breadth of Live Arts AttendanceThe 2008 SPPA included questions not only about the specific art forms in which respondents participated, but also about how often respondents engaged in such activities through live attendance. Due to the importance of live attendance as a way to participate in the arts, it is useful to examine whether arts participation through electronic media predicts the frequency and breadth of live arts attendance.
Because arts participants through electronic media are more likely than non-participants to report having attended an arts event (e.g., see Figure 4-4), the following analyses were limited to only those respondents who reported that they had attended at least one benchmark arts event.
Differences between arts participants through electronic media and non-participants in the frequency and breadth of live arts attendance. As a first step in examining the relationship between arts participation through electronic media and the frequency and breadth of live arts attendance, differences between arts participants through
electronic media and non-participants in those measures were examined among respondents who reported attending at least one arts event.
Mean frequency and breadth of live attendance. For arts participants through electronic media and non-participants who attended at least one arts event, Figure 4-11 presents:
• Meannumberoftimesthateachgroupreported attending a benchmark activity (frequency); and
• Meannumberofartformsinwhicheachgroup reported doing so (breadth).
Compared to non-participants, electronic media participants reported attending arts events more frequently (5.8 versus 3.1) and for a larger number of benchmark art forms (2.3 versus 1.5).
Demographic characteristics. Figure 4-12 presents mean frequency and breadth of live arts attendance by demographic group for arts participants through electronic media and non-participants who reported attending at least one benchmark arts event.
• Non-Hispanicwhiteadultsshowedahighermean frequency of live arts attendance than otherracial/ethnicgroups,regardlessofmedia participation.
• Onaverage,artsparticipantsthroughelectronic media who attended graduate school reported attending benchmark arts events approximately eight times during the 12-month period ending in May 2008, higher than any other group.
• Metropolitanarearesidentsdidnotdifferfrom rural residents in frequency or breadth of live arts attendance, regardless of electronic media participation.
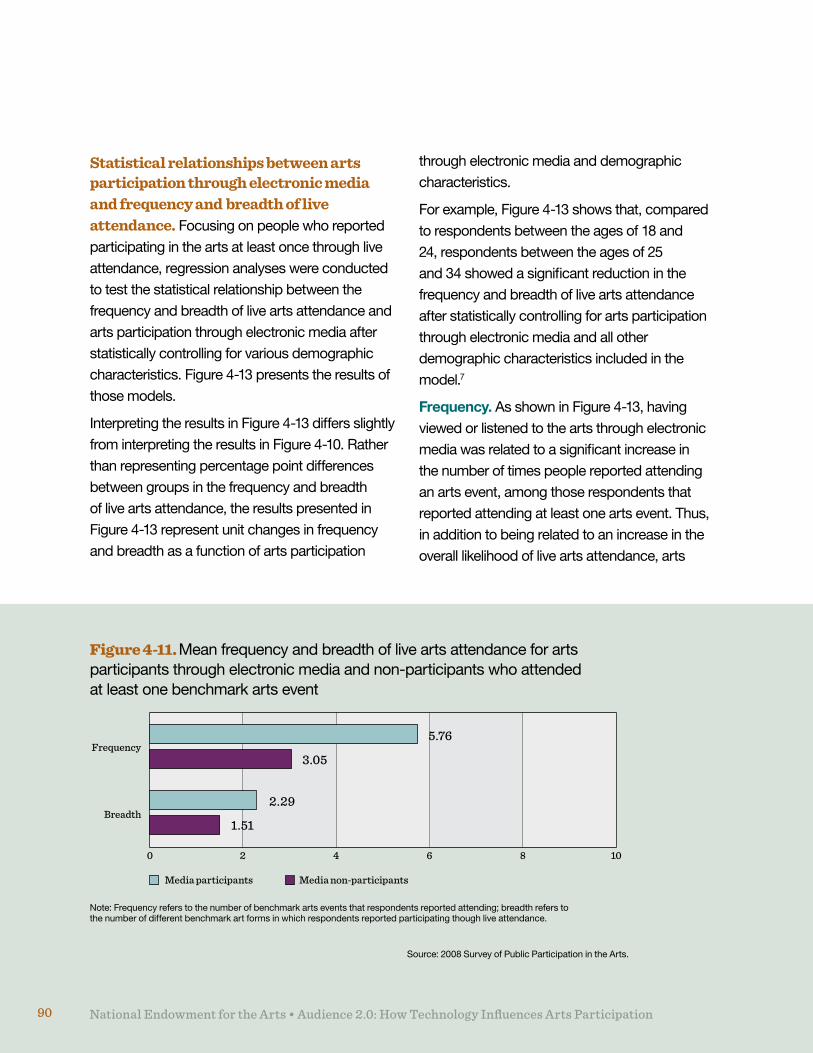
National Endowment for the Arts • Audience 2.0: How Technology Influences Arts Participation90 National Endowment for the Arts • Audience 2.0: How Technology Influences Arts Participation90
Statistical relationships between arts participation through electronic media and frequency and breadth of live attendance. Focusing on people who reported participating in the arts at least once through live attendance, regression analyses were conducted to test the statistical relationship between the frequency and breadth of live arts attendance and arts participation through electronic media after statistically controlling for various demographic characteristics. Figure 4-13 presents the results of those models.
Interpreting the results in Figure 4-13 differs slightly from interpreting the results in Figure 4-10. Rather than representing percentage point differences between groups in the frequency and breadth of live arts attendance, the results presented in Figure 4-13 represent unit changes in frequency and breadth as a function of arts participation
through electronic media and demographic characteristics.
For example, Figure 4-13 shows that, compared to respondents between the ages of 18 and 24, respondents between the ages of 25 and 34 showed a significant reduction in the frequency and breadth of live arts attendance after statistically controlling for arts participation through electronic media and all other demographic characteristics included in the model.7
Frequency. As shown in Figure 4-13, having viewed or listened to the arts through electronic media was related to a significant increase in the number of times people reported attending an arts event, among those respondents that reported attending at least one arts event. Thus, in addition to being related to an increase in the overall likelihood of live arts attendance, arts
Frequency
Breadth
Media participants Media non-participants
0 2 4 6 8 10
Figure 4-11. Mean frequency and breadth of live arts attendance for arts participants through electronic media and non-participants who attended at least one benchmark arts event
Note: Frequency refers to the number of benchmark arts events that respondents reported attending; breadth refers to the number of different benchmark art forms in which respondents reported participating though live attendance.
Source: 2008 Survey of Public Participation in the Arts.
5.76
3.05
2.29
1.51
National Endowment for the Arts • Audience 2.0: How Technology Influences Arts Participation 91
participation through electronic media is related to an increase in the frequency of arts attendance.
Breadth. As with frequency, having viewed or listened to the arts through electronic media was related to a significant increase in the number of different benchmark art forms in which people reported participating through live attendance. This finding suggests that participating in the arts through electronic media predicts live attendance in a broader range of arts activities.
Demographic characteristics. After statistically controlling for other factors, very few demographic characteristics were independently related to the frequency and breadth of live arts attendance when only considering those respondents who attended at least one benchmark arts event.
• Beingmalewasrelatedtoparticipationinalarger number of arts activities.
• Comparedtohavingonlyagradeschooleducation, having graduated college (or having a graduate school education) was related to a higher number of arts attendances in a larger number of arts activities.
• Adultsbetweentheagesof25and34attended fewer arts events overall and did not participate in as many art forms as adults between the ages of 18 and 24. Similarly, when controlling for other demographic traits, adults between the ages of 35 and 44 did not participate in as many arts events as adults between the ages of 18 and 24.
• Therewerenoindependentrelationshipsbetween the frequency and breadth of live attendanceandrespondentlocation,race/ethnicity, or income.
Summary and ImplicationsChapter 4 provides information about the relationship between arts participation through media and arts participation through live arts attendance, personal arts performance, and arts creation.
Arts participation through media and other means. A wealth of previous research indicates that participating in the arts through electronic media is correlated with live arts attendance. Findings from the monograph are consistent with that result and show that, in addition to being related to live arts attendance, arts media participation is strongly related to personal arts performance and arts creation.
• Adultswhoreportedviewingorlisteningtothe arts through electronic media showed higher rates of live arts attendance, personal performance, and arts creation than adults who reported not having done so.
• Statisticalmodelsshowedthatartsparticipation through media predicts live attendance, personal arts performance, and arts creation, even after statistically controlling for various demographic characteristics.
Arts participation and the frequency and breadth of live arts attendance. Deeper examinations of arts participation through electronic media showed that participating in the arts through media also predicts the frequency and breadth of live arts attendance when considering respondents who reported attending at least one benchmark arts event.
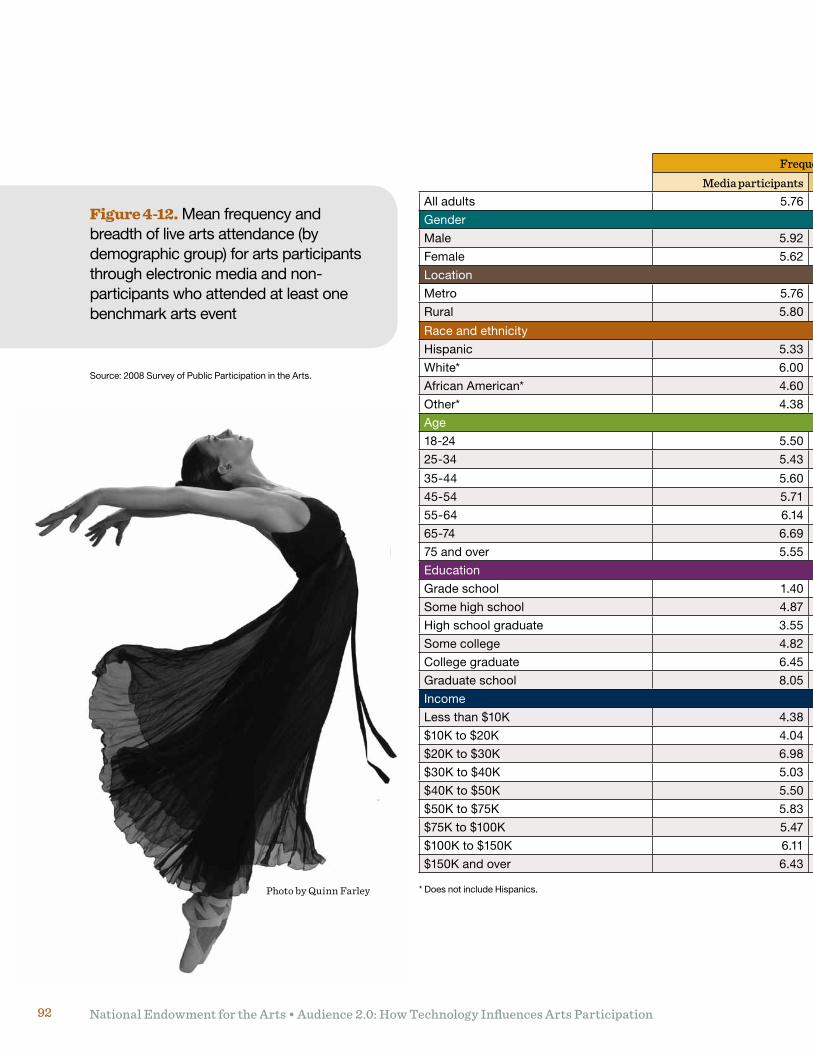
National Endowment for the Arts • Audience 2.0: How Technology Influences Arts Participation92
Frequency Breadth
Media participants Media non-participants Media participants Media non-participantsAll adults 5.76 3.05 2.29 1.51
Gender
Male 5.92 3.02 2.22 1.44
Female 5.62 3.08 2.34 1.58
Location
Metro 5.76 3.06 2.30 1.51
Rural 5.80 3.04 2.18 1.52
Race and ethnicity
Hispanic 5.33 2.00 1.92 1.26
White* 6.00 3.27 2.36 1.56
African American* 4.60 2.62 2.06 1.58
Other* 4.38 2.46 1.97 1.29
Age
18-24 5.50 2.96 2.32 1.47
25-34 5.43 2.83 2.09 1.41
35-44 5.60 2.33 2.34 1.43
45-54 5.71 3.37 2.29 1.58
55-64 6.14 4.12 2.33 1.72
65-74 6.69 2.15 2.45 1.44
75 and over 5.55 3.73 2.24 1.53
Education
Gradeschool 1.40 2.58 1.40 1.33
Some high school 4.87 2.37 1.89 1.37
High school graduate 3.55 2.36 1.73 1.44
Some college 4.82 2.79 2.07 1.36
College graduate 6.45 3.17 2.48 1.52
Graduateschool 8.05 5.46 2.83 2.22
Income
Less than $10K 4.38 2.41 2.17 1.07
$10K to $20K 4.04 1.86 1.84 1.24
$20K to $30K 6.98 2.86 2.10 1.47
$30K to $40K 5.03 2.76 2.00 1.48
$40K to $50K 5.50 4.10 2.27 1.57
$50K to $75K 5.83 2.61 2.23 1.46
$75K to $100K 5.47 3.12 2.22 1.56
$100K to $150K 6.11 3.05 2.45 1.53
$150K and over 6.43 4.14 2.67 1.88
Figure 4-12. Mean frequency and breadth of live arts attendance (by demographic group) for arts participants through electronic media and non-participants who attended at least one benchmark arts event
Source: 2008 Survey of Public Participation in the Arts.
* Does not include Hispanics.Photo by Quinn Farley
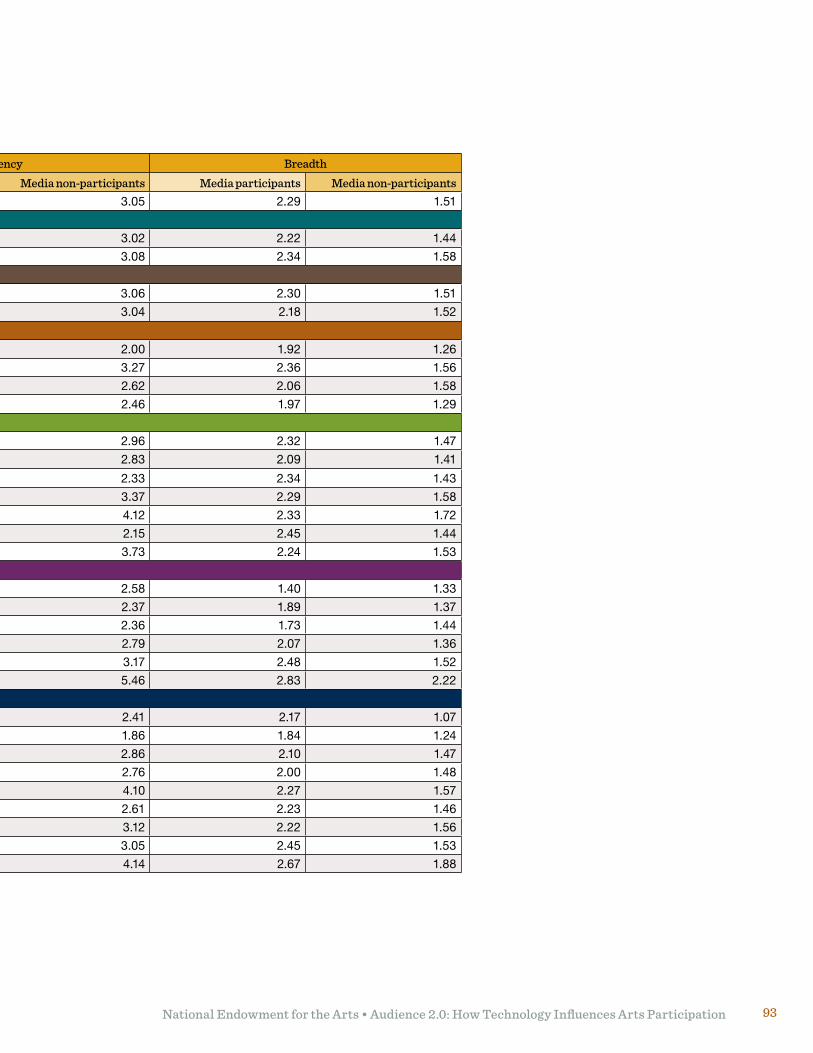
National Endowment for the Arts • Audience 2.0: How Technology Influences Arts Participation 93
Frequency Breadth
Media participants Media non-participants Media participants Media non-participantsAll adults 5.76 3.05 2.29 1.51
Gender
Male 5.92 3.02 2.22 1.44
Female 5.62 3.08 2.34 1.58
Location
Metro 5.76 3.06 2.30 1.51
Rural 5.80 3.04 2.18 1.52
Race and ethnicity
Hispanic 5.33 2.00 1.92 1.26
White* 6.00 3.27 2.36 1.56
African American* 4.60 2.62 2.06 1.58
Other* 4.38 2.46 1.97 1.29
Age
18-24 5.50 2.96 2.32 1.47
25-34 5.43 2.83 2.09 1.41
35-44 5.60 2.33 2.34 1.43
45-54 5.71 3.37 2.29 1.58
55-64 6.14 4.12 2.33 1.72
65-74 6.69 2.15 2.45 1.44
75 and over 5.55 3.73 2.24 1.53
Education
Gradeschool 1.40 2.58 1.40 1.33
Some high school 4.87 2.37 1.89 1.37
High school graduate 3.55 2.36 1.73 1.44
Some college 4.82 2.79 2.07 1.36
College graduate 6.45 3.17 2.48 1.52
Graduateschool 8.05 5.46 2.83 2.22
Income
Less than $10K 4.38 2.41 2.17 1.07
$10K to $20K 4.04 1.86 1.84 1.24
$20K to $30K 6.98 2.86 2.10 1.47
$30K to $40K 5.03 2.76 2.00 1.48
$40K to $50K 5.50 4.10 2.27 1.57
$50K to $75K 5.83 2.61 2.23 1.46
$75K to $100K 5.47 3.12 2.22 1.56
$100K to $150K 6.11 3.05 2.45 1.53
$150K and over 6.43 4.14 2.67 1.88

National Endowment for the Arts • Audience 2.0: How Technology Influences Arts Participation94
Frequency BreadthMedia arts participation
Media arts participants 0.49 ** 0.30 **
Media non-participants 0.00 0.00
Gender
Male -0.03 -0.07 **
Female 0.00 0.00
Location
Metro 0.04 0.03
Rural 0.00 0.00
Race and ethnicity
Hispanic -0.13 -0.10 **
White* 0.00 0.00
African American* -0.09 0.01
Other* -0.18 -0.12
Age
18-24 0.00 0.00
25-34 -0.24 ** -0.16 **
35-44 -0.23 ** -0.10
45-54 -0.15 -0.09
55-64 0.01 -0.06
65-74 -0.06 -0.01
75 and over -0.02 -0.04
Education
Gradeschool 0.00 0.00
Some high school 0.26 0.08
High school graduate 0.18 0.06
Some college 0.34 0.12
College graduate 0.59 ** 0.28 **
Graduateschool 0.86 ** 0.43 **
Income
Less than $10K 0.00 0.00
$10K to $20K -0.12 -0.07
$20K to $30K 0.20 0.04
$30K to $40K 0.04 0.01
$40K to $50K 0.16 0.10
$50K to $75K 0.01 0.01
$75K to $100K -0.01 0.01
$100K to $150K 0.02 0.03
$150K and over 0.17 0.16
Note:Regressioncoefficientsreflectlogarithmicallytransformeddata.
Source: 2008 Survey of Public Participation in the Arts.
Figure 4-13. Results of statistical models that predicted the frequency and breadth of live arts attendance from arts participation through electronic media and from demographic characteristics
* Does not include Hispanics.
** Indicates a statistically significant regression coefficient compared to the baseline group at the 95 percent confidence level.
National Endowment for the Arts • Audience 2.0: How Technology Influences Arts Participation 95
• Artsmediaparticipantsreportedattendingarts events more frequently than non-participants and reported attending a larger number of art forms.
• Statisticalmodelsindicatedthatartsparticipation through electronic media was related to increases in both the frequency and breadth of live arts attendance after statistically controlling for various demographic characteristics.
Implications. The relationships observed between arts participation through electronic media and arts participation through other means have several implications for the current understanding of arts engagement and for developing future research.
• Thereareclearrelationshipsbetweenparticipating in the arts through electronic media and participating in the arts through attendance, performance, and creation. Those results indicate that encouraging arts participation through electronic media may lead to greater interest in the arts overall.
• Despitedramaticimprovementsinelectronic media during the past decade, arts participation through electronic media does not appear to be “replacing” arts participation through other means — at least not based on data from the 2008 SPPA. Higher rates of arts participation through electronic media are not related to less arts participation through attendance,
performance, or creation. Although no evidence of replacement was found in this analysis, it is possible that future analyses of arts participation across time could show that as the rate of arts participation through electronic media increase, rates of arts participation through other means decrease.8
• ThefindingspresentedinChapter4areallcorrelative in nature, making it difficult to draw firm conclusions about whether:
• Artsparticipationthroughelectronicmedia directly leads to arts participation through attendance, performance and creation;
• Participationintheartsthroughattendance, performance and creation directly leads to arts participation through electronic media;
• Artsparticipationthroughelectronicmedia and arts participation through attendance, performance and creation reinforce one another; or
• Othercausalfactorsareinvolvedthathelp explain those relationships.
An area for future inquiry would be to examine the causal direction of the relationship between arts participation through electronic media and arts participation through other means, perhaps through quasi-experimental or experimental research.
National Endowment for the Arts • Audience 2.0: How Technology Influences Arts Participation96
Notes1 “Replace” in this context is used to mean a quantitative
replacement — that is, as people participate more in the arts through electronic media, do they participate less through live attendance, personal performance, and arts creation? This question says nothing about the qualitative differences that exist between arts participation through electronic media and through other means.
2 The demographic rates and distribution shown for arts participants through electronic media in Figures 4-1 and 4-2 are identical to those shown in the second column of Figure 3-4 and the third column of 3-5, respectively.
3 Unless otherwise noted, differences discussed in the text of Chapter 4 are statistically significant.
4 Models testing the relationship between preferences for an art form and participating in the art form via media showed a statistically significant relationship between preference for the art form and participation via electronic media. Those data were not included in the benchmark model because preference data were only available for musical art forms. For model specifications, see Appendix C.
5 A factor with a “marginal impact of 0.0” is the point of comparison for other related groups. It does not indicate that the factor has no impact on the arts participation measure.
6 The 2008 SPPA also included a question about whether participants used the Internet to create or post their own art online. Responses to that question were included as an additional predictor in an alternative regression model. Although arts creation via the Internet was related to “traditional” arts creation, it had little effect on the independent relationships between other variables — including arts participation through electronic media — and “traditional” arts creation.
7 To meet the assumptions of linear regression with a continuous dependent variable, data on frequency and breadth of live arts attendance were transformed using a natural logarithmic transformation before being entered into the models. Thus, the results shown in Figure 4-13 show regression coefficients based on the transformed data. Consequently, although it is accurate to conclude that being between the ages of 25 and 34 significantly reduces the frequency and breadth of live arts attendance, it is not accurate to conclude that it does so by 0.24 attendances or by 0.16 art forms, respectively. For example, the model predicts that the natural logarithm of the frequency of live arts attendance would decrease by 0.24 if an individual is between the ages of 25 and 34 (compared with individuals between the ages of 18 and 24), holding all other demographic characteristics constant. For model specifications, see Appendix C.
8 As discussed in Chapter 2 and later in Appendix A, the questions related to arts participation through media in the 2008 SPPA were incomparable to previous SPPAs, making this analysis impossible using SPPA data.

National Endowment for the Arts • Audience 2.0: How Technology Influences Arts Participation 97
Photo by Michael G. Stewart, courtesy of the National Council for the Traditional Arts
KQED is the public television and radio stations for northern California and provides programming on
the arts as well as science, education, and community events. To reach more people, they also use the Internet, providing audio and video clips from their programming
on their website, YouTube, and iTunes U. The above clip is from a program on the Klein International String Competition in San Francsico, California.
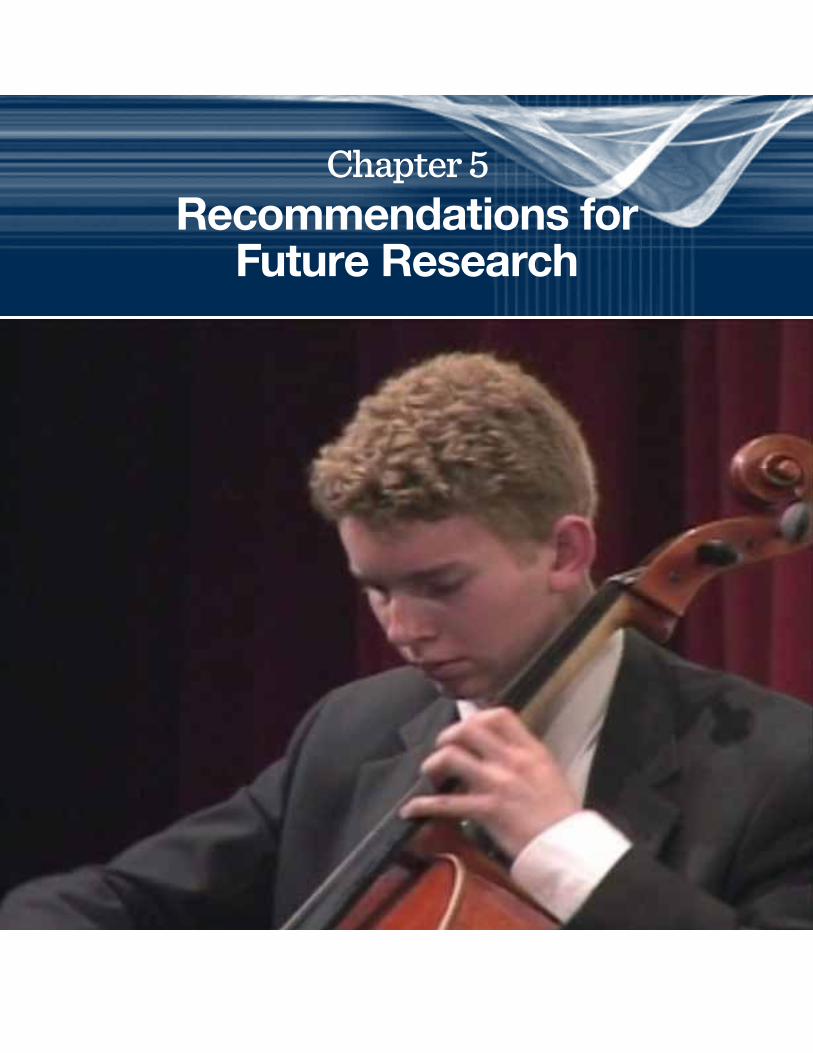
Chapter 5Recommendations for
Future Research

National Endowment for the Arts • Audience 2.0: How Technology Influences Arts Participation100
The research presented in this monograph relied primarily on data from the 2008 Survey of Public Participation in the Arts (SPPA) to examine arts participation through electronic and digital media. Several key findings emerged.
• Artsparticipationthroughelectronicmediais strongly related to arts participation through live attendance, personal arts performance, and arts creation — increases in arts participation through electronic media correspond to increases in attendance, performance, and creation.
• Educationisthebestpredictorofartsparticipation through electronic media — just as it is for live attendance.
• U.S.adultsaremorelikelytouseelectronicmedia to view or listen to the arts than to attend a live arts event — a finding that is consistent with those of prior SPPAs.
• Adultswhoparticipateintheartsexclusivelythrough electronic media are more similar demographically to adults who do not participate in the arts than to adults who attend arts events. They are more likely to be rural residents with relatively low levels of education and income.
In light of those findings, Chapter 5 presents recommendations for future research on arts participation through electronic media, including potential changes to the SPPA and suggestions for alternative research methods that could help address new research questions.1
Future Research on Arts Participation via Electronic MediaSeveral broad areas for future research exist, based on findings from previous research and those presented in this monograph.2
Does arts participation through electronic media directly lead to arts participation through other means? Findings from the monograph show a strong relationship between participating in the arts via electronic media and participating in the arts via other means such as live attendance, personal arts performance, and arts creation. Determining the causal nature of those relationships requires more research.
Although arts participation through electronic media may generate a broader interest in the arts and thus cause increases in other types of arts participation, it is also possible that other types of arts participation instead cause arts participation through electronic media. Or, some other variable may also be involved (e.g., preferences for a particular art form). Future studies could further explore the causal direction of those relationships, perhaps through experimental manipulation.
Does arts participation through electronic media “replace” live attendance? The 2008 SPPA demonstrates that arts participants through electronic media are more likely than non-participants to attend arts events, suggesting
National Endowment for the Arts • Audience 2.0: How Technology Influences Arts Participation 101
that using electronic media to view or listen to the arts does not “replace” live arts attendance. More likely, arts participation through electronic media increases live arts attendance.
Further evidence for that conclusion could come from examining chronological trends in the relationship between arts participation through electronic media and live attendance. For example, as electronic media improved and became more available over the past 30 years, did arts participation via electronic media increase or decrease and did those changes correspond with an increase or decrease in live attendance?
Findings presented in Appendix A indicate that arts participation through electronic media decreased substantially between 1982 and 2002, but there was little change in live attendance rates. Across time, changes in overall rates of arts participation through electronic media may have little or no relationship to changes in overall rates of live attendance. Considering substantial changes in the availability and use of electronic media during the 2000s (including the emergence of Internet-based arts activities and portable media devices), it would be valuable to complete a similar analysis that includes more recent information.3
Is the gap between arts participation through electronic media and live attendance becoming smaller? Related to the previous question, more adults participated in the arts through electronic media than through live attendance, according to the 1982, 1992 and 2002 SPPAs. However, the difference between arts participation via electronic media and attendance was much smaller in 2002 than in either 1992
or 1982, driven primarily by decreases in arts participation through electronic media. Why did rates of arts participation through electronic media appear to decrease between 1982 and 2002? Did the difference between arts participation through electronic media and live attendance continue to decrease through the late 2000s and, if so, why?
Do arts preferences explain the relationship between arts participation through electronic media and live attendance? Preferences for particular art forms may partially explain the relationship observed between arts participation through electronic media and live attendance. Based on data from the 2008 SPPA, statistical models were designed to predict attendance for certain individual arts activities from the following factors:
• Electronicmediaparticipationinthoseartsactivities;
• Respondents’musicalpreferencesforthoseart forms; and
• Variousdemographiccharacteristics.
Results indicated that musical preferences and preferences for particular art forms were related to an increase in live attendance for those art forms.4 But even after controlling for musical preferences and demographic variables, participation through electronic media was still found to be strongly related to live attendance.
The 2008 SPPA examined preferences only for particular types of music — which, for arts activities considered in this monograph, were limited to jazz, classical music, opera, musical plays, and Latin music. Future research could examine overall preferences (not just music preferences) for a broader range of arts activities.
National Endowment for the Arts • Audience 2.0: How Technology Influences Arts Participation102
Does media accessibility affect arts participation through electronic media? Lack of access — rather than interest — may partially explain lower rates of arts participation through electronic media among certain demographic groups. Findings from Chapter 3 suggest that adults who have access to the Internet are substantially more likely than those without Internet access to participate in the arts through any form of electronic media.
Comparing rates of arts participation via electronic media between people who have access to various forms of electronic media (e.g., cable or satellite television and broadband Internet) to those who do not have such access would help researchers better understand the degree to which accessibility affects participation.
Methods to Address Future Research QuestionsMany of the recommendations for future research on arts participation through electronic media may require changes to the SPPA or would require researchers to use different research methods altogether.
Changes to the SPPA. Future research on arts participation through electronic media may benefit from changes to current SPPA questions and how they are asked. Any changes to the survey would have to account for such factors as survey length and comparability to prior SPPA questions.
Content changes. Including additional survey questions about how adults use electronic media to view or listen to various art forms could help researchers better understand how electronic media use affects arts participation overall.
Measure of when respondents began participating in the arts through electronic media and attendance. New questions that assess when respondents began participating in arts activities via electronic media and attendance could help determine whether one type of arts participation typically precedes the other. For example, after asking whether respondents attended a jazz performance in the past 12 months, future SPPAs could also ask:
At what age did you first attend a live jazz performance?
Similar questions could also be asked for jazz participation through various forms of electronic media (e.g., television, radio and the Internet).
That information could help researchers further determine the causal nature of the relationship between arts participation via electronic media and live attendance. A necessary — but not sufficient — condition of causality is for one event to precede another. Finding that arts participation through electronic media typically precedes attendance would further suggest that using electronic media to participate in the arts leads to arts participation through other means.
Ask questions about electronic media accessibility. Arts participation through electronic media likely varies depending on the types of media to which people have access. Future SPPAs could ask respondents to indicate whether they have regular access to various forms of electronic media, including:
• Networkandexpandedcable/satellitetelevision;
• AM/FMandsatelliteradio;
• Portableelectronicdevices;and
• Dial-upandbroadbandInternet.
National Endowment for the Arts • Audience 2.0: How Technology Influences Arts Participation 103
That information could allow researchers to compare rates of arts participation through electronic media between respondents who have limited access to electronic media (e.g., those with only network television) and respondents with more access (e.g., those with cable or satellite television). Information about electronic media accessibility will also allow researchers to determine whether respondents have access to certain forms of electronic media but simply choose not to use them to participate in the arts (e.g., those who have access to portable media devices but do not use them to view or listen to the arts).
Account for new forms of electronic media. The forms of electronic media people use to view or listen to different art forms will continue to evolve in the coming years. Future SPPAs should continue to include questions about new ways in which people use electronic media to engage in arts activities.
Format changes. Several changes could also be made to how questions are asked in future SPPAs. Doing so could make it easier to assess arts participation through electronic media.
Ensuring consistency with previous SPPAs. The format of the SPPA could be changed to be more consistent with previous SPPAs, thus allowing researchers to analyze chronological trends in arts participation via electronic media. For example, the 1982, 1992, and 2002 SPPAs all included separate questions about participating in various arts activities through different forms of electronic media (e.g., Did you participate in jazz through television? Did you participate in opera through radio?). By contrast, the 2008 SPPA addressed all forms of electronic media in a single
question (e.g., Did you participate in jazz through television, radio, computers, mobile media or the Internet?).
The different question formats between the 2008 SPPA and the 1982, 1992, and 2002 SPPAs likely led respondents to interpret and answer questions in different ways, making it difficult to compare responses on the 2008 SPPA to previous years. Prior to implementing the next SPPA, questions from the 2008 and prior SPPAs should be pilot tested to gauge how different formats affect measurement of arts participation through electronic media. Results from the pilot testing could help determine how questions are formatted for the next survey.
More clearly define what counts as arts participation. Increased availability of electronic media and greater access to the arts through electronic media have blurred the lines between what is and what is not “arts participation.” For example, do people consider recording and broadcasting videos on YouTube as creating art online? Do they consider watching a rendition of Etta James’ “At Last” on American Idol as jazz participation via media? By the time of the next SPPA, determining what activities Americans consider as “art” could become even more complex.
In the next SPPA, an effort could be made to more clearly define what activities respondents should consider as “art” and what behaviors they should consider as “participation” for the purposes of answering survey questions. Doing so will help ensure that respondents interpret questions in exactly the same way and that future SPPAs measure what they intend to measure.
National Endowment for the Arts • Audience 2.0: How Technology Influences Arts Participation104
Alternative research methods. Traditional surveys such as the SPPA represent one of many ways in which researchers can examine arts participation. Future research related to arts participation through electronic media could also benefit from the use of alternative quantitative and qualitative research methods.
Focus groups. Focus groups could help researchers obtain qualitative information about issues related to arts participation through electronic media. For example, discussions with arts participants and non-participants about current SPPA topics may give researchers a deeper understanding of how people interpret SPPA questions and what activities they consider to be “arts” activities and how they view different forms of “participation.”
Case studies and in-depth interviews. Similar to focus groups, case studies and in-depth interviews could allow researchers to obtain rich information about arts participation through electronic media from select groups of people such as arts participants and non-participants, leaders of arts organizations, and artists. Conducting in-depth interviews could help researchers understand dynamic and complex relationships that would be difficult to assess via quantitative methods alone.
For example, questions about why some groups participate in the arts only through electronic media may be better suited for case studies and in-depth interviews than for surveys or experimental paradigms.
Experimental paradigms. Designing and conducting experiments or quasi-experiments that isolate and test the effects of different
variables on arts participation would be the clearest way to examine some of the possible causal relationships discussed earlier. For example, to test whether arts participation through electronic media leads to arts attendance, researchers could randomly assign school-aged children to different groups that vary in terms of their exposure to the arts through electronic media. The children could then be assessed across time in terms of the degree to which they show an interest in attending arts events.
If arts participation through electronic media leads to live arts attendance, then one would expect that children who receive more exposure to the arts through electronic media would exhibit higher rates of live arts attendance across time than children who receive less exposure.
SummaryChapter 5 outlines potential future directions in examining arts participation through electronic media, offers recommendations for changes to the SPPA, and discusses alternative research methods. Considering the trends observed regarding arts participation through electronic media, there are many questions for future research to address:
• Doesartsparticipationthroughelectronicmedia lead to live arts attendance?
• Isthegapbetweenartsparticipationthroughelectronic media and live attendance becoming smaller?
• Whatroledoartspreferencesplayintherelationship between arts participation through electronic media and live attendance?
National Endowment for the Arts • Audience 2.0: How Technology Influences Arts Participation 105
• Towhatdegreedoesaccesstodifferentforms of electronic media affect arts participation?
Many of the suggestions for future research may require changes to the SPPA or the use of alternative research methods. Key recommendations include:
• ChangingtheformatofSPPAquestionstobe more consistent with those of previous SPPAs;
• AddingquestionstotheSPPAthatprovidemore information about when respondents began using electronic media to participate in the arts and to what forms of electronic media they have access;
• Moreclearlydefiningwhatrespondentsshould consider as “arts participation” for the purposes of answering SPPA questions; and
• Usingalternativemethodssuchasfocusgroups and in-depth interviews and designs such as experiments or quasi-experiments to address new questions about arts participation through electronic media.
Notes1 The authors of this report — BBC Research & Consulting —
have made the recommendations presented in Chapter 5.
2 For a review of previous research, see Chapter 2.
3 As discussed in Chapter 2 and Appendix A, the format of the questions in the 2008 SPPA having to do with arts participation through electronic media differed substantially from those in the 1982, 1992 and 2002 SPPAs, making it difficult to compare media participation rates between the 2008 SPPA and SPPAs from prior years.
4 Models testing the relationship between preferences for an art form and participating in the art form via media showed a statistically significant relationship between preference for the art form and participation via electronic media. Those data were not included in the benchmark model because preference data were only available for musical art forms. For model specifications, see Appendix C.
The Metropolitan Museum of Art in New York City is one of the world’s largest fine arts museums, including more
than two million works of art spanning five thousand years of world culture. The museum keeps its feet firmly in the present, however, making good use of technology and the
Internet to further its mission, providing a special section on its website directed toward kids and families and using sites like Flickr and iTunes U to enhance the museum experience,
such as this video gallery tour of the exhibition, Vermeer’s Masterpiece The Milkmaid.
Appendix AChronological Trends in Arts
Participation through Media from 1982 to 2002
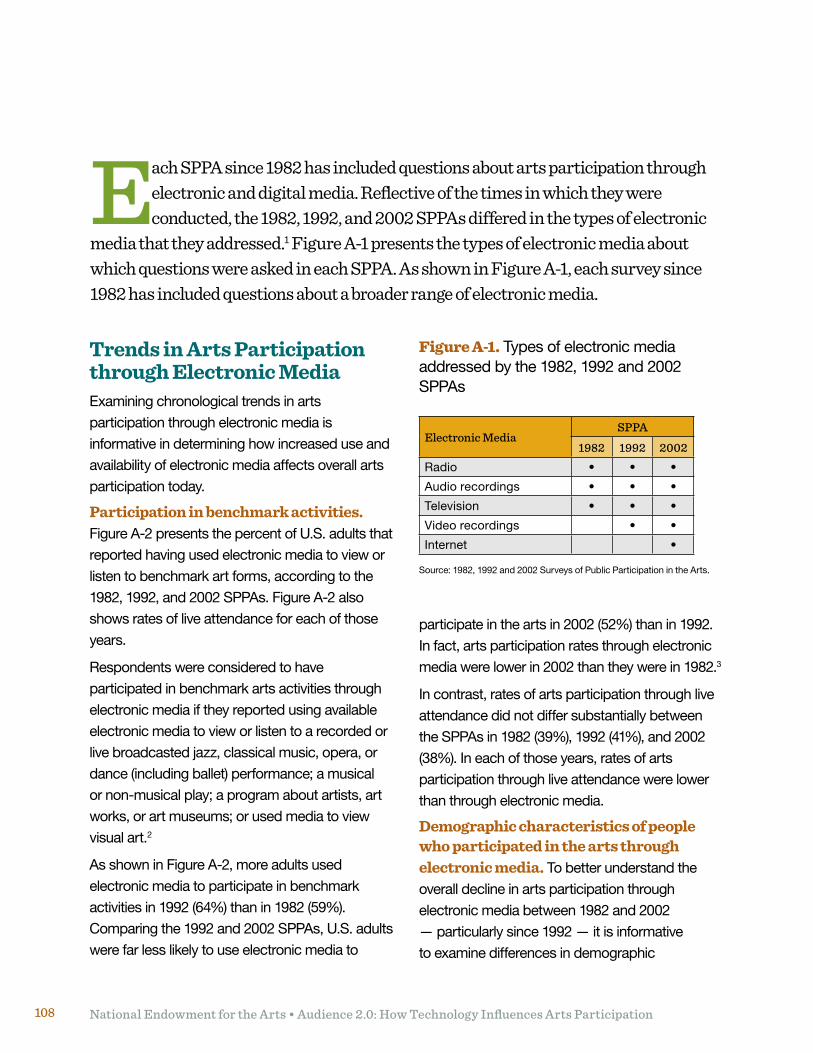
National Endowment for the Arts • Audience 2.0: How Technology Influences Arts Participation108
Each SPPA since 1982 has included questions about arts participation through electronic and digital media. Reflective of the times in which they were conducted, the 1982, 1992, and 2002 SPPAs differed in the types of electronic
media that they addressed.1 Figure A-1 presents the types of electronic media about which questions were asked in each SPPA. As shown in Figure A-1, each survey since 1982 has included questions about a broader range of electronic media.
Trends in Arts Participation through Electronic MediaExamining chronological trends in arts participation through electronic media is informative in determining how increased use and availability of electronic media affects overall arts participation today.
Participation in benchmark activities. Figure A-2 presents the percent of U.S. adults that reported having used electronic media to view or listen to benchmark art forms, according to the 1982, 1992, and 2002 SPPAs. Figure A-2 also shows rates of live attendance for each of those years.
Respondents were considered to have participated in benchmark arts activities through electronic media if they reported using available electronic media to view or listen to a recorded or live broadcasted jazz, classical music, opera, or dance (including ballet) performance; a musical or non-musical play; a program about artists, art works, or art museums; or used media to view visual art.2
As shown in Figure A-2, more adults used electronic media to participate in benchmark activities in 1992 (64%) than in 1982 (59%). Comparing the 1992 and 2002 SPPAs, U.S. adults were far less likely to use electronic media to
Figure A-1. Types of electronic media addressed by the 1982, 1992 and 2002 SPPAs
Electronic MediaSPPA
1982 1992 2002
Radio • • •
Audio recordings • • •
Television • • •
Video recordings • •
Internet •
Source: 1982, 1992 and 2002 Surveys of Public Participation in the Arts.
participate in the arts in 2002 (52%) than in 1992. In fact, arts participation rates through electronic media were lower in 2002 than they were in 1982.3
In contrast, rates of arts participation through live attendance did not differ substantially between the SPPAs in 1982 (39%), 1992 (41%), and 2002 (38%). In each of those years, rates of arts participation through live attendance were lower than through electronic media.
Demographic characteristics of people who participated in the arts through electronic media. To better understand the overall decline in arts participation through electronic media between 1982 and 2002 — particularly since 1992 — it is informative to examine differences in demographic
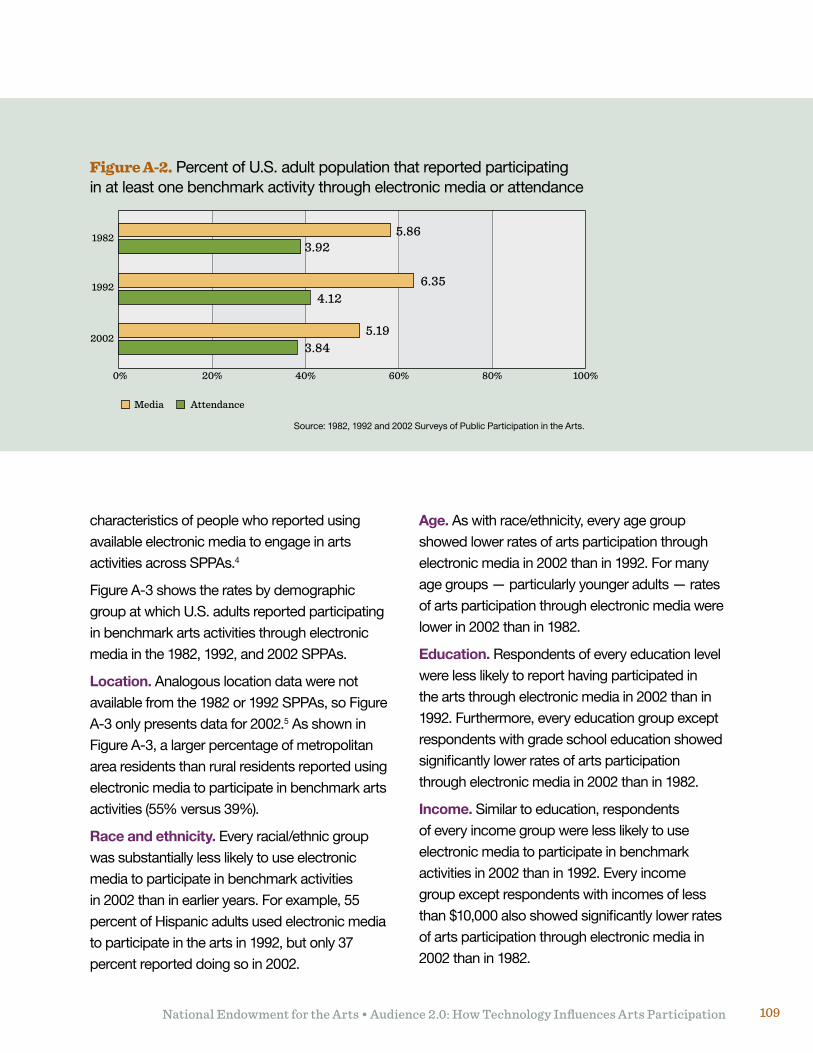
National Endowment for the Arts • Audience 2.0: How Technology Influences Arts Participation 109
characteristics of people who reported using available electronic media to engage in arts activities across SPPAs.4
Figure A-3 shows the rates by demographic group at which U.S. adults reported participating in benchmark arts activities through electronic media in the 1982, 1992, and 2002 SPPAs.
Location. Analogous location data were not available from the 1982 or 1992 SPPAs, so Figure A-3 only presents data for 2002.5 As shown in Figure A-3, a larger percentage of metropolitan area residents than rural residents reported using electronic media to participate in benchmark arts activities (55% versus 39%).
Race and ethnicity.Everyracial/ethnicgroupwas substantially less likely to use electronic media to participate in benchmark activities in 2002 than in earlier years. For example, 55 percent of Hispanic adults used electronic media to participate in the arts in 1992, but only 37 percent reported doing so in 2002.
Age.Aswithrace/ethnicity,everyagegroupshowed lower rates of arts participation through electronic media in 2002 than in 1992. For many age groups — particularly younger adults — rates of arts participation through electronic media were lower in 2002 than in 1982.
Education. Respondents of every education level were less likely to report having participated in the arts through electronic media in 2002 than in 1992. Furthermore, every education group except respondents with grade school education showed significantly lower rates of arts participation through electronic media in 2002 than in 1982.
Income. Similar to education, respondents of every income group were less likely to use electronic media to participate in benchmark activities in 2002 than in 1992. Every income group except respondents with incomes of less than $10,000 also showed significantly lower rates of arts participation through electronic media in 2002 than in 1982.
Figure A-2. Percent of U.S. adult population that reported participating in at least one benchmark activity through electronic media or attendance
Source: 1982, 1992 and 2002 Surveys of Public Participation in the Arts.
0% 20% 40% 60% 80% 100%
2002
1982
1992
Media Attendance
5.863.92
6.354.12
5.193.84
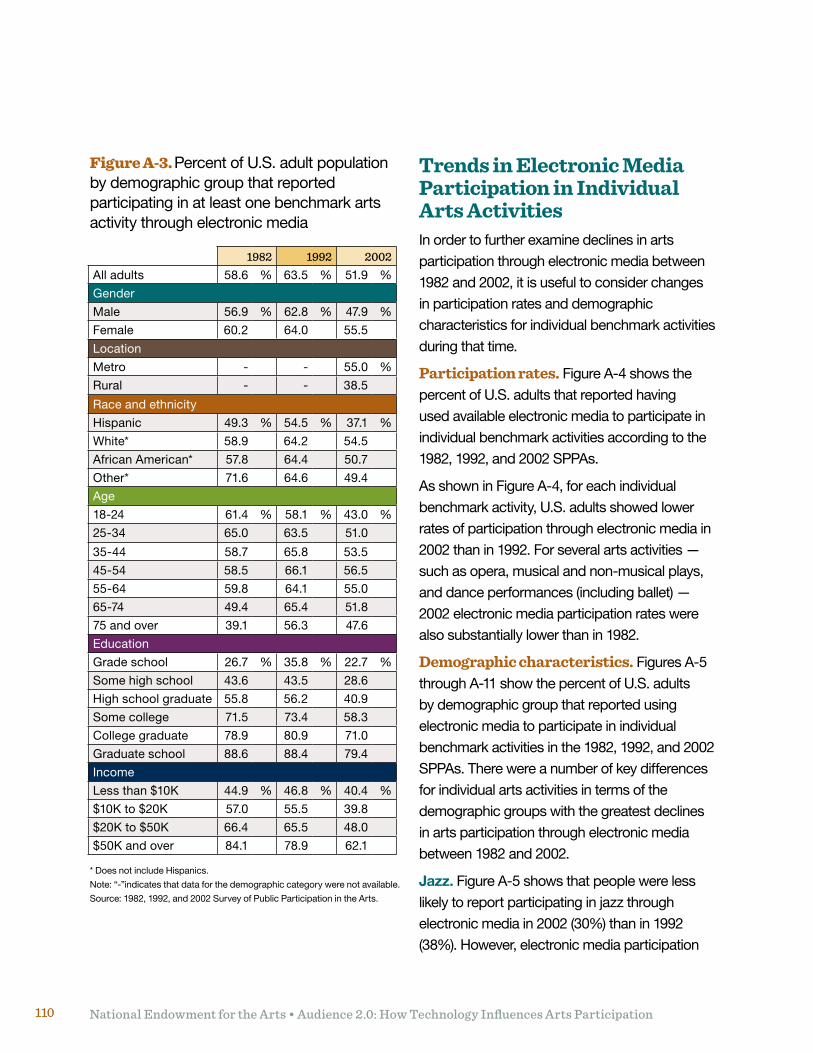
National Endowment for the Arts • Audience 2.0: How Technology Influences Arts Participation110
Trends in Electronic Media Participation in Individual Arts ActivitiesIn order to further examine declines in arts participation through electronic media between 1982 and 2002, it is useful to consider changes in participation rates and demographic characteristics for individual benchmark activities during that time.
Participation rates. Figure A-4 shows the percent of U.S. adults that reported having used available electronic media to participate in individual benchmark activities according to the 1982, 1992, and 2002 SPPAs.
As shown in Figure A-4, for each individual benchmark activity, U.S. adults showed lower rates of participation through electronic media in 2002 than in 1992. For several arts activities — such as opera, musical and non-musical plays, and dance performances (including ballet) — 2002 electronic media participation rates were also substantially lower than in 1982.
Demographic characteristics. Figures A-5 through A-11 show the percent of U.S. adults by demographic group that reported using electronic media to participate in individual benchmark activities in the 1982, 1992, and 2002 SPPAs. There were a number of key differences for individual arts activities in terms of the demographic groups with the greatest declines in arts participation through electronic media between 1982 and 2002.
Jazz. Figure A-5 shows that people were less likely to report participating in jazz through electronic media in 2002 (30%) than in 1992 (38%). However, electronic media participation
Figure A-3. Percent of U.S. adult population by demographic group that reported participating in at least one benchmark arts activity through electronic media
1982 1992 2002All adults 58.6 % 63.5 % 51.9 %
Gender
Male 56.9 % 62.8 % 47.9 %
Female 60.2 64.0 55.5
Location
Metro - - 55.0 %
Rural - - 38.5
Race and ethnicity
Hispanic 49.3 % 54.5 % 37.1 %
White* 58.9 64.2 54.5
African American* 57.8 64.4 50.7
Other* 71.6 64.6 49.4
Age
18-24 61.4 % 58.1 % 43.0 %
25-34 65.0 63.5 51.0
35-44 58.7 65.8 53.5
45-54 58.5 66.1 56.5
55-64 59.8 64.1 55.0
65-74 49.4 65.4 51.8
75 and over 39.1 56.3 47.6
Education
Gradeschool 26.7 % 35.8 % 22.7 %
Some high school 43.6 43.5 28.6
High school graduate 55.8 56.2 40.9
Some college 71.5 73.4 58.3
College graduate 78.9 80.9 71.0
Graduateschool 88.6 88.4 79.4
Income
Less than $10K 44.9 % 46.8 % 40.4 %
$10K to $20K 57.0 55.5 39.8
$20K to $50K 66.4 65.5 48.0
$50K and over 84.1 78.9 62.1
* Does not include Hispanics.
Note: “-”indicates that data for the demographic category were not available.
Source: 1982, 1992, and 2002 Survey of Public Participation in the Arts.
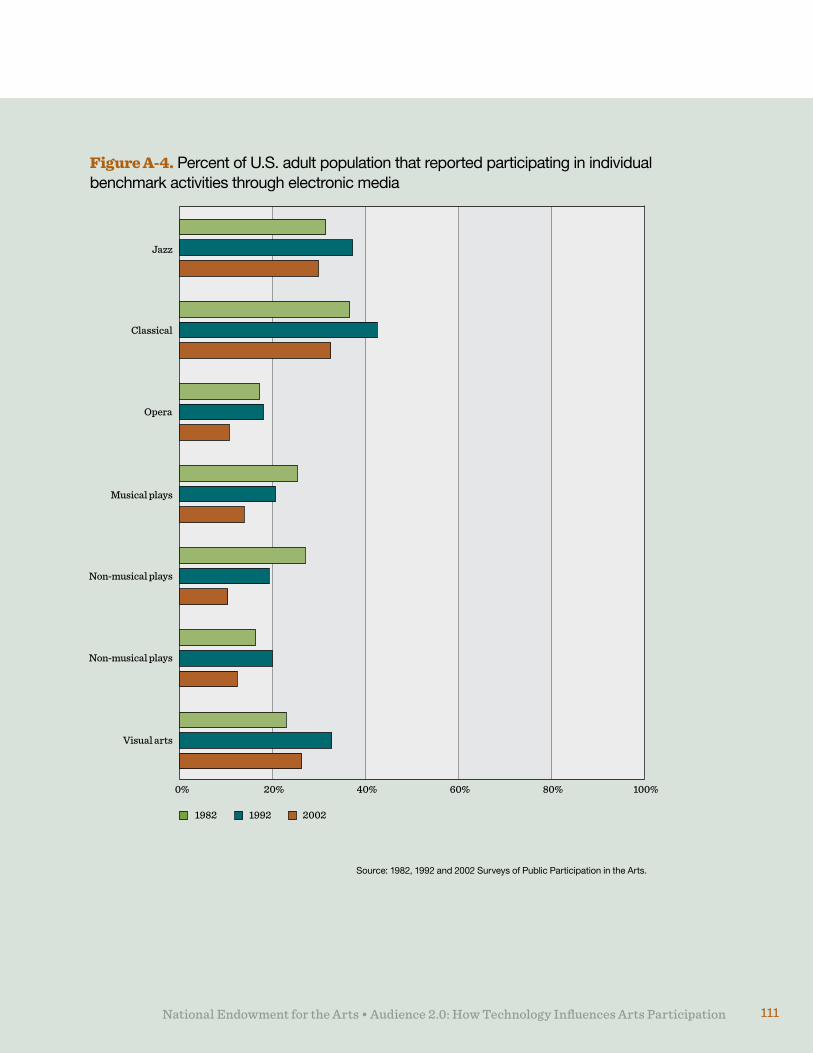
National Endowment for the Arts • Audience 2.0: How Technology Influences Arts Participation 111National Endowment for the Arts • Audience 2.0: How Technology Influences Arts Participation 111
0% 20% 40% 60% 80% 100%
Jazz
Classical
Opera
Musical plays
Non-musical plays
Non-musical plays
Visual arts
1982 1992 2002
Figure A-4. Percent of U.S. adult population that reported participating in individual benchmark activities through electronic media
Source: 1982, 1992 and 2002 Surveys of Public Participation in the Arts.
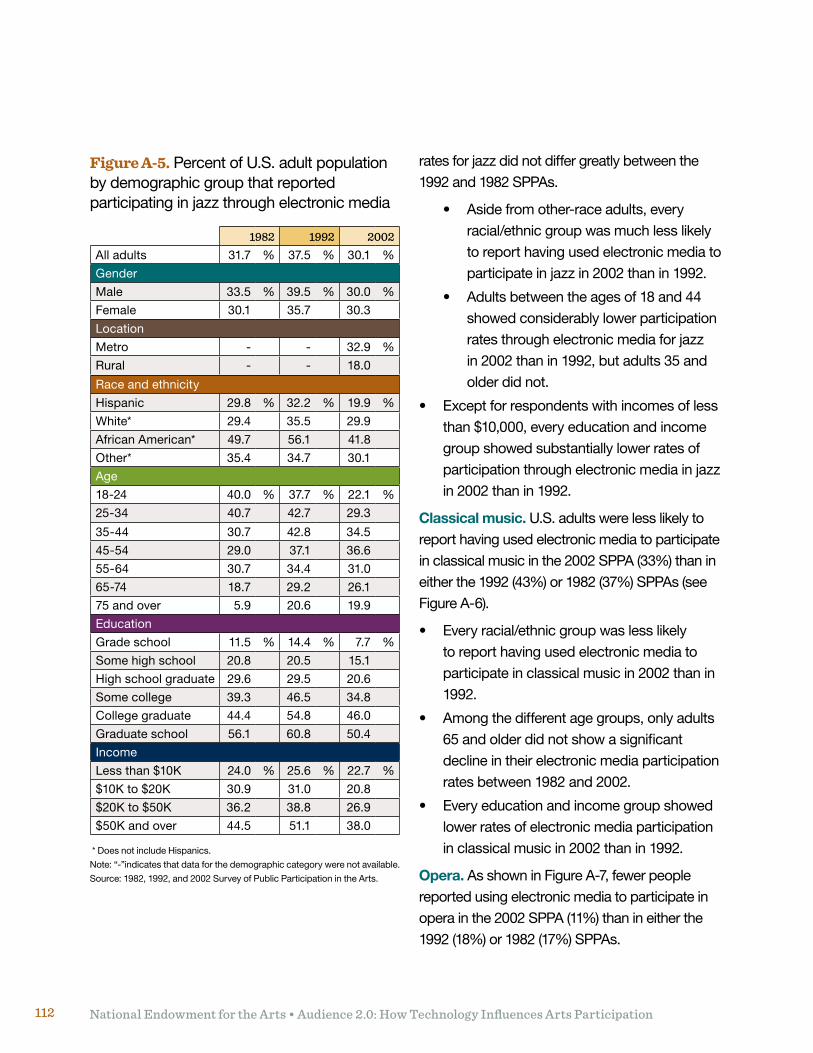
National Endowment for the Arts • Audience 2.0: How Technology Influences Arts Participation112
rates for jazz did not differ greatly between the 1992 and 1982 SPPAs.
• Asidefromother-raceadults,everyracial/ethnicgroupwasmuchlesslikelyto report having used electronic media to participate in jazz in 2002 than in 1992.
• Adultsbetweentheagesof18and44showed considerably lower participation rates through electronic media for jazz in 2002 than in 1992, but adults 35 and older did not.
• Exceptforrespondentswithincomesoflessthan $10,000, every education and income group showed substantially lower rates of participation through electronic media in jazz in 2002 than in 1992.
Classical music. U.S. adults were less likely to report having used electronic media to participate in classical music in the 2002 SPPA (33%) than in either the 1992 (43%) or 1982 (37%) SPPAs (see Figure A-6).
• Everyracial/ethnicgroupwaslesslikelyto report having used electronic media to participate in classical music in 2002 than in 1992.
• Amongthedifferentagegroups,onlyadults65 and older did not show a significant decline in their electronic media participation rates between 1982 and 2002.
• Everyeducationandincomegroupshowedlower rates of electronic media participation in classical music in 2002 than in 1992.
Opera. As shown in Figure A-7, fewer people reported using electronic media to participate in opera in the 2002 SPPA (11%) than in either the 1992 (18%) or 1982 (17%) SPPAs.
Figure A-5. Percent of U.S. adult population by demographic group that reported participating in jazz through electronic media
* Does not include Hispanics.
Note: “-”indicates that data for the demographic category were not available.
Source: 1982, 1992, and 2002 Survey of Public Participation in the Arts.
1982 1992 2002All adults 31.7 % 37.5 % 30.1 %
Gender
Male 33.5 % 39.5 % 30.0 %
Female 30.1 35.7 30.3
Location
Metro - - 32.9 %
Rural - - 18.0
Race and ethnicity
Hispanic 29.8 % 32.2 % 19.9 %
White* 29.4 35.5 29.9
African American* 49.7 56.1 41.8
Other* 35.4 34.7 30.1
Age
18-24 40.0 % 37.7 % 22.1 %
25-34 40.7 42.7 29.3
35-44 30.7 42.8 34.5
45-54 29.0 37.1 36.6
55-64 30.7 34.4 31.0
65-74 18.7 29.2 26.1
75 and over 5.9 20.6 19.9
Education
Gradeschool 11.5 % 14.4 % 7.7 %
Some high school 20.8 20.5 15.1
High school graduate 29.6 29.5 20.6
Some college 39.3 46.5 34.8
College graduate 44.4 54.8 46.0
Graduateschool 56.1 60.8 50.4
Income
Less than $10K 24.0 % 25.6 % 22.7 %
$10K to $20K 30.9 31.0 20.8
$20K to $50K 36.2 38.8 26.9
$50K and over 44.5 51.1 38.0
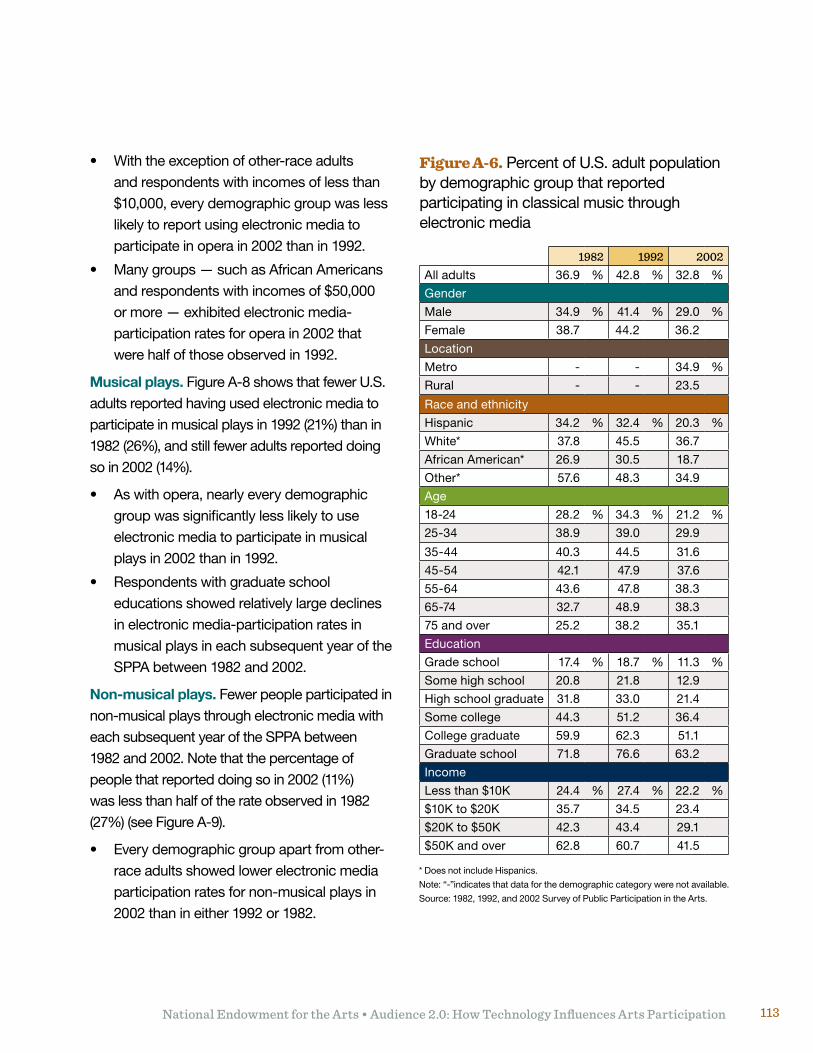
National Endowment for the Arts • Audience 2.0: How Technology Influences Arts Participation 113
• Withtheexceptionofother-raceadultsand respondents with incomes of less than $10,000, every demographic group was less likely to report using electronic media to participate in opera in 2002 than in 1992.
• Manygroups—suchasAfricanAmericansand respondents with incomes of $50,000 or more — exhibited electronic media-participation rates for opera in 2002 that were half of those observed in 1992.
Musical plays. Figure A-8 shows that fewer U.S. adults reported having used electronic media to participate in musical plays in 1992 (21%) than in 1982 (26%), and still fewer adults reported doing so in 2002 (14%).
• Aswithopera,nearlyeverydemographicgroup was significantly less likely to use electronic media to participate in musical plays in 2002 than in 1992.
• Respondentswithgraduateschooleducations showed relatively large declines in electronic media-participation rates in musical plays in each subsequent year of the SPPA between 1982 and 2002.
Non-musical plays. Fewer people participated in non-musical plays through electronic media with each subsequent year of the SPPA between 1982 and 2002. Note that the percentage of people that reported doing so in 2002 (11%) was less than half of the rate observed in 1982 (27%) (see Figure A-9).
• Everydemographicgroupapartfromother-race adults showed lower electronic media participation rates for non-musical plays in 2002 than in either 1992 or 1982.
Figure A-6. Percent of U.S. adult population by demographic group that reported participating in classical music through electronic media
* Does not include Hispanics.
Note: “-”indicates that data for the demographic category were not available.
Source: 1982, 1992, and 2002 Survey of Public Participation in the Arts.
1982 1992 2002All adults 36.9 % 42.8 % 32.8 %
Gender
Male 34.9 % 41.4 % 29.0 %
Female 38.7 44.2 36.2
Location
Metro - - 34.9 %
Rural - - 23.5
Race and ethnicity
Hispanic 34.2 % 32.4 % 20.3 %
White* 37.8 45.5 36.7
African American* 26.9 30.5 18.7
Other* 57.6 48.3 34.9
Age
18-24 28.2 % 34.3 % 21.2 %
25-34 38.9 39.0 29.9
35-44 40.3 44.5 31.6
45-54 42.1 47.9 37.6
55-64 43.6 47.8 38.3
65-74 32.7 48.9 38.3
75 and over 25.2 38.2 35.1
Education
Gradeschool 17.4 % 18.7 % 11.3 %
Some high school 20.8 21.8 12.9
High school graduate 31.8 33.0 21.4
Some college 44.3 51.2 36.4
College graduate 59.9 62.3 51.1
Graduateschool 71.8 76.6 63.2
Income
Less than $10K 24.4 % 27.4 % 22.2 %
$10K to $20K 35.7 34.5 23.4
$20K to $50K 42.3 43.4 29.1
$50K and over 62.8 60.7 41.5
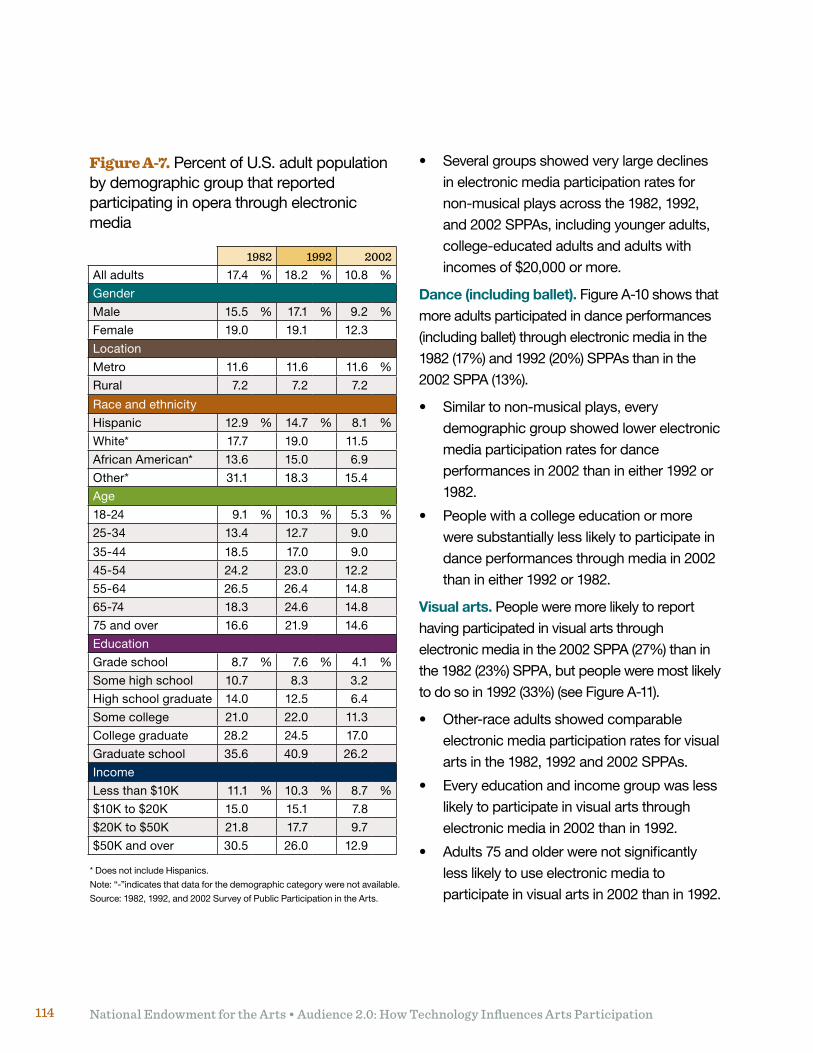
National Endowment for the Arts • Audience 2.0: How Technology Influences Arts Participation114
• Severalgroupsshowedverylargedeclinesin electronic media participation rates for non-musical plays across the 1982, 1992, and 2002 SPPAs, including younger adults, college-educated adults and adults with incomes of $20,000 or more.
Dance (including ballet). Figure A-10 shows that more adults participated in dance performances (including ballet) through electronic media in the 1982 (17%) and 1992 (20%) SPPAs than in the 2002 SPPA (13%).
• Similartonon-musicalplays,everydemographic group showed lower electronic media participation rates for dance performances in 2002 than in either 1992 or 1982.
• Peoplewithacollegeeducationormorewere substantially less likely to participate in dance performances through media in 2002 than in either 1992 or 1982.
Visual arts. People were more likely to report having participated in visual arts through electronic media in the 2002 SPPA (27%) than in the 1982 (23%) SPPA, but people were most likely to do so in 1992 (33%) (see Figure A-11).
• Other-raceadultsshowedcomparableelectronic media participation rates for visual arts in the 1982, 1992 and 2002 SPPAs.
• Everyeducationandincomegroupwaslesslikely to participate in visual arts through electronic media in 2002 than in 1992.
• Adults75andolderwerenotsignificantlyless likely to use electronic media to participate in visual arts in 2002 than in 1992.
Figure A-7. Percent of U.S. adult population by demographic group that reported participating in opera through electronic media
* Does not include Hispanics.
Note: “-”indicates that data for the demographic category were not available.
Source: 1982, 1992, and 2002 Survey of Public Participation in the Arts.
1982 1992 2002All adults 17.4 % 18.2 % 10.8 %
Gender
Male 15.5 % 17.1 % 9.2 %
Female 19.0 19.1 12.3
Location
Metro 11.6 11.6 11.6 %
Rural 7.2 7.2 7.2
Race and ethnicity
Hispanic 12.9 % 14.7 % 8.1 %
White* 17.7 19.0 11.5
African American* 13.6 15.0 6.9
Other* 31.1 18.3 15.4
Age
18-24 9.1 % 10.3 % 5.3 %
25-34 13.4 12.7 9.0
35-44 18.5 17.0 9.0
45-54 24.2 23.0 12.2
55-64 26.5 26.4 14.8
65-74 18.3 24.6 14.8
75 and over 16.6 21.9 14.6
Education
Gradeschool 8.7 % 7.6 % 4.1 %
Some high school 10.7 8.3 3.2
High school graduate 14.0 12.5 6.4
Some college 21.0 22.0 11.3
College graduate 28.2 24.5 17.0
Graduateschool 35.6 40.9 26.2
Income
Less than $10K 11.1 % 10.3 % 8.7 %
$10K to $20K 15.0 15.1 7.8
$20K to $50K 21.8 17.7 9.7
$50K and over 30.5 26.0 12.9
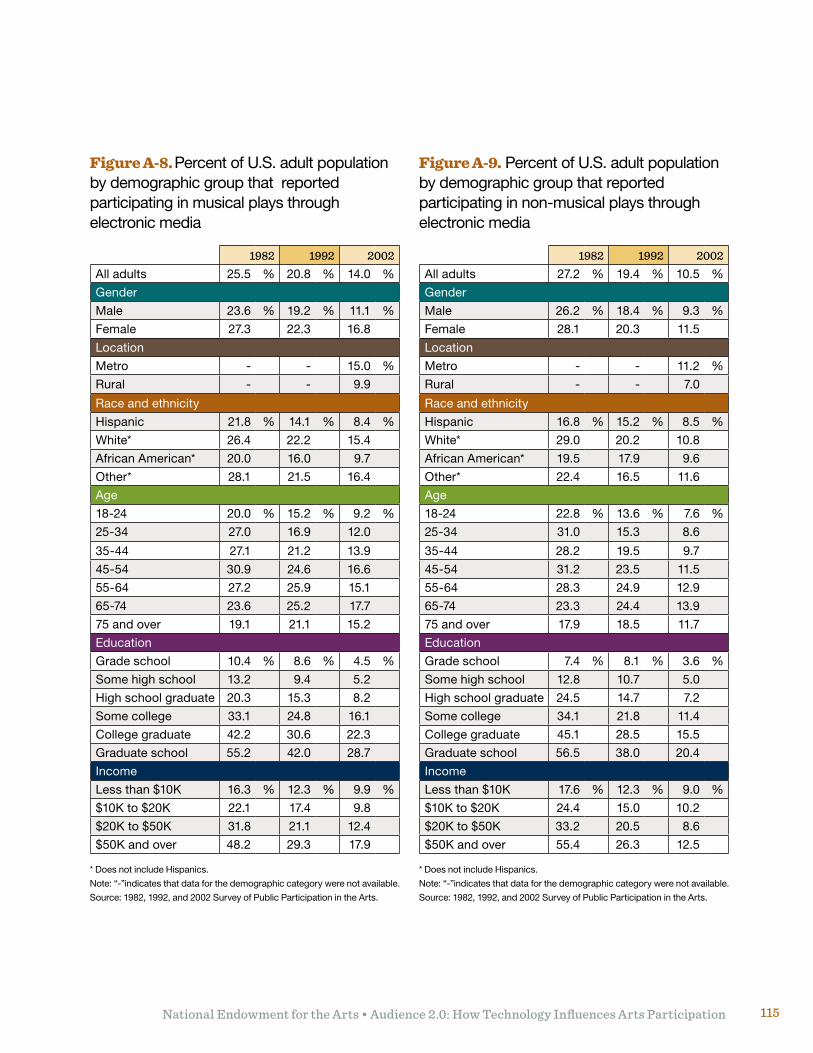
National Endowment for the Arts • Audience 2.0: How Technology Influences Arts Participation 115
Figure A-8. Percent of U.S. adult population by demographic group that reported participating in musical plays through electronic media
* Does not include Hispanics.
Note: “-”indicates that data for the demographic category were not available.
Source: 1982, 1992, and 2002 Survey of Public Participation in the Arts.
1982 1992 2002All adults 25.5 % 20.8 % 14.0 %
Gender
Male 23.6 % 19.2 % 11.1 %
Female 27.3 22.3 16.8
Location
Metro - - 15.0 %
Rural - - 9.9
Race and ethnicity
Hispanic 21.8 % 14.1 % 8.4 %
White* 26.4 22.2 15.4
African American* 20.0 16.0 9.7
Other* 28.1 21.5 16.4
Age
18-24 20.0 % 15.2 % 9.2 %
25-34 27.0 16.9 12.0
35-44 27.1 21.2 13.9
45-54 30.9 24.6 16.6
55-64 27.2 25.9 15.1
65-74 23.6 25.2 17.7
75 and over 19.1 21.1 15.2
Education
Gradeschool 10.4 % 8.6 % 4.5 %
Some high school 13.2 9.4 5.2
High school graduate 20.3 15.3 8.2
Some college 33.1 24.8 16.1
College graduate 42.2 30.6 22.3
Graduateschool 55.2 42.0 28.7
Income
Less than $10K 16.3 % 12.3 % 9.9 %
$10K to $20K 22.1 17.4 9.8
$20K to $50K 31.8 21.1 12.4
$50K and over 48.2 29.3 17.9
1982 1992 2002All adults 27.2 % 19.4 % 10.5 %
Gender
Male 26.2 % 18.4 % 9.3 %
Female 28.1 20.3 11.5
Location
Metro - - 11.2 %
Rural - - 7.0
Race and ethnicity
Hispanic 16.8 % 15.2 % 8.5 %
White* 29.0 20.2 10.8
African American* 19.5 17.9 9.6
Other* 22.4 16.5 11.6
Age
18-24 22.8 % 13.6 % 7.6 %
25-34 31.0 15.3 8.6
35-44 28.2 19.5 9.7
45-54 31.2 23.5 11.5
55-64 28.3 24.9 12.9
65-74 23.3 24.4 13.9
75 and over 17.9 18.5 11.7
Education
Gradeschool 7.4 % 8.1 % 3.6 %
Some high school 12.8 10.7 5.0
High school graduate 24.5 14.7 7.2
Some college 34.1 21.8 11.4
College graduate 45.1 28.5 15.5
Graduateschool 56.5 38.0 20.4
Income
Less than $10K 17.6 % 12.3 % 9.0 %
$10K to $20K 24.4 15.0 10.2
$20K to $50K 33.2 20.5 8.6
$50K and over 55.4 26.3 12.5
Figure A-9. Percent of U.S. adult population by demographic group that reported participating in non-musical plays through electronic media
* Does not include Hispanics.
Note: “-”indicates that data for the demographic category were not available.
Source: 1982, 1992, and 2002 Survey of Public Participation in the Arts.
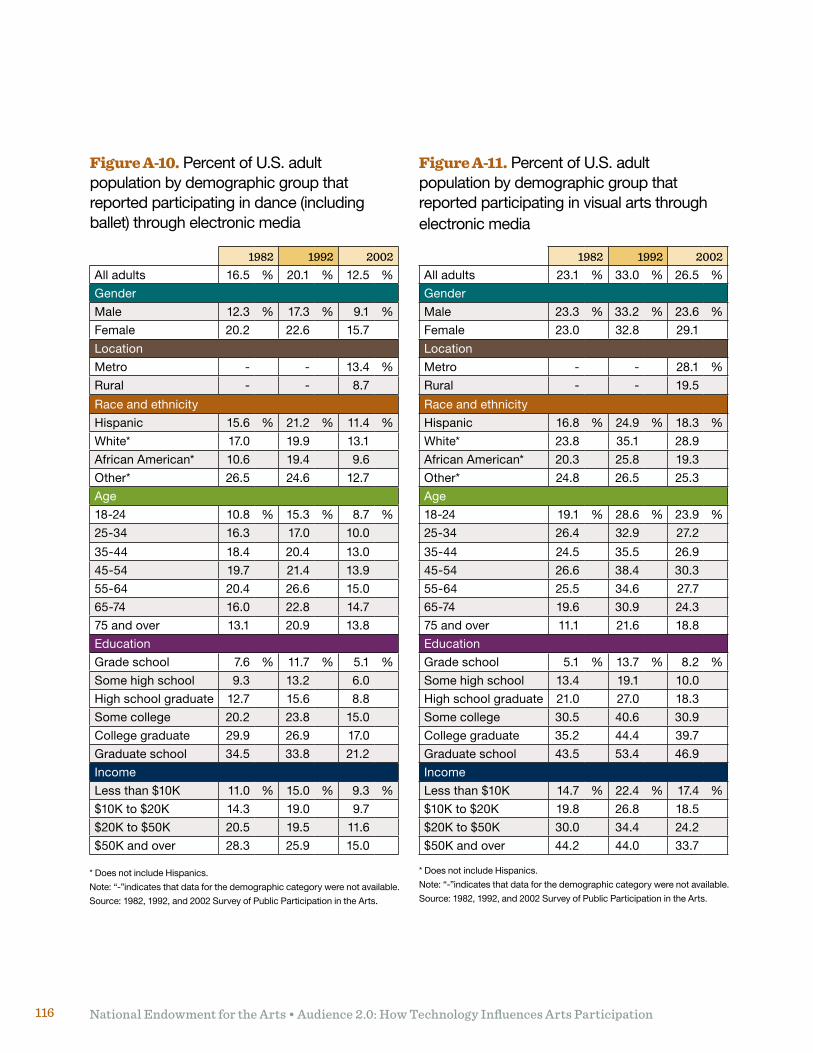
National Endowment for the Arts • Audience 2.0: How Technology Influences Arts Participation116
Figure A-10. Percent of U.S. adult population by demographic group that reported participating in dance (including ballet) through electronic media
* Does not include Hispanics.
Note: “-”indicates that data for the demographic category were not available.
Source: 1982, 1992, and 2002 Survey of Public Participation in the Arts.
1982 1992 2002All adults 16.5 % 20.1 % 12.5 %
Gender
Male 12.3 % 17.3 % 9.1 %
Female 20.2 22.6 15.7
Location
Metro - - 13.4 %
Rural - - 8.7
Race and ethnicity
Hispanic 15.6 % 21.2 % 11.4 %
White* 17.0 19.9 13.1
African American* 10.6 19.4 9.6
Other* 26.5 24.6 12.7
Age
18-24 10.8 % 15.3 % 8.7 %
25-34 16.3 17.0 10.0
35-44 18.4 20.4 13.0
45-54 19.7 21.4 13.9
55-64 20.4 26.6 15.0
65-74 16.0 22.8 14.7
75 and over 13.1 20.9 13.8
Education
Gradeschool 7.6 % 11.7 % 5.1 %
Some high school 9.3 13.2 6.0
High school graduate 12.7 15.6 8.8
Some college 20.2 23.8 15.0
College graduate 29.9 26.9 17.0
Graduateschool 34.5 33.8 21.2
Income
Less than $10K 11.0 % 15.0 % 9.3 %
$10K to $20K 14.3 19.0 9.7
$20K to $50K 20.5 19.5 11.6
$50K and over 28.3 25.9 15.0
1982 1992 2002All adults 23.1 % 33.0 % 26.5 %
Gender
Male 23.3 % 33.2 % 23.6 %
Female 23.0 32.8 29.1
Location
Metro - - 28.1 %
Rural - - 19.5
Race and ethnicity
Hispanic 16.8 % 24.9 % 18.3 %
White* 23.8 35.1 28.9
African American* 20.3 25.8 19.3
Other* 24.8 26.5 25.3
Age
18-24 19.1 % 28.6 % 23.9 %
25-34 26.4 32.9 27.2
35-44 24.5 35.5 26.9
45-54 26.6 38.4 30.3
55-64 25.5 34.6 27.7
65-74 19.6 30.9 24.3
75 and over 11.1 21.6 18.8
Education
Gradeschool 5.1 % 13.7 % 8.2 %
Some high school 13.4 19.1 10.0
High school graduate 21.0 27.0 18.3
Some college 30.5 40.6 30.9
College graduate 35.2 44.4 39.7
Graduateschool 43.5 53.4 46.9
Income
Less than $10K 14.7 % 22.4 % 17.4 %
$10K to $20K 19.8 26.8 18.5
$20K to $50K 30.0 34.4 24.2
$50K and over 44.2 44.0 33.7
Figure A-11. Percent of U.S. adult population by demographic group that reported participating in visual arts through electronic media
* Does not include Hispanics.
Note: “-”indicates that data for the demographic category were not available.
Source: 1982, 1992, and 2002 Survey of Public Participation in the Arts.
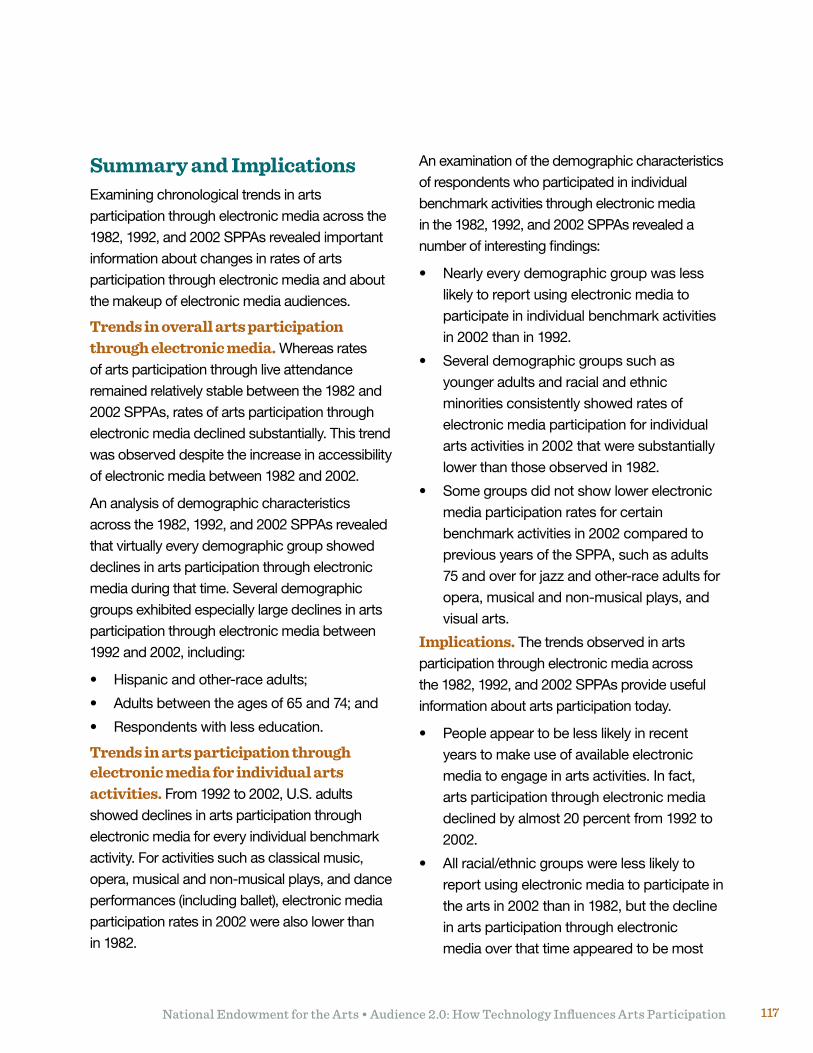
National Endowment for the Arts • Audience 2.0: How Technology Influences Arts Participation 117
Summary and ImplicationsExamining chronological trends in arts participation through electronic media across the 1982, 1992, and 2002 SPPAs revealed important information about changes in rates of arts participation through electronic media and about the makeup of electronic media audiences.
Trends in overall arts participation through electronic media. Whereas rates of arts participation through live attendance remained relatively stable between the 1982 and 2002 SPPAs, rates of arts participation through electronic media declined substantially. This trend was observed despite the increase in accessibility of electronic media between 1982 and 2002.
An analysis of demographic characteristics across the 1982, 1992, and 2002 SPPAs revealed that virtually every demographic group showed declines in arts participation through electronic media during that time. Several demographic groups exhibited especially large declines in arts participation through electronic media between 1992 and 2002, including:
• Hispanicandother-raceadults;
• Adultsbetweentheagesof65and74;and
• Respondentswithlesseducation.
Trends in arts participation through electronic media for individual arts activities. From 1992 to 2002, U.S. adults showed declines in arts participation through electronic media for every individual benchmark activity. For activities such as classical music, opera, musical and non-musical plays, and dance performances (including ballet), electronic media participation rates in 2002 were also lower than in 1982.
An examination of the demographic characteristics of respondents who participated in individual benchmark activities through electronic media in the 1982, 1992, and 2002 SPPAs revealed a number of interesting findings:
• Nearlyeverydemographicgroupwaslesslikely to report using electronic media to participate in individual benchmark activities in 2002 than in 1992.
• Severaldemographicgroupssuchasyounger adults and racial and ethnic minorities consistently showed rates of electronic media participation for individual arts activities in 2002 that were substantially lower than those observed in 1982.
• Somegroupsdidnotshowlowerelectronicmedia participation rates for certain benchmark activities in 2002 compared to previous years of the SPPA, such as adults 75 and over for jazz and other-race adults for opera, musical and non-musical plays, and visual arts.
Implications. The trends observed in arts participation through electronic media across the 1982, 1992, and 2002 SPPAs provide useful information about arts participation today.
• Peopleappeartobelesslikelyinrecentyears to make use of available electronic media to engage in arts activities. In fact, arts participation through electronic media declined by almost 20 percent from 1992 to 2002.
• Allracial/ethnicgroupswerelesslikelytoreport using electronic media to participate in the arts in 2002 than in 1982, but the decline in arts participation through electronic media over that time appeared to be most
National Endowment for the Arts • Audience 2.0: How Technology Influences Arts Participation118
pronounced for Hispanics. Across the three SPPAs included in the present analyses, Hispanic Americans in 2002 were the only racial/ethnicgrouptoshowarateofartsparticipation through electronic media considerably less than 50 percent. Efforts should be made to explore why Hispanics participate in the arts through electronic media less than they have in the past and lessthanotherracial/ethnicgroups.
• TheoldestU.S.adults—thatis,adults75and older — showed higher rates of arts participation through electronic media in 2002 than in 1982. No other age group showed an increase in arts participation through electronic media during that time period. This finding suggests that using electronic media may be an increasingly important way for older U.S. adults to remain engaged in arts activities.
Notes1 As discussed in Chapter 2, the format of the questions in the
2008 SPPA having to do with arts participation through media differed substantially from those in the 1982, 1992, and 2002 SPPAs, making it difficult to compare arts participation rates between the 2008 SPPA and prior years. As a result, data from the 2008 SPPA were not considered in the analyses presented in Appendix A.
2 Only the 1982 SPPA included questions specifically about participation in ballet through electronic media. Both the 1992 and 2002 SPPAs included questions about media participation in ballet or other dance performances, such as modern or tap.
3 The 1982, 1992, and 2002 SPPAs were conducted during different times of the year. Because television use is typically highest in the fall and winter months, the month in which the SPPA was conducted could have an effect on the percent of respondents that reported using television (and thus media) to view or listen to the arts. However, an examination of 1982, 1992, and 2002 SPPA data by month revealed no significant differences in rates of media arts participation.
4 Certain demographic categories were either not included in all of the SPPAs or included in such a way as to make them incomparable across years. In those cases, either the demographic categories were redefined to allow comparisons across years or data from certain years were excluded from the analyses.
5 Whereas the Census Bureau provided information on “metropolitan status,” for the 2002 SPPA , for the 1982 and 1992 SPPA’s, Census provided information only on respondents’ “land use” — that is, whether it was defined as urbanorrural—whichmaynotreflectplaceofresidence.
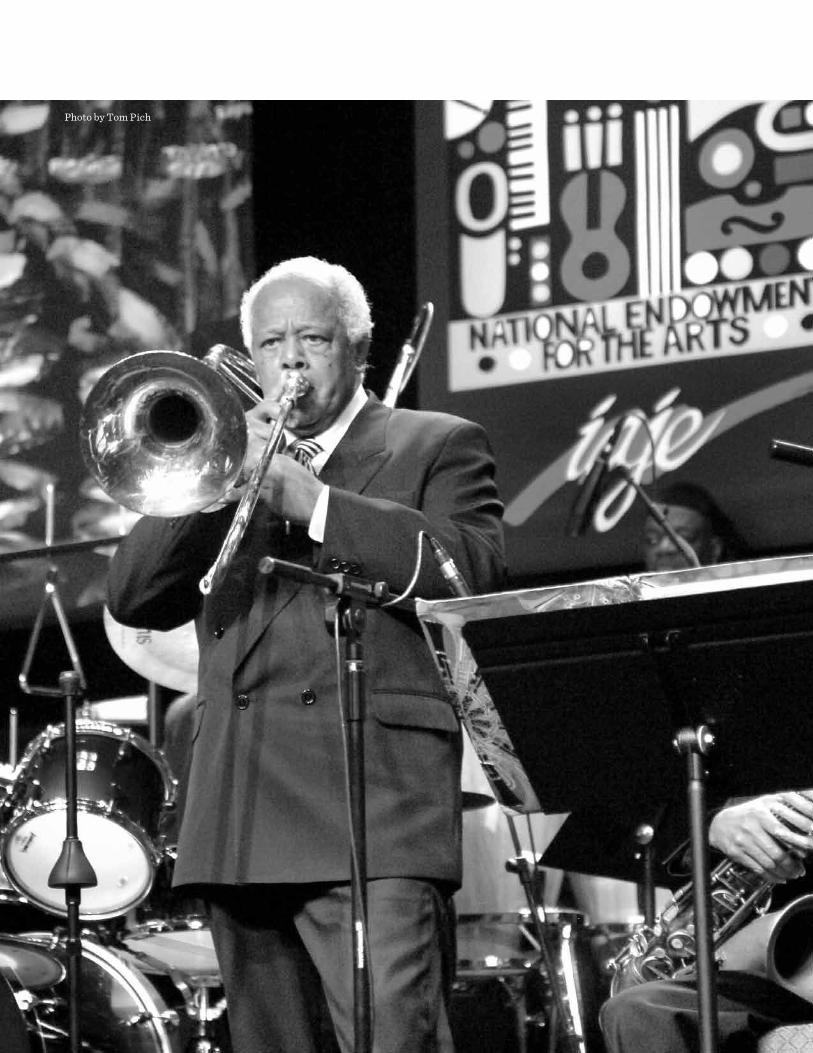
National Endowment for the Arts • Audience 2.0: How Technology Influences Arts Participation 119
Photo by Tom Pich
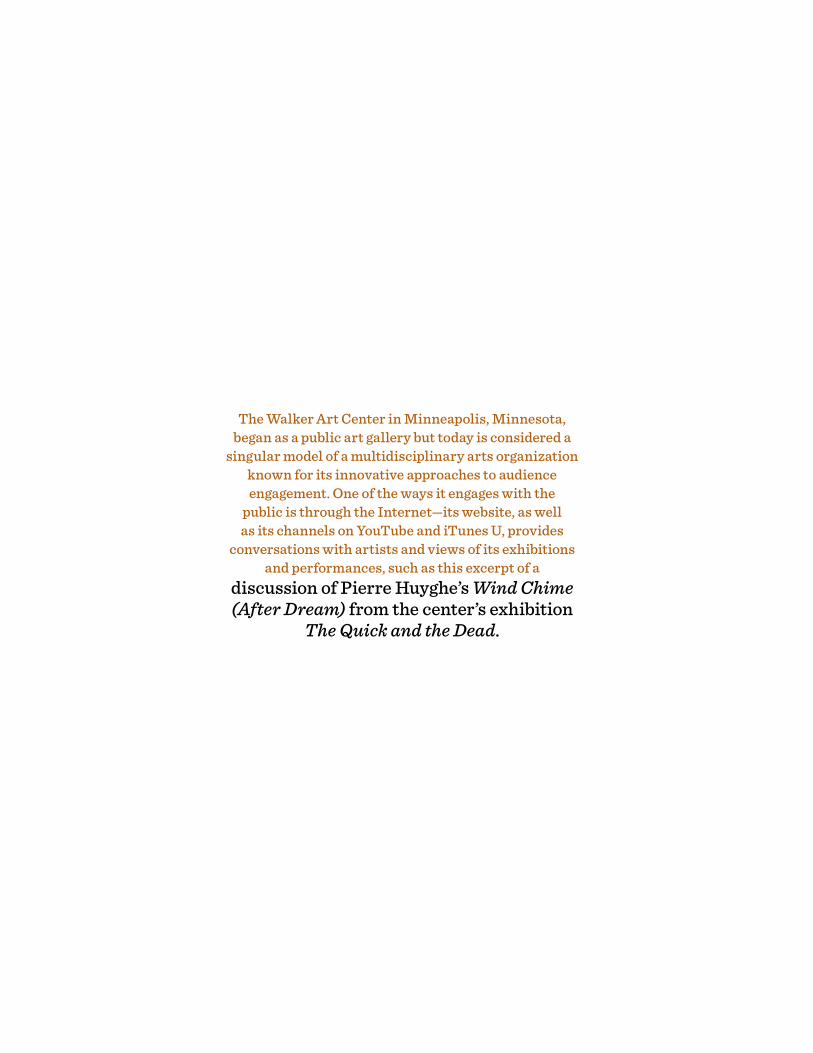
The Walker Art Center in Minneapolis, Minnesota, began as a public art gallery but today is considered a
singular model of a multidisciplinary arts organization known for its innovative approaches to audience engagement. One of the ways it engages with the
public is through the Internet—its website, as well as its channels on YouTube and iTunes U, provides
conversations with artists and views of its exhibitions and performances, such as this excerpt of a
discussion of Pierre Huyghe’s Wind Chime (After Dream) from the center’s exhibition
The Quick and the Dead.
Appendix B2008 Survey of Public
Participation in the Arts (SPPA)

National Endowment for the Arts • Audience 2.0: How Technology Influences Arts Participation122
The following is a reader-friendly interpretation of the 2008 SPAA. Questions that were new for 2008 are identified with an asterisk (*) at the end of the question. For questions that ask, “Did you (or your spouse/partner) … ,” two
separate questions were actually asked in the survey. In addition, question about the number of times the respondent participated in an art form were asked separately from the primary question about whether the respondent participated at all.
Core Questions: Participation via AttendanceThis month we are asking additional questions concerning public participation in the arts. The following questions are about your (and your spouse/partners’)activitiesduringthelast12months between May (current day), 2007 and May (current day), 2008.
1. [With the exception of elementary or high schoolperformances]Didyou(oryourspouse/partner) go to a live jazz performance during the last 12 months? If yes, how many times did you (oryourspouse/partner)dothisduringthelast12months?
2. [With the exception of elementary or high schoolperformances]Didyou(oryourspouse/partner) go to a live Latin, Spanish, or Salsa music performance during the last 12 months? If yes, howmanytimesdidyou(oryourspouse/partner)do this during the last 12 months?
3. [With the exception of elementary or high schoolperformances]Didyou(oryourspouse/partner) go to a live classical music performance such as symphony, chamber, or choral music during the last 12 months? If yes, how many times didyou(oryourspouse/partner)dothisduringthelast 12 months?
4. [With the exception of elementary or high schoolperformances]Didyou(oryourspouse/partner) go to a live opera during the last 12 months?* If yes, how many times did you (or yourspouse/partner)dothisduringthelast12months?*
5. [With the exception of elementary or high schoolperformances]Didyou(oryourspouse/partner) go to a live musical stage play during the last 12 months? If yes, how many times did you (oryourspouse/partner)dothisduringthelast12months?
6. [With the exception of elementary or high schoolperformances]Didyou(oryourspouse/partner) go to a live performance of a non-musical stage play during the last 12 months? If yes, how manytimesdidyou(oryourspouse/partner)dothis during the last 12 months?
7. [With the exception of elementary or high schoolperformances]Didyou(oryourspouse/partner) go to a live ballet performance during the last 12 months? If yes, how many times did you (oryourspouse/partner)dothisduringthelast12months?
8. [With the exception of elementary or high schoolperformances]Didyou(oryourspouse/partner) go to a live dance performance other than ballet, such as modern, folk, tap or Broadway
National Endowment for the Arts • Audience 2.0: How Technology Influences Arts Participation 123
style during the last 12 months? If yes, how many timesdidyou(oryourspouse/partner)dothisduring the last 12 months?
9. [During the last 12 months] Did you (or your spouse/partner)visitanartmuseumorgallery?Ifyes,howmanytimesdidyou(oryourspouse/partner) do this during the last 12 months?
10a. [During the last 12 months] Did you (or your spouse/partner)visitacraftsfairoravisualartsfestival?
10b. [During the last 12 months] Did you (or your spouse/partner)visitanoutdoorfestivalthatfeatured performing artists?*
11. [During the last 12 months] Did you (or your spouse/partner)visitahistoricparkormonument,or tour buildings or neighborhoods for their historic or design value?
12. With the exception of books required for work orschool,didyou(oryourspouse/partner)readany books during the last 12 months? About how manybooksdidyou(oryourspouse/partner)readduring the last 12 months?
13. During the last 12 months did you (or your spouse/partner)readany:• Novelsorshortstories?• Poetry?• Plays?
Module A: Additional Reading Questions and Music Preferencea1a. During the last 12 months, with the exception of required reading for work or school, did you read any articles, essays, or blogs either on the Internet or downloaded from the Internet?*
a1b. During the last 12 months, with the exception of required reading for work or school, did you read any novels, short stories, or poetry either on the Internet or downloaded from the Internet?*
a2. During the last 12 months, did you listen to any novels, short stories, or poetry, either live or recorded?
a3. Please tell me if you like to read each of the following. Do you like to read (* All questions below were new):• Mysteries?• Thillers?• Romance?• ScienceFictionorFantasy?• OtherFiction?• Health,Fitness,orSelf-Improvementbooks?• ReligioustextsorbooksaboutReligionor
Spirituality?• HistoryorPoliticalbooks?• BiographiesorMemoirs?• OtherNon-Fiction?• AnythingElseIhavenotmentioned?
a4. For each type of music I read, please tell me if you like to listen to it. Do you like to listen to:• ClassicalorChamberMusic?• Opera?• BroadwaymusicalsorShowtunes?• Jazz?• ClassicRockorOldies?• ContemporaryRock?*• RaporHip-hop?• BluesorRhythmandBlues?• Latin,SpanishorSalsa?*• Country?• Bluegrass?• FolkMusic?
National Endowment for the Arts • Audience 2.0: How Technology Influences Arts Participation124
• HymnsorGospelMusic?• AnythingElseIhavenotmentioned?
a5. Of those music types that you mention listening to, which do you like best? • ClassicalorChamberMusic?• Opera?• BroadwaymusicalsorShowtunes?• Jazz?• ClassicRockorOldies?• ContemporaryRock?*• RaporHip-hop?• BluesorRhythmandBlues?• Latin,SpanishorSalsa?*• Country?• Bluegrass?• FolkMusic?• HymnsorGospelMusic?• Other?
Module B: Participation via Internet and Other Mediab1a. During the last 12 months, did you use the Internet?
b1b. How often did you usually access the Internet?*
b2. During the last 12 months, did you use the Internet to watch, listen to, or download live or recorded music, theater or dance performances? Is this something that you usually do?
b3. During the last 12 months, did you use the Internet to view visual art online, such as paintings, sculpture, or photography? Is this something that you usually do?
b4. During the last 12 months, did you use the Internet to obtain information about music, theater or dance performances or art exhibits including purchasing tickets online?* Is this something that you usually do?*
b5. During the last 12 months, did you use the Internet to create or post your own art online including design, music, photography, films, video, or creative writing?* Is this something that you usually do?*
b6. During the last 12 months did you watch or listen to any recorded or live broadcasted arts performances on your television, radio, or on your computer, including watching or listening on portable media devices such as an iPod, cell phone, or portable DVD player? Arts performances include:• Jazz?• Latin,Spanish,orSalsamusic?*• Classicalmusic?• Opera?• Musicalstageplay?• Non-musicalstageplay(withtheexception
of movies, sitcoms, or TV series)?• Ballet,modern,folk,tap,orBroadwaystyle
dance performances (with the exception of music videos)?
• Aprogramaboutartists,artworks,orartmuseums?
• Aprogramaboutbooksorwriters?*
Module C: Leisure Activitiesc1. Approximately, how many hours of television doyou(oryourspouse/partner)watchonanaverage day?
c2. During the last 12 months, did you (or your spouse/partner)goouttothemovies?
National Endowment for the Arts • Audience 2.0: How Technology Influences Arts Participation 125
c3. During the last 12 months, did you (or yourspouse/partner)attendanelementary,middle, or high school music, theater, or dance performance?*
c4. During the last 12 months, did you (or your spouse/partner)attendatheatreordanceperformance at a church, synagogue or other religious institution?*
c5. With the exception of youth sports, did you(oryourspouse/partner)gotoanyamateur or professional sports events during the last 12 months?
c6. During the last 12 months, did you (or yourspouse/partner)jog,liftweights,walk,orparticipate in any other exercise program?
c7. During the last 12 months, did you (or your spouse/partner)participateinanysportsactivity,such as softball, basketball, golf, bowling, skiing, or tennis?
c8. During the last 12 months, did you (or your spouse/partner)participateinanyoutdooractivities, such as camping, hiking, or canoeing?
c9. During the last 12 months, did you (or your spouse/partner)workwithindoorplantsordoanygardening for pleasure?
c10. During the last 12 months, did you (or your spouse/partner)workwithpottery,ceramics,jewelry, or do any leatherwork or metalwork?
c11. During the last 12 months, did you (or your spouse/partner)doanyweaving,crocheting,quilting, needlepoint, or sewing?
c12. During the last 12 months, did you (or your spouse/partner)makephotographs,movies,orvideo tapes as an artistic activity?
c13. During the last 12 months, did you (or yourspouse/partner)doanypainting,drawing,sculpture, or printmaking activities?
c14. With the exception of work or school, did you (oryourspouse/partner)doanycreativewritingsuch as stories, poems, or plays during the last 12 months?
c15.Doyou(oryourspouse/partner)ownanyoriginal pieces of art, such as paintings, drawings, sculpture, prints, or lithographs? Did you (or your spouse/partner)purchaseoracquireanyofthesepieces during the last 12 months?
c16a. During the last 12 months, did you (or your spouse/partner)playamusicalinstrument?*
c16b. During the last 12 months, did you (or your spouse/partner)performorrehearseanyjazzmusic?
c16c. During the last 12 months, did you (or your spouse/partner)performorrehearseanyclassicalmusic?
c17. During the last 12 months, did you (or your spouse/partner)singanymusicfromanopera?
c18. During the last 12 months, did you (or your spouse/partner)singoractinamusicalplay?
c19. During the last 12 months, did you (or your spouse/partner)actinanon-musicalplay?
c20. During the last 12 months, did you (or your spouse/partner)singwithachorale,choir,orgleeclub or other type of vocal group?
c21. During the last 12 months, did you (or your spouse/partner)danceballet,orotherdancesuchas modern, folk, tap, or Broadway style dance?
c25. During the last 12 months, did you (or your spouse/partner)participateinanycommunityactivities, meetings, or events?*
National Endowment for the Arts • Audience 2.0: How Technology Influences Arts Participation126
c26. During the last 12 months, did you (or your spouse/partner)doanyvolunteerorcharitywork?
c27. Didyou(oryourspouse/partner)voteinthelast 2004 presidential election?*
Module D: Arts Learningd1a. Have you ever taken lessons or classes in music — either voice training or playing an instrument?
d1b. If yes, did you take these lessons or classes when you were:• Achildunder18?• Anadult18orolder?• Orbothasanadultandchild?
d1c. Excluding lessons or classes offered in elementary or high school, were any of the music lessons or classes you took as a child private lessons?
d1d. Did you take any of these lessons or classes in the past year?
d2a. Have you ever taken lessons or classes in visual arts such as sculpture, painting, printmaking, graphic design, photography, or film making?
d2b. If yes, did you take these lessons or classes when you were:• Achildunder18?• Anadult18orolder?• Orbothasanadultandchild?
d2c. Excluding lessons or classes offered in elementary or high school, were any of the visual arts lessons or classes you took as a child private lessons?
d2d. Did you take any of these lessons or classes in the past year?
d3a. Have you ever taken lessons or classes in acting or theater?
d3b. If yes, did you take these lessons or classes when you were:• Achildunder18?• Anadult18orolder?• Orbothasanadultandchild?
d3c. Excluding lessons or classes offered in elementary or high school, were any of the acting lessons or classes you took as a child private lessons?
d3d. Did you take any of these lessons or classes in the past year?
d4a. Have you ever taken lessons or classes in dance including ballet, or other dance such as modern, folk, tap, or Broadway style?
d4b. If yes, did you take these lessons or classes when you were:• Achildunder18?• Anadult18orolder?• Orbothasanadultandchild?
d4c. Excluding lessons or classes offered in elementary or high school, were any of the dance lessons or classes you took as a child private lessons?
d4d. Did you take any of these lessons or classes in the past year?
d5a. Have you ever taken lessons or classes in creative writing?
d5b. If yes, did you take these lessons or classes when you were:• Achildunder18?• Anadult18orolder?• Orbothasanadultandchild?
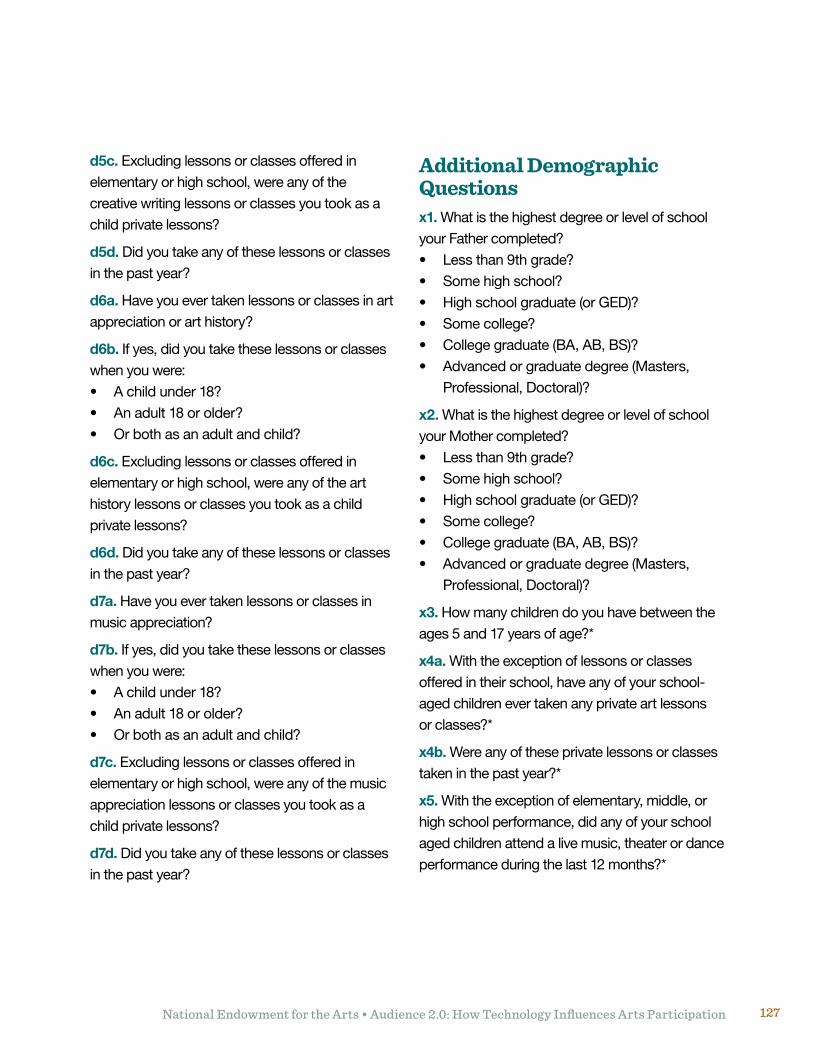
National Endowment for the Arts • Audience 2.0: How Technology Influences Arts Participation 127
d5c. Excluding lessons or classes offered in elementary or high school, were any of the creative writing lessons or classes you took as a child private lessons?
d5d. Did you take any of these lessons or classes in the past year?
d6a. Have you ever taken lessons or classes in art appreciation or art history?
d6b. If yes, did you take these lessons or classes when you were:• Achildunder18?• Anadult18orolder?• Orbothasanadultandchild?
d6c. Excluding lessons or classes offered in elementary or high school, were any of the art history lessons or classes you took as a child private lessons?
d6d. Did you take any of these lessons or classes in the past year?
d7a. Have you ever taken lessons or classes in music appreciation?
d7b. If yes, did you take these lessons or classes when you were:• Achildunder18?• Anadult18orolder?• Orbothasanadultandchild?
d7c. Excluding lessons or classes offered in elementary or high school, were any of the music appreciation lessons or classes you took as a child private lessons?
d7d. Did you take any of these lessons or classes in the past year?
Additional Demographic Questionsx1. What is the highest degree or level of school your Father completed?• Lessthan9thgrade?• Somehighschool?• Highschoolgraduate(orGED)?• Somecollege?• Collegegraduate(BA,AB,BS)?• Advancedorgraduatedegree(Masters,
Professional, Doctoral)?
x2. What is the highest degree or level of school your Mother completed?• Lessthan9thgrade?• Somehighschool?• Highschoolgraduate(orGED)?• Somecollege?• Collegegraduate(BA,AB,BS)?• Advancedorgraduatedegree(Masters,
Professional, Doctoral)?
x3. How many children do you have between the ages 5 and 17 years of age?*
x4a. With the exception of lessons or classes offered in their school, have any of your school-aged children ever taken any private art lessons or classes?*
x4b. Were any of these private lessons or classes taken in the past year?*
x5. With the exception of elementary, middle, or high school performance, did any of your school aged children attend a live music, theater or dance performance during the last 12 months?*
Technical Appendix
PBS has nearly 360 member stations across the country that broadcast programming on the arts, science, history, nature, and public affairs, reaching more than 110 million
people. It also reaches another 19 million people online, using its website as well as YouTube and iTunes to
disseminate material, such as this clip of the Great Performances series, the Broadway production
of Stephen Sondheim’s musical Company.

Appendix CTechnical Appendix
National Endowment for the Arts • Audience 2.0: How Technology Influences Arts Participation130
A ppendix C describes how 2008 SPPA data were used to compute arts participation rates and how relationships between those rates and other variables were examined. Appendix C details:
• Surveyquestionsonwhicheachrate was based;
• Definitionsofthenumeratorand denominator for each rate; and
• Statisticalmodelsusedtoassessrelationships between rates and demographic variables.
Survey QuestionsThe monograph includes information about arts participation rates in benchmark and other arts activities. Data from different survey questions were used to compute those rates.
Benchmark arts participation. Most analyses in the monograph examine participation in “benchmark” arts activities. Figure C-1 presents the survey questions on which measures of benchmark participation were based.
Rates of benchmark arts participation through electronic media were based on the eight questions presented in the top half of the figure, and rates of live attendance at benchmark arts events were based on the seven questions in the bottom half.
Other arts participation. Other analyses examined participation in art forms that are not considered to be benchmark arts activities, such as personal arts performance and arts creation. Some analyses examined participation in single arts activities. For example, the rate of media participation in Latin music was based on responses to question peb7:
During the last 12 months did you watch or listen to any recorded or live broadcasted Latin, Spanish, or Salsa music?
Figure C-2 shows the survey questions on which rates of arts participation in these other arts activities were based.
Questions from previous SPPAs. Appendix A includes analyses of trends in benchmark arts participation since 1982. Figure C-3 shows the 1982, 1992, and 2002 SPPA questions used to measure benchmark arts participation via media and live attendance.
Calculating ratesFigures C-4, C-5, and C-6 provide the following information about how each arts participation rate was computed in the monograph:
• Figure.Thefigureinwhichtheratesappear.
• Questionsetforsample.Thesetofquestionsfor which respondents must have provided a valid response (either “yes” or “no”) to be included in the sample.
• Numeratorquestionset.Thequestion(s)towhich respondents had to have responded “yes” to be considered as having engaged in that form of arts participation.
Figure C-4 presents definitions for the rates in Chapter 3; Figure C-5 presents definitions for the rates in Chapter 4; and Figure C-6 presents definitions for the rates in Appendix A.
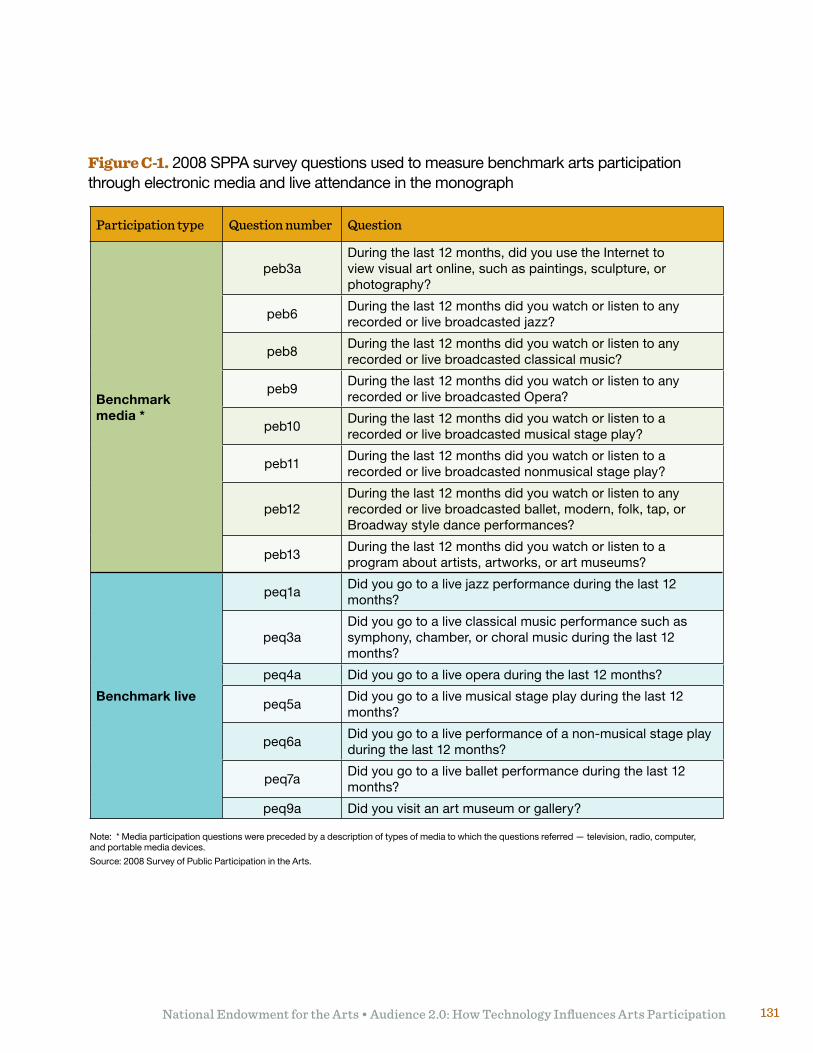
National Endowment for the Arts • Audience 2.0: How Technology Influences Arts Participation 131
Figure C-1. 2008 SPPA survey questions used to measure benchmark arts participation through electronic media and live attendance in the monograph
Participation type Question number Question
Benchmark media *
peb3aDuring the last 12 months, did you use the Internet to view visual art online, such as paintings, sculpture, or photography?
peb6During the last 12 months did you watch or listen to any recorded or live broadcasted jazz?
peb8During the last 12 months did you watch or listen to any recorded or live broadcasted classical music?
peb9During the last 12 months did you watch or listen to any recorded or live broadcasted Opera?
peb10During the last 12 months did you watch or listen to a recorded or live broadcasted musical stage play?
peb11During the last 12 months did you watch or listen to a recorded or live broadcasted nonmusical stage play?
peb12During the last 12 months did you watch or listen to any recorded or live broadcasted ballet, modern, folk, tap, or Broadway style dance performances?
peb13During the last 12 months did you watch or listen to a program about artists, artworks, or art museums?
Benchmark live
peq1aDid you go to a live jazz performance during the last 12 months?
peq3aDid you go to a live classical music performance such as symphony, chamber, or choral music during the last 12 months?
peq4a Did you go to a live opera during the last 12 months?
peq5aDid you go to a live musical stage play during the last 12 months?
peq6aDid you go to a live performance of a non-musical stage play during the last 12 months?
peq7aDid you go to a live ballet performance during the last 12 months?
peq9a Did you visit an art museum or gallery?
Note: * Media participation questions were preceded by a description of types of media to which the questions referred — television, radio, computer, and portable media devices.
Source: 2008 Survey of Public Participation in the Arts.
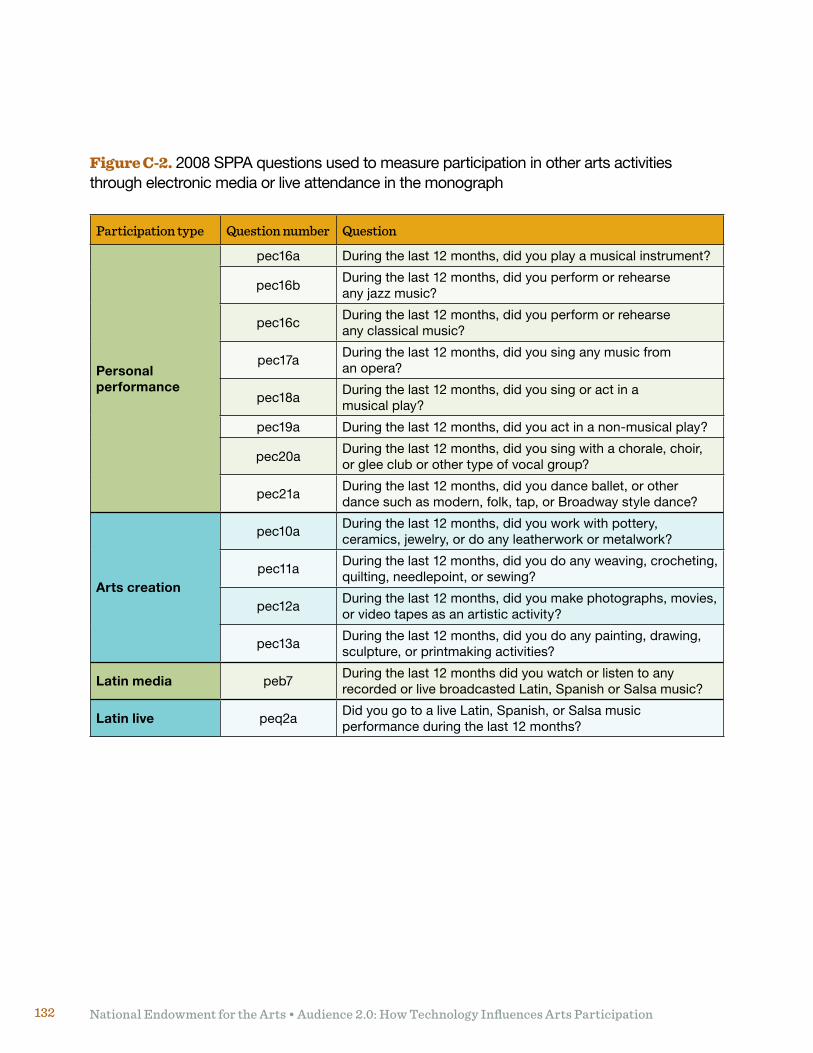
National Endowment for the Arts • Audience 2.0: How Technology Influences Arts Participation132
Figure C-2. 2008 SPPA questions used to measure participation in other arts activities through electronic media or live attendance in the monograph
Participation type Question number Question
Personal performance
pec16a During the last 12 months, did you play a musical instrument?
pec16bDuring the last 12 months, did you perform or rehearse any jazz music?
pec16cDuring the last 12 months, did you perform or rehearse any classical music?
pec17aDuring the last 12 months, did you sing any music from an opera?
pec18aDuring the last 12 months, did you sing or act in a musical play?
pec19a During the last 12 months, did you act in a non-musical play?
pec20aDuring the last 12 months, did you sing with a chorale, choir, or glee club or other type of vocal group?
pec21aDuring the last 12 months, did you dance ballet, or other dance such as modern, folk, tap, or Broadway style dance?
Arts creation
pec10aDuring the last 12 months, did you work with pottery, ceramics, jewelry, or do any leatherwork or metalwork?
pec11aDuring the last 12 months, did you do any weaving, crocheting, quilting, needlepoint, or sewing?
pec12aDuring the last 12 months, did you make photographs, movies, or video tapes as an artistic activity?
pec13aDuring the last 12 months, did you do any painting, drawing, sculpture, or printmaking activities?
Latin media peb7During the last 12 months did you watch or listen to any recorded or live broadcasted Latin, Spanish or Salsa music?
Latin live peq2aDid you go to a live Latin, Spanish, or Salsa music performance during the last 12 months?
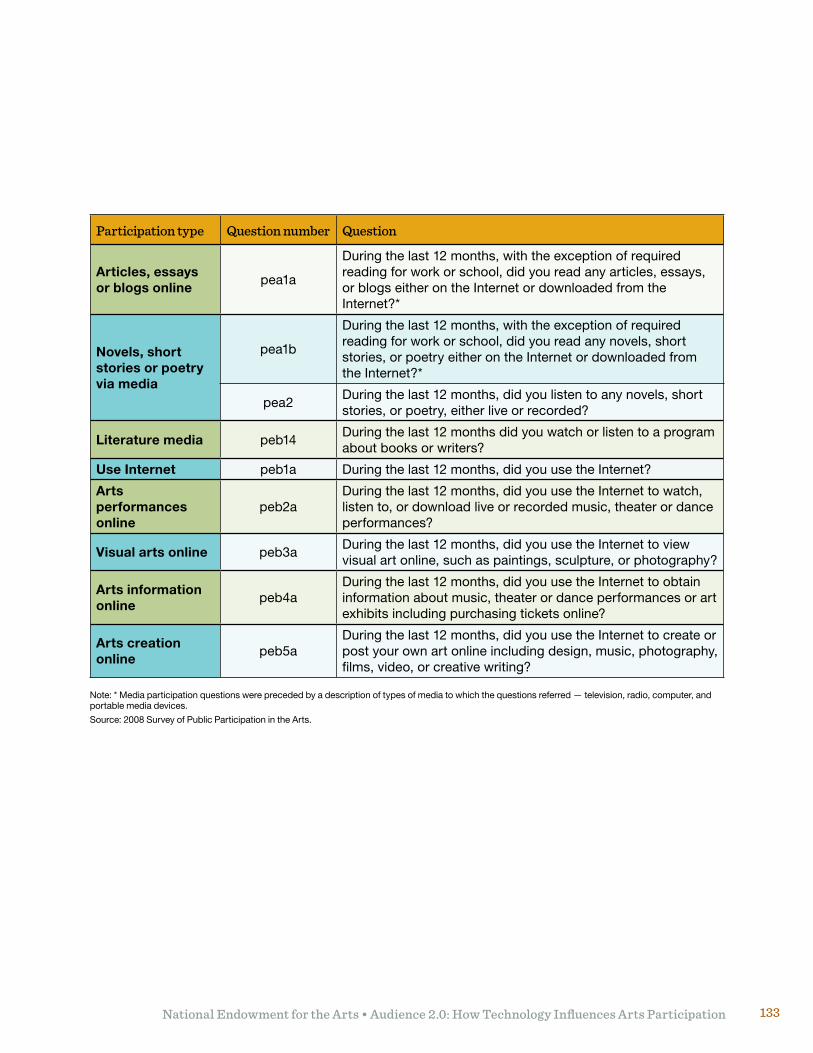
National Endowment for the Arts • Audience 2.0: How Technology Influences Arts Participation 133
Note: * Media participation questions were preceded by a description of types of media to which the questions referred — television, radio, computer, and portable media devices.
Source: 2008 Survey of Public Participation in the Arts.
Participation type Question number Question
Articles, essays or blogs online
pea1a
During the last 12 months, with the exception of required reading for work or school, did you read any articles, essays, or blogs either on the Internet or downloaded from the Internet?*
Novels, short stories or poetry via media
pea1b
During the last 12 months, with the exception of required reading for work or school, did you read any novels, short stories, or poetry either on the Internet or downloaded from the Internet?*
pea2During the last 12 months, did you listen to any novels, short stories, or poetry, either live or recorded?
Literature media peb14During the last 12 months did you watch or listen to a program about books or writers?
Use Internet peb1a During the last 12 months, did you use the Internet?
Arts performances online
peb2aDuring the last 12 months, did you use the Internet to watch, listen to, or download live or recorded music, theater or dance performances?
Visual arts online peb3aDuring the last 12 months, did you use the Internet to view visual art online, such as paintings, sculpture, or photography?
Arts information online
peb4aDuring the last 12 months, did you use the Internet to obtain information about music, theater or dance performances or art exhibits including purchasing tickets online?
Arts creation online
peb5aDuring the last 12 months, did you use the Internet to create or post your own art online including design, music, photography, films, video, or creative writing?
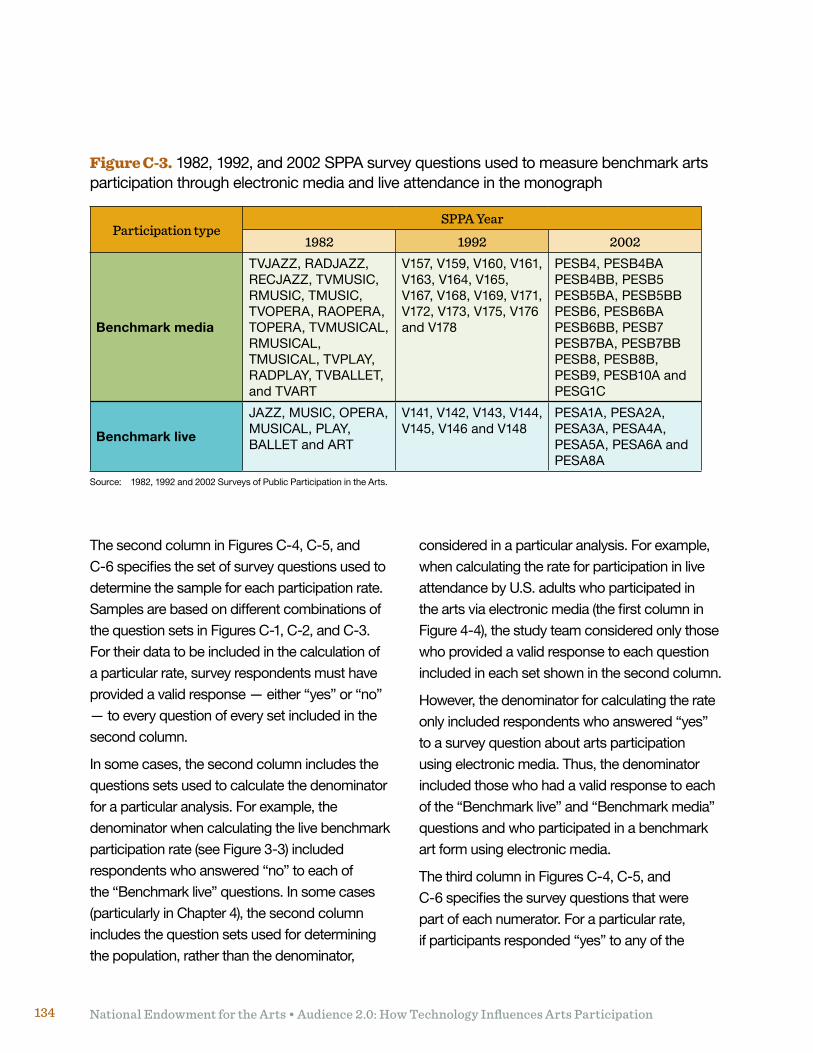
National Endowment for the Arts • Audience 2.0: How Technology Influences Arts Participation134
The second column in Figures C-4, C-5, and C-6 specifies the set of survey questions used to determine the sample for each participation rate. Samples are based on different combinations of the question sets in Figures C-1, C-2, and C-3. For their data to be included in the calculation of a particular rate, survey respondents must have provided a valid response — either “yes” or “no” — to every question of every set included in the second column.
In some cases, the second column includes the questions sets used to calculate the denominator for a particular analysis. For example, the denominator when calculating the live benchmark participation rate (see Figure 3-3) included respondents who answered “no” to each of the “Benchmark live” questions. In some cases (particularly in Chapter 4), the second column includes the question sets used for determining the population, rather than the denominator,
Figure C-3. 1982, 1992, and 2002 SPPA survey questions used to measure benchmark arts participation through electronic media and live attendance in the monograph
Source: 1982, 1992 and 2002 Surveys of Public Participation in the Arts.
Participation typeSPPA Year
1982 1992 2002
Benchmark media
TVJAZZ, RADJAZZ, RECJAZZ, TVMUSIC, RMUSIC, TMUSIC, TVOPERA, RAOPERA, TOPERA, TVMUSICAL, RMUSICAL, TMUSICAL, TVPLAY, RADPLAY, TVBALLET, and TVART
V157, V159, V160, V161, V163, V164, V165, V167, V168, V169, V171, V172, V173, V175, V176 and V178
PESB4, PESB4BA PESB4BB, PESB5 PESB5BA, PESB5BB PESB6, PESB6BA PESB6BB, PESB7 PESB7BA, PESB7BB PESB8, PESB8B, PESB9, PESB10A and PESG1C
Benchmark live
JAZZ, MUSIC, OPERA, MUSICAL, PLAY, BALLET and ART
V141, V142, V143, V144, V145, V146 and V148
PESA1A, PESA2A, PESA3A, PESA4A, PESA5A, PESA6A and PESA8A
considered in a particular analysis. For example, when calculating the rate for participation in live attendance by U.S. adults who participated in the arts via electronic media (the first column in Figure 4-4), the study team considered only those who provided a valid response to each question included in each set shown in the second column.
However, the denominator for calculating the rate only included respondents who answered “yes” to a survey question about arts participation using electronic media. Thus, the denominator included those who had a valid response to each of the “Benchmark live” and “Benchmark media” questions and who participated in a benchmark art form using electronic media.
The third column in Figures C-4, C-5, and C-6 specifies the survey questions that were part of each numerator. For a particular rate, if participants responded “yes” to any of the
National Endowment for the Arts • Audience 2.0: How Technology Influences Arts Participation 135
questions included in the numerator, they were counted as having engaged in that form of arts participation.
For example, for their data to be considered in the benchmark arts live attendance rate presented in Figure 3-2, participants must have provided a valid response to each of the questions included in the “benchmark live” question set (i.e., survey questions peq1a, peq3a, peq4a, peq5a, peq6a, peq7a and peq9a). If respondents answered “yes” to any of those survey questions, then their data were included in the numerator as having attended a benchmark arts event.
Statistical Model SpecificationsMultivariate regression models were used in Chapters 3 and 4 of the monograph to explore the statistical relationships among different arts participation rates and various demographic variables. Each analysis provided estimates of the relationships between an arts participation measure (the dependent variable) and each independent variable included in the model, while statistically controlling for all other independent variables.
Independent variables. Each regression model presented in the monograph included several independent variables from which the dependent variable was predicted. The independent variables used in the regression models were all “dummy” variables. That is, each independent variable was assigned a binary value for each participant to indicate the presence (value of “1”) or absence (value of “0”) of the variable.
For example, a regression model was used in Chapter 3 to predict arts media participation from various demographic variables (see Figure 3-5). Participants were assigned a series of binary values to indicate the presence or absence of various demographic characteristics before their data were entered into the model. Figure C-7 shows demographic values for a hypothetical survey respondent with the following characteristics:
• Male;
• Metropolitan-arearesident;
• Other-raceadult;
• Betweentheagesof25and34;
• Attendedgraduateschool;and
• Hasanincomebetween$50,000and$75,000.
For independent variables with two levels (e.g., gender and location), the level arbitrarily assigned a value of “0” served as the “reference level” against which the model coefficient of the other level was compared. For independent variables withmorethantwolevels(e.g.,race/ethnicityandage), each level was coded separately for each participant, and one level was excluded from the model to serve as the reference level. For example, an other-race adult was coded as “1” for other-race, “0” for African American, and “0” for Hispanic. Non-Hispanic white was left out of the model as the reference level.
Figure C-8 presents the reference level that was used for each demographic category.
Model types. Two types of regression models were used in the monograph depending on characteristics of the dependent variable.
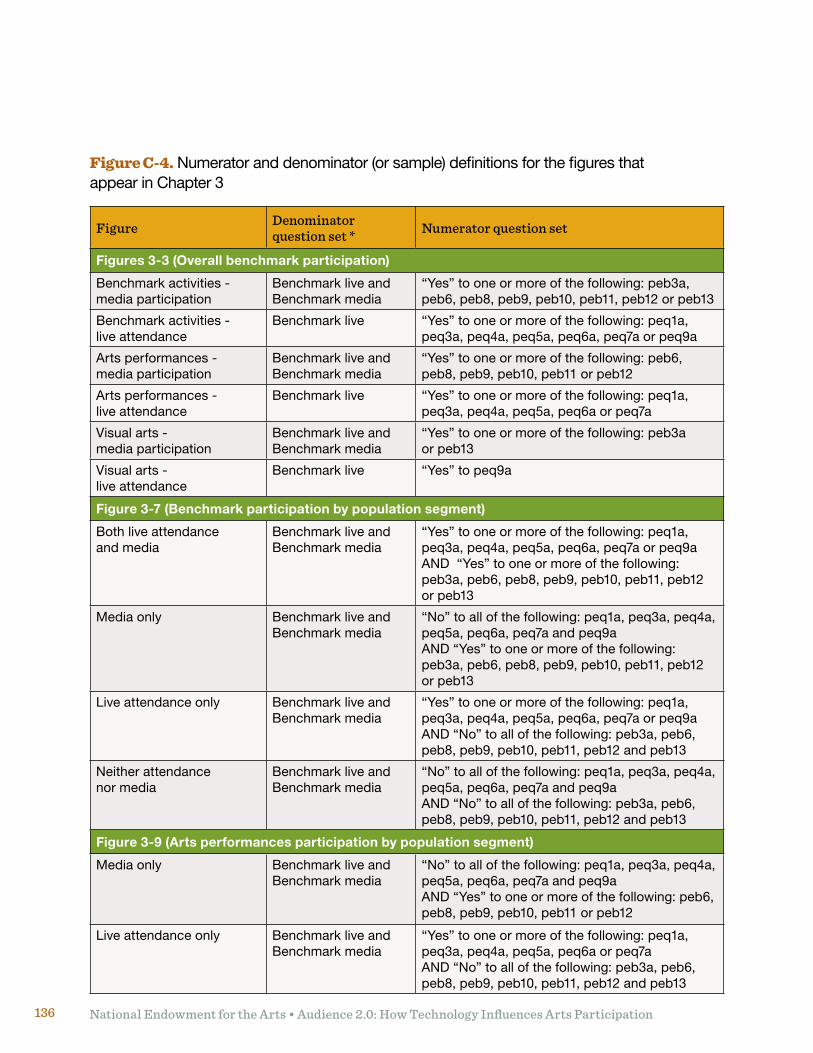
National Endowment for the Arts • Audience 2.0: How Technology Influences Arts Participation136
Figure Denominator question set * Numerator question set
Figures 3-3 (Overall benchmark participation)
Benchmark activities - media participation
Benchmark live and Benchmark media
“Yes” to one or more of the following: peb3a, peb6, peb8, peb9, peb10, peb11, peb12 or peb13
Benchmark activities - live attendance
Benchmark live “Yes” to one or more of the following: peq1a, peq3a, peq4a, peq5a, peq6a, peq7a or peq9a
Arts performances - media participation
Benchmark live and Benchmark media
“Yes” to one or more of the following: peb6, peb8, peb9, peb10, peb11 or peb12
Arts performances - live attendance
Benchmark live “Yes” to one or more of the following: peq1a, peq3a, peq4a, peq5a, peq6a or peq7a
Visual arts - media participation
Benchmark live and Benchmark media
“Yes” to one or more of the following: peb3a or peb13
Visual arts - live attendance
Benchmark live “Yes” to peq9a
Figure 3-7 (Benchmark participation by population segment)
Both live attendance and media
Benchmark live and Benchmark media
“Yes” to one or more of the following: peq1a, peq3a, peq4a, peq5a, peq6a, peq7a or peq9a AND “Yes” to one or more of the following: peb3a, peb6, peb8, peb9, peb10, peb11, peb12 or peb13
Media only Benchmark live and Benchmark media
“No” to all of the following: peq1a, peq3a, peq4a, peq5a, peq6a, peq7a and peq9a AND “Yes” to one or more of the following: peb3a, peb6, peb8, peb9, peb10, peb11, peb12 or peb13
Live attendance only Benchmark live and Benchmark media
“Yes” to one or more of the following: peq1a, peq3a, peq4a, peq5a, peq6a, peq7a or peq9a AND “No” to all of the following: peb3a, peb6, peb8, peb9, peb10, peb11, peb12 and peb13
Neither attendance nor media
Benchmark live and Benchmark media
“No” to all of the following: peq1a, peq3a, peq4a, peq5a, peq6a, peq7a and peq9a AND “No” to all of the following: peb3a, peb6, peb8, peb9, peb10, peb11, peb12 and peb13
Figure 3-9 (Arts performances participation by population segment)
Media only Benchmark live and Benchmark media
“No” to all of the following: peq1a, peq3a, peq4a, peq5a, peq6a, peq7a and peq9a AND “Yes” to one or more of the following: peb6, peb8, peb9, peb10, peb11 or peb12
Live attendance only Benchmark live and Benchmark media
“Yes” to one or more of the following: peq1a, peq3a, peq4a, peq5a, peq6a or peq7a AND “No” to all of the following: peb3a, peb6, peb8, peb9, peb10, peb11, peb12 and peb13
Figure C-4. Numerator and denominator (or sample) definitions for the figures that appear in Chapter 3
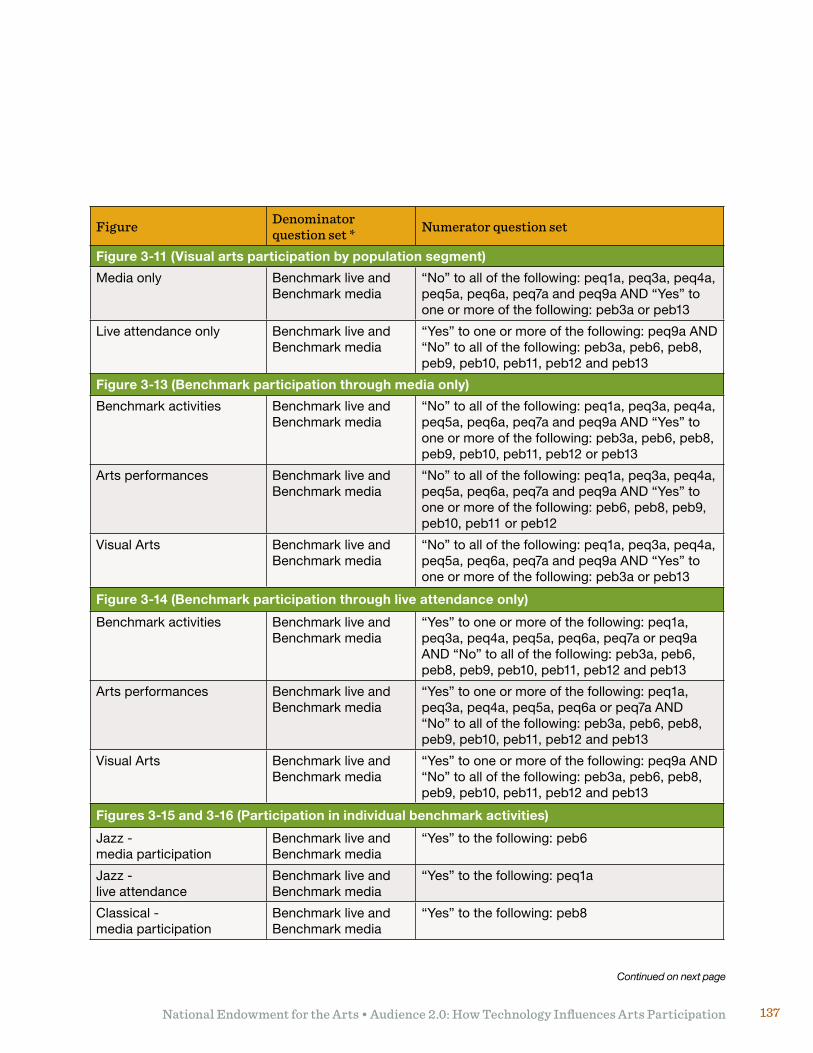
National Endowment for the Arts • Audience 2.0: How Technology Influences Arts Participation 137
Figure Denominator question set * Numerator question set
Figure 3-11 (Visual arts participation by population segment)
Media only Benchmark live and Benchmark media
“No” to all of the following: peq1a, peq3a, peq4a, peq5a, peq6a, peq7a and peq9a AND “Yes” to one or more of the following: peb3a or peb13
Live attendance only Benchmark live and Benchmark media
“Yes” to one or more of the following: peq9a AND “No” to all of the following: peb3a, peb6, peb8, peb9, peb10, peb11, peb12 and peb13
Figure 3-13 (Benchmark participation through media only)
Benchmark activities Benchmark live and Benchmark media
“No” to all of the following: peq1a, peq3a, peq4a, peq5a, peq6a, peq7a and peq9a AND “Yes” to one or more of the following: peb3a, peb6, peb8, peb9, peb10, peb11, peb12 or peb13
Arts performances Benchmark live and Benchmark media
“No” to all of the following: peq1a, peq3a, peq4a, peq5a, peq6a, peq7a and peq9a AND “Yes” to one or more of the following: peb6, peb8, peb9, peb10, peb11 or peb12
Visual Arts Benchmark live and Benchmark media
“No” to all of the following: peq1a, peq3a, peq4a, peq5a, peq6a, peq7a and peq9a AND “Yes” to one or more of the following: peb3a or peb13
Figure 3-14 (Benchmark participation through live attendance only)
Benchmark activities Benchmark live and Benchmark media
“Yes” to one or more of the following: peq1a, peq3a, peq4a, peq5a, peq6a, peq7a or peq9a AND “No” to all of the following: peb3a, peb6, peb8, peb9, peb10, peb11, peb12 and peb13
Arts performances Benchmark live and Benchmark media
“Yes” to one or more of the following: peq1a, peq3a, peq4a, peq5a, peq6a or peq7a AND “No” to all of the following: peb3a, peb6, peb8, peb9, peb10, peb11, peb12 and peb13
Visual Arts Benchmark live and Benchmark media
“Yes” to one or more of the following: peq9a AND “No” to all of the following: peb3a, peb6, peb8, peb9, peb10, peb11, peb12 and peb13
Figures 3-15 and 3-16 (Participation in individual benchmark activities)
Jazz - media participation
Benchmark live and Benchmark media
“Yes” to the following: peb6
Jazz - live attendance
Benchmark live and Benchmark media
“Yes” to the following: peq1a
Classical - media participation
Benchmark live and Benchmark media
“Yes” to the following: peb8
Continued on next page
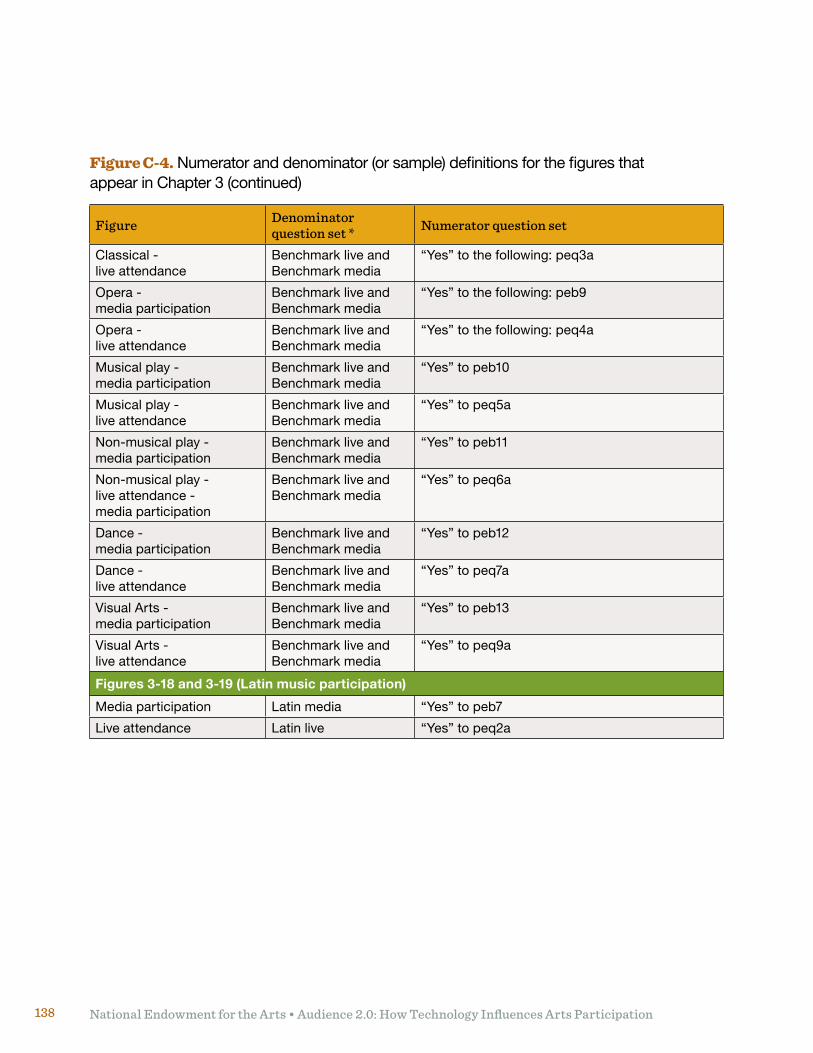
National Endowment for the Arts • Audience 2.0: How Technology Influences Arts Participation138
Figure Denominator question set * Numerator question set
Classical - live attendance
Benchmark live and Benchmark media
“Yes” to the following: peq3a
Opera - media participation
Benchmark live and Benchmark media
“Yes” to the following: peb9
Opera - live attendance
Benchmark live and Benchmark media
“Yes” to the following: peq4a
Musical play - media participation
Benchmark live and Benchmark media
“Yes” to peb10
Musical play - live attendance
Benchmark live and Benchmark media
“Yes” to peq5a
Non-musical play - media participation
Benchmark live and Benchmark media
“Yes” to peb11
Non-musical play - live attendance - media participation
Benchmark live and Benchmark media
“Yes” to peq6a
Dance - media participation
Benchmark live and Benchmark media
“Yes” to peb12
Dance - live attendance
Benchmark live and Benchmark media
“Yes” to peq7a
Visual Arts - media participation
Benchmark live and Benchmark media
“Yes” to peb13
Visual Arts - live attendance
Benchmark live and Benchmark media
“Yes” to peq9a
Figures 3-18 and 3-19 (Latin music participation)
Media participation Latin media “Yes” to peb7
Live attendance Latin live “Yes” to peq2a
Figure C-4. Numerator and denominator (or sample) definitions for the figures that appear in Chapter 3 (continued)
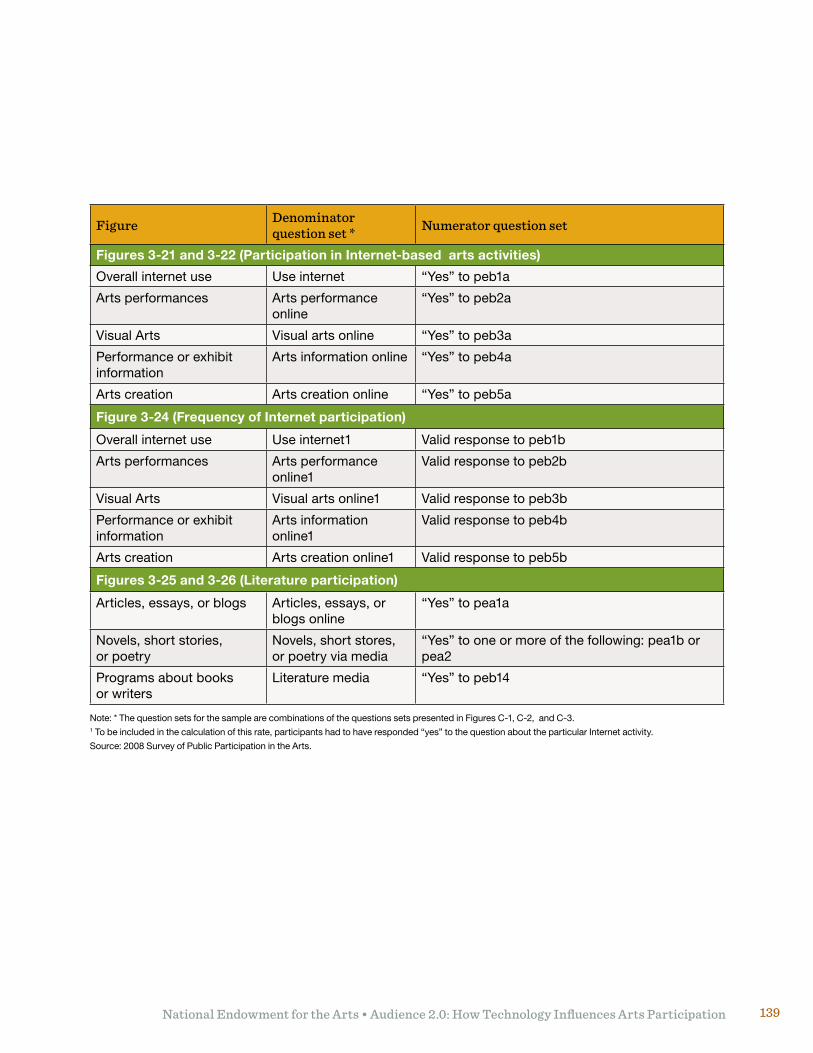
National Endowment for the Arts • Audience 2.0: How Technology Influences Arts Participation 139
Figure Denominator question set * Numerator question set
Figures 3-21 and 3-22 (Participation in Internet-based arts activities)
Overall internet use Use internet “Yes” to peb1a
Arts performances Arts performance online
“Yes” to peb2a
Visual Arts Visual arts online “Yes” to peb3a
Performance or exhibit information
Arts information online “Yes” to peb4a
Arts creation Arts creation online “Yes” to peb5a
Figure 3-24 (Frequency of Internet participation)
Overall internet use Use internet1 Valid response to peb1b
Arts performances Arts performance online1
Valid response to peb2b
Visual Arts Visual arts online1 Valid response to peb3b
Performance or exhibit information
Arts information online1
Valid response to peb4b
Arts creation Arts creation online1 Valid response to peb5b
Figures 3-25 and 3-26 (Literature participation)
Articles, essays, or blogs Articles, essays, or blogs online
“Yes” to pea1a
Novels, short stories, or poetry
Novels, short stores, or poetry via media
“Yes” to one or more of the following: pea1b or pea2
Programs about books or writers
Literature media “Yes” to peb14
Note: * The question sets for the sample are combinations of the questions sets presented in Figures C-1, C-2, and C-3.1 To be included in the calculation of this rate, participants had to have responded “yes” to the question about the particular Internet activity.
Source: 2008 Survey of Public Participation in the Arts.
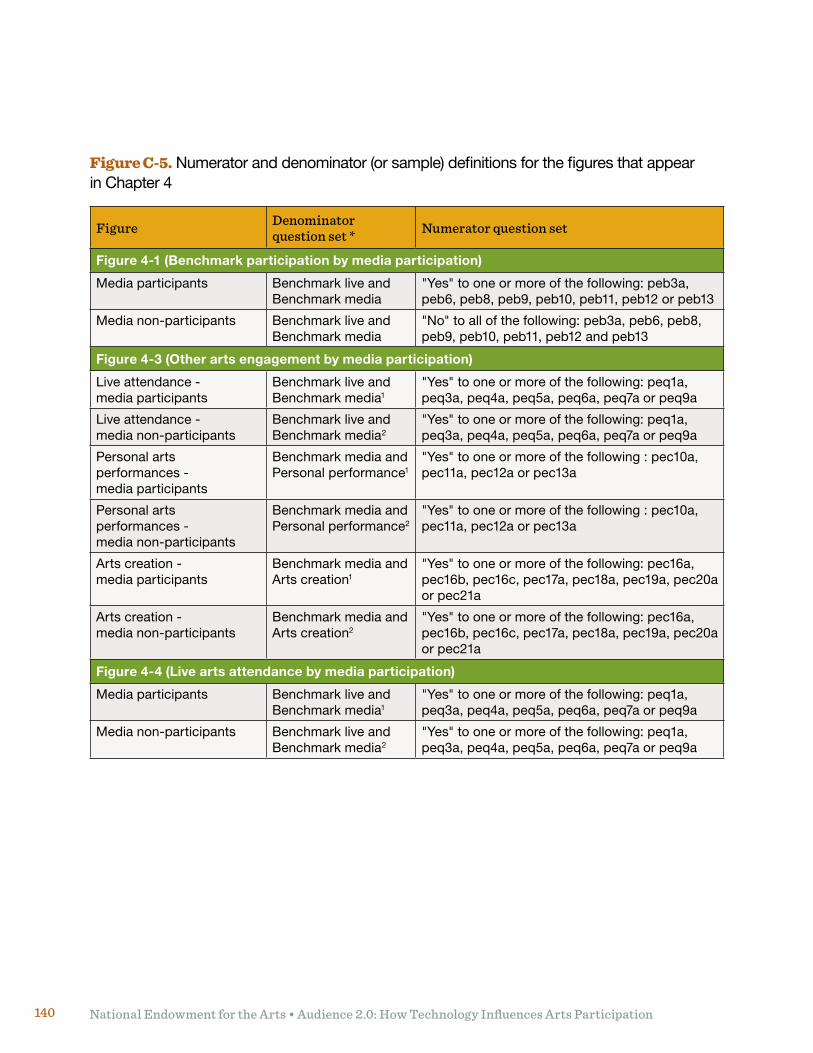
National Endowment for the Arts • Audience 2.0: How Technology Influences Arts Participation140
Figure C-5. Numerator and denominator (or sample) definitions for the figures that appear in Chapter 4
Figure Denominator question set * Numerator question set
Figure 4-1 (Benchmark participation by media participation)
Media participants Benchmark live and Benchmark media
"Yes" to one or more of the following: peb3a, peb6, peb8, peb9, peb10, peb11, peb12 or peb13
Media non-participants Benchmark live and Benchmark media
"No" to all of the following: peb3a, peb6, peb8, peb9, peb10, peb11, peb12 and peb13
Figure 4-3 (Other arts engagement by media participation)
Live attendance - media participants
Benchmark live and Benchmark media1
"Yes" to one or more of the following: peq1a, peq3a, peq4a, peq5a, peq6a, peq7a or peq9a
Live attendance - media non-participants
Benchmark live and Benchmark media2
"Yes" to one or more of the following: peq1a, peq3a, peq4a, peq5a, peq6a, peq7a or peq9a
Personal arts performances - media participants
Benchmark media and Personal performance1
"Yes" to one or more of the following : pec10a, pec11a, pec12a or pec13a
Personal arts performances - media non-participants
Benchmark media and Personal performance2
"Yes" to one or more of the following : pec10a, pec11a, pec12a or pec13a
Arts creation - media participants
Benchmark media and Arts creation1
"Yes" to one or more of the following: pec16a, pec16b, pec16c, pec17a, pec18a, pec19a, pec20a or pec21a
Arts creation - media non-participants
Benchmark media and Arts creation2
"Yes" to one or more of the following: pec16a, pec16b, pec16c, pec17a, pec18a, pec19a, pec20a or pec21a
Figure 4-4 (Live arts attendance by media participation)
Media participants Benchmark live and Benchmark media1
"Yes" to one or more of the following: peq1a, peq3a, peq4a, peq5a, peq6a, peq7a or peq9a
Media non-participants Benchmark live and Benchmark media2
"Yes" to one or more of the following: peq1a, peq3a, peq4a, peq5a, peq6a, peq7a or peq9a
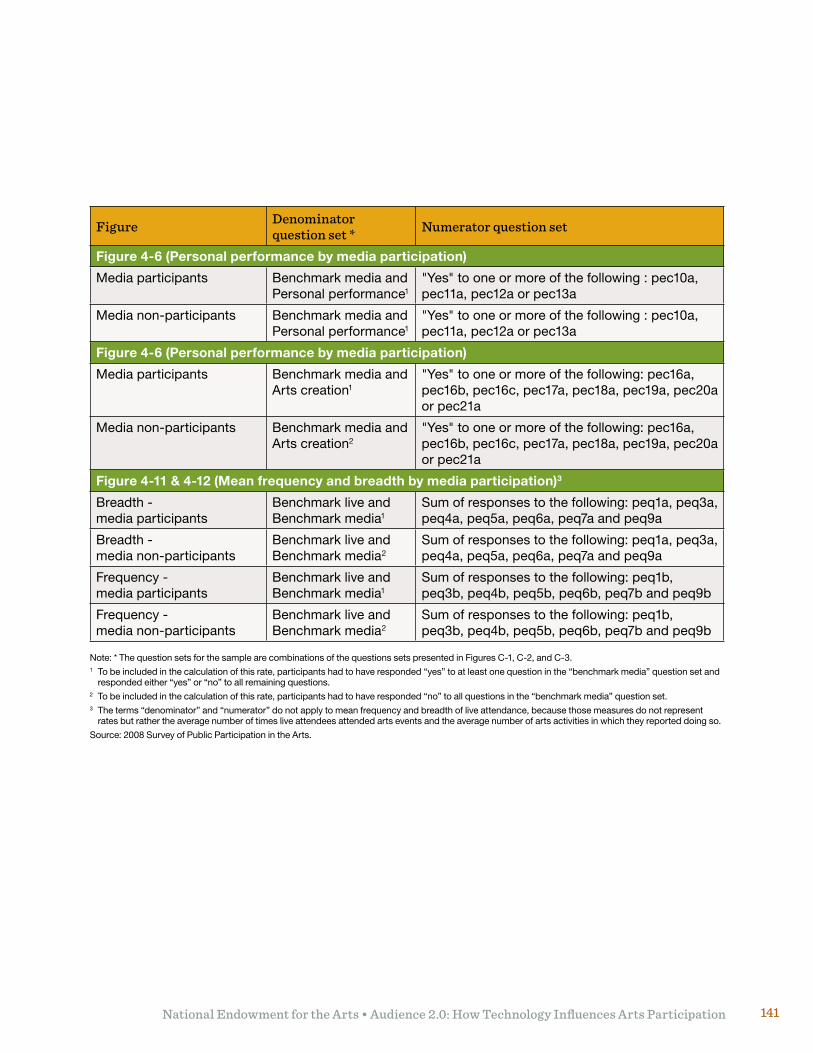
National Endowment for the Arts • Audience 2.0: How Technology Influences Arts Participation 141
Figure Denominator question set * Numerator question set
Figure 4-6 (Personal performance by media participation)
Media participants Benchmark media and Personal performance1
"Yes" to one or more of the following : pec10a, pec11a, pec12a or pec13a
Media non-participants Benchmark media and Personal performance1
"Yes" to one or more of the following : pec10a, pec11a, pec12a or pec13a
Figure 4-6 (Personal performance by media participation)
Media participants Benchmark media and Arts creation1
"Yes" to one or more of the following: pec16a, pec16b, pec16c, pec17a, pec18a, pec19a, pec20a or pec21a
Media non-participants Benchmark media and Arts creation2
"Yes" to one or more of the following: pec16a, pec16b, pec16c, pec17a, pec18a, pec19a, pec20a or pec21a
Figure 4-11 & 4-12 (Mean frequency and breadth by media participation)3
Breadth - media participants
Benchmark live and Benchmark media1
Sum of responses to the following: peq1a, peq3a, peq4a, peq5a, peq6a, peq7a and peq9a
Breadth - media non-participants
Benchmark live and Benchmark media2
Sum of responses to the following: peq1a, peq3a, peq4a, peq5a, peq6a, peq7a and peq9a
Frequency - media participants
Benchmark live and Benchmark media1
Sum of responses to the following: peq1b, peq3b, peq4b, peq5b, peq6b, peq7b and peq9b
Frequency - media non-participants
Benchmark live and Benchmark media2
Sum of responses to the following: peq1b, peq3b, peq4b, peq5b, peq6b, peq7b and peq9b
Note: * The question sets for the sample are combinations of the questions sets presented in Figures C-1, C-2, and C-3.1 To be included in the calculation of this rate, participants had to have responded “yes” to at least one question in the “benchmark media” question set and
responded either “yes” or “no” to all remaining questions.2 To be included in the calculation of this rate, participants had to have responded “no” to all questions in the “benchmark media” question set.3 The terms “denominator” and “numerator” do not apply to mean frequency and breadth of live attendance, because those measures do not represent
rates but rather the average number of times live attendees attended arts events and the average number of arts activities in which they reported doing so.
Source: 2008 Survey of Public Participation in the Arts.
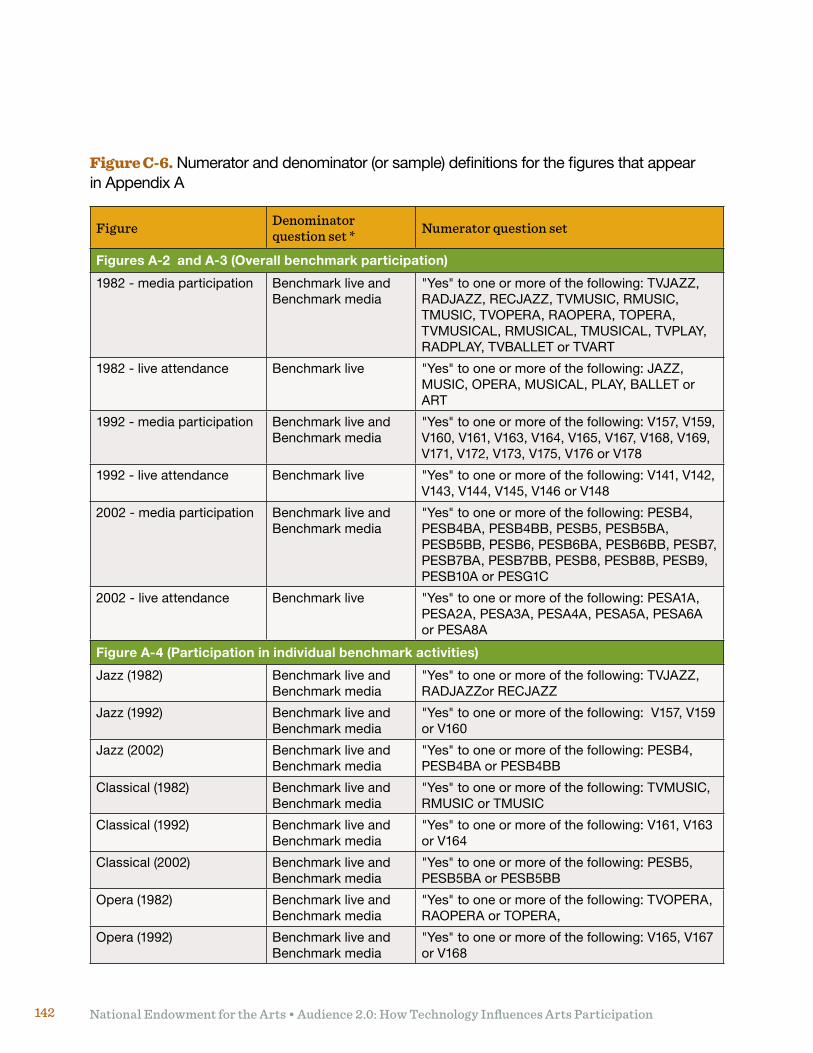
National Endowment for the Arts • Audience 2.0: How Technology Influences Arts Participation142
Figure C-6. Numerator and denominator (or sample) definitions for the figures that appear in Appendix A
Figure Denominator question set * Numerator question set
Figures A-2 and A-3 (Overall benchmark participation)
1982 - media participation Benchmark live and Benchmark media
"Yes" to one or more of the following: TVJAZZ, RADJAZZ, RECJAZZ, TVMUSIC, RMUSIC, TMUSIC, TVOPERA, RAOPERA, TOPERA, TVMUSICAL, RMUSICAL, TMUSICAL, TVPLAY, RADPLAY, TVBALLET or TVART
1982 - live attendance Benchmark live "Yes" to one or more of the following: JAZZ, MUSIC, OPERA, MUSICAL, PLAY, BALLET or ART
1992 - media participation Benchmark live and Benchmark media
"Yes" to one or more of the following: V157, V159, V160, V161, V163, V164, V165, V167, V168, V169, V171, V172, V173, V175, V176 or V178
1992 - live attendance Benchmark live "Yes" to one or more of the following: V141, V142, V143, V144, V145, V146 or V148
2002 - media participation Benchmark live and Benchmark media
"Yes" to one or more of the following: PESB4, PESB4BA, PESB4BB, PESB5, PESB5BA, PESB5BB, PESB6, PESB6BA, PESB6BB, PESB7, PESB7BA, PESB7BB, PESB8, PESB8B, PESB9, PESB10AorPESG1C
2002 - live attendance Benchmark live "Yes" to one or more of the following: PESA1A, PESA2A, PESA3A, PESA4A, PESA5A, PESA6A or PESA8A
Figure A-4 (Participation in individual benchmark activities)
Jazz (1982) Benchmark live and Benchmark media
"Yes" to one or more of the following: TVJAZZ, RADJAZZor RECJAZZ
Jazz (1992) Benchmark live and Benchmark media
"Yes" to one or more of the following: V157, V159 or V160
Jazz (2002) Benchmark live and Benchmark media
"Yes" to one or more of the following: PESB4, PESB4BA or PESB4BB
Classical (1982) Benchmark live and Benchmark media
"Yes" to one or more of the following: TVMUSIC, RMUSIC or TMUSIC
Classical (1992) Benchmark live and Benchmark media
"Yes" to one or more of the following: V161, V163 or V164
Classical (2002) Benchmark live and Benchmark media
"Yes" to one or more of the following: PESB5, PESB5BA or PESB5BB
Opera (1982) Benchmark live and Benchmark media
"Yes" to one or more of the following: TVOPERA, RAOPERA or TOPERA,
Opera (1992) Benchmark live and Benchmark media
"Yes" to one or more of the following: V165, V167 or V168
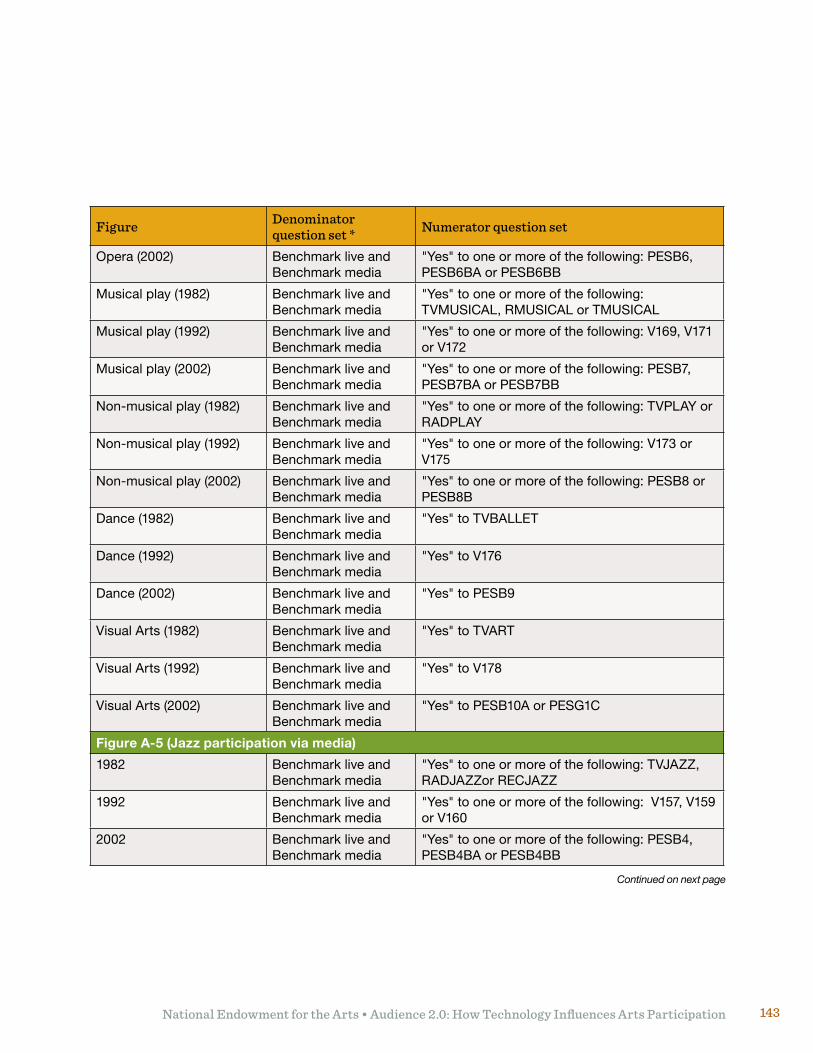
National Endowment for the Arts • Audience 2.0: How Technology Influences Arts Participation 143
Figure Denominator question set * Numerator question set
Opera (2002) Benchmark live and Benchmark media
"Yes" to one or more of the following: PESB6, PESB6BA or PESB6BB
Musical play (1982) Benchmark live and Benchmark media
"Yes" to one or more of the following: TVMUSICAL, RMUSICAL or TMUSICAL
Musical play (1992) Benchmark live and Benchmark media
"Yes" to one or more of the following: V169, V171 or V172
Musical play (2002) Benchmark live and Benchmark media
"Yes" to one or more of the following: PESB7, PESB7BA or PESB7BB
Non-musical play (1982) Benchmark live and Benchmark media
"Yes" to one or more of the following: TVPLAY or RADPLAY
Non-musical play (1992) Benchmark live and Benchmark media
"Yes" to one or more of the following: V173 or V175
Non-musical play (2002) Benchmark live and Benchmark media
"Yes" to one or more of the following: PESB8 or PESB8B
Dance (1982) Benchmark live and Benchmark media
"Yes" to TVBALLET
Dance (1992) Benchmark live and Benchmark media
"Yes" to V176
Dance (2002) Benchmark live and Benchmark media
"Yes" to PESB9
Visual Arts (1982) Benchmark live and Benchmark media
"Yes" to TVART
Visual Arts (1992) Benchmark live and Benchmark media
"Yes" to V178
Visual Arts (2002) Benchmark live and Benchmark media
"Yes"toPESB10AorPESG1C
Figure A-5 (Jazz participation via media)
1982 Benchmark live and Benchmark media
"Yes" to one or more of the following: TVJAZZ, RADJAZZor RECJAZZ
1992 Benchmark live and Benchmark media
"Yes" to one or more of the following: V157, V159 or V160
2002 Benchmark live and Benchmark media
"Yes" to one or more of the following: PESB4, PESB4BA or PESB4BB
Continued on next page
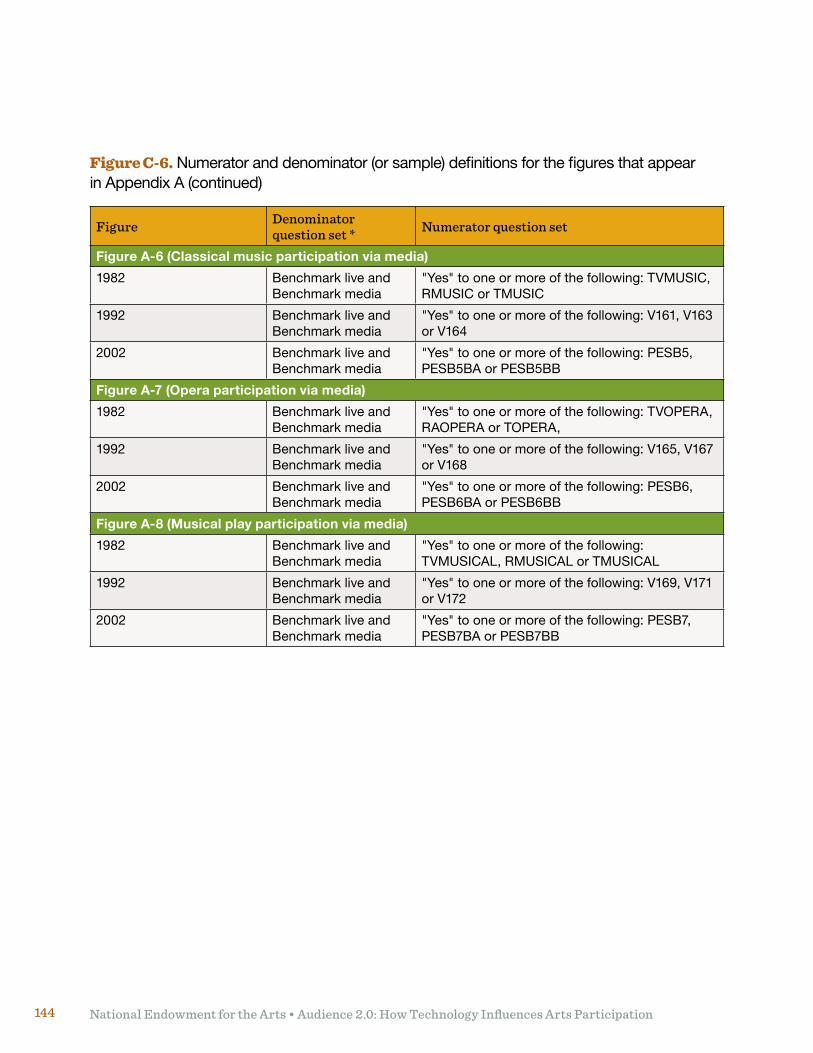
National Endowment for the Arts • Audience 2.0: How Technology Influences Arts Participation144
Figure Denominator question set * Numerator question set
Figure A-6 (Classical music participation via media)
1982 Benchmark live and Benchmark media
"Yes" to one or more of the following: TVMUSIC, RMUSIC or TMUSIC
1992 Benchmark live and Benchmark media
"Yes" to one or more of the following: V161, V163 or V164
2002 Benchmark live and Benchmark media
"Yes" to one or more of the following: PESB5, PESB5BA or PESB5BB
Figure A-7 (Opera participation via media)
1982 Benchmark live and Benchmark media
"Yes" to one or more of the following: TVOPERA, RAOPERA or TOPERA,
1992 Benchmark live and Benchmark media
"Yes" to one or more of the following: V165, V167 or V168
2002 Benchmark live and Benchmark media
"Yes" to one or more of the following: PESB6, PESB6BA or PESB6BB
Figure A-8 (Musical play participation via media)
1982 Benchmark live and Benchmark media
"Yes" to one or more of the following: TVMUSICAL, RMUSICAL or TMUSICAL
1992 Benchmark live and Benchmark media
"Yes" to one or more of the following: V169, V171 or V172
2002 Benchmark live and Benchmark media
"Yes" to one or more of the following: PESB7, PESB7BA or PESB7BB
Figure C-6. Numerator and denominator (or sample) definitions for the figures that appear in Appendix A (continued)
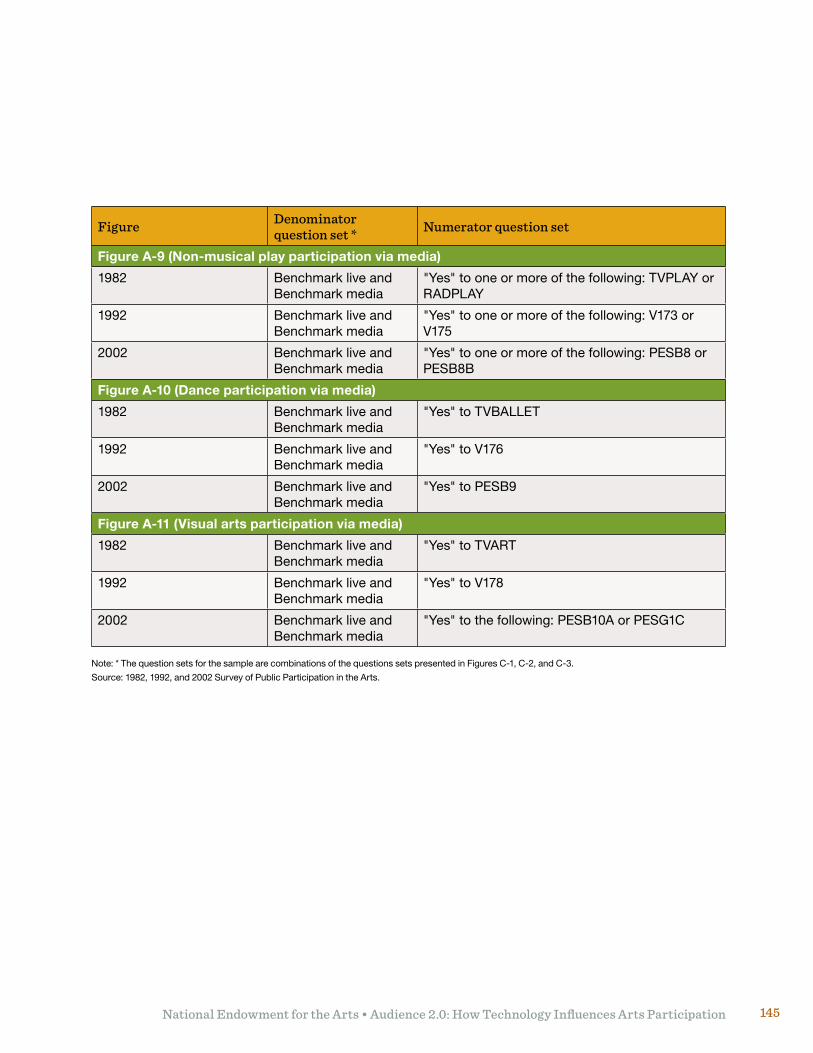
National Endowment for the Arts • Audience 2.0: How Technology Influences Arts Participation 145
Figure Denominator question set * Numerator question set
Figure A-9 (Non-musical play participation via media)
1982 Benchmark live and Benchmark media
"Yes" to one or more of the following: TVPLAY or RADPLAY
1992 Benchmark live and Benchmark media
"Yes" to one or more of the following: V173 or V175
2002 Benchmark live and Benchmark media
"Yes" to one or more of the following: PESB8 or PESB8B
Figure A-10 (Dance participation via media)
1982 Benchmark live and Benchmark media
"Yes" to TVBALLET
1992 Benchmark live and Benchmark media
"Yes" to V176
2002 Benchmark live and Benchmark media
"Yes" to PESB9
Figure A-11 (Visual arts participation via media)
1982 Benchmark live and Benchmark media
"Yes" to TVART
1992 Benchmark live and Benchmark media
"Yes" to V178
2002 Benchmark live and Benchmark media
"Yes"tothefollowing:PESB10AorPESG1C
Note: * The question sets for the sample are combinations of the questions sets presented in Figures C-1, C-2, and C-3.
Source: 1982, 1992, and 2002 Survey of Public Participation in the Arts.
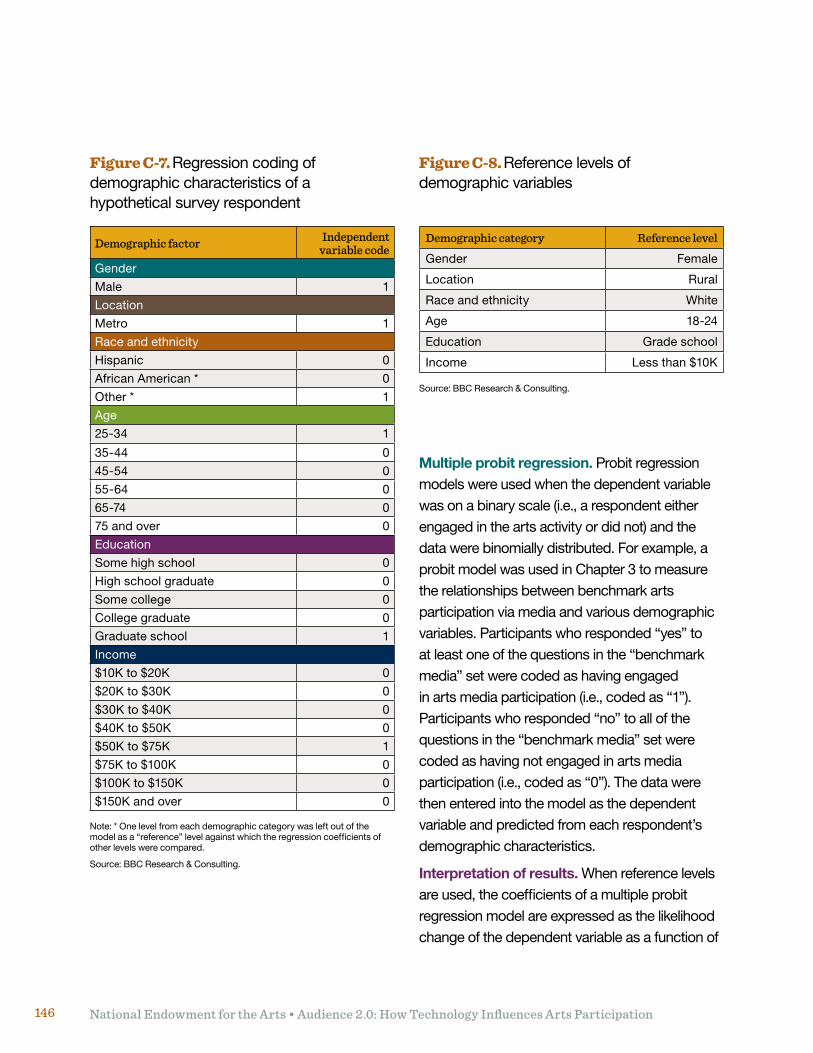
National Endowment for the Arts • Audience 2.0: How Technology Influences Arts Participation146
Multiple probit regression. Probit regression models were used when the dependent variable was on a binary scale (i.e., a respondent either engaged in the arts activity or did not) and the data were binomially distributed. For example, a probit model was used in Chapter 3 to measure the relationships between benchmark arts participation via media and various demographic variables. Participants who responded “yes” to at least one of the questions in the “benchmark media” set were coded as having engaged in arts media participation (i.e., coded as “1”). Participants who responded “no” to all of the questions in the “benchmark media” set were coded as having not engaged in arts media participation (i.e., coded as “0”). The data were then entered into the model as the dependent variable and predicted from each respondent’s demographic characteristics.
Interpretation of results. When reference levels are used, the coefficients of a multiple probit regression model are expressed as the likelihood change of the dependent variable as a function of
Figure C-7. Regression coding of demographic characteristics of a hypothetical survey respondent
Figure C-8. Reference levels of demographic variables
Demographic factor Independent variable code
Gender
Male 1
Location
Metro 1
Race and ethnicity
Hispanic 0
African American * 0
Other * 1
Age
25-34 1
35-44 0
45-54 0
55-64 0
65-74 0
75 and over 0
Education
Some high school 0
High school graduate 0
Some college 0
College graduate 0
Graduateschool 1
Income
$10K to $20K 0
$20K to $30K 0
$30K to $40K 0
$40K to $50K 0
$50K to $75K 1
$75K to $100K 0
$100K to $150K 0
$150K and over 0
Demographic category reference level
Gender Female
Location Rural
Race and ethnicity White
Age 18-24
Education Gradeschool
Income Less than $10K
Note: * One level from each demographic category was left out of the model as a “reference” level against which the regression coefficients of other levels were compared.
Source: BBC Research & Consulting.
Source: BBC Research & Consulting.
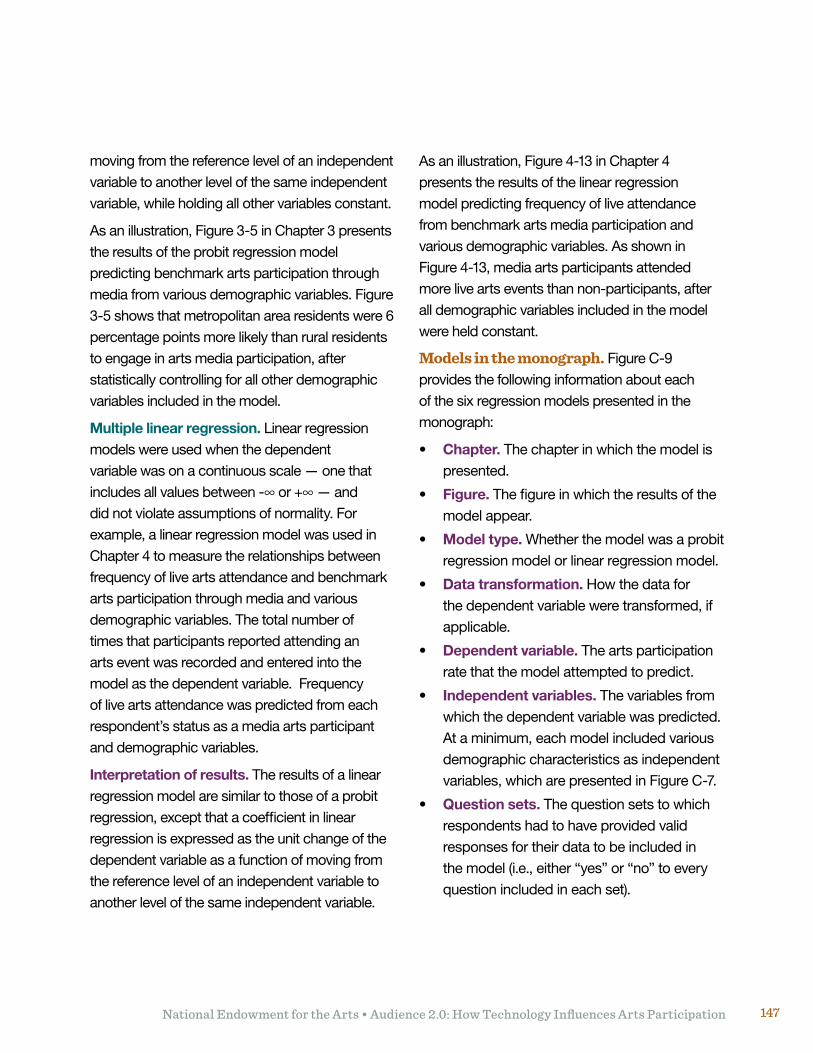
National Endowment for the Arts • Audience 2.0: How Technology Influences Arts Participation 147
moving from the reference level of an independent variable to another level of the same independent variable, while holding all other variables constant.
As an illustration, Figure 3-5 in Chapter 3 presents the results of the probit regression model predicting benchmark arts participation through media from various demographic variables. Figure 3-5 shows that metropolitan area residents were 6 percentage points more likely than rural residents to engage in arts media participation, after statistically controlling for all other demographic variables included in the model.
Multiple linear regression. Linear regression models were used when the dependent variable was on a continuous scale — one that includes all values between -∞ or +∞ — and did not violate assumptions of normality. For example, a linear regression model was used in Chapter 4 to measure the relationships between frequency of live arts attendance and benchmark arts participation through media and various demographic variables. The total number of times that participants reported attending an arts event was recorded and entered into the model as the dependent variable. Frequency of live arts attendance was predicted from each respondent’s status as a media arts participant and demographic variables.
Interpretation of results. The results of a linear regression model are similar to those of a probit regression, except that a coefficient in linear regression is expressed as the unit change of the dependent variable as a function of moving from the reference level of an independent variable to another level of the same independent variable.
As an illustration, Figure 4-13 in Chapter 4 presents the results of the linear regression model predicting frequency of live attendance from benchmark arts media participation and various demographic variables. As shown in Figure 4-13, media arts participants attended more live arts events than non-participants, after all demographic variables included in the model were held constant.
Models in the monograph. Figure C-9 provides the following information about each of the six regression models presented in the monograph:
• Chapter. The chapter in which the model is presented.
• Figure. The figure in which the results of the model appear.
• Model type. Whether the model was a probit regression model or linear regression model.
• Data transformation. How the data for the dependent variable were transformed, if applicable.
• Dependent variable. The arts participation rate that the model attempted to predict.
• Independent variables. The variables from which the dependent variable was predicted. At a minimum, each model included various demographic characteristics as independent variables, which are presented in Figure C-7.
• Question sets. The question sets to which respondents had to have provided valid responses for their data to be included in the model (i.e., either “yes” or “no” to every question included in each set).
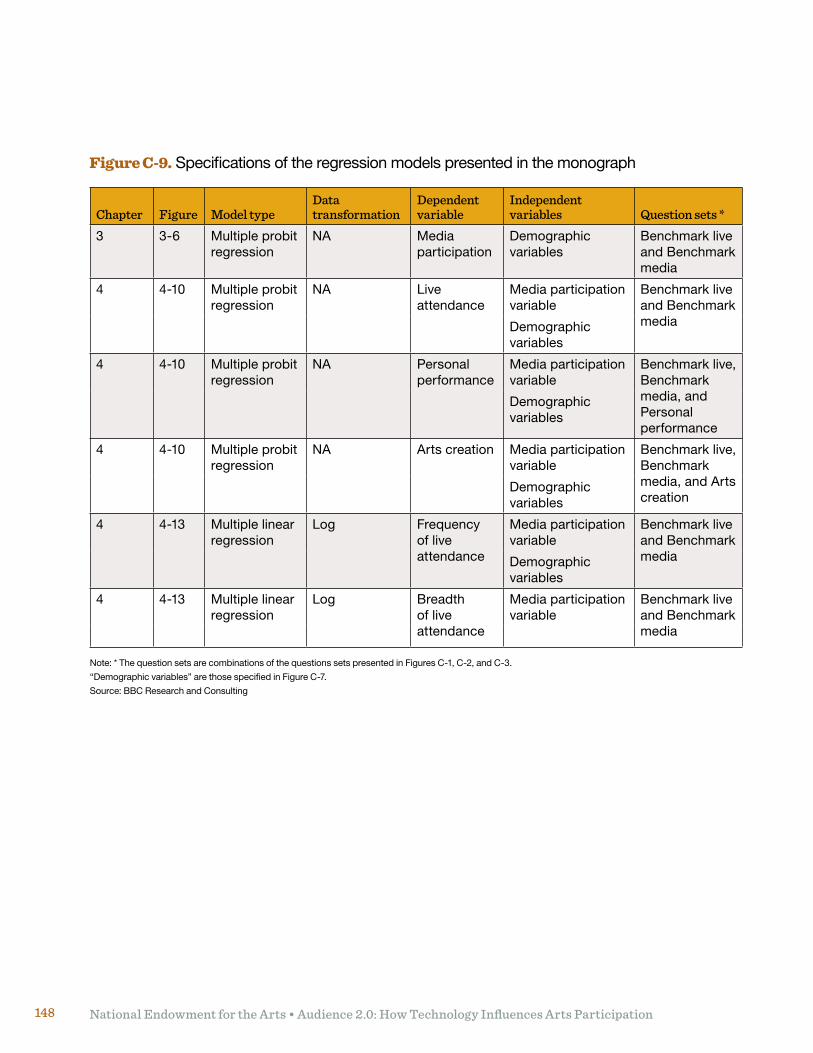
National Endowment for the Arts • Audience 2.0: How Technology Influences Arts Participation148
Figure C-9. Specifications of the regression models presented in the monograph
Chapter Figure Model typeData transformation
Dependent variable
Independent variables Question sets *
3 3-6 Multiple probit regression
NA Media participation
Demographic variables
Benchmark live and Benchmark media
4 4-10 Multiple probit regression
NA Live attendance
Media participation variable
Benchmark live and Benchmark mediaDemographic
variables
4 4-10 Multiple probit regression
NA Personal performance
Media participation variable
Benchmark live, Benchmark media, and Personal performance
Demographic variables
4 4-10 Multiple probit regression
NA Arts creation Media participation variable
Benchmark live, Benchmark media, and Arts creation
Demographic variables
4 4-13 Multiple linear regression
Log Frequency of live attendance
Media participation variable
Benchmark live and Benchmark mediaDemographic
variables
4 4-13 Multiple linear regression
Log Breadth of live attendance
Media participation variable
Benchmark live and Benchmark media
Note: * The question sets are combinations of the questions sets presented in Figures C-1, C-2, and C-3.
“Demographic variables” are those specified in Figure C-7.
Source: BBC Research and Consulting
National Endowment for the Arts • Audience 2.0: How Technology Influences Arts Participation 149
CreditsResearch Report #50
June 2010
National Endowment for the Arts 1100 Pennsylvania Avenue, NW Washington, DC 20506-0001 Telephone: 202-682-5400
Prepared for the Office of Research & Analysis by Sameer Bawa, Kevin Williams, and William Dong, BBC Research & Consulting, Denver, CO
Produced by the Office of Research & Analysis Sunil Iyengar, Director Tom Bradshaw, Senior Research Officer Bonnie Nichols, Research Analyst
Otherstaffcontributors:SarahSullivan,NonaMilstead,KelliRogowski,andEllenGrantham
Editorial and publication assistance by Don Ball
Designed by Fletcher Design, Washington, DC
Produced in the United States of America
202-682-5496Voice/TTY (a device for individuals who are deaf or hearing-impaired)
A downloadable PDF version of this report is available free of charge at www.arts.gov, the website of the National Endowment for the Arts.

1100 Pennsylvania Avenue, NW
Washington, DC 20506-0001
202/682-5400
www.arts.gov