
AUBURN WATER POLLUTION CONTROL PLANT TRIBUTARY COMMUNITY ... · AUBURN WATER POLLUTION CONTROL...
21
AUBURN WATER POLLUTION CONTROL PLANT TRIBUTARY COMMUNITY WET WEATHER FLOW STUDY Prepared For: CITY OF AUBURN 35 BRADLEY STREET AUBURN, NEW YORK 13021 JUNE 2011 REF. NO. 630811 (1) Prepared by: CRA Infrastructure & Engineering, Inc. 285 Delaware Avenue Suite 500 Buffalo, New York 14202 Office: (716) 856-2142 Fax: (716) 856-2160 web: http:\\www.CRAworld.com
Transcript of AUBURN WATER POLLUTION CONTROL PLANT TRIBUTARY COMMUNITY ... · AUBURN WATER POLLUTION CONTROL...

AUBURN WATER POLLUTION CONTROL PLANT
TRIBUTARY COMMUNITY WET WEATHER FLOW STUDY
Prepared For:
CITY OF AUBURN 35 BRADLEY STREET AUBURN, NEW YORK 13021
JUNE 2011 REF. NO. 630811 (1)
Prepared by: CRA Infrastructure & Engineering, Inc. 285 Delaware Avenue Suite 500 Buffalo, New York 14202
Office: (716) 856-2142 Fax: (716) 856-2160
web: http:\\www.CRAworld.com
630811 (1) CRA INFRASTRUCTURE & ENGINEERING, INC.
TABLE OF CONTENTS Page
1.0 INTRODUCTION ...................................................................................................................1 1.1 AUTHORIZATION.............................................................................................1 1.2 OBJECTIVES ........................................................................................................1 1.3 BACKGROUND ..................................................................................................2
2.0 METHODOLOGY...................................................................................................................5 2.1 EVALUATION AREA ........................................................................................5 2.2 FLOW MONITORING PROGRAM..................................................................6 2.3 DATA ANALYSIS PROCEDURES ...................................................................7
3.0 WET WEATHER FLOW ANALYSIS ...................................................................................9 3.1 FLOW MONITORING DATA...........................................................................9 3.2 FLOW MONITORING RESULTS/SUMMARY............................................10
4.0 SUMMARY ............................................................................................................................13
630811 (1) CRA INFRASTRUCTURE & ENGINEERING, INC.
LIST OF TABLES (Within Text)
Page TABLE 1 TRIBUTARY COMMUNITY SANITARY PIPELINE LENGTHS 2 TABLE 2 TRIBUTARY COMMUNITY INTERCONNECTIONS 6 METERING PLAN AND LOCATIONS TABLE 3 STORM EVENTS SUMMARY 9 TABLE 4 TRIBUTARY COMMUNITY COLLECTION SYSTEM 11 FLOW CONTRIBUTION TO AUBURN WPCP TABLE 5 SUMMARY OF RDII ANALYSIS 12
LIST OF FIGURES (Following Text)
FIGURE 1 INFILTRATION AND INFLOW SOURCES FIGURE 2 FLOW MONITORING AND TRIBUTARY CONNECTION LOCATIONS FIGURE 3 RAIN GAUGE AREAS FIGURE 4 METERED SUBSYSTEM AND RDII RATINGS
LIST OF APPENDICES APPENDIX A NEW YORK STATE DEPARTMENT OF ENVIRONMENTAL
CONSERVATION (NYS DEC) TIP NO. 26 APPENDIX B SUMMARY TABLE APPENDIX C SITE-SPECIFIC GRAPHS APPENDIX D SITE-SPECIFIC ANALYSIS TABLES

630811 (1) 1 CRA INFRASTRUCTURE & ENGINEERING, INC.
1.0 INTRODUCTION
1.1 AUTHORIZATION
In September 2010, the City of Auburn (City) retained CRA Infrastructure and
Engineering, Inc. (CRA) to conduct a Tributary Community Wet Weather Flow Study as
part of the feasibility of combining water and wastewater services currently provided by
the City and the Towns of Aurelius, Fleming, Owasco, Sennett, and Throop. This report
summarizes the objectives, methodology, and flow analysis of the tributary
communities.
1.2 OBJECTIVES
The key objectives of this wet weather flow study are to:
• Identify tributary community interconnection locations where sanitary wastewater
flows enter the City of Auburn's collection system and monitor flows during the
2010 Fall wet weather season.
• Determine the flow contributions from each community tributary connection to the
Auburn Water Pollution Control Plant (WPCP) during the study period.
• Estimate the rate of rainfall-derived infiltration and inflow (RDII) from each
community tributary connection, and identify if the RDII contribution is considered
excessive based on guidelines from Technical Information Pamphlet No. 26,
published by the New York State Department of Environmental Conservation
(DEC).
RDII is defined by the United States Environmental Protection Agency (USEPA) as the
portion of sewer flow in excess of the established normal dry-weather flow. The broad
definition of infiltration is water entering the sewer system through the ground, such as
cracked pipes, poor pipe joints, manholes, etc. Infiltration is influenced by groundwater
levels, as well as storm events when precipitation saturates the ground and pipe
trenches. Inflow is water entering the sewer system through direct openings such as
roof leaders, cross connections between a storm sewer and a sanitary sewer, yard drains,
manhole covers, etc. A typical representation of infiltration and inflow sources into a
sewer system is shown in Figure 1.
630811 (1) 2 CRA INFRASTRUCTURE & ENGINEERING, INC.
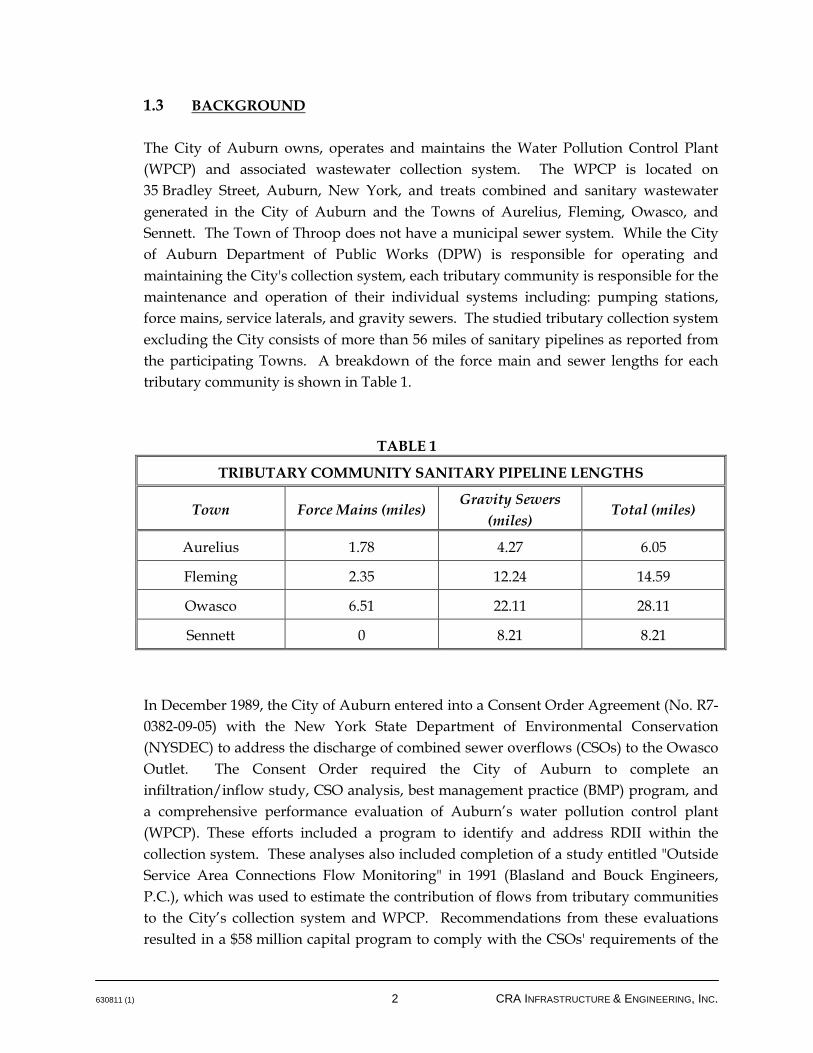
1.3 BACKGROUND
The City of Auburn owns, operates and maintains the Water Pollution Control Plant
(WPCP) and associated wastewater collection system. The WPCP is located on
35 Bradley Street, Auburn, New York, and treats combined and sanitary wastewater
generated in the City of Auburn and the Towns of Aurelius, Fleming, Owasco, and
Sennett. The Town of Throop does not have a municipal sewer system. While the City
of Auburn Department of Public Works (DPW) is responsible for operating and
maintaining the City's collection system, each tributary community is responsible for the
maintenance and operation of their individual systems including: pumping stations,
force mains, service laterals, and gravity sewers. The studied tributary collection system
excluding the City consists of more than 56 miles of sanitary pipelines as reported from
the participating Towns. A breakdown of the force main and sewer lengths for each
tributary community is shown in Table 1.
TABLE 1
TRIBUTARY COMMUNITY SANITARY PIPELINE LENGTHS
Town Force Mains (miles) Gravity Sewers
(miles) Total (miles)
Aurelius 1.78 4.27 6.05
Fleming 2.35 12.24 14.59
Owasco 6.51 22.11 28.11
Sennett 0 8.21 8.21
In December 1989, the City of Auburn entered into a Consent Order Agreement (No. R7-
0382-09-05) with the New York State Department of Environmental Conservation
(NYSDEC) to address the discharge of combined sewer overflows (CSOs) to the Owasco
Outlet. The Consent Order required the City of Auburn to complete an
infiltration/inflow study, CSO analysis, best management practice (BMP) program, and
a comprehensive performance evaluation of Auburn’s water pollution control plant
(WPCP). These efforts included a program to identify and address RDII within the
collection system. These analyses also included completion of a study entitled "Outside
Service Area Connections Flow Monitoring" in 1991 (Blasland and Bouck Engineers,
P.C.), which was used to estimate the contribution of flows from tributary communities
to the City’s collection system and WPCP. Recommendations from these evaluations
resulted in a $58 million capital program to comply with the CSOs' requirements of the

630811 (1) 3 CRA INFRASTRUCTURE & ENGINEERING, INC.
federal Clean Water Act and associated NYSDEC regulations. The capital program,
implemented over a 20-year period , included the following projects:
• A two-phased upgrade of the Auburn WPCP, including:
- New preliminary treatment facilities consisting of mechanical bar screens housed
in a new influent building, aerated grit channels, and new influent flow metering
- New primary treatment facilities, including new primary settling tanks and sludge
handling pumps, and rehabilitation of the existing settled sewage pumps and
controls
- A new overflow retention facility (ORF) utilizing the existing primary settling
tanks, with chlorination and dechlorination facilities, and flow metering
equipment for the ORF overflow
- Installing a new activated sludge system for secondary treatment, including tanks
and a blower building
- A new sludge handling system, including belt filter press and incinerator
- A new ultraviolet light (UV) disinfection system followed by a re-aeration system
to increase effluent dissolved oxygen concentrations
- New septage receiving facilities, including an enclosed septage receiving station,
mechanical septage screening, underground septage storage tank, and septage
handling
- Odor control facilities to treat ventilated air from influent building, screenings and
grit loading area, septage receiving station, and septage storage tank and belt filter
press room
• Construction of a 6.5-million gallon flow storage and timed release facility to allow for
capture of excess collection system flows and subsequent controlled release to the WPCP
after wet weather events.
• Construction of paralleling combined sewer mains to increase the conveyance capacities
of the North Owasco and South interceptors.
• Elimination of all but four CSO outlets. Construction of treatment facilities for the four
remaining CSOs.
• Implementing an infiltration/inflow reduction program.
• Initiation of a BMP program.

630811 (1) 4 CRA INFRASTRUCTURE & ENGINEERING, INC.
• Implementation of a catch basin and sewer main cleaning annual schedule.
These improvements have eliminated the discharge of all untreated sewage discharges to the Owasco Outlet.

630811 (1) 5 CRA INFRASTRUCTURE & ENGINEERING, INC.
2.0 METHODOLOGY
2.1 EVALUATION AREA
The evaluation area for this project comprises the collection systems of the four
tributary communities, which includes more than 56 miles of sewer of varying
size, material, and design. The studied tributary collection system covers more
than 26 square miles located in the towns of Aurelius, Sennett, Owasco, and
Fleming. A map of the evaluation area and associated tributary connections is
presented on Figure 2.
The initial steps of this project involved identifying locations to install temporary
flow meters and rain gauges, which form the basis of the flow analysis. Existing
collection system mapping, along with consultation from City of Auburn
operations staff, were used to develop a flow monitoring plan for significant
tributary interconnections. Meetings were also initiated with the City of Auburn
to identify challenges associated with installing flow monitoring equipment and
obtaining representative data.
Flow monitoring was conducted over a 3-month period at 14 of 19 tributary
interconnections. The flow monitoring plan was developed to maximize
coverage of the tributary connections within the available project budget. A list
of all tributary community interconnections, the connections that were
monitored, and the reasons for not monitoring at a specific interconnections are
summarized on Table 2. Of the four interconnections that were not monitored:
one was inactive, one was from an industrial source, one had a very small service
area, and the other was from a force main discharge that had no means for
connecting a flow meter. Flow meters were strategically located within the
sewers to best isolate these subsystems for evaluation. These flow meter
locations are shown on Figure 2.
During project kick-off, City staff noted that wet weather event intensity can
vary across the study area. Therefore, the City of Auburn service area was
broken down into three quadrants to reflect this variability and better represent
rainfall across the region. Precipitation was monitored using rain gauges
installed at three locations, as shown on Figure 3. One existing rain gauge at the
City of Auburn Water Treatment Plant (WTP) was used in conjunction with two
rain gauges installed at the DPW Garage, and the Grant Street Holding Tank
location.
630811 (1) 6 CRA INFRASTRUCTURE & ENGINEERING, INC.
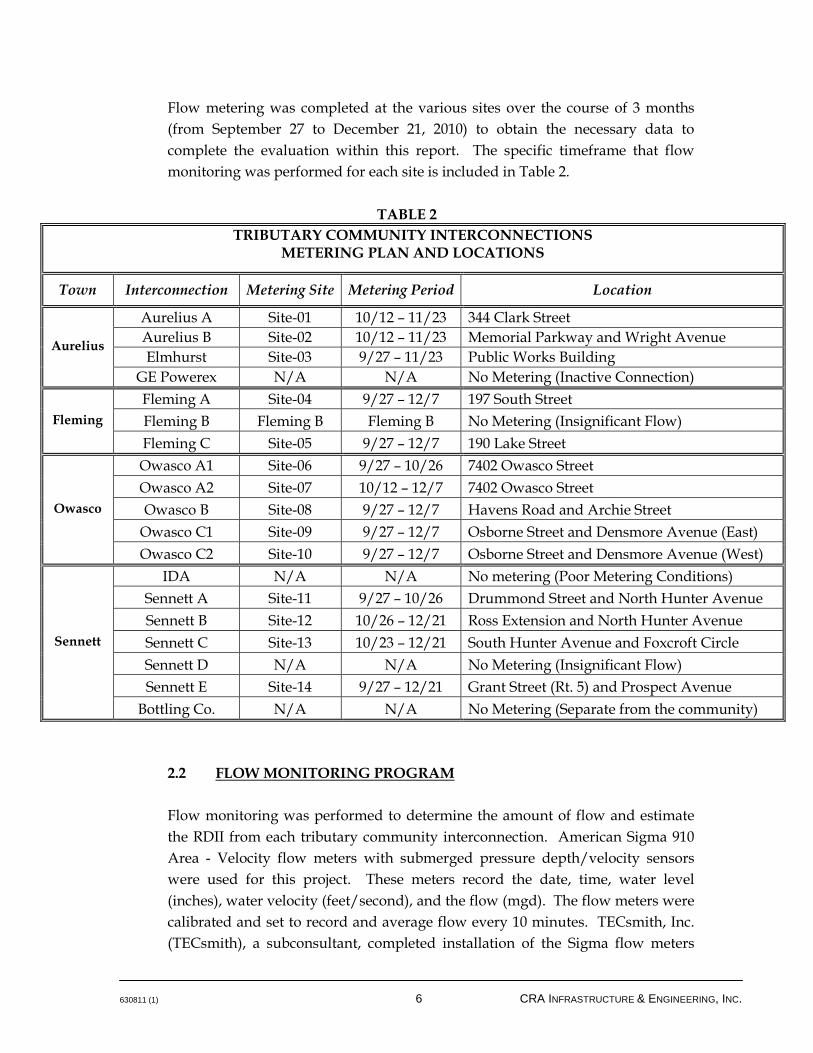
Flow metering was completed at the various sites over the course of 3 months
(from September 27 to December 21, 2010) to obtain the necessary data to
complete the evaluation within this report. The specific timeframe that flow
monitoring was performed for each site is included in Table 2.
TABLE 2
TRIBUTARY COMMUNITY INTERCONNECTIONS METERING PLAN AND LOCATIONS
Town Interconnection Metering Site Metering Period Location
Aurelius A Site-01 10/12 – 11/23 344 Clark Street
Aurelius B Site-02 10/12 – 11/23 Memorial Parkway and Wright Avenue
Elmhurst Site-03 9/27 – 11/23 Public Works Building Aurelius
GE Powerex N/A N/A No Metering (Inactive Connection)
Fleming A Site-04 9/27 – 12/7 197 South Street
Fleming B Fleming B Fleming B No Metering (Insignificant Flow) Fleming
Fleming C Site-05 9/27 – 12/7 190 Lake Street
Owasco A1 Site-06 9/27 – 10/26 7402 Owasco Street
Owasco A2 Site-07 10/12 – 12/7 7402 Owasco Street
Owasco B Site-08 9/27 – 12/7 Havens Road and Archie Street
Owasco C1 Site-09 9/27 – 12/7 Osborne Street and Densmore Avenue (East)
Owasco
Owasco C2 Site-10 9/27 – 12/7 Osborne Street and Densmore Avenue (West)
IDA N/A N/A No metering (Poor Metering Conditions)
Sennett A Site-11 9/27 – 10/26 Drummond Street and North Hunter Avenue
Sennett B Site-12 10/26 – 12/21 Ross Extension and North Hunter Avenue
Sennett C Site-13 10/23 – 12/21 South Hunter Avenue and Foxcroft Circle
Sennett D N/A N/A No Metering (Insignificant Flow)
Sennett E Site-14 9/27 – 12/21 Grant Street (Rt. 5) and Prospect Avenue
Sennett
Bottling Co. N/A N/A No Metering (Separate from the community)
2.2 FLOW MONITORING PROGRAM
Flow monitoring was performed to determine the amount of flow and estimate
the RDII from each tributary community interconnection. American Sigma 910
Area - Velocity flow meters with submerged pressure depth/velocity sensors
were used for this project. These meters record the date, time, water level
(inches), water velocity (feet/second), and the flow (mgd). The flow meters were
calibrated and set to record and average flow every 10 minutes. TECsmith, Inc.
(TECsmith), a subconsultant, completed installation of the Sigma flow meters
630811 (1) 7 CRA INFRASTRUCTURE & ENGINEERING, INC.
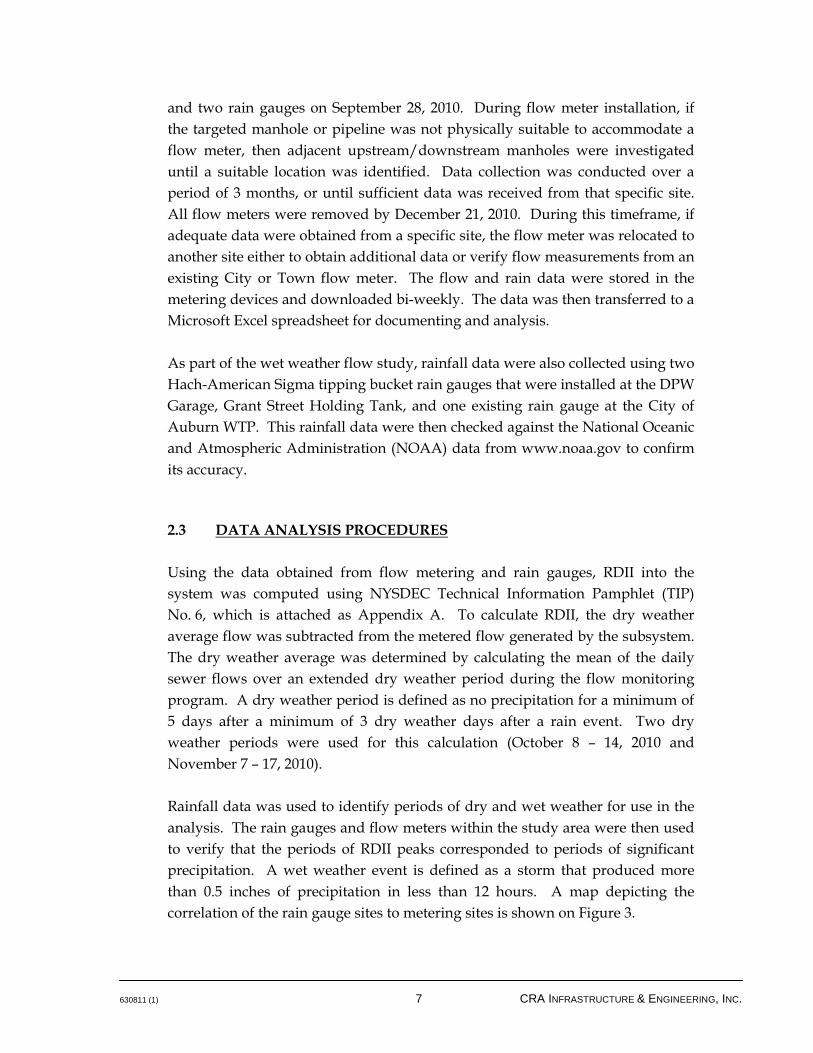
and two rain gauges on September 28, 2010. During flow meter installation, if
the targeted manhole or pipeline was not physically suitable to accommodate a
flow meter, then adjacent upstream/downstream manholes were investigated
until a suitable location was identified. Data collection was conducted over a
period of 3 months, or until sufficient data was received from that specific site.
All flow meters were removed by December 21, 2010. During this timeframe, if
adequate data were obtained from a specific site, the flow meter was relocated to
another site either to obtain additional data or verify flow measurements from an
existing City or Town flow meter. The flow and rain data were stored in the
metering devices and downloaded bi-weekly. The data was then transferred to a
Microsoft Excel spreadsheet for documenting and analysis.
As part of the wet weather flow study, rainfall data were also collected using two
Hach-American Sigma tipping bucket rain gauges that were installed at the DPW
Garage, Grant Street Holding Tank, and one existing rain gauge at the City of
Auburn WTP. This rainfall data were then checked against the National Oceanic
and Atmospheric Administration (NOAA) data from www.noaa.gov to confirm
its accuracy.
2.3 DATA ANALYSIS PROCEDURES
Using the data obtained from flow metering and rain gauges, RDII into the
system was computed using NYSDEC Technical Information Pamphlet (TIP)
No. 6, which is attached as Appendix A. To calculate RDII, the dry weather
average flow was subtracted from the metered flow generated by the subsystem.
The dry weather average was determined by calculating the mean of the daily
sewer flows over an extended dry weather period during the flow monitoring
program. A dry weather period is defined as no precipitation for a minimum of
5 days after a minimum of 3 dry weather days after a rain event. Two dry
weather periods were used for this calculation (October 8 – 14, 2010 and
November 7 – 17, 2010).
Rainfall data was used to identify periods of dry and wet weather for use in the
analysis. The rain gauges and flow meters within the study area were then used
to verify that the periods of RDII peaks corresponded to periods of significant
precipitation. A wet weather event is defined as a storm that produced more
than 0.5 inches of precipitation in less than 12 hours. A map depicting the
correlation of the rain gauge sites to metering sites is shown on Figure 3.
630811 (1) 8 CRA INFRASTRUCTURE & ENGINEERING, INC.
Once all data were collected, the 7-day and 30-day average RDII was calculated
for each subsystem using the methodology previously described. The highest
7-day average RDII was then divided by the computed inch-miles for each
subsystem, which provides the rate of infiltration in gallons per day per inch-
mile (gpd/im). The infiltration rate was then compared to the infiltration rate
considered non-excessive as published in the TIP No. 26 guidelines. These
guidelines present the non-excessive infiltration rate in terms of gallons per day
per inch-mile of sewer for three categories of sewer systems (less than 10,000 ft.,
10,000 to 100,000 ft., and greater than 100,000 ft.). This method allows for an
equivalent comparison of flow data for subsystems of varying size.
630811 (1) 9 CRA INFRASTRUCTURE & ENGINEERING, INC.
3.0 WET WEATHER FLOW ANALYSIS
Within this report the contribution to the City of Auburn WPCP from each
tributary connection was calculated. In addition, the amount of RDII generated
from each subsystem was determined and compared to the suggested guidelines
of the NYSDEC Tip No. 26.
3.1 FLOW MONITORING DATA
Data was collected between September 27 and December 21, 2010. Tabular and
graphical flow monitoring summaries of daily flow are attached as Appendices B
and C, respectively. Individual site analyses using site-specific hydrographs that
depict 30-day dry weather average flow, wet weather metered flow, and rain
gauge data is included as Appendix D.
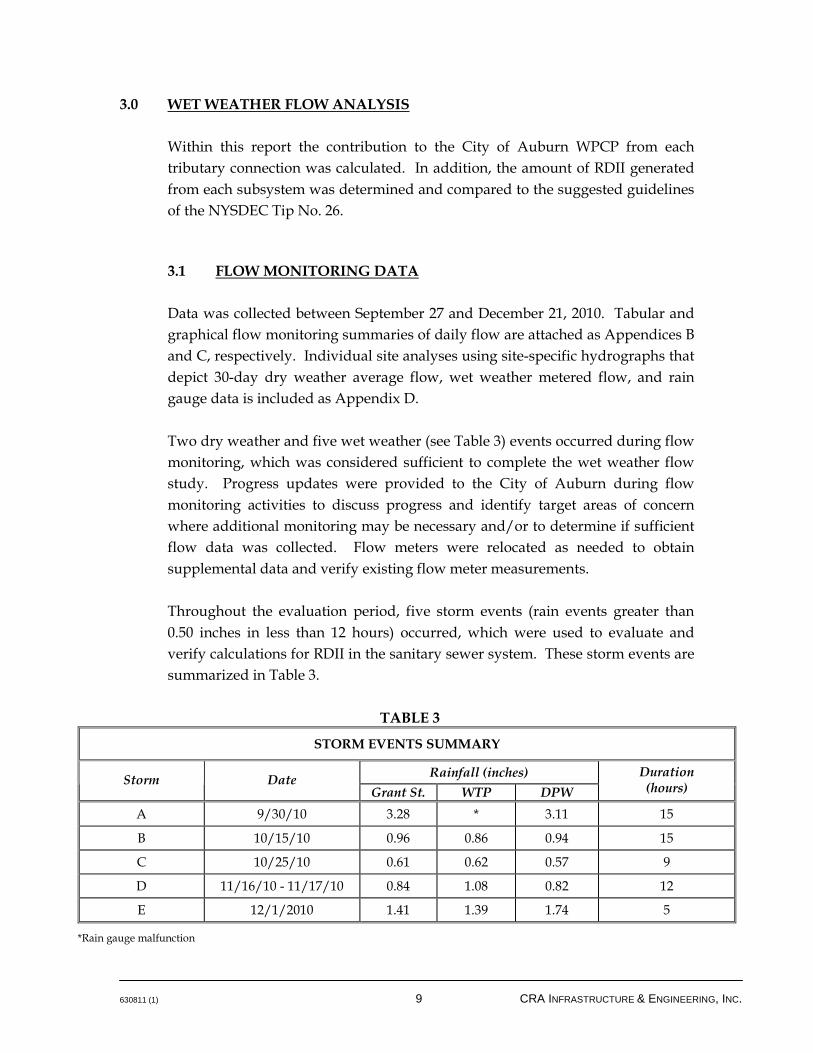
Two dry weather and five wet weather (see Table 3) events occurred during flow
monitoring, which was considered sufficient to complete the wet weather flow
study. Progress updates were provided to the City of Auburn during flow
monitoring activities to discuss progress and identify target areas of concern
where additional monitoring may be necessary and/or to determine if sufficient
flow data was collected. Flow meters were relocated as needed to obtain
supplemental data and verify existing flow meter measurements.
Throughout the evaluation period, five storm events (rain events greater than
0.50 inches in less than 12 hours) occurred, which were used to evaluate and
verify calculations for RDII in the sanitary sewer system. These storm events are
summarized in Table 3.
TABLE 3
STORM EVENTS SUMMARY
Rainfall (inches) Storm Date
Grant St. WTP DPW
Duration (hours)
A 9/30/10 3.28 * 3.11 15
B 10/15/10 0.96 0.86 0.94 15
C 10/25/10 0.61 0.62 0.57 9
D 11/16/10 - 11/17/10 0.84 1.08 0.82 12
E 12/1/2010 1.41 1.39 1.74 5
*Rain gauge malfunction

630811 (1) 10 CRA INFRASTRUCTURE & ENGINEERING, INC.
During the flow monitoring program, data validation was performed to verify
that the data collected were representative of actual conditions. Data validation
steps included:
• Reviewing and screening of velocity measurements for blocked, ragged, or
erratic measurements.
• Reviewing and screening of depth measurements for pressure drift or
erratic measurements.
• Confirming flow patterns with rainfall data.
In general, flow monitoring data were determined to be representative of actual
conditions. During flow monitoring, it was identified that Sites 03 and 10 had
flow measurements lower than anticipated. Investigation indicated that these
flow meters are located near the discharge points of a pumping station. Pump
operation results in sudden flow surges at startup followed by a rapid decline in
flow upon shutdown. It was determined that the pump operating cycles were
often less than the 10-minute delay between flow measurements, and that not all
flow was being measured. This was corrected by reducing the period between
measurements to 5 minutes.
3.2 FLOW MONITORING RESULTS/SUMMARY
The flow and precipitation data for the entire metering period is summarized for
each subsystem (see Appendix B). These tables present daily flow (as measured
by the flow meter), flow from other subsystem(s), net flow, 7-day average flow,
30-day average flow, 30-day dry weather average flow, daily RDII, 7-day average
RDII, and 30-day average RDII. Average daily dry weather flow from the
individual tributary connections and their contribution to the City of Auburn
WPCP are summarized in Table 4.

630811 (1) 11 CRA INFRASTRUCTURE & ENGINEERING, INC.
TABLE 4
TRIBUTARY COMMUNITY COLLECTION SYSTEM
FLOW CONTRIBUTION TO AUBURN WPCP
Interconnection Metering
Site
Average Daily
Dry Weather
Flow (gpd)
Site Contribution
to Auburn WPCP
Flow (%)
Total Community
Flow Contribution
to the Auburn
WPCP (%)
City of
Auburn
WPCP
N/A N/A 6,510,000*** N/A N/A
Aurelius A Site-01 40,000 0.61%
Aurelius B Site-02 15,000 0.23%
Elmhurst Site-03 8,000 0.12% Aurelius
GE Powerex N/A **(inactive) **
0.97%
Fleming A Site-04 26,000 0.40%
Fleming B N/A 7,500* 0.12% Fleming
Fleming C Site-05 62,000 0.95%
1.47%
Owasco A1 Site-06 3,000 0.05%
Owasco A2 Site-07 39,000 0.60%
Owasco B Site-08 54,000 0.83% Owasco
Owasco C1 & C2 Site-09/10 127,000 1.95%
3.43%
IDA N/A 26,000* 0.40%
Sennett A Site-11 2,000 0.03%
Sennett B Site-12 64,000 0.98%
Sennett C Site-13 53,000 0.81%
Sennett D N/A 10,400* 0.16%
Sennett Site-14 55,000 0.84%
Sennett
Bottling Co. N/A ** **
3.23%
Total: 9.09%
*Estimated flow based upon population and water consumption. **Industrial user not considered as part of this tributary collection system evaluation ***Average daily dry weather flow from 11/1/2008 – 9/30/2010, defined as flow data a minimum of 3 days after a recordable rain event, and at least 2 consecutive days of equalized plant flow after the rain event.
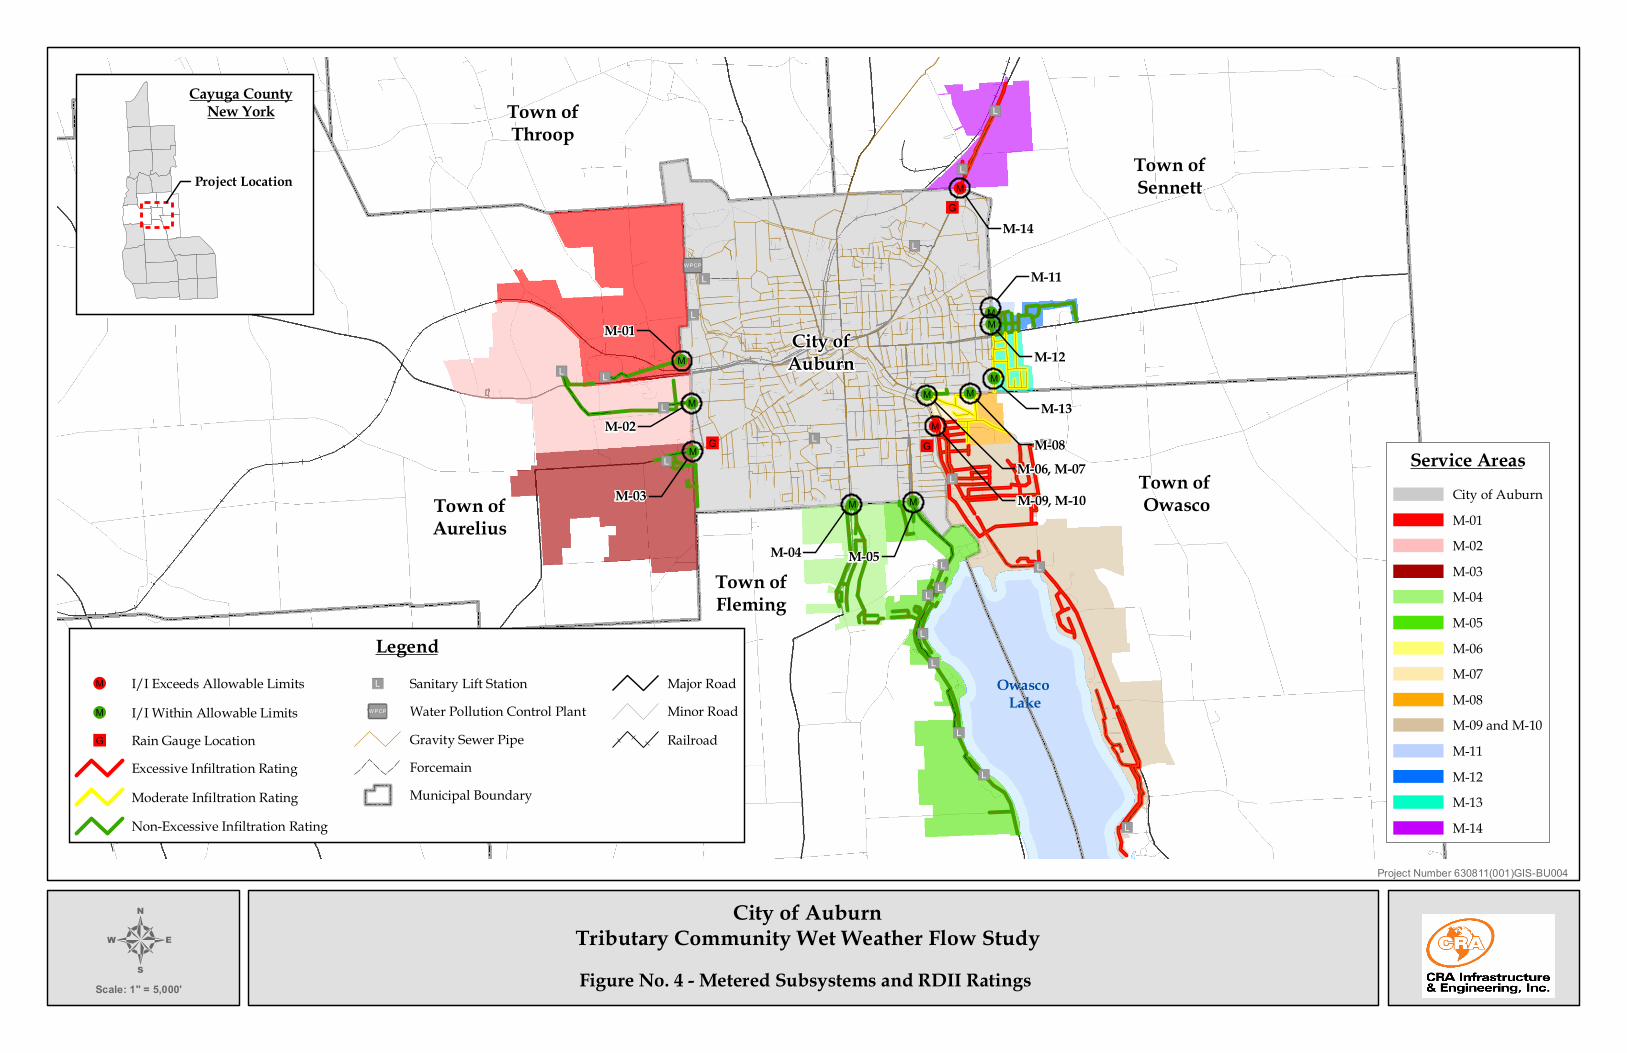
Appendix C summarizes the maximum average RDII per inch-mile for the 14
tributary connections monitored during this project. Table 5 summarizes the
tributary connections that are considered to have moderate or excessive RDII
rates.

630811 (1) 12 CRA INFRASTRUCTURE & ENGINEERING, INC.
TABLE 5
SUMMARY OF RDII ANALYSIS
Site Name Tributary
Sites
Inch-Miles of Sewer
(im)
Maximum 7-day Average RDII (MGD)
Infiltration rate (gpd/im)
Infiltration Rate Considered Non
Excessive (gpd/im)
Excessive RDII Rate (%)
Site 07 Owasco A2
None 6.77 0.06 8,300 6,000 - 10,000 0
Site 08 Owasco B
None 13.33 0.08 5,800 6,000 - 10,000 0
Site 09/10 Owasco C1
& C2 None 174.20 0.69 4,000 2,000 - 3,000 32
Site 13 Sennett C
None 30.14 0.10 3,200 3,000 – 6,000 0
Site 14 Sennett
None 10.75 0.12 11,200 6,000 - 10,000 12

630811 (1) 13 CRA INFRASTRUCTURE & ENGINEERING, INC.
4.0 SUMMARY
CRA was retained by the City of Auburn to conduct a Tributary Community Wet
Weather Flow Study to facilitate evaluating the feasibility of combining
wastewater services currently provided by the City and the Towns of Aurelius,
Fleming, Owasco, and Sennett. The study objectives were to:
• Monitor flows from the connections where the tributary communities'
collection systems enter the City of Auburn.
• Determine the flow contribution from each tributary connection to the
Auburn WPCP based on average daily dry weather flow.
• Estimate the rate RDII from each tributary connection. Also, identify if the
RDII contribution is considered excessive based on guidelines in Technical
Information Pamphlet No. 26, published by the New York State
Department of Environmental Conservation.
Monitoring of flow was conducted at 14 of the 19 City tributary connections
between September 28 and December 21, 2010. Of the four interconnections that
were not monitored: one was inactive, one was from an industrial source, one
had a very small service area, and the other was from a force main discharge that
had no means for connecting a flow meter. Rain gauge measurements were
taken at three locations within the City to determine wet weather flow events for
use in the RDII analysis.
Flow and rainfall data generally were verified to be representative of conditions
at each monitoring location, including response to wet weather. Five wet
weather events were used in evaluating RDII, ranging from 0.61 to 3.28 inches of
precipitation. In addition, two dry weather periods were identified.
Overall, the tributary communities contributed about 9.09 percent of the total
flow to the WPCP. Owasco was the largest contributing community
(3.43 percent) and had the largest connection (Owasco C1/2 – 1.95%).
RDII rates were considered to be excessive for the Owasco C1/C2 and Sennett
Site 14 connections. Moderate RDII rates occurred at the Sennett C, Owasco A2
and Owasco B connections. The remaining connections were not considered to
be excessive.

630811 (1)
FIGURES

File Number: 630811(001)GIS-BU006
Source: www.cityofindianola.com
City of AuburnTributary Community Wet Weather Flow StudyFigure No. 1 - Infiltration and Inflow Sources

[PCPW
")L
")L
")L
")L
")L ")L")L
")L
")L
")L
")L
")L
")L
")L
")L
")L
")L
")L")L
")L
")L
"G
"G
"G
!M
!M!M
!M!M!M
!M
!M
!M
!M
!M
!M
#I #I
#I
#I
#I
4Scale: 1" = 5,000'
City of AuburnTributary Community Wet Weather Flow Study
Town ofAurelius
Town of Owasco
Town ofFleming
Town ofSennett
Town ofThroop
City ofAuburn
Owasco Lake
Cayuga CountyNew York
Project Location
Figure No. 2 - Flow Monitoring and Tributary Connection Locations
Legend!M Meter Location"G Rain Gauge Location#I Tributary Connection (No Metering)")L Sanitary Lift Station[PCPW Water Pollution Control Plant
Gravity Sewer PipeForcemain
Major RoadMinor RoadRailroadMunicipal BoundarySewer Service Area (Within City Limits)Sewer Service Area (Outside City Limits)
M-01
M-02
M-03
M-04 M-05
M-14
M-11
M-12
M-13M-08
M-06, M-07M-09, M-10
Project Number: 630811(001)GIS-BU001
NYS Route 5
U.S. Route 20
NYS R
oute
34
NYS Route 38
NYS R
oute
326
Meter Number Meter Name Town Location
M-01 Aurelius A Aurelius 344 Clark StreetM-02 Aurelius B Aurelius Memorial Parkway and Wright AvenueM-03 Elmhurst Aurelius Public Works BuildingM-04 Fleming A Fleming 197 South StreetM-05 Fleming C Fleming 190 Lake StreetM-06 Owasco A1 Owasco 7402 Owasco StreetM-07 Owasco A2 Owasco 7402 Owasco StreetM-08 Owasco B Owasco Havens Road and Archie StreetM-09 Owasco C1 Owasco Osborne Street and Densmore AvenueM-10 Owasco C2 Owasco Osborne Street and Densmore AvenueM-11 Sennett A Sennett Drummons Street and Norht Hunter AvenueM-12 Sennett B Sennett Ross Extension and North Hunter AvenueM-13 Sennett C Sennett South Hunter Avenue and Foxcroft CircleM-14 Sennett Sennett Grant and Prospect
Flow Meter Locations
Cayuga County IDABottle Company
Sennett D
Fleming B
GeneralElectric

[PCPW
")L
")L
")L
")L
")L ")L")L
")L
")L
")L
")L
")L
")L
")L
")L
")L
")L
")L")L
")L
")L
"G
"G
"G
!M
!M!M
!M!M!M
!M
!M
!M
!M
!M
!M
Project Number 630811(001)GIS-BU003
4Scale: 1" = 5,000'
Town ofAurelius
Town of Owasco
Town ofFleming
Town ofSennett
Town ofThroop
City ofAuburn
Owasco Lake
Cayuga CountyNew York
Project Location
Legend!M Meter Location"G Rain Gauge Location")L Sanitary Lift Station[PCPW Water Pollution Control Plant
Gravity Sewer PipeForcemain
Major RoadMinor RoadRailroadMunicipal Boundary
M-01
M-02
M-03
M-04 M-05
M-14
M-11
M-12
M-13
M-08M-06, M-07M-09, M-10
Rain Gauge AreasDPW Rain Gauge AreaGrant Street Rain Gauge AreaWTP Rain Gauge Area
City of AuburnTributary Community Wet Weather Flow Study
Figure No. 3 - Rain Gauge Areas
[PCPW
")L
")L
")L
")L
")L ")L")L
")L
")L
")L
")L
")L
")L
")L
")L
")L
")L
")L")L
")L
")L
"G
"G
"G
!M
!M!M
!M!M!M
!M
!M
!M
!M
!M
!M
Project Number 630811(001)GIS-BU004
4Scale: 1" = 5,000'
Town ofAurelius
Town of Owasco
Town ofFleming
Town ofSennett
Town ofThroop
City ofAuburn
Owasco Lake
Cayuga CountyNew York
Project Location
Legend!M I/I Exceeds Allowable Limits!M I/I Within Allowable Limits"G Rain Gauge Location
Excessive Infiltration RatingModerate Infiltration RatingNon-Excessive Infiltration Rating
")L Sanitary Lift Station[PCPW Water Pollution Control Plant
Gravity Sewer PipeForcemainMunicipal Boundary
Major RoadMinor RoadRailroad
M-01
M-02
M-03
M-04 M-05
M-14
M-11
M-12
M-13
M-08M-06, M-07M-09, M-10
Service AreasCity of AuburnM-01M-02M-03M-04M-05M-06M-07M-08M-09 and M-10M-11M-12M-13M-14
City of AuburnTributary Community Wet Weather Flow StudyFigure No. 4 - Metered Subsystems and RDII Ratings