
Attrition in the trades - ed
42
Attrition in the trades Tom Karmel Patrick Lim Josie Misko NCVER MONOGRAPH SERIES 07/2011
Transcript of Attrition in the trades - ed

Attrition in the trades
Tom Karmel Patrick Lim Josie Misko
NCVER MONOGRAPH SERIES 07/2011

Cover design using artwork from
‘Consumed #4’ by Michelle Jones
A dual narrative exists within my work. One story explores
the materiality of paint, painting’s historical legacy and its
relationship with photography.
The other narrative stems from the content of my paintings,
thoughts about consumption, artificiality and man’s
manipulation of nature.
This work is from NCVER’s collection
which features artwork by VET students.
NCVER Monograph Series
In 2007 the NCVER Board agreed to establish an editorial
board to peer-review work commissioned or undertaken
by NCVER for publication in a monograph series. Each
contribution to the NCVER Monograph Series is subject
to peer review by two editorial board members. Research
accepted for publication in the NCVER Monograph
Series will assist university-based researchers make use of
their NCVER published work in the Research Publications
Return of the Higher Education Research Data Collection
and in Excellence in Research for Australia evaluations.
The members of the editorial board include:
Dr Tom Karmel (Chair)
Ms Francesca Beddie
Professor Gerald Burke
Emeritus Professor Anne Edwards
Professor Barry McGaw AO
Dr Robin Ryan
Professor Paul Miller
Professor Lorraine Dearden
Professor David Finegold

Attrition in the trades
Tom Karmel Patrick Lim Josie Misko National Centre for Vocational Education Research
NCVER Monograph series 07/2011
The views and opinions expressed in this document are those of the author/
project team and do not necessarily reflect the views of the Australian Government,
state and territory governments or NCVER.
Any interpretation of data is the responsibility of the author/project team.
NATIONAL CENTRE FOR VOCATIONAL EDUCATION RESEARCH NCVER MONOGRAPH SERIES 07/2011

© National Centre for Vocational Education Research, 2011
With the exception of cover design, artwork, photographs, all logos, and any other material
where copyright is owned by a third party, all material presented in this document is
provided under a Creative Commons Attribution 3.0 Australia
<http://creativecommons.org/licenses/by/3.0/au>. However, you must attribute the National
Centre for Vocational Education Research (NCVER) as the copyright holder of the work.
This document should be attributed as Karmel, T, Lim, P & Misko, J, 2011 Attrition in
the trades, NCVER.
NCVER is an independent body responsible for collecting, managing and analysing, evaluating
and communicating research and statistics about vocational education and training (VET).
NCVER’s inhouse research and evaluation program undertakes projects which are strategic to
the VET sector. These projects are developed and conducted by NCVER’s research staff and
are funded by NCVER. This research aims to improve policy and practice in the VET sector.
ISSN 1837-0659
ISBN 978 1 921955 49 5 web edition
978 1 921955 50 1 print edition
TD/TNC 104.36
Published by NCVER, ABN 87 007 967 311
Level 11, 33 King William Street, Adelaide, SA 5000;
PO Box 8288 Station Arcade, Adelaide SA 5000, Australia
P +61 8 8230 8400 F +61 8 8212 3436 E [email protected] W <http://www.ncver.edu.au>

About the research Attrition in the trades
Tom Karmel, Patrick Lim and Josie Misko, NCVER
Shortages in the trades are again becoming a prominent issue as Australia emerges from the Global
Financial Crisis. The existence of shortages puts the immediate focus on the apparent inability of the
training system to supply sufficient skilled tradespersons, but shortages in an occupation are as much
related to the rate at which individuals leave the occupation as the rate at which the occupation
attracts new entrants. Hence, this paper which focuses on attrition in the trades, using professional
occupations as comparators. The analysis is restricted to males in order to abstract from the impact
that family responsibilities have on women’s labour mobility, noting that the trades are dominated by
men, apart from hairdressing and, to a lesser extent, the food trades.
While attrition has a negative connotation, it may be positive for the individuals leaving a trade if
they are moving to something better. Thus, by looking at the occupations ex-tradespersons move to,
the paper also examines whether a trade offers a good start to a career.
Key messages Job and occupational mobility in the trades is not particularly different from that experienced in
the professions, although there is considerable variation across the trades (and across the
professions).
The rate of attrition in the trades is remarkably similar in good times and in bad times, although
the balance between job losers and job leavers is affected by economic conditions. However, job
churn within a trade is higher in good times, and this gives the impression to employers that
attrition is higher.
The one trade occupation that stands out as good foundation for a future career is
electrotechnology and communications.
The results of the paper bring us full circle. It seems that we should not be overly concerned about
attrition in the trades when addressing skills shortages. Thus it is the output of the training system
that should be the immediate focus and this puts the spotlight back on the commencement and
completion rates of apprenticeships.
Tom Karmel
Managing Director, NCVER


NCVER 5
Contents Tables and figures 6
Abstract 8
Introduction 9
The extent of attrition 13 Job mobility 14 Occupational mobility 16
Attrition and the state of the labour market 19
Is a trade a good start to a career? 21
Final comments 26
References 27
Appendices
A 28 B 31 C 33 D 35 E 36

6 Attrition in the trades
Tables and figures Tables 1 Probability of exiting job in next 12 months by age, 2008, with job
tenure of two years, for trades and professional occupations, males 14
2 Probability of exiting job in next 12 months by job tenure, 2008, at
age 35 years, for trades and professional occupations, males 15
3 Probability of exiting an occupation in next 12 months by age, for
trades and professional occupations, 2008, males 17
4 Gross attrition: the percentage of a cohort remaining in the
occupation by period since entry, for trades and professional
occupations, 2008, males 17
7 Proportion of individuals staying in or losing or moving jobs in weak
and strong economies, males (%) 19
8 Occupational staying and moving or losing jobs in weak and strong
economies for trades, associate professionals and professionals,
males (%) 20
9 Average changes in skill levels for occupational leavers from
Feb. 2007 — Feb. 2008, males 22
10 Change in average weekly income for occupational leavers Feb. 2007 —
Feb. 2008 23
11 Change in occupational prestige for occupational leavers
Feb. 2007 — Feb. 2008 24
A1 Model parameters for logistic regression (1 = exit job within
12 months), males 28
A2 Standard errors for parameters (given in table A1) in job leaving
regression, males 29
C1 Regression coefficients for leaving an occupation in the next
12 months, males 33
C2 Standard errors of regression coefficients for occupation leaving, males 34
D1 ANZSCO occupation by average cash weekly earnings, 2008 and
AUSEI06 prestige measures 35
E1 Engineering, ICT and science technicians (2008 ANZSCO 3), males 36
E2 Automotive and engineering (2008 ANZSCO 32), males 37
E3 Construction trades (2008 ANZSCO 33), males 37
E4 Electrotechnology (2008 ANZSCO 34), males 38
E5 Food trades (2008 ANZSCO 35), males 38
E6 Skilled agricultural and horticultural workers (2008 ANZSCO 36), males 38
E7 Other technician and trade workers (2008 ANZSCO 39), males 39

NCVER 7
Figures 1 Cumulative retention rates in a job for commencing individuals in selected
occupations by years of job tenure, males 16
2 Skill levels of destination occupations, job movers and job losers,
trade occupations, 2008, males 22
3 Age distributions for males who leave their job, by occupation 31

8 Attrition in the trades
Abstract Skill shortages in the trades are of growing concern as Australian industry emerges from the Global
Financial Crisis. Although such shortages are often attributed to the inability of the training system to
supply enough skilled tradespersons, they are just as much affected by the rate at which individuals
leave their occupations.
In this paper, using professional occupations as comparators, we investigate attrition in the trades and
the extent to which this is affected by good or bad economic times. We also ponder the question of
whether a trade is a good start to a career by tracking the occupational destination of those who exit
their trades.

NCVER 9
Introduction As Australia emerges from the Global Financial Crisis, shortages in the trades reappear as an issue,
although less of a severe one than prior to the downturn (Department of Education, Employment and
Workplace Relations 2010).1
The existence of shortages puts the immediate focus on the apparent inability of the training system
to supply sufficient skilled tradesmen, but there is another side to the story. Shortages in an
occupation are as much related to the rate at which individuals leave the occupation as to the rate at
which the occupation is attracting new entrants (as is recognised by, for example, Energy Skills
Queensland 2009). As a simple piece of arithmetic, if attrition is low, then the need for new entrants
will also be low, everything else being equal. While this argument is unexceptionable, the relevant
literature suggests that more attention has been paid to non-completion of apprenticeships than to
attrition of qualified tradespeople (for example, Group Training Australia & Group Training Victoria
2005; Ball & John 2005; Ray et al. 2000; Gow et al. 2008, Mangan & Trendle 2008; Snell & Hart 2007;
Trendle 2007).
On the whole, training as a solution to skill shortages seems to get more attention than attrition. For
example, the Australian Chamber of Commerce and Industry argues that training is one of four
elements of a solution to skill shortages, the others being labour mobility, better skills utilisation and
migration. The Australian Chamber of Commerce and Industry (2006) does not consider reducing
attrition as a possible remedy. In addition, attrition is associated with additional costs for the
organisation (Brereton, Beech & Cliff 2003), as well as for the individual, particularly if the attrition is
employer-initiated (Boxall, Macky & Rasmussen 2003). However, in considering attrition, are we in a
position to comment on whether attrition in the trades is unusually high? If it is, then it makes sense
to focus on ways to reduce attrition. If it isn’t, then the focus reverts back to the training system.
There is another aspect of attrition also worth considering. It is often argued that attrition is not such
an issue if those leaving the occupation are moving to ‘better’ jobs. According to this line of thinking,
the trades are a good preparation for a range of careers.
The purpose of this paper is to examine these issues, exploiting data from the Australian Bureau of
Statistics (ABS) Labour Mobility Survey. In the first part of the paper we examine attrition and the
extent to which it occurs and compare the trades with professional occupations. We choose the
professions as comparators because, first, the professions, like the trades, are credentialled
occupations and thus require extensive periods of preparation and, second, occupations for
individuals within these groups generally act as strong points of self-identity. Included in the analysis
1 The Department of Education, Employment and Workplace Relations’ ‘Survey of Employers who recently advertised’
(SERA) reports that in 2008 around half of recently advertised vacancies were filled, reflecting skill shortages across all trade occupations (2010). The proportion of filled vacancies for trades improved considerably in the downturn (that is, 2009), but a drop in filled vacancies and suitable applicants in 2010 again signals the advent of increasing shortages. In 2007 and 2008 the proportion of vacancies filled for trades was 48% and 51% respectively. For professions it was 57% and 50% for the same period. By 2009 the proportion of vacancies filled had risen for trades to 67% and by 2010 it had dropped to 62%. For professions the proportion of filled vacancies had climbed to 61% in 2009 and remained the same for 2010. This information indicates that, although the proportion of filled vacancies has picked up from 2007 and 2008 figures, employers are still continuing to experience difficulties in recruitment for substantial proportions of skilled vacancies in the trades and in the professions. Skill shortages are not evenly distributed and are greater in some trade occupations than others. In 2010 the filled vacancy rates for trades were lowest for automotive trades and hairdressers (49% and 47% respectively). It was highest for food trades (66%), followed by engineering trades (64%), construction trades (62%) and electrotechnology and telecommunication trades (61%).

10 Attrition in the trades
is the engineering, information and communications technology (ICT) and science technician
occupation. While the ABS includes this occupation in the same major group as the trades, it arguably
has more in common with the professional occupations than with the trade occupations.
Shah and Burke (2003) have looked extensively at labour mobility and this paper builds on their work,
although the approaches are not precisely the same. While Shah and Burke’s aim was to examine
mobility in relation to a wide range of characteristics — age, migration status, marital status, state
and region, educational qualification, whether part-time or full-time, broad occupation (the trades
are treated as one group), and industry — our interest is much narrower. Our focus is occupational
mobility within the trades; we are less interested in whether the characteristics of individuals in the
occupations, for example, level of qualification, help to ‘explain’ the mobility. Our aim is to
understand the dynamics of the trade labour markets with a view to assessing whether attrition is a
particular issue for the trades. There have been alternative approaches to measuring attrition in an
indirect manner by comparing employment with the numbers of graduates from relevant training (for
example, Folk & Yett 1968; Karmel & Ong 2007), but these are typically based on the very strong
assumption that all graduates from a particular course will go into an occupation — perhaps not
unreasonable for the trade apprentices but very heroic for some professional occupations. (How many
law graduates become lawyers?) It is much better to measure mobility directly, and this is what makes
the Labour Mobility Survey so valuable.
Our characterisation of attrition builds on what we know about mobility. The stylised model of the
trades labour force is that entrants are young and then attrition occurs as the workers age. Karmel
and Ong (2007) find that net attrition occurs in the trades once age cohorts reach 25 years. We also
know that much turnover occurs at the beginning of a job. We could simply look at the labour mobility
figures for trades relative to other occupations, but this would fail to take into account variations in
the distribution of workers by age and tenure. Thus the crude calculations would not be comparing
like with like. Our preferred approach would be to model the probability of a worker leaving the
occupation as a function of age and tenure. This model can then be simply translated into a model of
attrition, in which a cohort of new entrants into an occupation can be tracked over time. Thus we
could compare attrition between various occupations after one year, two years and so on. However,
such an approach is not possible with data from the Labour Mobility Survey because we only have the
job tenure of the current individual (or previous job in some circumstances). We do not know how
long people have been in an occupation.
We address this data limitation by splitting the analysis in two. First, we model job mobility,
irrespective of whether a new job was in the same occupation or not. Here we can control for both
age and tenure. Secondly, we model occupational mobility, by controlling for age only. We
concentrate on the concept of gross attrition, which refers to the rate at which people leave an
occupation. The idea of this is to help us to get an understanding of the dynamics of occupational
mobility. Our concept of gross attrition is the same as the concept of total replacement demand
defined by Shah and Burke (2001) and used in ‘Jobs Australia’ 2008 (Department of Education,
Employment and Workplace Relations 2008). The concept is the outflow of workers from an
occupation (hence gross attrition) and is also equal to the number of workers required to maintain
numbers in a given occupation (hence total replacement demand).

NCVER 11
We make one important simplification to the analysis by restricting it to male employees.2
From our empirical analysis of 2008 data a number of points emerge. The first is that job and
occupational mobility in the trades is not particularly different from that of the professions. Within
both groupings there is considerable variation but the distributions have much in common. So, for
example, in the professions the probability of leaving a job in the following 12 months at age 30
ranges from 0.09 (arts and media, and education professionals) to 0.15 (ICT and legal, social and
welfare professionals), while in the trades the range is 0.09 (construction and electrotechnology and
telecommunications) to 0.17 (other technicians). We also find that attrition drops quickly with tenure,
so that the probability of leaving a job within the first year is much higher than the probability after
being in a job for, say, five years.
This
reflects the domination of the trades by males (there are very few women in the trades apart from
the food trades and hairdressing) and enables us to abstract from the complexities of the workforce
participation of women associated with family formation.
An examination of occupational mobility reinforces the similarities between the trades and the
professions. The rates at which people leave professional and trade occupations vary across
occupations but as a whole the rates in the trades are not very different from the rates in professions.
So the probability at age 30 of leaving the occupation within the following 12 months in the
professions ranges from 0.04 to 0.05 (arts and media, education, ICT) to 0.12 (legal, social and
welfare professionals). The comparable range for trades is 0.06 (construction) to 0.11 (skilled animal
and horticultural trades).
The characterisation of attrition is based on data from the 2008 ABS Labour Mobility Survey. This survey
was conducted early in 2008 and looks back at mobility over the previous 12 months. Thus it covers a
period in which the labour market was very buoyant, although the Global Financial Crisis was on the
horizon. The second part of the study looks at the robustness of the characterisation by considering also
the survey conducted in 1994 when the labour market was not as buoyant. In making the comparison
between the two periods, our interest is how the nature of attrition changes according to the state of
the labour market. When times are very good we would expect that most attrition is caused by
individuals leaving jobs for other opportunities (job movers). By contrast, in poorer labour markets we
would expect that more attrition would be due to employees being made redundant (job losers). It is an
empirical question whether attrition is higher or lower in good times relative to bad — it is all a
question of whether in the good times an increase in job movers outweighs the decline in job losers.
We find that overall attrition in the trades is remarkably similar in good times compared with bad.
However, its composition changes: in bad times more tradespeople lose their jobs and exit from that
occupation, while in good times more tradespeople leave their jobs for other occupations. A point of
interest is that the pattern of job mobility changes, with many employees leaving one job for another
in the same occupation in the good times. Thus from an employer’s point of view attrition has
increased, but from the occupation’s point of view such a pattern is better thought of as job churn
rather than attrition. While job mobility is more important to employers, occupational mobility is of
more interest to policy-makers.
The final part of the study looks at what happens to tradespeople who leave their occupation, with a
view to assessing whether the trades are a good stepping-off point for other careers. Using the Labour
2 The Labour Mobility Survey collects information about owner—managers and employees. We have restricted the
analysis to employees only. However, another area for future investigation is the extent to which occupational mobility is explained by employees moving out of their occupation to set up their own businesses.

12 Attrition in the trades
Mobility Survey again, we can match the new occupations against the old occupations. Our interest
lies in the nature of the new occupations. This type of analysis implies that we have a ranking of
occupations. Here, we take three approaches. The first uses the five skill levels of the ANZSCO3
The paper ends with some comments. While attrition in the trades is higher than some professional
occupations, it compares fairly well with others. The implication is that if skill shortages need to be
addressed, then attention needs to be paid more to the numbers entering an occupation than those
leaving it. Thus the analysis, if anything, supports the notion that the output of the apprenticeship
system is probably a more important policy lever than attrition. While no doubt attrition could be
reduced, it does not stand out as being the issue.
(trades are assigned to the middle rank). The second ranks occupations according to average earnings
from the ABS Survey of Earnings and Hours. The third uses the Australian Socioeconomic Index
(AUSE106) scale to rank occupations by their status. In relation to the first of these methods, we find
that more tradespeople move to lower-skilled occupations, with movers doing rather better than job
losers. The second method gives a very different picture, with a clear finding that most who leave a
trade move to a better-paying occupation. The third approach discovers that job movers are more
likely to have an increase in occupational prestige. For job losers the story is mixed, with job losers in
some occupations suffering a substantial drop. The one occupation that stands out as a good stepping-
off point is the electrotechnology trade.
One final comment relates to the existence of a ‘pecking order’ in the trades, and an anomaly in the
ABS ANZSCO classification. The electrotechnology and telecommunications trade is clearly the most
highly skilled trade (as is evident from the wages) and behaves more like a professional occupation
than other trades. The anomaly in the ABS classification is engineering and building technicians. This
occupation, while included by the ABS in the ANZSCO major group 3, appears to have characteristics
more like those of a professional occupation than of a trade.
3 Australian and New Zealand Standard Classification of Occupations.

NCVER 13
The extent of attrition The ABS Labour Mobility Survey collects data over a 12-month period, ending in February each year.
Its focus is on labour mobility rather than attrition from particular occupations, and the data it
collects are not ideal for our purpose. If we accept the proposition that attrition from an occupation
will vary with the time that an individual has been in the occupation, then ideally we would wish to
collect data on tenure within an occupation and its relationship to the probability of exiting the
occupation. However, the survey does not collect this. Rather it collects data on the duration of jobs,
not the duration within an occupation. What this means is that we need to be somewhat creative in
building up a picture of attrition from labour mobility and from the data on which occupation an
individual is in at the survey date and a year earlier.
Our characterisation of mobility and attrition is based on age and (where possible) job tenure within
the trades and selected professions (based on ANZSCO sub-major group classifications). Our
expectation is that mobility declines with age and with job tenure until we get to the time when
people begin to retire. We approach the task in two stages.
First, we consider the extent of job mobility within each of the occupations. Job mobility refers to
the extent to which people change jobs and covers both changing employers (but not changing
occupation), as well as changing occupations. Thus it considers job mobility from the point of view of
the employer, not the occupation as a whole. We model the probability of changing jobs within a 12-
month period, conditional on the occupation, age and job tenure. (To allow for increasing mobility at
older ages we include quadratic terms for both age and tenure.)4
The second stage considers occupational mobility. This differs from job mobility in that it is possible
to change jobs without changing occupations. Our mechanism is based on questions in the Labour
Mobility Survey on occupation in February of one year and February of the following year. Ideally, one
would want to model occupational mobility in terms of age and tenure in the occupation.
Unfortunately, we do not have data on the latter, so our model is based on age (and age squared).
Essentially, we expect occupational mobility to decline with age and then increase as people begin to
leave the workforce.
Our model enables us to understand the dynamics of attrition. What we mean by this is that we are
following what happens to a cohort entering an occupation. We want to know how many of, say, a 100
people entering an occupation at the ‘standard’ entry age are still in the occupation one year later,
five years, ten years and so on. This describes what we label ‘gross attrition’.
The projections we calculate are based on a simple Markov chain that captures the flows we have
modelled. Formally, we define a commencing cohort and a transition matrix containing the transition
probabilities. For the ‘gross’ attrition projections the commencing vector consists of 100 people in the
occupation and zero not in the occupation, and the transition matrix contains the probabilities of
4 We use a logistic regression in which the dependent variable is 1 if the individual changes job within the next 12
months, 0 otherwise, conditional on the occupation, age, age (squared), job tenure, job tenure (squared). Job changers are those whose current job tenure is less than 12 months and who were employed in the previous February. Job tenure is defined as at the previous February (see appendix A for the derivation of the variable). Shah and Burke (2003) use both a binary and multinomial logistic approach to estimate the probability of job and occupational mobility and attrition. We originally looked at using a multinomial approach but it complicated matters without adding a great deal to our understanding of occupational mobility.

14 Attrition in the trades
exiting the occupation or staying in it, and each transition matrix is conditional on an age. Denote
as the number of people in occupation i at time t, and as the number of people who have left the
occupation. Then, for example, at the first time period we have
and
where is the probability of remaining in the occupation at time t and is the probability of
leaving the occupation.
We now proceed to present our results, beginning with the models of job mobility.
Job mobility
Recall that the job mobility models control for both age and tenure. Table 1 presents the results of
the models by age, holding tenure constant.5
Table 1 Probability of exiting job in next 12 months by age, 2008, with job tenure of two years, for trades and professional occupations, males
We arbitrarily choose tenure of two years to illustrate
the impact of age. The two years of tenure gets over the initial period when job mobility is
particularly high. In appendix B we provide a set of figures that indicate the spread of ages for those
who leave their jobs in each of the trades and professions.
ANZSCO sub-major group occupations 25 years 30 years 40 years 50 years
Arts and media professionals 0.16 0.13 0.09 0.08 Business, human resource and marketing professionals 0.24 0.22 0.20 0.19 Design, engineering, science and transport professionals 0.20 0.16 0.11 0.11 Education professionals 0.21 0.16 0.11 0.13 Health professionals 0.11 0.13 0.18 0.24 ICT professionals 0.15 0.18 0.21 0.19 Legal, social and welfare professionals 0.27 0.25 0.22 0.19 Engineering, ICT and science technicians 0.21 0.17 0.14 0.15 Automotive and engineering trades workers 0.20 0.20 0.19 0.19 Construction trades workers 0.18 0.17 0.16 0.17 Electrotechnology and telecommunications trades worker 0.20 0.20 0.18 0.13 Food trades workers 0.29 0.31 0.29 0.18 Skilled animal and horticultural workers 0.17 0.19 0.22 0.23 Other technicians and Trades workers 0.19 0.20 0.22 0.24
Source: Generated from ABS Survey of Labour Mobility, 2008, confidentialised unit record file, cat.no.6209.
We note that on the whole job mobility is very stable by age, although mobility does decline in the
food trades quite significantly among older workers. There is considerable variation by occupation,
but with quite an overlap between the professions and the trades. The food trades stand out as having
the highest job mobility at the younger ages (that is, 25 and 30 years), but not at the older ages.
Table 2 presents the tenure dimension of our model. We arbitrarily assume that an individual is aged
35 years.
5 Appendix A contains the model parameters.

NCVER 15
Table 2 Probability of exiting job in next 12 months by job tenure, 2008, at age 35 years, for trades and professional occupations, males
ANZSCO sub-major group occupations 1 year 5 years 10 years
Arts and media professionals 0.16 0.04 0.02 Business, human resource and marketing professionals 0.24 0.13 0.07 Design, engineering, science and transport professionals 0.15 0.09 0.06 Education professionals 0.22 0.03 0.01 Health professionals 0.18 0.10 0.06 ICT professionals 0.24 0.13 0.08 Legal, social and welfare professionals 0.26 0.17 0.12 Engineering, ICT and science technicians 0.16 0.11 0.09 Automotive and engineering trades workers 0.25 0.10 0.05 Construction trades workers 0.20 0.08 0.04 Electrotechnology and telecommunications trades worker 0.25 0.10 0.05 Food trades workers 0.42 0.13 0.06 Skilled animal and horticultural workers 0.24 0.14 0.10 Other technicians and trades workers 0.23 0.15 0.10
Source: Generated from ABS Survey of Labour Mobility, 2008, confidentialised unit record file, cat.no.6209.
Not surprisingly, job mobility tends to be high at the beginning of a job with a specific employer and
declines consistently as tenure increases (until retirements begin to take effect). More important for
us, however, are the differences across occupations. At the one-year point, the probabilities of exit
are comparable between the trades and the professions, although a couple of professional
occupations (arts and media, and design, engineering, science and transport) have the lowest
probabilities, while the food trades have the highest. After five years, the probabilities of exit for the
trades are similar to the professions, and the probabilities of exit stabilise between five and ten years
of tenure in a job.
Tables 1 and 2 are rather artificial because they don’t take into account that tenure and age are
related. A 20-year-old cannot have been in a job for ten years. This relationship makes it tricky to
compare job mobility of different occupations, because entry level ages differ. To aid the comparison
between occupations we construct notional cumulative retention rates that allow age and tenure to
change in a consistent manner. It is useful to express these job mobility rates as cumulative, so that
we can see the proportion of people who are still in a job after a certain period of time. Figure 1
provides a graphical representation of the proportions for selected occupations, beginning with a
notional 100 people commencing a job in each occupation.6
The occupations are representative of
professions and trades with high and low job mobility.
6 For these calculations we assume an entry age of 20 years for the trades and 25 years for the professions. Similarly,
graphs can be derived from the models in appendix A. The choice of 20 years for trades and 25 years for the professions is arbitrary but broadly reflects the differences in the distributions of age at entry (see appendix C).

16 Attrition in the trades
Figure 1 Cumulative retention rates in a job for commencing individuals in selected occupations(a) by years of job tenure, males
Note: (a) ANZSCO sub-major group occupations. See appendix A for the relevant models. Source: Generated from ABS Survey of Labour Mobility, 2008, confidentialised unit record file, cat.no.6209.
Of the occupations in figure 1, job mobility is lowest among education professionals. (Appendix A
provides information on regression coefficients on all relevant occupations.) The highest job mobility
in the early years is among the food trades. The construction trades and electrotechnology and
telecommunications trades have similar levels of job mobility and their levels are lower than those of
ICT professionals. Less than half of people are with the same employers after five years, apart from
the educators. No doubt the low mobility of educators is a reflection of the large internal labour
markets in which many of them work.
Occupational mobility
As noted earlier, job mobility does not necessarily imply exiting an occupation. From the point of
view of industry planning, occupational mobility is more important.
We first look at the gross attrition models and show how the probability of exiting an occupation
changes by age. Recall that these models are based on the number of persons remaining in an
occupation from one February to the next. We first present the probabilities of exit. (Model
parameters are shown in appendix A and chosen for presentational purposes.) As in the preceding
section, the commencing ages of 20 for trades and 25 for professionals are chosen to represent a
stylised new entrant. The entry age for trades is generally lower than that for professionals, with the
median age of entry close to those used as the starting point in table 3 (analysis not shown).
Table 3 highlights a couple of issues. First, the rate of leaving an occupation does vary between
occupations but by no means do the trades have particularly high rates of attrition. Among the trades
the highest rates of leaving at say, 25 years, are in the skilled animal and horticultural workers. The
construction industry trades have a consistently low rate of attrition that is similar to a number of the
professional occupations. Second, the patterns are quite stable by age, with a tendency for the
probabilities of leaving an occupation to decline with age (consistent with Shah & Burke 2003),
although they do pick up at age 50 in a number of the occupations.
Using these probabilities we can now describe the gross attrition patterns. These are shown in the next
table. As outlined earlier, we begin with 100 people in a cohort. The table then describes how many of
0102030405060708090
100
0 5 10 15
Cum
ula
tive
ret
enti
on
Job tenure (Years)
Education Professionals
ICT professionals
Construction Trades Workers
Electrotechnology and Telecommunications Trades worker
Food Trades Workers

NCVER 17
them remain in the occupation after one, five, 15, and 25 years. For the trades we assume the cohort
enters the occupation at 20 years. For the professions we assume the cohort enters at 25 years.
Table 3 Probability of exiting an occupation in next 12 months by age, for trades and professional occupations, 2008, males
ANZSCO sub-major group occupations 20 25 30 40 50
Arts and media professionals NA 0.11 0.07 0.04 0.03 Business, human resource and marketing professionals NA 0.15 0.12 0.09 0.09 Design, engineering, science and transport professionals NA 0.11 0.08 0.06 0.05 Education professionals NA 0.11 0.08 0.05 0.05 Health professionals NA 0.07 0.07 0.06 0.07 ICT professionals NA 0.07 0.06 0.05 0.06 Legal, social and welfare professionals NA 0.27 0.20 0.12 0.09 Engineering, ICT and science technicians NA 0.19 0.13 0.08 0.08 Automotive and engineering trades workers 0.11 0.10 0.08 0.08 0.09 Construction trades workers 0.09 0.07 0.06 0.06 0.07 Electrotechnology and telecommunications trades worker 0.12 0.11 0.10 0.08 0.05 Food trades workers 0.14 0.11 0.09 0.07 0.06 Skilled animal and horticultural workers 0.14 0.13 0.12 0.11 0.10 Other technicians and trades workers 0.12 0.11 0.11 0.10 0.11
Source: Generated from ABS Survey of Labour Mobility, 2008, confidentialised unit record file, cat.no.6209.
While the probabilities of exit seemed quite low in table 1, we see that they have a fair bite when
accumulated over a number of years. So after 15 years we see that in every occupation there is less
than 50% of an entering cohort remaining (table 4). Again there is quite a bit of variability across
occupations. Among the trades, those with the least attrition are construction, automotive and
engineering, electrotechnology and telecommunications trades workers and, perhaps surprisingly, the
food trades. By contrast, a number of the professions have higher retention rates, notably, arts and
media professionals, health, design, engineering, science and transport professionals, education
professionals and ICT professionals.
Table 4 Gross attrition: the percentage of a cohort remaining in the occupation by period since entry, for trades and professional occupations, 2008, males
ANZSCO sub-major group occupations 0 I yr 5 yrs 15 yrs 25 yrs
Arts and media professionals 100 90 64 38 28 Business, human resource and marketing professionals 100 86 50 17 7 Design, engineering, science and transport professionals 100 90 62 31 18 Education professionals 100 90 63 35 21 Health professionals 100 93 71 37 19 ICT professionals 100 93 72 42 24 Legal, social and welfare professionals 100 74 27 5 2 Engineering, ICT and science technicians 100 82 43 15 6 Automotive and engineering trades workers 100 89 58 24 10 Construction trades workers 100 91 66 35 20 Electrotechnology and telecommunications trades worker 100 88 55 20 9 Food trades workers 100 87 53 20 9 Skilled animal and horticultural workers 100 86 49 14 4 Other technicians and trades workers 100 88 55 18 6
Source: Generated from ABS Survey of Labour Mobility, 2008, confidentialised unit record file, cat.no.6209.

18 Attrition in the trades
From table 4 we can see that the retention rates after 15 years are higher for the well-defined
professions than for the trades. The four professions with the highest retention rates have a rate that
is around ten percentage points higher than most of the trades, with the exception of construction.
The more amorphous professions and occupations (including business, human resources and marketing
professionals, and engineering, ICT and science technicians) have lower retention rates than all trades
except the skilled animal and horticultural worker trade. Legal, social and welfare professionals have
the lowest retention of all.
Thus our broad conclusion is that on average and by comparison with professions and engineering, ICT
and science technicians, attrition is not always highest in the trades. The corollary is that if entry into
the trades is inadequate, then there are likely to be issues with labour supply.
NCVER 19
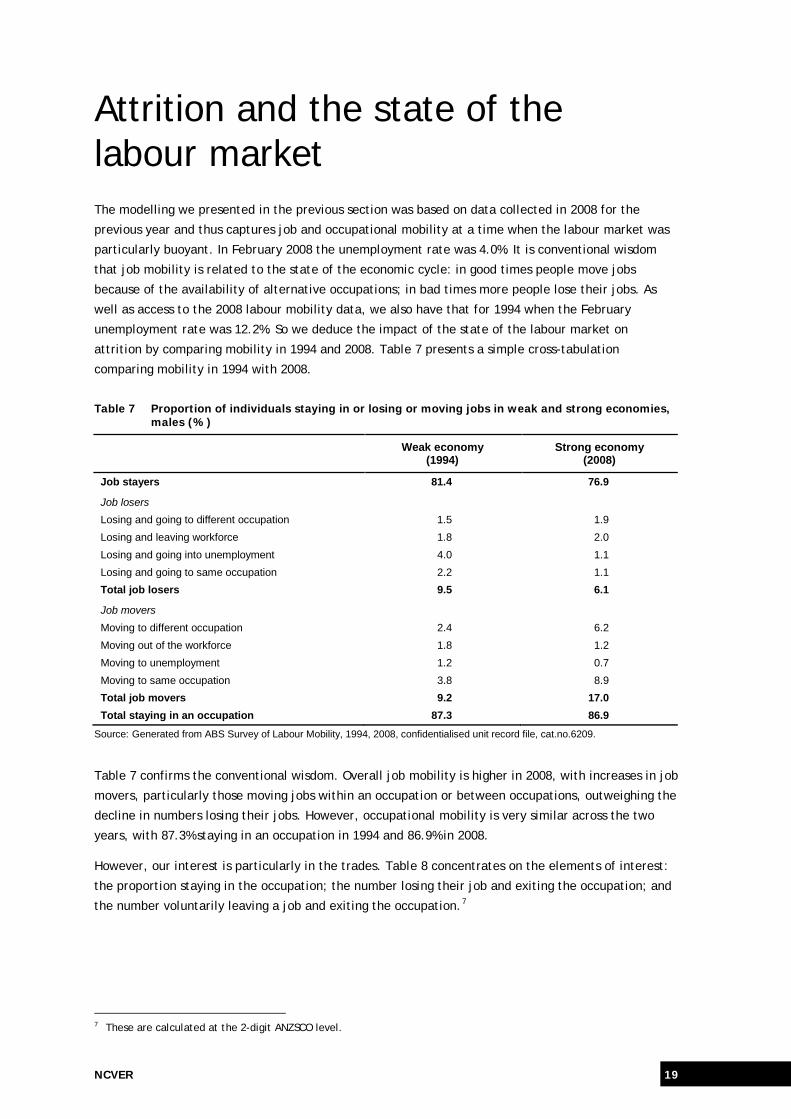
Attrition and the state of the labour market The modelling we presented in the previous section was based on data collected in 2008 for the
previous year and thus captures job and occupational mobility at a time when the labour market was
particularly buoyant. In February 2008 the unemployment rate was 4.0%. It is conventional wisdom
that job mobility is related to the state of the economic cycle: in good times people move jobs
because of the availability of alternative occupations; in bad times more people lose their jobs. As
well as access to the 2008 labour mobility data, we also have that for 1994 when the February
unemployment rate was 12.2%. So we deduce the impact of the state of the labour market on
attrition by comparing mobility in 1994 and 2008. Table 7 presents a simple cross-tabulation
comparing mobility in 1994 with 2008.
Table 7 Proportion of individuals staying in or losing or moving jobs in weak and strong economies, males (%)
Weak economy (1994)
Strong economy (2008)
Job stayers 81.4 76.9
Job losers Losing and going to different occupation 1.5 1.9 Losing and leaving workforce 1.8 2.0 Losing and going into unemployment 4.0 1.1 Losing and going to same occupation 2.2 1.1 Total job losers 9.5 6.1
Job movers Moving to different occupation 2.4 6.2 Moving out of the workforce 1.8 1.2 Moving to unemployment 1.2 0.7 Moving to same occupation 3.8 8.9 Total job movers 9.2 17.0 Total staying in an occupation 87.3 86.9
Source: Generated from ABS Survey of Labour Mobility, 1994, 2008, confidentialised unit record file, cat.no.6209.
Table 7 confirms the conventional wisdom. Overall job mobility is higher in 2008, with increases in job
movers, particularly those moving jobs within an occupation or between occupations, outweighing the
decline in numbers losing their jobs. However, occupational mobility is very similar across the two
years, with 87.3% staying in an occupation in 1994 and 86.9% in 2008.
However, our interest is particularly in the trades. Table 8 concentrates on the elements of interest:
the proportion staying in the occupation; the number losing their job and exiting the occupation; and
the number voluntarily leaving a job and exiting the occupation.7
7 These are calculated at the 2-digit ANZSCO level.

20 Attrition in the trades
Table 8 Occupational staying and moving or losing jobs in weak and strong economies for trades, associate professionals and professionals, males (%)
Sub-major groups(a) Weak economy (1994)
Strong economy (2008)
Trades Occupational staying (includes job losing and moving and going to the same occupation)
89.8 90.0
Losing for different occupation, unemployment or out of the labour force
7.1 3.8
Moving to different occupation, unemployment or out of the labour force
3.2 6.2
100.0 100.0
Professionals Occupational staying (includes job losing and moving and going to the same occupation)
92.4 91.6
Losing for different occupation, unemployment or out of the labour force
4.4 3.8
Moving to different occupation, unemployment or out of the labour force
3.2 4.6
100.0 100.0 Note: (a) Sub major-groups in 1994 are based on Australian Standard Classification of Occupations (ASCO; first edition); sub-
major groups in 2008 are based on ABS ANZSCO. Source: Generated from ABS Survey of Labour Mobility, 1994, 2008, confidentialised unit record file, cat.no.6209.
What this suggests is that in fact occupational mobility for the occupations we are interested in does
not vary a great deal between the labour markets of 1994 and 2008. However, what does vary is the
nature of job mobility. In less buoyant times, occupational exits are mostly driven by individuals
losing their jobs rather than leaving their jobs (7.1% compared with 3.2% for the trades), while in
more buoyant times the pattern is reversed. This phenomenon does not occur in the professions — job
losing is much less important for professionals. What also changes is the extent of job churn —
individuals moving jobs within an occupation — with the proportion of job stayers being considerably
higher in the weaker labour market. Thus the complaints in buoyant times from employers about the
difficulty of retaining and recruiting staff is a more a reflection of individuals changing jobs within an
occupation than a reflection of increased occupational attrition.

NCVER 21
Is a trade a good start to a career? So far the paper has looked at occupational mobility from the point of view of the occupation, with an
underlying inference that a high level of occupational attrition was a bad thing, and that skill
shortages in the trades could be addressed by reducing attrition. However, from the point of the
individual, occupational mobility may be a good thing. Is a trade background a useful foundation for
other careers? Fehring, Malley and Robinson (2008) have also tried to answer this question by a follow-
up study of a group of apprentices and higher education graduates who had completed their programs
with the Royal Melbourne Institute of Technology and who had spent ten years in the workforce. They
found that a trade was a good foundation for self-employment, with about 30% of apprentices in their
sample moving on to own their own businesses, compared with 15% of higher education graduates.
We examine this idea by looking at a different aspect of occupational mobility; we concentrate on the
occupations to which tradespeople go, again using the labour mobility survey data. We do this first by
looking at whether the individual benefits in terms of moving into an occupation associated with
higher or lower skill levels. We then look at whether the individual is moving into an occupation which
has better or worse earnings. Finally, we investigate the change in occupational prestige8
The first approach compares the skill levels of the new and old occupations for those leaving the
trades. The skill levels are those assigned by ANZSCO and range from 1 (most skilled) to 5 (least
skilled).
for those
who leave a trade occupation.
9
In thinking about whether leaving a trade is a good or a bad thing, we need to distinguish between job
movers and job losers. One would expect those moving of their own volition would do better than
those who lose their job. Figure 2 shows the destinations of those who exit a trade occupation. It does
not include engineering, ICT and science technicians because, as we will see later, they behave quite
differently from the other trade occupations (and are at skill level 2 rather than 3).
Appendix D provides the skill level allocated to each ANZSCO sub-major occupation. From
this appendix, we note that technicians are assigned a skill level of 2, while the trades, although in
the same major ANZSCO group, are assigned a skill level of 3. For those occupations that span
multiple skill levels, we have selected the most common skill level, using the unit group occupation
classifications.
Figure 2 gives an overview of the skill levels of destination jobs for all job losers and job movers,
including whether they move into unemployment. We see that almost one in eight job movers leaves
employment, no doubt reflecting retirement. For job losers, almost 50% move to ‘not in employment’,
indicating that many of these people have difficulty regaining employment. (Recall that we are
comparing February 2008 with February 2007.)
8 We thank an anonymous referee for this suggestion. 9 In appendix D we provide a detailed account of skill levels associated with ANZSCO sub-major classifications.

22 Attrition in the trades
Figure 2 Skill levels of destination occupations, job movers and job losers, trade occupations, 2008, males
Source: Generated from ABS Survey of Labour Mobility, 2008, confidentialised unit record file, cat.no.6209.
If we exclude those becoming ‘not employed’ (see columns 3 and 4 of figure 2), we find that job
losers are more likely to move to a lower-skilled job than are job movers. Table 9 presents the change
in average skill level for each trade for those who change occupations between February 2007 and
February 2008. We focus only on those who move from one job to another, and also include
engineering, ICT and science technicians in the table for completeness. Overall, the table is a little
disquieting, with the average skill level declining (or at least not increasing) for job losers and movers
in all trades and technicians occupations. However, there is some variation between the trades.
Table 9 Average changes in skill levels for occupational leavers from Feb. 2007 – Feb. 2008, males
ANZSCO sub-major group occupation in February 2007
Skill level in Feb. 2007
Average change in skill level
for job movers
Average change in skill level
for job losers
Average change in skill level
for all occupation leavers(a)
Proportion moving to a higher skill
level, all occupation
leavers
Engineering, ICT & science technicians
2 0.5 1.0 0.6 54.1
Automotive & engineering trades workers
3 0.5 0.7 0.5 26.5
Construction trades workers 3 0.5 1.6 0.8 28.9 Electrotechnology trades workers
3 0.0 0.3 0.0 54.7
Food trades workers 3 1.0 1.7 1.2 19.9 Skilled animal & horticultural workers
3 0.4 0.0 0.4 41.0
Other technicians, trades workers
3 0.5 0.5 0.5 36.9
Notes: (a) This is the weighted average based on the proportions of job movers and job losers (data not shown). An increase in the average skill level indicates a drop in skill level from February 2007. Source: Generated from ABS Survey of Labour Mobility, 2008, confidentialised unit record file, cat.no.6209.
0%
10%
20%
30%
40%
50%
60%
70%
80%
90%
100%
Job Movers (includes not employed)
Job Losers (includes not employed)
Job Movers Job Losers
Perc
enta
ge
Category
Skills level movement for Trades Occupations for job losers and movers
Moved to higher skill level moved to same skill level moved to lower skill level Moved to not in employment

NCVER 23
Two trade groups stand out. The electrotechnology and telecommunication trades are the best
platform to move into a higher-skilled occupation, with over 50% of those changing occupation moving
to a higher-skilled one. From appendix D we see that these more highly skilled occupations tend to be
technical and professional jobs (specifically engineering, ICT and science technicians and ICT
professionals). By contrast, only 19.9% of those in the food trades move to a more highly skilled
occupation, and almost 75% of them move to a lower-skilled occupation. For the food trades, the most
common more highly skilled occupation comprises hospitality, retail and service managers (appendix E).
The skill levels assigned by the ABS are very coarse. Another way to analyse the mobility data is to
look at what happens to the wages of those who leave. We do not have data on wages before and
after moving, but we can rank occupations according to their average wage levels. We take the
average total weekly earnings for each occupation, based on the Survey of Employee Earnings and
Hours (see appendix D), and use this to identify the potential wage gain or loss for those leaving the
occupation.10
Table 10 tabulates our results for each of the trades. We include engineering, ICT and science
technicians for completeness, although, as noted earlier, they are not usually considered a trade.
Table 10 Change in average weekly income for occupational leavers Feb. 2007 – Feb. 2008
ANZSCO sub-major group occupation in February 2007
Average weekly income
Feb. 2007 ($)
Average change in income for job movers ($)
Average change in income for job losers ($)
Average change in income for all occupation leavers(a) ($)
Engineering, ICT & science technicians
1498.60 (79.80) (280.10) (113.20)
Automotive & engineering trades workers
1249.00 30.40 (42.50) 14.40
Construction trades workers 1107.60 182.50 (117.60) 93.60 Electrotechnology trades workers 1268.40 64.00 (36.60) 50.30 Food trades workers 852.70 266.8 13.00 208.30 Skilled animal & horticultural workers
835.20 344.60 272.40 337.40
Other technicians, trades workers
1149.30 22.10 14.00 19.20
Notes: (a) This is the weighted average based on the proportions of job movers and job losers (data not shown). A figure in parenthesis indicates a negative dollar amount, that is, a decrease in weekly salary from February 2007 wage. Source: Generated from ABS Survey of Labour Mobility, 2008, confidentialised unit record file, cat.no.6209, published and
unpublished data from the Survey of Employee Earnings and Hours, cat.no.6306.0 and unpublished data for managerial occupations.
The first point to note is the wide variability in average wages within the trades — from $835 for
skilled animal and horticultural workers, to $1268 for electrotechnology and telecommunications
workers. On average, all those exiting a trade go to occupations which are paid better (with the
exception of automotive and engineering trades, where there is little change). The largest gains are
for skilled animal and horticultural workers and food trades workers, who are the worst paid of the
trades. Almost no one leaving any of these trades goes to an occupation that earns less. This suggests
that wage differences between occupations are a factor behind occupational mobility.
This is a quite different picture from the one based on the ABS skill levels. It suggests that on the
whole those leaving a trade for another occupation are doing it for positive reasons — to increase
earnings. On the other hand, the evidence for trades providing a springboard to a career is rather
10 The ABS data used to determine wages specifically excludes business owners, contractors and subcontractors.

24 Attrition in the trades
weak. From the skill level movements it seemed that the electrotechnology and telecommunication
trades is the best platform from which to move on. However, the increase in earnings (as reflected by
average salaries of destination occupations) for people leaving this occupation is quite modest,
although they do move to the highest-paying occupations.
The third approach in determining whether a trade background is a useful foundation for other
careers is to use the Australian Socioeconomic Index 2006 (McMillan, Beavis & Jones 2009) and
compare the occupational prestige of their original trade occupation with that of their new
occupation. Table 11 presents the average change in occupational prestige for those who leave their
trade occupations. The scale measures the social standing or desirability of occupations, based on a
model linking prestige ratings to the education, income and other socioeconomic characteristics of
occupations. The scale ranges from 0 to 100, where labourers are scored at 0.0 and medical
practitioners are rated at 100. As can be seen from table 12, trade occupations are not highly ranked
(electrotechnology has a rank of 41, food trades 21).
In table 11, we see that job movers are likely to move up in occupational prestige, although the
increases are modest. For job losers, the story is mixed, in that those who are engineering, ICT and
science technicians, or in construction trades and automotive and engineering trades are more likely
to suffer a substantial drop in occupational prestige, whereas the remaining occupations will
experience an increase. In some cases this is a larger increase than for job movers who changed
occupations. Food trades workers who move occupations experience the greatest increase in
occupational prestige, while engineering and science technicians and construction trades workers who
change occupations are more likely to experience the greatest drop in prestige.
What is observed here is similar to the story for wages, in which the majority of those who have left
their occupation are doing better. In this case, however, we notice that construction trades workers
fare worse, presumably because they have moved to a less-skilled occupation. Further, the
engineering, ICT and science technicians who leave their occupation experience a drop in
occupational prestige. This is matched by a corresponding drop in average weekly wage of the
destination occupation relative to the origin occupation but an increase in overall skill level. One
can’t help but wonder if this is due to the qualification level of those in this category, in that they
may now be competing for jobs with people who have higher-level qualifications.
Table 11 Change in occupational prestige for occupational leavers Feb. 2007 – Feb. 2008
ANZSCO sub-major group occupation in February 2007
AUSEI06 score in Feb. 2007
Average change in prestige for
job movers
Average change in prestige for
job losers
Average change in prestige for all occupation
leavers(a)
Engineering, ICT & science technicians
57.7 1.6 -23.2 -2.5
Automotive & engineering trades workers
30.4 6.7 -3.7 4.4
Construction trades workers 36.4 1.2 -16.6 -4.1 Electrotechnology trades workers 41.0 6.6 -1.4 5.5 Food trades workers 21.2 7.3 7.4 7.3 Skilled animal & horticultural workers
32.7 4.6 3.7 4.5
Other technicians, trades workers
33.5 -0.5 5.2 1.5
Note: (a) This is the weighted average based on the proportions of job movers and job losers (data not shown). Source: Generated from ABS Survey of Labour Mobility, 2008, confidentialised unit record file, cat.no.6209 and AUSE106 Index
from McMillan, Beavis and Jones (2009).

NCVER 25
Taking these results together we get a rather mixed picture. First, the ABS skills index is really too
coarse to be useful. Second, the six sub-major groups have quite different patterns. We observe that
those who leave the electrotechnology, skilled animal and food trades experience an improvement in
wages and prestige on average, but the first starts from a high base, while the others start from a
much lower base.
Thus our answer to the question about whether a trade is a good stepping-off point, is ‘yes’ for the
electrotechnology but ‘not necessarily’ for the other trades. This assessment is broadly consistent
with Webster and Jarvis (2003).

26 Attrition in the trades
Final comments The motivation behind this paper was the existence of skill shortages in the trades. The intention of
the paper was to look at attrition in the trades as a possible cause of skills shortages vis-a-vis
inadequacies in the output of the training system.
As a matter of arithmetic, a reduction in attrition would go some way to addressing pressures on the
labour supply for trades. However, our analysis did not produce any evidence that attrition is much
more of an issue in the trades than it is in our comparator occupations, the professions.
Our conclusion, that attrition in the trades is not such an issue, implies that inadequacies in labour
supply should be the focus if skill shortages emerge. However, entrants into the trades could be either
apprentices or ex-tradespersons. A question for future research is the balance between these two
sources: are apprenticeships the only game in town or are those who have previously left the trade a
worthwhile source of supply?
The second interesting point to emerge from the analysis is the relationship between attrition and the
economic cycle. From a reading of the popular press at times of boom one would get the impression
that labour mobility is one of the causes of skills shortages. However, we argue that such mobility is
more of a problem for particular employers than it is for an occupation. In boom times, job mobility
increases but occupational mobility is largely unaffected: it is job churn rather than occupational
attrition. In bad times, however, there is a difference between the trades and the professions.
Tradespeople are much more likely to lose their jobs than are professionals.
We also examined the idea that occupational attrition in the trades may not be a ‘bad’ thing because
individuals are going to better jobs; a trade is a good foundation for a career. Our analysis paints a
mixed picture, and there is only one trade for which there is convincing evidence that the trade is a
good foundation for a career — electrotechnology. Electrotechnology and telecommunications trade
workers are the highest-paid, have the highest prestige of the trades and on average move on to
better jobs.
In concentrating on employees, this study does not take into account those who move out of the trade
to start up their own business in the trade, perhaps hoping for higher financial rewards. However,
there is potential for a further study which investigates the extent to which occupational mobility is
affected by movement out of the trades to self-employment. Becoming self-employed is especially
observed in trades like construction, and in other technician and trade workers (for example,
carpentry and joinery, and hairdressing).
A final comment is that the definition of a trade is a little problematic and the ABS includes a number
of occupations in ANZSCO level 3 (technician and trades) that don’t seem to fit very well with the
common notion of a trade. At one end, the engineering, ICT and science technicians have
characteristics more like those of professional occupations than of trades occupations. They are
better paid, and are assessed as having skill level 2 not 3 by the ABS. At the other end of the scale are
skilled animal and horticultural workers. These are the worst-paid in the group and those leaving this
occupation appear to be quite disparate, with some going to management, technician and
professional jobs, but over a half going to labouring and other lower-level jobs. While these
classification issues do not affect our analysis to any great degree, they do indicate that one needs to
be careful in interpreting data at the ANZSCO one-digit level.

NCVER 27
References ABS (Australian Bureau of Statistics) 2008, Labour mobility survey 2008, cat.no.6202.0.30.005, ABS, Canberra.
Australian Chamber of Commerce and Industry 2006, ‘Addressing skill shortages: an industry—government partnership’, ACCI Review, no.134, pp.7—11.
Ball, K & John, D 2005, Apprentice and trainee completion rates, NCVER, Adelaide, viewed October 2005, <http://www.ncver.edu.au/publications/1582.html>.
Boxall, P, Macky, K & Rasmussen, E 2003, ‘Labour turnover and retention in New Zealand: the causes and consequences of leaving and staying with employers’, Asia Pacific Journal of Human Resources, vol.41, no.2, pp.196—214.
Brereton, D, Beach, R & Cliff, D 2003, ‘Employee turnover as a sustainability issue’, Centre for Social Responsibility in Mining, University of Queensland & Sustainable Minerals Institute, viewed 23 September 2011, <http://www.csrm.uq.edu.au/docs/MCApaperTurnover1.pdf>.
Department of Education, Employment and Workplace Relations 2008, ‘Jobs Australia’, viewed October 2010, <http://www.workplace.gov.au/NR/,donlyres/FA91FB91-73A8-4F5D-83CF-D391BEDF3538/0/ AustralianJobsforWorkplace.pdf>.
——2010, ‘Skills shortages Australia’, viewed May 2010, <http://www.deewr.gov.au/Employment/LMI/ SkillShortages/Documents/NationalSkillShortageReport2012.pdf>.
Energy Skills Queensland 2009, Addressing skills wastage in apprenticeships — non completion rates, Research report no.1, ESQ, Rocklea, Qld, viewed June 2009, <http://www.energyskillsqld.com.au/ index.php?option=com_rubberdoc&view=doc&id=25&format=raw>.
Fehring, H, Malley, J & Robinson, L 2008, ‘The first ten years of working life: the experiences of those with trade and bachelor degree qualifications’, Working paper series, 2008, Centre for Applied Research, RMIT University, Melbourne.
Folk, H & Yett, DE 1968 (republished in 2007), ‘Methods for estimating occupational attrition’, Western Economic Journal, pp.297—302.
Gow, K, Warren, C, Anthony, D & Hinschen, C 2008, ‘Retention and intentions to quit among Australian male apprentices’, Education + Training, vol.50, no.3, pp.216—30.
Group Training Australia & Group Training Association of Victoria 2005, Good start: great finish: improving completion rates for New Apprentices, viewed January 2007, <http://www.gtaltd.com.au/projects/ gstart_gfinish/good_start_great_finish.pdf>.
Karmel, T & Ong, K 2007, Will we run out of young men? Implications of the ageing of the population for the trades in Australia, NCVER, Adelaide, viewed December 2007, <http://www.ncver.edu.au/ publications/1935.html>.
Mangan, J & Trendle, B 2008, Variation in apprenticeship cancellation across regional Queensland, Labour Market Research Unit working paper series no.58, viewed March 2009, <http://www.trainandemploy. qld.gov.au/resources/business_employers/pdf/wp58_app_cancellation.pdf>.
McMillan, J, Beavis, A & Jones, FL 2009, ‘The AUSEI06: a new socioeconomic index for Australia’, Journal of Sociology, vol.45, no.2, pp.123—49.
Ray, D, Beswick, W, Lawson, C, O’Brien, C & Madigan, S 2000, Attrition in apprenticeships: an analysis of apprentices commencing between July 1994 and June 1996, Department of Education, Training and Youth Affairs, Canberra.
Shah, C & Burke, G 2001, ‘Occupational replacement demand in Australia’, International Journal of Manpower, vol.22, no.7, pp.648—63.
——2003, Labour mobility: demographic, labour force and education effects and implications for VET, CEET, Monash University, Melbourne, viewed April 2010, <http://www.education. monash.edu.au/centres/ceet/docs/otherpapers/ShahBurkeLabourMobility2004.pdf>.
Snell, D & Hart, A 2007, ‘I think about leaving every day. Doesn’t everyone?’ Reasons for non–completion and dissatisfaction amongst apprentices and trainees’, Monash University, Melbourne, viewed June 2008, <http://arts.monash.edu.au/humcass/ruwcf/garpreport.pdf>.
Trendle, B 2007, The labour market and apprenticeship retention in Queensland’s traditional trades, Labour Market Research Unit working paper series no. 44, viewed September 2009, <http://www.training.qld.gov.au/employers/labour-market-research/working-papers/wp44-apprenticeship-retention.html>.
Webster, E & Jarvis, K 2003, The occupational career paths of Australian tradesmen, Melbourne Institute of Applied Economic and Social Research, University of Melbourne, viewed 29 August 2011, <http://www.melbourneinstitute.com/wp/wp2003n14.pdf>.

28 Attrition in the trades
Appendix A Table A1 Model parameters for logistic regression (1 = exit job within 12 months), males
ANZSCO sub-major group occupations
Sample size
Intercept Age (years)
Age ^2 Tenure (mths)
Tenure^2
Arts and media professionals 160 -1.07 0.0972 -0.00091 0.0410 -0.00015 Business, human resource and marketing professionals
953 -0.34 0.0566 -0.00060 0.0193 -0.00005
Design, engineering, science and transport professionals
773 -1.63 0.1491 -0.00157 0.0124 -0.00003
Education professionals 508 -3.49 0.1957 -0.00232 0.0627 -0.00023 Health professionals 364 2.53 -0.0356 0.00005 0.0185 -0.00005 ICT professionals 463 3.78 -0.1412 0.00167 0.0110 -0.00006 Legal, social and welfare professionals
234 0.25 0.0182 -0.00004 0.0140 -0.00004
Engineering, ICT and science technicians
538 -1.44 0.1437 -0.00169 0.0112 -0.00004
Automotive and engineering trades workers
1167 0.31 0.0179 -0.00021 0.0329 -0.00012
Construction trades workers 1152 -0.30 0.0703 -0.00093 0.0275 -0.00008 Electrotechnology and telecommunications trades worker
666 1.70 -0.0690 0.00119 0.0311 -0.00011
Food trades workers 331 2.22 -0.1540 0.00241 0.0467 -0.00018 Skilled animal and horticultural workers
272 2.35 -0.0606 0.00063 0.0179 -0.00056
Other technicians and trades workers
384 1.50 -0.0126 0.00001 0.0133 -0.00003
Source: Derived from ABS, Survey of Labour Mobility, 2008, confidentialised unit record file, cat.no.6209.
Table A1 presents the regression coefficients of the regression model used to determine job exiting.
In undertaking this regression job exiting, age and duration were derived from the 2008 ABS Labour
Mobility Survey. Table A2 presents the standard errors of the regression coefficients.
The response variable of interest is that of job exiting. Job exiting was constructed using the
following variables: LMWKNG2C — Whether working at February 2008; CHEMBUSC — Change of
employer/business in the last 12 months; and LMWKINGC — Whether working at February 2007. An
individual is defined to have changed jobs in the 12 months from February 2007 to February 2008 if
there were working in February 2008 (LMWKNG2C = 1), and they have had at least one change of
employer/business in the last 12 months (CHEMBUSC in [1,2,3,5]), or if they were not employed in
February 2007 but are employed now, or if they were not employed in February 2008 but were
employed in February 2007. Those who have changed jobs are coded with a 1, and those who did not
change jobs are coded as 0.
The second variable under consideration is that of age. In the expanded CURF on the ABS RADL, age
is a continuous variable and so is used directly from the dataset, although the age-squared variable
is constructed.

NCVER 29
Table A2 Standard errors for parameters (given in table A1) in job leaving regression, males
ANZSCO sub-major group occupations
Intercept Age (years) Age2 Tenure (mths)
Tenure2
Arts and media professionals 0.115 0.005 0.000 0.001 0.000 Business, human resource and marketing professionals
0.053 0.003 0.000 0.001 0.000
Design, engineering, science and transport professionals
0.063 0.003 0.000 0.000 0.000
Education professionals 0.088 0.004 0.000 0.000 0.000 Health professionals 0.105 0.004 0.000 0.000 0.000 ICT professionals 0.104 0.005 0.000 0.000 0.000 Legal, social and welfare professionals
0.122 0.005 0.000 0.000 0.000
Engineering, ICT and science technicians
0.066 0.003 0.000 0.000 0.000
Automotive and engineering trades workers
0.036 0.000 0.000 0.000 0.000
Construction trades workers 0.037 0.003 0.000 0.000 0.000 Electrotechnology and telecommunications trades worker
0.058 0.003 0.000 0.000 0.000
Food trades workers 0.065 0.004 0.000 0.000 0.000 Skilled animal and horticultural workers
0.092 0.004 0.000 0.000 0.000
Other technicians and trades workers
0.065 0.003 0.000 0.000 0.000
Note: The values with 0.000 represent very small standard errors, they are not zero. Source: Derived from ABS, Survey of Labour Mobility, 2008, confidentialised unit record file, cat.no.6209.
The final variable to be constructed is that of job duration. The regression model is to include a
respondent’s job duration as at February 2007. However, duration with employer/business is not
directly available for their job at February 2007. Job duration is collected in the Labour Mobility Survey
for an individual’s employer at February 2008 (DREM08CF), and for their duration in their last job
(DURLJB2C, if applicable). These are categorical variables comprising the following ten categories:
0. Not applicable
1. Under 3 months
2. 3 and under 6 months
3. 6 and under 12 months
4. 1 and under 2 years
5. 2 and under 3 years
6. 2 and under 5 years
7. 5 and under 10 years
8. 10 and under 20 years
9. 20 years are over
We have converted this to a continuous variable by assigning duration to the mid-points of the ranges of these categories (in months), with the exception of under 3 months and 20 years and over, which have been assigned 1.5 months and 240 months respectively. In order to determine duration as at February 2007 (approximately), the following is used.
If individual hasn’t changed jobs between February 2007 to February 2008, then duration =
duration of current job — 12 months

30 Attrition in the trades
If individual has changed jobs:
- and currently not working and duration in last job is greater than or equal to 12 months, then
job duration is duration of last job — 12 months
- and currently not working and duration in last job less than 12 months, then job duration is
duration of last job
- currently employed, then job duration is duration of last job — 12 months + duration of current
job.
This derivation gives us an approximate duration at February 2007. We hope that, in future, the ABS
will collect job duration as at February 2007.
Given these variables, the logistic regression model (probability of job changing) is:
Where is the vector of 0/1 responses indicating whether a respondent has changed jobs or not,
represents the intercept, is the regression coefficient for age, is the n 1 vector of ages, is
the regression coefficient for age-squared, is the n 1 vector of squared ages, is the regression
coefficient for duration, is the n 1 vector of duration, is the regression coefficient of duration-
squared, and represents duration-squared.
The logistic regression model has been estimated using maximum likelihood methods in SAS. The
resultant regression coefficients appear in table B1. The regression coefficients for each occupation
have then been converted to the probability of job changing using:
,
where is the predicted probability and is the linear predictor from each regression model for
each occupation.

NCVER 31
05
1015202530
20 28 36 44 52 60 68 76 84
Age (years)
Histogram of age distribution for male who leave job -Health professionals
05
1015202530
20 28 36 44 52 60 68 76 84
Age (years)
Histogram of age distribution for males who leave job - Design and engineering
professionals
0
5
10
15
20
15 20 25 30 35 40 45 50 55 60 65 70 75
Age (years)
Histogram of age distribution for males who leave job - Electrotechnology trades workers
05
101520
15 20 25 30 35 40 45 50 55 60 65 70 75
Age (years)
Histogram of age distribution for males who leave job - Engineering, ICT and science
technicians
0
5
10
15
20
15 20 25 30 35 40 45 50 55 60 65 70 75
Age (years)
Histogram of age distribution for males who leave job - Skilled animal & horticultural
workers
05
10152025
20 28 36 44 52 60 68 76 84
Age (years)
Histogram of age distribution for males who leave job - arts and media professionals
0
5
10
15
20
15 20 25 30 35 40 45 50 55 60 65 70 75
Age (years)
Histogram of age distribution for males who leave job - Construction trades workers
05
1015202530
20 28 36 44 52 60 68 76 84
Age (years)
Histogram of age distribution for males who leave job - Business, human resource and
marketing professionals
Appendix B Here we present the distributions of ages for those who exit their jobs for ANZSCO sub-major group
professional and trade occupations.
Figure 3 Age distributions for males who leave their job, by occupation

32 Attrition in the trades
05
10152025
20 28 36 44 52 60 68 76 84
Age (years)
Histogram of age distribution for males who leave job - Education professionals
05
10152025
15 20 25 30 35 40 45 50 55 60 65 70 75
Age (years)
Histogram of age ditribution for males who leave job - Food trades workers
0
5
10
15
20
15 20 25 30 35 40 45 50 55 60 65 70 75
Age (years)
Histogram of age distribution for males who leave job - Automotive and engineering trades
workers
0
5
10
15
20
25
15 20 25 30 35 40 45 50 55 60 65 70 75
Age (years)
Histogram of age distribution for males who leave job - Other technicians, trades workers
05
1015202530
20 28 36 44 52 60 68 76 84
Age (years)
Histogram of age distribution for males who leave job - Legal and related professionals
05
1015202530
20 28 36 44 52 60 68 76 84
Age (years)
Histogram of age distribution for male who leave job -Health professionals
Source: Derived from ABS, Survey of Labour Mobility, 2008, confidentialised unit record file, cat.no.6209.
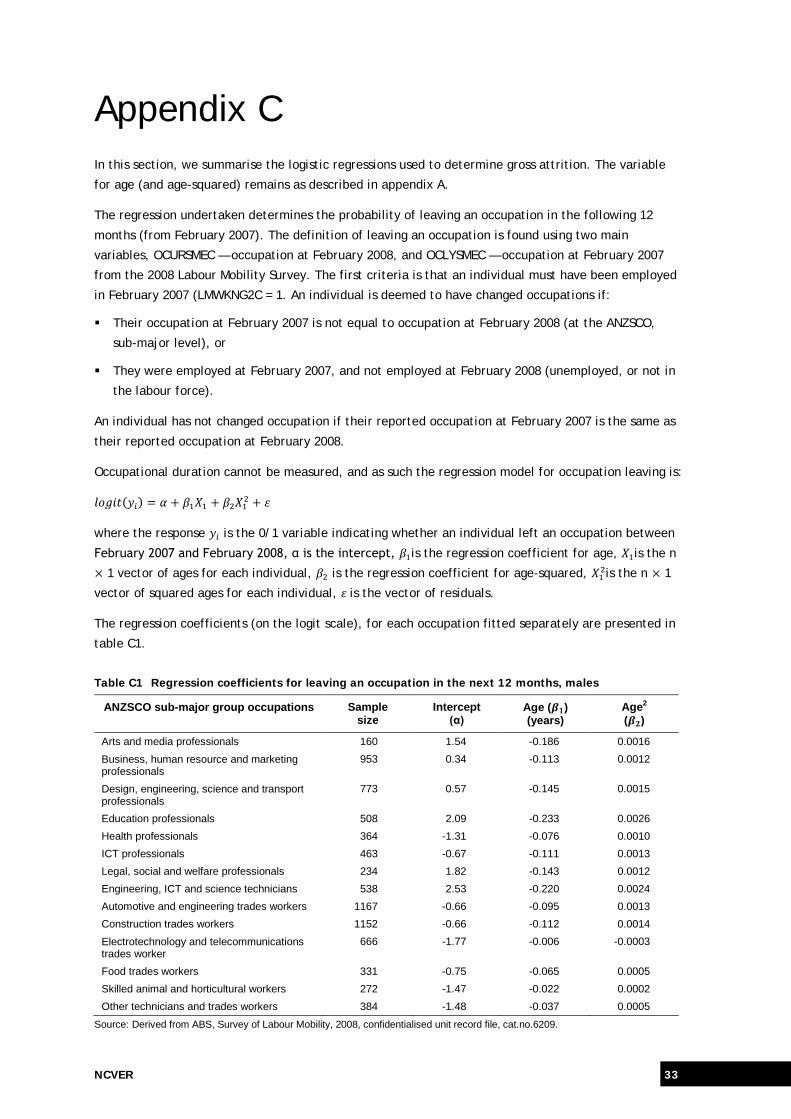
NCVER 33
Appendix C In this section, we summarise the logistic regressions used to determine gross attrition. The variable
for age (and age-squared) remains as described in appendix A.
The regression undertaken determines the probability of leaving an occupation in the following 12
months (from February 2007). The definition of leaving an occupation is found using two main
variables, OCURSMEC — occupation at February 2008, and OCLYSMEC — occupation at February 2007
from the 2008 Labour Mobility Survey. The first criteria is that an individual must have been employed
in February 2007 (LMWKNG2C = 1. An individual is deemed to have changed occupations if:
Their occupation at February 2007 is not equal to occupation at February 2008 (at the ANZSCO,
sub-major level), or
They were employed at February 2007, and not employed at February 2008 (unemployed, or not in
the labour force).
An individual has not changed occupation if their reported occupation at February 2007 is the same as
their reported occupation at February 2008.
Occupational duration cannot be measured, and as such the regression model for occupation leaving is:
where the response is the 0/1 variable indicating whether an individual left an occupation between
February 2007 and February 2008, α is the intercept, is the regression coefficient for age, is the n
1 vector of ages for each individual, is the regression coefficient for age-squared, is the n 1
vector of squared ages for each individual, is the vector of residuals.
The regression coefficients (on the logit scale), for each occupation fitted separately are presented in
table C1.
Table C1 Regression coefficients for leaving an occupation in the next 12 months, males
ANZSCO sub-major group occupations Sample size
Intercept (α)
Age ( ) (years)
Age2 ( )
Arts and media professionals 160 1.54 -0.186 0.0016 Business, human resource and marketing professionals
953 0.34 -0.113 0.0012
Design, engineering, science and transport professionals
773 0.57 -0.145 0.0015
Education professionals 508 2.09 -0.233 0.0026 Health professionals 364 -1.31 -0.076 0.0010 ICT professionals 463 -0.67 -0.111 0.0013 Legal, social and welfare professionals 234 1.82 -0.143 0.0012 Engineering, ICT and science technicians 538 2.53 -0.220 0.0024 Automotive and engineering trades workers 1167 -0.66 -0.095 0.0013 Construction trades workers 1152 -0.66 -0.112 0.0014 Electrotechnology and telecommunications trades worker
666 -1.77 -0.006 -0.0003
Food trades workers 331 -0.75 -0.065 0.0005 Skilled animal and horticultural workers 272 -1.47 -0.022 0.0002 Other technicians and trades workers 384 -1.48 -0.037 0.0005
Source: Derived from ABS, Survey of Labour Mobility, 2008, confidentialised unit record file, cat.no.6209.

34 Attrition in the trades
Standard errors for regression coefficients presented in table C1 appear in table C2.
Table C2 Standard errors of regression coefficients for occupation leaving, males
ANZSCO sub-major group occupations Intercept (α) Age ( ) (years) Age2 ( )^
Arts and media professionals 0.130 0.007 0.000 Business, human resource and marketing professionals
0.056 0.003 0.000
Design, engineering, science and transport professionals
0.072 0.003 0.000
Education professionals 0.092 0.004 0.000 Health professionals 0.118 0.005 0.000 ICT professionals 0.128 0.006 0.000 Legal, social and welfare professionals 0.123 0.005 0.000 Engineering, ICT and science technicians 0.066 0.003 0.000 Automotive and engineering trades workers 0.042 0.003 0.000 Construction trades workers 0.047 0.003 0.000 Electrotechnology and telecommunications trades worker
0.069 0.004 0.000
Food trades workers 0.076 0.004 0.000 Skilled animal and horticultural workers 0.095 0.004 0.000 Other technicians and trades workers 0.073 0.004 0.000
Note: The values with 0.000 represent very small standard errors, they are not zero. Source: Derived from ABS, Survey of Labour Mobility, 2008, confidentialised unit record file, cat.no.6209.

NCVER 35
Appendix D Table D1 ANZSCO occupation by average cash weekly earnings, 2008 and AUSEI06 prestige measures
Occupation: name and ANZSCO occupation Average cash weekly earnings ($)
AUSEI06 ABS skill level*
11 General managers 2352.60 78.2 1 12 Farm managers 1051.80 34.0 1 13 Specialist managers 2049.60 71.4 1 14 Hospitality, retail and service managers 1328.00 45.4 2 21 Arts and media professionals 1489.70 68.1 1 22 Business, human resource and marketing professionals 1617.80 77.3 1 23 Design, engineering, science and transport professionals 1663.20 81.2 1 24 Education professionals 1454.80 84.9 1 25 Health professionals 2096.60 85.1 1 26 ICT professionals 1689.60 81.3 1 27 Legal, social and welfare professionals 1528.30 84.4 1 30 Technicians and trade workers nfd 1236.10 35.9 3 31 Engineering, ICT and science technicians 1498.60 57.7 2 32 Automotive and engineering trades workers 1249.00 30.4 3 33 Construction trades workers 1107.60 36.4 3 34 Electrotechnology and telecommunications trades workers 1268.40 41.0 3 35 Food trades workers 852.70 21.2 2,3 36 Skilled animal and horticultural workers 835.20 32.7 3 39 Other technicians and trades workers 1149.30 33.5 3 41 Health and welfare support workers 1339.40 60.0 2 42 Carers and aides 888.50 34.9 4 43 Hospitality workers 845.00 34.7 4,5 44 Protective service workers 1382.60 47.8 2,3,4,5 45 Sports and personal service workers 1071.40 49.8 3,4 51 Office managers and program administrators 1363.60 57.4 2 52 Personal assistants and secretaries 1078.20 44.8 3 53 General clerical workers 1008.00 41.9 4 54 Inquiry clerks and receptionists 957.80 37.3 4 55 Numerical clerks 1091.20 48.8 4 56 Clerical and office support workers 971.30 37.7 5 59 Other clerical and administrative workers 1129.00 47.1 3,4,5 61 Sales representatives and agents 1219.40 50.7 2,3,4 62 Sales assistants and salespersons 947.80 30.8 5 63 Sales support workers 1062.50 32.0 5 70 Machinery operators nfd 1231.70 21.0 4 71 Machine and stationary plant operators 1414.70 25.1 4 72 Mobile plant operators 1264.40 14.7 4 73 Road and rail drivers 1207.30 21.1 4 74 Storepersons 924.10 20.8 4 80 Labourers 997.90 18.5 4,5 81 Cleaners and laundry workers 804.40 20.4 5 82 Construction and mining labourers 1243.70 23.3 4,5 83 Factory process workers 940.80 12.1 5 84 Farm, forestry and garden workers 828.00 11.0 5 85 Food preparation assistants 774.10 22.0 5 89 Other labourers 982.60 24.8 5
Note: * Where multiple skill levels exist, the bolded level is the one used.

36 Attrition in the trades
Appendix E Destinations of occupational movers in the trades, 2008
These tables have been generated from the ABS 2008 Survey of Labour Mobility. Occupations are
based on ANZSCO sub-major group occupations.
Table E1 Engineering, ICT and science technicians (2008 ANZSCO 3), males
Upwards movement (%) Downwards movement (%) Across skill level movement (%)
Specialist managers 5.9 Automotive and engineering trade workers
4.5
Hospitality, retail and service managers
1.2 Construction trade workers
4.3
Business human resources and marketing
11.6 Electrotechnology and telecommunications trades workers
5.1
Design, engineering science and transport and education professionals
9.9 Skilled animal and horticultural workers
0.7
Personal assistants and secretaries
2.2
Health professionals 2.4 General clerical workers 3.8 ICT professionals 20.8 Inquiry clerks and
receptionists 0.6
Numerical clerks 5.6 Legal, social and welfare professionals
2.2 Other clerical and administrative workers
5.2
Machine operators nfd 8.2 Labourers 5.7 Total 54.1 Total 45.9 Total 0.0
Source: Derived from ABS, Survey of Labour Mobility, 2008, confidentialised unit record file, cat.no.6209.

NCVER 37
Table E2 Automotive and engineering (2008 ANZSCO 32), males
Upwards movement (%) Downwards movement (%) Across trades movement (%)
Specialist managers 8.0 Construction trades 2.0 Managing supervisors (sales and service)
2.8 Road and rail drivers 8.5 Electrotechnology and telecommunications trades
6.1
Business human resources and marketing
0.8 Labourers 26.2 Skilled and animal horticultural workers
1.1
Design, engineering science and transport and education professionals
4.4 General clerical workers 0.4
Engineering, ICT and science technicians
7.7 Inquiry clerks and receptionists
3.4
Office managers and program administrators
2.9 Machine and stationary plant operators
3.9
Numerical clerks 1.7 Clerical and office
support workers 1.5
Other clerical and administrative workers
2.4
Sales assistants and salespersons
7.1
Machinery operators nfd 2.1 Mobile plant operators 7.3 Total 26.5 Total 64.3 Total 9.2
Source: Derived from ABS, Survey of Labour Mobility, 2008, confidentialised unit record file, cat.no.6209.
Table E3 Construction trades (2008 ANZSCO 33), males
Upwards movement (%) Downwards movement (%) Across trades movement (%)
Specialist managers 17.1 Labourers 45.4 Automotive and engineering trades
1.9
Engineering, ICT and science technicians
4.8 Road and rail drivers 4.0
Office managers and program administrators
7.0 Storepersons 7.7
Machinery and stationary plant operators
2.0
Sales representatives and agents
4.8
Sales assistants and
sales persons 5.4
Total 28.9 Total 69.3 Total 1.9 Source: Derived from ABS, Survey of Labour Mobility, 2008, confidentialised unit record file, cat.no.6209.

38 Attrition in the trades
Table E4 Electrotechnology (2008 ANZSCO 34), males
Upwards movement (%) Downwards movement (%) Across trades movement (%)
Business, human resource and marketing professionals
4.8 Labourers 11.7 Automotive and engineering trades
9.2
Engineering, ICT and science technicians
14.6 Storepersons 3.7 Construction trades 2.1
Hospitality, retail and service managers
5.2 Machinery and stationary plant operators
3.3
Design, engineering science and transport and education professionals
6.9 Sales assistants and sales workers
8.6
ICT professionals 14.5 Numerical clerks 4.2 Other clerical and
administrative workers 2.6
Protective service workers
8.6
Total 46.0 Total 42.7 Total 11.3 Source: Derived from ABS, Survey of Labour Mobility, 2008, confidentialised unit record file, cat.no.6209.
Table E5 Food trades (2008 ANZSCO 35), males
Upwards movement (%) Downwards movement (%) Across trades movement (%)
Business, human resource and marketing professionals
3.0 Labourers 13.4 Construction trades 4.5
Hospitality, retail and service managers
11.3 Road and rail drivers 8.9 Other technician and trades workers
3.4
Storepersons 6.5 Machinery and stationary
plant operators 4.1
Sales assistants and sales persons
24.6
Sales representatives and agents
1.9
Carers and aides 9.0 Hospitality workers 3.8 Health and welfare
support workers 5.6
Total 14.3 Total 77.8 Total 7.9 Source: Derived from ABS, Survey of Labour Mobility, 2008, confidentialised unit record file, cat.no.6209.
Table E6 Skilled agricultural and horticultural workers (2008 ANZSCO 36), males
Upwards movement (%) Downwards movement (%) Across trades movement (%)
General managers and farm managers
9.7 Labourers 28.4 Construction trades 7.9
Specialist managers 7.2 Sales assistants and sales persons
6.1
Engineering, ICT and science technicians
13.0 General clerical workers 7.6
Design, engineering science and transport and education professionals
11.1 Clerical and office support workers
9.0
Total 41.0 Total 51.1 Total 7.9 Source: Derived from ABS, Survey of Labour Mobility, 2008, confidentialised unit record file, cat.no.6209.
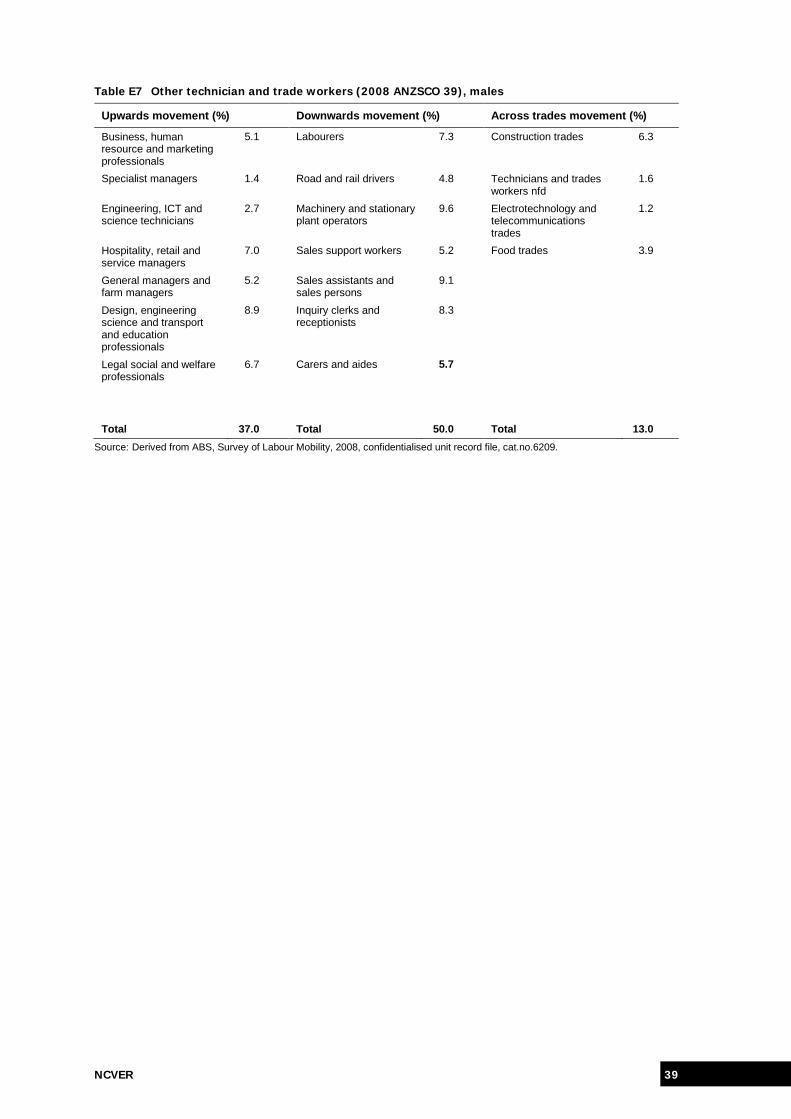
NCVER 39
Table E7 Other technician and trade workers (2008 ANZSCO 39), males
Upwards movement (%) Downwards movement (%) Across trades movement (%)
Business, human resource and marketing professionals
5.1 Labourers 7.3 Construction trades 6.3
Specialist managers 1.4 Road and rail drivers 4.8 Technicians and trades workers nfd
1.6
Engineering, ICT and science technicians
2.7 Machinery and stationary plant operators
9.6 Electrotechnology and telecommunications trades
1.2
Hospitality, retail and service managers
7.0 Sales support workers 5.2 Food trades 3.9
General managers and farm managers
5.2 Sales assistants and sales persons
9.1
Design, engineering science and transport and education professionals
8.9 Inquiry clerks and receptionists
8.3
Legal social and welfare professionals
6.7 Carers and aides 5.7
Total 37.0 Total 50.0 Total 13.0
Source: Derived from ABS, Survey of Labour Mobility, 2008, confidentialised unit record file, cat.no.6209.

National Centre for Vocational Education Research Ltd
Level 11, 33 King William Street, Adelaide, South Australia
PO Box 8288, Station Arcade, SA 5000 Australia
Telephone +61 8 8230 8400 Facsimile +61 8 8212 3436
Website www.ncver.edu.au Email [email protected]