Attributing Illnesses to Foods Using Data from Outbreaks...
35
Attributing Illnesses to Foods Using Data from Outbreaks and Expert Elicitation ILSI 2012 | 23 January 2012 Michael Batz University of Florida Emerging Pathogens Institut e with J. Glenn Morris Jr. University of Florida Emerging Pathogens Institute Sandra Hoffmann USDA Economic Research Service
Transcript of Attributing Illnesses to Foods Using Data from Outbreaks...

Attributing Illnesses to Foods Using Data from Outbreaks and Expert Elicitation
ILSI 2012 | 23 January 2012
Michael Batz University of Florida Emerging Pathogens Institute with J. Glenn Morris Jr. University of Florida Emerging Pathogens Institute Sandra Hoffmann USDA Economic Research Service

Requisite Disclosure Additional affiliation:
Executive Director, Food Safety Research Consortium
Prior employers: University of Maryland School of Medicine Resources for the Future
Primary funding sources: Robert Wood Johnson Foundation USDA NIFA (previously CSREES) Pew (via Produce Safety Project)

Report released: April 28, 2011
Funded by: Robert Wood Johnson Foundation
Available: epi.ufl.edu
Many of today’s
results from submitted articles,
not report


Risk-Based Food Safety System
1. Strategic planning
2. Public health risk ranking
3. Targeted information gathering
4. Analysis and selection of
interventions
5. Design of intervention plan
6. Monitoring and review
NAS. Enhancing Food Safety. 2010 (p. 82)

The Analytical Objective To target interventions and prioritize
effort, we need to understand where the biggest problems lie
This means estimating the burden of specific etiologic agents (pathogens) and the vehicles (foods) of exposure Which pathogens in which foods
cause the greatest impact on public health?

The Starting Point Scallan et al. (2011):
48 million cases of foodborne illness annually, 128,000 hospitalizations, 3,000 deaths
31 identified pathogens cause 9.4 million cases of illness (20% of total), 56,000 hospitalizations (44%), 1400 deaths (45%)
14 major pathogens cause 95% of illnesses due to known pathogens, 96% of hospitalizations, 98% of deaths
Scallan, E., et al. 2011. Foodborne illness acquired in the United States – major pathogens. Emerg. Infect. Dis. 7(1): 7-15.
Scallan, E., et al. 2011. Foodborne illness acquired in the United States—unspecified agents. Emerg. Infect. Dis.17(1): 16-22.

Major Steps in Analysis 14 pathogens in 12 food categories
Incidence Estimates {annual illnesses, hosp’s, death due to each pathogen}
Public Health Impact {$ and QALY loss due to each pathogen}
Food Attribution {$ and QALY loss due to each pathogen-food combination}
Rank Pathogens {$& QALYs}
Rank Pathogen- Food Combinations {$ & QALYs}
Rank Foods (sum across pathogens) {$ & QALYs}

Ranges reflect 90% confidence intervals from Scallan et al.

Food Attribution

Risk Ranking Context Approach depends on decision:
Targeted risk management: (e.g. on-farm controls for single pathogen)
Broad allocation of resources (e.g. many pathogens, many foods)
Risk ranking is sensitive to methodological differences across risk categories‡
A mix-and-match approach is problematic Preference is to use same method for all pathogens
‡ Morgan M.G., et al. 2000. Categorizing risks for risk ranking. Risk Anal. 20: 49-58.

Attributing Illnesses to Foods Many Methods, None Perfect
1. Microbial subtyping 2. Outbreak data 3. Case-control studies 4. Intervention studies 5. Comparative exposure assessments 6. Expert elicitation

Data Sources: Outbreaks Pulled from predecessor to CDC’s
database of foodborne outbreak data http://www.cdc.gov/foodborneoutbreaks/
Ten years (1999-2008) 14 pathogens: 5830 outbreaks (172,495 cases) “Unknown” food: 2636 outbreaks (70,568 cases) Multiple vehicles: 606 outbreaks (22,485 cases) Attributable: 2588 outbreaks (79,442 cases)

Food Categories Comprehensive across food supply Foods as consumed (point of exposure): more
akin to menu sections than commodity groups Complex foods, baked goods, and deli meat
reflect important role of food preparation
Beef Dairy Produce Poultry Eggs Beverages Pork Seafood Baked goods Deli/other meats Game Complex foods

Coding Scheme Code outbreaks into categories:
Single food item or identified ingredient Complex dish with multiple ingredients
Ingredients in same category (e.g. green salad) Ingredients in multiple categories
Code by primary ingredient (e.g. cheeseburger as beef, quiche as egg)
If no obvious primary ingredient (e.g. pizza, macaroni salad), bin as complex foods (776 outbreaks (24,357 cases) as complex foods)
Tabulate fractions for each pathogen across food categories

Coding Bias? Assumptions may bin more in meat categories
than other approaches that attribute to constituent ingredients of complex dishes
But impact likely minimal: Many of these pathogens are zoonotic in origin with
known animal reservoirs; sporadic studies repeatedly identify animal pathways as more relevant
Outbreaks reflect cross-contamination, which is almost always unidirectional from animal products to non-animal products during preparation

Outbreak Events vs. Cases The larger the outbreak….
The more likely it is to be reported The more likely it is to be investigated fully The more likely a food vehicle is to be identified The more likely it is to reflect an unusual event
caused by a confluence of major failures
Therefore, large outbreaks are likely over-represented in outbreak data and are more likely to have identified vehicle – this skews attribution towards factors and foods with larger average outbreak size

Likelihood of Identifying Vehicle
Outbreak size
Total number of outbreaks
Percent w/ Known Food (Norovirus)*
Percent w/ Known Food (Non-noro)*
2-5 1252 41% 64% 6-10 1096 42% 60%
11-20 1317 43% 70% 21-50 1346 46% 78%
51-100 485 44% 82% 101-1650 260 44% 84%
Percent of total outbreaks with identified food vehicle(s). Outbreaks include those due to 14 major pathogens from 1999-2008.


Outbreak Size, by Food Category

Salmonella Outbreak count attribution
Outbreak case attribution
Beef 7% 4% Beverages 1% 3% Breads and Bakery 3% 2% Dairy 6% 5% Deli/Other Meats 3% 2% Eggs 12% 9% Game 0% 0% Pork 7% 5% Poultry 21% 14% Produce 18% 33% Seafood 5% 3% Complex foods 19% 19% Total 100% 100%
Count vs. Case Attribution: Salmonella

Data Source: Expert Judgment Expert elicitation survey (2003)
Conducted to evaluate outbreak attribution and fill in gaps
44 finalized surveys (out of about 90) Same food categories as outbreak data with
exception of complex foods (removed in pre-tests)
Published: Hoffmann, et al. 2007. Dec. Anal. 4(2):91-109. Hoffmann, et al. 2007. J. Food Prot. 70(5):1220-1229. Hoffmann, et al. 2008. Reliability Eng.and Sys. Safety 93(5): 687-
698.

Elicitation Tool
Asked to provide: Best estimate 90% confidence intervals Self-assessed certainty
Intra- and inter-expert measures of uncertainty
For attribution: mean of best estimates
Hoffmann, et al. 2007. J. Food Prot. 70(5):1220-11229.

Can multiple methods be combined?
Assumption: outbreak data are preferable because they reflect observed data, but are not always adequate
Approach: Evaluate strength of outbreak data on pathogen-by-
pathogen basis Based on totality of evidence, decide where expert
attribution should be used as alternative to outbreak attribution

Measuring Reliability (1) 1. Density of outbreak data
Number of “attributable” outbreaks reported Some pathogens have too few outbreaks
2. Ratio of estimated incidence (Scallan et al.) to reported outbreak cases Measure of representativeness that reflects number
of sporadic, non-outbreak cases for each reported outbreak case
High ratios suggest outbreak data captures relatively small fraction of overall illness

Measuring Reliability (2) 3. Sum of mean difference squared between
expert and outbreak estimates Use outbreak data from 1993-2002 for data
concurrent with 2003 elicitation Large differences show where experts differ from
outbreaks considerably
4. Mean standard deviation of expert estimates Signal of agreement among experts High variance → disagreement among experts:
scientific knowledge on attribution is low

Attribution reliability measures
Num of attrib.
outbreaks
Ratio (Scallan: outbreak cases)
Sum of mean diff. squared outbk/expert
Mean st dev of experts
Campylobacter 120 1,712 3,307 0.91 C. perfringens 362 495 -- -- Cryptosporidium 4 1,152 3,622 1.64 Cyclospora 14 87 62 0.42 E. coli 0157 143 132 20 0.76 STEC non-O157 15 745 -- -- L. monocytogenes 20 55 827 0.96 Norovirus 1,125 555 701 1.77 Salmonella 621 296 218 1.02 Shigella 41 256 1,198 1.68 Toxoplasma 0 -- -- 2.02 Vibrio spp. 59 780 9 0.25 Yersinia 5 11,909 562 1.38
Expert elicitation did not include C. perfringens or STEC non-O157. STEC non-O157 outbreaks include suspected enterohemorrhagic E. coli w/o confirmed etiology. See Hoffmann et al. 2007. Dec. Anal. 4(2): 91-109 for more on expert uncertainty measures.

Measuring Reliability (3) 5. Comparison to case control studies Campylobacter
Friedman et al. 2004. Clin. Infect. Dis. 38(S3): S285-96
PAF: chicken in restaurant (24%), non-poultry meat in restaurant (21%), turkey in restaurant (4%), pink chicken (3%), raw seafood (3%), raw milk (1.5%)
Supports expert attribution
Toxoplasma
Jones et al. 2009. Clin. Infect. Dis. 49(6): 878-84
No PAF, but high odds ratios for rare lamb, raw ground beef, raw shellfish, locally cured meats.
Experts: pork, beef, and game. High variance. No outbreak data.

Baseline attribution percents (%)
Cam
pyl.
C. P
erfr
ing.
Cryp
to.
Cycl
ospo
ra
E. c
oli O
157
non-
O15
7
List
eria
Nor
oviru
s
Salm
onel
la
Shig
ella
Toxo
plas
ma
Vibr
io
Yers
inia
Data source: Exp Out Exp Out Out Out Out Out Out Out Exp Out Exp
Beef 4 33 7 0 55 40 0 4 7 15 23 0 2
Beverages 0 0 9 0 2 13 0 2 1 0 0 0 1
Baked goods 0 0 0 0 1 0 0 8 3 0 0 0 0
Complex foods 0 24 0 21 13 7 15 46 19 49 0 0 0
Dairy 8 1 6 0 6 20 30 2 6 2 2 0 12
Deli meats 1 3 1 0 3 0 35 2 3 5 2 0 2
Eggs 3 0 0 0 0 0 0 1 12 0 0 0 0
Game 2 0 5 0 0 0 0 0 0 0 20 0 2
Pork 4 8 2 0 0 0 5 3 7 0 41 0 72
Poultry 72 27 1 0 1 7 5 8 21 10 4 0 1
Produce 5 3 60 79 18 13 5 16 18 12 7 0 3
Seafood 1 1 8 0 1 0 5 9 5 7 1 100 5
Out=outbreak, Exp=expert. Rounded values may not sum to 100%.

Ranked Pathogen/Food Combinations (Average Rank) Ra
nk
Pathogen/Food Combination
COI ($ mill) QALY Loss Illnesses Hospitalizations Deaths
1 Campy/Poultry 1,257 (606–2,988)
9,541 (5,753–18,730)
608,231 (242,588–1,159,624)
6,091 (3,095–10,960)
55 (0–239)
2 Toxoplasma/Pork 1,219 (723–1,819)
4,495 (2,471–6,875)
35,537 (26,590–45,879)
1,815 (1,080–2,736)
134 (82–198)
3 Listeria/Deli Meats 902 (71–2,433)
3,281 (536–8,234)
557 (195–1,106)
509 (182–1,056)
89 (0–257)
4 Salmonella/Poultry 693 (33–1,797)
3,513 (64–9,290)
215,109 (134,979–351,621)
4,048 (1,789–7,848)
79 (0–212)
5 Listeria/Dairy 773 (61–2,086)
2,812 (459–7,058)
477 (167–948)
437 (156–905)
77 (0–220)
5 Norovirus/Complex 911 (519–1,432)
2,288 (1,319–3,565)
2,485,694 (1,468,679–3,781,737)
6,673 (3,685–10,615)
68 (38–108)
7 Salmonella/Complex 618 (30–1,604)
3,135 (57–8,290)
191,944 (120,443–313,754)
3,612 (1,596–7,003)
71 (0–189)
8 Salmonella/Produce 581 (28–1,507)
2,946 (53–7,790)
180,361 (113,175–294,821)
3,394 (1,500–6,580)
66 (0–177)
8 Toxoplasma/Beef 689 (409–1,028)
2,541 (1,396–3,886)
20,086 (15,029–25,931)
1,026 (610–1,546)
76 (46–112)
10 Salmonella/Eggs 389 (19–1,009)
1,973 (36–5,217)
120,792 (75,796–197,449)
2,273 (1,004–4,407)
44 (0–119)
Baseline assumptions. Rank based on average of QALY and COI ranks. Ranges based upon 90% CI from Scallan et al. incidence estimates. Game excluded.

Ranking Results: Sensitivity to Attribution Assumptions Scenario* Baseline 1 2 3 4 5 6
Attribution method Out+Exp Out+Exp Out Out Exp Out+Exp Out+Exp Outbreak Approach Events Cases Events Cases N/A Events Events
Complex foods In In In In In In Out Multi-source Out Out Out Out Out In Out
Campylobacter/Poultry 1 1 9 27 1 1 1 Toxoplasma/Pork 2 2 - - 4 2 2 Listeria/Deli Meats 3 4 3 3 2 4 3 Salmonella/Poultry 4 9 4 8 3 6 4 Listeria/Dairy 5 9 6 8 8 6 5 Norovirus/Complex 5 5 5 5 - 4 - Salmonella/Complex 7 7 6 5 - 3 - Salmonella/Produce 8 3 8 3 9 9 6 Toxoplasma/Beef 8 8 - - 6 8 7 Salmonella/Eggs 10 11 9 10 5 10 8 Listeria/Complex 11 5 11 5 - 10 - Salmonella/Beef 12 18 14 17 11 12 10 Norovirus/Produce 14 12 15 11 7 17 8 Campylobacter/Dairy 19 16 2 2 19 16 21 Norovirus/Seafood 22 27 21 25 10 27 12 Toxoplasma/Unknown - - 1 1 - - -
Only rows ranking in top 10 in one of scenarios included. Game excluded.
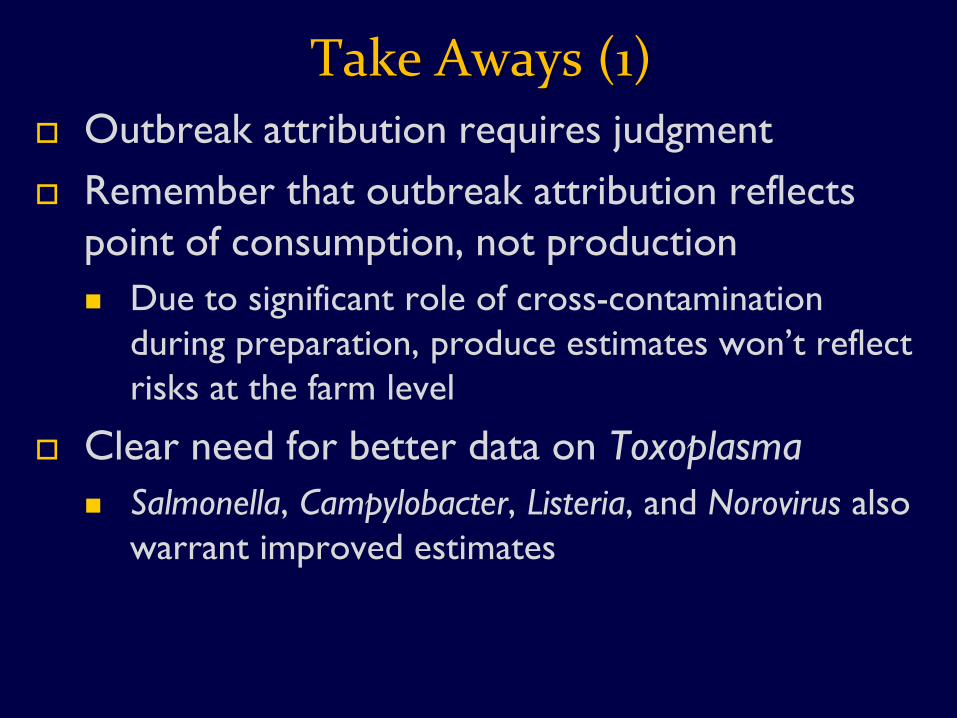
Take Aways (1) Outbreak attribution requires judgment Remember that outbreak attribution reflects
point of consumption, not production Due to significant role of cross-contamination
during preparation, produce estimates won’t reflect risks at the farm level
Clear need for better data on Toxoplasma Salmonella, Campylobacter, Listeria, and Norovirus also
warrant improved estimates

Take Aways (2) Expert elicitation is useful
When there are data gaps When care is taken to measure uncertainties Particularly when done in manner that allows for
comparison and combination with other data A lot of unexplored potential
Ranking is sensitive to attribution assumptions and data sources, but top-identified pathogen/food pathways are fairly robust

“I can live with doubt and uncertainty and not knowing. If we will only allow that, as we progress, we remain unsure, we will leave opportunities for alternatives. We will not
become enthusiastic for the fact, the knowledge, the absolute truth of the day, but
remain always uncertain …
In order to make progress, one must leave the door to the unknown ajar.”
Richard Feynman