Attraction, Entrance, and Passage Efficiency of Arctic ...
76
ATTRACTION, ENTRANCE, AND PASSAGE EFFICIENCY OF ARCTIC GRAYLING, TROUT, AND SUCKERS AT DENIL FISHWAYS IN THE BIG HOLE RIVER BASIN, MONTANA by Benjamin Louis Triano A thesis submitted in partial fulfillment of the requirements for the degree of Master of Science in Fish and Wildlife Management MONTANA STATE UNIVERSITY Bozeman, Montana April 2020
Transcript of Attraction, Entrance, and Passage Efficiency of Arctic ...

ATTRACTION, ENTRANCE, AND PASSAGE EFFICIENCY OF ARCTIC GRAYLING,
TROUT, AND SUCKERS AT DENIL FISHWAYS IN THE
BIG HOLE RIVER BASIN, MONTANA
by
Benjamin Louis Triano
A thesis submitted in partial fulfillment
of the requirements for the degree
of
Master of Science
in
Fish and Wildlife Management
MONTANA STATE UNIVERSITY
Bozeman, Montana
April 2020

©COPYRIGHT
by
Benjamin Louis Triano
2020
All Rights Reserved

ii
DEDICATION
This thesis is dedicated to my family and friends for their constant love and support, to
Nolan for his hard work that made this project possible, and to all the fish that can’t speak
for themselves.

iii
ACKNOWLEDGMENTS
This project would not be possible without the guidance and support of my
graduate committee: Kevin Kappenman, Tom McMahon, Matt Blank, and Al Zale. I
thank Kevin Kappenman for taking a lead role in organizing this project, Tom McMahon
and Al Zale for making critical contributions in reviewing this manuscript, and Matt
Blank for providing hydraulic knowledge that was essential to this research. I thank Al
Parker for assisting me with data analyses, Kurt Heim for teaching me coding skills and
reviewing this manuscript, and Katey Plymesser, Joel Cahoon, and Nolan Platt for
providing additional hydraulic knowledge. Specifically, I thank my co-worker Nolan
Platt for his many thoughtful contributions, hard work, and dedication in the field.
This was a collaborative effort and I thank our project partners in the Big Hole
River valley with Montana Fish, Wildlife & Parks (MTFWP), the U.S. Fish & Wildlife
Service (USFWS), and the Montana Department of Natural Resources and Conservation
for helping us access study sites and communicate with landowners. Specifically, I thank
Austin McCullough for helping me contact landowners, and I thank the landowners that
let us work on their land. I also thank the folks at the MTFWP Yellowstone River Trout
Hatchery for rearing the grayling tested in this study, and the folks at the United States
Forest Service Ranger Station in Wisdom, Montana, for providing housing
accommodations. This project was funded by the U.S. Geological Survey, the USFWS
Region 6 Fish Passage Program and Bozeman Fish Technology Center, the George Grant
Chapter of Trout Unlimited, and Montana State University’s Department of Ecology,
College of Engineering, and Western Transportation Institute.

iv
TABLE OF CONTENTS
1. ATTRACTION, ENTRANCE, AND PASSAGE EFFICIENCY OF ARCTIC
GRAYLING, TROUT, AND SUCKERS AT DENIL FISHWAYS
IN THE BIG HOLE RIVER BASIN, MONTANA .........................................................1
Introduction ......................................................................................................................1
Methods............................................................................................................................5
Study Area ...............................................................................................................5
Study Sites ...............................................................................................................6
Hydraulic Conditions ...............................................................................................7
Test Fish ...................................................................................................................8
Wild Fish ......................................................................................................8
Hatchery-reared Arctic Grayling .................................................................9
Test Protocol ..........................................................................................................10
Antenna Construction and Operation.....................................................................10
Detection Probability .............................................................................................11
In-Situ ........................................................................................................11
Post Hoc .....................................................................................................12
Data Analyses ................................................................................................................13
Species Groups.......................................................................................................13
Transit Times .........................................................................................................14
Proportional Fishway Efficiency ...........................................................................14
Statistical Analyses ................................................................................................15
Efficiency Estimates and Species Comparisons ........................................16
Fishway Efficiency vs. Upstream Depth ...................................................16
Multiple Regression Analyses ...................................................................18
Results ............................................................................................................................19
Detection Probability .............................................................................................19
Transit Times .........................................................................................................20
Proportional Fishway Efficiency ...........................................................................21
Efficiency Estimates and Species Comparisons ....................................................22
Fishway Efficiency vs. Upstream Depth ...............................................................23
Multiple Regression Analyses ...............................................................................24
Attraction ...................................................................................................24
Entrance .....................................................................................................26
Passage .......................................................................................................27
Discussion ......................................................................................................................28
Management Brief .........................................................................................................37
Assessment and Modification of Currently Installed Fishways ............................37
Design Criteria for Future Denil Fishway Installations .........................................39

v
TABLE OF CONTENTS CONTINUED
REFERENCES CITED ......................................................................................................42
APPENDIX A: Tables and Figures ...................................................................................50

vi
LIST OF TABLES
Table Page
1. Physical and Hydraulic Conditions ....................................................................53
2. Summarized Fishway Efficiencies .....................................................................54
3. Odds of Attraction, Entrance, and Passage ........................................................62
4. AIC Model Selection: Multiple Regression Analyses for
Attraction, Entrance, and Passage ..........................................................................63
5. Parameter Estimates from Top Models for Attraction,
Entrance, and Passage ............................................................................................64
vii
LIST OF FIGURES
Figure Page
1. Map of Upper Big Hole River Basin Study Area ..............................................51
2. Denil Fishway Schematic ..................................................................................52
3. General Schematic of Study Site and PIT Array Configuration ........................52
4. Fishway Efficiency vs. Upstream Depth ...........................................................55
5. Fishway Efficiency vs. Fishway Discharge .......................................................56
6. Fishway Efficiency vs. Downstream Depth .......................................................57
7. Fishway Efficiency vs. Slope .............................................................................58
8. Fishway Efficiency vs. Attraction Flow ............................................................59
9. Transit Times .....................................................................................................60
10. Time After Release Until Passage ...................................................................61
11. Fishway Efficiency Estimates ..........................................................................62
12. Trial 5 Photo ....................................................................................................65
13. Trial 11 Photo ..................................................................................................66
14. Trial 2 Photo ....................................................................................................67
viii
ABSTRACT
The Big Hole River in southwest Montana supports the only indigenous, self-
sustaining fluvial population of Arctic Grayling (Thymallus arcticus) in the conterminous
United States. Denil fishways have been installed at 63 low-head irrigation diversion
dams throughout the basin to provide grayling and other fishes year-round access to
critical habitats; however, their efficiency has not been evaluated comprehensively. We
quantified attraction, entrance, and passage efficiency of grayling, trout (Brook Trout
Salvelinus fontinalis and Brown Trout Salmo trutta), and suckers (White Sucker
Catostomus commersonii and Longnose Sucker C. catostomus) at six Denil fishways
during 14 trials conducted over a range of fishway slopes and hydraulic conditions.
Tagged hatchery-reared grayling and wild fish of several taxa were released downstream
of diversions in each trial, and upstream passage was monitored for 72 hours using
passive integrated transponder telemetry. Attraction (60.4-84.3%) and entrance (44.3-
78.6%) efficiencies limited overall fishway efficiencies (19.1-55.8%), but passage
efficiencies (96.2-97.0%) were high for all taxa over all conditions tested. Attraction of
hatchery-reared grayling was limited at fishways with shallow upstream depths (low
fishway discharges) and low attraction flows, but wild trout and suckers were less limited
by these effects. Entrance of grayling and trout was limited at high fishway discharges
and fishways with steep slopes, but both species groups were more likely to enter
fishways with deep downstream depths than those with shallow downstream depths.
Entrance appeared to be limited by turbulent plunging conditions associated with shallow
downstream depths. Denil fishways demonstrated great promise for improving habitat
connectivity for grayling and other fishes in the Big Hole River basin; however, attraction
and entrance were key bottlenecks that limited overall fishway efficiency. Maintaining
high attraction flows and deep downstream depths should be the focus of adaptive
management strategies and design criteria to improve overall efficiency of Denil
fishways in the Big Hole basin.
1
ATTRACTION, ENTRANCE, AND PASSAGE EFFICIENCY OF ARCTIC
GRAYLING, TROUT, AND SUCKERS AT DENIL FISHWAYS IN
THE BIG HOLE RIVER BASIN, MONTANA
Introduction
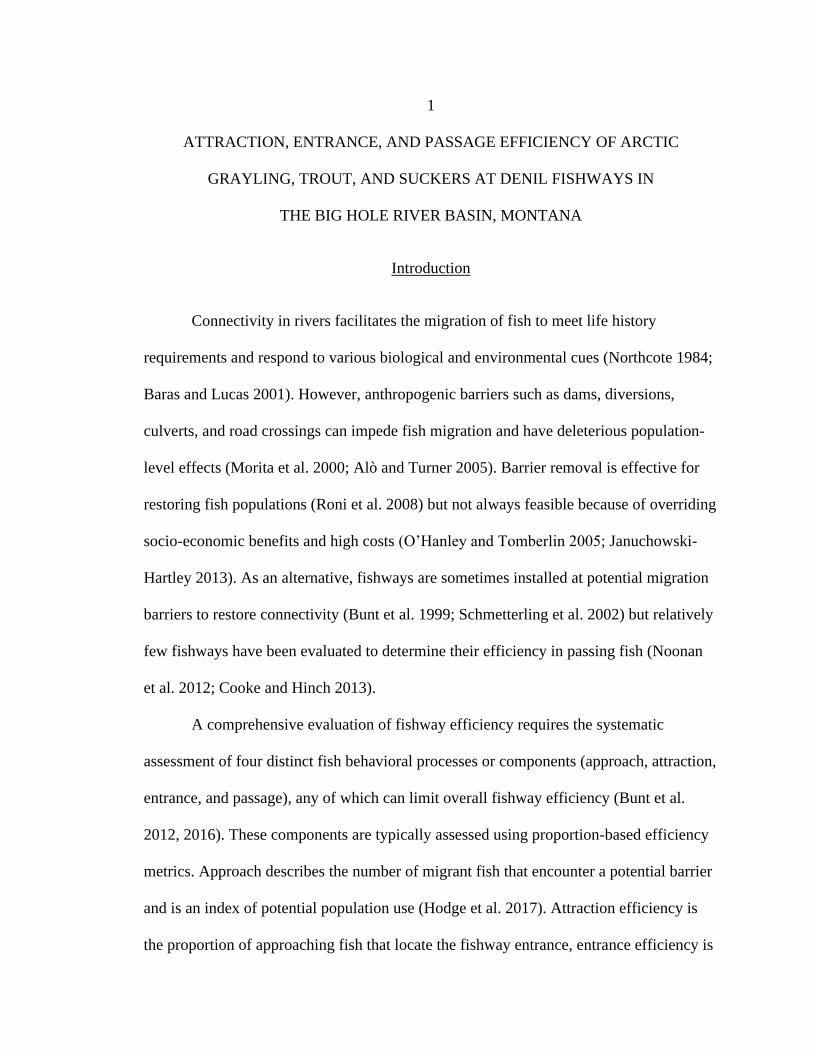
Connectivity in rivers facilitates the migration of fish to meet life history
requirements and respond to various biological and environmental cues (Northcote 1984;
Baras and Lucas 2001). However, anthropogenic barriers such as dams, diversions,
culverts, and road crossings can impede fish migration and have deleterious population-
level effects (Morita et al. 2000; Alò and Turner 2005). Barrier removal is effective for
restoring fish populations (Roni et al. 2008) but not always feasible because of overriding
socio-economic benefits and high costs (O’Hanley and Tomberlin 2005; Januchowski-
Hartley 2013). As an alternative, fishways are sometimes installed at potential migration
barriers to restore connectivity (Bunt et al. 1999; Schmetterling et al. 2002) but relatively
few fishways have been evaluated to determine their efficiency in passing fish (Noonan
et al. 2012; Cooke and Hinch 2013).
A comprehensive evaluation of fishway efficiency requires the systematic
assessment of four distinct fish behavioral processes or components (approach, attraction,
entrance, and passage), any of which can limit overall fishway efficiency (Bunt et al.
2012, 2016). These components are typically assessed using proportion-based efficiency
metrics. Approach describes the number of migrant fish that encounter a potential barrier
and is an index of potential population use (Hodge et al. 2017). Attraction efficiency is
the proportion of approaching fish that locate the fishway entrance, entrance efficiency is
2
the proportion of attracted fish that enter the fishway, and passage efficiency is the
proportion of entering fish that successfully pass (Cooke and Hinch 2013). Overall
efficiency is the proportion of approaching fish that are attracted to, enter, and pass a
fishway (Baker et al. 2019); therefore, overall efficiency can be limited by low attraction,
entrance, and passage efficiencies.
Quantifying these metrics individually provides important insight as to how each
component limits overall efficiency (Bunt et al. 2012). For example, large numbers of
approaching fish may be attracted to a fishway, but few may enter. Alternatively, few
approaching fish may be attracted to a fishway, but those that are attracted may have high
entrance and passage success. The time it takes a fish to approach, attract, enter, and pass
a fishway is also of interest because delays at barriers and passage structures can
detrimentally affect reproduction and fish health (Mesa and Magie 2006; Newton et al.
2018). Understanding such fish behavioral processes will help identify where fish are
limited in using a fishway and inform adaptive management strategies to enhance overall
fishway efficiency.
Denil fish ladders (Katopodis 1992) are commonly used to restore connectivity in
rivers (Bunt et al. 1999; Haro et al. 1999; Schmetterling et al. 2002) because they are
inexpensive, easy to install, and well suited to low-head dams (Clay 1995). However,
their efficiency for passing many species under different hydraulic conditions (e.g.,
depth, discharge, velocity) is not well understood (Haro et al. 1999; Mallen-Cooper and
Stuart 2007). Seasonal hydrologic variation alters entrance (downstream) and exit
(upstream) depths at Denil and other fishways (Hinch and Bratty 2000; Platt 2019), and
3
depth markedly affects hydraulic conditions such as water velocity and turbulence inside
a Denil fishway, thereby affecting passage success (Haro et al. 1999). Upstream and
downstream fishway depths could provide a promising indicator of Denil fishway
efficiency because depth can be used as a simple proxy for the complex hydraulic
conditions inside a Denil fishway (Rajaratnam and Katopodis 1984). Additionally, depths
are easily monitored with in-stream staff gauges and can be directly linked to annual
hydrologic variation (Platt 2019). Thus, fishway depths could serve as a critical
component of Denil fishway design criteria.
Fishway slope also affects hydraulic conditions inside a Denil fishway and
presumably passage success (Haro et al. 1999). The maximum slope recommended for
passing salmonid fishes through a Denil fishway is 16.7% (USFWS 2017). Slopes up to
15% had little effect on passage success of Arctic Grayling (Thymallus arcticus) through
a similar Alaska Steeppass fish ladder (Tack and Fisher 1977), but steeper slopes
negatively affected passage of non-salmonid fishes through Denil fishways (Haro et al.
1999; Mallen-Cooper and Stuart 2007). Slope is directly linked to upstream and
downstream fishway depths, and ideally, slope could be set so that fishway depths and
hydraulic conditions are favorable for fishway use at all seasonal discharges. A better
understanding of how slope and depth affect Denil fishway efficiency could inform
fishway design criteria that improve the effectiveness of fishways for restoring fish
populations threatened by stream fragmentation.
Arctic Grayling inhabiting an 80-100 km section of the upper Big Hole River in
Montana are the last remaining indigenous, self-sustaining fluvial Arctic Grayling
4
population in the conterminous United States (Shepard and Oswald 1989; Kaya 1992).
Arctic Grayling are listed as a Species of Concern in Montana and have been considered
for protection under the Endangered Species Act (ESA) since 1982 (MTFWP 2013;
USOFR 2014). Big Hole River Arctic Grayling are known to make seasonal migrations
exceeding 80 km to access critical main-stem and tributary habitats for spawning,
feeding, wintering, and thermal refuge (Shepard and Oswald 1989; Lamothe and Magee
2003; Vatland 2015); however, the Big Hole River basin is fragmented by numerous low-
head irrigation diversion dams (typically "pin and plank" style; Schmetterling et al. 2002)
that impound and divert water for agricultural production.
Involvement of private landowners was critical to conservation of Big Hole River
Arctic Grayling. The Candidate Conservation Agreement with Assurances (CCAA) for
Fluvial Arctic Grayling in the Upper Big Hole River was established in 2006 (MTFWP
and USFWS 2006). The CCAA program encourages voluntary participation by
landowners to implement conservation measures, in exchange for assurances that they
will not have to change their land and water management practices if Arctic Grayling
become ESA listed. A primary focus of this program is the removal of barriers to Arctic
Grayling migration. Denil fishways have been installed at 63 irrigation diversions in the
Big Hole River basin to allow continued diversion of water for agriculture while
improving habitat connectivity; however, their efficiency for passing Arctic Grayling and
other fishes has not been evaluated comprehensively.
We evaluated overall efficiency of Denil fishways for facilitating upstream
passage of Arctic Grayling and other species in the Big Hole River basin using Passive

5
Integrated Transponder (PIT) telemetry. Our main objectives were to 1) quantify
attraction, entrance, and passage efficiencies of grayling and other fishes, 2) determine
how slope and fishway depths affect each component of overall efficiency, and 3)
provide adaptive management strategies and design criteria to improve fishway efficiency
and habitat connectivity in the Big Hole River basin by addressing specific limiting
factors.
Methods
Study Area
The Big Hole River originates in the Beaverhead Mountains of southwest
Montana and flows 250 km to its confluence with the Beaverhead River, forming the
Jefferson River (DNRC 1979). The Big Hole is characterized by meandering, riffle-pool
sequences within a single or braided channel. The Big Hole and its tributaries provide a
variety of critical habitats for a diverse assemblage of native and nonnative fishes
including Arctic Grayling, Westslope Cutthroat Trout Oncorhynchus clarkii lewisi,
Brook Trout Salvelinus fontinalis, Brown Trout Salmo trutta, Rainbow Trout
Oncorhynchus mykiss, Mountain Whitefish Prosopium williamsoni, Burbot Lota lota,
White Sucker Catostomus commersonii, Longnose Sucker Catostomus catostomus,
Mountain Sucker Catostomus platyrhynchus, Longnose Dace Rhinichthys cataractae, and
Rocky Mountain Sculpin Uranidea sp. cf. bairdii (Oswald 2000).
Seasonal hydrologic variation and irrigation practices in the Big Hole River basin
result in highly variable hydraulic conditions at Denil fishways (Platt 2019). The Big
Hole is fed predominantly by spring snowmelt that results in peak stream discharges

6
during June and early July, and low stream discharges (i.e., base flows) during August
and September (Sladek 2013; Vatland 2015). Land use in the basin is predominantly
agricultural with about 1,000 water rights allocated for seasonal diversion of surface
water to irrigate hay fields and support livestock (MTFWP and USFWS 2006). Low base
flows are often exacerbated by irrigation withdrawals that further diminish stream
discharge (Vatland 2015) and potentially limit connectivity through Denil fishways.
Fishway depths and discharges are high in Big Hole Denil fishways during peak stream
discharges but decrease considerably at base flows and during periods of irrigation
withdrawal.
Study Sites
Fishway efficiency was evaluated in 14 field trials at six Denil fishways in the
upper Big Hole River basin (Figure 1) from June to October of 2018. Seventeen fishways
were initially evaluated in 2017 in a companion study of seasonal hydrologic and
hydraulic variation and physical differences among fishway installations (Platt 2019).
Initial evaluations focused on Denil fishways that were expected to be ecologically
important for Arctic Grayling and were in close proximity to the main-stem Big Hole
River (i.e., the first potential barriers on important tributaries). Three primary study sites
(where multiple trials were conducted) and three secondary study sites (where single
trials were conducted) were selected for fishway efficiency evaluations in 2018. Sites
were selected based on access, permission to manipulate irrigation diversion operating
conditions, and to best represent the range of fishway slopes and hydrologic variation
(i.e., stream discharge, and as a consequence fishway discharge and upstream and

7
downstream fishway depths) observed in 2017. Primary sites were located on Steel
Creek, Warm Springs Creek (upper), and the main-stem Big Hole River with respective
fishway slopes of 5.0, 10.7, and 15.6%. Three or four trials were conducted at each
primary site over a range of upstream depths and fishway discharges. Secondary sites
were included to represent other conditions commonly observed among Big Hole
fishways such as submerged fishway entrances at Rock Creek and Swamp Creek, and a
near 0.0% slope and shallow downstream depth at Warm Springs Creek (lower). All
study sites were located within CCAA program boundaries where grayling were once
abundant and historically used spawning and rearing habitat (MTFWP and USFWS
2006).
Hydraulic Conditions
Upstream depth (cm), downstream depth (cm), fishway discharge (m3/s), total
stream discharge (m3/s), fishway attraction flow (%), and water temperature (ºC) were
monitored during each trial (Table 1). Upstream and downstream depths and water
temperatures were recorded every five minutes by data loggers (Onset Computer
Corporation, Bourne, Massachusetts; Model U20L-04) installed in stilling wells
positioned at the exit (upstream depth) and entrance (downstream depth) of the fishway.
Gauge pressures were calculated and converted to upstream and downstream depths after
correcting for atmospheric pressure, and upstream and downstream depths were
measured relative to the bottom (or ‘invert’) of the fishway exit and entrance (Figure 2).
In other words, upstream and downstream depths describe how full the fishway is at the
exit and entrance, respectively. Fishway discharge was calculated from the average
8
estimates of five laboratory-derived rating curves for Denil fishways (Rajaratnam et al.
1997; Katopodis 1992; Katopodis et. al 1997; FAO/DVWK 2002; Odeh 2003) that
predicted discharge from the combination of upstream depth (measured relative to the v-
notch of the most upstream baffle; Figure 2) and fishway slope (as calculated by Platt
[2019]). Total stream discharge downstream of the diversion structure was estimated
daily by converting stage height to discharge using stage-discharge relationships
developed in 2017 (Platt 2019). Fishway attraction flow was calculated by dividing
fishway discharge by total stream discharge, and was expressed as a percentage. In other
words, attraction flow described the relative contribution of fishway discharge to the total
stream discharge downstream of the diversion dam.
Test Fish
Wild Fish Field trials were run with wild fish present at each site, including Brook
Trout (mean TL ± SD = 231 mm ± 58) and other taxa as available: Longnose Sucker (194
mm ± 34), White Sucker (230 mm ± 57), Brown Trout (285 mm ± 73), Burbot (282 mm
± 55), and a single Mountain Whitefish (206 mm). We included 50 Brook Trout in all
trials except trial 1 (n = 36) and up to 30 fish combined of other taxa. Wild fish were
collected on the first day of each trial by backpack electrofishing the stream segment
immediately upstream of the diversion structure. Short-term displacement trials in which
fish are captured upstream of a potential barrier and relocated downstream are effective
for rapid evaluations of passage structures by invoking a homing response that increases
motivation and participation of fish (Armstrong and Herbert 1997; Schmetterling et al.
2002; Burford et al. 2009; Forty et al. 2016). Captured fish were anesthetized with

9
AQUI-S anesthetic (AQUI-S, Kirkland, Washington), measured (TL), and tagged with
half-duplex (HDX) PIT tags (Oregon RFID, Portland, Oregon). Fish longer than 130 mm
were tagged with 23 × 3.65 mm tags (0.6 g); shorter fish were tagged with 12 × 2.12 mm
tags (0.1 g) (Larsen et al. 2013; Forty et al. 2016). Tags were inserted into the abdomen
through a 2-5 mm incision on the ventral surface anterior to the pelvic girdle (Forty et al.
2016); sutures were not necessary for tag retention with such small incisions (Bolland et
al. 2009; Larsen et al. 2013). Tagged fish were placed in 19-L buckets of clean stream
water for about 15 minutes to regain equilibrium and then transferred to live cars in the
stream for holding prior to release.
Hatchery-reared Arctic Grayling Thirty-two age-1, hatchery-reared Arctic
Grayling (212 mm ± 23) were released simultaneously with wild fish in all trials because
of the low and unpredictable abundance of wild grayling in the study area. Test grayling
originated from a population in Axolotl Lake, Montana, that was established from Big
Hole River grayling stock. Grayling were spawned at Axolotl Lake and embryos were
transported to the Yellowstone River Trout Hatchery in Big Timber, Montana, where
they were incubated and reared at 12 ºC. Test grayling were exercised in a flowing
raceway at about 0.3 m/s for at least one month prior to use in trials. Exercise training of
4-6 weeks increases swimming performance in captive-reared fish (Davison 1989;
Davison 1997). Test grayling were PIT-tagged (23 mm) at least one month prior to field
testing. On the day before each trial, 32 fish were randomly netted from the raceway,
scanned for tags, anesthetized, measured, and transported about 350 km to study sites in a
340-L insulated, oxygenated holding tank at 12 ºC. Test grayling remained in the holding
10
tank for 18-24 hours prior to transfer to live cars at each study site; temperature
differences between the holding tank and study streams did not exceed 2 ºC.
Test Protocol
All test fish were held in live cars for at least 1 hour before simultaneous release
downstream of the fishway and diversion dam. Release times were near midday (1145-
1430 hours), except in trial 1 when release time was 1750 hours. Release locations were
in the second pool downstream (15-40 m) of the diversion dam (Figure 3). Therefore, fish
had to volitionally leave the release pool and move upstream (‘approach’) through a riffle
to reach the approach pool directly below the fishway. Plastic fencing (6.35-mm mesh)
was positioned at the downstream end of the release pool to prevent emigration from the
study area; downstream emigration of test fish has been hypothesized as a cause for low
participation in passage studies (Hodge et al. 2017). Fencing was also installed along the
diversion dam spillway to limit upstream passage of fish to the fishway only. After
release, fish movement was monitored for 72 hours using PIT telemetry. We observed
adequate participation of fish during a 72-hour pilot study in 2017, and previous passage
studies have shown participation of displaced fish within 72-hour trials (Burford et al.
2009). Furthermore, we decided short-term trials would be beneficial for conducting
additional trials across a more comprehensive range of hydraulic conditions.
Antenna Construction and Operation
We modified methods of Hodge et al. (2017) and used four stationary PIT
antennas to track the upstream progress of fish through each component of overall
fishway efficiency: approach, attraction, entrance, and passage (Figure 3). All antennas
11
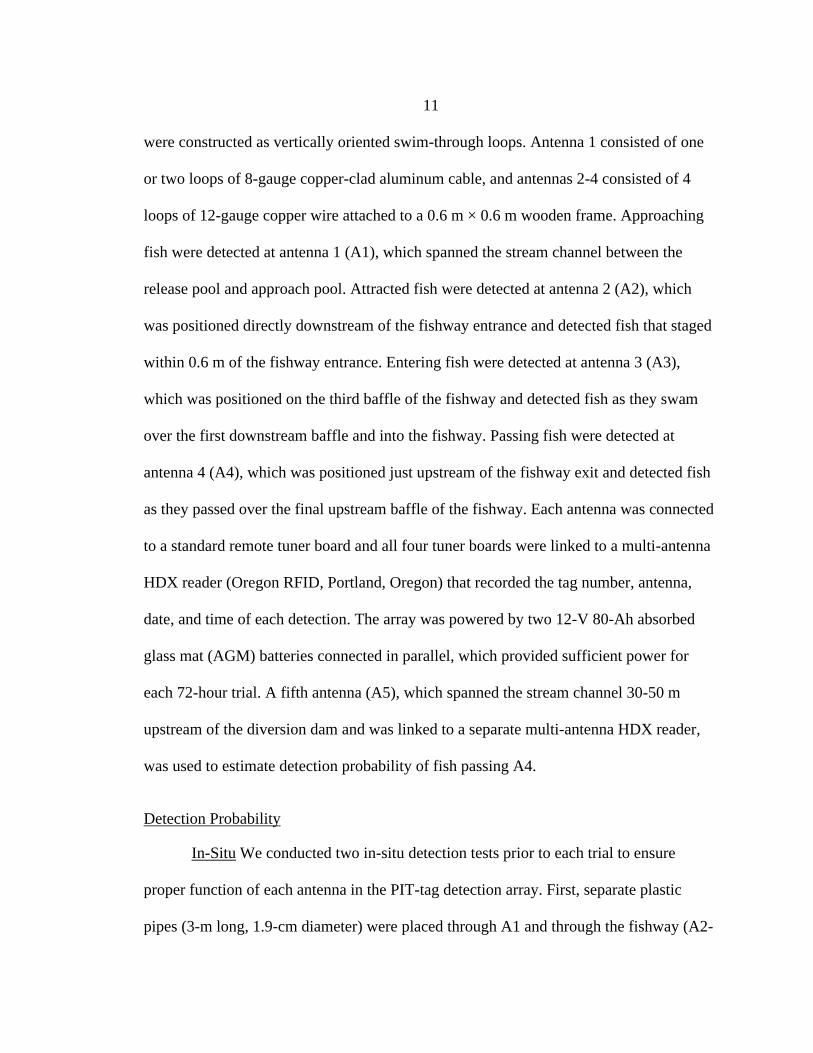
were constructed as vertically oriented swim-through loops. Antenna 1 consisted of one
or two loops of 8-gauge copper-clad aluminum cable, and antennas 2-4 consisted of 4
loops of 12-gauge copper wire attached to a 0.6 m × 0.6 m wooden frame. Approaching
fish were detected at antenna 1 (A1), which spanned the stream channel between the
release pool and approach pool. Attracted fish were detected at antenna 2 (A2), which
was positioned directly downstream of the fishway entrance and detected fish that staged
within 0.6 m of the fishway entrance. Entering fish were detected at antenna 3 (A3),
which was positioned on the third baffle of the fishway and detected fish as they swam
over the first downstream baffle and into the fishway. Passing fish were detected at
antenna 4 (A4), which was positioned just upstream of the fishway exit and detected fish
as they passed over the final upstream baffle of the fishway. Each antenna was connected
to a standard remote tuner board and all four tuner boards were linked to a multi-antenna
HDX reader (Oregon RFID, Portland, Oregon) that recorded the tag number, antenna,
date, and time of each detection. The array was powered by two 12-V 80-Ah absorbed
glass mat (AGM) batteries connected in parallel, which provided sufficient power for
each 72-hour trial. A fifth antenna (A5), which spanned the stream channel 30-50 m
upstream of the diversion dam and was linked to a separate multi-antenna HDX reader,
was used to estimate detection probability of fish passing A4.
Detection Probability
In-Situ We conducted two in-situ detection tests prior to each trial to ensure
proper function of each antenna in the PIT-tag detection array. First, separate plastic
pipes (3-m long, 1.9-cm diameter) were placed through A1 and through the fishway (A2-

12
A4). A single 23-mm PIT tag attached to parachute cord was pulled through each pipe
with a fishing rod at about 1.5 m/s to simulate a single fish moving through the PIT array
(single-tag test). The same test was conducted with three 23-mm PIT tags spaced 0.4 m
apart to simulate multiple fish moving through the PIT array simultaneously (multi-tag
test). The multi-tag test evaluated the potential for missed tag detections because of tag
collision, which occurs when multiple tagged fish move through a detection zone
simultaneously, and some detections are missed because of overlapping signals
(http://support.oregonrfid.com). Ten single-tag and ten multi-tag tests were conducted
prior to each trial, and antenna-specific detection probabilities for each trial were
calculated as the proportion of tags pulled through an antenna that were successfully
detected. For example, if an antenna detected 9 tags in 10 single-tag tests (10 tags), the
detection probability at that antenna was 90.0% for that trial. If an antenna detected 20
tags in 10 multi-tag tests (30 tags), then the detection probability at that antenna was
66.6% for that trial. Antenna-specific detection probabilities from the single-tag test were
averaged among 13 trials to generate single estimates of detection probability at each
antenna from the single-tag test. Separate averages were calculated for each antenna from
the multi-tag test.
Post hoc We conducted a post hoc analysis of all recorded tag detections to
generate additional antenna-specific estimates of detection probability based on observed
fish movements during trials. Encounter histories included a series of binary responses
representing release and subsequent detections (or lack thereof) of fish at each antenna
(Hodge et al. 2017). For example, if a fish was released and only detected at A5 (a
13
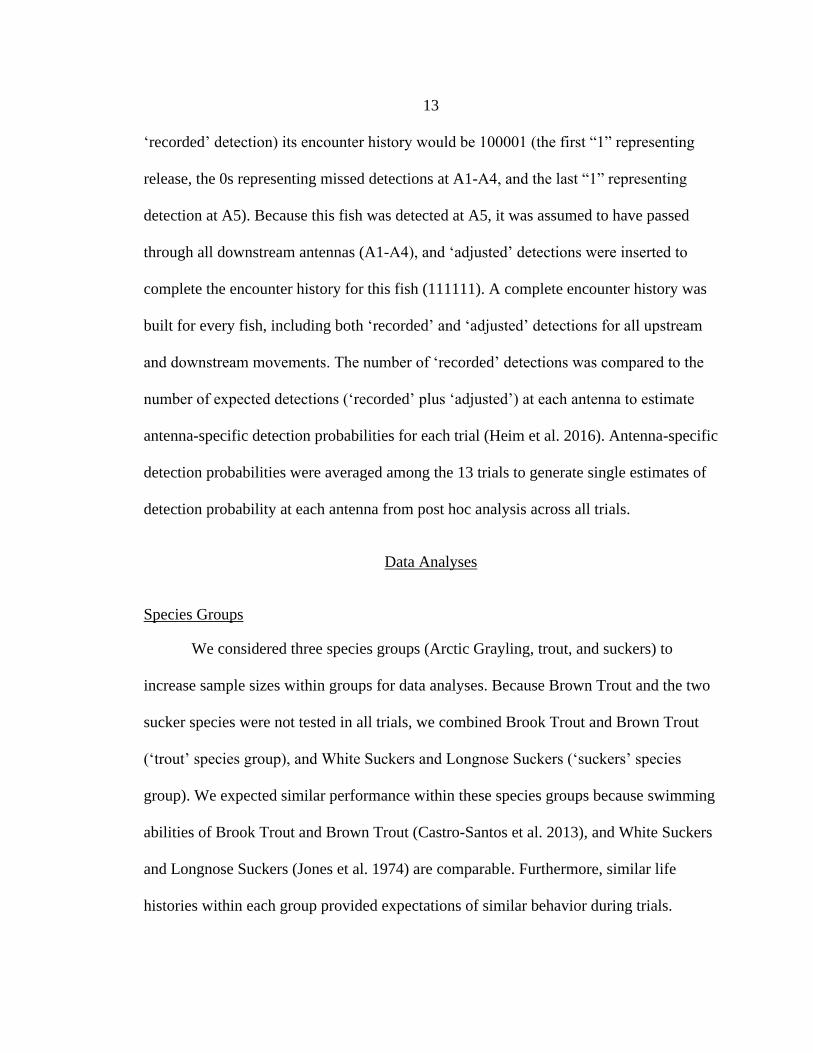
‘recorded’ detection) its encounter history would be 100001 (the first “1” representing
release, the 0s representing missed detections at A1-A4, and the last “1” representing
detection at A5). Because this fish was detected at A5, it was assumed to have passed
through all downstream antennas (A1-A4), and ‘adjusted’ detections were inserted to
complete the encounter history for this fish (111111). A complete encounter history was
built for every fish, including both ‘recorded’ and ‘adjusted’ detections for all upstream
and downstream movements. The number of ‘recorded’ detections was compared to the
number of expected detections (‘recorded’ plus ‘adjusted’) at each antenna to estimate
antenna-specific detection probabilities for each trial (Heim et al. 2016). Antenna-specific
detection probabilities were averaged among the 13 trials to generate single estimates of
detection probability at each antenna from post hoc analysis across all trials.
Data Analyses
Species Groups
We considered three species groups (Arctic Grayling, trout, and suckers) to
increase sample sizes within groups for data analyses. Because Brown Trout and the two
sucker species were not tested in all trials, we combined Brook Trout and Brown Trout
(‘trout’ species group), and White Suckers and Longnose Suckers (‘suckers’ species
group). We expected similar performance within these species groups because swimming
abilities of Brook Trout and Brown Trout (Castro-Santos et al. 2013), and White Suckers
and Longnose Suckers (Jones et al. 1974) are comparable. Furthermore, similar life
histories within each group provided expectations of similar behavior during trials.
14
Transit Times
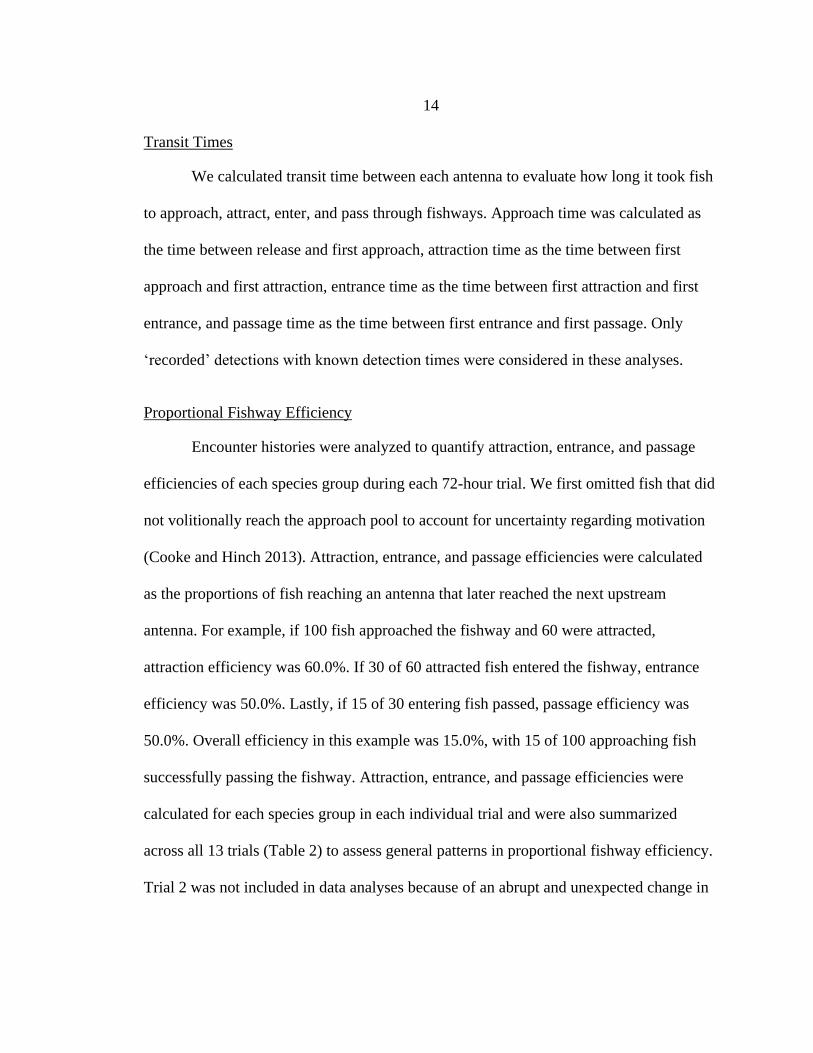
We calculated transit time between each antenna to evaluate how long it took fish
to approach, attract, enter, and pass through fishways. Approach time was calculated as
the time between release and first approach, attraction time as the time between first
approach and first attraction, entrance time as the time between first attraction and first
entrance, and passage time as the time between first entrance and first passage. Only
‘recorded’ detections with known detection times were considered in these analyses.
Proportional Fishway Efficiency
Encounter histories were analyzed to quantify attraction, entrance, and passage
efficiencies of each species group during each 72-hour trial. We first omitted fish that did
not volitionally reach the approach pool to account for uncertainty regarding motivation
(Cooke and Hinch 2013). Attraction, entrance, and passage efficiencies were calculated
as the proportions of fish reaching an antenna that later reached the next upstream
antenna. For example, if 100 fish approached the fishway and 60 were attracted,
attraction efficiency was 60.0%. If 30 of 60 attracted fish entered the fishway, entrance
efficiency was 50.0%. Lastly, if 15 of 30 entering fish passed, passage efficiency was
50.0%. Overall efficiency in this example was 15.0%, with 15 of 100 approaching fish
successfully passing the fishway. Attraction, entrance, and passage efficiencies were
calculated for each species group in each individual trial and were also summarized
across all 13 trials (Table 2) to assess general patterns in proportional fishway efficiency.
Trial 2 was not included in data analyses because of an abrupt and unexpected change in
15
hydraulic conditions that occurred 20 hours after the trial began; however, fishway
efficiencies from this trial are discussed as anecdotal evidence.
Statistical Analyses
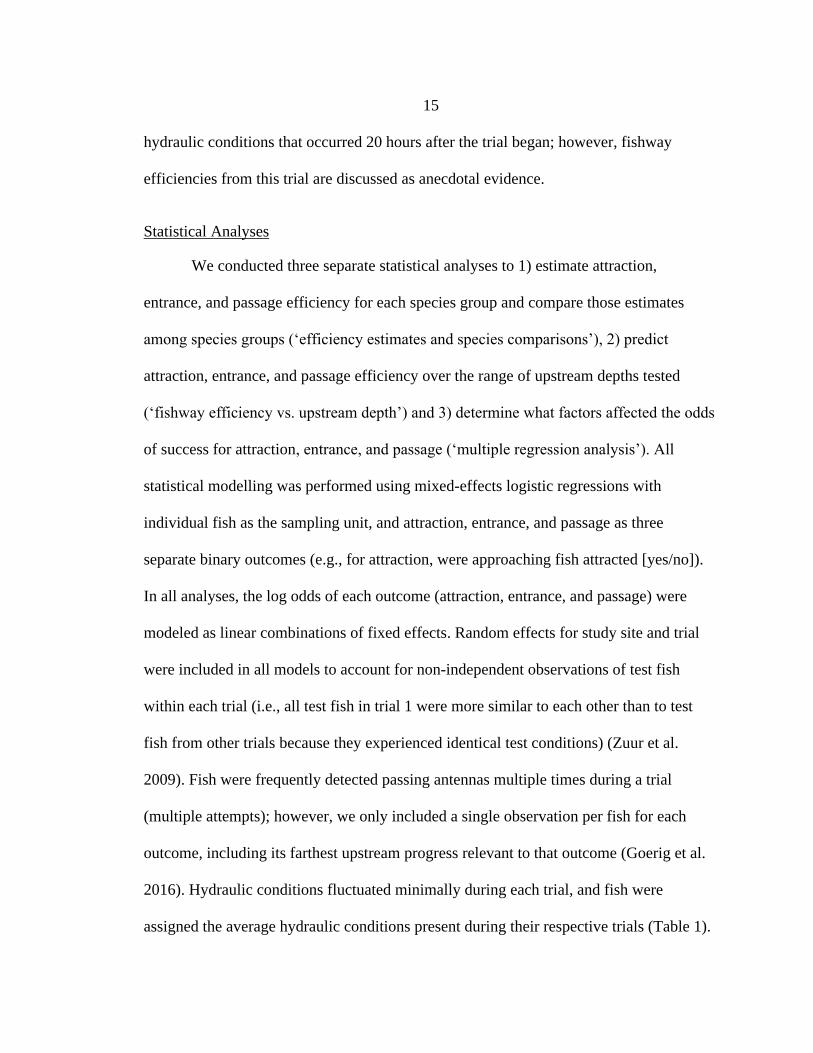
We conducted three separate statistical analyses to 1) estimate attraction,
entrance, and passage efficiency for each species group and compare those estimates
among species groups (‘efficiency estimates and species comparisons’), 2) predict
attraction, entrance, and passage efficiency over the range of upstream depths tested
(‘fishway efficiency vs. upstream depth’) and 3) determine what factors affected the odds
of success for attraction, entrance, and passage (‘multiple regression analysis’). All
statistical modelling was performed using mixed-effects logistic regressions with
individual fish as the sampling unit, and attraction, entrance, and passage as three
separate binary outcomes (e.g., for attraction, were approaching fish attracted [yes/no]).
In all analyses, the log odds of each outcome (attraction, entrance, and passage) were
modeled as linear combinations of fixed effects. Random effects for study site and trial
were included in all models to account for non-independent observations of test fish
within each trial (i.e., all test fish in trial 1 were more similar to each other than to test
fish from other trials because they experienced identical test conditions) (Zuur et al.
2009). Fish were frequently detected passing antennas multiple times during a trial
(multiple attempts); however, we only included a single observation per fish for each
outcome, including its farthest upstream progress relevant to that outcome (Goerig et al.
2016). Hydraulic conditions fluctuated minimally during each trial, and fish were
assigned the average hydraulic conditions present during their respective trials (Table 1).

16
Efficiency Estimates and Species Comparisons Attraction, entrance, passage, and
overall efficiencies were estimated for each species group over the entire study using
logistic regression. Species group was the single fixed effect in these models, and the
probability of success for each outcome and species group was calculated by:
P(success) = exp(ßi) / [1 + exp(ßi)]
where P(success) is the efficiency estimate for each outcome, and ßi is the model
coefficient for each species group (Zuur et al. 2009). Wald 95% confidence intervals
were calculated for each ßi. The efficiency estimates generated by these mixed-effects
models are more appropriate than the summarized proportional efficiencies in Table 2
because random effects were included to account for non-independent observations of
test fish within each trial. To compare efficiency estimates among species, we calculated
odds ratios for all pairwise species combinations by exponentiating the model coefficient
of each comparison (Zuur et al. 2009). The resulting odds ratios describe the relative odds
of attraction, entrance, or passage between two species groups. Efficiency estimates for
each species group are reported as percentages with 95% confidence intervals, and
species group comparisons are described as odds ratios with P-values adjusted for
multiple tests.
Fishway Efficiency vs. Upstream Depth We used logistic regression to predict
attraction, entrance, and passage efficiencies over the range of upstream depths tested
without considering potential effects of additional explanatory variables. We included
fixed effects for upstream depth, species group, and an upstream depth × species group
17
interaction to account for potentially different associations with upstream depth among
species groups. The probability of success for attraction, entrance, and passage was
predicted for each species group over the continuous range of upstream depths tested
(18.1-65.4 cm) by:
P(success) = exp(ß0,i + ß1,i US) / [1 + exp(ß0,i + ß1,i US)]
where P(success) is the predicted efficiency for each outcome, ß0,i is the model intercept
for the ith species group, US is upstream depth, and ß1,i is the coefficient for upstream
depth for the ith species group (Zuur et al. 2009). The predicted efficiencies from logistic
regression and observed fishway efficiencies from each trial were plotted against
upstream depth (Figure 4).
We focused on upstream depth for this univariate analysis, because managers in
the region are particularly interested in how much water is needed to facilitate passage
through Denil fishways. Additionally, the observed fishway efficiencies from each trial
are best visualized when plotted against upstream depth because our observations were
more evenly distributed across the range of upstream depths tested than across the ranges
of other variables. We ran similar univariate analyses for fishway discharge (Figure 5),
downstream depth (Figure 6), slope (Figure 7), and attraction flow (Figure 8); however,
we did not focus on interpreting the results from these additional univariate analyses
because the potential effects of all explanatory variables on fishway efficiency are most
appropriately addressed by the multiple regression analyses described below.

18
Multiple Regression Analyses We evaluated the effects of slope and hydraulic
conditions (and two-way interactions) on the odds of success for each efficiency
component using separate, multiple regression analyses. Attraction, entrance, and passage
models were built separately for each species group and included the explanatory
variables hypothesized to be most relevant for each outcome. We performed a pairwise
Pearson’s correlation analysis of all explanatory variables. For strongly correlated
variables (r > 0.70) we included the single variable with the most likely functional
significance for that response (Dormann et al. 2013). As expected, the two variables
describing fishway discharge (upstream depth and fishway discharge) were strongly
correlated (r = 0.91). We included upstream depth in our models because upstream depth
is more practical for managers to measure in the field. Explanatory variables for
attraction included upstream depth, downstream depth, attraction flow, water
temperature, and fish length. Explanatory variables for entrance included upstream depth,
downstream depth, fishway slope, water temperature, and fish length. Explanatory
variables for passage included upstream depth, fishway slope, water temperature, and fish
length.
We compared four types of models for each outcome and species group using
Akaike’s information criterion corrected for small sample sizes (AICc): 1) a main effects
model that included the additive combination of explanatory variables, 2) a full model
that included all main effects and all two-way interactions, 3) a reduced model obtained
by backward selection from the full model (P > 0.05), and 4) an intercept model that only
included random effects for study site and trial. Main effects were not removed from the

19
reduced models regardless of their significance to explicitly account for all relevant
explanatory variables (Wasserman et al. 1996; Ramsey and Schafer 2002). We
considered models with △AICc less than or equal to 2 to be competitive (Burnham and
Anderson 2002) and selected the most parsimonious of competitive models as the top
model for each analysis. Explanatory variables in top models were centered on their
overall mean values (Table 1). Odds ratios were calculated by exponentiation of the
model coefficient of each statistically significant explanatory variable to explain the
expected effect of a one-unit increase in that variable while all other variables were held
constant at their overall mean values (Sen and Srivastava 1990).
We identified outliers and assessed goodness of fit for all top models. Outliers
were defined as observations > 4 standard deviations from the mean (Ramsey and
Schafer 2002). We tested the influence of outliers on parameter and standard error
estimation in all models; no outliers were removed before any analysis because none
were influential in any model. Goodness of fit of the mixed-effect logistic regression
models were confirmed by residual plots, chi-squared tests of deviance, and Hosmer-
Lemeshow tests (P < 0.05). All models were fit using statistical software R (R Core
Team 2018) package lme4 (Bates et al. 2015), and AICc was calculated using package
AICcmodavg (Mazerolle 2019).
Results
Detection Probability
Detection probability of PIT arrays was high throughout the study. Average
detection probability estimates from single-tag tests ranged from 99.3 to 100.0% for A1-
20
A4, suggesting near perfect detection if a single fish passed through the array. In contrast,
estimates from multi-tag tests ranged from 76.2 to 86.4%, illustrating potential for missed
detections resulting from tag collision. The detection probability estimates generated
from actual fish movements in our post hoc analyses ranged from 92.9 to 98.4%. In other
words, nearly all (92.9-98.4%) observed detections occurred in the expected sequence
(i.e., A1-A2-A3-A4 or A4-A3-A2-A1) given the layout of the PIT antenna array, which
suggests that tag collision was infrequent during trials. However, we did observe some
potential evidence of tag collision at A2 and A4 as a low percentage of entering fish
(4.6%, n = 23 of 499) were not detected exiting fishways. These 23 entering fish were
omitted from passage and overall efficiency analyses because we could not confirm
whether they were successful in passing fishways.
Transit Times
Wild fish approached fishways more quickly after release than hatchery-origin
Arctic Grayling, and fish generally took longer to locate the fishway entrance (i.e.,
become attracted to) than to enter or pass the structure (Figure 9). More than 90.0% of all
approaching trout and suckers approached within 24 hours after release, compared to
67.9% of approaching grayling. Fish were typically attracted within several hours after
their first approach. Only 36.6% of attracted grayling, 47.0% of attracted trout, and
31.1% of attracted suckers were attracted to fishways within 1 hour after their first
approach; however, about 80.0% of all attracted fish were attracted within 24 hours after
their first approach. Entrance times were typically shorter than attraction times for all
species groups, with 64.6% of attracted grayling, 79.0% of attracted trout, and 71.2% of
21
attracted suckers entering fishways within 1 hour after their first attraction. Fish generally
passed fishways quickly, with 82.7% of all passes occurring less than one minute after
fish were first detected inside the fishway (i.e., first entrance). The majority of passing
trout (73.3%) and 47.3% of passing suckers passed within 24 hours after release (Figure
10), whereas hatchery-origin grayling passed at a slower and more consistent rate
throughout trials (37.3%, 33.3%, and 29.3% on days 1-3, respectively). Diel periodicity
appeared to affect when fish passed fishways; passage by all species groups peaked
during sunset and at night, and passage occurred less frequently during daylight (Figure
10).
Proportional Fishway Efficiency
Aggregated overall fishway efficiency for all species groups and trials was 41.8%
(Table 2). Reductions in overall efficiency were primarily due to low attraction (65.5%)
and entrance (68.4%) efficiencies, as nearly all fish that entered fishways successfully
passed (95.8% passage efficiency, n = 456 of 476). Cumulative failures in attraction,
entrance, and passage reduced overall efficiencies of all species groups; however, the
efficiency components that limited overall efficiencies varied among species groups.
Arctic Grayling were limited by both attraction (53.1%) and entrance (48.3%), whereas
suckers were mainly limited by attraction (51.3%). Trout were least limited by attraction
(75.7%) and entrance (74.8%) and had the highest overall efficiency (51.6%). Passage
efficiencies of all species groups were greater than 95.0%; we observed only 4 failed
passage attempts by Arctic Grayling (n = 83), 2 failed attempts by suckers (n = 57), and
14 failed attempts by trout (n = 333).
22
Efficiency Estimates and Species Comparisons
Attraction, and entrance efficiency estimates generated from logistic regression
were highest for trout followed by suckers and then Arctic Grayling; however, passage
efficiency estimates were high for all species groups (Figure 11). Attraction efficiency of
trout was 84.3% (95% CI = 65.7-93.7%) compared to 72.8% (47.6-88.8%) for suckers
and 60.4% (35.1-81.1%) for grayling. Attraction of trout was significantly greater than
attraction of suckers (odds ratio = 1.998, P = 0.005) and grayling (odds ratio = 3.515, P <
0.001), and attraction of suckers was significantly greater than attraction of grayling
(odds ratio = 1.759, P = 0.044). For all species comparisons, odds ratios describe the
relative odds of attraction, entrance, or passage (Table 3) between two species groups. In
other words, “attraction of trout was significantly greater than attraction of suckers (odds
ratio = 1.998, P = 0.005)” means the odds of attraction of trout were 99.8% greater than
the odds of attraction of suckers. Entrance efficiency of trout was 78.6% (66.3-87.3%)
compared to 69.3% (50.3-83.4%) for suckers and 44.3% (29.0-60.8%) for grayling.
Entrance of trout was significantly greater than entrance of grayling (odds ratio = 4.611,
P < 0.001) and entrance of suckers was significantly greater than entrance of grayling
(odds ratio = 2.827, P = 0.004); however entrance of trout was not significantly different
than entrance of suckers (odds ratio = 1.631, P = 0.253). Passage efficiency estimates
were between 96.0-97.0% for all species groups.
Overall efficiency estimates were highest for trout, followed by suckers and then
Arctic Grayling. Overall efficiency of trout was 55.8% (38.6-71.6%) compared to 38.5%
(22.3-57.7%) for suckers and 19.1% (10.3-32.9%) for grayling. Overall efficiency of
trout was significantly greater than overall efficiency of suckers (odds ratio = 2.017, P =
23
0.004) and grayling (odds ratio = 5.336, P < 0.001), and overall efficiency of suckers was
significantly greater than overall efficiency of grayling (odds ratio = 2.645, P < 0.001).
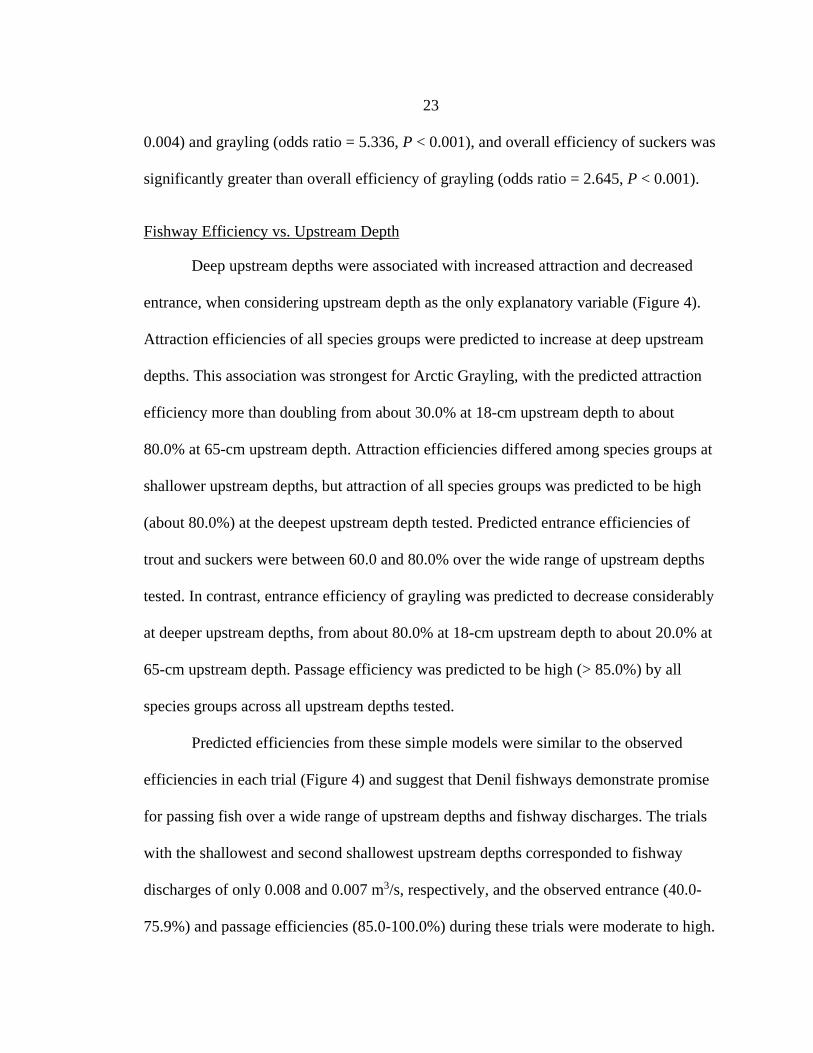
Fishway Efficiency vs. Upstream Depth
Deep upstream depths were associated with increased attraction and decreased
entrance, when considering upstream depth as the only explanatory variable (Figure 4).
Attraction efficiencies of all species groups were predicted to increase at deep upstream
depths. This association was strongest for Arctic Grayling, with the predicted attraction
efficiency more than doubling from about 30.0% at 18-cm upstream depth to about
80.0% at 65-cm upstream depth. Attraction efficiencies differed among species groups at
shallower upstream depths, but attraction of all species groups was predicted to be high
(about 80.0%) at the deepest upstream depth tested. Predicted entrance efficiencies of
trout and suckers were between 60.0 and 80.0% over the wide range of upstream depths
tested. In contrast, entrance efficiency of grayling was predicted to decrease considerably
at deeper upstream depths, from about 80.0% at 18-cm upstream depth to about 20.0% at
65-cm upstream depth. Passage efficiency was predicted to be high (> 85.0%) by all
species groups across all upstream depths tested.
Predicted efficiencies from these simple models were similar to the observed
efficiencies in each trial (Figure 4) and suggest that Denil fishways demonstrate promise
for passing fish over a wide range of upstream depths and fishway discharges. The trials
with the shallowest and second shallowest upstream depths corresponded to fishway
discharges of only 0.008 and 0.007 m3/s, respectively, and the observed entrance (40.0-
75.9%) and passage efficiencies (85.0-100.0%) during these trials were moderate to high.

24
Only observed attraction efficiencies (8.0-63.8%) were notably limited at such low
fishway discharges. The trials with deepest and second deepest upstream depths
corresponded to fishway discharges of 0.209 and 0.167 m3/s, respectively, and the
observed attraction (75.0-100.0%) and passage efficiencies (77.8-100.0%) during these
trials were high. Only entrance efficiencies (37.5-100.0%) appeared to be limited at high
fishway discharges, most notably for hatchery-reared Arctic Grayling.
Multiple Regression Analyses
Attraction The top models for attraction of Arctic Grayling, trout, and suckers
(Table 4) included significant effects of upstream depth, attraction flow, water
temperature, and downstream depth (Table 5). Fish length did not affect attraction of any
species group. The top models for grayling and trout included several significant
interactive effects; however, we focused on interpreting interactions that we considered
biologically significant or those with direct management implications.
Arctic Grayling were more likely to be attracted to fishways with deeper upstream
depths (i.e., greater fishway discharges) and high attraction flows compared to fishways
with shallow upstream depths and low attraction flows; however, these factors had varied
effects on attraction of trout, and no effect on suckers (Table 5). Upstream depth had a
positive effect on attraction of grayling; a 1-cm increase in upstream depth was
associated with a 7.8% increase in the odds of attraction of grayling. Attraction flow also
had a positive effect on attraction of grayling; a 1.0% increase in attraction flow was
associated with a 2.9% increase in odds of attraction of grayling. In contrast, upstream
depth and attraction flow had negative effects on attraction of trout. A 1-cm increase in
25
upstream depth was associated with a 5.9% decrease in the odds of attraction of trout, and
a 1.0% increase in attraction flow was associated with a 5.7% decrease in the odds of
attraction of trout. However, an interaction between upstream depth and attraction flow
indicated that each of these variables positively affected attraction of trout at low levels
of the other variable. In other words, increased attraction flow had a positive effect on
attraction of trout at fishways with shallow upstream depths and low fishway discharges.
Alternatively, increased upstream depth had a positive effect on attraction of trout at
fishways with low attraction flows.
Water temperature had a positive effect on attraction of Arctic Grayling, trout,
and suckers (Table 5). A 1° increase in water temperature was associated with a 28.9%
increase in the odds of attraction of grayling, a 31.1% increase in the odds of attraction of
trout, and a 44.5% increase in the odds of attraction of suckers. This effect was more
pronounced for trout and grayling at low attraction flows because of an interaction
between water temperature and attraction flow; increased water temperatures had a
stronger positive effect on attraction of trout and grayling at fishways with low attraction
flows compared to fishways with high attraction flows, or alternatively increased
attraction flows had a stronger positive effect on attraction when water temperatures were
cold compared to warmer water temperatures.
Downstream depth had a positive effect on attraction of trout but did not affect
attraction of Arctic Grayling or suckers. A 1-cm increase in downstream depth was
associated with a 22.5% increase in odds of attraction of trout (Table 5). This effect was
more pronounced at shallow upstream depths because of an interaction between

26
downstream depth and upstream depth; increased downstream depth had a stronger
positive effect on attraction of trout at fishways with shallow upstream depths (i.e. low
fishway discharges) than fishways with deep upstream depths.
Entrance The top models for entrance of Arctic Grayling and trout (Table 4)
included significant effects of upstream depth, downstream depth, slope, and water
temperature, as well as several interactive effects (Table 5). Fish length did not affect
entrance of either species group. The top model for entrance of suckers was the intercept
model, which showed no statistically significant effect by any explanatory variable.
Arctic Grayling and trout were less likely to enter fishways with deep upstream
depths (high fishway discharges) than fishways with shallow upstream depths (low
fishway discharges), and this association was stronger at fishways with steep slopes than
at fishways with gradual slopes (Table 5). Upstream depth had a negative effect on
entrance of both species groups; a 1-cm increase in upstream depth was associated with a
9.8% decrease in the odds of entrance of grayling, and a 5.0% decrease in the odds of
entrance of trout. The negative effect of upstream depth was more pronounced among
trout at steeper fishway slopes because of a significant interaction between upstream
depth and slope; deeper upstream depths were more limiting to entrance of trout at
fishways with steep slopes than at fishways with gradual slopes. Slope alone had a
significant negative effect on entrance of grayling and trout; a 1.0% increase in slope was
associated with a 34.8% decrease in the odds of entrance of grayling, and a 37.0%
decrease in the odds of entrance of trout. Steep slopes were more limiting to entrance of

27
trout at fishways with deep upstream depths than at fishways with shallow upstream
depths.
Arctic Grayling and trout were more likely to enter fishways with deeper
downstream depths (Table 5) than fishways with shallow downstream depths. A 1-cm
increase in downstream depth was associated with a 12.2% increase in the odds of
entrance of grayling, and a 16.3% increase in the odds of entrance of trout. Downstream
depth was predicted to have a positive effect on entrance at all slopes tested (0.6-15.6%);
however, downstream depth had a stronger positive effect on entrance at fishways with
gradual slopes than at fishways with steep slopes because of an interaction between
downstream depth and slope. This interaction was probably a result of the correlation
between downstream depth and slope (r = .53).
Water temperature had a significant positive effect on entrance of trout but did not
affect entrance of Arctic Grayling (Table 5). A 1° increase in water temperature was
associated with a 9.4% increase in the odds of entrance of trout. However, this effect was
less pronounced at fishways with steep slopes and deep upstream depths than at fishways
with gradual slopes and shallow upstream depths because of interactions between
temperature and slope, and temperature and upstream depth.
Passage The top models for passage of Arctic Grayling and suckers (Table 4)
were intercept models, which showed no statistically significant effect by any
explanatory variable. We expected this because we observed few failed passage attempts
by grayling (n = 4) and suckers (n = 2). The top model for passage of trout (Table 4)

28
included significant effects of water temperature and fish length (Table 5), but no effect
of upstream depth or slope.
Water temperature and fish length positively affected passage of trout. A 1°
increase in water temperature was associated with a 24.7% increase in odds of passage of
trout, and a 1-cm increase in fish length was associated with a 19.6% increase in odds of
passage of trout. Longer trout were more likely to pass fishways than shorter trout;
however, only 14 of 333 entering trout failed to pass fishways. Moreover, Denil fishways
effectively passed multiple fish species of varied lengths: trout (112-415 mm), Arctic
Grayling (170-273 mm), suckers (118-353 mm), Burbot (295-381 mm), and Mountain
Whitefish (206 mm). Furthermore, we observed three trout < 120 mm TL pass the
fishway during trial 3, which had the highest upstream depth and highest fishway
discharge tested. This highlights the potential for small fish to pass Denil fishways at
high fishway discharges.
Discussion
Denil fishways are thought to be effective for reconnecting habitats isolated by
anthropogenic barriers (Schmetterling et al. 2002), but few comprehensive field
evaluations of them have been conducted. We demonstrated that Denil fishways show
promise for improving habitat connectivity for Arctic Grayling and other taxa across a
wide range of slopes and hydraulic conditions in the Big Hole basin, and that adaptive
management strategies and design criteria focused on increasing attraction and entrance
efficiency will improve their overall efficiency.

29
Knowledge of fishway efficiency is limited by a lack of comprehensive field
evaluations and the use of non-standardized efficiency components (Bunt et al. 2012;
Kemp 2016). Attraction efficiency has been neglected in passage studies that crowd fish
below a fishway to induce participation (Haro et al. 1999; Mallen-Cooper and Stuart
2007), and studies that quantify attraction and passage efficiencies often fail to consider
entrance as a distinct efficiency component. Hodge et al. (2017) defined attraction as the
probability that an approaching fish located the fishway entrance, and passage as the
probability that an entering fish passed the structure; however, they did not distinguish
between locating the entrance (attraction) and subsequently entering the structure
(entrance). Forty et al. (2016) used ‘proportion of displaced fish attempting passage’ as a
metric of motivation, but this metric combined approach, attraction, and entrance into a
single component. Inconsistent methodology and terminology have prevented accurate
comparisons among studies and limited our understanding of the distinct behavioral
components that can limit fishway efficiency (Bunt et al. 2012; Bunt et al. 2016; Kemp
2016; Williams and Katopodis 2016).
We identified where fish were limited in using fishways by quantifying approach,
attraction, entrance, and passage as four distinct components of overall efficiency. Our
PIT array configuration allowed us to accurately and cost-effectively distinguish between
four types of potential failure: 1) released fish that never approached the fishway
(approach), 2) approaching fish that never located the entrance (attraction), 3) attracted
fish that never entered the fishway (entrance), and 4) entering fish that failed to pass the
fishway (passage). By dividing overall efficiency into these four components, we

30
determined that attraction and entrance limited overall efficiency, whereas nearly all fish
that entered fishways successfully passed. The high detection probabilities of our and
similar PIT arrays (Goerig et al. 2016; Hodge et al. 2017) validate our findings and
confirm PIT telemetry as an accurate and effective means to collect such comprehensive
data.
Our attraction efficiency estimates (60.4-84.3%) were similar or slightly higher
than the mean attraction efficiency (61.0%) reported for Denil fishways (Bunt et al.
2012), and we think our estimates may be conservative compared to those expected from
naturally motivated fish. Hatchery-reared Arctic Grayling had the lowest attraction
efficiency and attraction of grayling was limited at fishways with shallow upstream
depths (low fishway discharges) and low attraction flows, presumably because fish are
attracted to areas of high discharge (Bunt et al. 2012), and discharge occurring away from
the fishway entrance can distract approaching fish (Bunt et al. 1999). However, attraction
of wild test fish was less affected by upstream depth and attraction flow, and trout and
suckers had higher attraction efficiencies than grayling over most conditions tested.
Attraction can be driven by biological characteristics of fish, behavior, and motivation
(Bunt et al. 2012), and our test grayling were naïve to study streams and lacked the
homing motivation that we expected from displaced wild test fish. Furthermore, all wild
Colorado River Cutthroat Trout that naturally approached a fishway were attracted to it
(Hodge et al. 2017), suggesting that naturally motivated fish may be more efficiently
attracted to fishways than both our displaced wild fish and hatchery-reared grayling.

31
Entrance limited overall efficiency but passage was high by all species groups
across all conditions tested. Our entrance efficiency estimates (44.3-78.6%) were
moderate, and entrance of Arctic Grayling and trout was limited at fishways with deep
upstream depths (high fishway discharges) and steep slopes. Deep upstream depths and
steep slopes are correlated to high velocities and turbulence inside the fishway, which can
limit passage efficiency at Denil fishways (Bunt et al. 1999; Haro et al. 1999; Mallen-
Cooper and Stuart 2007); however, our results provide the first evidence that these
conditions limit entrance but do not affect passage. Our passage efficiency estimates
(96.2-99.0%) were higher and less variable than other Denil passage efficiencies (mean =
51.0%, range = 0.0-97.0%; Bunt et al. 2012) and were not affected by slope or upstream
depth. This was not unexpected because Denil fishways have been engineered to provide
a favorable low velocity zone of passage inside the fishway (USFWS 2017). Our high
passage efficiencies across a wide range of test conditions highlight their versatility for
creating that favorable zone of passage; however, our moderate entrance efficiencies
indicate that entrance is a key bottleneck that can prevent fish from reaching the
favorable conditions inside the fishway.
Ours is the first study of Denil fishways to quantify entrance efficiency, and
thereby emphasizes the importance of distinguishing between entrance and passage. Low
passage efficiencies reported in previous studies may have been a result of both entrance
and passage failure (Bunt et al. 2012). High upstream depths and steep slopes have been
implicated as factors limiting passage efficiency through Denil fishways (Haro et al.
1999; Mallen-Cooper and Stuart 2007), but these investigators did not distinguish
32
between entrance and passage failure. We suggest that entrance failure may have caused
the low and variable passage efficiencies they reported. Whereas previous studies have
focused on the effects of upstream depth, slope, and velocities on passage efficiency
(Bunt et al. 1999; Haro et al. 1999; Mallen-Cooper and Stuart 2007), our findings direct
the attention toward entrance as a distinct and limiting component of overall efficiency.
Thus, we highlight the importance of entrance conditions related to downstream depth,
which have not been evaluated in previous Denil studies but affected entrance efficiency
in our study.
Shallow downstream depths may have limited entrance of Arctic Grayling and
trout because shallow downstream depths can lead to high velocities at fishway
entrances. Turbulence compromises the accuracy of velocity measurements taken inside a
Denil fishway (Katopodis and Rajaratnam 1983), but mean flow velocity (𝑈𝑓 ; Castro-
Santos et al. 2013) calculated as follows can be used to characterize velocity at the
entrance of the fishway:
𝑈𝑓 = Q / yz
where mean flow velocity (𝑈𝑓 ) equals fishway discharge (Q) divided by cross-sectional
area of that discharge (yz) or fishway width (y) multiplied by depth (z). Fishway
discharge is constant throughout the length of a fishway (flowing from exit to entrance);
however, when upstream depth is greater than downstream depth (typically at fishways
with shallow downstream depths), the constant fishway discharge is constricted to a
smaller cross-sectional area at the fishway entrance than it was at the exit because of the
33
shallower downstream depth (z). Therefore, mean flow velocity increases as water flows
through the fishway when upstream depth is greater than downstream depth. In contrast,
if downstream depth is greater than upstream depth, flow velocity decreases as fishway
discharge is distributed over a greater cross-sectional area at the fishway entrance than
the exit because of the deeper downstream depth (z). Therefore, deep downstream depths
can create more favorable entrance conditions by reducing mean flow velocity at the
fishway entrance.
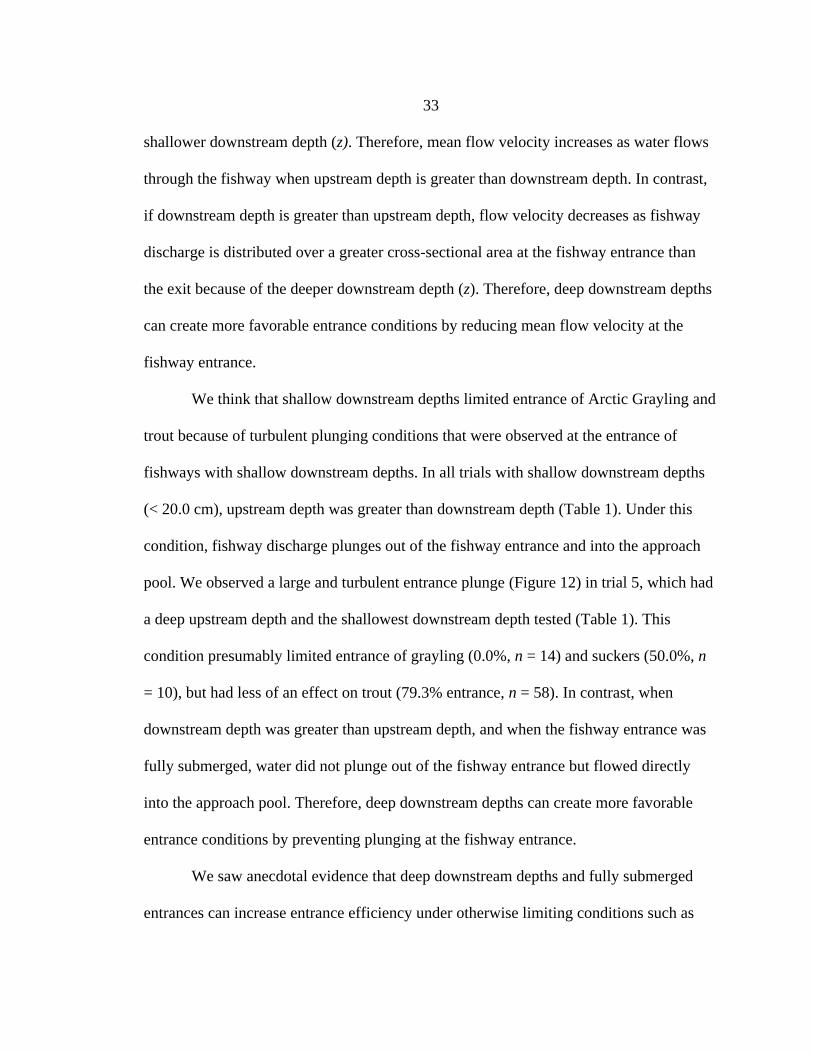
We think that shallow downstream depths limited entrance of Arctic Grayling and
trout because of turbulent plunging conditions that were observed at the entrance of
fishways with shallow downstream depths. In all trials with shallow downstream depths
(< 20.0 cm), upstream depth was greater than downstream depth (Table 1). Under this
condition, fishway discharge plunges out of the fishway entrance and into the approach
pool. We observed a large and turbulent entrance plunge (Figure 12) in trial 5, which had
a deep upstream depth and the shallowest downstream depth tested (Table 1). This
condition presumably limited entrance of grayling (0.0%, n = 14) and suckers (50.0%, n
= 10), but had less of an effect on trout (79.3% entrance, n = 58). In contrast, when
downstream depth was greater than upstream depth, and when the fishway entrance was
fully submerged, water did not plunge out of the fishway entrance but flowed directly
into the approach pool. Therefore, deep downstream depths can create more favorable
entrance conditions by preventing plunging at the fishway entrance.
We saw anecdotal evidence that deep downstream depths and fully submerged
entrances can increase entrance efficiency under otherwise limiting conditions such as
34
deep upstream depths (high fishway discharges) and steep slopes. Trial 2 at Swamp
Creek was not included in our data analyses because of a considerable change in
hydraulic conditions that occurred 20 hours into the trial; however, entrance efficiencies
during the first 20 hours of trial 2 were high (37.5 and 73.3% by Arctic Grayling and
trout, respectively) compared to entrance efficiencies observed during trial 11 (6.3 and
25.6% by grayling and trout, respectively). Upstream depths were deep and slopes were
steep in both trials (Table 1), which limited entrance; however, downstream depth was
shallower in trial 11 than in trial 2 and resulted in a turbulent entrance plunge (Figure 13)
and high mean flow velocity at the fishway entrance. In contrast, the deep downstream
depth and submerged entrance in trial 2 prevented plunging (Figure 14) and resulted in a
lower mean flow velocity at the fishway entrance than in trial 11. The more efficient
entrance of trout and grayling in trial 2 than in trial 11 emphasizes the potential benefits
of submerged fishway entrances to increase entrance efficiency at Denil fishways with
steep slopes and high fishway discharges.
Allocating water for irrigation and maintaining adequate fishway discharges
remains a difficult challenge in the Big Hole basin and other agricultural regions;
however, information about how much water is needed to facilitate passage through a
Denil fishway is limited. Denil fishways effectively passed fish at ‘low flows’ in the
Blackfoot River basin in Montana (Schmetterling et al. 2002), but fishway discharges
were not reported and fishway efficiencies were not quantified. Our Denil fishways
efficiently passed fish at fishway discharges ranging from just 0.007 to 0.209 m3/s (i.e., a
nearly empty fishway to a completely full fishway). Attraction was somewhat limited at
35
low fishway discharges and entrance was somewhat limited at high fishway discharges,
which is a common paradox in fish passage (Castro-Santos et al. 2013). However, these
effects were most notable among hatchery-reared Arctic Grayling, which we suspect
would be more limited by these conditions than naturally motivated wild grayling.
We think our estimates of attraction and entrance efficiency by hatchery-reared
Arctic Grayling are conservative compared to those expected for wild grayling in the Big
Hole basin. Moderate attraction efficiency (60.4%) of test grayling may have been due to
behavioral differences stemming from their hatchery-rearing, naivety to study streams,
and lack of motivation. Hatchery-reared grayling were typically slower to approach
fishways, approached in lower numbers, and passed fishways at a slower and more
consistent rate after release than wild test fish, which appeared to have a strong homing
motivation. Low entrance efficiency (44.3%) of test grayling could reflect behavioral or
physiological limitations; however, their high passage efficiency (96.2%) suggests they
have swimming abilities comparable to wild test fish. Additionally, grayling are strong
burst swimmers (Northcote 1995; Cahoon et al. 2018) and swimming performance of
hatchery-reared grayling and captive wild Brook and Brown Trout (Castro-Santos et al.
2013; Dockery et al. 2019) were comparable. Therefore, we think the low entrance
efficiency of test grayling probably reflects behavioral differences caused by hatchery-
rearing or the innate behavioral preferences of grayling. Wild test fish were more
experienced than hatchery-reared grayling in navigating complex currents and high
velocities like those found at fishway entrances, and wild grayling prefer to swim around
barriers than to jump over them (Cutting et al. 2018), suggesting they may avoid
36
turbulent conditions at fishway entrances. Testing wild grayling at Big Hole Denil
fishways is important to address these uncertainties; however, we think it is reasonable to
expect higher attraction and entrance efficiencies by wild Big Hole grayling than our
hatchery-reared test grayling.
Comprehensive fishway evaluations are essential for validating the potential
connectivity benefits of fishways, improving our understanding of the distinct behavioral
components that can limit fishway efficiency, and informing adaptive management
strategies and fishway design criteria. It may not be feasible for every study to quantify
all four efficiency components; however, consistent methodology and terminology that
distinguishes between attraction, entrance, and passage will facilitate meaningful
comparisons among studies and improve our understanding of fishway efficiency.
Additional research on attraction of naturally approaching wild fish could address
uncertainties regarding fish behavior and motivation. Further, future studies that
distinguish between entrance and passage failure might reinforce our findings that
entrance is a key bottleneck in Denil fishway use while passage efficiency is high. The
positive effect of downstream depth on entrance efficiency should be further evaluated in
future Denil fishway studies and considered in adaptive management strategies and
design criteria to improve overall fishway efficiency. Lastly, habitat connectivity includes
both upstream and downstream movement of fish. Although downstream passage was
outside of the scope of this research, future studies should comprehensively evaluate
downstream movement through Denil and other fishways to address potential loss of out-

37
migrating fish to injury, mortality, and entrainment in irrigation canals (Roberts and
Rahel 2008; Calles and Greenberg 2009).
Management Recommendations
The results of our study suggest that adaptive management strategies and fishway
design criteria should focus on increasing attraction and entrance efficiency at Big Hole
Denil fishways. Currently installed fishways should be assessed to identify conditions
that limit attraction and entrance such as low attraction flows and entrance plunges
associated with shallow downstream depths. These conditions could be improved through
modifications in fishway design and operating conditions at irrigation structures. Further,
downstream depth should be a focus of design criteria for future Denil fishway
installations to maintain favorable entrance conditions throughout the year.
Assessment and Modification of Currently Installed Fishways
Attraction was limited at shallow upstream depths (low fishway discharges), but it
is difficult to maintain deep upstream depths when water is scarce during low stream
discharges and periods of irrigation withdrawal. Instead, maintaining high attraction flow
should be the focus of strategies to increase attraction efficiency at fishways with low
fishway discharges. This can be done by modifying operating conditions at diversion
structures to ensure all stream discharge downstream of a diversion is channeled through
the fishway, and not over or through the diversion dam (i.e., 100.0% attraction flow).
Making these adjustments could impound and divert additional water into irrigation
ditches and reduce stream discharge; however, if irrigation discharge is kept constant by

38
adjusting the head gates or pin and plank structures at the inlets of most irrigation ditches,
attraction efficiency could be increased without reducing stream discharge.
Entrance was limited at fishways with deep upstream depths, but purposely
reducing upstream depth and fishway discharge could negatively affect habitat quality
downstream of the fishway by reducing stream discharge. Instead, modifications to
increase downstream depth would be preferable to increase entrance efficiency. Plunging
entrance conditions associated with low downstream depths should be identified in
assessments of currently installed fishways. Plunging conditions were typically observed
at fishways with slopes less than 5.0% where upstream depth is often greater than
downstream depth (Figure 12). Modifying fishways with gradual slopes by lowering the
elevation of the downstream invert of the fishway would increase downstream depth,
prevent plunging at the entrance, and presumably increase entrance efficiency. It is also
important to identify plunging entrance conditions at fishways with steep slopes and high
fishway discharges (Figure 13) because modifications to increase downstream depth
could increase entrance efficiency under these otherwise limiting conditions.
Lowering the elevation of the downstream invert of the fishway to increase
downstream depth would increase fishway slope, which negatively affected entrance.
However, submerged fishway entrances demonstrated promise for increasing entrance
efficiency at fishways with steeps slopes by preventing plunging and creating more
favorable entrance conditions (Figure 14). Additionally, steep slopes did not affect
passage efficiency and all slopes tested were less than the 16.7% maximum
recommended slope for passing salmonids through Denil fishways (USFWS 2017). If
39
lowering the elevation of the downstream invert to maintain deep downstream depths
results in a slope steeper than 16.7%, we propose using longer fishways as a method for
achieving deep downstream depths at more gradual slopes. Our high passage efficiencies
suggest it is unlikely a longer fishway would limit passage, but this should be tested.
Longer fishways might limit attraction because the fishway entrance would be farther
downstream of any potentially distracting discharge coming through and over the
diversion dam; however, if high attraction flows are maintained then fish should be
directed to the fishway entrance regardless of fishway length. Another option for
increasing downstream depth while maintaining a gradual slope is to create a step pool
below the fishway entrance to impound water and increase downstream depth.
Design Criteria for Future Denil fishway Installations
One disadvantage of Denil fishways is they function over a limited range of
stream discharges because of their limited accommodation to changes in upstream and
downstream depth (Clay 1995). In other words, the fishway exit or entrance will go dry if
fluctuations in depth exceed the dimensions of the fishway. For this reason, it is
important to estimate the expected fluctuations in upstream and downstream depths at
diversion dams before installing fishways (Clay 1995). Ideally, depths can be monitored
directly with data loggers installed in stilling wells as was done in our study, or through
hydraulic modelling (Platt 2019), which is a cost-effective method for providing
reasonable estimates of fluctuations in depth. Comprehensive depth profiles describing
seasonal fluctuations in upstream and downstream depth will inform optimal design
criteria (i.e., downstream and upstream invert elevations and resulting slopes) for future

40
Denil installations that will maintain target depths throughout the year. At the least,
upstream and downstream depth measurements made during the highest and lowest
seasonal discharges should describe depth fluctuations at each site, however, diversion
dam operating conditions should be considered because irrigation practices can have
considerable effects on fishway depths at any stream discharge.
For future installations, the elevation of the fishway entrance should be set early
in the design process to ensure deep downstream depths throughout the year (Platt 2019).
We recommend the elevation of the downstream fishway invert should be selected to
maintain a minimum downstream depth of 61.0 cm (i.e., a full fishway entrance) as this
would ensure that downstream depth is equal to or greater than upstream depth and
prevent plunging at all times. Next, an elevation for the upstream fishway invert should
be selected to accommodate a minimum upstream depth of at least 18.0 cm. We selected
18.0 cm because we saw efficient passage under this minimum upstream depth tested;
however, shallower upstream depths should be tested. Attraction should also be
considered when selecting minimum targeted depths; submerged entrances might limit
attraction at shallow upstream depths (low fishway discharges), and attraction could be
limited at shallow upstream depths regardless of downstream depth.
If the selected downstream and upstream invert elevations result in a slope steeper
than the 16.7% maximum recommendation by USFWS (2017), adjusting the elevations
of the downstream and upstream inverts of the fishway would reduce slope. Raising the
elevation of the downstream invert slightly (reducing downstream depth) could still
prevent or reduce plunging entrance conditions throughout most of the year.
41
Alternatively, lowering the elevation of the upstream invert (increasing upstream depth)
would also reduce slope, but would lead to higher fishway discharge during low stream
discharges when water for irrigation is scarce. The upstream invert of the fishway should
never be installed at a lower elevation than the invert of the irrigation ditch inlet,
otherwise the fishway would take a disproportionate amount of water and probably get
boarded up by landowners to meet their irrigation needs. This was observed at two Denil
sites on Howell Creek in 2017. Minimum targeted depths could also be maintained at
slopes less than 16.7% by installing longer fishways or creating a step pool below the
fishway entrance to increase downstream depth.
Defining minimum target depths and slopes to meet fishway efficiency goals is a
difficult task. Myriad variables can affect fishway efficiency, and the effect of one
variable is often dependent on several other variables through complex interactions.
Additionally, the lack of comprehensive fishway evaluations and uncertainty in fish
motivation add to the complexities of developing universal design criteria. However, by
comprehensively evaluating Denil fishways in the Big Hole basin, we found entrance was
a key component that limited overall efficiency, and downstream depth had a positive
effect on entrance after accounting for upstream depth, and slope. Therefore, we
recommend that the focus of modifications to existing fishways and future fishway
installations should be improving entrance conditions by maintaining deep downstream
depths.

42
REFERENCES CITED

43
Alo, D., and T. F. Turner. 2005. Effects of habitat fragmentation on effective population
size in the endangered Rio Grande silvery minnow. Conservation Biology
19:1138–1148.
Armstrong, J. D., and N. A. Herbert. 1997. Homing movements of displaced stream-
dwelling brown trout. Journal of Fish Biology 50:445–449.
Baker, N., A. Haro, B. Watten, J. Noreika, and J. D. Bolland. 2019. Comparison of
attraction, entrance and passage of downstream migrant American eels (Anguilla
rostrata) through airlift and siphon deep entrance bypass systems. Ecological
Engineering 126:74–82.
Baras, E., and M. C. Lucas. 2001. Impact of man’s modifications of river hydrology on
the migration of freshwater fishes: a mechanistic perspective. International
Journal of Ecohydrology & Hydrobiology 1:291–304.
Bates, D., M. Maechler, B. Bolker, and S. Walker. 2015. Fitting linear mixed-effects
models using lme4. Journal of Statistical Software 67:1–48.
Behnke, R. J. 1992. Native trout of western North America. American Fisheries Society,
Monograph 6, Bethesda, Maryland.
Bolland, J. D., I. G. Cowx, and M. C. Lucas. 2009. Evaluation of VIE and PIT tagging
methods for juvenile cyprinid fishes. Journal of Applied Ichthyology 25:381–386.
Bunt, C. M., C. Katopodis, and R. S. McKinely. 1999. Attraction and passage efficiency
of White Suckers and Smallmouth Bass by two Denil fishways. North American
Journal of Fisheries Management 19:793–803.
Bunt, C. M., T. Castro-Santos, and A. Haro. 2012. Performance of fish passage structures
at upstream barriers to migration. River Research and Applications 28:457–478.
Bunt, C. M., T. Castro-Santos, and A. Haro. 2016. Reinforcement and validation of the
analyses and conclusions related to fishway evaluation data from Bunt et al.:
“Performance of fish passage structures at upstream barriers to migration”. River
Research and Applications 32:2125–2137.
Burford, D. D., T. E. McMahon, J. E. Cahoon, and M. Blank. 2009. Assessment of trout
passage through culverts in a large Montana drainage during summer low flow.
North American Journal of Fisheries Management 29:39–752.
Burnham, K. P., and D. R. Anderson. 2002. Model selection and multimodel inference: a
practical information-theoretic approach, 2nd edition. Springer Verlag, New
York.

44
Calles, O., and L. Greenberg. 2009. Connectivity is a two-way street–the need for a
holistic approach to fish passage problems in regulated rivers. River Research and
Applications 25:1268–1286.
Cahoon, J., K. Kappenman, E. Ryan, A. Jones, K. Plymesser, and M. Blank. 2018.
Swimming capabilities of Arctic grayling. Northwest Science 92:234–239.
Clay, C. H. 1995. Design of fishways and other fish facilities, 2nd edition. Lewis
Publishers, Boca Raton, Florida.
Castro-Santos, T., F. J. Sanz-Ronda, and J. Ruiz-Legazpi. 2013. Breaking the speed
limit–comparative sprinting performance of brook trout (Salvelinus fontinalis) and
brown trout (Salmo trutta). Canadian Journal of Fisheries and Aquatic Sciences
70:280–293.
Cooke, S. J., and S. G. Hinch. 2013. Improving the reliability of fishway attraction and
passage efficiency estimates to inform fishway engineering, science, and practice.
Ecological Engineering 58:123–132.
Cutting, K. A., J. M. Ferguson, M. L. Anderson, K. Cook, S. C. Davis, and R. Levine.
2018. Linking beaver dam affected flow dynamics to upstream passage of Arctic
grayling. Ecology and Evolution 8:12905–12917.
Davison, W. 1989. Training and its effects on teleost fish. Comparative Biochemistry and
Physiology Part A: Physiology 94:1–10.
Davison, W. 1997. The effects of exercise training on teleost fish, a review of recent
literature. Comparative Biochemistry Physiology Part A: Physiology 117:67–75.
Dockery, D. R., E. Ryan, K. M. Kappenman, and M. Blank. 2019. Swimming
performance of Arctic Grayling (Thymallus arcticus Pallas) in an open-channel
flume. Journal of Ecohydraulics, DOI: 10.1080/24705357.2019.1599306
Dormann, C. F., J. Elith, S. Bacher, C. Buchmann, G. Carl, G. Carré, J. R. G. Marquéz,
B. Gruber, B. Lacfourcade, P. J. Leitão, T. Münkemüller, C. McClean, P. E.
Osborne, B. Reineking, B. Schröder, A. K. Skidmore, D. Zurell, and S.
Lautenbach. 2013. Collinearity: a review of methods to deal with it and a
simulation study evaluating their performance. Ecography 36:27–46.
DNRC (Montana Department of Natural Resources and Conservation). 1979. River mile
index of the Missouri River, Helena, MT.
45
FAO/DVWK. 2002. Fish passes–design, dimensions and monitoring. Food and
Agricultural Organization of the United Nations in arrangement with Deutscher
Verband für Wasserwirtschaft und Kulturbau e.V. (DVWK). Rome.
Forty, M., J. Spees, and M. C. Lucas. 2016. Not just for adults! Evaluating the
performance of multiple fish passage designs at low-head barriers for the
upstream movement of juvenile and adult trout Salmo trutta. Ecological
Engineering 94:214–224.
Goerig, E., T. Castro-Santos, and N. E. Bergeron. 2016. Brook trout passage through
culverts. Canadian Journal of Fisheries and Aquatic Sciences 73:94–104.
Haro, A., M. Odeh, T. Castro-Santos, and J. Noreika. 1999. Effect of slope and headpond
on passage of American Shad and Blueback Herring through simple Denil and
deepened Alaska steeppass fishways. North American Journal of Fisheries
Management 19:51–58.
Heim, K. C., M. S. Wipfli, M. S. Whitman, C. D. Arp, J. Adams and J. A. Falke. 2016.
Seasonal cues of Arctic grayling movement in a small Arctic stream: the
importance of surface water connectivity. Environmental Biology of Fishes
99:49–65.
Hinch, S. G., and J. M. Bratty. 2000. Effects of swim speed and activity pattern on
success of adult sockeye salmon migration through an area of difficult passage.
Transactions of the American Fisheries Society 129:604–612.
Hodge, B. W., E. R. Fetherman, K. B. Rogers, and R. Henderson. 2017. Effectiveness of
a fishway for restoring passage of Colorado River Cutthroat Trout. North
American Journal of Fisheries Management 37:1332–1340.
Januchowski-Hartley, S. R., P. B. McIntyre, M. Diebel, P. J. Doran, D. M. Infante, C.
Joseph, and J. D. Allan. 2013. Restoring aquatic ecosystem connectivity requires
expanding inventories of both dams and road crossings. Frontiers in Ecology and
the Environment 11:211–217.
Jones, D. R., J. W. Kiceniuk, and O. S. Bamford. 1974. Evaluation of the swimming
performance of several fish species from the MacKenzie River. The Journal of the
Fisheries Research Board of Canada 31:1641–1647.
Katopodis, C., and N. Rajaratnam. 1983. A review and laboratory study of the hydraulics
of Denil fishways. Candian Technical Report of Fisheries and Aquatic Sciences
1145.

46
Katopodis, C. 1992. Introduction to fishway design. Working Document, Freshwater
Institute, Fisheries and Oceans Canada, Winnipeg, Manitoba, Canada.
Katopodis, C., N. Rajaratnam, S. Wu, and D. Tovell. 1997. Denil fishways of varying
geometry. Journal of Hydraulic Engineering 123:624–631.
Katopodis, C., and J. G. Williams. 2012. The development of fish passage research in a
historical context. Ecological Engineering 48:8–18.
Kaya, C. M. 1992. Review of the decline and status of fluvial Arctic grayling (Thymallus
arcticus) in Montana. Proceedings of the Montana Academy of Sciences 52:43–
70.
Kemp, P. S. 2016. Meta-analyses, metrics and motivation: mixed messages in the fish
passage debate. River Research and Applications 32:2116–2124.
Lamothe, P., and J. Magee. 2003. Movement and habitat selection of Arctic grayling,
brook trout, and mountain whitefish during drought conditions in the Big Hole
River, Montana. Arctic Grayling Workgroup. Montana Department of Fish,
Wildlife and Parks. Bozeman, MT.
Larsen, M. H., A. N. Thorn, C. Skov, and K. Aarestrup. 2013. Effects of passive
integrated transponder tags on survival and growth of juvenile Atlantic salmon
Salmo salar. Animal Biotelemetry 1:1–7.
Mallen-Cooper, M., and I. G. Stuart. 2007. Optimizing Denil fishways for passage of
small and large fishes. Fisheries Management and Ecology 14:61–71.
Mazerolle, M. J. 2019. AICcmodavg: model selection and multimodel inference based on
(Q)AIC(c). R package version 2.2-1. https://cran.r-
project.org/package=AICcmodavg.
Mesa, M. G., and C. D. Magie. 2006. Evaluation of energy expenditure in adult spring
Chinook salmon migrating upstream in the Columbia River basin: an assessment
based on sequential proximate analysis. River Research and Applications
22:1085–1095.
Morita, K., S. Yamamoto, and N. Hoshino. 2000. Extreme life history change of White-
spotted Char (Salvelinus leucomaenis) after damming. Canadian Journal of
Fisheries and Aquatic Sciences 57:1300–1306.
MTFWP (Montana Fish, Wildlife & Parks). 2013. Arctic Grayling monitoring report:
2013 annual report, Bozeman, MT.
47
MTFWP and USFWS (Montana Fish, Wildlife & Parks and U.S. Fish and Wildlife
Service). 2006. Candidate agreement with assurances for fluvial Arctic Grayling
in the upper Big Hole River. U.S. Fish and Wildlife Service, Tracking
#TE104415-0, Washington, D.C.
Newton, M., J. A. Dodd, J. Barry, P. Boylan, and C. E. Adams. 2018. The impact of a
small-scale riverine obstacle on the upstream migration of Atlantic Salmon.
Hydrobiologia 806: 251–264.
Noonan, M. J., J. W. A. Grant, and C. D. Jackson. 2012. A quantitative assessment of fish
passage efficiency. Fish and Fisheries 13:450–464.
Northcote, T. G. 1984. Mechanisms of fish migrations in rivers. Pages 317-355 in J. D.
McCleave, G. P. Arnold, J. J. Dodson, and W. H. Neill, editors. Mechanisms of
migration in fishes. NATO Conference Series (IV Marine Sciences) Volume 14,
Boston, Massachusetts.
Northcote, T. G. 1995. Comparative biology and management of Arctic and European
grayling (Salmonidae, Thymallus). Reviews in Fish Biology and Fisheries 5:141–
194.
Odeh, M. 2003. Discharge rating equation and hydraulic characteristics of standard Denil
fishways. Journal of Hydraulic Engineering 129:341–348.
O'Hanley, J. R., and D. Tomberlin. 2005. Optimizing the removal of small fish passage
barriers. Environmental Modeling and Assessment 10:85–98.
Oswald, R. A. 2000. Inventory and survey of the salmonid populations of the Big Hole
River of southwest Montana, 1981-1999. Montana Department of Fish, Wildlife
and Parks. Bozeman, MT.
Platt, N. C. 2019. Designing and assessing the effectiveness of Denil fishways using
hydraulic modeling-based approaches. Master’s thesis. Montana State University,
Bozeman, Montana.
R Core Team. 2018. R: A language and environment for statistical computing. R
Foundation for Statistical Computing, Vienna, Austria. URL https://www.R-
project.org/.
Ramsey, F., and D. Schafer. 2002. The statistical sleuth–a course in methods of data
analysis, 2nd edition. Brooks Cole, Belmont, California.
Rajaratnam, N., and C. Katopodis. 1984. Hydraulics of Denil fishways. Journal of
Hydraulic Engineering 110:1219–1233.
48
Rajaratnam, N., C. Katopodis, S. Wu, and M.A. Sabur. 1997. Hydraulics of resting pools
for Denil fishways. Journal of Hydraulic Engineering 123:632–638.
Roberts, J. J., and F. J. Rahel. 2008. Irrigation canals as sink habitat for trout and other
fishes in a Wyoming drainage. Transactions of the American Fisheries Society
137:951–961.
Roni, P., K. Hanson, and T. Beechie. 2008. Global review of the physical and biological
effectiveness of stream habitat rehabilitation techniques. North American Journal
of Fisheries Management 28:856–890.
Schmetterling, D. A., R. W. Pierce, and B. W. Liermann. 2002. Efficacy of three Denil
fish ladders for low-flow fish passage in two tributaries to the Blackfoot River,
Montana. North American Journal of Fisheries Management 22:929–933.
Schwalme, K., W. C. Mackay, and D. Lindner. 1985. Suitability of vertical slot and Denil
fishways for passing north-temperate, nonsalmonid fish. Canadian Journal of
Fisheries and Aquatic Sciences 42:1815–1822.
Sen, A., and M. Srivastava. 1990. Regression analysis–theory, methods, and applications.
Springer Verlag, New York.
Shepard, B. B., and R. A. Oswald. 1989. Timing, location, and population characteristics
of spawning Montana Arctic Grayling Thymallus arcticus in the Big Hole River
drainage, 1988. Montana Fish, Wildlife & Parks, Bozeman, MT.
Sladek, H. 2013. Trend analysis of water temperatures relative to air temperatures and
flow in the Big Hole River, Final Report. United States Fish and Wildlife Service.
Dillon, MT.
Tack, S. L., and J. R. Fisher. 1977. Performance of Arctic Grayling in a twenty foot
section of model ‘‘A’’Alaska steeppass fish ladder. Final Report to the U.S. Army
Corps of Engineers, Alaska Division, Anchorage, AK.
USOFR (U.S. Office of the Federal Register). 2014. Endangered and threatened wildlife
and plants; revised 12-month finding on a petition to list the upper Missouri River
distinct population segment of Arctic Grayling as endangered or threatened;
proposed rule. Federal Register 79:161(20 August 2014):49384-49422.
USFWS (U.S. Fish and Wildlife Service). 2017. Fish Passage Engineering Design
Criteria. USFWS, Northeast Region R5, Hadley, Massachusetts.

49
Vatland, S. J. 2015. Effects of stream temperature and climate change on fluvial Arctic
Grayling and non-native salmonids in the upper Big Hole River, Montana.
Master’s thesis. Montana State University, Bozeman, Montana.
Wasserman, W., J. Neter, C. J. Nachtsheim, and M. H. Kutner. 1996. Applied linear
statistic models, 4th edition. McGraw-Hill Higher Education, Chicago.
Williams, J. G., and C. Katapodis. 2016. Commentary–incorrect application of data
negates some meta-analyses results in Bunt et al. (2012). River Research and
Applications 32:2109–2115.
Kutner, M. H., C. J. Nachtsheim, and J. Neter. 2005. Applied linear statistical models, 5th
edition. McGraw-Hill Irwin. Chicago.
Zuur, A., E. N. Ieno, N. Walker, A. A. Saveliev, and G. M. Smith. 2009. Mixed effects
models and extensions in ecology with R. Springer Science+Business Media,
New York.

50
APPENDIX A
TABLES AND FIGURES
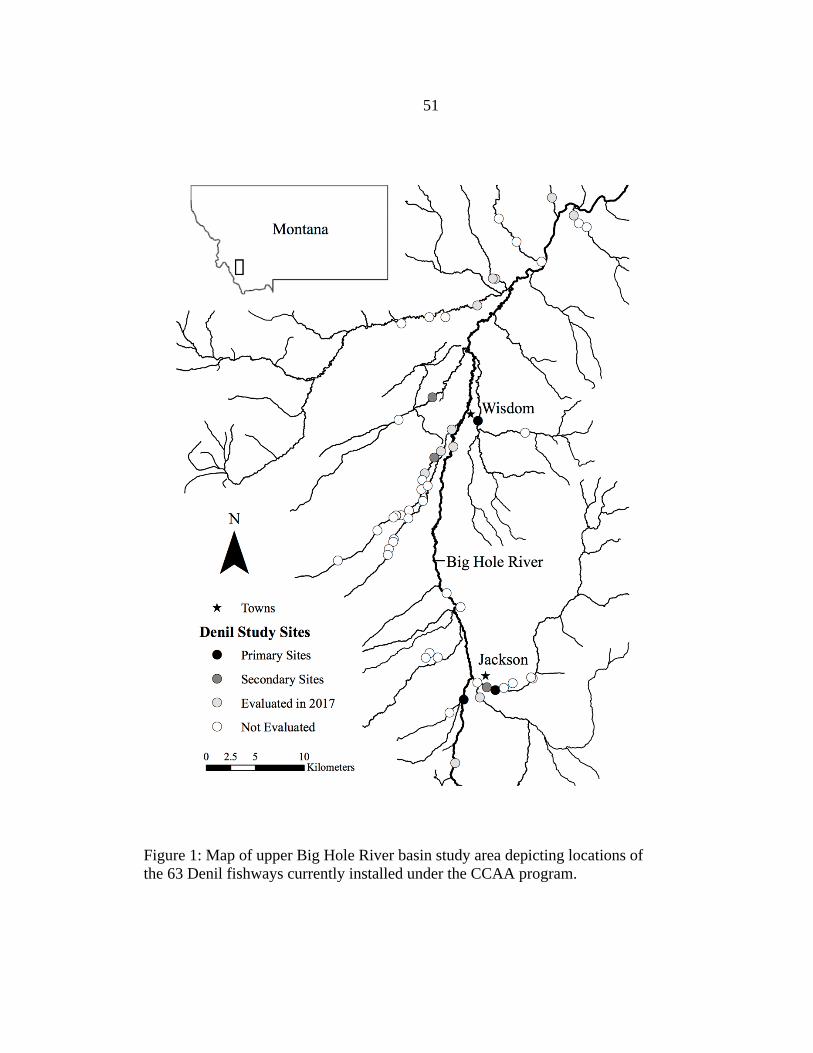
51
Figure 1: Map of upper Big Hole River basin study area depicting locations of
the 63 Denil fishways currently installed under the CCAA program.
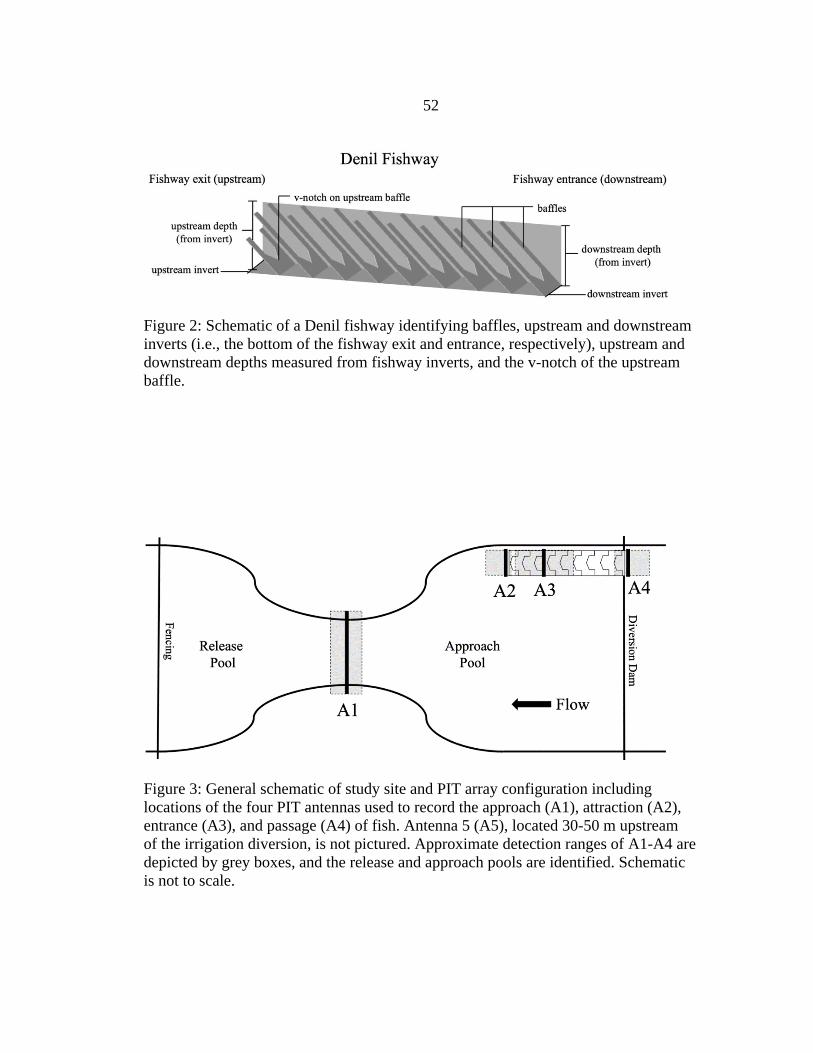
52
Figure 2: Schematic of a Denil fishway identifying baffles, upstream and downstream
inverts (i.e., the bottom of the fishway exit and entrance, respectively), upstream and
downstream depths measured from fishway inverts, and the v-notch of the upstream
baffle.
Figure 3: General schematic of study site and PIT array configuration including
locations of the four PIT antennas used to record the approach (A1), attraction (A2),
entrance (A3), and passage (A4) of fish. Antenna 5 (A5), located 30-50 m upstream
of the irrigation diversion, is not pictured. Approximate detection ranges of A1-A4 are
depicted by grey boxes, and the release and approach pools are identified. Schematic
is not to scale.
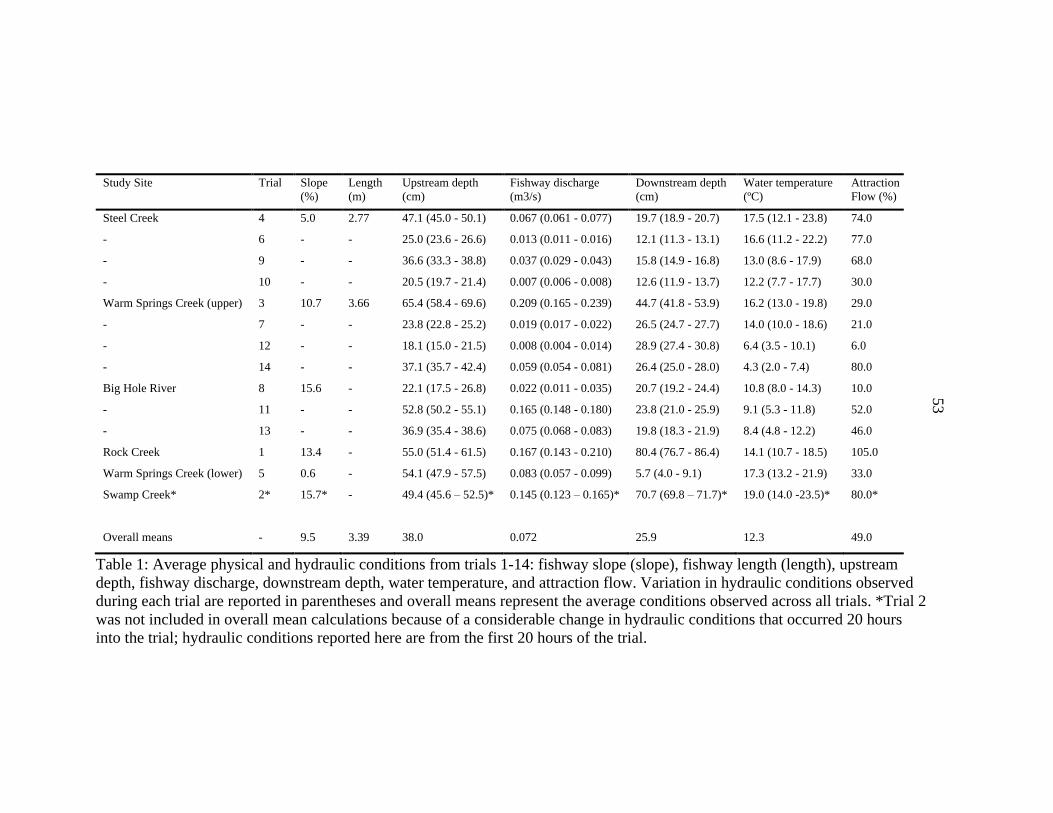
53
Study Site Trial Slope
(%)
Length
(m)
Upstream depth
(cm)
Fishway discharge
(m3/s)
Downstream depth
(cm)
Water temperature
(ºC)
Attraction
Flow (%)
Steel Creek 4 5.0 2.77 47.1 (45.0 - 50.1) 0.067 (0.061 - 0.077) 19.7 (18.9 - 20.7) 17.5 (12.1 - 23.8) 74.0
- 6 - - 25.0 (23.6 - 26.6) 0.013 (0.011 - 0.016) 12.1 (11.3 - 13.1) 16.6 (11.2 - 22.2) 77.0
- 9 - - 36.6 (33.3 - 38.8) 0.037 (0.029 - 0.043) 15.8 (14.9 - 16.8) 13.0 (8.6 - 17.9) 68.0
- 10 - - 20.5 (19.7 - 21.4) 0.007 (0.006 - 0.008) 12.6 (11.9 - 13.7) 12.2 (7.7 - 17.7) 30.0
Warm Springs Creek (upper) 3 10.7 3.66 65.4 (58.4 - 69.6) 0.209 (0.165 - 0.239) 44.7 (41.8 - 53.9) 16.2 (13.0 - 19.8) 29.0
- 7 - - 23.8 (22.8 - 25.2) 0.019 (0.017 - 0.022) 26.5 (24.7 - 27.7) 14.0 (10.0 - 18.6) 21.0
- 12 - - 18.1 (15.0 - 21.5) 0.008 (0.004 - 0.014) 28.9 (27.4 - 30.8) 6.4 (3.5 - 10.1) 6.0
- 14 - - 37.1 (35.7 - 42.4) 0.059 (0.054 - 0.081) 26.4 (25.0 - 28.0) 4.3 (2.0 - 7.4) 80.0
Big Hole River 8 15.6 - 22.1 (17.5 - 26.8) 0.022 (0.011 - 0.035) 20.7 (19.2 - 24.4) 10.8 (8.0 - 14.3) 10.0
- 11 - - 52.8 (50.2 - 55.1) 0.165 (0.148 - 0.180) 23.8 (21.0 - 25.9) 9.1 (5.3 - 11.8) 52.0
- 13 - - 36.9 (35.4 - 38.6) 0.075 (0.068 - 0.083) 19.8 (18.3 - 21.9) 8.4 (4.8 - 12.2) 46.0
Rock Creek 1 13.4 - 55.0 (51.4 - 61.5) 0.167 (0.143 - 0.210) 80.4 (76.7 - 86.4) 14.1 (10.7 - 18.5) 105.0
Warm Springs Creek (lower) 5 0.6 - 54.1 (47.9 - 57.5) 0.083 (0.057 - 0.099) 5.7 (4.0 - 9.1) 17.3 (13.2 - 21.9) 33.0
Swamp Creek* 2* 15.7* - 49.4 (45.6 – 52.5)* 0.145 (0.123 – 0.165)* 70.7 (69.8 – 71.7)* 19.0 (14.0 -23.5)* 80.0*
Overall means - 9.5 3.39 38.0 0.072 25.9 12.3 49.0
Table 1: Average physical and hydraulic conditions from trials 1-14: fishway slope (slope), fishway length (length), upstream
depth, fishway discharge, downstream depth, water temperature, and attraction flow. Variation in hydraulic conditions observed
during each trial are reported in parentheses and overall means represent the average conditions observed across all trials. *Trial 2
was not included in overall mean calculations because of a considerable change in hydraulic conditions that occurred 20 hours
into the trial; hydraulic conditions reported here are from the first 20 hours of the trial.

54
Total Counts (n) Fishway Efficiencies (%)
Species Group Released Approached Attracted Entered Passed Attraction Entrance Passage Overall
Arctic Grayling 416 335 (332) 178 86 (83) 79 53.1% 48.3% 95.2% 23.8%
Trout 668 618 (601) 468 350 (333) 319 75.7% 74.8% 95.8% 53.1%
Suckers 175 154 (151) 79 60 (57) 55 51.3% 75.9% 96.5% 36.4%
Burbot 8 7 4 2 2 57.1% 50.0% 100.0% 28.6%
Mountain Whitefish 1 1 1 1 1 100.0% 100.0% 100.0% 100.0%
All species 1268 1115 (1092) 730 499 (476) 456 65.5% 68.4% 95.8% 41.8%
Table 2: Summarized fishway efficiencies over 13 trials with total counts (released, approached, attracted, entered, and passed)
and proportional fishway efficiencies (attraction, entrance, passage, and overall) for each species group tested. Twenty-three
fish with unknown passage fate (i.e., fish that entered fishways but were not detected exiting) were omitted from passage and
overall efficiency analyses; the total counts of entering and approaching fish listed in parentheses represent the number of
entering and approaching fish used in passage and overall efficiency analyses respectively.

55
Figure 4: Fishway efficiencies (attraction, entrance, and passage) vs. upstream depth
for Arctic Grayling, Trout, and Suckers. Lines represent predicted efficiencies from
mixed effects logistic regressions and each point represents an observed efficiency
for one species group during an individual trial. Observed efficiencies are calculated
from between 1 and 58 fish; all passage efficiencies less than or equal to 50.0% are
based on two or fewer fish.
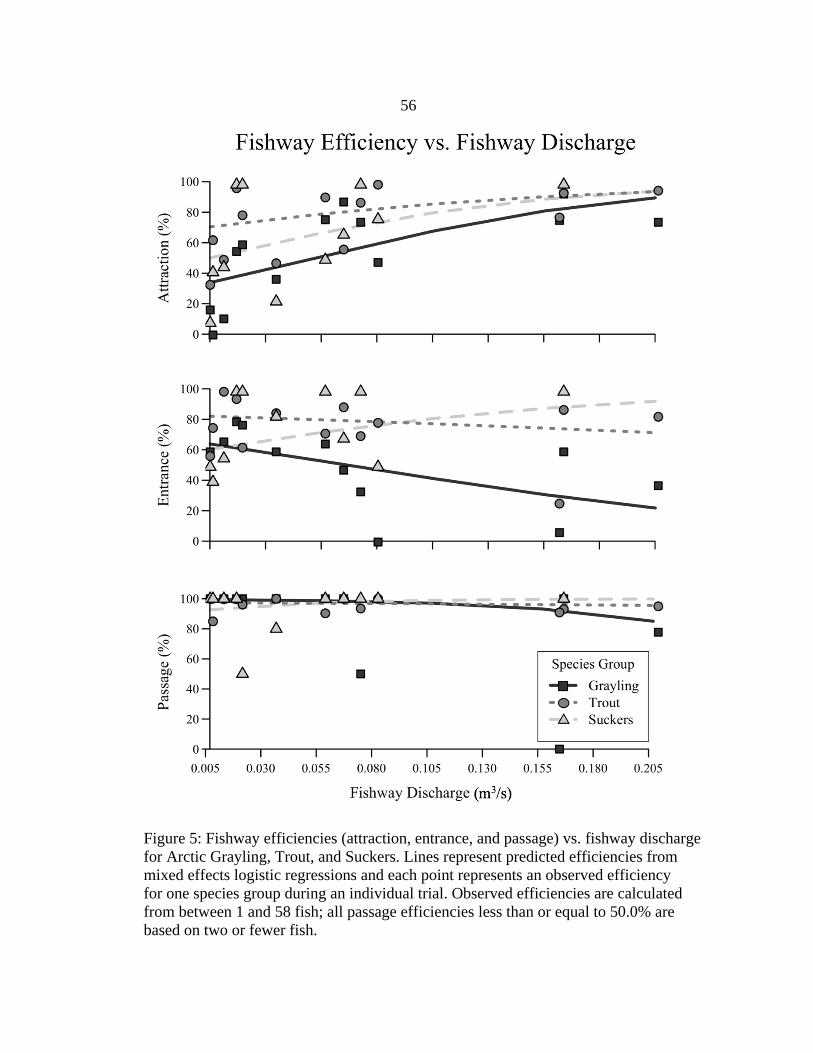
56
Figure 5: Fishway efficiencies (attraction, entrance, and passage) vs. fishway discharge
for Arctic Grayling, Trout, and Suckers. Lines represent predicted efficiencies from
mixed effects logistic regressions and each point represents an observed efficiency
for one species group during an individual trial. Observed efficiencies are calculated
from between 1 and 58 fish; all passage efficiencies less than or equal to 50.0% are
based on two or fewer fish.
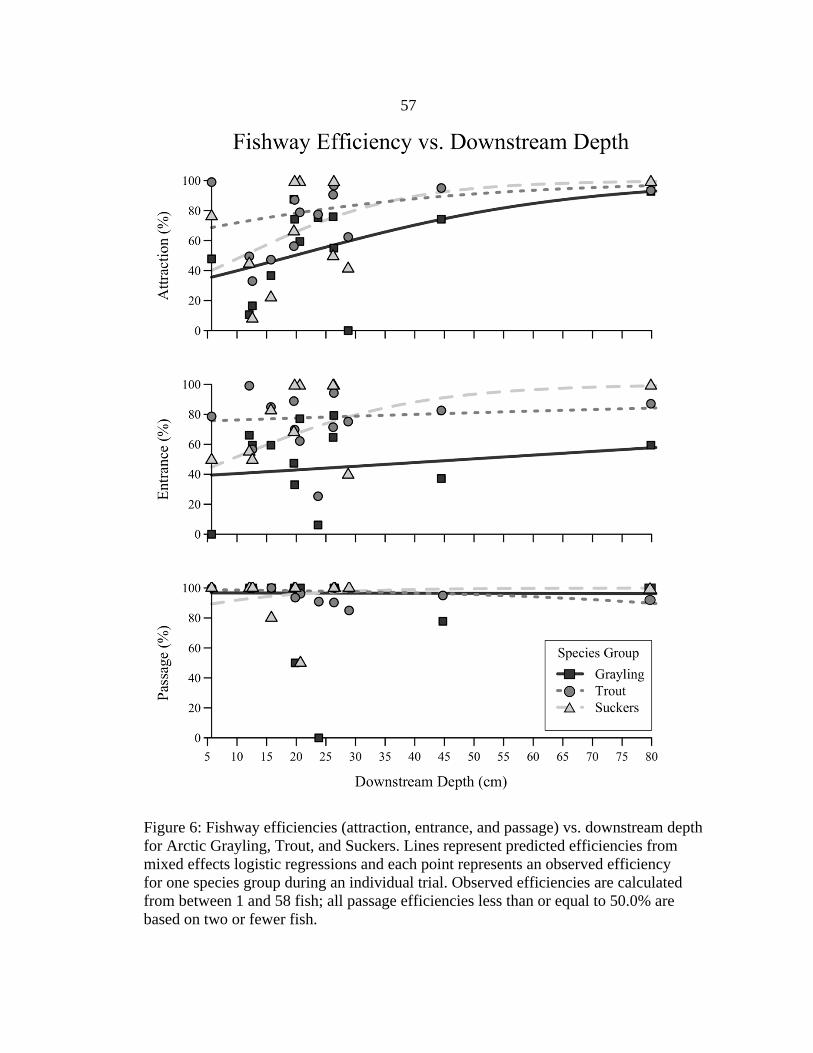
57
Figure 6: Fishway efficiencies (attraction, entrance, and passage) vs. downstream depth
for Arctic Grayling, Trout, and Suckers. Lines represent predicted efficiencies from
mixed effects logistic regressions and each point represents an observed efficiency
for one species group during an individual trial. Observed efficiencies are calculated
from between 1 and 58 fish; all passage efficiencies less than or equal to 50.0% are
based on two or fewer fish.

58
Figure 7: Fishway efficiencies (attraction, entrance, and passage) vs. slope for Arctic
Grayling, Trout, and Suckers. Lines represent predicted efficiencies from mixed effects
logistic regressions and each point represents an observed efficiency for one species
group during an individual trial. Observed efficiencies are calculated from between
1 and 58 fish; all passage efficiencies less than or equal to 50.0% are based on two or
fewer fish.

59
Figure 8: Fishway efficiencies (attraction, entrance, and passage) vs. attraction flow
for Arctic Grayling, Trout, and Suckers. Lines represent predicted efficiencies from
mixed effects logistic regressions and each point represents an observed efficiency
for one species group during an individual trial. Observed efficiencies are calculated
from between 1 and 58 fish; all passage efficiencies less than or equal to 50.0% are
based on two or fewer fish.
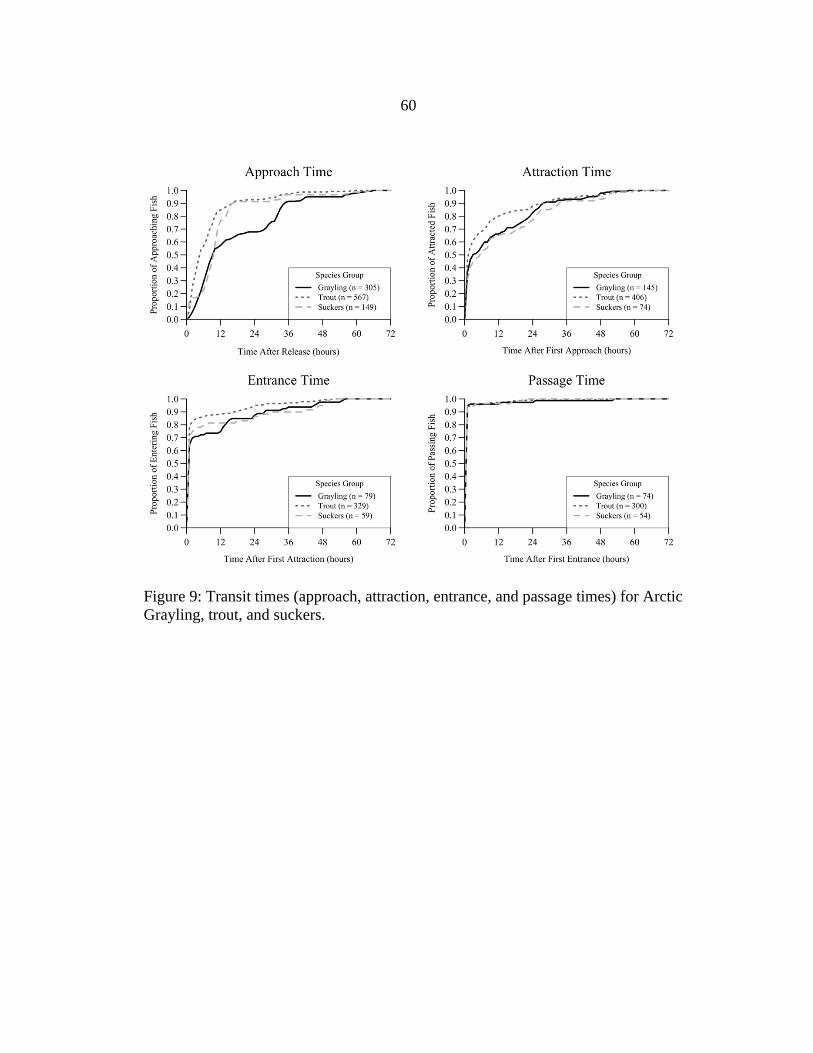
60
Figure 9: Transit times (approach, attraction, entrance, and passage times) for Arctic
Grayling, trout, and suckers.

61
Figure 10: Time after release until passage for 445 passing fish. Nights 1-3 are depicted
as shaded areas bounded by solid vertical lines representing the average time from
release until sunset and sunrise calculated over 12 trials (trial 1 was not included in
these calculations because of its delayed release time). Dashed vertical lines represent
the variation in time after release until sunset and sunrise over those 12 trials.
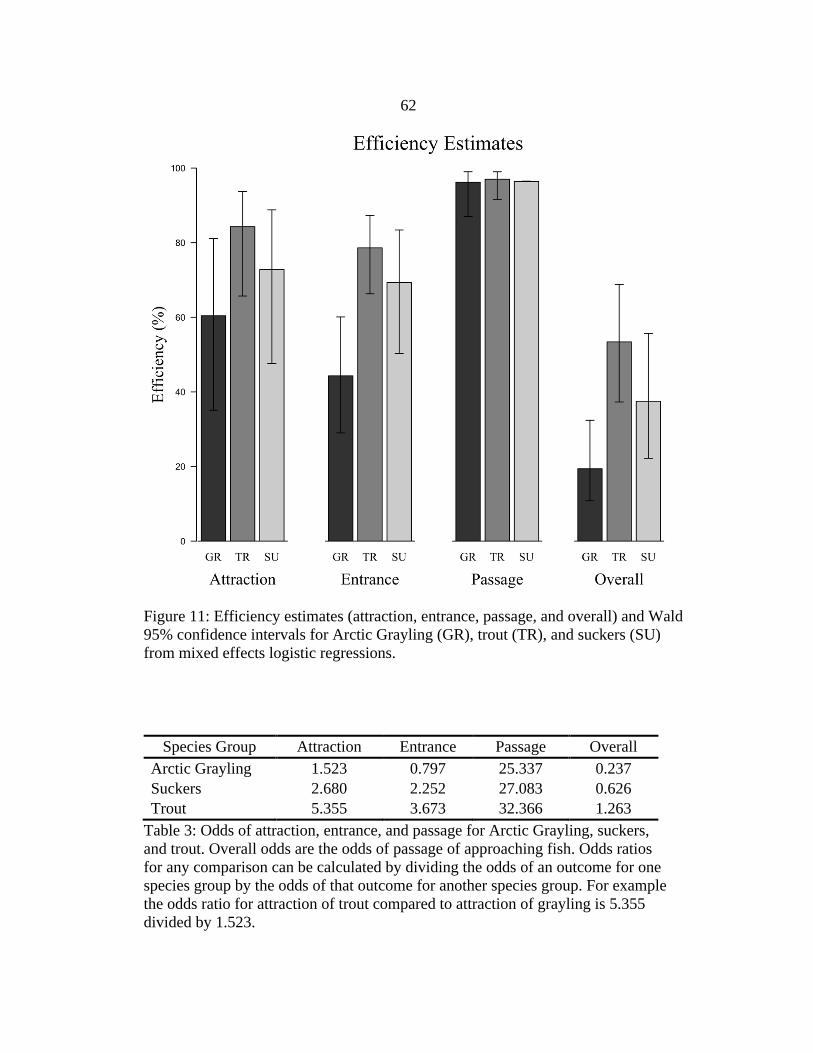
62
Figure 11: Efficiency estimates (attraction, entrance, passage, and overall) and Wald
95% confidence intervals for Arctic Grayling (GR), trout (TR), and suckers (SU)
from mixed effects logistic regressions.
Species Group Attraction Entrance Passage Overall
Arctic Grayling 1.523 0.797 25.337 0.237
Suckers 2.680 2.252 27.083 0.626
Trout 5.355 3.673 32.366 1.263
Table 3: Odds of attraction, entrance, and passage for Arctic Grayling, suckers,
and trout. Overall odds are the odds of passage of approaching fish. Odds ratios
for any comparison can be calculated by dividing the odds of an outcome for one
species group by the odds of that outcome for another species group. For example
the odds ratio for attraction of trout compared to attraction of grayling is 5.355
divided by 1.523.
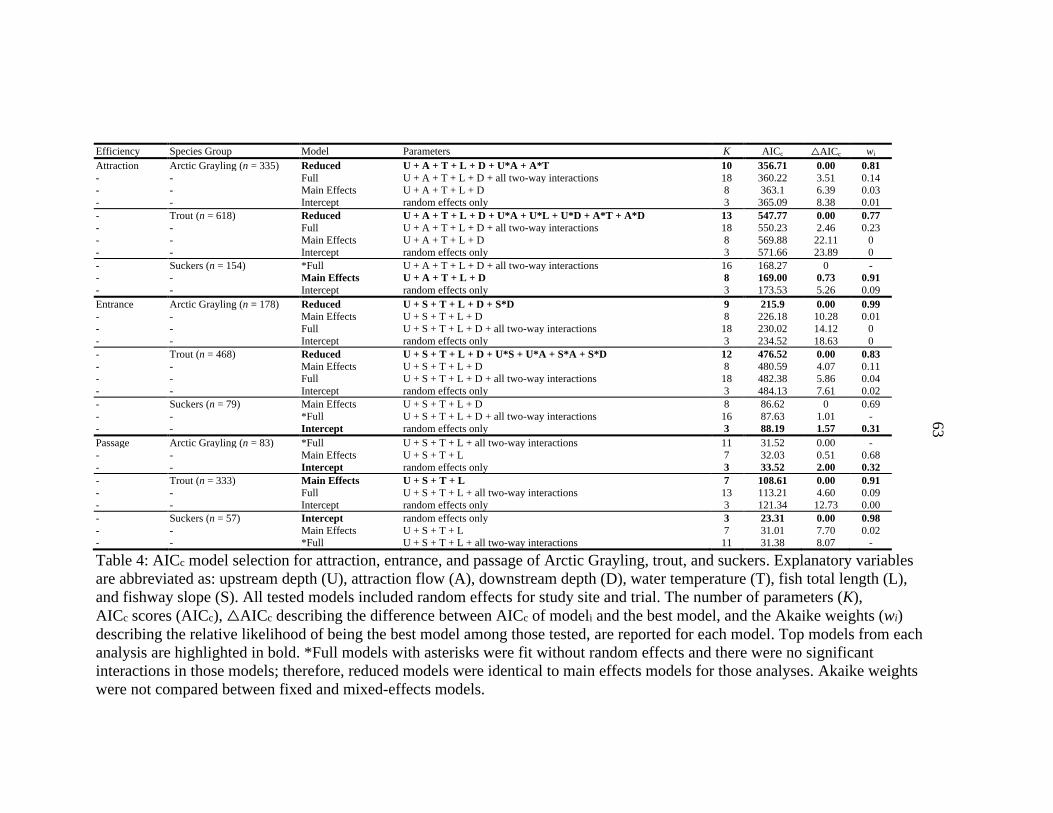
63
Efficiency Species Group Model Parameters K AICc △AICc wi
Attraction Arctic Grayling (n = 335) Reduced U + A + T + L + D + U*A + A*T 10 356.71 0.00 0.81
- - Full U + A + T + L + D + all two-way interactions 18 360.22 3.51 0.14
- - Main Effects U + A + T + L + D 8 363.1 6.39 0.03
- - Intercept random effects only 3 365.09 8.38 0.01
- Trout (n = 618) Reduced U + A + T + L + D + U*A + U*L + U*D + A*T + A*D 13 547.77 0.00 0.77
- - Full U + A + T + L + D + all two-way interactions 18 550.23 2.46 0.23
- - Main Effects U + A + T + L + D 8 569.88 22.11 0
- - Intercept random effects only 3 571.66 23.89 0
- Suckers (n = 154) *Full U + A + T + L + D + all two-way interactions 16 168.27 0 -
- - Main Effects U + A + T + L + D 8 169.00 0.73 0.91
- - Intercept random effects only 3 173.53 5.26 0.09
Entrance Arctic Grayling (n = 178) Reduced U + S + T + L + D + S*D 9 215.9 0.00 0.99
- - Main Effects U + S + T + L + D 8 226.18 10.28 0.01
- - Full U + S + T + L + D + all two-way interactions 18 230.02 14.12 0
- - Intercept random effects only 3 234.52 18.63 0
- Trout (n = 468) Reduced U + S + T + L + D + U*S + U*A + S*A + S*D 12 476.52 0.00 0.83
- - Main Effects U + S + T + L + D 8 480.59 4.07 0.11
- - Full U + S + T + L + D + all two-way interactions 18 482.38 5.86 0.04
- - Intercept random effects only 3 484.13 7.61 0.02
- Suckers (n = 79) Main Effects U + S + T + L + D 8 86.62 0 0.69
- - *Full U + S + T + L + D + all two-way interactions 16 87.63 1.01 -
- - Intercept random effects only 3 88.19 1.57 0.31
Passage Arctic Grayling (n = 83) *Full U + S + T + L + all two-way interactions 11 31.52 0.00 -
- - Main Effects U + S + T + L 7 32.03 0.51 0.68
- - Intercept random effects only 3 33.52 2.00 0.32
- Trout (n = 333) Main Effects U + S + T + L 7 108.61 0.00 0.91
- - Full U + S + T + L + all two-way interactions 13 113.21 4.60 0.09
- - Intercept random effects only 3 121.34 12.73 0.00
- Suckers (n = 57) Intercept random effects only 3 23.31 0.00 0.98
- - Main Effects U + S + T + L 7 31.01 7.70 0.02
- - *Full U + S + T + L + all two-way interactions 11 31.38 8.07 -
Table 4: AICc model selection for attraction, entrance, and passage of Arctic Grayling, trout, and suckers. Explanatory variables
are abbreviated as: upstream depth (U), attraction flow (A), downstream depth (D), water temperature (T), fish total length (L),
and fishway slope (S). All tested models included random effects for study site and trial. The number of parameters (K),
AICc scores (AICc), △AICc describing the difference between AICc of modeli and the best model, and the Akaike weights (wi)
describing the relative likelihood of being the best model among those tested, are reported for each model. Top models from each
analysis are highlighted in bold. *Full models with asterisks were fit without random effects and there were no significant
interactions in those models; therefore, reduced models were identical to main effects models for those analyses. Akaike weights
were not compared between fixed and mixed-effects models.

64
Trout Arctic Grayling Suckers
Efficiency Parameter ß ± SE P OR ß ± SE P OR ß ± SE P OR
Attraction ß0 Intercept 3.841* 0.675 <0.001 - -0.483 0.602 0.422 - 1.970 1.091 0.071 -
- ß1 U (cm) -0.061* 0.024 0.009 0.941 0.075* 0.022 <0.001 1.078 -0.004 0.032 0.888 -
- ß2 A (%) -0.059* 0.015 <0.001 0.943 0.029* 0.010 0.003 1.029 0.011 0.015 0.444 -
- ß3 D (cm) 0.203* 0.038 <0.001 1.225 -0.011 0.026 0.667 - 0.112 0.073 0.125 -
- ß4 T (ºC) 0.271* 0.094 0.004 1.311 0.254* 0.087 0.004 1.289 0.368* 0.094 < 0.001 1.445
- ß5 L (cm) -0.005 0.020 0.787 - 0.090 0.065 0.167 - 0.016 0.043 0.711 -
- ß6 U (cm) x A (%) -0.007* 0.002 <0.001 - 0.003* 0.001 <0.001 - - - - -
- ß7 A (%) x T (ºC) -0.005* 0.002 0.006 - -0.010* 0.003 0.002 - - - - -
- ß8 D (cm) x U (cm) -0.013* 0.004 <0.001 - - - - - - - - -
- ß9 U (cm) x L (cm) 0.004* 0.002 0.008 - - - - - - - - -
- ß10 D (cm) x A (%) 0.003* 0.001 0.004 - - - - - - - - -
Entrance ß0 Intercept 1.633* 0.281 < 0.001 - 0.776* 0.314 0.014 - - - - -
- ß1 U (cm) -0.051* 0.015 < 0.001 0.950 -0.103* 0.022 < 0.001 0.902 - - - -
- ß2 S (%) -0.462* 0.101 < 0.001 0.630 -0.427* 0.136 0.002 0.652 - - - -
- ß3 D (cm) 0.151* 0.035 < 0.001 1.163 0.115* 0.030 < 0.001 1.122 - - - -
- ß4 L (cm) 0.028 0.022 0.205 - 0.146 0.086 0.088 - - - - -
- ß5 T (ºC) 0.090* 0.044 0.042 1.094 0.031 0.056 0.577 - - - - -
- ß6 S (%) x D (cm) -0.025* 0.007 < 0.001 - -0.019* 0.007 0.004 - - - - -
- ß7 U (cm) x S (%) -0.006* 0.003 0.046 - - - - - - - - -
- ß8 U (cm) x T (ºC) -0.010* 0.004 0.025 - - - - - - - - -
- ß9 S (%) x T (ºC) -0.073* 0.028 0.010 - - - - - - - - -
Passage ß0 Intercept 4.176* 0.555 < 0.001 - - - - - - - - -
- ß1 U (cm) -0.971 0.730 0.184 - - - - - - - - -
- ß2 S (%) -0.113 0.094 0.231 - - - - - - - - -
- ß3 T (ºC) 0.221* 0.087 0.011 1.247 - - - - - - - -
- ß4 L (cm) 0.179* 0.063 0.005 1.196 - - - - - - - -
Table 5: Parameter estimates from top models for attraction, entrance, and passage of trout, Arctic Grayling, and suckers.
Explanatory variables are abbreviated as: upstream depth (U), attraction flow (A), downstream depth (D), water temperature (T),
fish total length (L), and fishway slope (S). Parameter estimates (ß), standard errors (SE), P-values (P), and odds ratios (OR) are
reported for top models in each analysis. All explanatory variables have been centered on their overall mean values (Table 1).
Significant parameter estimates (P < 0.05) are denoted by *. Odds ratios (OR) describing the effect of a one-unit increase in each
parameter are computed for all statistically significant main effects by exponentiation of parameter estimates (ß).

65
Figure 12: Photo of plunging entrance conditions during Trial 5 on Warm Springs
Creek (lower). The deep upstream depth, shallow downstream depth (Table 1),
and 0.6% slope resulted in a turbulent entrance plunge that appeared to restrict
entrance of Arctic Grayling and limit entrance of suckers during this trial.

66
Figure 13: Photo of plunging entrance conditions during Trial 11 on the Big Hole
River. The deep upstream depth, steep slope, and shallow downstream depth
(Table 1) resulted in a turbulent entrance plunge that appeared to limit entrance
of trout and Arctic Grayling during this trial.
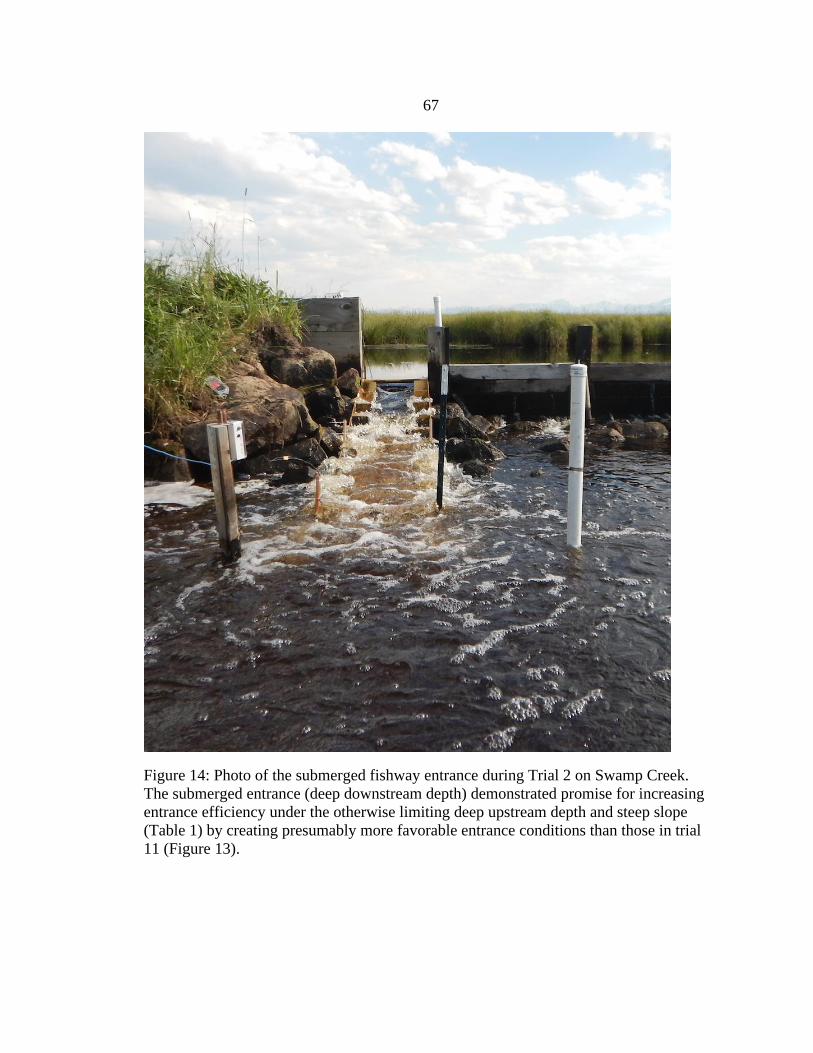
67
Figure 14: Photo of the submerged fishway entrance during Trial 2 on Swamp Creek.
The submerged entrance (deep downstream depth) demonstrated promise for increasing
entrance efficiency under the otherwise limiting deep upstream depth and steep slope
(Table 1) by creating presumably more favorable entrance conditions than those in trial
11 (Figure 13).