Attracting Private Capital to The Electricity Sector
30
Tonci Bakovic 1 Tonci Bakovic Attracting Private Capital to The Electricity Sector -regulatory challenges and lessons- January 2012 Washington DC Presented by: Tonci Bakovic Chief Energy Specialist International Finance Corporation
Transcript of Attracting Private Capital to The Electricity Sector

Tonci Bakovic 1
To
nci B
ako
vic
Attracting Private Capital to The Electricity Sector -regulatory challenges and lessons-
January 2012
Washington DC
Presented by:
Tonci Bakovic
Chief Energy Specialist
International Finance Corporation

Tonci Bakovic 2
The findings, interpretations, and conclusions expressed in this presentation
are entirely those of the author and should not be attributed in any manner to
the International Finance Corporation or to the World Bank Group or to
members of its Board of Executive Directors or the countries they represent.
Disclaimer
-This presentation cannot be quoted without permission-
Tonci Bakovic

Tonci Bakovic 3
1. Capital Attraction – two decades of reform and privatization
2. Change Trends
3. Regulatory Lessons Learned and Best Practices
4. Country Case Studies Bolivia, Macedonia, Argentina, Chile, Brazil, Romania, Albania, Turkey, India
5. Summary – Best Practices
6. Suggested Reading
Table of Contents
“If you have ten thousand regulations you destroy all respect for the law.” Winston Churchill

Tonci Bakovic 4
0
5000
10000
15000
20000
25000
30000
35000
40000
1990 1991 1992 1993 1994 1995 1996 1997 1998 1999 2000 2001 2002 2003 2004 2005 2006 2007 2008 2009 2010 2011
East Asia & Pacific
Europe & Central Asia
Latin America & Caribbean
Middle East & North Africa
South Asia
Sub-Saharan Africa
Tonci Bakovic
Latin America
Privatizations
Indian Ultramega
Projects
Brazil Boom
Eastern Europe
Privatizations
Asian IPPs
$ Capital Attraction
Two Decades of Reform (1990-2011)
Privatizations, Concessions, Green Field Projects
Source : World Bank and PPIAF, PPI Project Database. (http://ppi.worldbank.org) Date: 01/23/2012
Total Investment Commitments in Power USD 000
Tonci Bakovic 5
-
10,000
20,000
30,000
40,000
50,000
60,000
70,000
80,000
90,000
100,000
110,000
120,000
Tonci Bakovic
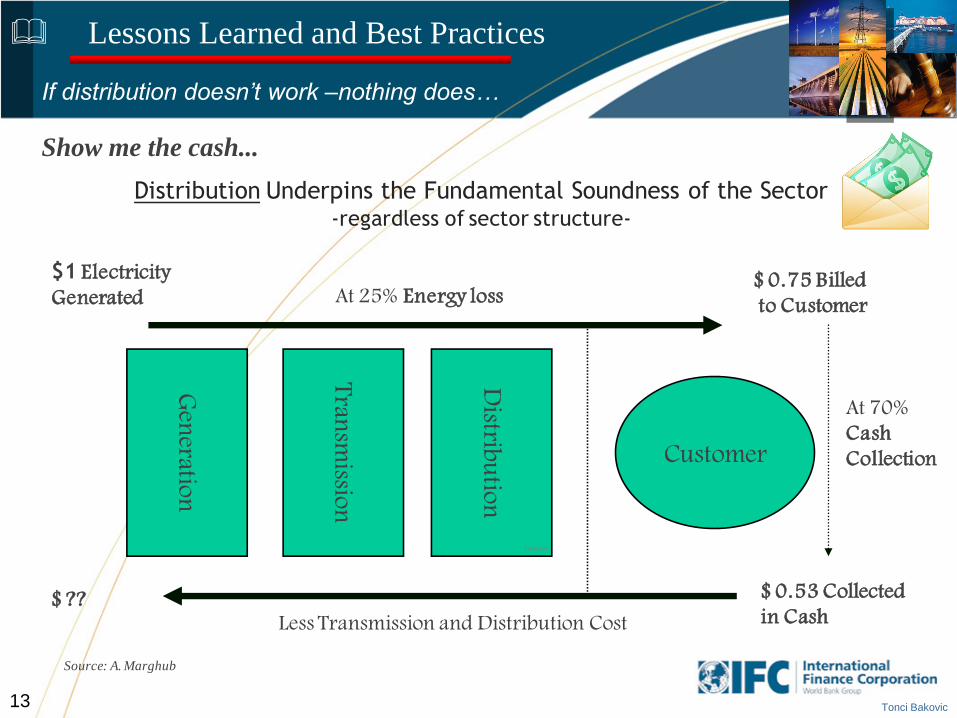
$ Capital Attraction
Attraction of Private Capital to Power (1990-2011)
Total Investment Commitments USD 000
Source : World Bank and PPIAF, PPI Project Database. (http://ppi.worldbank.org) Date: 01/23/2012
and the winners are…

Tonci Bakovic 6 Source : World Bank and PPIAF, PPI Project Database. (http://ppi.worldbank.org) Date: 01/23/2012
$0
$10,000
$20,000
$30,000
$40,000
$50,000
$60,000
$70,000
$80,000
$90,000
$100,000
$110,000
Concession
Divestiture
Greenfield
Tonci Bakovic
$ Capital Attraction
Attraction of Private Capital to Power (1990-2011)
Concessions, Divestitures or Privatizations, Green Field Projects USD 000
Indian Ultramega (Gov Guarantee)
Russian Privatization (Generation)
Brazil (Concessions +
Greenfield)
Distribution privatized in all countries with exception of: -Vietnam
-Thailand
-China
-Mexico

Tonci Bakovic 7
101 106
238 253 260 262 288334 343 347
392 418 433 461 464 477 492
601
699
1,660
0
200
400
600
800
1,000
1,200
1,400
1,600
1,800
KOE ROE Varna Ban Dob M old Star Olt Sof Ded Tit ESM VSE Dem SSE Ed Em Elm ZSE M Sud
Ukr Ukr Bulg Rom Rom Rom Bulg Rom Bulg Hung Hung M acd Slovk Hung Slovk Hung Hung Hung Slovk Rom
Avg E.Europe Avg Lat.America Avg.Brazil T.Bakovic
EV= [(amount paid for equity) + (debt assumed * % bought)]
Post-World Bank PRG
PRG = Partial Risk Guarantee
$ Capital Attraction
Eastern Europe - Prices Paid for Discos (US$/customer)
Attraction of Private Capital to the Regulated Business
Brazil an outlier ?
Disco = Distribution Company
T Bakovic

Tonci Bakovic
How the Sector Structure Has Evolved
G1 G2 G3 G4
TRANSMISSION COMPANY
LTC/Spot
DISTRIBUTION COMPANIES AND LARGE USERS
END USERS
LTC = LONG TERM CONTRACT
LTC/Spot LTC/Spot LTC/Spot
LTC/Spot
Source: T Bakovic
G
T
D
Vertical Integrated
UTILITY (Monopoly)COMPETITION and Choice
ifrompriceofferP
offeredquantityofferQ
ifromprocuredquantityQwhere
QofferQQand
demandQtosubject
PQMinimize
i
i
i
iii
n
i i
i
n
i i
)(
0),(
,
1
1
Cost Plus = O&M + Dep + r (Assets)
Competitive MktMonopoly
T Bakovic
CHANGE TRENDS
8

Tonci Bakovic
Private participation and competition
CHANGE TRENDS
Latin
American
Model
Asian (IPP)
ModelIndonesia
Pakistan
Thailand
Philippines
MexicoFrance, Italy
South Africa
Portugal
Morocco
Uruguay
Chile
Argentina
El Salvador
Panama
Guatemala
Peru
Colombia
AustraliaNew Zealand
Cote d’Ivoire
Cameroon
Low
Competition
and
Regulatory
Reform
Private ParticipationLow High
High
Uganda
Philippines
Turkey
Argentina
Norway
USARussia
Brazil
Egypt
Vietnam
Source: T Bakovic
Bulgaria
Romania
Slovakia
Hungary
Poland,
India
UK
China,
Turkey
Ghana
UK +
9
Do you know where you are going to….
Tonci Bakovic
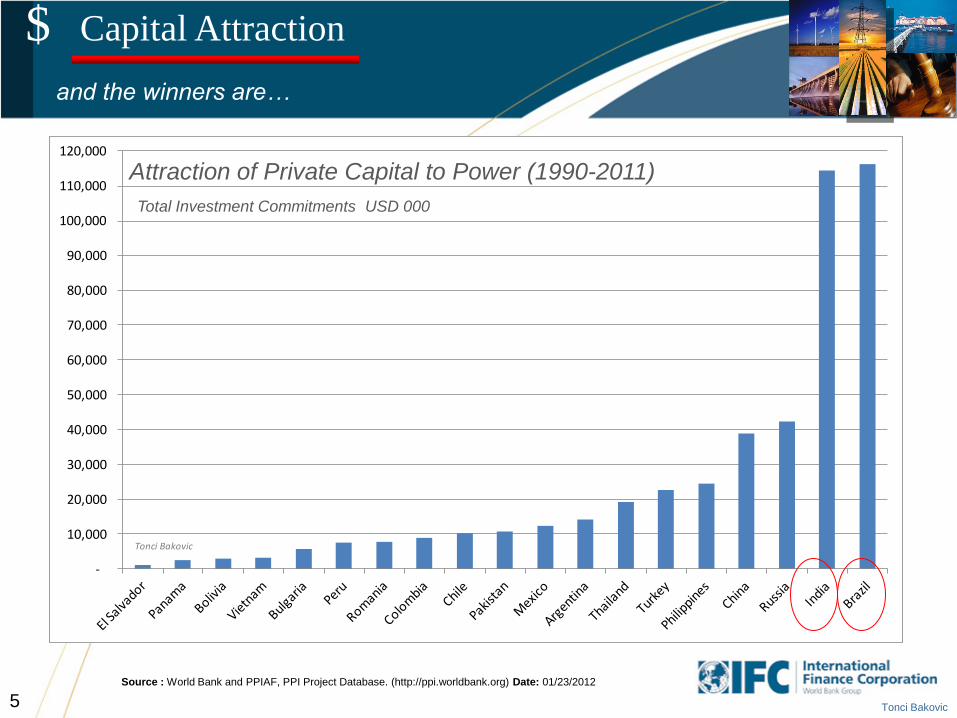
Ingredients of “good regulatory reform”:
1. Clear “rules-of-the-game” Electricity Law and Regulations
2. Competition Lowest cost producer wins and no market concentration nor dominant state-
owned generator (no single-seller, no single-buyer)
3. Free contracting scheme Free to enter into bilateral contracts
4. Credit worthy off-taker Private distribution
5. Trading arrangements Clear and transparent rules of dispatch and operations
6. Open access to transmission (and distribution) Wires are equally and transparently open to all competitors
7. Independent Regulator Independent regulator with instances of appeal and appointed
by congress/parliament and paid by fee on sector revenues (no Gov budget)
CHANGE TRENDS
10
http://publications.worldbank.org/index.php?
main_page=product_info&cPath=0&product
s_id=21832
Regulation by Contract
What are we looking for…

Tonci Bakovic 11
0
20
40
60
80
100
120
140
160
US$
/MW
h
Taxes
Distribution
Transmission
Generation
T Bakovic
First Question: Do tariffs cover costs…?
Second Question: Do we want to maximize sale revenues to the Treasury or do we want to minimize
tariff impact to customers ?
Third Question: How sustainable are the tariff increases required by the privatization policy ?
Tariff
Components
Lessons Learned and Best Practices
Checklist before embarking on reform/privatization

Tonci Bakovic 12
~50% Power Purchase Costs (PPC)
~50% Distribution Margin (VAD)
~2/3 RAB related
Lessons Learned and Best Practices
Pass-Through and Asset Valuation
RAB = Regulated Asset Base
Total Tariff
Key Regulatory Issues:
-Promote competition
-Respect free-market price determination
-PPC passthrough mechanism
Key Regulatory Issues:
-Asset revaluation
-WACC determination
-Allowed losses passthrough
-Allowed bad-debt passthrough
-X-factor determination
-Quality of Service Regulations
-Forex indexation
-Supply margin determination
Ge
ne
ratio
n P
rice
s
Dis
tributio
n T
ariff
Tonci Bakovic
If you achieve
competition at the
wholesale level then
you only need to
regulate the “wires-
business”
Tonci Bakovic
Gen
eration
Customer
Tran
smissio
n
Distrib
utio
n
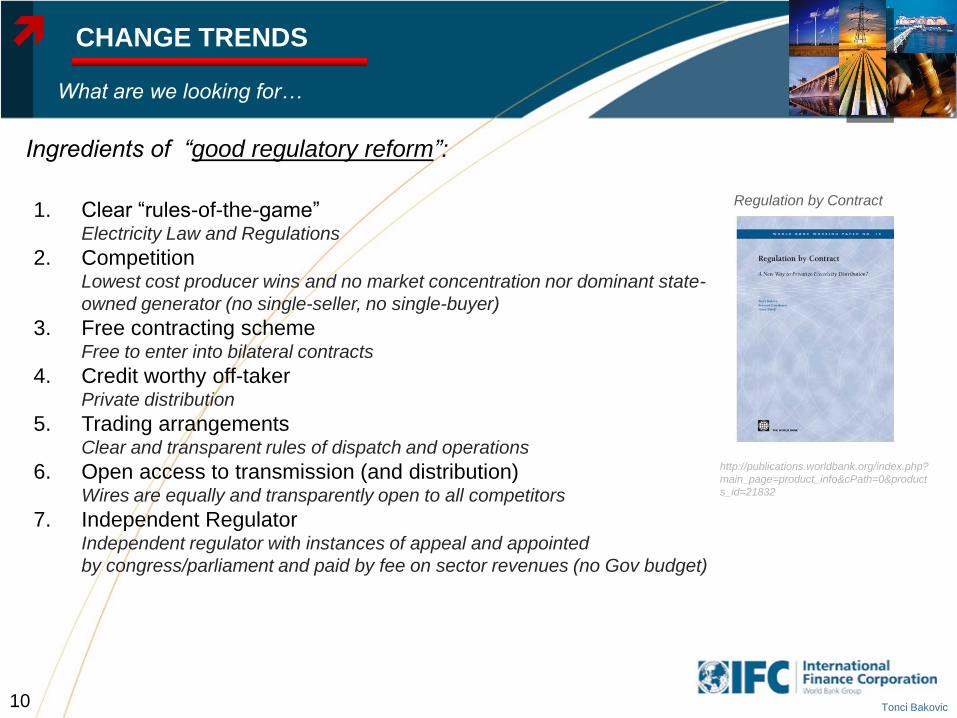
$ 0.53 Collected
in Cash
$1 Electricity
Generated At 25% Energy loss$ 0.75 Billed
to Customer
At 70%
Cash
Collection
Less Transmission and Distribution Cost$ ??
Distribution Underpins the Fundamental Soundness of the Sector-regardless of sector structure-
Source: A. Marghub
T Bakovic
Show me the cash...
Lessons Learned and Best Practices
If distribution doesn‟t work –nothing does…
13

Tonci Bakovic 14
RAB Depreciation
Regulated Return on RAB
Operating costs
Cost of distribution losses
Regulated Revenues
Projected Demand
For Regulatory Period
Distribution Tariff
(indexed to inflation during
regulatory period)
RAB Depreciation
Regulated Return on RAB
Operating costs
Cost of distribution losses
Regulated Revenues
Projected Demand
For Regulatory Period
Distribution Tariff
(indexed to inflation during
regulatory period)
RRt = OCt + Depnt + [RABt x RRR] + DLt
RRt = Regulated revenues
OCt = Operating costs (in real terms). “Controllable” costs (O&M costs, commercial and administrative costs, labor cost) and “non-controllable” costs ( taxes, royalties)
Depnt = Depreciation of the RAB
RABt = Regulatory Asset Base. RAB is based on the enterprise value paid for the disco assets at privatization, plus the future capital expenditure approved by Regulator, plus
the annual working capital needs (e.g. capped at 1/8 of the revenues). RAB is depreciated annually and adjusted for inflation at the end of each regulatory period.
RRR = Regulated rate of return determined using a pre-tax Capital Asset Pricing Methodology (CAPM). This value remains constant for each regulatory year in the regulatory
period [e.g. the RRR can be set at 12%, in real terms, for the First Regulatory Period (FRP) and 10% for the Second Regulatory Period (SRP)]
DLt = Cost to purchase the energy that does not get distributed to the end consumers due to commercial and technical losses in the network. (e.g. allowed losses for the
beginning of the FRP are 13%)
Lessons Learned and Best Practices
Typical Components of the Distribution Tariff
PCAPt = PCAPt-1 x (1 + CPI – X)
customers
RRt
#PCAPt
Source: Tonci Bakovic
Tonci Bakovic
An asset based business…
Tonci Bakovic 15
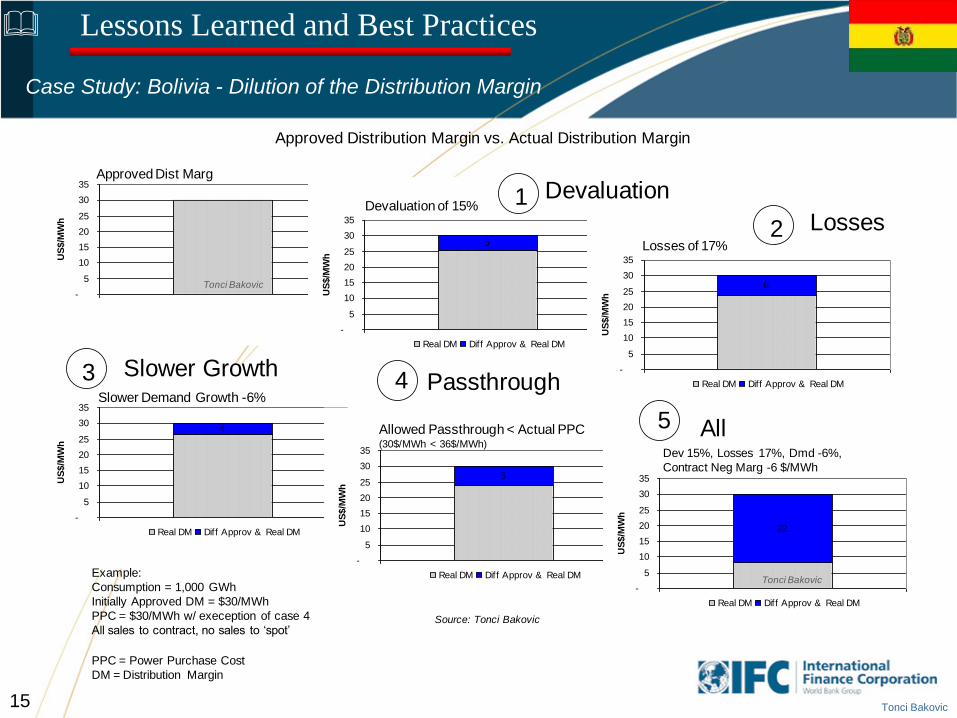
Case Study: Bolivia - Dilution of the Distribution Margin
Lessons Learned and Best Practices
-
5
10
15
20
25
30
35
1
US
$/M
Wh
5
-
5
10
15
20
25
30
35
1
US
$/M
Wh
Real DM Diff Approv & Real DM
6
-
5
10
15
20
25
30
35
1
US
$/M
Wh
Real DM Diff Approv & Real DM
4
-
5
10
15
20
25
30
35
1
US
$/M
Wh
Real DM Diff Approv & Real DM
6
-
5
10
15
20
25
30
35
1
US
$/M
Wh
Real DM Diff Approv & Real DM
22
-
5
10
15
20
25
30
35
1
US
$/M
Wh
Real DM Diff Approv & Real DM
Devaluation of 15%
Losses of 17%
Slower Demand Growth -6%
Allowed Passthrough < Actual PPC(30$/MWh < 36$/MWh)
Dev 15%, Losses 17%, Dmd -6%,
Contract Neg Marg -6 $/MWh
Approved Dist Marg
PPC = Power Purchase Cost
DM = Distribution Margin
Approved Distribution Margin vs. Actual Distribution Margin
1
2
3 4
Devaluation
Losses
Slower GrowthPassthrough
Example:
Consumption = 1,000 GWh
Initially Approved DM = $30/MWh
PPC = $30/MWh w/ exeception of case 4
All sales to contract, no sales to „spot‟
All5
Source: Tonci Bakovic
Tonci Bakovic
Tonci Bakovic

Tonci Bakovic 16
0%
10%
20%
30%
40%
50%
60%
70%
80%
90%
100%
Jan-
06
Feb-
06
Mar-
06
Apr-
06
May-
06
Jun-
06
Jul-
06
Aug-
06
Sep-
06
Oct-
06
Nov-
06
Dec-
06
Jan-
07
Feb-
07
Mar-
07
Apr-
07
1 month 3 months 6 months 9 months
Estimated Bill Collections Rates as % of Monthly Invoices
Sample: Starting Retail Tariff After Privatization
• Difficult for regulator to add capex to the asset base
• Company trying to improve efficiencies (reduce
O&M, improve collections, reduce losses)
• Privatization restrictions on employee reductions
• Trying to shift share of VAD that is going to O&M
and losses to the asset base (capex)
• Chicken-and-egg issue since you need capex to
improve efficiency (reduce losses, increase
collections)
Performance Improvement Higher Capex
Larger RAB Higher Tariff
2.99
0.11
0.99
0.33
0.46
0.42
0.34
0.00
1.00
2.00
3.00
4.00
5.00
6.00
Eu
rocen
t/kW
h
Pow er Purchase Cost Transmission ChargeO&M Costs DepreciationReturn on RAB Allow ed LossesExcess Losses
Net
Distribution
Margin
€2.2 cent/kWh
Power Purchase
Cost Tariff
€3.1 cent/kWh
Excess
Losses
Retail
Tariff: €5.3
cent/kWh
Lessons Learned and Best Practices
Macedonia: Losses vs Capex
Tonci Bakovic
Tonci Bakovic RAB = Regulated Asset Base

Tonci Bakovic
Single Buyer stops delivering electricity to cover losses
Import wholesale mkt prices at 7 euro-cent/kWh
Only 11% losses allowed for pass-through
Actual losses in 2008 are 21%
Current scenario already shows losses at regulated wholesale prices
Revised scenario shows losses at import wholesale mkt prices
3.06 3.06
0.11 0.11
1.12 1.12
0.33 0.330.46 0.46
0.44 0.44
0.410.93
0.00
1.00
2.00
3.00
4.00
5.00
6.00
7.00
Eu
roc
en
t/kW
h
Power Purchase Cost Transmission Charge O&M Costs
Depreciation Return on RAB Allowed Losses
Excess Losses
Net
Distribution
Margin
€2.2 cent/kWh
Power Purchase
Cost Tariff
€3.1 cent/kWh
Excess
Losses at
market prices
ESM Retail
Tariff: €5.3
cent/kWh
Excess
Losses at regulated
prices
Current
Scenario
Revised
Scenario
Macedonia: Single Buyer and Pass-through of Losses
Lessons Learned and Best Practices
Tonci Bakovic
+ $- $ - $
? $
G1 G2 Gn
Single-Buyer
T Bakovic
Not enough cash to meet capex needs or debt service
17
Tonci Bakovic
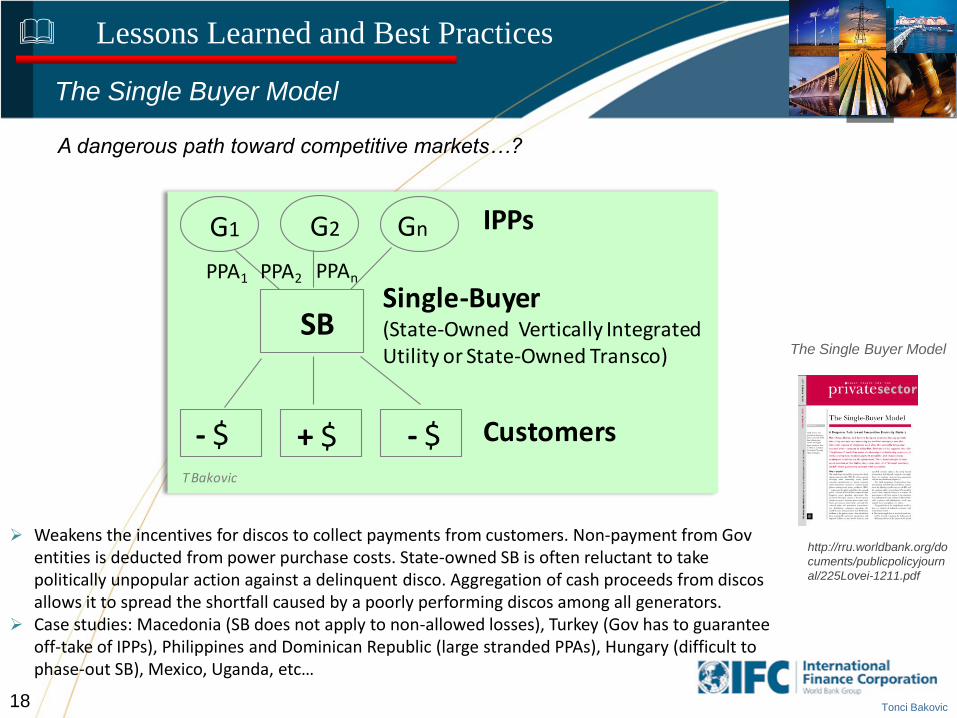
The Single Buyer Model
Lessons Learned and Best Practices
A dangerous path toward competitive markets…?
+ $- $ - $
SB
G1 G2 Gn
Single-Buyer(State-Owned Vertically Integrated Utility or State-Owned Transco)
IPPs
Customers
PPA1 PPA2 PPAn
T Bakovic
Weakens the incentives for discos to collect payments from customers. Non-payment from Gov entities is deducted from power purchase costs. State-owned SB is often reluctant to take politically unpopular action against a delinquent disco. Aggregation of cash proceeds from discos allows it to spread the shortfall caused by a poorly performing discos among all generators.
Case studies: Macedonia (SB does not apply to non-allowed losses), Turkey (Gov has to guarantee off-take of IPPs), Philippines and Dominican Republic (large stranded PPAs), Hungary (difficult to phase-out SB), Mexico, Uganda, etc…
http://rru.worldbank.org/do
cuments/publicpolicyjourn
al/225Lovei-1211.pdf
The Single Buyer Model
18

Tonci Bakovic 19
Source: Electricity Association Argentina + Edelap
Effect of Devaluation – Residential Tariffs US$/kWh
Effect of Devaluation – Industrial Tariffs US$/kWh
Lessons Learned and Best Practices
Argentina: Devaluation and No Indexation
- Argentina Post 2001

Tonci Bakovic 20
Where:
Dollar Price: Average price of the exchange rate for the US Dollar, for the last thirty days, published by the Central Bank.
DOL0 : Average Exchange rate for the US Dollar, published by the Central Bank (Chilean$/US$).
D1 : Custom Duty applicable to electro-mechanical equipment at the Iquique Extension Free Zone.
D10 : Current Custom Duty applicable to electro-mechanical equipment at the Iquique Extension Free Zone
ISS & IPM : Salary & Wholesale Prices indexes published by INE for the third month before the Indexation is calculated.
ISS0 & IPM0 : Base values for the ISS and the IPM
0.11*
IPM
IPM0.1*
ISS
ISS.790*
D1
D+1*
DOL
PriceDollar *Price BaseCapacity =Capacity Price
0010
1
0
Chile: Indexation, Indexation, Indexation
Capacity Node Price in Chilean Pesos (79% xrate & import duties, 10% salary index, 11% wholesale price index)
Where :
Dollar Price: Average price of the exchange rate for the US Dollar, for the last thirty days, published by the Central Bank.
DOL0 : Average Exchange rate for the US Dollar, published by the Central Bank (Chilean $/US$).
D2 : Custom Duty aplicable to electro-mechanical equipment in Antofagasta.
D20 : Current Custom Duty aplicable to electro-mechanical equipment in Antofagasta
PPDA : Price for Light Diesel in Antofagasta, (in $/m3).
PPDA0 : Current Price for Light Diesel in Antofagasta (in $/m3
PFOA : Price for Fuel Oil Nº6 in Antofagasta, ($/ton)
PFOA0 : Current price for Fuel Oil Nº6 in Antofagasta (en $/ton)
The fuel prices to be used in the indexatión formulas will be the purchase prices, net of IVA (sale tax).
0020
2
0 PFOA
PFOA*0.00
PPDA
PPDA*0.00.001*
D 1
D 1 *
DOL
PriceDollar *PriceEnergy Base=Energy Price
Energy Node Price in Chilean Pesos (100% indexed to import components: xrate + import duties)
Note: Wholesale Energy Prices get Adjusted Every 6 Months Based on Expected Spot Forecast for Next 48 Months
%10Price BaseCapacity
Price) BaseCapacity -Capacity (Price ifAdjust
Lessons Learned and Best Practices
%10PriceEnergy Base
Price)Energy Base -Energy (Price ifAdjust
Indexation Algorithm for Hydro
Devil is in the Details

Tonci Bakovic 21
DoDIB4
IPCuoIPCuIB3
IPMNoIPMN*OB2)(IB2
IPCoIPC*OB1)(IB1*CDBTo= CDBT
In which:
CDBT: Cost of Distribution in Low Voltage $Chilean/kW-month
D: Index of imported products where D= Tc * (1+Ta) where Tc corresponds to the average price of the exchange rate for the US Dollar, for
the month before the last, published by the Central Bank, and Ta corresponds to the custom duty applicable to electro mechanical
equiptment
IPC: Consumer Price Index published by INE for the third month before the month when the tariffs will be applied
IPMN: Wholesale Price Index published by INE for the third month before the month when the tariffs will be applied
IPCu: Copper Price Index calculated as the average monthly price for the last 12 months of the price of Copper in the London Mercantile
Exchange
IAi and OAi: Weights applied to each service area
CFE: Fixed Charges; billing and metering $Chilean/client-month
DoD*B*0.07
IPCuoIPCu*0.10
IPMNoIPMN*.430
IPCoIPC*.400*3.811=CDBT
Cost of Distribution (17% indexed to import components: xrate + import duties)
IPMNoIPMN*FE2
IPCoIPC*FE1*CFEo= CFE CC
Fixed Charges
IPMNoIPMN*.180
IPCoIPC*.820*371.25= CFE
Lessons Learned and Best Practices
In the past also indexed to salary index (IRH) published by INE (IRH and IPMN ~20% each in the CDBT, and 70% and 30% -respectively- in the CFE)
IRHo
IRH*OB5)(IB5. ......*CDBTo= CDBT
INE = National Statistics Institute
IRHo
IRH*FE2 IPMNo
IPMN*FE1*CFEo= CFE CC
Chile: Distribution Tariff Indexation
Devil is in the Details

Tonci Bakovic 22
Spot Prices, Seasonal Passthrough and Smoothing Scrow Account
Argentina‟s MEM 1999-2003
Lessons Learned and Best Practices
Argentina: Collapse of „Pass-Though‟ Mechanism
-40.00
-30.00
-20.00
-10.00
0.00
10.00
20.00
30.00
40.00
1999 2000 2001 2002 2003
Mo
no
mic
Sp
ot
Pri
ce (
$/M
Wh
)
-400.00
-300.00
-200.00
-100.00
0.00
100.00
200.00
300.00
400.00
Bala
nce S
mo
oth
ing
Fu
nd
($)
Seasonal Avg Spot Balance Smoothing Fund
Source: ADEERA
http://www.regulationbodyofknowledge.or
g/documents/001.pdf
Pass Through of Power
Purchase Costs
Is your passthrough
mechanism
sustainable…?

Tonci Bakovic 23
http://siteresources.worldbank.org/INTENE
RGY/Resources/335544-
1111615897422/EnergyWorkingNotes2.pdf
- What should be the new
asset-base at the end of
the regulatory period ?
Book Value
Replacement
Value
Market
Value
3,000 $/cust
1,000 $/cust
400 $/cust
Tonci Bakovic
Brazil: Percentage premium of market
value over minimum sale price
(distribution privatizations)
Lessons Learned and Best Practices
Brazil: Asset Revaluation (RAB)
Source: The Regulatory Challenge of Asset Valuation.
Vivien Foster and Pedro Antmann
RAB = Regulatory Asset Base
The Regulatory Challenge
of Asset Valuation

Tonci Bakovic 24
S1 S2 S4 S5
Disco
Regulated Customers Eligible Customers „Grey‟ Customers
SOLR
?
Lessons Learned and Best Practices
Romania: The Supplier of Last Resort
Exerting the Right to Choose
Generators
Suppliers
Tariffs Prices
SOLR = Supplier of Last Resort
will PPC be allowed a
full passthrough ?
what is the regulated
supply-margin?
can customers leave
and come back at any
time?
who is in charge for
stopping supply in
case of no payment?
PPC = Power Purchase Costs
Why me…?

Tonci Bakovic 25
Prior to privatization, the GOA entered into a Partial Risk Guarantee (PRG) Agreement with
IBRD in May 2009 for an amount of up to EUR 60 million ensuring that the regulatory
framework committed to in the pre-privatization phase will be preserved and not changed
unilaterally following the privatization
The PRG backstops the Government‟s debt obligation to a commercial bank (Citibank) who
issued the Letter of Credit (LC) that may be drawn by OSSH to compensate for a resulting loss
of revenue upon a non-compliance by ERE or the Government relating to the distribution tariff
formula, the full pass-through of the electricity costs and the timely approval of the tariffs
The PRG covers the first three regulatory periods until the end of 2014
Following any LC drawings, the Ministry of Finance is obligated to pay the withdrawn amount
to IBRD within 12-18 months
The PRG recognizes the compensation mechanism and the option of the Government to limit
the tariff increase at 15% (in real terms) and therefore as long as the tariff increase is at 15% +
inflation (if required), the LC cannot be withdrawn
• If the event is not remedied within
review/cure periods in the Government
Support Agreement (GSA), OSSH is
entitled to draw under the LC and the LC
amount is reduced by the amount of
drawing
• If this is disputed by the Government, the
claim will be referred to international
arbitration and in the mean time OSSH can
continue to draw provisional payments by
posting security in favor of the Government
Lessons Learned and Best Practices
Albania: Partial Risk Guarantee (PRG)
Source: World Bank
www-
wds.worldbank.org/.../280900
Mitigatingrisk0EMS0no.05.pdf
The World Bank Partial
Risk Guarantee

Tonci Bakovic
26
Lessons Learned and Best Practices
Turkey‟s Transfer of Operating Rights (TOR scheme)
Source: TEDAS
Tonci Bakovic 27
8%8%
7%3%
2.5%
T BakovicT Bakovic
9.25
0.390.86 0.88
0.09 0.32 0.00 0.210.00
1.00
2.00
3.00
4.00
5.00
6.00
7.00
8.00
9.00
PROCUREMENT
PRICE
TRANSMISSION RETAIL SERVICE
AND O&M COSTS
LOSSES RETURN ON ASSET DEPRECIATION TOR* SUPPLY MARGIN
US cents/KWh
Distribution and Retail Business
77.1% 2.7% 0%7.3% 1.7%3.2% 0.8%7.2%
Tonci Bakovic
Lessons Learned and Best Practices
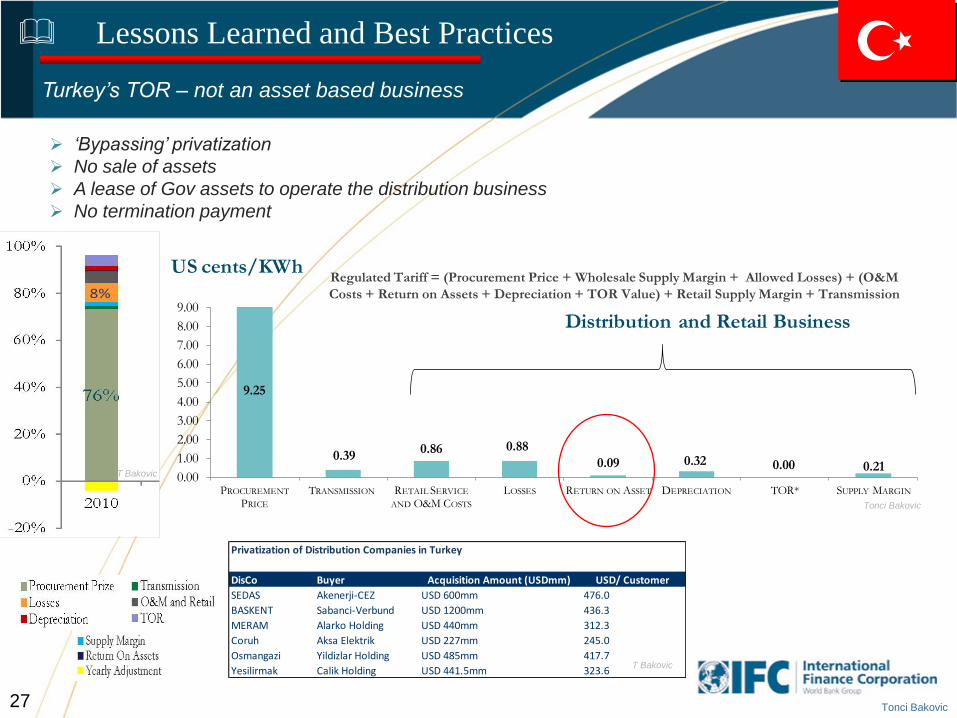
Turkey‟s TOR – not an asset based business
„Bypassing‟ privatization
No sale of assets
A lease of Gov assets to operate the distribution business
No termination payment
Privatization of Distribution Companies in Turkey
1000
DisCo Buyer Acquisition Amount (USDmm) USD/ Customer
SEDAS Akenerji-CEZ USD 600mm 476.0
BASKENT Sabanci-Verbund USD 1200mm 436.3
MERAM Alarko Holding USD 440mm 312.3
Coruh Aksa Elektrik USD 227mm 245.0
Osmangazi Yildizlar Holding USD 485mm 417.7
Yesilirmak Calik Holding USD 441.5mm 323.6T Bakovic
Regulated Tariff = (Procurement Price + Wholesale Supply Margin + Allowed Losses) + (O&M
Costs + Return on Assets + Depreciation + TOR Value) + Retail Supply Margin + Transmission

Tonci Bakovic
28
India‟s Franchise Model
Green = Private
Black = Public
Hybrid Single Buyer Model and Power Exchange
Gov supports the creation of private power exchanges mainly to encourage captive generation
(cogen) to inject into the grid
Companies must prepay 2-days before transacting on exchange
Distribution “franchising” model gets implemented by some states given difficulties implementing
privatization
Lessons Learned and Best Practices
IPP1
Industry
State1
IPP2
IPPn
IPP3
State2
Staten
PTC
IEX
PXI
Private Power Exchanges(~2% of transactions)
(Pre-Pay Before Trade)
Single Buyer Mega Projects(Guarantees Off-Take)
Industry
Staten
Private Bilateral Contract
Traders
T Bakovic
Cogen
D1
D2
2 Discos Private(others franchising some localities)
Private Bilateral Cont.
“Franchise” Model:Locality/Region operation, within State distribution concession, awarded to private operators based on loss reduction and collection improvement targets.
38% of Consumption
Private Industry
Fed Gencos
State Gencos

Tonci Bakovic 29
Establish a fair mechanism to set-up the limits and a ‘smoothing mechanism’ of the power
purchase costs (pass-through)
Length of concession should be at least 30 years
In case of intervention or concession lapse, a clear ‘asset-transfer-mechanism’ must be established
indicating how the ‘terminal value’ of the concession will be determined
Establish clear and measurable quality standards in the concession and/or regulations and the
corresponding penalty levels
Obtain a technical audit of the starting distribution losses and agree on a realistic loss reduction
program for –at least- the first two regulatory periods. Audited losses should be disclosed at the
data-room before privatization
Clearly indicate and obtain regulatory approval for the investment program for the first regulatory
period
Clearly indicate the upper limit of the efficiency factor X -in at least the initial two regulatory
periods
Obtain an audit of the starting ‘accounts receivable’ of the disco and clearly indicate how much of
those receivables are ‘bad debt’. Audited bad-debt should be disclosed at the data-room before
privatization.
Clearly indicate who will have the responsibility to be SOLR and how ‘grey customers’ will be
treated
Avoid an intermediate ‘single-buyer’-between Generation and Distribution
Do not leave anything for approval post-privatization
– discount from purchase value information not provided at time of sale
Lessons Learned and Best Practices
Wish list…

Tonci Bakovic 30
The Regulatory Challenge of Asset Valuation: A Case Study from the Brazilian Electricity Distribution Sector
(Vivien Foster and Pedro Antmann)
Pass Through of Power Purchase Costs. Regulatory Challenges and International Practices (Beatriz Arizu,
Luiz Maurer, and Bernard Tenenbaum)
Mitigating Regulatory Risk for Distribution Privatization – The World Bank Partial Risk Guarantee (Pankaj
Gupta, Ranjit Lamech, Farida Mazhar, Joseph Wright)
The Single-Buyer Model: A Dangerous Path toward Competitive Electricity Markets (Laszlo Lovei)
The Regulation of Investment in Utilities Concepts and Applications (Ian Alexander, Clive Harris)
Regulation by Contract: A New Way to Privatize Electricity Distribution? (Tonci Bakovic, Bernard
Tenenbaum and Fiona Woolf)
Recommended Reading
World Bank Group – Two Decades of Regulatory Lessons