
Attosecond Transient Absorption Spectroscopy of Atoms and ...
168
University of Central Florida University of Central Florida STARS STARS Electronic Theses and Dissertations, 2004-2019 2015 Attosecond Transient Absorption Spectroscopy of Atoms and Attosecond Transient Absorption Spectroscopy of Atoms and Molecules Molecules Yan Cheng University of Central Florida Part of the Atomic, Molecular and Optical Physics Commons Find similar works at: https://stars.library.ucf.edu/etd University of Central Florida Libraries http://library.ucf.edu This Doctoral Dissertation (Open Access) is brought to you for free and open access by STARS. It has been accepted for inclusion in Electronic Theses and Dissertations, 2004-2019 by an authorized administrator of STARS. For more information, please contact [email protected]. STARS Citation STARS Citation Cheng, Yan, "Attosecond Transient Absorption Spectroscopy of Atoms and Molecules" (2015). Electronic Theses and Dissertations, 2004-2019. 5151. https://stars.library.ucf.edu/etd/5151
Transcript of Attosecond Transient Absorption Spectroscopy of Atoms and ...

University of Central Florida University of Central Florida
STARS STARS
Electronic Theses and Dissertations, 2004-2019
2015
Attosecond Transient Absorption Spectroscopy of Atoms and Attosecond Transient Absorption Spectroscopy of Atoms and
Molecules Molecules
Yan Cheng University of Central Florida
Part of the Atomic, Molecular and Optical Physics Commons
Find similar works at: https://stars.library.ucf.edu/etd
University of Central Florida Libraries http://library.ucf.edu
This Doctoral Dissertation (Open Access) is brought to you for free and open access by STARS. It has been accepted
for inclusion in Electronic Theses and Dissertations, 2004-2019 by an authorized administrator of STARS. For more
information, please contact [email protected].
STARS Citation STARS Citation Cheng, Yan, "Attosecond Transient Absorption Spectroscopy of Atoms and Molecules" (2015). Electronic Theses and Dissertations, 2004-2019. 5151. https://stars.library.ucf.edu/etd/5151

ATTOSECOND TRANSIENT ABSORPTION SPECTROSCOPY
OF ATOMS AND MOLECULES
by
YAN CHENG
M.S., Kansas State University, 2011
B.S., University of Science and Technology of China, 2009
A dissertation submitted in partial fulfillment of the requirements
for the degree of Doctor of Philosophy
in the Department of Physics
in the College of Sciences
at the University of Central Florida
Orlando, Florida
Fall Term
2015
Major Professor: Zenghu Chang

ii
ABSTRACT
One of the most fundamental goals of attosecond science is to observe and to control the
dynamic evolutions of electrons in matter. The attosecond transient absorption spectroscopy is a
powerful tool to utilize attosecond pulse to measure electron dynamics in quantum systems
directly. In this work, isolated single attosecond pulses are used to probe electron dynamics in
atoms and to study dynamics in hydrogen molecules using the attosecond transient absorption
spectroscopy technique. The target atom/molecule is first pumped to excited states and then
probed by a subsequent attosecond extreme ultraviolet (XUV) pulse or by a near infrared (NIR)
laser pulse. By measuring the absorbed attosecond XUV pulse spectrum, the ultrafast electron
correlation dynamics can be studied in real time. The quantum processes that can be studied
using the attosecond transient absorption spectroscopy include the AC stark shift, multi-photon
absorption, intermediate states of atoms, autoionizing states, and transitions of vibrational states
in molecules. In all experiments, the absorption changes as a function of the time delay between
the attosecond XUV probe pulse and the dressing NIR laser pulse, on a time scale of sub-cycle
laser period, which reveals attosecond electron dynamics. These experiments demonstrate that
the attosecond transient absorption spectroscopy can be performed to study and control
electronic and nuclear dynamics in quantum systems with high temporal and spectral resolution,
and it opens door for the study of electron dynamics in large molecules and other more complex
systems.

iii
ACKNOWLEDGMENTS
Today is October 4th , 2015, Sunday. The sunshine in Florida is beautiful, with the blue
sky. Not too many people are around in the Physical Science building on a Sunday morning, and
it is a good time to think about my stories since I came to the U.S. in 2009. Although I don’t
know where I will be landing after thirty or fifty years, I will never forget the wonderful people I
have been working and staying with during the past six years, and they will be what really
matters to me.
First I would like to thank my adviser and mentor Dr. Zenghu Chang who has been
giving me enormous guidance, encouragement and help. Dr. Chang is extremely knowledgeable
and has taught me how to conduct research effectively. Dr. Chang comes to the lab every day to
discuss the experimental results and progress with us, and provides prompt feedback and
suggestions. In addition, our weekly group meetings have provided me with great opportunities
to discuss the experiments in depth with him and other colleagues, as well as enabled me to
practice my presentation skill. Dr. Chang is also an excellent model for how to manage a
research team and research projects.
The attosecond transient absorption experiments were mainly performed together with
Dr. Michael Chini, Dr. He Wang and Dr. Xiaowei Wang. Dr. Chini taught me most of the
experimental details of the attosecond transient absorption experiments, I learned a lot from him.
In my heart Dr. Chini is my second mentor during the past six years. Dr. He Wang was the one
who first introduced me to attosecond science, and has provided me numerous help in my
research projects and in life. Dr. Xiaowei Wang helped me a lot with programming, Zemax and
Solidworks. Dr. Chini, Dr. Xiaowei Wang and I spent many days and late nights in the lab to
perform experiments. In addition, the theoretical simulations were contributed from Dr.

iv
Fernando Martín, Dr. Alberto González-Castrillo, .Dr. Alicia Palacios, Dr. Luca Argenti, Dr.
Xiao-Min Tong, Dr. Di Zhao, Dr. Dmitry Telnov, Dr. Peng-Cheng Li, Dr. John Heslar, Dr. Shih-
I Chu, Dr. Feng He, Dr. Chang-Huang Zhang, Dr. Uwe Thumm, Dr. Suxing Hu.
I had the fortune to work with many excellent researchers in our research group. I would
like to thank Dr. Kun Zhao who answered many of my questions, Dr. Sabih Kan and Max
Moller, who worked with me on the 400 nm laser driven high harmonic ellipticity dependence
experiment, Dr. Yi Wu, Eric Cunningham and Dr. Baozhen Zhao, who gave me tremendous help
with lasers. I would like to acknowledge Dr. Qi Zhang, Dr. Shouyuan Chen, Dr. Yanchun Yin,
Dr. Xiaoming Ren, Yang Wang, Jie Li, Andrew Chew, Julius Biedermann, Dr. Jianhua Zeng, Dr.
Xianglin Wang, Peng Xu, Dr. Huaping Zang, who helped me massively in both the lab and my
everyday life. In addition, I would like to thank my committee members Dr. Lee Chow, Dr.
Haripada Saha and Dr. Eric W. Van Stryland.
Finally I would like acknowledge my parents and my wife, Dehui. This work could not
have been done without their help, support, understanding and encouragement. Ever since high
school, I have been living in schools and I do not see my parents often. I call them every other
few days to share with them my life, my happiness and my sadness. Time goes by quickly and
they are no long as young as they used to be. Although they may never understand the English I
wrote here, I want to let them know how much I love them. My wife Dehui has been with me
since my undergraduate years, we share each other’s happiness and fight difficult times together.
I cannot thank her enough for her support and confidence on me since I know sometimes how
difficult it can be for her. There might be many more difficulties in the future, together we can do
it!

v
This material is based upon work supported by the National Science Foundation,
Department of Energy, Army Research Office, Air Force Office of Scientific Research, and the
DARPA PULSE program by a grant from AMRDEC.

vi
TABLE OF CONTENTS
LIST OF FIGURES ..................................................................................................................... viii
LIST OF TABLES ...................................................................................................................... xvii
CHAPTER 1 - INTRODUCTION .................................................................................................. 1
1.1 Principle of High Harmonic Generation (HHG) ................................................................... 2
1.2 The Laser System .................................................................................................................. 5
1.3 Few-cycle Femtosecond Pulses ............................................................................................ 7
1.4 Isolated Attosecond Pulse ..................................................................................................... 8
1.4.1 Polarization Gating ........................................................................................................ 9
1.4.2 Double Optical Gating ................................................................................................. 11
CHAPTER 2 - ATTOSECOND TRANSIENT ABSORPTION SPECTROSCOPY................... 15
2.1 The Attosecond Transient Absorption Experimental Setup ............................................... 16
2.2 Theory of Attosecond Transient Absorption Spectroscopy ................................................ 28
CHAPTER 3 - SUB-CYCLE ELECTRON DYNAMICS IN HELIUM AND NEON ATOMS . 32
3.1 Sub-cycle Electron Dynamics in Helium ............................................................................ 32
3.2 Sub-cycle Electron Dynamics and Quantum Interferences of Attosecond Transient
Absorption of Neon Atoms ....................................................................................................... 48
CHAPTER 4 - ATTOSECOND TIME-RESOLVED AUTOIONIZATION OF ARGON AND
KRYPTON ATOMS ............................................................................................................. 58
4.1 Attosecond time resolved autoionization of argon ............................................................. 58
4.2 Quantum Beats in Attosecond Transient Absorption of Krypton Autoionizing States ...... 67
CHAPTER 5 - COHERENT PHASE-MATCHED VUV GENERATION BY BELOW
THRESHOLD HARMONIC GENERATION ...................................................................... 78
5.1 Below Threshold Harmonic Generation ............................................................................. 79
5.2 Coherent VUV Emission .................................................................................................... 83
5.3 Phase Matching Mechanisms .............................................................................................. 87
CHAPTER 6 - ATTOSECOND TRANSIENT ABSORPTION SPECTROSCOPY IN
HYDROGEN MOLECULES ................................................................................................ 95
6.1 Excited Vibrational States of Molecular Hydrogen ............................................................ 96
6.2 Simultaneous Observation of Electron and Nuclear Dynamics in Hydrogen Molecules ... 98

vii
6.3 Theoretical Simulation of Attosecond Transient Absorption Spectroscopy of Molecular
Hydrogen ................................................................................................................................ 102
6.4 Quantum Control in Attosecond Spectroscopy ................................................................ 116
CHAPTER 7 - FINAL REMARKS ............................................................................................ 118
APPENDIX A: LIST OF PUBLICATIONS .............................................................................. 120
Peer-Reviewed Journal Publications ...................................................................................... 121
Invited Book Chapters ............................................................................................................ 123
Invited talks ............................................................................................................................. 124
Selected Conference Presentations ......................................................................................... 125
APPENDIX B: COPYRIGHT PERMISSIONS ......................................................................... 126
LIST OF REFERENCES ............................................................................................................ 136
viii
LIST OF FIGURES
Figure 1-1 The three step model for high harmonic generation. Adapted from [2] ....................... 3
Figure 1-2 Layout of the FAST laser system .................................................................................. 6
Figure 1-3 The FAST laser amplified pulse spectrum .................................................................... 7
Figure 1-4 FROG retrieval of a 4 fs pulse from the FAST laser system and the hollow core fiber
compressor .............................................................................................................................. 8
Figure 1-5 The ellipticity dependence of high harmonic generation yield. Adapted from [20] ..... 9
Figure 1-6 Polarization gating scheme. Adapted from [22]. ........................................................ 10
Figure 1-7 Optical components for polarization gating. Adapted from [23]. ............................... 11
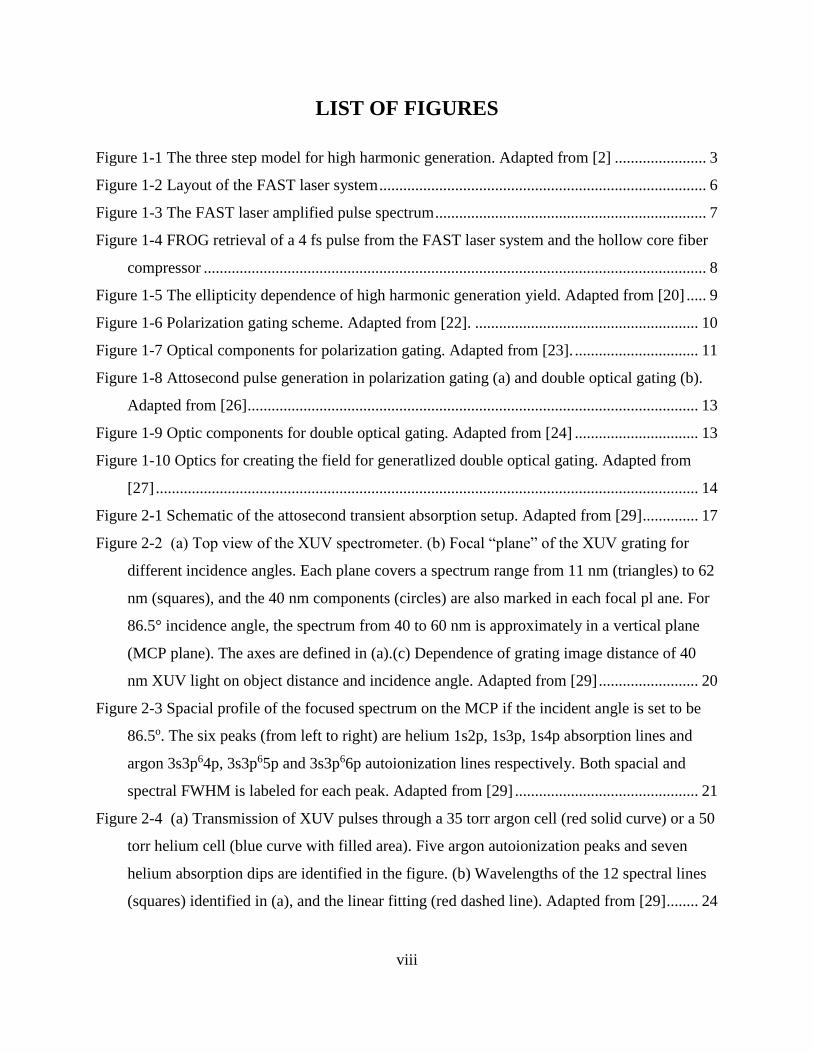
Figure 1-8 Attosecond pulse generation in polarization gating (a) and double optical gating (b).
Adapted from [26] ................................................................................................................. 13
Figure 1-9 Optic components for double optical gating. Adapted from [24] ............................... 13
Figure 1-10 Optics for creating the field for generatlized double optical gating. Adapted from
[27] ........................................................................................................................................ 14
Figure 2-1 Schematic of the attosecond transient absorption setup. Adapted from [29] .............. 17
Figure 2-2 (a) Top view of the XUV spectrometer. (b) Focal “plane” of the XUV grating for
different incidence angles. Each plane covers a spectrum range from 11 nm (triangles) to 62
nm (squares), and the 40 nm components (circles) are also marked in each focal pl ane. For
86.5° incidence angle, the spectrum from 40 to 60 nm is approximately in a vertical plane
(MCP plane). The axes are defined in (a).(c) Dependence of grating image distance of 40
nm XUV light on object distance and incidence angle. Adapted from [29] ......................... 20
Figure 2-3 Spacial profile of the focused spectrum on the MCP if the incident angle is set to be
86.5o. The six peaks (from left to right) are helium 1s2p, 1s3p, 1s4p absorption lines and
argon 3s3p64p, 3s3p65p and 3s3p66p autoionization lines respectively. Both spacial and
spectral FWHM is labeled for each peak. Adapted from [29] .............................................. 21
Figure 2-4 (a) Transmission of XUV pulses through a 35 torr argon cell (red solid curve) or a 50
torr helium cell (blue curve with filled area). Five argon autoionization peaks and seven
helium absorption dips are identified in the figure. (b) Wavelengths of the 12 spectral lines
(squares) identified in (a), and the linear fitting (red dashed line). Adapted from [29] ........ 24

ix
Figure 2-5 Comparison between measured absorption cross section (dots) and argon
autoionization Fano profile convoluted by a Gaussian function with FWHM of 60 meV
(solid curve). Adapted from [29] .......................................................................................... 26
Figure 2-6 Image of the electron distribution of a single microchannel pore, with corresponding
lineouts (symbols) along the x (dispersion) and y (position) axes. Gaussian fits (solid curve)
to the measured distribution give FWHM resolution of 131 μm and 151 μm along the x and
y axes, respectively. The error comes from the Gaussian fit. Adapted from [29] ................ 27
Figure 3-1 (a), Schematic of experimental setup for attosecond transient absorption. (b), Helium
1snp energy level diagram showing schematic XUV spectrum and states accessible for
excitation by the attosecond pulse. (c), Measured absorbance spectrum as a function of the
dressing laser intensity when the attosecond XUV pulse overlaps in time with the peak of
the NIR laser pulse. The dotted lines trace the Stark-shifted absorption lines. At an intensity
of ~2.5×10¹² W/cm2, several new absorption features appear in the vicinity of the 1s2p state,
which dynamically evolve as the laser intensity is increased. Adapted from [48]. .............. 34
Figure 3-2 Two-color multi-photon absorption in time-resolved absorption. The absorption in the
vicinity of the 1s2p state at lower dressing laser intensities of a, 7×10¹¹ W/cm2 and b,
5×10¹² W/cm2 allow for experimental identification of the virtual states appearing in the
laser-dressed absorption. Adapted from [48]. ....................................................................... 37
Figure 3-3 (a), Schematic diagram of two-color two- and three-photon absorption pathways to
the 1s3d (green), 1s4s (blue), and 1snp (red) excited states. The solid arrow indicates the
single-photon excitation of the 1s2p and 1snp (red) states, whereas the dotted arrows
indicate XUV absorption via two-color multi-photon excitation to 1snp states with n ≥ 6.
Dashed lines indicate absorption lines corresponding to laser-induced virtual states. (b),
Normalized photoabsorption cross-sections based on TDSE simulation of helium when the
attosecond XUV pulse overlaps in time with the peak of the NIR laser field. By removing
the 1s2s and 1s4s states (blue) or 1s3s and 1s3d states (green) from the calculation, we can
confirm that the additional absorption lines are due to multi-photon excitation to those
excited states. Adapted from [48]. ........................................................................................ 38
Figure 3-4 a, Time-delay-dependent absorbance spectrum with a dressing laser intensity of 1013
W/cm2. With the strong dressing laser field, quantum-optical interferences can be observed
in the absorption at negative delays. Near zero delay, the attosecond and NIR laser pulses

x
overlap, and the absorption is dominated by the sub-cycle AC Stark and ponderomotive
energy level shifts. b, Absorbance lineouts in the vicinity of the transient virtual states. The
absorbance (data points) was obtained by integrating the signal in the vicinity (±50 meV) of
the virtual intermediate states, and the error bars indicate the standard deviation of the
absorbance in that region. The solid lines serve to guide the eye. While the absorbance near
the 3s-, 3d-, 2s+, and 4s- virtual states oscillates with half-cycle periodicities, the absorbance
near the np2- absorption feature oscillates with a quarter-cycle periodicity. Adapted from
[48]. ....................................................................................................................................... 40
Figure 3-5 Simulated time-delay-dependent absorbance spectrum with a dressing laser intensity
of 1013 W/cm2. The spectrogram can be divided into two regions to separate the effects of
quantum-optical interferences and sub-cycle energy level dynamics. Adapted from [48]. .. 41
Figure 3-6 (a)Fourier transform analysis of region b in Figure 3-5, which spans -40 fs < D <-20
fs. The FT spectrogram obtained from the experimental data is shown in the left panel,
while the right panel shows that obtained from the simulated data. The dashed 45-degree
lines indicate the two-path quantum-optical interference. (b), Fourier transform analysis of
region c, which spans -13 fs < D < 7 fs. Half- and quarter-cycle oscillations are evident
above and below the ionization potential, and the oscillation frequency no longer follows
the 45-degree lines associated with the two-path interference. Adapted from [48]. ............ 42
Figure 3-7 Interference in the delay-dependent absorption near 19.68 eV with a dressing laser
frequency 𝝎𝑳 =1.7 eV. The full calculation in (a) includes the contributions from 16 bound
states, and the half-cycle interference oscillations are indicated by the yellow box. In (b), the
calculation has been repeated after removing the 1s2p, 1s4p, 1s5p, 1s6p, and 1s7p states.
The presence of the interference oscillation near 19.68 eV suggests that it does not result
from quantum “which-way” interference, as no “direct” pathway is possible. In (c) the
power spectrum 𝑷𝝎𝟐of the atomic dipole radiation is plotted for the same conditions as in
(a), with all states included. The lack of the interference oscillations indicates an optical
interference mechanism, as explained in the text. ................................................................ 44
Figure 3-8 Comparison of “which-way” and optical interference models. (a) In the “which-way”
interference, the final state can be excited both by the attosecond pulse alone (“direct”) and
by the combined attosecond and NIR laser fields (“indirect”). Each of these excitation

xi
pathways induces a time-dependent dipole, 𝑷𝒅𝒊𝒓(𝝎𝟐) and 𝑷𝒊𝒏𝒅(𝝎𝟐) respectively, which
both oscillate with the frequency 𝝎𝟐 = 𝑬𝒇 − 𝑬𝟎. Depending on the delay, these two
components may add up constructively or destructively, leading to a modulation of the
measured signal. (b) In the optical interference, there is no state with energy 𝑬𝒇, and
therefore the component of the attosecond spectrum (pale blue shaded) with frequency 𝝎𝟐
does not induce dipole emission on its own. When the NIR laser is present, the state with
energy 𝑬𝒊 forms sidebands resulting in the emission with frequency 𝝎𝟐. This laser-induced
dipole radiation (“emitted”) will interfere with the “transmitted” components of the
attosecond spectrum with frequency 𝝎𝟐, leading to a delay-dependent modulation in the
measured signal. Blue arrows indicate atomic transitions initiated by the attosecond pulse
(with spectrum indicated by the pale blue shaded area), while red arrows indicate transitions
resulting from the NIR pulse. Magenta sinusoidal arrows indicate the dipole emission with
frequency 𝝎𝟐, while the pale blue sinusoidal arrow indicates the transmitted component of
the attosecond spectrum. ....................................................................................................... 47
Figure 3-9 Measured absorption cross section of neon atoms (black curve with gray filled area)
and atomic energy levels of interest. The electron configurations are marked for each
identified. Adapted from [63] ............................................................................................... 49
Figure 3-10 Measured delay-dependent absorbance spectra with a dressing laser intensity of (a)
~10 TW/cm2 and (b) ~75 TW/cm2 (b). Panels (c) and (d) show the calculated absorption
cross sections for dressing laser pulses 4 fs in duration and with the same intensities as in
panels (a) and (b). Adapted from [63]................................................................................... 51
Figure 3-11 Diagram of direct and indirect pathways resulting in quantum interferences in the (a)
3s and (b) 4p+ absorption lines. Energy levels indicated by black lines are accessible by one
XUV photon absorption, while gray levels are forbidden by selection rules. Dashed gray
energy levels in (b) indicate Floquet-like sidebands of the 4p energy level. Adapted from
[63] ........................................................................................................................................ 53
Figure 3-12 Measured absorption cross sections in the vicinity of the 3s (black) and 4p+ (gray)
absorption lines. The dots indicate the experimentally obtained data points, whereas the
solid lines are smoothed to show the major features. Whereas half-cycle (~1.3 fs)
oscillations can be observed in the 3s absorption lines extending to large negative delays,

xii
oscillations in the 4p+ absorption can only be observed for delays between 0 and -7 fs.
Adapted from [63] ................................................................................................................. 55
Figure 3-13 Measeaured (a) and calculated (b) delay-dependent absorbance spectrum with
isolated attosecond pulses filtered by indium filter which allows transmission of XUV
pulses within the spectrum range from 11 eV to 17 eV. Autler-Town splitting instead of
quantum interference was observed. Adapted from [63] ...................................................... 56
Figure 4-1 Energy diagram of the 3s3p6np 1P autoionizing states in argon. The continuum
spectrum of the attosecond pulse covers the 1P series of states. Adapted from [5]. ............. 60
Figure 4-2 Transmitted XUV spectrum indicating argon 3s3p6np 1P autoionizing states. The
spectrometer resolution was 50 meV. Adapted from [5]. ..................................................... 61
Figure 4-3 Transmitted attosecond XUV spectra of argon in a strong NIR laser field with a peak
intensity of (a) 5×10¹¹ W/cm2 and (b) 1012 W/cm2. Negative delays correspond to the
attosecond pulse arriving on the target before the NIR laser pulse. The resonance peaks are
shifted, broadened, and weakened when the two pulses overlap. (c), (d) Transmitted signal
(solid) near the 3s3p64p and 3s3p65p states for 5×10¹¹ W/cm2 and 1012 W/cm2, respectively,
and calculated exponential decay convoluted with 4.5 fs Gaussian for best fit (dashed).
Adapted from [5]. .................................................................................................................. 63
Figure 4-4 (a) Schematic representation of argon autoionizing states exposed to the strong NIR
laser field. The blue arrows indicate the attosecond XUV excitation of the ground state to
the 3s3p6np 1P states as well as to the Ar+ (3s23p5εl) continuum. The red arrows indicate the
NIR laser coupling between the autoionizing states and the Ar*+ (3s3p6εl) continuum or to
3s3p6nl autoionizing states. The configuration interaction (green arrows) couples all
autoionizing states to the Ar+ continuum. (b) Autoionization decay modified by NIR laser-
induced coupling to the Ar*+ (3s3p6εl) continuum. Ionization by the NIR field truncates the
autoionization decay, resulting in a shorter lifetime and a broader, shifted resonance peak.
(c) Autoionization decay modified by NIR laser-induced coupling to 3s3p6nl autoionizing
states. Rabi oscillation between the two states results in AC Stark-like splitting. Adapted
from [5]. ................................................................................................................................ 64
Figure 4-5 Simulated dipole radiation spectrum of laser-induced coupling of the 3s3p64p and
3s3p64d autoionizing states. The XUV laser had a pulse duration of 140 as and intensity of

xiii
1010 W/cm2. The NIR laser had a pulse duration of 8 fs and intensity of (a) 5×10¹¹ W/cm2
and (b) 1012 W/cm2. Adapted from [5]. ............................................................................... 66
Figure 4-6 Quantum beats in the delay-dependent absorption near the 1s2p excited state with a
reduced excited state basis set consisting of the 1s2p, 1s3s, 1s5p, and 1s6p states. Relatively
slow oscillations are present on the high-energy side of the 1s2p absorption line in (a) with
periodicity equal to that of the quantum beating of the 1s5p and 1s6p state (white curve).
The integrated absorbance from 21.25 to 21.28 eV in (b) clearly shows the quantum beat
effect with a periodicity of 25.83 fs. Adapted from [77]. ..................................................... 68
Figure 4-7 Fourier transform analysis of the quantum beats in the vicinity of the 1s2p excited
state. (a) For the reduced basis set, the dominant quantum beat arises from the 1s5p and
1s6p states. (b) When the full 16-state basis set is used, additional beat frequencies
corresponding to each of the 1snp energy level differences ∆𝐄𝐧′𝐩, 𝐧𝐩 = 𝐄𝐧′𝐩 − 𝐄𝐧𝐩
can be observed. Adapted from [77]. .................................................................................... 69
Figure 4-8 The atomic absorption cross section of krypton vs wavelength. Adapted from [78] . 70
Figure 4-9 The attosecond pulse spectrum with a 200 nm thick indium filter. ............................ 71
Figure 4-10 The measured transmitted attosecond VUV spectra of krypton as a function of the
time delay between the isolated attosecond pulse and a NIR pulse with a peak intensity of
5x10¹² W/cm2. Adapted from [79]. ....................................................................................... 73
Figure 4-11 The measured transmitted attosecond VUV spectra of krypton as a function of the
time delay between the isolated attosecond pulse and a NIR pulse in the energy range of 14
– 15 eV with a peak intensity of 5 × 10¹² W/cm2. Adapted from [79]. ............................ 74
Figure 4-12 the Fourier transform analysis of the measured time dependent transmitted
attosecond VUV spectra of krypton ...................................................................................... 75
Figure 4-13 The simplified model calculation that includes the ground state, the 5p and 7d state
and three autoionizing states. ................................................................................................ 76
Figure 4-14 The calculated transmitted attosecond VUV spectra of krypton as a function of the
time delay between the isolated attosecond pulse and a NIR pulse in the energy range of 14
– 15 eV .................................................................................................................................. 77
Figure 5-1 Measured harmonic spectrum with an intensity of (3.3±0.3)×1013 W/cm2 and a target
pressure-length product of 10 torr-mm. The spectrum is characterized by coherent line
emissions (e.g.; RESs A and B) consistent with the labelled 3p63p5ns and 3p5nd

xiv
resonances of argon (indicated by vertical white lines) in addition to the broadband high
harmonics (e.g.; the 11th harmonic, H11). Adapted from [95]. ............................................ 80
Figure 5-2 Evolution of the resonance-enhanced structures with driving laser intensity. At low
intensities (top), the resonance-enhanced structures dominate the spectrum, whereas the
harmonics dominate at higher intensities (bottom). Adapted from [95]. .............................. 82
Figure 5-3 Argon and neon exhibit resonance-enhanced structures in the below-threshold
harmonics generation, whereas the harmonics generated in xenon are structureless above the
ionization threshold. Bound state resonances within the photon energy ranges of interest are
indicated. Adapted from [95]. ............................................................................................... 83
Figure 5-4 a, Both the RESs (here, A and B) and the above-threshold harmonics exhibit narrow
divergence angles of ~3 mrad FWHM, indicating laser-like spatial coherence of the VUV
line emission. b, The efficiency of the coherent line emission depends strongly on the
ellipticity of the driving laser, and indicates a sub-cycle generation mechanism. The
ellipticity dependence is much stronger than that expected from recollision (blue solid line),
but is consistent with harmonic generation during tunneling. Adapted from [95]. .............. 85
Figure 5-5 The RESs exhibit a strong dependence on the carrier-envelope phase when the VUV
generation is confined to a single half-cycle of the driving laser. Adapted from [95]. ........ 86
Figure 5-6 The intensity of the RESs located at 14.05 eV (top), 14.80 eV (middle) and 15.30 eV
(bottom) exhibits a 2π periodicity under the DOG, whereas much smaller changes are
observed with the CEP for linearly polarized 5 fs pulses. Adapted from [95]. .................... 87
Figure 5-7 a, The coherent VUV emission in the vicinity of the RESs scales quadratically with
the target gas pressure-length product, indicating perfect phase-matching. The 11th harmonic
(H11) scales quadratically up to a pressure-length product of only ~20 torr-mm, due to the
strong absorption cross-section of the neutral gas for photon energies just above the
ionization threshold. Calibrated energy measurements of the RESs are indicated by open
gray stars. b, Numerical simulation of the VUV emission in argon indicates that the phase-
matching process results in spectrally narrow, energy-shifted RESs when compared with the
single-atom emission. The shift of the phase-matched RESs relative to the bound state
energies is indicated in the inset. Adapted from [95]. .......................................................... 89
Figure 5-8 Argon exhibits regions of anomalous dispersion (gray shading) in the vicinity of the
atomic resonances, just above the resonance energies. Adapted from [95]. ......................... 92

xv
Figure 5-9 Since the amount of negative dispersion increases with the pressure, the phase-
matched photon energy moves away from the resonance energy, and the RESs tend to shift
to higher energy with increasing pressure. The dashed red lines represent a cubic spline fit
of the most prominent RES peak energies. Adapted from [95]. ........................................... 93
Figure 5-10 As the target pressure increases, the phase-matching occurs at higher energies and
the RESs are observed to shift in energy. Adapted from [95]. ............................................. 94
Figure 6-1 Attosecond absorption in neutral hydrogen molecules. a, the bound state manifold.
The electronic and nuclear dynamics are encoded in the transient changes of the absorption
lines with state selectivity. b, Absorption lines corresponding to the B 1Σu+X 1Σg
+ , C
1ΠuX, and D 1ΠuX bands of neutral hydrogen molecules can be observed in the
attosecond spectrum. c, The spectral range of the attosecond VUV pulse was selected by
using an indium foil filter ..................................................................................................... 98
Figure 6-2 Experimentally measured time delay-dependent absorbance spectrum of hydrogen
molecules. In the 𝑩𝟏𝜮𝒖 state, absorption lines show fast oscillations with half the laser
cycle period, while absorption line splitting and shifting are observed in 𝑪𝟏𝜫𝒖 and 𝑫𝟏𝜫𝒖
states, such features are attributed to electronic dynamics. These features revive as slow
variations on the time scale of nuclear vibration. By performing the attosecond transient
absorption experiment in hydrogen molecules, both the electronic and nuclear dynamics can
be observed simultaneously. ............................................................................................... 100
Figure 6-3 ATAS reveals state-resolved electronic and nuclear dynamics. a, the measured delay
dependent absorption spectrum of hydrogen molecules near delay zero. b, the ab initio
quantum simulations. c and d are the measured and simulated delay dependent absorption
spectrum in the vicinity of C 1Πu states, e and f are the measured and simulated delay
dependent absorption spectrum near B 1Σu+ states. Model calculations including only the X
1Σg+ ground state and d, the C 1Πu and J 1Δg and f, B 1Σu
+ and GK 1Σu+ excited states, reveal
the mechanism behind the state-resolved absorption features. ........................................... 103
Figure 6-4 Fourier transform analysis of measured (a) and simulated (b) delay dependent
absorption spectrum. Quantum beats in the delay dependent absorption spectrum can be
observed as crossings of Fourier lines associated with different laser-perturbed vibrational
states. Consecutive vibrational levels cross when the Fourier frequency is equal to half of

xvi
their energy differences (blue stars), while intersections at larger Fourier frequencies
indicate higher-order crossings (red stars). ......................................................................... 106
Figure 6-5 Plot of the polarization in the time and energy domain for a single vibrational state.
............................................................................................................................................. 107
Figure 6-6 ATAS spectrum obtained from the analytical model. Upper panel: only the v=0 state
is included. Central panel: only v=0 and v=1 states are included. Bottom panel: all v’s are
included. Adapted from [121] ............................................................................................. 110
Figure 6-7 ATAS spectrum obtained from the reduced TDSE calculations. Upper panel: only the
v=0 state is included. Central panel: only v=0 and v=1 states are included. Bottom panel: all
v’s are included. Adapted from [121] ................................................................................. 111
Figure 6-8 Eigenvalues of the Floquet matrix as a function of IR intensity. Adapted from [121]
............................................................................................................................................. 113
Figure 6-9 ATAS spectrum obtained from the reduced TDSE calculations.The intensity of the IR
pulse is 10 times larger than that of Figure 6-7. Adapted from [121]................................. 114
Figure 6-10 Left panel: Chirped and unchirped pulses used in the calculations. Right panel:
Fourier transform of the two pulses. Adapted from [121] .................................................. 115
Figure 6-11 ATAS spectrum obtained from the reduced TDSE calculations using the chirped
pulses. Adapted from [121] ................................................................................................. 115
Figure 6-12 | Quantum control in attosecond photochemistry. A weak, few-cycle NIR “control”
pulse, which overlaps in time with the VUV attosecond pulse, modifies the attosecond
excitation dynamics. The strong modulation of the ATAS indicates the modification of the
initial wavepacket, suggesting a mechanism for attosecond quantum control. .................. 117

xvii
LIST OF TABLES
Table 2-1 Spectrum lines used to calibration the spectrometer. Adapted from [29] .................... 23

1
CHAPTER 1 - INTRODUCTION
Over the last five decades, the development of ultrafast laser technology created new time
scale for experimental observations [1, 2]. Molecular vibrations occur on a time scale of tens to
hundreds of femtoseconds, and this is the characteristic time scale for the motion of atoms in
molecules. The nuclear motion in molecules has been studied extensively by using the
femtosecond pump-probe spectroscopy technique [3]. The motion of electrons in matter occurs
on the attosecond time scale (1 𝑎𝑠 = 10−18 𝑠). For example, the time it takes one electron in the
first Bohr orbit to travel a Bohr radius is 24.2 as. Using femtosecond pump-probe spectroscopy
technique is insufficient to track the dynamic evolution of electrons in matter. To study the fast
electron dynamics in atoms and molecules, a light pulse shorter than the dynamics process itself
is needed, and for this reason, an attosecond light source is required to study the electron
dynamics. In recent years, advances of attosecond science has opened the new way for
understanding and controlling ultrafast electron dynamics in atoms and molecules [4].
The attosecond transient absorption spectroscopy is a powerful tool [5] to utilize
attosecond pulse for direct measurement of electron dynamics in quantum systems. In this thesis,
I will discuss the generation of attosecond pulses, the fundamental principles and experimental
setup of the attosecond transient absorption spectroscopy technique, and some experiments
utilizing the technique to study the electron dynamics in helium, neon atoms, and in hydrogen,
deuterium molecules.
The overall goal of my work is to study the electron dynamics in atoms and molecules
using the attosecond transient absorption spectroscopy technique. This thesis will be organized
as follows. Chapter one will be the discussion of high harmonic generation and gating techniques
used to generate single attosecond pulses, including the polarization gating, double optical gating

2
and generalized double optical gating. In Chapter Two, I will discuss the experiment setup and
theory of attosecond transient absorption spectroscopy. In Chapter Three, Four and Six, I will
present the measurement of bound state electron dynamics in helium and neon atoms,
autoionizing states dynamics in argon and krypton atoms, and the molecular dynamics in
hydrogen and deuterium molecules. Chapter Five will be the below threshold harmonics
generation. Chapter Seven will be the final remarks.
1.1 Principle of High Harmonic Generation (HHG)
Ferray et al [6] discovered high harmonic generation (HHG) in 1988 by focusing a
Nd:YAG laser at 1064 nm central-wavelength to an intensity of 1013 ~ 1014 𝑊/𝑐𝑚2 in a noble
gas target. The high harmonic generation radiation has very good temporal coherence [7] which
makes it a good way to generate broadband XUV sources.
When an atomic or molecular medium is exposed to an intense femtosecond laser whose
peak electric field strength is comparable to the Coulomb field, a train of attosecond pulses is
generated through the process of high harmonic generation. This process was explained using the
so-called three step model in a semi-classical way in 1994 [8]. First, the valence electron tunnels
through the atomic potential barrier created by the ion charge and the applied strong oscillating
laser electric field. After tunneling, the electron is accelerated in the laser field. The freed
electron travels in the external laser field like a classical particle and one can calculate the
electron’s trajectory using Newton’s law when two conditions, first introduced by Keldysh [9],
are met. First, after the electron is liberated from the atom, it is no longer affected by the
Coulomb potential of the atom. Second, during the evolution only the ground state of the atom is

3
considered. In the third step, a portion of the electrons recombines with the parent ion, producing
an XUV photon. The three step model can be understood in a schematic of the model as shown
in the figure below.
Figure 1-1 The three step model for high harmonic generation. Adapted from [2]
For simplicity, we consider the system moving in one dimension only, and assume the
laser field to be monochromatic and linearly polarized [10]. The electric field is given by
휀(𝑡) = 𝐸0cos (𝜔0𝑡) (1-1)
When the electron is released, its initial position is at 𝑥0 = 0 and its initial velocity is
𝑣0 = 0. We have assumed that the electron leaves the barrier with zero velocity, however,
quantum mechanics never allows such precision [2]. The ionization process is assumed to be
instantaneous. The electron is then affected by the laser field only and the Coulomb potential is
neglected. Under the two conditions we discussed above, we can treat the electron classically and
calculate the electron trajectory by using Newton’s law. The equation of motion of the electron is
𝑑2𝑥
𝑑𝑡2= −
𝑒
𝑚𝑒휀(𝑡) = −
𝑒
𝑚𝑒𝐸0cos (𝜔0𝑡) (1-2)

4
where 𝑒 and 𝑚𝑒 are the electron charge and mass respectively.
Assuming the electron is freed at time 𝑡0, the solution of the differential equation is
𝑣(𝑡) = −𝑒𝐸0
𝑚𝑒𝜔0[sin(𝜔0𝑡) − sin (𝜔0𝑡0)] (1-3)
where 𝑣(𝑡) is the velocity of the electron.
When the electron returns to the parent ion, its position is at 𝑥(𝑡) = 0, and using (2-3) ,
the return time 𝑡𝑓 can be found by solving the equation
𝑥(𝑡𝑓) =𝑒𝐸0
𝑚𝑒𝜔0{[cos(𝜔0𝑡𝑓) − cos(𝜔0𝑡0)] + 𝜔0 sin(𝜔0𝑡0) (𝑡𝑓 − 𝑡0)} = 0 (1-4)
The emitted photon energy is
ℏ𝜔𝑋 = 𝐼𝑝 + 2𝑈𝑝[sin(𝜔0𝑡𝑓) − sin (𝜔0𝑡0)]2 (1-5)
where 𝐼𝑝 is the ionization potential of the atom and 𝑈𝑝 =𝑒2𝐸0
2
4𝑚𝜔2is the pondermotive
energy which is the average quivering energy the electron gains in the laser electric field.
Equation (1-5) does not have analytical solutions. We can solve the equation numerically.This
solution can be fitted with an analytical function
𝑡𝑓
𝑇0=
1
4−
3
2𝜋𝑠𝑖𝑛−1(4
𝑡0
𝑇0− 1) (1-6)
We know that 𝜔0 = 2𝜋/𝑇0, Equation (1-6) can be rewritten as
𝜔0𝑡𝑓 =𝜋
2− 3𝑠𝑖𝑛−1(2
𝜔0𝑡0
𝜋− 1) (1-7)
Plug (1-7) into (1-5), we have

5
ℏ𝜔𝑋 = 𝐼𝑝 + 2𝑈𝑝[cos (3𝑠𝑖𝑛−1 (2𝜔0𝑡0
𝜋− 1)) − sin (𝜔0𝑡0)]2 (1-8)
And from (1-8) we can find that the highest released photon energy is
𝐸𝑐𝑢𝑡𝑜𝑓𝑓 = 𝐼𝑝 + 3.17𝑈𝑝 (1-9)
when the electron is released at 𝜔0𝑡0 = 0.05 × 2𝜋 and returns at 𝜔0𝑡𝑓 = 0.7 × 2𝜋.
High harmonic generation process can also be understood quantum mechanically [11],
however, the three step model is intuitive and convenient to use in experiments.
The HHG radiation is intrinsically an attosecond process and it occurs once every half
laser cycle. For a multi-cycle driving laser pulse, a train of attosecond pulses will be generated
with an interval of half an optical cycle. While attosecond pulse trains are useful in some
applications [12-14], isolated single attosecond pulses are more desirable for experimentalists to
perform pump-probe experiments to study electron dynamics in atoms and molecules and map
out the time evolution of the system, especially for the cases where the pulse spacing (half an
optical cycle) is shorter than the physical process to be studied.
1.2 The Laser System
The attosecond transient absorption experiments are performed using the Florida
Attosecond Science and Technology (FAST) laser, which is a two-amplification-stage chirped
pulse amplifier (CPA) laser system [15] as shown in the figure below. The first amplification
stage is a multi-pass amplifier in which the seed pulse passes through the cryogenically-cooled
[16] Ti:Sapphire crystal 14 times. Amplified spontaneous emission (ASE) is suppressed due to
the geometry configuration. In the second amplification stage, the seed pulse pass through a

6
second cryogenically-cooled Ti:Sapphire crystal once. After the amplification, the pulses are
compressed by a pair of grating.
Figure 1-2 Layout of the FAST laser system
The spectrum of the amplified laser pulses is shown in the figure below, the spectrum
covers from 725 nm to 830 nm. The laser system delivers laser pulses with energy up to 3 mJ.
The central wavelength is 780 nm and the pulse duration is 20 fs. The amplified pulses are
further sent into a hollow core fiber compressor to compress the pulse to be few-cycle in order to
generate single attosecond pulses more efficiently. We will discuss the few-cycle femtosecond
pulse generation in the next session.

7
Figure 1-3 The FAST laser amplified pulse spectrum
1.3 Few-cycle Femtosecond Pulses
To produce few cycle femtosecond pulses, the multi-cycle pulses from the laser are sent
into a neon gas-filled hollow core fiber [17] and a chirped mirror compressor [18]. Inside the
hollow core fiber, the pulse spectral bandwidth is broadened due to the self-phase modulation
[19] process in nonlinear optical media, neon in our case. The positive chirp introduced by the
self-phase modulation process and material dispersion is compensated by using chirped mirrors.
1 mJ pulses as short as 4-6 fs centered at 730 nm are generated after the hollow core fiber and
chirped mirror compressors. A FROG measurement of a compressed pulse from the FAST laser
is shown in Figure 1-4.

8
Figure 1-4 FROG retrieval of a 4 fs pulse from the FAST laser system and the
hollow core fiber compressor.
1.4 Isolated Attosecond Pulse
When intense linearly polarized near infrared (NIR) laser pulses are focused in to a noble
gas target, a train of attosecond pulses can be generated every half a laser cycle through the high
harmonic generation process. Attosecond pulse trains are useful for some experiments, however,
in order to study electron dynamics in atoms and molecules through pump-probe experiments,
single attosecond pulses are more desirable. In this session, we will discuss different methods to
generate isolated single attosecond pulses.

9
1.4.1 Polarization Gating
The high harmonic generation process strongly depends on the ellipticity of the driving
pulses [20]. As the ellipticity of the driving pulses increases, high harmonic generation efficiency
drops off dramatically. This ellipticity dependence can be explained using the three-step model
[21]. The figure below shows the typical dependence of high harmonic generation yield as a
function of driving laser field ellipticity. The high harmonic yield drops significantly as the
ellipticity increases.
Figure 1-5 The ellipticity dependence of high harmonic generation yield. Adapted from [20]
In the polarization gating, in order to create a temporal gate, the polarization of the
driving laser pulses changes from circularly polarized to linearly polarized and then changes
back to circularly polarized again. Since the HHG radiation process occurs every half an optical
cycle, in order to generate single attosecond pulses, the gate width should be equal or smaller to

10
the spacing between adjacent attosecond pulses, which is half a laser cycle. By combining a right
circularly polarized and a left circularly polarized laser pulse with a time delay between them, we
can create a pulse whose leading and trailing edges are circularly polarized and central part is
linearly polarized. This is show in the figure below.
Figure 1-6 Polarization gating scheme. Adapted from [22].
The width of the temporal gate can be written as:
𝛿𝑡𝐺 =𝜉𝑡ℎ𝑟
ln 2 𝜏𝐿
2
𝑇𝐷 (1-10)
where 𝜉𝑡ℎ𝑟 is the so-called threshold ellipticity at which the high harmonic yield becomes
very small, usually 𝜉𝑡ℎ𝑟 = 0.2, 𝜏𝐿 is the pulse duration of the drive laser and 𝑇𝐷 is the time delay
between the two pulses. For polarization gating, the temporal gating width is half a laser cycle.
In addition, in order to rich a reasonable high intensity within the gate, the time delay between
the two pulses should not be larger than the pulse duration.

11
In experiments, we can create such ellipticity dependent pules by using a quartz plate and
a quarter wave plate the figure below.
Figure 1-7 Optical components for polarization gating. Adapted from [23].
In practice, polarization gating was used to generate single attosecond pulses with a
driving pulse duration of 5 fs or shorter and it was first demonstrated in 2006 [23]. However, it is
challenging to generate such short driving pulse on a daily basis, and in the next session, we will
introduce the Double Optical Gating (DOG) method in which laser pulses with longer pulse
duration can be used to generate single attosecond pulses.
1.4.2 Double Optical Gating
From the previous discussions, we can find that polarization gating requires very short
driving pulses. The double optical gating (DOG) technique has been proposed and
experimentally investigated [24] to reduce the requirement for the input pulse. The double
optical gating combines the two color gating [25] and polarization gating, and is a highly robust
method for generating isolated single attosecond pulses on a daily basis.
In double optical gating, a weak second harmonic field is added to the driving laser field,
and the symmetry of the driving laser field is broken. Using this driving laser field, the HHG
12
radiation process occurs every full laser cycle instead of every half laser cycle. This is illustrated
in Figure 1-8. The color gradient in the figure shows the ellipticity of the driving pulse, the white
color indicates that the drive pulse is linearly polarized and the blue color indicates circular
polarization. The gating width is presented with two vertical lines. From this figure we can see
that, when the gate width is one optical cycle, at least two attosecond pulses will be generated in
polarization gating, while in double optical gating, only one attosecond pulse will be generated.
The polarization gate temporal width is given by [10]
𝛿𝑡𝐺 =1
ln 2𝜖𝑡ℎ
𝜏2
𝑇𝐷 (1-11)
where 𝜖𝑡ℎ is the threshold ellipticity which is defined as the ellipticity at which the high
harmonic yield drop to 20% of its value when the driving pulse is linearly polarized, 𝜏 is the
pulse duration of the driving pulse and 𝑇𝐷 is the time delay between the two counter rotating
pulses. We can see from Figure 1-8 that in double optical gating, attosecond pulses are generated
every full cycle of the driving laser pulse instead of half laser cycle, so we can increase the gate
width to one full optical cycle. By increasing the gate width, isolated single attosecond pulses
can be generated from 10 fs driving pulses which is longer than polarization gating (5 fs).
Generation and maintenance of 10 fs pulses are much easier.

13
Figure 1-8 Attosecond pulse generation in polarization gating (a) and double optical
gating (b). Adapted from [26]
The DOG scheme has another advantage, the ground state population on the leading edge
can be reduced [24], thus the conversion efficiency can be increased as compared to polarization
gating.
Figure 1-9 Optic components for double optical gating. Adapted from [24]
The driving pulse duration can be extended to even longer by using the generalized
double optical gating technique [27]. In the generalized double optical gating, the ellipticity of

14
the counter-rotating pulses is less than one, the pulse has an elliptically polarized leading and
trailing edge. This is accomplished by reflecting a portion of the driving field away by placing a
Brewster window after the first quartz plate in the double optical gating optics, the gating field
still remains the same. The setup is shown in Figure 1-10.
Figure 1-10 Optics for creating the field for generalized double optical gating.
Adapted from [27]
The generalized double optical gating technique was demonstrated to be able to generate
single attosecond pulse using 28 fs driving pulses [27]. In our attosecond transient absorption
experiments, we will use the generalized double optical gating technique to generate single
attosecond pulses.

15
CHAPTER 2 - ATTOSECOND TRANSIENT ABSORPTION
SPECTROSCOPY
Over the decades, the development of ultrafast laser technology created new time scale
for experimental observations. Molecular vibrations occur on a time scale of tens to hundreds of
femtoseconds, and this is the characteristic time scale for the motion of atoms in molecules. The
nuclear motion in molecules has been studied extensively by using the femtosecond pump-probe
spectroscopy technique. The motion of electrons in matter occurs on the attosecond time scale
(1 𝑎𝑠 = 10−18 𝑠). For example, the time it takes one electron in the first Bohr orbit to travel a
Bohr radius is 24.2 as. Using femtosecond pump-probe spectroscopy technique is insufficient to
track the dynamic evolution of electrons in matter. To study the fast electron dynamics in atoms
and molecules, a light pulse shorter than the dynamics process itself is needed, and for this
reason, an attosecond light source is required to study electron dynamics. In recent years,
advances of attosecond science has opened a new way for understanding and controlling ultrafast
electron dynamics in atoms and molecules.
The attosecond transient absorption spectroscopy is a powerful tool [5] to utilize
attosecond pulses for direct measurement of electron dynamics in quantum systems. In this
chapter and the next few chapters, I will discuss the generation of attosecond pulses, the
fundamental principles and experimental setup of the attosecond transient absorption
spectroscopy technique, and some experiments utilizing the technique to study the electron
dynamics in helium, neon atoms, and in hydrogen molecules.

16
2.1 The Attosecond Transient Absorption Experimental Setup
The attosecond transient absorption experimental setup is shown in Figure 2-1. Few-cycle
NIR laser pulses are generated from a hollow core fiber compressor with chirped mirrors (UFI
PC70). The beam is split and sent into two arms using a broadband beam splitter (LayerTec
#108215). The broadband beam splitter reflects 50% and 80% of the laser pulses for s-
polarization and p-polarization respectively. In one arm, the laser pulses generate single
attosecond pulses using the generalized double optical gating (GDOG) from a rare gas
(xenon/argon) filled cell with 1.0 mm inner diameter. The focal length of the focusing mirror is
500 mm (Newport 10DC1000ER.2). The entrance window is a 0.7 mm fused silica plate with
AR coating (CVI W2-PW1-1005-UV-670-1064-0). An aluminum/indium filter (Lebow
Company) is used to block the residue NIR pulses, select the proper XUV energy range and
compensate the intrinsic chirp of the attosecond pulses. A toroidal mirror with 5 degree AOI is
used to focus the XUV pulse. In the other arm, the beam passes through an optical delay line [28]
and then recombines with the attosecond pulses. Both pulses are focused into the target gas cell
filled with the gas to be studied.
The time delay between the XUV pulse and the NIR pulse is controlled by using a
piezoelectric transducer stage. The optical path difference suffers from environmental noise such
as air fluctuations as well as vibrations of optical tables and mechanical parts. Such instability
can be suppressed by using a Mach-Zehnder optical interferometer in which a continuous wave
laser field propagates in both arms. By stabilizing the interference pattern, the optical path length
difference between the two arms can be locked to within 20 as RMS for the experiments. The
details of this design can be found in [28]. This interferometer configuration is able to keep the
stability when the delay between the two arms is changed.

17
Figure 2-1 Schematic of the attosecond transient absorption setup. Adapted from
[29]
High-order harmonics generation (HHG) from the interaction between ultrashort
femtosecond laser pulses and gas jets is a novel source of extremely ultraviolet (XUV) radiation
[6, 8, 30]. With proper gating methods [24, 27, 31, 32], HHG is also the main source of isolated
attosecond pulses (IAP), which holds the promise to observe and control electron dynamics
inside atoms and molecules in attosecond timescale. Recent advance in ultrafast dynamics
observation with HHG and IAP [5, 33-35] have greatly relied on spectral resolved XUV
measurement. From this point of view, XUV spectrometer is significantly important to
attosecond technology, especially for attosecond transient absorption experiment [5, 35, 36], in
which the transmitted spectrum of the XUV pulses is measured as a function of time delay
between the XUV and near-infrared (NIR) laser pulses. Abundant ultrafast dynamics information
is encoded in the transmitted XUV spectrum. The accuracy and resolution of the XUV
spectrometer therefore plays a critical role in attosecond transient absorption experiment.
18
One of the advantages of the attosecond transient absorption spectroscopy technique is
that the achievable spectrometer resolution is high [37]. Insufficient spectrometer resolution will
broaden or even smear out the absorption peak features. In our case, the transmitted XUV spectra
is recorded on a XUV spectrometer which has a resolution of ~ 50 meV near 28 eV [29].
The spectrometer consists of a flat field grazing incidence grating and a flat detector, the
detector can be either a micro-channel plate (MCP) with a phosphor screen or an XUV charge-
coupled device (CCD) camera. In order to focus various wavelength into a flat detector, the
XUV grating has a spherical surface with variable line spaced grooves. The complex structure of
the grating makes the focal length of each spectrum component very sensitive to the incident
angle and objective distance which is the distance between XUV source and the center of
grating.
The XUV grating used in the transient absorption setup is the Hitachi 001-0640 XUV
grating with a flat field in the spectrum range of 11 – 62 nm. To quantitatively evaluate the
sensitivity, we calculated the focal length of a Hitachi XUV grating for different incident angles
and objective distance. The wavelength of the incident beam is assumed to be 40 nm. The result
shows that 2 cm off in the objective distance will change the focal length by 5 mm and 0.5
degree error of the incident angle will result in 10 mm error of the focal length. Both of these
small errors will dramatically enlarge the spatial width of spectral lines on MCP, which will
worsen the resolution of the spectrometer. Therefore precisely assembling and carefully aligning
is required to develop a XUV spectrometer with good performance, however, that doesn’t
guarantee all the parameters are perfectly set to be the designed value. Accurate calibration is
indispensable to appraise and optimize the XUV spectrometer.

19
Usually, the XUV spectrometers are calibrated using the absorption edges of metal foils
[37, 38], laser produced plasma [39, 40], or Electron Beam Ion Trap (EBIT) [41, 42]. Metal foils
can only provide very few spectrum lines to benchmark the XUV spectrometer. The spectrum of
XUV generated from plasma is either complicated or doesn’t have sufficient intensity in the
energy range of interest. And EBIT is not available for most of laboratories. In our attosecond
transient absorption setup, the calibration is performed by measuring argon 3s3p6np auto-
ionization lines, as well as helium 1snp absorption lines. All of those lines are in the energy
range of 20-30 eV. Besides, the line widths of the 3s3p64p, 3s3p65p and 3s3p66p states of argon
are 80 meV, 28.2 meV and 12.6meV, respectively, which can be used to examine the resolution
of the XUV spectrometer.
To perform attosecond transient experiment with Ar/He gas, we built a XUV
spectrometer with spectrum range of 20 – 30 eV (40 – 62 nm). A Hitach 001-0640 XUV grating
with a flat field in the spectrum range of 20-112 eV (11-62 nm) is installed in a vacuum
chamber. The designed incident angle, objective distance and imaging distance is 85.3o, 350 mm
and 469 mm, respectively. With the help of a proper adaptor, the grating is hold by a mirror
mount, whose actuators are connected to rotary feedthroughs on the side flange of the vacuum
chamber. This design allows further fine tuning of the grating even if the spectrometer is under
vacuum. The dispersed XUV spectrum reaches the MCP after passing through an extension tube
and a bellow, which makes the image distance – the distance between the center of the grating
and MCP – adjustable in the range of 440 - 470 mm. The reason to have the incident angle and
image distance adjustable is that: i) the dispersed spectrum is so sensitive to these parameters
that small errors will lead to significant reduction of the resolution, as we addressed above; ii)
the focus position of 40–62nm spectrum components are at the edge of the flat focal plane of the

20
grating, and they are not in a line parallel to flat focal plane in which the MCP is placed. So
adjustment of incident angle and imaging distance is requisite otherwise the resolution for 40–
62nm spectrum components is expected to be very low if we keep the designed incident angle
and imaging distance.
Figure 2-2 (a) Top view of the XUV spectrometer. (b) Focal “plane” of the XUV grating
for different incidence angles. Each plane covers a spectrum range from 11 nm (triangles)
to 62 nm (squares), and the 40 nm components (circles) are also marked in each focal pl
ane. For 86.5° incidence angle, the spectrum from 40 to 60 nm is approximately in a
vertical plane (MCP plane). The axes are defined in (a).(c) Dependence of grating image
distance of 40 nm XUV light on object distance and incidence angle. Adapted from [29]

21
Simulation shows that changing the incident angle will indeed help to make the measured
spectrum to be focused on a flat plane parallel to MCP. We plot the focus position for the
spectrum component from 11 nm to 62 nm with different incident angle. The results indicate that
the incident angle and imaging distance should be set to 86.5o and 448 mm respectively. To
verify the resolution under this geometric configuration, ray tracing is carried out with Zemax
[43]. The light source in the ray tracing consists of 6 difference wavelength component
corresponding to three helium absorption lines (1s2p, 1s3p, 1s4p) and three argon autoionizaiton
lines (3s3p64p, 3s3p65p, 3s3p66p). The spacial profile of the focused spectrum on the MCP is
shown in the figure below. The horizontal axis is along the MCP surface, and the corresponding
photon energy increases as the position axis increases, so the left three peaks are the helium
absorption lines and the right three are the argon autoionization lines.
Figure 2-3 Spacial profile of the focused spectrum on the MCP if the incident angle is set to
be 86.5o. The six peaks (from left to right) are helium 1s2p, 1s3p, 1s4p absorption lines and
argon 3s3p64p, 3s3p65p and 3s3p66p autoionization lines respectively. Both spacial and
spectral FWHM is labeled for each peak. Adapted from [29]
The spacial full width at half maximum (FWHM) of each spectrum peak is between 30
𝜇𝑚 and 40 𝜇𝑚, as labeled in the figure, which indicates that all the spectrum components are

22
well focused on the MCP plane since the size of each micro-channel of the MCP is just 32 nm.
By taking into account the reciprocal linear dispersion of the grating, we can also estimate the
spectral FWHM, which is equivalent to spectrometer resolution, since each line is
monochromatic in the source. The spectrometer resolution is around 10meV, as labeled in the
figure above, and it is slightly better for long wavelength components.
In the Experiment, transmitted XUV spectrum after both argon and helium was
measured. The ionization potential of argon is 15.7 eV (79 nm), which is much lower than the
measured energy of the spectrometer. Thus, all the measured spectrum will be strongly absorbed
due to photon-ionization and the photon-ionization cross-section of argon is almost constant
during the entire energy range [44] of our XUV spectrometer. So it is not expected to see any
absorption structure there. However, lying in the energy range of the spectrometer there are
several argon auto-ionization states [5, 45], and the interference between the direct ionization
and the decay from auto-ionization states will result in Fano resonance profiles [46], which can
be observed as transmission peaks in the absorption spectrum with resolution compatible line
width. The ionization potential of helium (24.6 eV) is right in the spectrometer energy range, so
a step-shape absorption spectrum is expected. Besides, the 1snp excitation states of helium will
also leave their absorption mark on the measured spectrum. But without external disturbance, the
1snp excitation states are rather stable, and their lifetime can be as short as few nanoseconds [47]
corresponding to few nano-eV linewidth in spectrum, which is immeasurable by the
spectrometer. To see these absorption lines, moderately intense (1011-1013 W/cm2) NIR laser
pulses need to be focused in the second cell to dress the helium atoms [35].
The transmission of XUV pulses after passing through argon or helium cell are presented
in the figure below. The backing pressure of the second cell is 35 torr and 50 torr for argon and

23
helium respectively. In the argon transmission curve (red solid), five peaks corresponding to the
five autoionization states listed in the table below are identified by the gray arrows. In helium
absorption experiment, the intensity of dressing laser is set to be about 5x10¹² W/cm2 to broaden
the 1snp lines. The step around 900th pixel in the helium transmission curve (blue line with filled
area) is the ionization potential of helium. Below the ionization potential, only those photons
with energy equal to 1snp excited states could be absorbed due to transition from ground state to
the corresponding excited states. So the dips below 900th pixel which are marked by the black
arrow indicate the position of helium 1snp states. All the spectrum lines we observed with the
XUV spectrometer are listed in the table below.
Table 2-1 Spectrum lines used to calibration the spectrometer. Adapted from [29]
States Energy (eV)
Measured
Linewidth
(meV)
He
1s2p 21.242 235.9
1s3p 23.113 144.3
1s4p 23.769 86.4
1s5p 24.073 69.7
1s6p 24.239 69.5
1s7p 24.338 -
1s8p 24.403 -
Ar
3s3p64p 26.646 82.46
3s3p65p 28.023 81.02
3s3p66p 28.543 82.3
3s3p67p 28.793 81.7
3s3p68p 28.933 -

24
Figure 2-4 (a) Transmission of XUV pulses through a 35 torr argon cell (red solid curve)
or a 50 torr helium cell (blue curve with filled area). Five argon autoionization peaks and
seven helium absorption dips are identified in the figure. (b) Wavelengths of the 12 spectral
lines (squares) identified in (a), and the linear fitting (red dashed line). Adapted from [29]
Now we have 12 known spectrum lines to calibrate the spectrometer. The wavelength of
spectrum lines is plotted in Figure 2-4 (b) as a function of their pixel location on the CCD. In the
narrow wavelength range of interest it is a reasonable assumption that the wavelength is
proportional to pixel location. So the relationship between the wavelength and pixel location can
be fit as:
0kx (2-1)

25
By performing linear least square fitting for the 12 known spectrum dots, , we can get
0.01531k , 0 64.154 . The effective pixels of HHG spectrum on the CCD are in the range
of 310-1500, so the wavelength range of the spectrometer is 41.19-59.41nm (20.87-30.10eV).
After the calibration of the spectrometer, we can easily measure the FWHM of each spectrum
lines by fitting the spectrum line with a Gaussian curve. The FWHM of each spectrum are listed
in Table I (some peaks are too weak to be correctly fit). The actual linewidth of the first three
argon autoionization states [5] are also listed in Table 2-1. By comparing them with the
measured linewidth, we can see that the resolution of the spectrometer is 60 meV. But in the low
energy range, the resolution is slightly better (~50 meV), which agrees with our previous
estimation. Note that the linewidth of argon 3s3p66p autoionization state is just 12.6 meV, which
enable this method to examine the XUV spectrometers with energy resolution as high as 13
meV.
Although ray tracing result suggests a resolution as high as 10 meV, the resolution of our
XUV spectrometer is calibrated to be 60 meV. The difference is caused by couple of issues.
First, the XUV focal point in the absorption cell serves as the entrance slit to the spectrometer, so
the spectrometer resolution is partially determined by the focal spot size of the soft x-ray beam at
the sample position. While in the ray tracing, an ideally point source is used. Second, since the
spectral data is finally read out through a CCD on which the MCP phosphor is imaged with a
lens, both the CCD noise and imaging process will introduce some error to the spectrum data.
Finally, a monochromatic point source will be imaged as a sharp peak with a broad outsole by
the grating. The FWHM somehow is no longer a valid physical quantity to evaluate the width of
the spectrum.

26
Figure 2-5 Comparison between measured absorption cross section (dots) and argon
autoionization Fano profile convoluted by a Gaussian function with FWHM of 60 meV
(solid curve). Adapted from [29]
In order to determine the resolution of our imaging system, we measured the image of the
so-called “quantum noise”. When we apply a very high voltage (1800 V) to the front surface of
the MCP, a stray electron will be amplified and form an electron avalanche, and the image
observed on the phosphor screen is from a single microchannel pore. The image is shown in the
figure below. The FWHM of the image is 131 (27) μm and 151 (33) μm along x and y axes
respectively. Our spectrometer resolution was calibrated to be 60 meV which corresponds to a
190 (13) m FWHM. We can see that the spectrometer resolution is mainly limited by the
MCP imaging resolution.

27
Figure 2-6 Image of the electron distribution of a single microchannel pore, with
corresponding lineouts (symbols) along the x (dispersion) and y (position) axes. Gaussian
fits (solid curve) to the measured distribution give FWHM resolution of 131 μm and 151
μm along the x and y axes, respectively. The error comes from the Gaussian fit. Adapted
from [29]
We developed XUV spectrometer with energy range of 20-30 eV for attosecond transient
absorption experiment and proposed a novel method to calibrate it. By measuring helium
absorption lines and argon autoionization lines, the XUV spectrometer can be easily calibrated
and the resolution can also be determined simultaneously. Since there are up to 12 known
spectrum features which are located in the spectrometer energy range uniformly, the calibration
is rather accurate. The resolution of our homemade XUV spectrometer is determined to be 60

28
meV, however, this method has the potential to evaluate the XUV spectrometer with a resolution
as high as 13 meV.
The attosecond transient absorption spectroscopy technique also allows direct and
simultaneous measurement of the excited state dynamics and quantum interference both above
and below the ionization threshold, which is not possible by using the attosecond photoelectron
spectroscopy [48].
2.2 Theory of Attosecond Transient Absorption Spectroscopy
The attosecond transient absorption spectroscopy setup is all-optical, which makes it
much simpler than the attosecond streaking camera spectroscopy. However, interpreting the
time-delay dependent absorption spectrum of target atoms and molecules is still challenging. In
attosecond transient absorption spectroscopy experiments, the number of photons is relatively
large (on the order of 1015 photons per pulse for NIR laser pulses and on the order of 107 photons
per pulse for attosecond pulses), we can treat the laser-target interaction semi-classically in
which the targets (atoms or molecules) are described quantum mechanically while the laser
pulses are treated by classical electrodynamics.
The spectrum of laser pulses that go through a gas cell can be calculated using the Beer-
Lambert Law when non-linear effects and temporal shaping of the input pulses can be neglected.
The transmitted spectrum:
𝐼𝑜𝑢𝑡(𝜔) = 𝐼𝑖𝑛(𝜔) exp {−4𝜋𝜔
𝑐𝐈𝐦 [
�̃�(𝜔)
휀�̃�𝑛(𝜔)] 𝑁𝐿} (2-2)

29
where 𝐼𝑖𝑛(𝜔) = |휀�̃�𝑛(𝜔)|2 is the incident laser pulse intensity, 𝐼𝑜𝑢𝑡(𝜔) = |휀�̃�𝑢𝑡(𝜔)|2 is
the transmitted laser pulse intensity, NL is the density-length product of the target, �̃�(𝜔) is the
polarization spectrum of the atom.
In experiments, absorbance 𝐴(𝜔), which is defined as the common logarithm of the ratio
of incident to transmitted radiant power through a material [49], is given by
𝐴(𝜔) =4𝜋𝜔
𝑐𝐈𝐦 [
�̃�(𝜔)
휀�̃�𝑛(𝜔)] 𝑁𝐿 (2-3)
The polarization spectrum is given by the Fourier transform of the time dependent dipole
moment
𝑃(𝑡) = ⟨Ψ(𝒓, 𝑡)|𝑧|Ψ(𝒓, 𝑡)⟩ (2-4)
𝑃(𝜔) = ∫ 𝑑𝜔𝑃(𝑡)𝑒𝑖𝜔𝑡∞
−∞
(2-5)
So in order to calculate the absorption spectrum, we need to calculate the time dependent
wavefunction with the combined XUV and NIR laser fields.
The laser field can be presented using the electric field F and the vector potential A.
𝑭(𝒓, 𝑡) = 𝒛𝐹0 cos(−𝒌 ∙ 𝒓 + 𝜔0𝑡 + 𝜑0) (2-6)
𝑨(𝒓, 𝑡) = − ∫ 𝑑𝑡′𝑭(𝑡′)𝑡
−∞
= 𝒛𝐹0
𝜔0sin (−𝒌 ∙ 𝒓 + 𝜔0𝑡 + 𝜑0) (2-7)

30
where 𝐹0 is the electric field strength, 𝒌 is the wave vector, 𝜔0 is the angular frequency,
and 𝜑0 is the phase of the laser pulse.
By making the dipole approximation, the time dependent Schrödinger equation (TDSE)
in the length gauge can be written as:
𝑖𝜕
𝜕𝑡Ψ(𝒓, 𝑡) = [𝐻0 − 𝒓 ∙ 𝑭𝑿(𝑡 − 𝜏𝐷) − 𝒓 ∙ 𝑭𝐿(𝑡)]Ψ(𝒓, 𝑡) (2-8)
where 𝐻0 is the field-free Hamiltonian and Ψ(𝒓, 𝑡) is the wavefunction of the target.
𝑭𝑿(𝑡) and 𝑭𝐿(𝑡) are the XUV and NIR laser field strength. 𝜏𝐷 is the time delay between the two
pulses. In experiments, both the attosecond pulse and the NIR pulse are polarized along the same
axis, without loss of generality, they are assumed to be polarized along z-axis. Then the
interaction Hamiltonian 𝐻′(𝑡) can be written as
𝐻′(𝑡) = −𝑧𝐹𝐿(𝑡) − 𝑧𝐹𝑋(𝑡 − 𝜏𝐷) (2-9)
which includes the interaction of the target with both the XUV laser field and the NIR
laser field. The time dependent Hamiltonian is
𝐻(𝑡) = 𝐻0 + 𝐻′(𝑡) (2-10)
where 𝐻0 is the field free Hamiltonian. The wavefunction can be expanded with the set of
Eigen functions of the stationary states Ψ(𝒓, 𝑡) = ∑ 𝑐𝑗(𝑡)𝜓𝑗(𝒓)𝑗 , where 𝐻0𝜓𝑗(𝒓) = 𝐸𝑗𝜓𝑗(𝒓),
𝑐𝑗(𝑡) is the amplitude for the 𝜓𝑗(𝒓) state and 𝐸𝑗 is the corresponding eigenenergy, and the time
dependent Schrodinger equation can be rewritten:

31
𝑖𝜕
𝜕𝑡∑ 𝑐𝑗(𝑡)𝜓𝑗(𝒓)
𝑗
= ∑[𝐸𝑗 − 𝑧𝐹𝐿(𝑡) − 𝑧𝐹𝑋(𝑡 − 𝜏𝐷)]𝑐𝑗(𝑡)𝜓𝑗(𝒓)
𝑗
(2-11)
Using the orthogonality of the stationary states ⟨𝜓𝑎|𝜓𝑗⟩ = 𝛿𝑎𝑗 and the dipole matrix
element is defined as 𝑑𝑎𝑗 = ⟨𝜓𝑎|𝑧|𝜓𝑗⟩, by projecting the Schrodinger equation onto the state
𝜓𝑎(𝒓), we can get a set of coupled differential equations:
𝑖�̇�𝑎 = 𝐸𝑎𝑐𝑎(𝑡) − ∑ 𝑑𝑎𝑗[𝐹𝐿(𝑡) + 𝐹𝑋(𝑡 − 𝜏𝐷)]𝑐𝑗(𝑡)
𝑗≠𝑎
(2-12)
By using theoretical eigenstate energy values and dipole matrix elements, the equations
can be solved numerically. Then we can calculate the polarization spectrum using equation (2-4)
and (2-5), the absorbance is then given by:
𝐴(𝜔) = ln (|휀�̃�𝑢𝑡(𝜔)|2
|휀�̃�𝑛(𝜔)|2) =
4𝜋𝜔
𝑐𝐈𝐦 [
�̃�(𝜔)
휀�̃�𝑛(𝜔)] 𝑁𝐿 (2-13)
In our case, programs written in LabVIEW and C++ are used to perform the calculation
with typical desktop computers, we will discuss the calculation results in following chapters.

32
CHAPTER 3 - SUB-CYCLE ELECTRON DYNAMICS IN
HELIUM AND NEON ATOMS
Note: Portions of this chapter were used or adapted with permission from the following:
(1) Michael Chini, Xiaowei Wang, Yan Cheng, Yi Wu, Di Zhao, Dmitry A. Telnov,
Shih-I Chu & Zenghu Chang. Sub-cycle Oscillations in Virtual States Brought to Light.
Scientific Reports 3, Article number: 1105 (2013)
(2) Xiaowei Wang, Michael Chini, Yan Cheng, Yi Wu, Xiao-Min Tong, and Zenghu
Chang. Subcycle laser control and quantum interferences in attosecond photoabsorption of neon.
Phys. Rev. A 87, 063413 (2013)
The attosecond transient absorption spectroscopy is a powerful tool to study electron
dynamics and time resolved molecular dynamics. Visualizing the electron dynamics in chemical
reactions is a scientific dream. With the advent of attosecond laser pulses, it is becoming
possible. Attosecond pulses have been used to study atoms, molecules and solid state systems
and hold the promise of allowing new forms of photochemistry. In this chapter, I will discuss the
measurement of bound state electron dynamics in helium and neon atoms using the attosecond
transient absorption spectroscopy.
3.1 Sub-cycle Electron Dynamics in Helium
Development and control of materials exhibiting novel optical phenomena such as
negative refractive index [50], electromagnetic-induced transparency (EIT) [51] and tunable
optical resonances [52] has led to significant advances in optical technology. One of the most
fundamental goals of attosecond second science is to understand and to control the dynamic
evolutions of electrons in matter. While the most exotic behaviors have been observed in

33
complex materials, these phenomena are rooted in well-known optical physics concepts and can
also be studied at the fundamental level in atomic systems, using moderately intense (<1013
W/cm2) lasers to control the electronic structure and therefore the optical properties.
Among the most fundamental optical properties of an atom is its absorption spectrum.
Spectrally-resolved absorption has long been used to study atomic structure [53] and provides a
“fingerprint” for identifying atomic and molecular species. With the addition of a moderately
intense laser field, the absorption spectrum can be modified, allowing measurement of and
demonstrating control over the electron dynamics in the atom on ultrafast timescales. Laser-
dressed absorption measurements have recently demonstrated controllable EIT-like phenomena
in atoms at extreme ultraviolet (XUV) [54] and x-ray [55] wavelengths. More recently, transient
changes in the absorption of an isolated attosecond pulse in the presence of a synchronized few-
cycle laser pulse were observed in valence electron wavepackets in field-ionized krypton
[34],autoionizing states of argon [5]and Stark-shifted excited states of helium [35] allowing
measurement of electron dynamics on the few-femtosecond and even sub-laser-cycle timescale.
Here, we study the absorption of an isolated attosecond pulse in the vicinity of the helium
absorption line manifold corresponding to excitation of an electron from the ground state (1s2) to
the 1snp excited states. When the attosecond pulse overlaps in time with a moderately intense
(~1011-1013 W/cm2) few-cycle laser field, new absorption features appear below the ionization
threshold that correspond to two-color multi-photon absorption to bound states inaccessible to
the attosecond pulse alone. By changing the delay between the attosecond pulse and the laser
field, the absorption strength of these features can be modulated on timescales as short as a
quarter-cycle of the dressing laser field. We further observe strong half-cycle shifts of the
ionization potential, corresponding to a sub-cycle ponderomotive energy shift.

34
The experiment was performed using the attosecond transient absorption technique [5] ,
in which the absorption of an isolated attosecond pulse is measured in the presence of a delayed
laser field as a function of the time delay. The experimental setup combines the high temporal
resolution afforded by the isolated attosecond probe pulse in an actively stabilized interferometer
[28] with the high spectral resolution of XUV absorption spectroscopy [37].Compared to
attosecond photoelectron spectroscopy [56] , the attosecond transient absorption technique
allows observation of bound state dynamics and quantum interferences with high fidelity in low-
intensity laser fields, where the probability of ionization (and therefore the photoelectron yield)
is small, as well as state selectivity in high-intensity laser fields where the contribution of
multiple ionization channels complicates the interpretation of photoelectron spectra.
Figure 3-1 (a), Schematic of experimental setup for attosecond transient absorption. (b),
Helium 1snp energy level diagram showing schematic XUV spectrum and states accessible
for excitation by the attosecond pulse. (c), Measured absorbance spectrum as a function of
the dressing laser intensity when the attosecond XUV pulse overlaps in time with the peak

35
of the NIR laser pulse. The dotted lines trace the Stark-shifted absorption lines. At an
intensity of ~2.5×10¹² W/cm2, several new absorption features appear in the vicinity of the
1s2p state, which dynamically evolve as the laser intensity is increased. Adapted from [48].
Figure 3-1(b) shows the energy level diagram of the helium 1snp excited states, which
extend from 21 eV above the ground state to the first ionization potential at 24.58 eV [57] , along
with the absorbance measured as a function of the dressing laser intensity at a fixed time delay
where the laser field overlaps with the attosecond pulse. As the intensity of the dressing laser is
increased, the absorption in the vicinity of the 1snp excited state manifold changes significantly
[58-60]. For the 1s3p (23.09 eV) and higher-lying states (leading to the absorption edge at the
ionization potential), these changes amount to energy shifts of the absorption lines, which
correspond to AC Stark [35] and ponderomotive shifts. However the laser-dressed 1s2p
absorption line, which was not observed in previous experiments, exhibits more complicated
structure, including energy level splitting and formation of new absorption sub-structures (near
22 eV, becoming prominent at intensities above ~2×10¹² W/cm2) in addition to a relatively small
AC Stark shift. These complex features have previously been attributed to strong couplings
between the 1s2p (21.22 eV) and 1snl (l = s, d) states [59, 60], but the individual sub-structures
could not be identified.
By scanning the time delay between the attosecond XUV and few-cycle NIR pulses, we
can trace the dynamics of the individual sub-structures and elucidate their origins. The figure
below shows the absorbance spectrum as a function of the time delay for dressing laser
intensities of 7×10¹¹ W/cm2 and 5×10¹² W/cm2. Negative delays indicate that the attosecond
pulse arrives on the target before the NIR pulse. While the new absorption sub-structures are
most prominent near zero delay where the two pulses overlap, they can still be observed for large

36
negative delays. Furthermore, the absorption line energies and amplitudes change dynamically
near zero delay, whereas they are relatively constant for larger negative delays. These dynamic
features can allow us to identify the origins of each sub-structure.

37
Figure 3-2 Two-color multi-photon absorption in time-resolved absorption. The absorption
in the vicinity of the 1s2p state at lower dressing laser intensities of a, 7×10¹¹ W/cm2 and b,
5×10¹² W/cm2 allow for experimental identification of the virtual states appearing in the
laser-dressed absorption. Adapted from [48].

38
The observed absorption sub-structures can each be assigned to an excitation pathway to
a given 1snl excited state by the simultaneous absorption of an XUV photon and one or more
NIR photons. The assignment of the excited states was confirmed by solution of the time-
dependent Schrödinger equation in the two-color field.
Figure 3-3 (a), Schematic diagram of two-color two- and three-photon absorption pathways
to the 1s3d (green), 1s4s (blue), and 1snp (red) excited states. The solid arrow indicates the
single-photon excitation of the 1s2p and 1snp (red) states, whereas the dotted arrows
indicate XUV absorption via two-color multi-photon excitation to 1snp states with n ≥ 6.
Dashed lines indicate absorption lines corresponding to laser-induced virtual states. (b),
Normalized photoabsorption cross-sections based on TDSE simulation of helium when the
attosecond XUV pulse overlaps in time with the peak of the NIR laser field. By removing
the 1s2s and 1s4s states (blue) or 1s3s and 1s3d states (green) from the calculation, we can
confirm that the additional absorption lines are due to multi-photon excitation to those
excited states. Adapted from [48].
Unlike the single-XUV photon absorption rate for excitation to the 1snp states in the
absence of the laser field, which is proportional to the cycle-averaged intensity, the probability of
two-color multi-photon absorption is highest when the attosecond pulse overlaps with a
maximum or minimum of the instantaneous laser electric field. Therefore, we expect to see a
strong half-cycle periodicity in the absorption lines corresponding to two-photon (XUV+NIR)

39
excitation to 1sns and 1snd states and quarter-cycle periodicity in the absorption lines
corresponding to three-photon (XUV+NIR+NIR) excitation to 1snp states. The figure below
shows the absorbance spectrum as a function of the time delay for a dressing laser intensity of
1×10¹³ W/cm2. Negative delays indicate that the attosecond pulse arrives on the target before the
NIR pulse. While the new absorption sub-structures are most prominent near zero delay where
the two pulses overlap, they can still be observed for large negative delays. Additionally,
absorption sub-structures above the ionization threshold (ns+ and nd+, 25-28 eV) and below the
1s2p energy level (2s-, ~19 eV) are revealed in the time-dependent measurement. As the time
delay is scanned with attosecond precision, the absorption strength of each feature is modulated
on timescales faster than the laser cycle period. We find that the absorption strength in the
vicinity of the 2s+, 3s-, 4s-, and 3d- absorption features is modulated with a half-cycle periodicity,
whereas the absorption strength near the np2- absorption feature oscillates with a quarter-cycle
periodicity. Furthermore, the absorption line energies change dynamically near zero delay,
revealing Autler-Townes splitting of the 1s2p absorption line in addition to sub-cycle AC Stark
and ponderomotive energy level shifts of the 1s3p and higher-lying states.

40
Figure 3-4 a, Time-delay-dependent absorbance spectrum with a dressing laser intensity of
1013 W/cm2. With the strong dressing laser field, quantum-optical interferences can be
observed in the absorption at negative delays. Near zero delay, the attosecond and NIR
laser pulses overlap, and the absorption is dominated by the sub-cycle AC Stark and
ponderomotive energy level shifts. b, Absorbance lineouts in the vicinity of the transient
virtual states. The absorbance (data points) was obtained by integrating the signal in the
vicinity (±50 meV) of the virtual intermediate states, and the error bars indicate the
standard deviation of the absorbance in that region. The solid lines serve to guide the eye.
While the absorbance near the 3s-, 3d-, 2s+, and 4s- virtual states oscillates with half-cycle
periodicities, the absorbance near the np2- absorption feature oscillates with a quarter-cycle
periodicity. Adapted from [48].
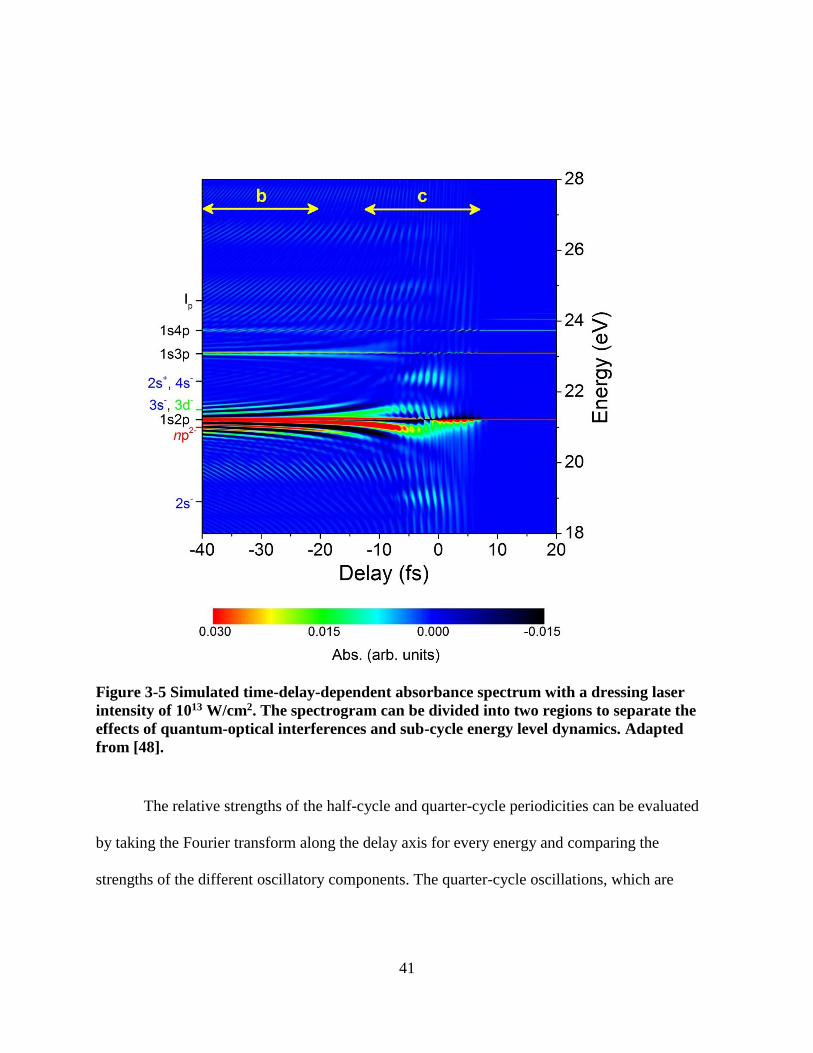
41
Figure 3-5 Simulated time-delay-dependent absorbance spectrum with a dressing laser
intensity of 1013 W/cm2. The spectrogram can be divided into two regions to separate the
effects of quantum-optical interferences and sub-cycle energy level dynamics. Adapted
from [48].
The relative strengths of the half-cycle and quarter-cycle periodicities can be evaluated
by taking the Fourier transform along the delay axis for every energy and comparing the
strengths of the different oscillatory components. The quarter-cycle oscillations, which are

42
clearly apparent for three-photon exciation to the 1snp (n ≥ 6) excited states at an XUV photon
energy near 21 eV, are the fastest dynamic feature observed so far pump-probe spectroscopy.
Figure 3-6 (a)Fourier transform analysis of region b in Figure 3-5, which spans -40 fs < D
<-20 fs. The FT spectrogram obtained from the experimental data is shown in the left
panel, while the right panel shows that obtained from the simulated data. The dashed 45-
degree lines indicate the two-path quantum-optical interference. (b), Fourier transform
analysis of region c, which spans -13 fs < D < 7 fs. Half- and quarter-cycle oscillations are
evident above and below the ionization potential, and the oscillation frequency no longer
follows the 45-degree lines associated with the two-path interference. Adapted from [48].
At higher intensities, the excited state dynamics become significantly more complicated,
owing to the interactions of bound and continuum states with the strong field. At this intensity,
a
b

43
the 1snp excited states lie above the laser-suppressed Coulomb barrier and the excited state
lifetime is therefore very short. However, discrete absorption lines are still present near zero
delay. Additonally, we observe two distinct dynamic features in the continuum states above the
ionization potential (Ip = 24.58 eV). At negative delays, we observe a weak modulation of the
absorption, following hyperbolic lines which indicate the previously observed direct-indirect
interference in the continuum states [56]. These absorption structures appear as 45° lines in the
Fourier transform analysis, with Fourier frequencies equal to psEE 21 , where E is the photon
energy and psE 21 = 21.22 eV. The direct-indirect interferences can be seen extending to photon
energies of nearly 28 eV due to the high spectral resolution of the XUV spectrometer.
The most dominant feature, however, can be seen near zero delay. Here, we observe a
shift in the absorption threshold that exhibits a strong half-cycle oscillation. This energy shift
corresponds to the ponderomotive shift of the ionization potential. In this region, the periodicity
of the oscillation does not change with the XUV photon energy, indicating that it is not a result
of the direct-indirect interference. Moreover, it is inconsistent with the quantum beating observed
in electron spectroscopy [56], which appear at negative delays with Fourier frequencies
corresponding to energy level differences psnsnp EE '11 ( n , 'n ≥ 2 and n ≠ 'n ). Instead, this half-
cycle oscillation is a clear evidence of a sub-cycle ponderomotive shift which follows the
instantaneous laser intensity, analogous to the sub-cycle AC Stark shift [34, 35]. However,
whereas the measurement of the sub-cycle AC Stark shifts by transient absorption is necessarily
convoluted due to the relatively long lifetimes of the laser-dressed excited states [34, 35, 61]
resulting in a relatively small modulation depth, the sub-cycle ponderomotive shift can be
observed more clearly, as it relies on continuum states without finite lifetimes.

44
We turn our attention to the oscillating spectral features below the helium excited state
manifold. In the figure below, we plot the simulated transient absorption of helium (including all
bound states) using a dressing laser with 𝜔𝐿 =1.7 eV, three cycles pulse duration, and peak
intensity of 5×10¹² W/cm2.
Figure 3-7 Interference in the delay-dependent absorption near 19.68 eV with a dressing
laser frequency 𝝎𝑳 =1.7 eV. The full calculation in (a) includes the contributions from 16
bound states, and the half-cycle interference oscillations are indicated by the yellow box. In
(b), the calculation has been repeated after removing the 1s2p, 1s4p, 1s5p, 1s6p, and 1s7p
states. The presence of the interference oscillation near 19.68 eV suggests that it does not

45
result from quantum “which-way” interference, as no “direct” pathway is possible. In (c)
the power spectrum |�̃�(𝝎)|𝟐of the atomic dipole radiation is plotted for the same
conditions as in (a), with all states included. The lack of the interference oscillations
indicates an optical interference mechanism, as explained in the text.
We observe oscillations in the delay-dependent spectrogram which extend to large
negative delays both near the ionization threshold (~24 to 25 eV) and below the 1s2p excited
state energy (~19.5 to 20 eV). The features near the ionization threshold have been discussed in
detail before [48, 62, 63], and have been attributed to quantum path interference in the
population of 1snp Rydberg states. In this case, the high-lying 1snp states can be populated either
directly by the attosecond pulse or indirectly via a three-photon (XUV+NIR+NIR) process
wherein the attosecond pulse initially excites the 1s2p state. In the case of the low-energy
feature, there is no clear “direct” pathway, though the photon energy of this feature does agree
well with an indirect pathway via the 1s3p state (𝐸3𝑝 − 2𝜔𝐿 = 19.68 eV). Past experiments have
indicated that removing either of the two pathways will quench the interference [63], suggesting
that this feature results from another process. In Figure 3-7(b), we remove the possibility of
another “direct” pathway by removing all 1snp states with the exception of 1s3p. We find that
the strong oscillations remain, both above and below the ionization threshold, in spite of the
absence of quantum path interference.
To explain this feature, we propose that the observed interference does not arise from
quantum path interference, but instead results from optical interference. Rather than two
quantum paths, the delay-dependent oscillations stem from the interference between two
coherent optical fields which contain the same photon energy, but which arrive on the detector at
two different times. In particular, the interference feature at 19.68 eV can be understood as the

46
interference between the attosecond pulse transmitted by the medium and the dipole emission of
the dressed atom. For a sufficiently thin target, we have:
휀̃𝑜𝑢𝑡(𝜔) ≈ 휀̃𝑖𝑛(𝜔) (1 + 𝑖2𝜋𝜔
𝑐
�̃�(𝜔)
휀̃𝑖𝑛(𝜔)𝑁𝐿) (3-1)
which yields an intensity spectrum of:
|휀̃𝑜𝑢𝑡(𝜔)|2 ≈ |휀̃𝑖𝑛(𝜔)|2 [1 + |2𝜋𝜔
𝑐
�̃�(𝜔)
휀̃𝑖𝑛(𝜔)𝑁𝐿|
2
−4𝜋𝜔
𝑐ℑ [
�̃�(𝜔)
휀̃𝑖𝑛(𝜔)] 𝑁𝐿] (3-2)
Here, the first term represents the spectrum of the attosecond pulse, the second term is the
intensity spectrum of the polarization field, and the third term represents the interference
between the two. In the figure below, we plot the polarization spectrum intensity (second term),
which is found not to exhibit the sub-cycle oscillations, indicating that this feature arises from
the interference term, which is directly proportional to the absorbance. Interestingly, the
oscillations above 24 eV are also nearly absent, suggesting that the interference oscillations in
the vicinity of the ionization threshold of helium may also not result from pathways involving
the high-lying 1snp Rydberg states, though it is important to note that such intermediate
resonances may enhance the optical interference process and that our calculations neglect the
contributions of continuum states.

47
Figure 3-8 Comparison of “which-way” and optical interference models. (a) In the “which-
way” interference, the final state can be excited both by the attosecond pulse alone
(“direct”) and by the combined attosecond and NIR laser fields (“indirect”). Each of these
excitation pathways induces a time-dependent dipole, 𝑷𝒅𝒊𝒓(𝝎𝟐)
and 𝑷𝒊𝒏𝒅(𝝎𝟐)
respectively, which
both oscillate with the frequency 𝝎𝟐 = 𝑬𝒇 − 𝑬𝟎. Depending on the delay, these two
components may add up constructively or destructively, leading to a modulation of the
measured signal. (b) In the optical interference, there is no state with energy 𝑬𝒇, and
therefore the component of the attosecond spectrum (pale blue shaded) with frequency 𝝎𝟐
does not induce dipole emission on its own. When the NIR laser is present, the state with
energy 𝑬𝒊 forms sidebands resulting in the emission with frequency 𝝎𝟐. This laser-induced
dipole radiation (“emitted”) will interfere with the “transmitted” components of the
attosecond spectrum with frequency 𝝎𝟐, leading to a delay-dependent modulation in the
measured signal. Blue arrows indicate atomic transitions initiated by the attosecond pulse
(with spectrum indicated by the pale blue shaded area), while red arrows indicate
transitions resulting from the NIR pulse. Magenta sinusoidal arrows indicate the dipole
emission with frequency 𝝎𝟐, while the pale blue sinusoidal arrow indicates the transmitted
component of the attosecond spectrum.
The absorption of light is a fundamental process which can be used to initiate chemical
reactions [64] or as a basis for lightwave electronics [65] . Here, we show that a moderately
intense (1011-1013 W/cm2) laser field can control the absorption of light on the attosecond
timescale. When overlapped in space and time with a few-cycle laser field, new features in the
absorption spectrum of an isolated attosecond pulse appear, corresponding to two- and three-
photon excitation to bound states which cannot be populated by the XUV pulse alone. These

48
absorption features can be “gated” on the half- and even quarter-cycle timescale by changing the
delay between the two pulses, allowing for all-optical switching on the attosecond timescale.
3.2 Sub-cycle Electron Dynamics and Quantum Interferences of Attosecond
Transient Absorption of Neon Atoms
In the previous session, we discussed the attosecond transient absorption experiment in
helium atoms which is a relatively simple atom system with few interacting energy levels. For
this reason, the experiments could be interpreted relatively easily, using a three-level atom [5,
66-68] or other model systems [35, 48] to explain most of the features of experiments. For ATA
experiments in bound states of helium atoms, ab initio solutions of the time-dependent
Schrödinger equation (TDSE) have also been obtained [48, 60, 62], which have helped to verify
the existing theory and to illustrate several previously unexplained features. However, helium
atoms have simple energy levels which are solvable with very high precision in principle and
could be treated very well with single-active-electron (SAE) approximation. Therefore, our
current theory needs to be further examined by ATA experiments with more complex atoms
before we can apply it to molecules or condense matter.
In this session, we extended the attosecond transient absorption spectroscopy technique to
a more complex atom system - neon atoms – in which ten electrons are involved in an atom, so
the previous theory for ATA technique based on SAE approximation is highly challenged. Using
neon as the target gas, we observed laser-induced AC Stark shifts and quantum interferences
between different multi-photon excitation pathways, which is similar to those features observed
in helium attosecond transient absorption spectrum. Theoretical calculations from TDSE with
SAE approximation reproduced the experiments result quite well. In addition we confirmed by

49
both experiment and calculation that the quantum interference result from two distinct pathways
of excitation to a final state.
Neon is a more complex noble gas with ground configuration 1s22s22p6, and higher
energy levels with the excitation of one valence electron results configuration of 1s22s22p5nl. Its
energy levels of interest along with measured absorption cross section are shown in the figure
below.
Figure 3-9 Measured absorption cross section of neon atoms (black curve with gray filled
area) and atomic energy levels of interest. The electron configurations are marked for each
identified. Adapted from [63]

50
According to dipole selection rules, single XUV photon absorption by neon atoms will
cause a valence electron transit from ground 2p state to ns or nd bound states or to the
continuum, which can be experimentally measured as absorption cross section, as indicated in
the figure above. When a moderately intense NIR laser field is introduced, as is the case in ATA
experiments, the corresponding energy level splitting and shifting can be directly observed
through changes in the positions and shapes of the absorption features. Furthermore, time-
dependent absorption measurements enable us to resolve in time domain the evolution of atom
energy levels under perturbation of NIR laser field.
The experiment was performed on the attosecond transient absorption setup that was used
for the helium experiment [48]. The target cell was filled with 40 torr of neon gas and ~ 75% of
the spectrum above neon ionization threshold was absorbed. By changing an iris diameter, we
could control the pulse energy of NIR laser pulses as well as the focal spot size. The delay
between the two arms was controlled by a piezo-electric transducer (PZT). A CW green laser
that copropagated in both arms was used to stabilize and control the delay between the two
pulses [28]. The delay stability was locked to within 50 attosecond RMS for the entirety of the
measurement, while the delay step size is 141 as. The carrier-envelope phase was not of
significant importance in our experiments since the generated single attosecond pulses were
synchronized to the dressing NIR pulses [ ].

51
Figure 3-10 Measured delay-dependent absorbance spectra with a dressing laser intensity
of (a) ~10 TW/cm2 and (b) ~75 TW/cm2 (b). Panels (c) and (d) show the calculated
absorption cross sections for dressing laser pulses 4 fs in duration and with the same
intensities as in panels (a) and (b). Adapted from [63]
The measured absorbance spectrum of neon atoms perturbed by 10 TW/cm2 laser pulses
as a function of time delay between pump and probe pulses is shown in the figure above. When
the time delay is negative, where the attosecond pulses arrived at the absorption cell before the
NIR pulses, we can see several absorption lines corresponding to electron transitions from
ground state to certain excited states which are marked in the figure. The spectrum of the single
attosecond pulses is broad, bound states and continuum absorption can be observed
simultaneously. As NIR pulses are adjusted by the delay controlling PZT to be close to the single
attosecond pulse, the energy levels exhibit some interesting features. First of all, the absorption
cross section in the vicinity of 1s22s22p53s state oscillates with half of the NIR cycle – 1.3 fs.

52
Secondly, half cycle oscillation in addition to strongly AC stark shift is observed for higher
excited states near zero delay, as is also observed in helium atoms and explained by Chini et.
al.[48]. Thirdly, light induced structure near 22 eV around zero delay was observed. At last, the
ionization threshold do not show up until positive delay. This is likely because that the higher
excited states of neon atoms can be easily ionized by one NIR photon absorption. To see this
area more clearly, we increased the NIR laser intensity up to 75 TW/cm2, with which one NIR
photon ionization of highly excited states is much stronger. And the XUV spectrometer was
optimized to concentrate on higher excited energy levels near ionization threshold. The delay
dependent absorption spectrum are shown, in which tons of parabolic interference lines are
observed above 21 eV in negative delay. This is previously interpreted as quantum interference
as a result of direct-indirect transition in helium atoms [48].
The theoretical treatment is done with an effective method based on Flouquet theory [].
This part of work is collaborated with Dr. Xiaomin Tong. With this method, the IR-assisted
photoabsorption cross sections can be calculated as:
( ) t t
0
4( ) Im (t)e p gip
p iC dtc
(3-3)
where, (t)C is a generalized autocorrelation function defined as:
0
1(t) (t 0, ) (t, )
T
CT
(3-4)
The wave function (t, ) is obtained from time-dependent Schrodinger equation in
which the Hamiltonian takes the form of 0(t, )) (tH H V . is a time shift which

53
correspoinds to an initial phase 2
T
. (t, ) is obtained using the split-operator method
with the generalized pseudospectral grid in the energy representation for a given (t, )H with the
initial wave function as (t 0, ) d g . The method is equivalent to the time-independent
Floquet method but the details of the Floquet wave function are not explicitly required.
Our calculated photoabsorption cross section for neon atoms as a function of IAP-NIR
delay are shown in Figure 3-10 (c) and (d), corresponding to NIR intensity of 10 TW/cm2 and 75
TW/cm2 respectively. All the predominant features reappear in our calculation. Note that the
calculated energy levels of neon atoms are slightly off their actual position due to limited box
area used in the calculation. However, the behaviors of each energy level are similar to what is
observed in the experiment, such as the half cycle oscillation in 1s22s22p53s state (16.8 eV).
Figure 3-11 Diagram of direct and indirect pathways resulting in quantum interferences in
the (a) 3s and (b) 4p+ absorption lines. Energy levels indicated by black lines are accessible
by one XUV photon absorption, while gray levels are forbidden by selection rules. Dashed
gray energy levels in (b) indicate Floquet-like sidebands of the 4p energy level. Adapted
from [63]

54
There are two distinct pathways for electron to transit for ground state to 3s state. When
IAPs arrived at the absorption cell, one XUV photon absorption resulted in excitation of several
ns and nd states, one of which is 3s. This is termed as direct pathway. There are also some
population in 3d states (20.1 eV) which is about two NIR photon energy higher than 3s state. A
certain delay time 𝜏𝑑 later, came the NIR pulses, which caused the 3d state transit down to 3s
state by emitting two NIR photons. This is the indirect pathway. These two pathways finally lead
to an interference in the absorption cross section. The light induced structure in Figure 3-10 (a)
and (b) near 22 eV is localized around zero delay, since a dark state 4p which cannot be
populated directly by one XUV photon absorption is involved. This process is diagrammed in
Figure 3-12(b). Under moderately intense laser field, 4p state have two Floquet sidebands
located evenly with one NIR photon energy away from 4p. Therefore, except for the direct
pathway by an XUV photon absorption to the 4p+ state (ionization), there exists another indirect
pathway: an XUV photon absorption to 4p- followed by two NIR photon absorption to the finial
4p+ state.

55
Figure 3-12 Measured absorption cross sections in the vicinity of the 3s (black) and 4p+
(gray) absorption lines. The dots indicate the experimentally obtained data points, whereas
the solid lines are smoothed to show the major features. Whereas half-cycle (~1.3 fs)
oscillations can be observed in the 3s absorption lines extending to large negative delays,
oscillations in the 4p+ absorption can only be observed for delays between 0 and -7 fs.
Adapted from [63]
This also leads to interference in absorption cross section which can be seen in Figure
3-12(c) (gray curve). Note that Floquet sidebands exists only if laser is present, so the light
induced structure as well as the corresponding interference shows up only near zero delay.
Previously, the role that a certain state play in ATA experiment can be identified by a test
calculation which dynamically eliminates the state during the time propagation of the TDSE.
Here, we adopted an experimental way to confirm the origin of the interference in the vicinity of
3s state by suppressing the indirect pathway. The aluminum filter used to filter out the IAPs was
replaced with a 200 nm thick indium filter which allows transmission of XUV pulses within the

56
spectrum range from 11 eV to 17 eV. So only the direct pathway for the excitation of 3s state is
feasible, while the indirect way was turned off due to lack of XUV photons to populate electrons
to 3d state. Figure 3-13(a) shows the result ATA cross section, in which no quantum
interferences are observed, and calculated cross section shown in Figure 3-13 (b) is in great
agreement with the experiment result. This is a direct evidence from experiment that the
observed quantum interference come from the coupling between higher excited states (3d) and 3s
state by NIR laser. Instead, we can see a clearly symmetric energy splitting near the IAP-NIR
overlap region. This is called Autler-Town splitting, which is caused by resonance coupling
between 3s and 3d state. Although the population of 3d state initialized by indium filtered IAPs
is zero, the transition from 3s to 3d by absorbing two NIR photons is still possible.
Figure 3-13 Measeaured (a) and calculated (b) delay-dependent absorbance spectrum with
isolated attosecond pulses filtered by indium filter which allows transmission of XUV
pulses within the spectrum range from 11 eV to 17 eV. Autler-Town splitting instead of
quantum interference was observed. Adapted from [63]
In conclusion, we measured the transient absorption of an isolated attosecond pulse by
laser-dressed bound states of neon atoms. Although lots of electrons are involved, the theory

57
treatment based on SAE approximation is still be able to reproduce the experimental result. The
observed sub-cycle changes in the neon absorption spectrum result from both laser-induced AC
Stark shifts and from quantum interferences between different multi-photon excitation pathways.
Light induced structure was also observed and well predicted by our theory. Furthermore, we
saw experimental evidence that the indirect pathway to 3s state via 3d state plays a role in the
quantum interference in the vicinity of 3s state. The presented neon ATA experiment along with
our theory pave the way to extend ATA technique to more complex system.

58
CHAPTER 4 - ATTOSECOND TIME-RESOLVED
AUTOIONIZATION OF ARGON AND KRYPTON ATOMS
Note: Portions of this chapter were used or adapted with permission from the following:
(1) He Wang, Michael Chini, Shouyuan Chen, Chang-Hua Zhang, Feng He, Yan Cheng,
Yi Wu, Uwe Thumm, and Zenghu Chang. Attosecond Time-Resolved Autoionization of Argon.
Phys. Rev. Lett. 105, 143002 (2010)
(2) Michael Chini, Xiaowei Wang, Yan Cheng and Zenghu Chang. Resonance effects
and quantum beats in attosecond transient absorption of helium. Journal of Physics B: Atomic,
Molecular and Optical Physics, 47, 124009 (2014)
(3) Yan Cheng, Michael Chini, Xiao-Min Tong, Andrew Chew, Julius Biedermann, Yi
Wu, Eric Cunningham, and Zenghu Chang. Quantum Beats in Attosecond Transient Absorption
of Krypton Autoionizing States. CLEO: 2015, paper FTh3C.3
The recent advance in the attosecond pulse generation has made the observation of real
time electron dynamics possible. Autoionization in argon and krypton atoms was studied
experimentally by transient absorption spectroscopy with isolated attosecond pulses. The peak
position, line shape and population of the resonant states were modified by intense near infrared
(NIR) laser pulses as the delay between attosecond pulse and NIR laser was scanned.
4.1 Attosecond time resolved autoionization of argon
Fano resonances in the photoabsorption cross sections of atoms are the signature of the
autoionization process, which is governed by electron-electron correlation [46]. In multi-electron
systems, discrete states are embedded in the continuum state under independent particle picture.

59
Because of the configuration interaction, the discrete state is coupled with continuum state and
the Fano peaks in the absorption spectrum are the result of interference between the direction
ionization to the continuum state with the decay from the autoionizing states. Although the
autoionizing states in strong laser field has been theoretically predicted thirty years ago [69], the
synchrotron pulse duration is too long (100 fs to 100 ps) to probe Fano resonances exposed to an
external strong field in the time domain since the autoionzing state of noble gases can be as short
as few femtoseconds. Since the generation of the first isolated attosecond pulses in 2001 [70], it
was theoretically proposed and experimentally demonstrated that time-resolved Fano profiles can
be studied by attosecond streaking technique [71-74]. Here we report results of the transient
absorption experiment on the autoionization process with isolated attosecond pulses in argon
atoms.
The absorption cross-section of autoionization state is usually described by the Fano
formula as:
2
2
1
)()(
qE a
(4-1)
where )2//()( rEE is the reduced energy defined in terms of the resonance energy
rE and the natural width of the resonance. The natural width determined the decay rate of
the resonance through autoionization, which is related with the life time of the autoioinizing
state by / . The q parameter represents the ratio of transition amplitude from ground state
to autoionizing state to the transition amplitude of excitation of continuum.
A diagram of the argon autoionizing states of interest is depicted in the figure below. The
line width of the 3s3p64p state and 3s3p65p state are 80 meV and 28 meV respectively, which

60
correspond to life time of 8.2 fs and 23.5 fs. They are orders of magnitude shorter than
synchrotron pulses, therefore the real time control of autoionization state demands attosecond
pulse as a trigger.
Figure 4-1 Energy diagram of the 3s3p6np 1P autoionizing states in argon. The continuum
spectrum of the attosecond pulse covers the 1P series of states. Adapted from [5].
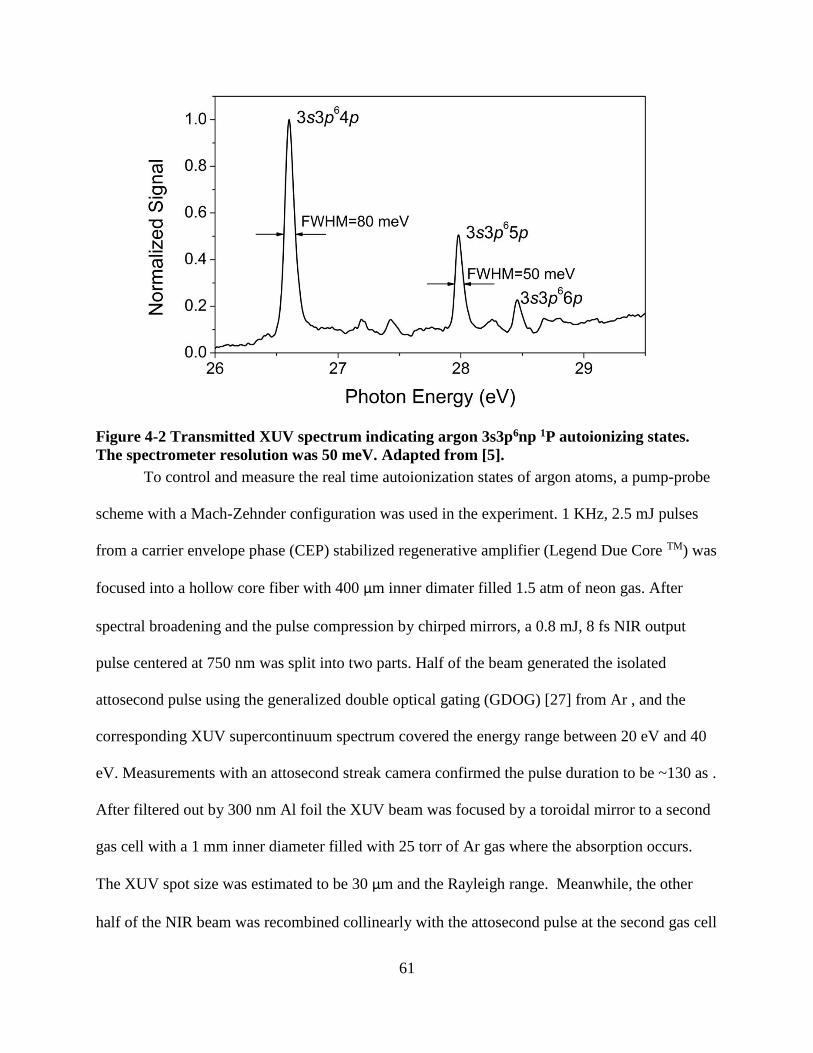
61
Figure 4-2 Transmitted XUV spectrum indicating argon 3s3p6np 1P autoionizing states.
The spectrometer resolution was 50 meV. Adapted from [5].
To control and measure the real time autoionization states of argon atoms, a pump-probe
scheme with a Mach-Zehnder configuration was used in the experiment. 1 KHz, 2.5 mJ pulses
from a carrier envelope phase (CEP) stabilized regenerative amplifier (Legend Due Core TM) was
focused into a hollow core fiber with 400 μm inner dimater filled 1.5 atm of neon gas. After
spectral broadening and the pulse compression by chirped mirrors, a 0.8 mJ, 8 fs NIR output
pulse centered at 750 nm was split into two parts. Half of the beam generated the isolated
attosecond pulse using the generalized double optical gating (GDOG) [27] from Ar , and the
corresponding XUV supercontinuum spectrum covered the energy range between 20 eV and 40
eV. Measurements with an attosecond streak camera confirmed the pulse duration to be ~130 as .
After filtered out by 300 nm Al foil the XUV beam was focused by a toroidal mirror to a second
gas cell with a 1 mm inner diameter filled with 25 torr of Ar gas where the absorption occurs.
The XUV spot size was estimated to be 30 μm and the Rayleigh range. Meanwhile, the other
half of the NIR beam was recombined collinearly with the attosecond pulse at the second gas cell

62
by a hole-drilled mirror which reflected the NIR and allowed the XUV to pass, a lens with f=400
mm was used to focused the NIR, and it spatially and temporally overlaps with the XUV focal
spot at the second cell. Delay between the NIR and XUV pulses was introduced by a piezo-
electric transducer. A CW green laser was co-propagated in both arms of the interferometer to
stabilize and control the delay between the NIR and XUV pulses with 22 as precision [28]. The
transmitted XUV spectrum was refocused by a spherical mirror at 2 degree grazing incidence
angle and dispersed by a transmission grating (2000 lines/mm). The MCP phosphor stack was
used to capture the image XUV spectrum. The spectrometer resolution was measured to be 50
meV with the reference of 3s3p65p state, which is smaller than the width of the 3s4p64p
resonance peak.
The figure below shows the experimental results. In the plot, negative delay corresponds
to the situation where the XUV pulses arrive on the argon target before the NIR pulses. Three
resonance peaks 3s3p64p, 3s3p65p, and 3s3p66p can be identified. As the time delay approaches
zero, the NIR pulse gradually shifts the positions of the first two resonance peaks to higher
photon energy.

63
Figure 4-3 Transmitted attosecond XUV spectra of argon in a strong NIR laser field with a
peak intensity of (a) 5×10¹¹ W/cm2 and (b) 1012 W/cm2. Negative delays correspond to the
attosecond pulse arriving on the target before the NIR laser pulse. The resonance peaks are
shifted, broadened, and weakened when the two pulses overlap. (c), (d) Transmitted signal
(solid) near the 3s3p64p and 3s3p65p states for 5×10¹¹ W/cm2 and 1012 W/cm2, respectively,
and calculated exponential decay convoluted with 4.5 fs Gaussian for best fit (dashed).
Adapted from [5].
Figure 4-3 (c) plots the total count of the 3s3p64p peak as function of delay. When the
XUV and NIR are overlapped, the transmission corresponding to the autoionizing state is
minimized, which can be considered as a new type of electromagnetic induced transparency that
occurs on a femtosecond time scale. This phenomenon can be understood as multiphoton
ionization of the resonance state (3s3p64p 26.61 eV), which has a binding energy of less than 3
eV, by the NIR laser pulse. The NIR intensity is estimated to be ~1013 W/cm2 at the second gas
cell, which is more than sufficient for the depletion of the population of the excited state through

64
multiphoton ionization. At ~1012 W/cm, we found the depletion of the resonance states to be
weaker. When a portion of an excited state population is depleted, the contribution from the
autoionization to the Fano interference is smaller, which leads to a weaker Fano peak.
Figure 4-4 (a) Schematic representation of argon autoionizing states exposed to the strong
NIR laser field. The blue arrows indicate the attosecond XUV excitation of the ground state
to the 3s3p6np 1P states as well as to the Ar+ (3s23p5εl) continuum. The red arrows indicate
the NIR laser coupling between the autoionizing states and the Ar*+ (3s3p6εl) continuum or
to 3s3p6nl autoionizing states. The configuration interaction (green arrows) couples all
autoionizing states to the Ar+ continuum. (b) Autoionization decay modified by NIR laser-
induced coupling to the Ar*+ (3s3p6εl) continuum. Ionization by the NIR field truncates the
autoionization decay, resulting in a shorter lifetime and a broader, shifted resonance peak.
(c) Autoionization decay modified by NIR laser-induced coupling to 3s3p6nl autoionizing
states. Rabi oscillation between the two states results in AC Stark-like splitting. Adapted
from [5].
We observed several new features in autoionization of argon with attosecond transient
absorption spectroscopy that could not be measured with synchrotron radiation. The capability of
synchronizing an intense 8 fs NIR pulse and a 130 as XUV pulse on an argon gas target allows
us to control the autoionization process with a lifetime of less than 10 fs. It was found that the

65
NIR laser field causes changes to the resonance peak shape and a reduction in the transmission,
and that these features depend strongly on the laser intensity. The shift and broadening of the
Fano resonance peak in the laser field are discovered for the first time to the best of our
knowledge.
In reality, the coupling can be complicated, as additional quasi-bound states (3s3p6nd),
which cannot be observed by the absorption of a single XUV photon, is in the same energy range
as the 3s3p6np 1P manifold of states. However, such states can be accessed by two photon
(XUV+NIR) processes. In particular, the 3s3p64d (28.3 eV) state lies 1.7 eV above the 3s3p64p
state we detect [75], which is approximately equal to the central photon energy of the NIR laser
pulse. When the two states are strongly coupled together in resonance with the NIR photon, Rabi
oscillations and autoionization can result in complicated Fano interference profiles, which
includes the AC Stark shifting and splitting [69, 76]. This NIR-laser induced interference of two
(or more) autoionizing states can dramatically change their uncoupled decay widths. This may
explain the much stronger shift and splitting for the 3s3p64p state as compared to the higher-
lying states. Furthermore, as is shown in the trace of the shift, the strongly shifted 3s3p64p
resonance peak suddenly disappears once the energy approaches 27.7 eV. We tentatively
attribute this to the fact that the continuum energy threshold, which will experience only the
smaller non-resonant AC Stark shift, lies ~1.5 eV above the shifted peak of the 3s3p64p state
indicated near zero delay. The 3s3p64p state can then be coupled to the continuum directly,
speeding up the decay process and resulting in the observed asymmetry of the 3s3p64p state with
respect to zero delay.
Simulations of the argon attosecond transient absorption experiment are performed using
the formalism in Ref.[69, 76]. In this simulation, we ignored the 3s3p65p and 3s3p66p states as

66
well as the Ar*+ (3s3p6εl) continuum state, but preserved the coupling to the Ar+ (3s23p5εl)
continuum via configuration interaction. The simulated delay-dependent spectra are shown in the
figure below for NIR laser intensities of 5×10¹¹ and 1×10¹² W/cm2, respectively. Features
including the asymmetric splitting, broadening, and weakening of the Fano lineshape, are well
reproduced.
Figure 4-5 Simulated dipole radiation spectrum of laser-induced coupling of the 3s3p64p
and 3s3p64d autoionizing states. The XUV laser had a pulse duration of 140 as and
intensity of 1010 W/cm2. The NIR laser had a pulse duration of 8 fs and intensity of (a)
5×10¹¹ W/cm2 and (b) 1012 W/cm2. Adapted from [5].
Compared with the photoelectron measurement in the attosecond streaking experiments,
transient photoabsorption measurements have higher data collection efficiency and better energy
resolution. Attosecond transient absorption is a pure optical measurement, with a much simpler
set-up than an attosecond streak camera. The measurement demonstrates full control of the
autoionization process with attosecond precision.

67
4.2 Quantum Beats in Attosecond Transient Absorption of Krypton
Autoionizing States
In previous photoelectron measurements [56], the quantum beats were attributed to
electrons which were initially excited by the attosecond pulse to different 1snp states, and
subsequently ionized by the dressing laser pulse to the same final state in the continuum. The
quantum beats therefore arise from the field-free evolution of the excited state wavepacket in the
time interval between the two pulses. In the case of attosecond transient absorption, however, the
final state is typically a bound state, and so the conditions for observing the quantum beating are
somewhat different. Rather than observing the quantum beats in the absorption spectrum above
the ionization threshold, we expect that the wavepacket motion may be imprinted as a slow
variation on the absorption in the vicinity of the excited state energy levels. Here, we propose a
mechanism by which the quantum beating of the 1s4p and higher-lying states can be observed in
the transient absorption in the vicinity of the 1s2p absorption line. Because the bandwidth of the
dressing infrared laser is large, the 1s4p and higher-lying states can be coupled to the 1s2p state
through the emission of two photons within the spectrum of state-of-the-art few-cycle
Ti:Sapphire lasers. For example, population initially excited to the 1s5p and 1s6p states can be
transferred to the 1s2p state via stimulated emission of two 876 and 829 nm photons,
respectively. In Figure 4-6, we simulate the attosecond transient absorption of the 1s2p state
coupled to the 1s5p and 1s6p states. For simplicity, only the 2p, 3s, 5p, and 6p energy levels
were included in the calculation. Figure 4-6 (a) shows the attosecond transient absorption
spectrogram, which exhibits relatively slow oscillations with a superimposed half-cycle
modulation. To guide the eye, we have also plotted a sinusoidal oscillation with a period equal to
the quantum beat period of the 1s5p and 1s6p states, 𝑇5𝑝,6𝑝 = 2𝜋 |𝐸6𝑝 − 𝐸5𝑝|⁄ =25.83 fs, which

68
is in good agreement with the slow oscillations on the high-energy side of the 1s2p resonance. In
Figure 4-6 (b) we have integrated the absorbance spectrum within a small energy window (21.25
to 21.28 eV) just above the 1s2p resonance, and find that the quantum beat results in a strong
modulation of the absorption in the vicinity of the 1s2p energy level.
Figure 4-6 Quantum beats in the delay-dependent absorption near the 1s2p excited state
with a reduced excited state basis set consisting of the 1s2p, 1s3s, 1s5p, and 1s6p states.
Relatively slow oscillations are present on the high-energy side of the 1s2p absorption line
in (a) with periodicity equal to that of the quantum beating of the 1s5p and 1s6p state
(white curve). The integrated absorbance from 21.25 to 21.28 eV in (b) clearly shows the
quantum beat effect with a periodicity of 25.83 fs. Adapted from [77].
Such slow oscillations are clearly present in previous transient absorption measurements,
but unambiguous identification of the quantum beats will require measurements over a much
larger range of negative delays. Because clear observation of the quantum beat requires sufficient

69
population to be transferred from the 1s5p and 1s6p states to the 1s2p state, in these calculations
we have intentionally modified the attosecond pulse spectrum, so that the spectrum in the
vicinity of the 1s5p and 1s6p states is ~10 times stronger than in the vicinity of the 1s2p state.
Such modifications can be achieved experimentally by using suitable foil filters [63], as has
previously been demonstrated in attosecond transient absorption, or by using multilayer XUV
mirrors.
Figure 4-7 Fourier transform analysis of the quantum beats in the vicinity of the 1s2p
excited state. (a) For the reduced basis set, the dominant quantum beat arises from the
1s5p and 1s6p states. (b) When the full 16-state basis set is used, additional beat frequencies
corresponding to each of the 1snp energy level differences ∆𝐄𝐧′𝐩,𝐧𝐩 = 𝐄𝐧′𝐩 − 𝐄𝐧𝐩 can be
observed. Adapted from [77].

70
Quantum beats occurs when two quantum paths that leads to the same final states have a
phase difference, and this phase difference gives rise to periodic beating structures. Recently we
proposed that quantum beats can be observed in attosecond transient absorption experiments in
the bound states. For example, in heium atoms, electrons in the 1s2 ground state can be excited to
1s2p, 5p, 6p states, in addition, 5p and 6p states can be coupled to the 1s2p state by emitting two
NIR photons. We calculated the attosecond transient absorption spectrum in the 1s2p state, and
found that the absorbance shows a slow variation structure, with a period of around 26 fs, which
corresponds to the energy difference of the 1s5p and 1s6p states. In our experiment, quantum
beats can be observed in a series of krypton autoionizing states. This is the krypton autoionizing
states absorption cross section in the range from 14 to 14.7 eV, which is slightly higher than the
ionization threshold, and this allows these autoionizing states be coupled to bound excited states
by one or more photons.
Figure 4-8 The atomic absorption cross section of krypton vs wavelength. Adapted from
[78]

71
In the experiment, the output of a home-built femtosecond Ti:Sapphire laser was sent into
a neon-filled hollow core fiber and a set of chirped mirrors. The pulse was split into a high-
harmonic generation arm and a near infrared (NIR) arm by using a broadband beam splitter. In
the high-harmonic generation arm, isolated attosecond pulses were generated using the double
optical gating technique [27]. The vacuum ultraviolet (VUV) continuum was filtered using a 200
nm thick indium filter, and the spectra spans from below 12 eV to more than 17 eV.
In the attosecond transient absorption experiment, both the single attosecond pulse and
the NIR laser pulse were focused into a 2 mm inner diameter krypton-filled gas cell, in which the
absorption occurred. The time delay between the two pulses was varied by a piezoelectric
transducer (PZT) stage. The transmitted VUV spectra was recorded as a function of the time
delay in a VUV spectrometer composed of a flat-field grating and a MCP/phosphor detector.
Figure 4-9 The attosecond pulse spectrum with a 200 nm thick indium filter.

72
The figure above shows the spectrum of the attosecond pulse generated using the
generalized double optical gating technique, it covers from 11 eV to 18 eV, the blue curve is the
transmission curve for a 200 nm thick indium foil filter. The krypton ionization energy is 14.0
eV, the XUV spectrum covers both excited bound states and the autoionizing states, and this is
essential for this experiment in order to observe quantum beats in the autoionizing states.
The figure below shows the measured transmitted attosecond VUV spectra of krypton as
a function of the time delay between the isolated attosecond pulse and a NIR pulse with a peak
intensity of 5×10¹² W/cm2. Negative delay indicates that the isolated attosecond pulse arrives
at the target before the NIR pulse. The attosecond pulse launches electronic wave packets
composed of multiple bound excited states and spin-orbit coupling induced autoionzation states
of krypton atoms. Absorption lines corresponding to the 4s24p5nd excited states change
dramatically near zero time delay and in the negative delay region. In addition to the shifting and
splitting of the energy levels in the negative delay region, quantum beats with a period of ~7 fs
are observed in the 5d- light-induced intermediate state [48].

73
Figure 4-10 The measured transmitted attosecond VUV spectra of krypton as a function of
the time delay between the isolated attosecond pulse and a NIR pulse with a peak intensity
of 5x10¹² W/cm2. Adapted from [79].
Here we replot this region in a different color scale so that we can see these features more
clearly. This absorption lines correspond to 6d, 7d, 8d, and 9d autoionizing states. The oscillation
period for these three states are 9.8 fs, 6.3 fs and 5.2 fs respectively. Furthermore, six
autoionization lines are observed in the 14 – 15 eV region, as shown in the figure below.
Recurrences are observed in the 4s24p5(2P°1/2)6d, 4s24p5(2P°1/2)7d, 4s24p5(2P°1/2)8d states with
periods of 9.8 fs, 6.3 fs, 5.2 fs, respectively. Recurrences cannot be observed clearly in
4s24p5(2P°1/2)9d, 4s24p5(2P°1/2)10d, 4s24p5(2P°1/2)11d since the absorption features are not strong
enough in the data. The quantum beats are attributed to electrons coupled by the dressing NIR
laser pulse to the same final state after being initially excited by the attosecond pulse to different
4s24p5(2P°1/2)nd autoionizing states. The beating itself arises from the field-free evolution of the
wave packet in the time interval between the two pulses, with the wave packet motion imprinted
as a slow variation in the absorption of the autoionizing states [5]. The relative phase among

74
these states can be retrieved from such measurement, thus allows the reconstruction of the
valence state wave packet.
Figure 4-11 The measured transmitted attosecond VUV spectra of krypton as a function of
the time delay between the isolated attosecond pulse and a NIR pulse in the energy range of
14 – 15 eV with a peak intensity of 5×10¹² W/cm2. Adapted from [79].
This is the Fourier transform analysis of this region, this part clearly shows that these
autoionizing states are coupled to bound excited states.

75
Figure 4-12 the Fourier transform analysis of the measured time dependent transmitted
attosecond VUV spectra of krypton
So following this analysis, we proposed a simplified model calculation which includes
the ground state, the 5p and 7d state and three autoionizing states. These four states can be
coupled from the ground state by absorbing one xuv pulse, and these states can be coupled to the
5p state by one NIR photon. Because of these couplings, we expect to see quantum beating
structures in these states.

76
Figure 4-13 The simplified model calculation that includes the ground state, the 5p and 7d
state and three autoionizing states.
And this is the calculation result, these autoionizing states shows clearly oscillation
structures with periods of 10, 6, 5 fs, which is very close to the experimental results. In addition,
these quantum beat measurements allows us to retrieve the quantum phase of these states thus
allows the reconstruction of the valence electron wave packet, this part of work is still
preliminary.

77
Figure 4-14 The calculated transmitted attosecond VUV spectra of krypton as a function of
the time delay between the isolated attosecond pulse and a NIR pulse in the energy range of
14 – 15 eV
In conclusion, we measured the transient absorption of a single attosecond pulse in
krypton bound states and autoionizing states by synchronizing a single attosecond pulse with a
few-cycle NIR laser field. Other than the shifting and splitting of the bound state energy levels,
quantum beats with periods of 9.8 fs, 6.3 fs and 5.2 fs are observed for the 4s24p5(2P°1/2)6d,
4s24p5(2P°1/2)7d, and 4s24p5(2P°1/2)8d autoionizing states respectively. Such measurement allows
the reconstruction of the valence state wave packet.

78
CHAPTER 5 - COHERENT PHASE-MATCHED VUV
GENERATION BY BELOW THRESHOLD HARMONIC
GENERATION
Note: Portions of this chapter were used or adapted with permission from the following:
Michael Chini, Xiaowei Wang, Yan Cheng, He Wang, Yi Wu, Eric Cunningham, Peng-
Cheng Li, John Heslar, Dmitry A. Telnov, Shih-I Chu & Zenghu Chang. Coherent phase-
matched VUV generation by field-controlled bound states. Nature Photonics 8, 437–441 (2014)
Currently high order harmonics and attosecond pulses are usually generated with 10 Hz
to 1 kHz repetition rate, high harmonics generated with megahertz repetition rates are very
desirable for experiments such as coincidence measurements and photoemission spectroscopy.
The generation of high-order harmonics [80] and attosecond pulses [81] at megahertz (MHz)
repetition rates allows for the extension of frequency metrology techniques [82] to the vacuum
ultraviolet (VUV) and soft x-ray spectral regions and to attosecond timescales. Ideally, such
processes could be driven directly by plasmon field enhancement of laser pulses from a
femtosecond oscillator [83, 84], but recently people found that the below-threshold harmonics
generation is actually governed by incoherent atomic line emission [85] due to poor phase
matching. Here, we demonstrate below-threshold harmonics generation in a new regime, in
which the phase matching of short trajectory harmonics is enabled only near resonant structures
of the atomic target. The generated coherent VUV line emission exhibits narrow spectral
linewidths with low divergence and phase-matched growth with increasing target density, and
requires intensities on the order of 1013 W/cm2, which can be achieved through tight focusing of
few-cycle femtosecond pulses with sub-microJoule energy.

79
5.1 Below Threshold Harmonic Generation
Recent work in high-order harmonics generation (HHG) at high repetition rates [80, 83]
has focused on the so-called below-threshold harmonics, with photon energies below the target
ionization potential. Such harmonics are critical to the extension of attosecond science to MHz
repetition rates and to the development of HHG sources with high average power, since they can
be generated with relatively low driving laser intensities (~1013 W/cm2). However, little is
known about the mechanism behind the generation of below-threshold harmonics. Although non-
perturbative below-threshold harmonics generation is incompatible with the semiclassical three-
step model of HHG [8], recent experimental work [80, 86-88] indicates that below-threshold
harmonics can arise from a recollision process, and theoretical models extending the three-step
model to account for negative-energy electron recollisions have been proposed [88, 89].
Such semi-classical treatments of the HHG process minimize the effects of the target
atom structure on the high-order harmonic spectrum. However, this approach which may not be
valid for the generation of below-threshold harmonics, where resonance-enhancement of high-
order harmonics has been observed for moderate driving laser intensities [90-92]. Here, we
uncover a novel regime of below threshold harmonics generation accompanied with coherent
VUV line emission. The line emission is generated from moderately intense few-cycle driving
laser pulses, wherein the VUV generation is enhanced in the vicinity of dipole-allowed single-
photon transitions. In contrast to the incoherent atomic line emission observed in HHG with high
laser intensities [93] or with plasmonic enhancement [85] , the narrow-linewidth VUV emission
is spatially coherent and exhibits phase-matched growth. Our results, supported by numerical
simulations under identical experimental conditions, suggest that the atomic resonances enhance
not only the single-atom emission, but also the coherent build-up of fully phase-matched below-
threshold harmonics.

80
In the experiment, below-threshold high-order harmonics were generated from argon gas
in a loose focusing geometry, and the VUV spectrum was measured using a flat-field grating
spectrometer [29]. The high harmonic generation was driven with few-cycle (τ = 5 fs, λ = 730
nm) near infrared (NIR) laser pulses with moderate intensities (~1013 – 1014 W/cm2) sufficient to
generate high-order harmonics, but not so high as to destroy the atomic resonances. In the
language of strong-field laser physics, such intensities correspond to the border between the
“multi-photon” and “tunneling” regimes of ionization [9, 94]. The use of few-cycle driving lasers
relaxes the constraints on resonance-enhanced HHG in the traditional sense, and multiple
resonances can be observed in the spectrally-resolved HHG signal.
Figure 5-1 Measured harmonic spectrum with an intensity of (3.3±0.3)×1013 W/cm2 and a
target pressure-length product of 10 torr-mm. The spectrum is characterized by coherent

81
line emissions (e.g.; RESs A and B) consistent with the labelled 3p63p5ns and 3p5nd
resonances of argon (indicated by vertical white lines) in addition to the broadband high
harmonics (e.g.; the 11th harmonic, H11). Adapted from [95].
The figure above shows the spectrally- and spatially-resolved HHG signal in the vicinity
of the 9th and 11th harmonics with a driving laser intensity of (3.3±0.3)×1013 W/cm2 and a target
pressure-length product of 10 torr-mm. Whereas the 11th harmonic is above the argon ionization
threshold (Ip = 15.76 eV), the 9th harmonic spans photon energies both above- and below-
threshold. Below-threshold, the 9th harmonic exhibits narrow-linewidth spectral enhancements in
the vicinity of the atomic resonances. The figure below shows the evolution of these resonance-
enhanced structures as a function of the driving laser intensity within three different regimes. At
relatively low intensities (~1 – 3×10¹³ W/cm2), the resonance-enhanced structures exhibit narrow
linewidth and dominate the high harmonic spectrum. For intensities between ~5 – 8×10¹³ W/cm2,
The above-threshold harmonic emission becomes comparable to the resonance-enhanced
structures, and the linewidths in general become shifted and broadened until no resonances can
be observed at intensities higher than ~1014 W/cm2. The intermediate regime corresponds almost
exactly with the crossover from the multi-photon to the tunneling ionization regime Although the
electronic states corresponding to the various resonance-enhanced structures could not be
determined precisely, the mechanism of resonance enhancement is confirmed by below-
threshold harmonics generation in neon and xenon gases, and by numerical solution of the time-
dependent Schrodinger equation.

82
Figure 5-2 Evolution of the resonance-enhanced structures with driving laser intensity. At
low intensities (top), the resonance-enhanced structures dominate the spectrum, whereas
the harmonics dominate at higher intensities (bottom). Adapted from [95].
The figure below shows the below threshold harmonic generation for xenon, argon and
neon gas. The ionization threshold for xenon, argon and neon is 12.12 eV, 15.76 eV and 21.56
eV respectively. We can see that the xenon spectrum consists of only relatively broad harmonic
orders, whereas the argon and neon spectra exhibit coherent line emission in the vicinity of their
respective bound excited states, up to the ionization thresholds. By comparing the harmonic
spectra of argon with those from neon and xenon, we confirm that the coherent resonance-
enhanced structures (RESs) coincide in photon energy with the atomic resonance manifolds of
these gases.

83
Figure 5-3 Argon and neon exhibit resonance-enhanced structures in the below-threshold
harmonics generation, whereas the harmonics generated in xenon are structureless above
the ionization threshold. Bound state resonances within the photon energy ranges of
interest are indicated. Adapted from [95].
5.2 Coherent VUV Emission
Although spectrally similar to atomic line emission, the observed resonance-enhanced
structures are emitted in a laser-like beam, with divergence angles similar to the above threshold
harmonics as shown in the figure below. Such a small divergence angle is consistent with
previous measurements of below-threshold harmonics in a tight focusing geometry [80, 87],

84
wherein multiple divergence angles were attributed to quantum trajectories with different
intensity-dependent phases. Here, the phase matching conditions are chosen to favor the short
trajectories with small intensity-dependent phase, and the more strongly divergent long trajectory
contributions are not observed. Although previous studies have indicated that such short
trajectory contributions cannot be initiated by tunnel ionization [89], we can confirm that the
resonance-enhanced harmonics generation does result from a recollision-like process. In the
figure below, the integrated yield of the resonance-enhanced structures between 15 and 15.8 eV
is compared to that of the above-threshold 11th harmonic for an elliptically polarized driving
laser pulse with the same intensity. The strong ellipticity dependence of both the resonance-
enhanced structures and the above-threshold harmonics is indicative of a recollision-based
generation process, wherein the ionized electron can be driven away from the parent ion by the
elliptically polarized field and preventing recombination [31]. We find that the efficiency of both
the resonance-enhanced structures and the above-threshold harmonic generation drop by one
order of magnitude when the ellipticity is ~0.2, in good agreement with previous measurements
using more intense few-cycle laser pulses [96]. It is worth noting that, although the recollision-
based three-step model is typically applied in the tunneling ionization regime, similar quantum
trajectory analyses can be applied at lower laser intensities [80, 89].

85
Figure 5-4 a, Both the RESs (here, A and B) and the above-threshold harmonics exhibit
narrow divergence angles of ~3 mrad FWHM, indicating laser-like spatial coherence of the
VUV line emission. b, The efficiency of the coherent line emission depends strongly on the
ellipticity of the driving laser, and indicates a sub-cycle generation mechanism. The
ellipticity dependence is much stronger than that expected from recollision (blue solid line),
but is consistent with harmonic generation during tunneling. Adapted from [95].

86
Using the double optical gating technique, we measure the dependence of VUV
generation as a function of the carrier envelope phase of the driving NIR laser pulses. The double
optical gating technique creates a half laser cycle gate (~1.5 fs) with linear polarization. The
intensity within the gate is ~5×10¹³ W/cm2.
Figure 5-5 The RESs exhibit a strong dependence on the carrier-envelope phase when the
VUV generation is confined to a single half-cycle of the driving laser. Adapted from [95].

87
When the driving laser pulse is ~ 5 fs with linear polarization, the carrier envelope phase
dependence is much weaker, as shown in the figure below.
Figure 5-6 The intensity of the RESs located at 14.05 eV (top), 14.80 eV (middle) and 15.30
eV (bottom) exhibits a 2π periodicity under the DOG, whereas much smaller changes are
observed with the CEP for linearly polarized 5 fs pulses. Adapted from [95].
5.3 Phase Matching Mechanisms
Generation of strong sources of high-order harmonics requires that extra attention is paid
to the phase matching of the generation process [97, 98], allowing coherent build-up of the
harmonic photons generated by different atoms in a macroscopic medium. However, near- and

88
below-threshold harmonics can typically not be well phase-matched. Above-threshold, this
results from the strong absorption of the neutral gas, which limits the phase-matched build-up to
relatively low pressures [99]. On the other hand, phase matching of the below-threshold
harmonics, though not well understood, is typically thought to be limited to quantum trajectories
with large intensity-dependent phase. In the figure below, the phase matching of the resonance-
enhanced structures at between 15 and 15.8 eV is compared with that of the 11th harmonic. The
quadratic growth of the high-order harmonic signal as a function of gas pressure characterizes
perfect phase matching, and the harmonic yield is limited by absorption. We observe that, while
the phase matching of the 11th harmonic is limited by re-absorption of the harmonic photons to
pressure-length products of ~20 torr-mm, the resonance-enhanced structures below-threshold can
be perfectly phase matched to much higher pressures – up to nearly 1000 torr-mm, allowing a
relative enhancement of the resonance-enhanced structures over the above-threshold harmonics
by approximately four orders of magnitude. The figure below compares harmonic spectra
calculated from solution of the time-dependent Schrodinger equation for a single atom and for a
macroscopic medium as used in the experiment. By comparing the two spectra, we can see that
the below-threshold phase matching is indeed enhanced near the atomic resonance structures,
while the off-resonance below-threshold harmonics are comparatively weaker after propagation
through the macroscopic medium.

89
Figure 5-7 a, The coherent VUV emission in the vicinity of the RESs scales quadratically
with the target gas pressure-length product, indicating perfect phase-matching. The 11th
harmonic (H11) scales quadratically up to a pressure-length product of only ~20 torr-mm,
due to the strong absorption cross-section of the neutral gas for photon energies just above
the ionization threshold. Calibrated energy measurements of the RESs are indicated by
open gray stars. b, Numerical simulation of the VUV emission in argon indicates that the
phase-matching process results in spectrally narrow, energy-shifted RESs when compared
with the single-atom emission. The shift of the phase-matched RESs relative to the bound
state energies is indicated in the inset. Adapted from [95].

90
The on-axis phase matching of the resonance-enhanced structures can be understood by
considering the propagation of both the NIR driving laser and the generated VUV light through
the medium. Perfect phase matching requires that the phase accumulated in the wave propagation
is the same for both the NIR and VUV. For a Gaussian beam, the phase mismatch of the qth
harmonic is given by:
zkzzqzz
IqR
R
arctan1
2
0 (5-1)
where the three terms describe the intensity-dependent dipole phase, the Gouy phase, and
the chromatic dispersion of the ionizing medium [10]. The proportional coefficient is
different for long and short quantum trajectories, and Rz is the Rayleigh length of the focused
beam. Phase matching is optimal when does not vary much with the propagation coordinate
z . In the absence of strong ionization, qk is often assumed to be approximately equal to zero
for harmonics with photon energies above the ionization threshold, and short trajectory phase
matching is achieved for a thin target located with the range of Rzz 0 . However, for below-
threshold harmonics from quantum trajectories initiated by multi-photon ionization, is
approximately zero [80, 89, 100] , and the phase mismatch of the Gouy phase cannot be
compensated by that of the dipole phase. On the other hand, the neutral atom phase mismatch
becomes nonzero when the harmonic photon energy lies near an atomic resonance. For the
below-threshold harmonics (again, in the absence of substantial ionization), the neutral atom

91
phase mismatch may dominate for certain photon energies, the neutral atomic medium phase
mismatch can be written as:
Δ𝑘𝑎𝑡(𝜔) ≈2𝜋𝑁𝜔
𝑐∑
𝑓𝑗
𝜔𝑗2 − 𝜔2
𝑗
(5-2)
and the Gouy phase is:
Δ𝑘𝐺(𝑧) ≈ 𝑞1
2𝜋
𝑑
𝑑𝑧tan−1 (
𝑧
𝑧𝑅) (5-2)
where 𝑧 is the on-axis target position relative to the focal point, 𝑧𝑅 is the Rayleigh length,
𝑞 is the harmonic order, 𝑁 is the atomic density, and 𝜔𝑗 and 𝑓𝑗 are the energy and oscillator
strength of the 𝑗th resonance.

92
Figure 5-8 Argon exhibits regions of anomalous dispersion (gray shading) in the vicinity of
the atomic resonances, just above the resonance energies. Adapted from [95].
In the figure above, we plot the contributions of the Gouy phase shift and the near-
resonance neutral atom dispersion to the total phase mismatch for an isolated resonance in the
vicinity of the 9th harmonic under similar conditions to the experiments. Clearly, phase matching
can be achieved only within a narrow spectral range near resonance. From the total phase
mismatch, we find that the resonance-enhanced phase matching condition can be met for
Rzz 0 . In addition, the phase matching conditions depend on the pressure (density) of the
atomic gas and on how close the photon energy is to the resonance energy. For photon energies
𝜔 > 𝜔𝑗, the resonance contribution to ∆𝑘𝑎𝑡 is negative and can compensate the positive Gouy
phase-mismatch, giving ∆𝑘 = ∆𝑘𝑎𝑡 + ∆𝑘𝐺 ≈ 0 under the experimental conditions.

93
Figure 5-9 Since the amount of negative dispersion increases with the pressure, the phase-
matched photon energy moves away from the resonance energy, and the RESs tend to shift
to higher energy with increasing pressure. The dashed red lines represent a cubic spline fit
of the most prominent RES peak energies. Adapted from [95].
As shown in the figure above, the resonance-enhanced structures are observed to shift in
energy when the pressure is increased, indicating that the phase matching process can select the
particular photon energy within the harmonic for perfect phase matching.

94
Figure 5-10 As the target pressure increases, the phase-matching occurs at higher energies
and the RESs are observed to shift in energy. Adapted from [95].
High-order harmonics generated at high repetition rates have already been demonstrated
as a novel source for direct frequency comb spectroscopy [101] and may soon replace 3rd
generation synchrotron sources of high average power VUV light for lensless imaging [102],
photoelectron spectroscopy [103, 104] and nanoscale lithography. Here, we demonstrate a novel
regime of phase-matched below-threshold harmonics generation which is initiated by multi-
photon ionization and requires driving laser intensities on the order of 1013 W/cm2. Such
intensities are already achievable from few-cycle laser oscillators at the nanoJoule level [105],
which may enable phase-matched harmonic generation with MHz repetition rates without the
need for cavity or nanoplasmonic enhancement.

95
CHAPTER 6 - ATTOSECOND TRANSIENT ABSORPTION
SPECTROSCOPY IN HYDROGEN MOLECULES
Attosecond pulses promise to allow new forms of quantum control in which a broadband
isolated attosecond pulse excites a molecular wavepacket consisting of a coherent superposition
of multiple excited electronic states. This electronic excitation will trigger nuclear motion on the
molecular manifold of potential energy surfaces and can result in permanent rearrangement of
the constituent atoms. The ability to steer reaction outcomes by controlling the exciting light
fields will enable attosecond control in photo-induced chemical processes [106, 107]. Here, we
demonstrate attosecond transient absorption spectroscopy as a viable probe of the electronic and
nuclear dynamics initiated in neutral hydrogen molecules by an isolated attosecond vacuum
ultraviolet (VUV) pulse. The technique allows high-resolution and state-resolved measurements
of molecular dynamics without the need for inducing subsequent ionization [108] or
dissociation[109].
Purely electronic processes in atoms and small molecules typically proceed on attosecond
to few-femtosecond timescales, as dictated by the energy level spacings between the ground and
low excited states. In the absence of external degrees of freedom, electronic wavepackets excited
by an isolated attosecond pulse[48, 56, 110] or by strong field ionization [34] exhibit a high
degree of coherence, and can be probed via the photoelectron or transient absorption spectrum.
On the other hand, electronic excitation in molecules leads to subsequent rearrangement –
vibration, rotation, torsion – of the nuclei, on the timescale of femtoseconds to picoseconds,
which can ultimately lead to the breaking of chemical bonds. Recent advances in the generation
of attosecond light pulses [111] and time-resolved spectroscopic techniques have opened the

96
possibility of attosecond photochemistry [106, 107], wherein the initial electronic excitation can
steer a chemical reaction along a particular trajectory.
Bound states are major actors in the quantum dynamics of systems with chemical and
biological interest. Pioneering experiments have demonstrated attosecond control of ionization
[108] and dissociation [109] of hydrogen molecules by detecting the charged reaction products.
However, these techniques only provide indirect information on such dynamics as they require to
pass through an ionization or dissociation step, and detection of only the final product of the
interaction obscures the molecular dynamics. Furthermore, application of coincidence techniques
to large systems, such as chromophores in proteins, will give electron spectra that are too
complicated to be understood. On the other hand, attosecond transient absorption spectroscopy
(ATAS), which is sensitive to the dynamics in individual bound states without the need for
subsequent ionization or dissociation, does not require to disentangle the impossibly complicated
path of strongly interacting electrons through bigger molecules. One can conceivably be able to
monitor the recurrence of the vibronic wave packet created close to a localized chromophore,
even in solution. So far, ATAS has been applied successfully to the study of wave packet motion
[34, 48, 63, 110] and correlated electron dynamics[5, 112] in atoms and condensed matter [113]
with unprecedented high energy resolution and time resolution. With recent developments in
both experimental and theoretical approaches to ATAS, however, it is becoming apparent that
the range of applicability of the technique is much larger than that.
6.1 Excited Vibrational States of Molecular Hydrogen
In this work, we make a major step forward and report for the first time the application of
ATAS to H2 molecules in the VUV energy range with sufficient energy resolution to monitor

97
several vibrational levels and to detect clear evidence of ultrafast recurrences associated with the
vibronic wave packet in the system. The experiments are accompanied by state-of-the-art ab
initio quantum calculations which fully account for both the electronic and nuclear motion in the
presence of the two pulsed fields, and which guide the interpretation of the rich dynamics
through the development of a few-level models which include the minimum number of
electronic states in order to reproduce the most relevant features observed in the experimental
and the fully ab initio results. These results paint a complete picture of the neutral hydrogen
molecule in which attosecond electron excitation triggers nuclear motion evolving on the
manifold of potential energy surfaces. The measurements further suggest ATAS as a viable
technique for extending attosecond science to larger molecules, where coupled electronic and
nuclear dynamics in the bound and quasi-bound state manifold underpin photochemical
processes relevant to solar energy and photocatalysis.
The bound state manifold of molecular hydrogen is plotted in Figure 6-1 a. Absorption
lines corresponding to the B 1Σu+X 1Σg
+ , C 1ΠuX, and D 1ΠuX bands of neutral hydrogen
molecules are imprinted on the attosecond spectrum, as shown in Figure 6-1 b and c.

98
Figure 6-1 Attosecond absorption in neutral hydrogen molecules. a, the bound state
manifold. The electronic and nuclear dynamics are encoded in the transient changes of the
absorption lines with state selectivity. b, Absorption lines corresponding to the B 1Σu+X
1Σg+ , C 1ΠuX, and D 1ΠuX bands of neutral hydrogen molecules can be observed in the
attosecond spectrum. c, The spectral range of the attosecond VUV pulse was selected by
using an indium foil filter .
6.2 Simultaneous Observation of Electron and Nuclear Dynamics in
Hydrogen Molecules
In the experiments, few-cycle (~5 fs) pulses with a central wavelength of 730 nm from a
Ti:Sapphire amplifier with a hollow-core fiber and chirped mirror pulse compressor were
focused using a spherical mirror (f = 500 mm) into a quasi-static gas cell (inner diameter = 1.2
mm) with laser drilled holes placed ~5 mm after the laser focus. Isolated VUV pulses with
spectrum supporting a transform-limited pulse duration of 750 as, which were generated using
the generalized double optical gating technique24 in low-pressure xenon gas (typically 1-5 mbar),
and synchronized few-cycle NIR laser pulses with a variable time delay were combined with a
hole-drilled mirror and focused together into a second quasi-static gas cell (inner diameter = 1.5

99
mm) filled with ~20 mbar of H2 gas. The peak intensity of the NIR laser was ~5×10¹² W/cm2.
The spectral range of the attosecond pulses was selected using an indium foil filter placed after
the first gas cell with transmission extending from ~12-17 eV, which overlaps with the excited
state manifold of neutral H2 . After passing through the gas cell, the VUV spectrum was
dispersed using a flat-field grazing-incidence spectrometer [114] with a spectral resolution of
~40 meV at 15 eV. The delay was scanned using a mirror mounted on a piezoelectric stage and
was actively stabilized to an error of ~25 attoseconds RMS [28] during the experiments. Details
of the experimental setup can be found in previous publications [5, 48, 114].
The figure below depicts the measured delay-dependent absorbance of the H2 target in
the vicinity of the bound state manifold. Electronic and nuclear dynamics of the target are
revealed through the dependence of the molecular absorption spectrum on the time delay
between the isolated attosecond pulse and a few-cycle near infrared (NIR) pulse, where negative
(positive) time delays indicate that the attosecond pulse arrives on the target before (after) the
peak of the NIR laser envelope. The ATA spectrum is characterized by dense bands of
absorption lines, corresponding primarily to the excitation of the B 1Σu+X 1Σg
+, C 1ΠuX, and
D 1ΠuX bands [115] which have large absorption cross section [116].

100
Figure 6-2 Experimentally measured time delay-dependent absorbance spectrum of
hydrogen molecules. In the 𝑩𝟏𝜮𝒖 state, absorption lines show fast oscillations with half the
laser cycle period, while absorption line splitting and shifting are observed in 𝑪𝟏𝜫𝒖 and
𝑫𝟏𝜫𝒖 states, such features are attributed to electronic dynamics. These features revive as
slow variations on the time scale of nuclear vibration. By performing the attosecond
transient absorption experiment in hydrogen molecules, both the electronic and nuclear
dynamics can be observed simultaneously.
When the attosecond pulse arrives on the target first, the ATA spectrum reveals delay-
dependent changes in the absorption line energies, shapes, and strengths. In general, these
dynamics can be attributed to a process wherein the attosecond pulse induces a time-dependent
dipole response in the molecular target, which is interrupted by the NIR field [117]. The
mechanism of the laser perturbation can be further classified by scrutinizing the absorption
dynamics within a particular excited state absorption line: resonant processes involving coupling

101
of neighboring states through the absorption or emission of one NIR photon typically result in
relatively slowly varying spectral features such as absorption line splitting (analogous to Autler-
Townes splitting [118]) and the formation of light-induced structures [110], whereas nonresonant
couplings involving two or more NIR photons result in fast oscillations with periodicity shorter
than the dressing laser optical cycle [48]. These features reveal information about the field-free
evolution of the electron wavepacket in the interval between the two pulses [56, 77], and are also
ubiquitous features in both the experimental and calculated H2 ATA spectra. On the other hand,
the molecular dipole can also be perturbed by the nuclear dynamics. Under the adiabatic
approximation, the electronic response to the nuclear motion is instantaneous, such that the time-
dependent dipole is further modulated on the timescale of the nuclear vibrations. This
modulation can be observed in ATAS as relatively slow oscillations on the timescale of the
nuclear vibration, which are the focus of the current study. For the data in the figure above, we
identify four distinct regions in which the nuclear motion within a particular electronic state can
be discerned from the experiment, corresponding approximately to the BX (11.0-12.5 eV),
CX (13.0-14.0 eV), and DX (14.0-15.0 eV) transitions of neutral H2, as well as to transitions
in the vicinity of the 2Σg+ 1sσg and 2pσu states of H2
+ (17.5-19.0 eV). In each of these regions,
periodic recurrences of the absorption line dynamics (splitting, shifting, and modulation) are
observed to revive periodically, with periodicity approximately equal to the full vibrational
period of the associated state. These structures correspond to vibrational revivals in the
wavepacket motion, and indicate the state-resolved observation of wavepacket dynamics
evolving on multiple distinct potential energy surfaces. The ability to differentiate these
signatures of the electronic and nuclear dynamics in individual excited states suggests the power
of ATAS to resolve multi-scale dynamics in more complex systems.

102
6.3 Theoretical Simulation of Attosecond Transient Absorption Spectroscopy
of Molecular Hydrogen
The theory part of this work is in collaboration with Dr. Alberto González-Castrillo, Dr.
Alicia Palacios, Dr. Luca Argenti and Dr. Fernando Martín.
The quantum calculations can be used to provide valuable insight into the ATAS
measurements by identifying the primary coupling pathways for each electronic state. This
allows for the development of model systems including only a few molecular states, for which
the transient absorption spectrum can be calculated for arbitrarily long delays while fully
accounting for the nuclear motion. Two such model calculations, in which the basis has been
restricted to the ground X 1Σg+ state and either (i) the excited B 1Σu
+ and E, F 1Σg+ bound states or
(ii) the excited C 1Πu and J 1Δg bound states, are shown in Figure 6-3 f and d, respectively. In
both cases, only bound vibrational states were included, so that the calculation could be extended
to very long times. The first model is appropriate for molecules parallel to the polarization
direction and can be compared to the transient absorption in the vicinity of the BX transition,
while the second model is appropriate for molecules perpendicular to the polarization direction
and can be compared to the transient absorption in the vicinity of the CX transition. The
observed absorption line dynamics follow the vibrational periods of the coupled excited states.

103
Figure 6-3 ATAS reveals state-resolved electronic and nuclear dynamics. a, the measured
delay dependent absorption spectrum of hydrogen molecules near delay zero. b, the ab initio
quantum simulations. c and d are the measured and simulated delay dependent absorption
spectrum in the vicinity of C 1Πu states, e and f are the measured and simulated delay
dependent absorption spectrum near B 1Σu+ states. Model calculations including only the X
1Σg+ ground state and d, the C 1Πu and J 1Δg and f, B 1Σu
+ and GK 1Σu+ excited states, reveal
the mechanism behind the state-resolved absorption features.
The time-dependent Schrödinger equation (TDSE) was solved by expanding the time-
dependent wave function in a large basis of Born-Oppenheimer (BO) molecular states, which
were obtained by diagonalization of the electronic and nuclear Hamiltonians of H2 in a box of 60
a.u. and 12 a.u., respectively (see Refs. [119, 120]). The method includes all electronic and
vibrational (dissociative) degrees of freedom and, therefore, accounts for electron correlation and
the nuclear motion. The BO basis includes the six lowest bound states and a set of discretized
continuum states for each of the following symmetries: 1Σg+, 1Σu
+, 1Πg, 1Πu, and 1Δg. All bound-
bound and bound-continuum dipole couplings have been included. In the simulation we have

104
used a VUV pulse of central frequency 15 eV, duration at half maximum 400 as, and intensity
1010 W/cm2, and an IR pulse of, respectively, 1.7 eV, 4 fs, and 2×10¹² W/cm2. Both pulses have a
sine-squared envelope and carrier-envelope phase of 0°. Due to the finite size of the boxes used
in the evaluation of the wave function, time integration could only be performed up to 22 fs,
which limits our calculations to time delays from -20 to +20 fs. From the calculated time-
dependent wave function, the expectation value of the canonical momentum has been obtained as
a function of time. It has then been extrapolated analytically to arbitrarily large times beyond the
end of the pulses and its Fourier transform numerically evaluated. The ATAS results from the
imaginary part of the ratio between the momentum and vector potential Fourier transforms30.
To further study the recurrence effect of the absorption line dynamics, we developed a
simple model in which the time dependent wave function resulting from irradiating the molecule
with the XUV and IR pulses at time delay 𝜏 is defined 𝜓(𝑡) = 𝑐𝑔(𝑡)𝜓𝑔(𝑟, 𝑅)𝜒𝜈𝑔(𝑅) +
𝜓Π(𝑟, 𝑅) ∑ 𝑐𝜈,𝜏(𝑡)𝜒𝜈(𝑅)𝜈 and the coupling between the Π𝑢 and Δ𝑔 states due to the IR pulse is
entirely neglected. Using this model, we found that the recurrence effect originates from
quantum beats between laser-perturbed vibrational states. This is confirmed by a two-
dimensional (2D) spectral analysis of both the experimental and model data in the vicinity of the
CX transition. Laser quenching of the population of a given excited state results the formation
of spectral sidebands which depend on both energy and delay. The signature of this perturbed
free decay can be observed in the 2D spectra as lines with unity slope, intercepting the spectral
axis at the energy of the unperturbed bound state. We find that the quantum beats observed in the
delay-dependent spectrum appear at the intersection of Fourier lines associated with neighboring
vibrational states, and that these intersections approximately map the periods of the vibrational

105
states in the Π𝑢 electronic state. Consecutive vibrational levels (∆𝑗 = ±1) cross when the Fourier
frequency is equal to half of their energy differences), resulting in the prominent beats observed
in the experiments, and higher-order beats can be observed at larger Fourier frequencies where
laser-perturbed vibrational levels differing by ∆𝑗 = ±2 intersect.

106
Figure 6-4 Fourier transform analysis of measured (a) and simulated (b) delay dependent
absorption spectrum. Quantum beats in the delay dependent absorption spectrum can be
observed as crossings of Fourier lines associated with different laser-perturbed vibrational
states. Consecutive vibrational levels cross when the Fourier frequency is equal to half of
their energy differences (blue stars), while intersections at larger Fourier frequencies
indicate higher-order crossings (red stars).

107
To study the recurrence effect of the absorption line dynamics, we developed a simple
model in which the time dependent wave function resulting from irradiating the molecule with
the XUV and IR pulses at time delay 𝜏 is defined 𝜓(𝑡) = 𝑐𝑔(𝑡)𝜓𝑔(𝑟, 𝑅)𝜒𝜈𝑔(𝑅) +
𝜓Π(𝑟, 𝑅) ∑ 𝑐𝜈,𝜏(𝑡)𝜒𝜈(𝑅)𝜈 , where the expansion coefficients are given by the analytical formula
𝑐𝜈,𝜏(𝑡) = 𝐹(𝜔𝜈) erf [𝑡
𝜎𝑋𝑈𝑉] (1 − erf [
𝜏−𝑡
𝜎𝐼𝑅]) < 𝜒𝜈 |𝜒𝜈𝑔
> exp(−𝑖𝜔𝜈𝑔)) in which 𝐹(𝜔𝜈) is a
normalization factor that accounts for the XUV pulse spectrum and the dipole-transition matrix
element between the ground and the Π𝑢 state so that |𝑐𝑔|2 + ∑ |𝑐𝜈,𝜏|2𝜈 = 1 at all times.
Figure 6-5 Plot of the polarization in the time and energy domain for a single vibrational
state.

108
In this formula, which is only valid when the XUV and IR pulses do not overlap, we are
assuming that the modulus of the 𝑐𝜈 amplitudes increase during a time interval 𝜎𝑋𝑈𝑉, then
remains constant during approximately a time interval 𝜏, and then go to zero again during a time
interval 𝜎𝐼𝑅. So the coupling between the Π𝑢 and Δ𝑔 states due to the IR pulse is entirely
neglected. Under these assumptions, the time dependent dipole is given by 𝑃𝜏(𝑡) =<
𝜓(𝑡)|𝜇|𝜓(𝑡) >, and the ATAS spectrum is simplely proportional to the Fourier transform of
𝑃𝜏(𝑡). The results obtained withthis simple analytic treatment are shown in Figure 6-6 for the
cases of a single 𝜈 = 0 vibrational level, the two vibrational levels 𝜈 = 0 and 𝜈 = 1, and all
vibrational levels in the Π𝑢 state. The corresponding results obtained from the reduced TDSE
calculations in which only the Σ𝑔, Π𝑢 and Δ𝑔 electronic states were included are shown inFigure
6-7. As can be seen, except the region of time delays where the XUV and IR pulse overlap, the
agreement between both sets of calculations is very good.
The Fourier transform of the 𝑐𝜈 amplitude leads to a prominent peak at 𝜔 = 𝜔0,𝜈 , where
𝜔0,𝜈 is the frequency of the vibrational motion in the 𝜈 vibrational state, and satellite peaks,
symmetric with respect to the central frequency 𝜔0,𝜈, whose intensity rapidly decreases as one
moves apart from 𝜔0,𝜈. The position of all maxima are approximately given by the expression
𝜔𝑛,𝜈 = 𝜔0,𝜈 + 𝑛2𝜋
𝜏=
2𝜋
𝑇𝜈+ 𝑛
2𝜋
𝜏 , where n is an integer number associated with the order of the
peak and 𝑇𝜈 is the vibrational period in the 𝜈 vibrational state. As time delay increases, the
satellite peaks approach the central peak. One has a similar expression for every 𝜈, so it is
possible that, for two different vibrational states 𝜈 and 𝜈′ and peak orders n and m, respectively,
one has 𝜔𝑛,𝜈 = 𝜔𝑚,𝜈′. This situation arises quite often when 𝜏 is continuously varied, leading to
crossings in the Fourier lines associated to different vibrational states. The time delays at which
these crossings can occur are given by 𝜏 = 𝑚𝑇𝜈′ − 𝑛𝑇𝜈 . The smallest values of 𝜏 at which the

109
crossings can be visible correspond to orders of 𝑚 = 𝑛 ± 1. For consecutive vibrational levels,
𝑇𝜈′ = 𝑇𝜈 , so that 𝜏 = 𝑇𝜈 . Therefore, the intersections of the Fourier lines approximately map the
periods of the vibrational states in the Π𝑢 electronic state. This is the reason why in the ab initio
ATAS spectra, as well as in its reduced TDSE version, one can see the signatures of the Π𝑢
potential energy curve of H2 as a function of 𝜏. The mapping is periodically reproduced at longer
time delays when the Fourier orders differ by more than 1.

110
Figure 6-6 ATAS spectrum obtained from the analytical model. Upper panel: only the v=0
state is included. Central panel: only v=0 and v=1 states are included. Bottom panel: all v’s
are included. Adapted from [121]

111
Figure 6-7 ATAS spectrum obtained from the reduced TDSE calculations. Upper panel:
only the v=0 state is included. Central panel: only v=0 and v=1 states are included. Bottom
panel: all v’s are included. Adapted from [121]

112
In the region where the XUV and IR pulses overlap, one should see the lines associated
with dressed vibronic states. Indeed, the IR field couples the Π𝑢 and Δ𝑔 states, and due to its
relatively large intensity, should have a non-negligible effect on the position of the
corresponding vibrational states. To prove it, we have diagonalized the Floquet matrix and
plotted the values of the eigenvalues as a function of the IR intensity. Since not all Π𝑢 vibronic
states are equally populated by the XUV pulse, the intensity of the line associated to a given
eigenvalue has been multiplied by the square of the dipole transition amplitude connecting the
initial vibronic state with the Π𝑢 vibronic state and the square of the corresponding Floquet
coefficient. One can see the familiar Autler-Townes splitting, which become more and more
pronounced as the intensity of the IR field increases. One can also see a lot of avoided crossings,
which are due to the proximity of the unperturbed vibronic energies. In order to compare the
results of this figure with those shown in the previous ones, one should take into account that, in
the Floquet picture, the amplitude (i.e., the intensity) of the IR pulse remains constant at all times
and forever, which that of the actual pulse is only different from zero in a finite time interval and
has a sin2 envelope. So, for a meaningful comparison, one should rather use the average value of
the latter intensity, which is roughly four times smaller than the peak intensity.

113
Figure 6-8 Eigenvalues of the Floquet matrix as a function of IR intensity. Adapted from
[121]
For the peak intensity used in our TDSE calculations, 2 × 10¹²𝑊/𝑐𝑚2, which
corresponds to an average intensity of 5 × 10¹¹𝑊/𝑐𝑚2, we are in the vicinity of a series of
avoided crossings. These crossings appear at energies roughly in between two consecutive
vibrational states. As a results, one can expect to observe lines lying in between the energies of
the unperturbed vibrational states. This is precisely what is observed in the region of the ATAS
spectrum where the XUV and IR pulses overlap. At higher or lower intensities, the pattern
should be different.
When longer and more intense pulses are used, one can see the the following figure that
the interval of time delays in which the coupling between the Π𝑢 and Δ𝑔 states shows up is also
longer. In this region, the ATAS spectrum becomes much more complicated than for shorter and
less intense pulses, since pure Fourier transform effects are superimposed to the Autler-Townes
multiple splittings due to the IR-induced coupling between the Π𝑢 and Δ𝑔 states. In the region

114
where the two pulses do not overlap any more, the ATAS spectrum reflects the same Fourier
transform effects as discussed before.
Figure 6-9 ATAS spectrum obtained from the reduced TDSE calculations.The intensity of
the IR pulse is 10 times larger than that of Figure 6-7. Adapted from [121]
We have repeated the calculations by using the chirped pulse shown in the figure below.
We have chosen a large chirp to check if this has any noticeable influence on the results. Notice,
however, that the spectrum of the chirped pulse is nearly identical to the unchirped one, so that
we ensure that the same states are populated with both kinds of pulses.

115
Figure 6-10 Left panel: Chirped and unchirped pulses used in the calculations. Right
panel: Fourier transform of the two pulses. Adapted from [121]
As can be see, the two absorption spectrum are very similar, the effects expected from the
chirp are somewhat hidden in the forest of lines discussed in the previous sections.
Figure 6-11 ATAS spectrum obtained from the reduced TDSE calculations using the
chirped pulses. Adapted from [121]

116
6.4 Quantum Control in Attosecond Spectroscopy
The ATAS of H2 presents an attractive scheme for attosecond quantum control in larger
molecules evolving on multidimensional potential surfaces. Since the initial attosecond
excitation determines the evolution of both the electronic and nuclear dynamics, it should be
possible to shape the initial electronic wavepacket in such a way as to optimize the efficiency of
pre-selected dissociation pathways and reaction products [122]. This can be done either by
shaping the spectral amplitude and phase of the attosecond pulse [123] or by altering the
wavepacket amplitude and phase with the addition of an overlapping control pulse [124]. Here,
we demonstrate a rudimentary form of control by adding a weak, few-cycle NIR control pulse
with intensity of ~1×10¹¹ W/cm2 which overlaps in time with the VUV attosecond pulse. In the
presence of the NIR laser, the dipole selection rules for the VUV pulse are modified and the
attosecond excitation results in a different initial wavepacket. We then probe the ensuing
wavepacket dynamics by repeating the ATAS experiment, with two NIR laser pulses: the weak
control pulse, which is locked in phase to the VUV attosecond pulse, and the strong perturbing
pulse, which arrives at a variable time delay. While this may result in optical interference
between the two NIR fields near zero delay, the wavepacket dynamics can be probed for delays
of -20 fs and longer where the two NIR fields no longer overlap. Compared to the case of
excitation by the VUV pulse alone, the transient absorption spectrum is more strongly modulated
and exhibits oscillations with both half- and full-cycle periodicity. These changes indicate a
substantial modification of the excited wavepacket, and are easily observed in spite of the low
intensity of the control pulse. In the future, such a scheme could be implemented with a tunable
control field or pulse shaping device to exert control in attosecond photochemistry.

117
Figure 6-12 | Quantum control in attosecond photochemistry. A weak, few-cycle NIR
“control” pulse, which overlaps in time with the VUV attosecond pulse, modifies the
attosecond excitation dynamics. The strong modulation of the ATAS indicates the
modification of the initial wavepacket, suggesting a mechanism for attosecond quantum
control.
ATAS has proven valuable to the study of wavepacket dynamics and electron correlation
in excited states of atoms and condensed matter. Here, we demonstrate its applicability to
probing the electronic and nuclear dynamics simultaneously with high temporal and spectra
resolution in hydrogen molecules. Unlike attosecond photoelectron and photoion spectroscopies,
the ATAS measurements are capable of resolving dynamics on multiple potential energy
surfaces with attosecond time resolution and state selectivity, without requiring a subsequent
ionization step. The measurements suggest ATAS as a suitable platform for attosecond
measurement in the first steps of a photochemical reaction.

118
CHAPTER 7 - FINAL REMARKS
In this thesis, I have discussed the probing and controlling of atomic and molecular
dynamics by using the attosecond transient absorption spectroscopy technique. In chapter two, I
presented the fundamental knowledge of how to generated single isolated attosecond pulse,
which is used as the probe in the attosecond transient absorption spectroscopy experiments. In
chapter three, four and six, I reported our progress on utilizing single isolated attosecond pulses
on probing electron dynamics in helium/neon/argon/krypton atoms and probing molecular
dynamics in hydrogen molecules. The target atom/molecule is first pumped into excited states
and then probed by a subsequent attosecond XUV pulse or by an NIR laser pulse. By measuring
the absorbed attosecond XUV pulse spectrum, the ultrafast electron correlation dynamics can be
studied in real time. The quantum processes that can be studied using the attosecond transient
absorption spectroscopy include the AC stark shift, multi-photon absorption, intermediate states
of atoms, autoionizing states, and transitions of vibrational states in molecules. In all
experiments, the absorption changes as a function of the time delay between the attosecond XUV
probe pulse and the dressing NIR laser pulse, on a time scale of sub cycle laser period, which
reveals attosecond electron dynamics.
This is the beginning of studying and controlling electron and nuclear dynamics in atoms
and molecules with attosecond transient absorption spectroscopy. With the development of the
next generation of attosecond sources with micro-Joule pulse energy, attosecond-pump-
attosecond-probe transient absorption experiments will be possible, this will allow us to study the
excitation and control of electron dynamics on the few-attosecond time scale. In addition, the
first application of attosecond transient absorption spectroscopy to the study of laser induced
dynamics in atoms and simple molecules opens the door to the study of complex optical

119
phenomena in large molecules and solid materials, with the ultimate goal of “filming” chemical
reactions and electron transportation.

120
APPENDIX A: LIST OF PUBLICATIONS

121
Peer-Reviewed Journal Publications
1. Y. Cheng, M. Chini, X. Wang, A. González-Castrillo, A. Palacios, L. Argenti, F. Martín,
and Z. Chang, "Probing Electronic and Nuclear Dynamics in Molecules with Attosecond
Transient Absorption," (under submission).
2. M. Chini, X. W. Wang, Y. Cheng, and Z. H. Chang, "Resonance effects and quantum
beats in attosecond transient absorption of helium," J Phys B-at Mol Opt 47 (2014).
3. Q. Zhang, K. Zhao, J. Li, M. Chini, Y. Cheng, Y. Wu, E. Cunningham, and Z. H. Chang,
"Suppression of driving laser in high harmonic generation with a microchannel plate,"
Opt Lett 39, 3670-3673 (2014).
4. M. Chini, X. W. Wang, Y. Cheng, H. Wang, Y. Wu, E. Cunningham, P. C. Li, J. Heslar,
D. A. Telnov, S. I. Chu, and Z. H. Chang, "Coherent phase-matched VUV generation by
field-controlled bound states," Nat Photonics 8, 437-441 (2014).
5. X. W. Wang, M. Chini, Y. Cheng, Y. Wu, X. M. Tong, and Z. H. Chang, "Subcycle laser
control and quantum interferences in attosecond photoabsorption of neon," Phys Rev A
87 (2013).
6. M. Chini, X. W. Wang, Y. Cheng, Y. Wu, D. Zhao, D. A. Telnov, S. I. Chu, and Z. H.
Chang, "Sub-cycle Oscillations in Virtual States Brought to Light," Sci Rep-Uk 3 (2013).
7. X. Wang, M. Chini, Y. Cheng, Y. Wu, and Z. Chang, "In situ calibration of an extreme
ultraviolet spectrometer for attosecond transient absorption experiments," Appl Optics
52, 323-329 (2013).
8. M. Chini, B. Zhao, H. Wang, Y. Cheng, S. Hu, and Z. Chang, "Subcycle ac stark shift of
helium excited states probed with isolated attosecond pulses," Phys Rev Lett 109, 073601
(2012).

122
9. M. Möller, Y. Cheng, S. D. Khan, B. Zhao, K. Zhao, M. Chini, G. G. Paulus, and Z.
Chang, "Dependence of high-order-harmonic-generation yield on driving-laser
ellipticity," Phys Rev A 86, 011401 (2012).
10. S. D. Khan, Y. Cheng, M. Möller, K. Zhao, B. Zhao, M. Chini, G. G. Paulus, and Z.
Chang, "Ellipticity dependence of 400 nm-driven high harmonic generation," Appl Phys
Lett 99, 161106 (2011).
11. H. Wang, M. Chini, S. Y. Chen, C. H. Zhang, F. He, Y. Cheng, Y. Wu, U. Thumm, and
Z. H. Chang, "Attosecond Time-Resolved Autoionization of Argon," Phys Rev Lett 105
(2010).

123
Invited Book Chapters
1. M. Chini, H. Wang, B. Zhao, Y. Cheng, S. Chen, Y. Wu, and Z. Chang, "Attosecond
Absorption Spectroscopy," in Progress in Ultrafast Intense Laser Science(Springer Berlin
Heidelberg, 2013), pp. 135-150.

124
Invited talks
1. Yan Cheng, "Attosecond transient absorption experiments in atoms and molecules ",
OSA Graduate Research Symposium, CREOL, University of Central Florida, 2014,
Orlando, USA

125
Selected Conference Presentations
1. Y. Cheng, M. Chini, X.-M. Tong, A. Chew, J. Biedermann, Y. Wu, E. Cunningham, and
Z. Chang, "Quantum beats in attosecond time-resolved autoionization of krypton,"
Bulletin of the American Physical Society 60 (2015).
2. Y. Cheng, M. Chini, X.-M. Tong, A. Chew, J. Biedermann, Y. Wu, E. Cunningham, and
Z. Chang, "Quantum Beats in Attosecond Transient Absorption of Krypton Autoionizing
States," in CLEO: QELS_Fundamental Science(Optical Society of America, 2015), p.
FTh3C. 3.
3. Y. Cheng, M. Chini, X. Wang, Y. Wu, and Z. Chang, "Attosecond Transient Absorption
in Molecular Hydrogen," in CLEO: QELS_Fundamental Science(Optical Society of
America, 2014), p. FM2B. 3.
4. Y. Cheng, M. Chini, X. Wang, Y. Wang, Y. Wu, and Z. Chang, "Probing molecular
dynamics using attosecond transient absorption," Bulletin of the American Physical
Society 58 (2013).
5. Y. Cheng, M. Chini, X. Wang, Y. Wu, and Z. Chang, "Probing Hydrogen and Deuterium
Molecular Dynamics Using Attosecond Transient Absorption," in Laser Science(Optical
Society of America, 2013), p. LW2H. 2.
6. Y. Cheng, S. D. Khan, B. Zhao, K. Zhao, M. Chini, and Z. Chang, "Broadband high
harmonic generation from 400 nm sub-10 fs driving pulses," in Quantum Electronics and
Laser Science Conference(Optical Society of America, 2012), p. JW4A. 23.
7. Y. Cheng, S. Khan, K. Zhao, B. Zhao, M. Chini, and Z. Chang, "Ellipticity dependence
of high harmonics generated using 400 nm driving lasers," in APS Division of Atomic,
Molecular and Optical Physics Meeting Abstracts(2011), p. 5004.

126
APPENDIX B: COPYRIGHT PERMISSIONS

127

128
129

130

131

132

133

134

135

136
LIST OF REFERENCES
1. P. B. Corkum, and Z. Chang, "The Attosecond Revolution," Opt. Photon. News 19, 24-29
(2008).
2. P. B. Corkum, and F. Krausz, "Attosecond science," Nat Phys 3, 381-387 (2007).
3. M. Dantus, M. J. Rosker, and A. H. Zewail, "Real-Time Femtosecond Probing of
Transition-States in Chemical-Reactions," J Chem Phys 87, 2395-2397 (1987).
4. F. Krausz, and M. Ivanov, "Attosecond physics," Rev Mod Phys 81, 163-234 (2009).
5. H. Wang, M. Chini, S. Y. Chen, C. H. Zhang, F. He, Y. Cheng, Y. Wu, U. Thumm, and
Z. H. Chang, "Attosecond Time-Resolved Autoionization of Argon," Phys Rev Lett 105
(2010).
6. M. Ferray, A. Lhuillier, X. F. Li, L. A. Lompre, G. Mainfray, and C. Manus, "Multiple-
Harmonic Conversion of 1064-Nm Radiation in Rare-Gases," Journal of Physics B-
Atomic Molecular and Optical Physics 21, L31-L35 (1988).
7. C. Lynga, M. B. Gaarde, C. Delfin, M. Bellini, T. W. Hansch, A. L'Huillier, and C. G.
Wahlstrom, "Temporal coherence of high-order harmonics," Phys Rev A 60, 4823-4830
(1999).
8. P. B. Corkum, "Plasma Perspective on Strong-Field Multiphoton Ionization," Physical
Review Letters 71, 1994-1997 (1993).
9. L. V. Keldysh, "Ionization in the Field of a Strong Electromagnetic Wave," Soviet
Physics JETP 20, 1307 (1965).
10. Z. Chang, Fundamentals of Attosecond Optics (2011 by CRC Press).
11. N. Milosevic, A. Scrinzi, and T. Brabec, "Numerical characterization of high harmonic
attosecond pulses," Phys Rev Lett 88 (2002).

137
12. J. Itatani, J. Levesque, D. Zeidler, H. Niikura, H. Pepin, J. C. Kieffer, P. B. Corkum, and
D. M. Villeneuve, "Tomographic imaging of molecular orbitals," Nature 432, 867-871
(2004).
13. D. Shafir, Y. Mairesse, D. M. Villeneuve, P. B. Corkum, and N. Dudovich, "Atomic
wavefunctions probed through strong-field light-matter interaction," Nat Phys 5, 412-416
(2009).
14. O. Smirnova, Y. Mairesse, S. Patchkovskii, N. Dudovich, D. Villeneuve, P. Corkum, and
M. Y. Ivanov, "High harmonic interferometry of multi-electron dynamics in molecules,"
Nature 460, 972-977 (2009).
15. D. Strickland, and G. Mourou, "Compression of Amplified Chirped Optical Pulses," Opt
Commun 56, 219-221 (1985).
16. J. Feng, J. Nasiatka, M. Hertlein, B. Rude, and H. Padmore, "Compact cryogenically
cooled Ti:Sapphire dual multi-kilohertz amplifiers for synchrotron radiation ultra-fast x-
ray applications," Review of Scientific Instruments 84 (2013).
17. M. Nisoli, S. DeSilvestri, O. Svelto, R. Szipocs, K. Ferencz, C. Spielmann, S. Sartania,
and F. Krausz, "Compression of high-energy laser pulses below 5 fs," Opt Lett 22, 522-
524 (1997).
18. R. Szipöcs, K. Ferencz, C. Spielmann, and F. Krausz, "Chirped multilayer coatings for
broadband dispersion control in femtosecond lasers," Opt. Lett. 19, 201-203 (1994).
19. R. W. Boyd, Nonlinear Optics, Third Edition (Academic Press, 2008).
20. S. D. Khan, Y. Cheng, M. Moller, K. Zhao, B. Z. Zhao, M. Chini, G. G. Paulus, and Z. H.
Chang, "Ellipticity dependence of 400 nm-driven high harmonic generation," Appl Phys
Lett 99 (2011).

138
21. M. Moller, Y. Cheng, S. D. Khan, B. Z. Zhao, K. Zhao, M. Chini, G. G. Paulus, and Z. H.
Chang, "Dependence of high-order-harmonic-generation yield on driving-laser
ellipticity," Phys Rev A 86 (2012).
22. B. Shan, S. Ghimire, and Z. Chang, "Generation of the attosecond extreme ultraviolet
supercontinuum by a polarization," J Mod Optic 52, 277-283 (2005).
23. G. Sansone, E. Benedetti, F. Calegari, C. Vozzi, L. Avaldi, R. Flammini, L. Poletto, P.
Villoresi, C. Altucci, R. Velotta, S. Stagira, S. De Silvestri, and M. Nisoli, "Isolated
single-cycle attosecond pulses," Science 314, 443-446 (2006).
24. H. Mashiko, S. Gilbertson, C. Q. Li, S. D. Khan, M. M. Shakya, E. Moon, and Z. H.
Chang, "Double optical gating of high-order harmonic generation with carrier-envelope
phase stabilized lasers," Physical Review Letters 100 (2008).
25. O. S. Yu, M. Kaku, A. Suda, F. Kannari, and K. Midorikawa, "Generation of extreme
ultraviolet continuum radiation driven by a sub-10-fs two-color field," Opt Express 14,
7230-7237 (2006).
26. S. Gibertson, "Double Optical Gating," PhD Dissertation (2010).
27. X. M. Feng, S. Gilbertson, H. Mashiko, H. Wang, S. D. Khan, M. Chini, Y. Wu, K. Zhao,
and Z. H. Chang, "Generation of Isolated Attosecond Pulses with 20 to 28 Femtosecond
Lasers," Phys Rev Lett 103 (2009).
28. M. Chini, H. Mashiko, H. Wang, S. Y. Chen, C. X. Yun, S. Scott, S. Gilbertson, and Z.
H. Chang, "Delay control in attosecond pump-probe experiments," Optics Express 17,
21459-21464 (2009).
139
29. X. W. Wang, M. Chini, Y. Cheng, Y. Wu, and Z. H. Chang, "In situ calibration of an
extreme ultraviolet spectrometer for attosecond transient absorption experiments,"
Applied Optics 52, 323-329 (2013).
30. J. L. Krause, K. J. Schafer, and K. C. Kulander, "High-Order Harmonic-Generation from
Atoms and Ions in the High-Intensity Regime," Phys Rev Lett 68, 3535-3538 (1992).
31. P. B. Corkum, N. H. Burnett, and M. Y. Ivanov, "Subfemtosecond Pulses," Opt Lett 19,
1870-1872 (1994).
32. J. Mauritsson, P. Johnsson, E. Gustafsson, A. L'Huillier, K. J. Schafer, and M. B. Gaarde,
"Attosecond pulse trains generated using two color laser fields," Phys Rev Lett 97
(2006).
33. R. E. F. Silva, P. Riviere, and F. Martin, "Autoionizing decay of H-2 doubly excited
states by using xuv-pump-infrared-probe schemes with trains of attosecond pulses," Phys
Rev A 85 (2012).
34. E. Goulielmakis, Z. H. Loh, A. Wirth, R. Santra, N. Rohringer, V. S. Yakovlev, S.
Zherebtsov, T. Pfeifer, A. M. Azzeer, M. F. Kling, S. R. Leone, and F. Krausz, "Real-
time observation of valence electron motion," Nature 466, 739-U737 (2010).
35. M. Chini, B. Z. Zhao, H. Wang, Y. Cheng, S. X. Hu, and Z. H. Chang, "Subcycle ac
Stark Shift of Helium Excited States Probed with Isolated Attosecond Pulses," Phys Rev
Lett 109 (2012).
36. M. Holler, F. Schapper, L. Gallmann, and U. Keller, "Attosecond Electron Wave-Packet
Interference Observed by Transient Absorption," Phys Rev Lett 106 (2011).

140
37. Z. H. Loh, M. Khalil, R. E. Correa, and S. R. Leone, "A tabletop femtosecond time-
resolved soft x-ray transient absorption spectrometer," Review of Scientific Instruments
79 (2008).
38. M. Fiess, M. Schultze, E. Goulielmakis, B. Dennhardt, J. Gagnon, M. Hofstetter, R.
Kienberger, and F. Krausz, "Versatile apparatus for attosecond metrology and
spectroscopy," Review of Scientific Instruments 81 (2010).
39. W. Schwanda, K. Eidmann, and M. C. Richardson, "Characterization of a Flat-Field
Grazing-Incidence XUV Spectrometer," Journal of X-ray science and technology 4, 8-17
(1993).
40. N. Nakano, H. Kuroda, T. Kita, and T. Harada, "Development of a Flat-Field Grazing-
Incidence Xuv Spectrometer and Its Application in Picosecond Xuv Spectroscopy," Appl
Optics 23, 2386-2392 (1984).
41. B. Blagojevic, E. O. Le Bigot, K. Fahy, A. Aguilar, K. Makonyi, E. Takacs, J. N. Tan, J.
M. Pomeroy, J. H. Burnett, J. D. Gillaspy, and J. R. Roberts, "A high efficiency ultrahigh
vacuum compatible flat field spectrometer for extreme ultraviolet wavelengths," Review
of Scientific Instruments 76 (2005).
42. J. Park, G. V. Brown, M. B. Schneider, H. A. Baldis, P. Beiersdorfer, K. V. Cone, R. L.
Kelley, C. A. Kilbourne, E. W. Magee, M. J. May, and F. S. Porter, "Calibration of a flat
field soft x-ray grating spectrometer for laser produced plasmas," Review of Scientific
Instruments 81 (2010).
43. "www.zemax.com."
44. "www.cxro.lbl.gov."
141
45. R. P. Madden, D. L. Ederer, and K. Codling, "Resonances in the Photo-ionization
Continuum of Ar i (20-150 eV)," Physical Review 177, 136-151 (1969).
46. U. Fano, "Effects of Configuration Interaction on Intensities and Phase Shifts," Physical
Review 124, 1866-1878 (1961).
47. M. Žitnik, A. Stanič, K. Bučar, J. G. Lambourne, F. Penent, R. I. Hall, and P. Lablanquie,
"Lifetimes of n 1 P states in helium," Journal of Physics B: Atomic, Molecular and
Optical Physics 36, 4175 (2003).
48. M. Chini, X. W. Wang, Y. Cheng, Y. Wu, D. Zhao, D. A. Telnov, S. I. Chu, and Z. H.
Chang, "Sub-cycle Oscillations in Virtual States Brought to Light," Sci Rep-Uk 3 (2013).
49. "https://en.wikipedia.org/wiki/Absorbance."
50. D. R. Smith, J. B. Pendry, and M. C. K. Wiltshire, "Metamaterials and negative refractive
index," Science 305, 788-792 (2004).
51. M. Fleischhauer, A. Imamoglu, and J. P. Marangos, "Electromagnetically induced
transparency: Optics in coherent media," Rev Mod Phys 77, 633-673 (2005).
52. F. Hao, Y. Sonnefraud, P. Van Dorpe, S. A. Maier, N. J. Halas, and P. Nordlander,
"Symmetry Breaking in Plasmonic Nanocavities: Subradiant LSPR Sensing and a
Tunable Fano Resonance," Nano Lett 8, 3983-3988 (2008).
53. U. Fano, and J. W. Cooper, "Spectral Distribution of Atomic Oscillator Strengths," Rev
Mod Phys 40, 441-+ (1968).
54. Z. H. Loh, C. H. Greene, and S. R. Leone, "Femtosecond induced transparency and
absorption in the extreme ultraviolet by coherent coupling of the He 2s2p (P-1(o)) and
2p(2) (S-1(e)) double excitation states with 800 nm light," Chem Phys 350, 7-13 (2008).

142
55. T. E. Glover, M. P. Hertlein, S. H. Southworth, T. K. Allison, J. van Tilborg, E. P.
Kanter, B. Krassig, H. R. Varma, B. Rude, R. Santra, A. Belkacem, and L. Young,
"Controlling X-rays with light," Nat Phys 6, 69-U65 (2010).
56. J. Mauritsson, T. Remetter, M. Swoboda, K. Klunder, A. L'Huillier, K. J. Schafer, O.
Ghafur, F. Kelkensberg, W. Siu, P. Johnsson, M. J. J. Vrakking, I. Znakovskaya, T.
Uphues, S. Zherebtsov, M. F. Kling, F. Lepine, E. Benedetti, F. Ferrari, G. Sansone, and
M. Nisoli, "Attosecond Electron Spectroscopy Using a Novel Interferometric Pump-
Probe Technique," Phys Rev Lett 105 (2010).
57. D. G. W. F, "Springer Handbook of Atomic, Molecular and Optical Physics."
58. X. M. Tong, and N. Toshima, "Controlling atomic structures and photoabsorption
processes by an infrared laser," Phys Rev A 81 (2010).
59. M. B. Gaarde, C. Buth, J. L. Tate, and K. J. Schafer, "Transient absorption and reshaping
of ultrafast XUV light by laser-dressed helium," Phys Rev A 83, 013419 (2011).
60. S. H. Chen, K. J. Schafer, and M. B. Gaarde, "Transient absorption of attosecond pulse
trains by laser-dressed helium," Opt Lett 37, 2211-2213 (2012).
61. S. Pabst, A. Sytcheva, A. Moulet, A. Wirth, E. Goulielmakis, and R. Santra, "Theory of
attosecond transient-absorption spectroscopy of krypton for overlapping pump and probe
pulses," Phys Rev A 86 (2012).
62. S. H. Chen, M. Wu, M. B. Gaarde, and K. J. Schafer, "Quantum interference in
attosecond transient absorption of laser-dressed helium atoms," Phys Rev A 87 (2013).
63. X. W. Wang, M. Chini, Y. Cheng, Y. Wu, X. M. Tong, and Z. H. Chang, "Subcycle laser
control and quantum interferences in attosecond photoabsorption of neon," Phys Rev A
87 (2013).

143
64. M. F. Kling, and M. J. J. Vrakking, "Attosecond electron dynamics," Annu Rev Phys
Chem 59, 463-492 (2008).
65. E. Goulielmakis, V. S. Yakovlev, A. L. Cavalieri, M. Uiberacker, V. Pervak, A.
Apolonski, R. Kienberger, U. Kleineberg, and F. Krausz, "Attosecond control and
measurement: Lightwave electronics," Science 317, 769-775 (2007).
66. W. C. Chu, and C. D. Lin, "Photoabsorption of attosecond XUV light pulses by two
strongly laser-coupled autoionizing states," Phys Rev A 85 (2012).
67. W. C. Chu, S. F. Zhao, and C. D. Lin, "Laser-assisted-autoionization dynamics of helium
resonances with single attosecond pulses," Phys Rev A 84 (2011).
68. A. N. Pfeiffer, and S. R. Leone, "Transmission of an isolated attosecond pulse in a
strong-field dressed atom," Phys Rev A 85 (2012).
69. P. Lambropoulos, and P. Zoller, "Autoionizing States in Strong Laser Fields," Phys Rev
A 24, 379-397 (1981).
70. M. Hentschel, R. Kienberger, C. Spielmann, G. A. Reider, N. Milosevic, T. Brabec, P.
Corkum, U. Heinzmann, M. Drescher, and F. Krausz, "Attosecond metrology," Nature
414, 509-513 (2001).
71. M. Wickenhauser, J. Burgdorfer, F. Krausz, and M. Drescher, "Time resolved Fano
resonances," Phys Rev Lett 94 (2005).
72. X. M. Tong, and C. D. Lin, "Double photoexcitation of He atoms by attosecond xuv
pulses in the presence of intense few-cycle infrared lasers," Phys Rev A 71 (2005).
73. Z. X. Zhao, and C. D. Lin, "Theory of laser-assisted autoionization by attosecond light
pulses," Phys Rev A 71 (2005).

144
74. S. Gilbertson, M. Chini, X. M. Feng, S. Khan, Y. Wu, and Z. H. Chang, "Monitoring and
Controlling the Electron Dynamics in Helium with Isolated Attosecond Pulses," Phys
Rev Lett 105 (2010).
75. J. W. Mcconkey, and J. A. Preston, "Autoionizing States in Argon," J Phys B-at Mol Opt
6, L138-L141 (1973).
76. S. I. Themelis, P. Lambropoulos, and M. Meyer, "Ionization dynamics in double
resonance involving autoionizing states in helium: the effect of pulse shapes," J Phys B-at
Mol Opt 37, 4281-4293 (2004).
77. M. Chini, X. W. Wang, Y. Cheng, and Z. H. Chang, "Resonance effects and quantum
beats in attosecond transient absorption of helium," J Phys B-at Mol Opt 47 (2014).
78. V. L. Carter, and R. D. Hudson, "Absorption spectra of krypton and xenon in their
regions of autoionization," J. Opt. Soc. Am. 63, 733-735 (1973).
79. Y. Cheng, M. Chini, X.-M. Tong, A. Chew, J. Biedermann, Y. Wu, E. Cunningham, and
Z. Chang, "Quantum Beats in Attosecond Transient Absorption of Krypton Autoionizing
States," in CLEO: QELS_Fundamental Science(Optical Society of America, 2015), p.
FTh3C. 3.
80. D. C. Yost, T. R. Schibli, J. Ye, J. L. Tate, J. Hostetter, M. B. Gaarde, and K. J. Schafer,
"Vacuum-ultraviolet frequency combs from below-threshold harmonics," Nat Phys 5,
815-820 (2009).
81. M. Krebs, S. Hadrich, S. Demmler, J. Rothhardt, A. Zair, L. Chipperfield, J. Limpert, and
A. Tunnermann, "Towards isolated attosecond pulses at megahertz repetition rates," Nat
Photonics 7, 555-559 (2013).

145
82. T. Udem, R. Holzwarth, and T. W. Hansch, "Optical frequency metrology," Nature 416,
233-237 (2002).
83. S. Kim, J. H. Jin, Y. J. Kim, I. Y. Park, Y. Kim, and S. W. Kim, "High-harmonic
generation by resonant plasmon field enhancement," Nature 453, 757-760 (2008).
84. I. Y. Park, S. Kim, J. Choi, D. H. Lee, Y. J. Kim, M. F. Kling, M. I. Stockman, and S. W.
Kim, "Plasmonic generation of ultrashort extreme-ultraviolet light pulses," Nat Photonics
5, 678-682 (2011).
85. M. Sivis, M. Duwe, B. Abel, and C. Ropers, "Extreme-ultraviolet light generation in
plasmonic nanostructures," Nat Phys 9, 304-309 (2013).
86. E. P. Power, A. M. March, F. Catoire, E. Sistrunk, K. Krushelnick, P. Agostini, and L. F.
DiMauro, "XFROG phase measurement of threshold harmonics in a Keldysh-scaled
system," Nat Photonics 4, 352-356 (2010).
87. T. J. Hammond, A. K. Mills, and D. J. Jones, "Near-threshold harmonics from a
femtosecond enhancement cavity-based EUV source: effects of multiple quantum
pathways on spatial profile and yield," Opt Express 19, 24871-24883 (2011).
88. D. Shafir, H. Soifer, C. Vozzi, A. S. Johnson, A. Hartung, Z. Dube, D. M. Villeneuve, P.
B. Corkum, N. Dudovich, and A. Staudte, "Trajectory-Resolved Coulomb Focusing in
Tunnel Ionization of Atoms with Intense, Elliptically Polarized Laser Pulses," Phys Rev
Lett 111 (2013).
89. J. A. Hostetter, J. L. Tate, K. J. Schafer, and M. B. Gaarde, "Semiclassical approaches to
below-threshold harmonics," Phys Rev A 82 (2010).
90. A. Lhuillier, P. Balcou, and L. A. Lompre, "Coherence and Resonance Effects in High-
Order Harmonic-Generation," Phys Rev Lett 68, 166-169 (1992).

146
91. E. S. Toma, P. Antoine, A. de Bohan, and H. G. Muller, "Resonance-enhanced high-
harmonic generation," J Phys B-at Mol Opt 32, 5843-5852 (1999).
92. P. Ackermann, H. Munch, and T. Halfmann, "Resonantly-enhanced harmonic generation
in Argon," Opt Express 20, 13824-13832 (2012).
93. J. K. Crane, M. D. Perry, D. Strickland, S. Herman, and R. W. Falcone, "Coherent and
Incoherent Xuv Emission in Helium and Neon, Laser-Driven Plasmas," Ieee T Plasma
Sci 21, 82-89 (1993).
94. E. Mevel, P. Breger, R. Trainham, G. Petite, P. Agostini, A. Migus, J. P. Chambaret, and
A. Antonetti, "Atoms in Strong Optical-Fields - Evolution from Multiphoton to Tunnel
Ionization," Phys Rev Lett 70, 406-409 (1993).
95. M. Chini, X. W. Wang, Y. Cheng, H. Wang, Y. Wu, E. Cunningham, P. C. Li, J. Heslar,
D. A. Telnov, S. I. Chu, and Z. H. Chang, "Coherent phase-matched VUV generation by
field-controlled bound states," Nat Photonics 8, 437-441 (2014).
96. I. J. Sola, E. Mevel, L. Elouga, E. Constant, V. Strelkov, L. Poletto, P. Villoresi, E.
Benedetti, J. P. Caumes, S. Stagira, C. Vozzi, G. Sansone, and M. Nisoli, "Controlling
attosecond electron dynamics by phase-stabilized polarization gating," Nat Phys 2, 319-
322 (2006).
97. T. Popmintchev, M. C. Chen, A. Bahabad, M. Gerrity, P. Sidorenko, O. Cohen, I. P.
Christov, M. M. Murnane, and H. C. Kapteyn, "Phase matching of high harmonic
generation in the soft and hard X-ray regions of the spectrum," P Natl Acad Sci USA
106, 10516-10521 (2009).
98. M. B. Gaarde, J. L. Tate, and K. J. Schafer, "Macroscopic aspects of attosecond pulse
generation," J Phys B-at Mol Opt 41 (2008).

147
99. E. Constant, D. Garzella, P. Breger, E. Mevel, C. Dorrer, C. Le Blanc, F. Salin, and P.
Agostini, "Optimizing high harmonic generation in absorbing gases: Model and
experiment," Phys Rev Lett 82, 1668-1671 (1999).
100. H. Soifer, P. Botheron, D. Shafir, A. Diner, O. Raz, B. D. Bruner, Y. Mairesse, B. Pons,
and N. Dudovich, "Near-Threshold High-Order Harmonic Spectroscopy with Aligned
Molecules," Phys Rev Lett 105 (2010).
101. A. Cingoz, D. C. Yost, T. K. Allison, A. Ruehl, M. E. Fermann, I. Hartl, and J. Ye,
"Direct frequency comb spectroscopy in the extreme ultraviolet," Nature 482, 68-71
(2012).
102. R. L. Sandberg, A. Paul, D. A. Raymondson, S. Hadrich, D. M. Gaudiosi, J. Holtsnider,
R. I. Tobey, O. Cohen, M. M. Murnane, H. C. Kapteyn, C. G. Song, J. W. Miao, Y. W.
Liu, and F. Salmassi, "Lensless diffractive imaging using tabletop coherent high-
harmonic soft-x-ray beams," Phys Rev Lett 99 (2007).
103. M. I. Stockman, M. F. Kling, U. Kleineberg, and F. Krausz, "Attosecond nanoplasmonic-
field microscope," Nat Photon 1, 539-544 (2007).
104. S. H. Chew, F. Sussmann, C. Spath, A. Wirth, J. Schmidt, S. Zherebtsov, A. Guggenmos,
A. Oelsner, N. Weber, J. Kapaldo, A. Gliserin, M. I. Stockman, M. F. Kling, and U.
Kleineberg, "Time-of-flight-photoelectron emission microscopy on plasmonic structures
using attosecond extreme ultraviolet pulses," Appl Phys Lett 100 (2012).
105. M. N. Miranda, P. B. Oliveira, L. M. Bernardo, F. X. Kärtner, and H. M. Crespo, "Space-
time focusing of phase-stabilized nanojoule-level 2.5-cycle pulses to peak intensities
>3x10¹³ W/cm2 at 80 MHz," in CLEO/Europe and EQEC 2009 Conference
Digest(Optical Society of America, Munich, 2009), p. CF1_2.

148
106. F. Lepine, M. Y. Ivanov, and M. J. J. Vrakking, "Attosecond molecular dynamics: fact or
fiction?," Nat Photonics 8, 195-204 (2014).
107. F. Lepine, G. Sansone, and M. J. J. Vrakking, "Molecular applications of attosecond laser
pulses," Chem Phys Lett 578, 1-14 (2013).
108. P. Ranitovic, C. W. Hogle, P. Riviere, A. Palacios, X. M. Tong, N. Toshima, A.
Gonzalez-Castrillo, L. Martin, F. Martin, M. M. Murnane, and H. Kapteyn, "Attosecond
vacuum UV coherent control of molecular dynamics," P Natl Acad Sci USA 111, 912-
917 (2014).
109. G. Sansone, F. Kelkensberg, J. F. Perez-Torres, F. Morales, M. F. Kling, W. Siu, O.
Ghafur, P. Johnsson, M. Swoboda, E. Benedetti, F. Ferrari, F. Lepine, J. L. Sanz-Vicario,
S. Zherebtsov, I. Znakovskaya, A. L'Huillier, M. Y. Ivanov, M. Nisoli, F. Martin, and M.
J. J. Vrakking, "Electron localization following attosecond molecular photoionization,"
Nature 465, 763-U763 (2010).
110. S. H. Chen, M. J. Bell, A. R. Beck, H. Mashiko, M. X. Wu, A. N. Pfeiffer, M. B. Gaarde,
D. M. Neumark, S. R. Leone, and K. J. Schafer, "Light-induced states in attosecond
transient absorption spectra of laser-dressed helium," Phys Rev A 86 (2012).
111. M. Chini, K. Zhao, and Z. H. Chang, "The generation, characterization and applications
of broadband isolated attosecond pulses," Nat Photonics 8, 178-186 (2014).
112. C. Ott, A. Kaldun, L. Argenti, P. Raith, K. Meyer, M. Laux, Y. Zhang, A. Blattermann,
S. Hagstotz, T. Ding, R. Heck, J. Madronero, F. Martin, and T. Pfeifer, "Reconstruction
and control of a time-dependent two-electron wave packet," Nature 516, 374-378 (2014).
113. M. Schultze, E. M. Bothschafter, A. Sommer, S. Holzner, W. Schweinberger, M. Fiess,
M. Hofstetter, R. Kienberger, V. Apalkov, V. S. Yakovlev, M. I. Stockman, and F.

149
Krausz, "Controlling dielectrics with the electric field of light," Nature 493, 75-78
(2013).
114. X. Wang, M. Chini, Y. Cheng, Y. Wu, and Z. Chang, "In situ calibration of an extreme
ultraviolet spectrometer for attosecond transient absorption experiments," Appl Optics
52, 323-329 (2013).
115. S. T. E, "Potential-Energy Curves for Molecular Hydrogen and Its Ions," Atomic Data 2,
119 (1971).
116. Z. P. Zhong, W. H. Zhang, K. Z. Xu, R. F. Feng, and J. M. Li, "Experimental and
theoretical study of photoabsorption spectra of molecular hydrogen in the energy region
11-19 eV," Phys Rev A 60, 236-245 (1999).
117. C. H. B. Cruz, J. P. Gordon, P. C. Becker, R. L. Fork, and C. V. Shank, "Dynamics of
Spectral Hole Burning," Ieee J Quantum Elect 24, 261-266 (1988).
118. S. H. Autler, and C. H. Townes, "Stark Effect in Rapidly Varying Fields," Physical
Review 100, 703-722 (1955).
119. J. L. Sanz-Vicario, H. Bachau, and F. Martin, "Time-dependent theoretical description of
molecular autoionization produced by femtosecond xuv laser pulses," Phys Rev A 73
(2006).
120. A. Palacios, H. Bachau, and F. Martin, "Excitation and ionization of molecular hydrogen
by ultrashort vuv laser pulses," Phys Rev A 75 (2007).
121. "Private communication from Dr. Fernando Martin."
122. A. Assion, T. Baumert, M. Bergt, T. Brixner, B. Kiefer, V. Seyfried, M. Strehle, and G.
Gerber, "Control of chemical reactions by feedback-optimized phase-shaped femtosecond
laser pulses," Science 282, 919-922 (1998).

150
123. E. Gustafsson, T. Ruchon, M. Swoboda, T. Remetter, E. Pourtal, R. Lopez-Martens, P.
Balcou, and A. L'Huillier, "Broadband attosecond pulse shaping," Opt Lett 32, 1353-
1355 (2007).
124. C. Ott, A. Kaldun, P. Raith, K. Meyer, M. Laux, J. Evers, C. H. Keitel, C. H. Greene, and
T. Pfeifer, "Lorentz Meets Fano in Spectral Line Shapes: A Universal Phase and Its Laser
Control," Science 340, 716-720 (2013).


![Dressing effects in the attosecond transient absorption ... · excited states in krypton [2,8], of singly excited bound states in neon [6,9] and helium [10–14], and of doubly excited](https://static.fdocuments.net/doc/165x107/6057aa3e96971114e931820d/dressing-effects-in-the-attosecond-transient-absorption-excited-states-in-krypton.jpg)

![Analytic Modeling of Features in Attosecond Transient ......Autler-Townes splitting of the absorption lines, due to the resonant interaction between two states [15, 16, 17]. Here we](https://static.fdocuments.net/doc/165x107/60e18c85196e640bd556e20c/analytic-modeling-of-features-in-attosecond-transient-autler-townes-splitting.jpg)