ATTENTION-DEFICIT/HYPERACTIVITY · Barbara Ann Pocklington BA (Hons), Grad Dip (Mktg), Grad Dip...
343
COGNITIVE PROFILING OF ATTENTION-DEFICIT/HYPERACTIVITY DISORDER AND READING DISORDER Barbara Ann Pocklington BA (Hons), Grad Dip (Mktg), Grad Dip (Science) School of Psychology University of Western Australia This thesis is submitted as a partial requirement for the degree of Master of Psychology (Clinical) and Doctor of Philosophy at the University of Western Australia, 2010
Transcript of ATTENTION-DEFICIT/HYPERACTIVITY · Barbara Ann Pocklington BA (Hons), Grad Dip (Mktg), Grad Dip...

COGNITIVE PROFILING OF
ATTENTION-DEFICIT/HYPERACTIVITY
DISORDER AND READING DISORDER
Barbara Ann Pocklington
BA (Hons), Grad Dip (Mktg), Grad Dip (Science)
School of Psychology
University of Western Australia
This thesis is submitted as a partial requirement for the degree of
Master of Psychology (Clinical) and Doctor of Philosophy
at the University of Western Australia, 2010
i
ABSTRACT
Attention-deficit/hyperactivity disorder (ADHD) and reading disorder (RD) are two of the most
common developmental disorders. Of recent and especial interest is their frequent comorbidity.
The main aim of the thesis was to cognitively profile each of the disorders by evaluating and
comparing deficits of executive and lower-level cognitive functioning in children with ADHD
classified by comorbidity with RD.
Systematic reviews focused on investigations of the five major theoretical cognitive domains,
namely phonological awareness, memory, inhibition, rapid naming, and speed-of-processing. As
an adjunct to the rapid naming review, a meta-analytic study of 22 published studies was
undertaken to investigate possible differences in the profile of rapid naming deficits for ADHD
and RD children. This investigation sought to determine if ADHD and RD populations could be
demarcated on the basis of tasks using graphological versus nongraphological stimuli. The RD
group was found to be more impaired on the graphological than the nongraphological stimulus
categories, but the ADHD group showed similar margins of deficits across both stimulus
categories.
Several new cognitive tasks were developed to enable comparisons of performance profiles for
ADHD and RD using carefully matched task variants. In a subsidiary adult study, a sample of
48 undergraduate students pilot tested two memory span tasks especially created for the primary
child study to verify the construct validity of these tasks.
In the main child study, rigorous sets of criteria were used in screening children for a fully-
crossed ADHD Status x ADHD Status design. A battery of executive and lower-level cognitive
functioning tasks tapping each of the five key domains was administered to males aged 8 to 13
years, divided into ADHD, RD, ADHD+RD, and control groups. The objective was to ascertain
whether common or unique neuropsychological profiles emerged for these special populations.
Three novel Brinley plot meta-analyses were undertaken to investigate the potential role of
slowed speed of processing in cognitive impairment associated with ADHD and RD. Brinley
plot analyses of the available literature demonstrated that ADHD versus control performance
across the different Stroop conditions could be captured by a linear function, with a
proportionate increase in reaction times for the ADHD sample relative to the control sample of
approximately 27%, suggesting a substantial difference in processing speed for the two sample
groups. A subsidiary Brinley plot investigations into possible slowing for RD children indicated

ii
a 27% increase in response times for RD children and adolescents in comparison to their control
peers across the three Stroop task conditions. A corresponding 30% increase in response times
was found for ADHD+RD children and adolescents in comparison to their control peers across
the standard Stroop conditions.
This is one of the first studies of ADHD and RD from a comprehensive executive functions and
cognitive processing perspective. The results call into dispute some of the standard measures
said to demarcate RD and ADHD children from their typically developing peers, and RD
children from ADHD children. It appears that complex phonological awareness, verbal memory,
and visuospatial speed-of-processing may be cognitive markers for RD. In contrast, visuospatial
memory, naming speed (as indexed by the Stroop task, and continuous and discrete rapid
naming tasks), and verbal speed-of-processing may be common markers for ADHD and RD.
Whilst both populations evidenced difficulties on the stop signal task, this task indexed
predominantly inhibition deficits for the ADHD population, and predominantly inattention (and
some inhibition) difficulties for the RD population.
In terms of arriving at a phenotypy of ADHD and RD, the extant literature and the results from
the primary child study from this thesis suggest that the profile for the two disorders is
characterised more by communality than uniqueness.

iii
TABLE OF CONTENTS
ABSTRACT ........................................................................................................................... i
TABLE OF CONTENTS ....................................................................................................... iii
LIST OF FIGURES ............................................................................................................ viii
LIST OF TABLES ................................................................................................................. x
ACKNOWLEDGEMENTS ................................................................................................... xii
Chapter 1 : Introduction .................................................................................................. 1
1.1 Overview of the Thesis ........................................................................................................2
1.2 Significance of the Thesis ....................................................................................................4
Chapter 2 : Overview of ADHD....................................................................................... 5
2.1 ADHD Definition and Core Clinical Criteria ......................................................................6
2.2 Prevalence of ADHD ...........................................................................................................8
2.3 Focal Theory and Prevailing Model of ADHD ....................................................................9
2.4 Summary ............................................................................................................................13
Chapter 3 : Overview of RD........................................................................................... 16
3.1 RD Definition and Core Clinical Criteria ..........................................................................17
3.2 Prevalence of RD ...............................................................................................................19
3.3 Focal Theory and Prevailing Model of RD ........................................................................20
3.4 Summary ............................................................................................................................25
Chapter 4 : Literature Reviews ..................................................................................... 26
4.1 Phonological Awareness ....................................................................................................26
4.1.1 Research on PA and RD ..............................................................................................28
4.1.2 Research on PA and ADHD ........................................................................................30
4.1.3 Research on PA and ADHD+RD ................................................................................32
4.1.4 Summary of the Literature on PA ...............................................................................34
4.2 Memory ..............................................................................................................................35
4.2.1 Verbal Short-term Memory .........................................................................................37
4.2.2 Visuospatial Short-term Memory ................................................................................41
4.2.3 Verbal Working Memory ............................................................................................43
4.2.4 Visuospatial Working Memory ...................................................................................47
4.2.5 Reviews of the Literature on Memory and ADHD and RD ........................................48
4.3 Inhibition ............................................................................................................................52

iv
4.3.1 Overview of the Stop Signal Task .............................................................................. 56
4.3.2 Review of the Stop Signal Task Literature ................................................................. 59
4.3.3 Overview of the Stroop Task ...................................................................................... 64
4.3.4 Review of the Stroop Literature ................................................................................. 65
4.3.5 Summary of the Literature on Inhibition .................................................................... 69
4.4 Rapid Naming .................................................................................................................... 70
4.4.1 Origins of the RN Task ............................................................................................... 70
4.4.2 Review of the Continuous Rapid Naming Literature ................................................. 71
4.4.3 Review of the Discrete Rapid Naming Literature ...................................................... 80
4.5 Speed-of-Processing .......................................................................................................... 94
4.5.1 Review of the Literature on SOP and ADHD ............................................................ 95
4.5.2 Review of the Literature on SOP and RD .................................................................. 98
4.5.3 Review of the Literature on SOP and ADHD+RD ................................................... 100
Chapter 5 : Rationale and General Methodology for the Empirical Studies ........... 102
5.1 Domain Hypotheses Arising from the Literature Review ............................................... 102
5.1.1 PA Hypotheses ......................................................................................................... 102
5.1.2 Memory Hypotheses ................................................................................................. 103
5.1.3 Inhibition Hypotheses ............................................................................................... 103
5.1.4 RN Hypotheses ......................................................................................................... 105
5.1.5 SOP Hypotheses ....................................................................................................... 106
5.2 General Method ............................................................................................................... 106
5.2.1 Screening Tasks ........................................................................................................ 106
5.2.2 Participants ............................................................................................................... 112
5.2.3 General Procedure .................................................................................................... 119
5.2.4 General Approach to Statistical Analysis ................................................................. 120
Chapter 6 : An Empirical Investigation of Phonological Awareness ........................ 121
6.1 Experimental Design and Hypotheses ............................................................................. 122
6.2 Method ............................................................................................................................. 122
6.2.1 Participants ............................................................................................................... 122
6.2.2 Procedure .................................................................................................................. 122
6.3 Results ............................................................................................................................. 124
6.4 Discussion........................................................................................................................ 126
Chapter 7 : An Empirical Study of Memory Performance in ADHD and RD ........ 128
7.1 Method ............................................................................................................................. 129
v
7.1.1 Experimental Design and Hypotheses ......................................................................129
7.1.2 Participants ................................................................................................................130
7.1.3 Equipment .................................................................................................................130
7.1.4 Verbal and Visuospatial Short-term Memory Tasks .................................................130
7.1.5 Verbal Working Memory Task .................................................................................131
7.1.6 Visuospatial Working Memory Task ........................................................................132
7.2 Results and Discussion ....................................................................................................134
Chapter 8 : An Empirical Study of Stop Signal Task Performance in ADHD and RD138
8.1 Method .............................................................................................................................138
8.1.1 Experimental Design .................................................................................................138
8.1.2 Participants ................................................................................................................139
8.1.3 Equipment .................................................................................................................139
8.1.4 Stimuli .......................................................................................................................139
8.1.5 Procedure ..................................................................................................................139
8.2 Results ..............................................................................................................................143
8.3 Discussion ........................................................................................................................147
Chapter 9 : An Empirical Study of Stroop Performance in ADHD and RD ........... 154
9.1 Method .............................................................................................................................158
9.1.1 Experimental Design and Hypotheses ......................................................................158
9.1.2 Participants ................................................................................................................160
9.1.3 Equipment .................................................................................................................160
9.1.4 Procedure ..................................................................................................................160
9.1.5 Scoring of Responses ................................................................................................163
9.2 Results ..............................................................................................................................163
9.3 Discussion ........................................................................................................................167
Chapter 10 : An Empirical Study of Continuous and Discrete Rapid Naming in ADHD
and RD ........................................................................................................................... 170
10.1 Method ...........................................................................................................................171
10.1.1 Experimental Design and Hypotheses ....................................................................171
10.1.2 Participants ..............................................................................................................172
10.1.3 RNC Task ................................................................................................................172
10.1.4 RND Task ...............................................................................................................174
10.2 Results ............................................................................................................................175
10.2.1 RNC Task ................................................................................................................175

vi
10.2.2 RND Task ............................................................................................................... 178
10.3 Discussion...................................................................................................................... 181
Chapter 11 : An Empirical Study of Speed-of-Processing in ADHD and RD.......... 183
11.1 Method ........................................................................................................................... 184
11.1.1 Experimental Design and Hypotheses .................................................................... 184
11.1.2 Participants ............................................................................................................. 184
11.1.3 Equipment ............................................................................................................... 184
11.1.4 Verbal Search Condition ........................................................................................ 184
11.1.5 Spatial Search Condition ........................................................................................ 185
11.1.6 Procedure ................................................................................................................ 186
11.2 Results ........................................................................................................................... 187
11.3 Discussion...................................................................................................................... 188
Chapter 12 : Stroop Brinley Plot Analyses ................................................................. 191
12.1 A Brinley Plot Analysis of Stroop Performance for ADHD and Control Samples ....... 193
12.1.1 Method .................................................................................................................... 195
12.1.2 Results .................................................................................................................... 198
12.1.3 Discussion ............................................................................................................... 203
12.2 A Brinley Plot Analysis of Stroop Performance for RD and ADHD+RD Samples
Relative to Control Samples .................................................................................................. 211
12.2.1 Method .................................................................................................................... 211
12.3 Results and Discussion .................................................................................................. 212
Chapter 13 : Mapping the Neuropsychological Correlates of ADHD and RD ........ 222
13.1 Phonological Awareness as a Cognitive Correlate for RD and ADHD ........................ 223
13.2 Memory as a Cognitive Correlate for RD and ADHD .................................................. 224
13.3 Inhibition as a Cognitive Correlate for RD and ADHD ................................................ 227
13.3.1 The Stop Signal Task .............................................................................................. 229
13.3.2 The Stroop Task...................................................................................................... 232
13.4 Rapid Naming as a Cognitive Correlate for RD and ADHD ......................................... 236
13.5 Speed-of-Processing as a Cognitive Correlate for RD and ADHD ............................... 239
13.6 Towards an Endophenotypy of ADHD and RD ............................................................ 241
13.7 Clinical and Educational Implications for the Thesis Findings ..................................... 244
13.8 Limitations of the Current Design ................................................................................. 244
13.9 Conclusions ................................................................................................................... 246
Appendix: An Empirical Validation of Memory Measures ....................................... 249

vii
1.0 Method .............................................................................................................................250
1.1 Experimental Design and Hypotheses .........................................................................250
1.2 Participants ...................................................................................................................251
1.3 Equipment ....................................................................................................................251
1.4 The Verbal Memory Task ............................................................................................251
1.5 The Visuospatial Memory Task ...................................................................................254
1.6 Interference Tasks ........................................................................................................257
2.0 General Procedure ............................................................................................................259
3.0 Results and Discussion ....................................................................................................260
Glossary of Terms ......................................................................................................... 265
References ...................................................................................................................... 267

viii
LIST OF FIGURES
Figure 2-1. Barkley‟s self-control model of ADHD. ................................................................... 12
Figure 3-1. A continuum of difficulty of PA tasks (adapted from Yopp, 1988). ........................ 21
Figure 3-2. Wagner and Torgesen‟s (1987) outline of phonological processing and its
constituent processes (adapted from Wagner, 1988). .................................................................. 22
Figure 3-3. Model of the double deficit hypothesis proposed by Bowers and Newby-Clark,
2002, showing the dual contribution of PA and RN to the successful acquisition of reading..... 23
Figure 3-4. The double deficit hypothesis (adapted from Wolf, 1997, p. 78). ............................ 24
Figure 4-1. The stop signal paradigm (figure adapted from Logan & Cowan, 1984, and
Rodriguez-Fornells, Lorenzo-Seva, & Andres-Pueyo, 2002). .................................................... 58
Figure 4-2. Mean RN latency effect sizes for graphological and nongraphological stimuli for RD
studies. Numbering of studies is consistent with Table 4-1. ....................................................... 79
Figure 4-3. Mean RN latency effect sizes for graphological and nongraphological stimuli for
ADHD studies. Numbering of studies is consistent with Table 4-2. ........................................... 80
Figure 6-1. Mean CTOPP subtest standard scores (with standard errors shown as error bars) for
the four experimental groups. .................................................................................................... 125
Figure 7-1. Illustration of a trial of the VSTM task for the child study. .................................... 130
Figure 7-2. Illustration of a trial of the VSSTM task for the child study. ................................. 131
Figure 7-3. Illustration of a trial of the VWM task for the child study. .................................... 132
Figure 7-4. Illustration of a trial of the VSWM task for the child study. .................................. 133
Figure 7-5. Means (and standard errors) of verbal memory span scores (collapsed across the
VSTM and VWM tasks) for each of the experimental groups. ................................................. 135
Figure 7-6. Means (and standard errors) of spatial memory span scores (collapsed across the
VSTM and working memory tasks) for each of the experimental groups................................. 136
Figure 8-1. Timing of events for stop signal trials. ................................................................... 141
Figure 8-2. Illustration of stop signal response time estimation (adapted from Williams,
Ponesse, Schachar, Logan, & Tannock, 1999). ......................................................................... 142
Figure 9-1. Stroop word condition, where the task is to read the words. .................................. 154
Figure 9-2. Stroop colour condition, where the task is to name the colour of the typeface. ..... 155
Figure 9-3. Stroop colour-word condition, where the task is to name the colour of typeface and
ignore the printed word. ............................................................................................................ 156
Figure 9-4. Stroop negative priming condition, where the task is to name the colour of the
typeface and ignore the printed word. ....................................................................................... 157

ix
Figure 9-5. Response rates, showing mean and standard error, achieved by each of the four
groups. ........................................................................................................................................164
Figure 9-6. Percentage accuracy, showing mean and standard error, achieved by the four groups.
...................................................................................................................................................166
Figure 10-1. Reaction time, showing mean and standard error, achieved by the four
experimental groups on the three RNC conditions. ...................................................................176
Figure 10-2. Reaction time, showing mean and standard error, achieved by the four
experimental groups on the three RND conditions. ...................................................................179
Figure 11-1. Illustration of the display screen for a successfully completed trial on the SOP
verbal condition. ........................................................................................................................185
Figure 11-2. Illustration showing the display screen for an unsuccessful first attempt on a trial
of the SOP spatial condition. .....................................................................................................186
Figure 11-3. Means (and standard errors) of reaction time data (in milliseconds) for Verbal and
Spatial SOP conditions. .............................................................................................................188
Figure 11-4. Means (and standard errors) of accuracy data (in percentages) for verbal and spatial
SOP conditions...........................................................................................................................189
Figure 12-1. Brinley plots for ADHD and control group Stroop latencies (RT per item, in
seconds) for the 18 data sets. .....................................................................................................204
Figure 12-2. Brinley plots for RD and control group Stroop latencies (RT per item, in seconds)
for the seven data sets. ...............................................................................................................218
Figure 12-3. Brinley plots for ADHD+RD and control group Stroop latencies (RT per item, in
seconds) for the four data sets. ...................................................................................................219
Figure 12-4. Brinley plots for RD, ADHD, and ADHD+RD and control group Stroop latencies
(RT per item, in seconds) for the data from the current study. ..................................................221
Figure A1. Primary verbal span task with secondary visuospatial interference task. ................255
Figure A2. Primary visuospatial span task with secondary verbal interference task. ................258
Figure A3. Means (and standard errors) of memory span scores for each combination of
memory task and interference condition. ...................................................................................262

x
LIST OF TABLES
Table 4-1. Primary experiments on RN generated from the RD literature review ...................... 81
Table 4-2. Primary experiments on RN generated from the ADHD literature review ................ 85
Table 4-3. Primary experiments on RN generated from the ADHD+RD literature review ........ 87
Table 4-4. RD studies included in the meta-analysis: Sample sizes (N) and effect sizes (d) for
RNC latencies. Numbers correspond to those studies listed in Table 4-1. .................................. 88
Table 4-5. ADHD studies included in the meta-analysis: Sample sizes (N) and effect sizes (d)
for RNC latencies. Numbers correspond to those studies listed in Table 4-2. ............................ 89
Table 4-6. ADHD+RD studies included in the meta-analysis: Sample sizes (N) and effect sizes
for RNC latencies. Numbers correspond to those studies listed in Table 4-3. ............................ 90
Table 4-7. Single-sample t-tests conducted on effect sizes (Ho: d = 0) for each RN category for
RD and ADHD studies. ............................................................................................................... 91
Table 5-1. Descriptive characteristics for the control, RD, ADHD, and ADHD+RD groups (SDs
in parentheses; N = 60). ............................................................................................................. 113
Table 7-1. Means (with standard errors in italics) for the four groups on VSTM, VWM,
VSSTM, and VSWM tasks. ....................................................................................................... 134
Table 8-1. Range of response permutations for the stop signal task. ........................................ 144
Table 8-2. Comparison of diagnostic groups on stop signal paradigm performance. ............... 146
Table 8-3. Mean number of errors of omission and response errors for the four groups. ......... 147
Table 8-4. Effect sizes for stop signal task variables. ................................................................ 147
Table 9-1. Stroop interference scores for the four experimental groups. .................................. 166
Table 10-1. Means (and standard errors) for the RNC conditions across the groups. ............... 178
Table 10-2. Means (and standard errors) for the RND conditions across the groups ................ 180
Table 12-1. Mean reaction time per item (in seconds) for atypical data sets. ........................... 197
Table 12-2. Summaries of the designs of studies that investigated Stroop performance in ADHD
and control samples. .................................................................................................................. 199
Table 12-3. Outcomes for Brinley plot analyses of Stroop performance for ADHD and control
group samples (where deviation refers to the deviation of the colour-word data point from the
regression line). ......................................................................................................................... 208
Table 12-4. Outcomes for Brinley Plot analyses of Stroop performance for RD and control
group samples. ........................................................................................................................... 213
Table 12-5. Summaries of the designs of studies that investigated Stroop performance in RD
and control samples. .................................................................................................................. 214

xi
Table 12-6. Summaries of the designs of studies that investigated Stroop performance in
ADHD+RD and control samples. ..............................................................................................216
Table 12-7. Outcomes for Brinley Plot analyses of Stroop performance for ADHD+RD and
control group samples. ...............................................................................................................217
Table 12-8. Outcomes of Brinley plot analyses of Stroop task results from the current study. .220
Table 13-1. Mapping the neuropsychological correlates of PA in ADHD and RD. ..................225
Table 13-2. Mapping the neuropsychological correlates of memory in ADHD and RD across
modality and processing type. ....................................................................................................228
Table 13-3. Mapping the neuropsychological correlates of inhibition in ADHD and RD using
the stop signal task. ....................................................................................................................231
Table 13-4. Mapping the neuropsychological correlates of inhibition in ADHD and RD using
the Stroop task............................................................................................................................234
Table 13-5. Mapping the neuropsychological correlates of RN in ADHD and RD using the RNC
task. ............................................................................................................................................237
Table 13-6. Mapping the neuropsychological correlates of ADHD and RD in RN using the RND
task. ............................................................................................................................................238
Table 13-7. Mapping the neuropsychological correlates of SOP in ADHD and RD. ................240
Table A1. Level of compliance (as measured by the number of taps and the number of
vocalizations) on secondary task performance for the verbal and spatial memory tasks. ..........263

xii
ACKNOWLEDGEMENTS
This thesis had its genesis in my Honours work, and has been developed through regular
discourses with my supervisor, Dr Murray Maybery. Murray‟s steady logic and patience
shaped the ideas that grew through this (rather lopsided) meeting of minds. His rigorous
editing and precise sense of language sharpened an otherwise shapeless body of work.
Thank you, Murray, for your generosity.
Especial appreciation is owed the members of my thesis committee - Professor Stephen
Houghton, Dr Allison Fox, Dr John Hogben, and Professor Kevin Durkin - for their
guidance and recommendations throughout the project‟s gestation. Also, Professor
Rosemary Tannock had valued input during the inception phase.
Thank you to Hubert Jurkiewicz, from the Technical Services division within the
School of Psychology, for his expertise in digital imaging. Similarly, my thanks go to
Matt Huitson, also with Technical Services, for his talented assistance in the formatting
of several of the tasks used in this research.
A debt of gratitude is owed to the principal and teaching staff at a local primary school,
as well as to various tutors across the metropolitan area, for allowing me the use of their
premises and access to their students. Likewise, I am grateful to Dr Janet Fletcher from
the School of Psychology‟s Child Study Centre for the provision of a child-friendly
environment with easy parent access for the testing of those participants who came to
me via other means.
Thanks must also be awarded the parents of the participants in my study, who shared so
generously with me their time and details of their child‟s life. Plus, a vote of
appreciation should go to the participants themselves, for so willingly engaging in the
various tasks, and so enriching this whole experience. And finally, my most heartfelt
thanks go to my family for their lasting support and encouragement throughout my
scholarship.

1
Chapter 1: Introduction
Attention-deficit/hyperactivity disorder (ADHD) is one of the most prevalent chronic
developmental disorders (Barkley, 1997a), constituting as much as 50% of child
psychiatric clinic populations (Brown, 2000; Cantwell, 1996; Offord et al., 1987;
Whalen & Henker, 1991). Reading disorder (RD) is a common learning disability with
identification rates as high as 30% in some American samples (Benton, 1975; Hallahan,
Kauffman, & Lloyd, 1985), and accounting for as much as 80% of all learning disorders
(Wertheim, Vogel, & Brulle, 1998). Of especial interest is the frequent comorbidity of
these two disorders, RD being the most frequent comorbidity of ADHD (Riccio &
Jemison, 1998). For example, rate of ADHD in samples selected for RD falls between
15 and 40% (Holborow & Berry, 1986; Gilger, Pennington, & DeFries, 1992;
McConaughy, Mattison, & Peterson, 1994; Shaywitz, Fletcher, & Shaywitz, 1995;
Shaywitz & Shaywitz, 1988; Willcutt & Pennington, 2000); conversely, the rate of RD
in samples selected for ADHD ranges from 10 to 40% (Dykman & Ackerman, 1991;
Biederman, Faraone, & Lapey, 1992; Frick & Lahey, 1991; Holborow & Berry, 1986;
Lambert & Sandoval, 1980; Semrud-Clikeman et al., 1992; Shaywitz & Shaywitz,
1988; Willcutt & Pennington, 2000). Yet the relationship between these two disorders
has not yet been fully explained (Purvis & Tannock, 2000; Willcutt et al., 2001).
International research, though, is moving towards a fuller delineation of the
cognitive deficits associated with ADHD, RD, and the group of children represented by
the comorbid overlap of these two disorders (ADHD+RD), but the research base is
small, and the deficits specific to each group are still poorly defined. This thesis adds to
the growing body of work in this area by mapping the cognitive correlates for ADHD,
RD, and ADHD+RD using a fully crossed four-group design described below.
The current research explores the specificity of each of five cognitive domains as a
candidate cognitive marker for ADHD or RD. Drawn from Barkley‟s Self-Control
Model (Barkley, 1997a) of neuropsychological functioning in ADHD, the key
constructs of memory, inhibition, and speed-of-processing have received significant
attention. Similarly, Wolf and Bowers‟ double deficit hypothesis of RD (Bowers &

2
Wolf, 1993; Wolf & Bowers, 1999) has generated much debate over the relative
contributions of phonological awareness (PA) and rapid naming (RN) to the successful
acquisition of reading in the developing child. Literature reviews herein work to refine
the operationalisation of each construct and highlight the need for the creation of new
tasks in those instances where these constructs have not been systematically
investigated. A central feature of the review of rapid naming is a meta-analysis of
research outcomes from studies of ADHD and RD that employed the four conditions of
the Denckla and Rudel (1976a) continuous RN task.
Before embarking on the major child study, an adult study was conducted to
confirm the construct validity of the memory tasks created for the major study (see
Appendix). A dual task interference methodology was adopted for this purpose. For the
child study, a fully crossed 2 x 2 design in which ADHD status (ADHD/No ADHD) is
crossed with RD (RD, No RD), yielding four groups: those with neither disorder
(control group), those with RD only or ADHD only (the two single disorder groups),
and those with both disorders (comorbid group). One issue central to the thesis is
whether a general slowing factor might more parsimoniously account for some of the
reaction time (RT) data reported across one of the domains under investigation, namely
inhibition. In order to investigate this issue with reference to published empirical
studies, Brinley plot analyses, borrowed from the aging literature, were employed. The
Brinley plots were the basis of meta-analyses that investigated whether a linear
function, reflecting uniform slowing as a consequence of either ADHD or RD, might
better fit the pattern the latency data emerging from one of the tasks used to tap the
inhibition domain.
1.1 Overview of the Thesis
Chapter 1 provides an introduction and outline of the thesis. An overview of each of the
clinical disorders under investigation is given in Chapters 2 and 3, along with a
presentation of the key theories of ADHD and RD. Chapter 2, for example, charts the
history of our knowledge of ADHD and addresses its diagnosis and prevalence. The
most compelling and extensively researched theory in this area is Barkley‟s Self-
Control theory of ADHD. Each of the theory‟s component parts is described. From this

3
theoretical springboard, three candidate domains for investigation emerge: inhibition,
memory (both verbal and nonverbal working memory), and processing speed.
Chapter 3 traces the history of our understanding of RD and considers its diagnosis
and prevalence. The two theories that dominate thinking in this area weight discussion
in this chapter: the single deficit model states that phonological difficulties underlie the
RD child‟s reading deficits; the double deficit hypothesis, on the other hand, suggests
that difficulties in both PA and RN contribute to impaired acquisition of reading skill.
PA and RN emerge as viable candidate domains.
Chapter 4 explores the relevant literature for each of the five cognitive domains
suggested by the dominant theories pertaining to each disorder. The operationalisation
of the constructs under consideration become further shaped by the key findings and
principal methodological considerations from each of the reviews. Chapter 4 also
includes a meta-analysis of investigations of continuous rapid naming in ADHD and
RD. Summaries at the end of each section in this chapter draw the findings from the
literature together to shape the main aims of the research.
Chapter 5 provides a brief overview of the design of the study and develops the
general hypotheses. This chapter contains a general method section, which includes an
overview of the screening tasks employed. The chapters thereafter (Chapters 6-12) then
report on the empirical studies undertaken within each of the five domains of interest for
this research and discuss the implications of each of these investigations. Chapter 6 is
dedicated to an investigation of PA where such deficits are traditionally considered a
marker for the RD population. Chapter 7 examines memory performance, with the
differing memory measures constructed for use in the main child study validated and
reported within the Appendix chapter. Chapters 8 and 9 focus on the inhibition domain,
and look at the stop signal task and the Stroop task respectively. Chapter 10 focuses on
rapid naming. Chapter 11 reports on an enquiry into processing speed. Chapter 12 uses
Brinley plot analyses to organize the data from published Stroop RT studies of ADHD
and RD to determine if a general slowing factor can explain the pattern of performance
across Stroop conditions.
The final chapter, Chapter 13, provides summaries and discussion designed to
evaluate both the outcomes for each domain and the fruitfulness of the research that has

4
been undertaken in this thesis. Firstly, the cognitive correlates for each of the key
disorders are mapped in the light of the findings for each of the investigative domains.
Secondly, these findings are considered against the backdrop of the focal theories in
each area; namely, the single and double deficit theories of RD, and Barkley‟s inhibition
theory of ADHD. Thirdly, the results are considered in the light of the four key
etiological theories, and the most parsimonious account sought to best explain the
findings. The clinical and educational implications of the current research are then
contemplated. Finally, a consideration is given to possible limitations in the research
that may limit the generalisability of the results.
1.2 Significance of the Thesis
The thesis aims to advance understanding of the neuropsychological profiles of ADHD,
RD, and ADHD+RD, through:
(1) Systematic reviews focused on investigations of the five key cognitive domains with
reference to ADHD or RD;
(2) Conducting a meta-analysis to investigate possible differences in the profile of
rapid-naming deficits for ADHD and RD;
(3) Completing further, novel Brinley plot meta-analyses to investigate the potential role
of slowed speed of processing in cognitive impairment associated with ADHD and RD;
(4) Adopting rigorous sets of criteria in screening children for a fully-crossed ADHD
status x ADHD status design used in investigating the five key cognitive domains; and
(5) Developing several new cognitive tasks to enable comparisons of performance
profiles for ADHD and RD using carefully matched task variants (e.g., as in assessing
verbal and non-verbal STM and WM).

5
Chapter 2: Overview of ADHD
ADHD has had a colourful evolution - from its first literary depiction, which is
attributed to William Shakespeare‟s reference to a “malady of attention” in King Henry
VIII (Barkley, 2003a), to its embodiment in the 1845 contrasting nursery rhyme
characters, “Fidgety Phil” and “Johnny Head-in-Air”, created by German physician,
Heinrich Hoffman and, finally, through to its current clinical delineation in the
American Psychiatric Association‟s Diagnostic and Statistical Manual of Mental
Disorders, 4th edition, Text Revision (DSM-IV-TR; APA, 2000).
The first medical reference to ADHD, however, is that attributed to Crichton‟s
characterisation of ADHD-PI (1798; reported by Palmer & Finger, 2001), where he
described this “mental restlessness” as being “incapable of attending with constancy to
any one object of education (1798, p. 271), and, more simply, as having the “fidgets” (p.
272). British pediatrician Still, in 1902, described 20 impulsive children and defined
their collective behaviours by a syndrome referred to as "morbid defects in moral
control" (1902, p.1008; cited in Palmer & Finger, 2001). In 1932, Kramer and Pollnow
adopted the term hyperkinetic disease to describe a syndrome characterized by
restlessness, distractibility, and speech problems (Neumarker, 2005). Hyperactivity had
slowly begun to emerge as the major symptom of the disorder throughout the late 1950s
and this view gave rise to the hyperactive child syndrome (Laufer & Denhoff, 1957),
also referred to as hyperkinetic impulse disorder (Burks, 1960; Chess, 1960).
The diagnostic criteria have likewise evolved over the various DSM-editions. The
DSM-II (APA, 1968) nomenclature introduced to describe ADHD was hyperkinetic
reaction of childhood, and the unitary model adopted was restricted to a listing of
hyperactive symptoms emphasising the gross motor aspects of the disorder. Primarily
driven by the research of Douglas throughout the 1970s, there emerged a growing
realisation that, in addition to hyperactivity, deficits in sustained attention and impulse
control were also primary symptoms of ADHD. Spearheaded by Douglas‟ efforts, a new
term emerged to describe ADHD; that is, attention deficit disorder (ADD; APA, 1980).
In order to arrive at the new subtype allocation, the DSM-III sanctioned a tripartite

6
definition of attention deficits, such deficits then being assessed across lists of items
considered to represent the symptoms of attention, hyperactivity and impulsivity. The
disorder was renamed attention-deficit hyperactivity disorder (ADHD) in the DSM-III-
R, and a single list of items incorporating all three symptom dimensions was specified,
resulted in a diagnosed population that was more heterogeneous than before (Lahey,
Carlson, & Frick, 1997). Only with the more recent DSM-IV (APA, 1994) and DSM-
IV-TR (APA, 2000) has multi-level diagnosis again become plausible.
2.1 ADHD Definition and Core Clinical Criteria
ADHD now bifurcates in the DSM-IV1 into two empirically-derived, separate
dimensions of inattention and hyperactivity/impulsivity. Children must be elevated
across at least one of these domains (i.e., meet at least six criteria) for the behaviours so
manifested to be considered developmentally inappropriate for the child‟s chronological
age. This profile allows for diagnostic classification into one of three basic subtypes:
attention-deficit/hyperactivity disorder, predominantly inattentive (ADHD-PI),
attention-deficit/hyperactivity disorder, hyperactive-impulsive (ADHD-HI), and
attention-deficit/hyperactivity disorder, combined type (ADHD-CT), the latter subtype
being conferred when elevations of six or more symptoms occur on both dimensions.
Further, the DSM-IV requires that “clinically significant impairment” be
demonstrated as a result of the presence of ADHD symptomatology, yet “impairment”
remains undefined. Whilst there is an allowance for each diagnosis derived from the
DSM-IV criteria to be described by a level of severity – mild, moderate, or severe -
nevertheless no further guidance in the application of these levels is provided. For
instance, McKeowan (2004) found prevalence rates dropped from 12.2% of boys and
5.6% of girls who met the symptom score criterion (based on the DSM-IV criteria) on
the Strengths and Difficulties Questionnaire (SDQ; Goodman, 1997, 1999) to 5.6% of
boys and 2.3% of girls when the impact requirement (also calibrated on the SDQ) was
1 DSM-IV-TR criteria for ADHD do not differ from those published in the DSM-IV, so the more generic
DSM-IV term will be used hereafter.

7
included. For this reason, in the present research the SDQ will be used to provide an
index of ADHD impairment.
The diagnosis of ADHD must be made be a qualified clinician and pediatric
diagnosis is considered to be the gold standard in Australia. Information is collected
from parent and/or child interviews and observations, behaviour rating scales, physical
and neurological examinations, and cognitive testing. Because the core symptoms of
ADHD are mirrored in many other disorders, the making of an accurate differential
diagnosis is paramount. The comorbid presence of complicating psychiatric, medical,
and neurological conditions is sometimes unacknowledged in the research literature;
equally, comorbidity is sometimes acknowledged, but not deemed an exclusionary
criterion. This current research favours use of the Swanson, Nolan and Pelham-IV
(SNAP-IV; Swanson, 1994) rating scale, an instrument sensitive to many confounding
diagnoses.
Another conundrum rarely addressed by the literature is that ADHD symptoms are
ameliorated with medication. The major objective for the pharmacotherapy of ADHD is
that stimulant medications are prescribed to allow for the temporary suppression of
ADHD symptoms. Participants, teachers, and clinicians in one double-blind controlled
study, for example, rated 75% of children with ADHD to be improved on stimulants,
compared to 18% of placebo-treated children (Green, 1992; reported in Perry &
Kuperman, 2004). Findings from the extant double-blind controlled studies (e.g.,
Whalen et al., 1987; Klorman, Brumaghim, Fitzpatrick, & Borgstedt, 1990; Gittelman-
Klein, 1987; Green, 1992; Greenhill, 1992), suggest that psychostimulants ameliorate
the following ADHD symptoms: hyperactivity, limited attention span, impulsivity and
lack of self-control, compliance, physical and verbal aggression, negative social
interactions with peers, teachers, and parents, and poor academic productivity. It is
crucial, therefore, that all behavioural rating scales be completed in the context of the
child‟s usual behaviour when unmedicated and a medical washout period be included
within the design constraints.

8
2.2 Prevalence of ADHD
Methodological considerations likely to affect prevalence estimates encompass
community versus clinical sampling, whether gender is a specific design variable, and
the differing age ranges investigated. In regard to sex composition of samples, for
example, a higher representation of males is consistently reported in clinical samples
(9:1) than in epidemiological samples (4:1; refer Cantwell, 1996; Baumgaertel,
Wolraich, & Dietrich, 1995; Wolraich, Hannah, Pinnock, Baumgaertel, & Brown,
1996). Available evidence suggests rates of ADHD fall to 6% by adolescence and to
anywhere between 3-6% by adulthood (Barkley, Fischer, Edelbrock, & Smallish, 1990;
Mannuzza & Klein, 1999; Wender, Wolf, & Wasserstein, 2001; Wolraich et al., 1996;
Scahill & Schwab-Stone 2000; though Johnston, 2002, cites a much lower statistic, at
between .3 and 3.3% for adult ADHD). ADHD persists through adolescence into
adulthood in 30-80% of cases (August, Stewart & Holmes, 1983; Claude & Firestone,
1995; Barkley et al., 1990; Gittelman, Mannuzza, Shenker, & Bonagura, 1985; Klein &
Mannuzza, 1991; Mannuzza, Klein, Bessler, Malloy, & LaPadula, 1993; Weiss &
Hechtman, 1993), depending on whether community or clinical sampling is carried out.
Overall, the point prevalence figures for ADHD vary from 1.4-17.8% of school-
aged children across the world (Anderson, Williams, McGee, & Silva, 1987; Barabasz
& Barabasz, 1996; Barkley, 1990, 1998; Baumgaertal et al., 1995; Bird et al., 1988;
Elia, Ambrosini, & Rapoport, 1999; Landau & McAninch, 1993; McFarland, Kolstad,
& Briggs, 1994; Szatmari, Offord, & Boyle, 1989; Wolraich et al., 1996). In their
review of general population studies, however, Scahill and Schwab-Stone (2000)
reported that the best prevalence estimates range from 5-10%. Most prevalence figures
lie within or overlap this range (see also Taylor, Sandberg, Thorley, & Giles, 1991).
Figures cited by the DSM-IV suggest the population rates for the United States are
much lower, at 3-5% of school-age children (APA, 1994; see also Brown, 2000; Taylor
et al., 1998).
Australian prevalence statistics are reported at a higher rate of 11.2% (Mackey &
Kopras, 2001). The Child and Adolescent component of the National Mental Health
Survey also suggests a prevalence rate of 11% in Australian children (Sawyer et al,
2000). In contrast, the National Health and Medical Research Council in Australia

9
reported prevalence rates in 1997, using a strictly categorical approach (i.e., relying on
DSM-IV diagnostic criteria) from 2.3-6% of Australian school-age children, a figure
much more in line with the international rates cited by the DSM-IV. Research
conducted in Western Australia (WA) places the rate at 7.5% across children aged 10-
18 years (Langsford, Houghton, Douglas, & Whiting, 2001). This coincides with figures
recorded by the WA Child Health Survey (Zubrick et al., 1997) for children aged 4-16
years.
2.3 Focal Theory and Prevailing Model of ADHD
ADHD has traditionally been characterised by symptoms of hyperactivity, impulsivity,
and inattention derived from the DSM-IV. The most common criticisms of this model
are that it is a purely descriptive taxonomic system (Slee & Shute, 2003), referencing
only observable behavioural deficits, and that it explicitly claims to adopt a neutral,
atheoretical stance in respect to etiology (McGough & McCracken, 2006). More
recently, the emphasis in research circles has moved to an examination of the cognitive
deficits inherent to the disorder. These deficits are used to bolster the long-held frontal
hypothesis regarding ADHD, whereby frontal lobe abnormalities are thought to be
signposted by problems in executive functioning, such as those that occur in working
memory, planning, concentration, attention, perceptual organization, judgment, decision
making, self-monitoring, and behavioural inhibition (Benton, 1994; Fuster, 1997; Stuss
& Benson, 1986). Several researchers have examined the role of behavioural
disinhibition, not inattention, as one of the primary impairments of ADHD (Barkley,
1997a, 1997b, 2001; Douglas, 1980, 1983, 1988; Gray, 1987; Nigg, 2001; Quay, 1988,
1997; Schacher et al., 1993).
Barkley‟s (1997b) model of ADHD, the self-control model, provides the most
inclusive theory to date to explain the executive dysfunction associated with the
disorder. It has driven much of the research in this area and has implications for the
management of ADHD (Smith, Barkley, & Shapiro, 2007). (For discussions on other
models of ADHD, see Barkley, 1997a; Tannock, 2003; and Vassileva & Fischer, 2003.)
Barkley‟s model, however, is confined to an explication of the ADHD-CT and ADHD-
HI subtypes; it does not account for the ADHD-PI subtype. Barkley suggests that the

10
ADHD-PI subtype reflects deficits in speed of processing and in focused or selective
attention. However, researchers have found that the ADHD-CT and ADHD-PI subtypes
do not vary across a range of neuropsychological executive function tasks, including
tasks tapping the key inhibition domain of Barkley‟s theory (e.g., Chhabildas,
Pennington, & Willcutt, 2001; Fischer, Barkley, Edelbrock, & Smallish, 1990; Klorman
et al., 1999; Lemiere et al., 2010; Nigg, Blaskey, Huang-Pollock, & Rappley, 2002) and
many of the principal researchers in the ADHD arena still tend to use undifferentiated
ADHD groups when testing for neuropsychological impairment for ADHD children in
general (e.g., Rucklidge & Tannock, 2002; Willcutt, Pennington, Chhabildas, Olson, &
Hulslander, 2005). Nigg (2006) states that too few studies of ADHD exist to enable firm
conclusions about differences in executive dysfunction among the subtypes; for this
reason, the current research was considered exploratory in nature. Nigg goes on to state
that the pattern appears to be that ADHD-CT children generally demonstrate a larger
pattern of differences than ADHD-PI. This led Nigg to postulate that ADHD-PI may
simply be a milder version of ADHD-CT. Moreover, a recent article (Finn, 2009)
suggests that a meta-analysis of 490 studies (n = 25,000) calls the validity of subtyping
into question, and there is a suggestion that all three subtypes in fact fall on a
continuum. The DSM-V diagnostic criteria are now under review in the light of these
findings.
Executive functioning refers to a range of control processes that allows the
individual to demonstrate goal-directed behaviour, usually in novel contexts where
distracting response options compete for the individual‟s attention; efficient executive
functioning enables the individual to identify optimal action for the situation at hand
(Denckla, 1996; Pennington & Ozonoff, 1996; Willcutt, Doyle, Nigg, Faraone, &
Pennington, 2005).
Barkley (1997b) argued for the parsimony of his theory of ADHD as it is able to
account for the diverse symptomatology that has come to be recognised as constituting
ADHD. It is a hybrid theory in that it is based on a synthesis of Bronowski‟s language
theory (1977), Fuster‟s prefrontal cortex theory (1989), and Douglas‟ (1980) earlier
model of ADHD. Barkley‟s (1997b) model proposes that, rather than viewing ADHD as
a clustering of behavioural deficits derived from the traditional triad of DSM-IV

11
symptoms, ADHD should be viewed as reflecting specific deficits in executive
functioning that result in the range of behaviours customarily displayed by children with
the disorder (Barkley, 1996, 1997b, 2001, 2003a). This emphasis has effectively shifted
the focus of ADHD research to the domain of impulsivity, characterised primarily by
response (dis)inhibition. Barkley‟s inhibition deficit hypothesis for ADHD meshes with
the views expressed by other researchers in this area who have linked the
symptomatology of ADHD with impairments in response inhibition (Douglas, 1988,
1989; Milich, Hartung, Martin, & Haigler, 1994; Newman & Wallace, 1993;
Pennington & Ozonoff, 1996; Quay, 1988, 1997; Schachar, Tannock, & Logan, 1993).
Figure 2-1 provides an overview of Barkley‟s theory. Note that behavioural
inhibition is the primary component upon which four secondary areas of executive
functioning are dependent for their effective execution (Barkley, 1997a, 1997b, 2001).
All the executive functions rely on the intact functioning of the prefrontal cortex. They
also tend to scaffold; thus, they develop in a step-wise hierarchy, whereby the
successful development of each successive stage requires that the earlier stage be fully
activated. The key effect of these four executive functions is on self-regulation, defined
as “any self-directed action used to change one‟s own behaviour so as to alter the
probability of a delayed (further) consequence” (Mash & Barkley, 2007, p. 78).
Behavioural inhibition covers three interrelated concepts: (i) the ability to inhibit
an initial „prepotent‟2 response to an event; (ii) the ability to stop an ongoing response
that is rendered inappropriate or inaccurate because of changes in the task‟s demands or
feedback about performance, thus creating a protective delay period preventing
response behaviour; (iii) interference control, indicating the ability to protect the delay
period and the self-directed responses that occur within it from disruption by competing
events or responses, thus resisting distractions. ADHD individuals are purported to
show deficiencies in all three types of inhibition (Barkley, 1997b).
Nonverbal working memory mainly involves visuospatial information, and has
also been referred to as covert, self-directed sensing (Barkley, 1997a). This executive
2 By „prepotent‟ is meant a response associated with either positive (to gain a reward) or negative (to
escape or avoid an aversive or punitive consequence) reinforcement.

12
function refers to the capacity to maintain information online (i.e., via rehearsal) in
order to use this information to control subsequent actions. This form of memory
enables the individual to foresee and plan future responses and gives a sense of
Figure 2-1. Barkley‟s self-control model of ADHD.
temporal continuity. An efficient nonverbal working memory fosters foresight; that is,
foresight involves the use of the past to direct the future.
Verbal working memory facilitates the internalisation of speech in Barkley‟s
model. This self-directed, covert dialogue enables the individual to internally appraise
an event and its likely outcomes before actually generating an appropriate response to
that event. Thus, the individual is able to apply self-questioning, described as “an
interrogation of the past” (Barkley & Murphy, 2006), which in turn enhances the
individual‟s problem-solving ability. This skill fosters self-control, planning, rule-
compliance, and problem-solving.

13
The self-regulation of affect affords the individual the capacity to evaluate events
rationally and objectively, inhibiting the emotional response to that event. Emotional
drive and motivation are interlinked with the self-regulation of affect in this concept.
These attributes foster greater goal-directed persistence.
Reconstitution is the ability to analyse a message and break it down into its
constituent parts, then to reorganise these component parts into a new message in
multiple, novel, complex, and innovative ways (Barkley, 1997b). This capability is said
to foster problem-solving and creativity; thus, when problem-solving is stymied, novel
solutions can be planned and generated to overcome any foreseen obstacles through the
process of reconstitution.
These four executive functions are internal, self-directed mechanisms that regulate
the sixth facet of Barkley‟s model: the motor control and executive system. Motor
control represents the observable, behavioural response. Nonverbal working memory,
the internalization of speech, the self-regulation of affect, and reconstitution develop to
allow self-regulation, bringing motor control successively more and more under the
control of internal information rather than being dominated by the external context and
the immediate present (Mash & Barkley, 2006). Thus, if the four executive functions
have developed optimally, the individual will evidence a shift in the locus of control for
behaviour, from being controlled exclusively by the external environment, to control by
internally-represented information. This total process fosters goal-directed persistence
(Barkley, 1997a, p. 244). When all these functions operate effectively, and in tandem,
the individual is said to be able to demonstrate that ability referred to as inhibition.
2.4 Summary
The initial consideration of ADHD and its clinical diagnostic classification in this
chapter has highlighted the need for: (i) the use of a rating scale to determine the
clinically significant impairment resulting from ADHD symptomatology; (ii) the use of
a screening tool to exclude complicating comorbid disorders; and (iii) because
medication improves ADHD symptomatology, the completion of behaviour rating
scales with the child‟s unmedicated behaviour in mind is mandated, along with a
suitable medication washout.

14
The current chapter has also explored the prevalence and developmental course of
ADHD emphasized the substantial impact of this disorder. The Australian prevalence
rate is around 11%; the WA figure for school-aged children is closer to 7.5%, with a
higher representation of males in both clinical and epidemiological samples.
The accepted concept of ADHD and the variety of cognitive impairments
suggested by Barkley‟s model have also been examined. Barkley‟s model is a model of
self-control and its component parts cover three different types of self-regulation:
cognitive, behavioural, and emotional. In terms of the latter form of self-regulation, a
diverse literature exists investigating the self-regulation of affect, motivation, and
arousal in children with ADHD. This is a very broad domain which has been
empirically investigated by examining whether ADHD children have more negative and
emotional peer interactions (Braaten & Rosen, 2000; Hoza, 2007; Maedgen & Carlson,
2000; Saunders & Chambers, 1996; Southam-Gerow & Kendall, 2002), and whether
ADHD children exhibit more impairment in their persistence of effort (Douglas &
Benezra, 1990; Hoza, Waschbusch, Owens, Pelham, & Kipp, 2001; Milich, Carson,
Pelham, & Licht, 1991; van der Meere, Shalev, Borger, & Gross-Tsur, 1995). For
reasons of economy, this thesis will focus on the first two aspects of self-control,
namely cognitive and behavioural self-regulation. Likewise, reconstitution is a broad
concept that has been operationalised variously via studies of simple verbal fluency
(Carte, Nigg, & Hinshaw, 1996; Grodzinsky & Diamond, 1992; Reader, Harris,
Schuerholz, & Denckla, 1994), the creativity of ADHD children during free play (Funk,
Chessare, Weaver, & Exley, 1993), and their story-telling ability (Tannock & Schachar,
1996). Because the concept of verbal fluency overlaps quite markedly with the
reconstitution domain, reconstitution is not explored as a separate domain in the current
work.
When Barkley‟s model is viewed from this sharpened perspective, it is evident that
several viable avenues of research present for an investigation of possible markers for
ADHD. Consideration of inhibition (a cognitive self-regulating factor) as a key
cognitive deficit for ADHD is mandated by this model. (A separate literature
investigating inhibition deficits in RD is also considered, along with any literature that
has examined the two disorders in a 2 x 2 design, so as to explore the specificity of any

15
inhibition deficit for the ADHD population. This format is adhered to in the
examination of each of the subsequent domains highlighted.) Exploration of the
construct of inhibition should encompass measures that explore its three interrelated
concepts, namely stopping a prepotent response, stopping an ongoing response, and
interference control. Likewise, both verbal and nonverbal facets of working memory
(again, contributing to cognitive self-regulation) are plausible candidates for
investigation. Evidence from the literature to support the further exploration of these
domains in the main child study will likewise be examined. Barkley considers that it is
interference in the action of working memory that causes failure of the inhibitory
processes in children with ADHD. This causes children with ADHD to be controlled by
their immediate environment rather than by internal self-talk. The final domain
signposted for consideration is that of motor control, fluency, and syntax (or
behavioural self-regulation). This domain will be investigated by focusing on
processing speed, on the understanding that deficits in motor control and fluency will
lead to reduced output, delayed responses, hesitancy, and slowed RTs (Anderson, 2002).
Processing speed has added significance for this study given that Barkley (2003a) has
hypothesised that ADHD-PI children may be more impaired in cognitive processing
speed that ADHD-CT children, and that earlier investigations by the author suggested
that speed-of-processing has influence on the performance of ADHD children
(Pocklington, 2000). The literature for each of these domains is considered in Chapter 4
after the overview of RD.

16
Chapter 3: Overview of RD
The history of our knowledge of dyslexia has evolved over four distinct stages (Fischer,
Bernstein, & Immordino-Yang, 2007; Gayan, 2001; Pauc, 2005). The first stage
(roughly 1676-1894) charts the origin of knowledge of dyslexia. The first case of
dyslexia is ascribed to Schmidt, a Prussian physician (Anderson & Meier-Hedde, 2001),
who described in 1676 the case of Nicolaus Cambier who had lost his ability to read,
whilst the ability to write was preserved (Arbib, Caplan, & Marshall, 1982).
Pre-twentieth century, the study of aphasics was pervasive. The term dyslexia is
attributed to the German ophthalmologist Berlin (1884), who coined the term from the
Greek words, dys, meaning ill, or difficult, and ad lesicos, pertaining to words. He
applied the term to a specific disturbance of reading in the absence of pathological
conditions of the visual system. The term wortblindheit (word blindness, or alexia) was
used by German physician, Kussmaul (1878), to describe a male stroke victim who
demonstrated typical intelligence, but who was unable to read, despite adequate
education. This emphasis on visual processing difficulties (i.e., word blindness) became
the prevailing theory of dyslexia until the mid-twentieth century.
The emergence of the second stage in the history of dyslexia (approximately 1895-
1950) considered the study of developmental dyslexia. Hinshelwood (1895) outlined a
case of acquired dyslexia, describing a teacher who abruptly found himself unable to
read the work of his students. In contrast to this condition of acquired dyslexia,
Hinshelwood also proposed a corresponding condition must exist, one he coined
congenital word blindness, indicating a failure to learn to read; this effectively shifted
the emphasis from acquired word blindness in adults to congenital or developmental
word blindness in children. For example, Pringle-Morgan (1896) described a 14-year-
old male, Percy F., who had not yet learnt to read, yet he was a “bright and intelligent
boy” (p. 1378), who spelt his name „Precy‟.
The third stage (about 1950-1970) introduced a variety of clinical, research, and
educational approaches that have been applied to dyslexia. Critchley (1964) saw the
central problem with dyslexia as “the recognition of the visual form of a symbol and its

17
acoustic properties” (cited in Fischer et al., 2007). Geschwind (1965), drawing on the
work of Dejerine (1892), proposed that the same process responsible for attaching a
linguistic label to a visual abstract symbol would be a viable predictor of later reading
ability. Denckla (1972) developed her RN tasks based on this premise (refer to Chapter
12).
Finally, the period 1970 to current times yielded the theories and research that
have had most impact in this area. Liberman proposed that the alphabetic principle and
its relationship to phonemic awareness and phonological processing underlie most of
RD (Liberman, Shankweiler, & Liberman, 1989). Impairment in the ability to process
written words into sounds became the basis for the phonological processing theory
(refer to Chapter 6). The double deficit hypothesis, currently in favour in the
neuropsychological literature, as previously outlined, posits that phonological deficits
and processes underlying RN tasks represent two dissociable sources of reading
dysfunction.
3.1 RD Definition and Core Clinical Criteria
In this body of work, as with many researchers and practitioners, the preferred term to
refer to the problems experienced by a group of children who have difficulty learning to
read is that of reading disorder (RD). This document uses the terms reading disorder,
specific reading disorder, and dyslexia interchangeably. Likewise, the term disorder is
often used interchangeably with disability and impairment (and even retardation in the
literature published in the United Kingdom). Sometimes, too, the word developmental is
added to clarify that the disorder is not an acquired one, but one that has interrupted the
development of normal childhood learning.
According to the revised edition of the DSM-IV, RD is characterized by reading
achievement below the expected level for a child‟s age, education, and intelligence,
with the disability interfering significantly with academic achievement or the daily
activities that require reading skills. If a neurological or sensory disturbance is
indicated, the reading disability must exceed that usually associated with the other
condition. The ability-achievement discrepancy definition alluded to in the DSM-IV
guidelines is based on a categorical model for the identification of RD. The categorical

18
model suggests that reading ability is a bimodal distribution, with the lower mode
representing dyslexia; this definition holds that children whose achievement in reading
is significantly lower than their overall IQ have a unique profile of reading difficulties
that is qualitatively different from that of children who also read poorly, but for whom
their general IQ is consonant with their reading ability (Spear-Swerling, 1998). The
profile of discrepant readers, for example, should be qualitatively different from those
poor readers who have concomitant intellectual deficits, sometimes referred to as
“general backward readers”. Discrepancy in this sense is typically defined operationally
in terms of a difference between what is expected on the basis of intelligence scores and
observed reading ability on some standardised reading (usually word-recognition) test.
The discrepancy-based definition might nominate, for example, a criterion for reading
performance on the word attack test of the Woodcock Reading Mastery Tests – Revised
(WRMT-R; Woodcock, 1987) that fell at least 1.5 SDs below that level of achievement
on the test predicted by an individual‟s full scale intelligence quotient. The validity of
the discrepancy definition has been questioned by many researchers (Berninger &
Abbott, 1994; Fletcher, Coulter, Reschly, & Vaughn, 2004; Lyon & Fletcher, 2001;
Scarborough, 1989; Siegel, 1989; Vellutino, Scanlon, & Lyon, 2000; Vellutino,
Scanlon, & Zhang, 2007), the main criticism being levied at the lack of validity in the
definition‟s claim, for most children with reading problems show the same deficits in
phonological processing, regardless of IQ (Sadock, Kaplan, Sadock, 2007; refer to
Hoskyn & Swanson, 2000, and Steubing et al., 2002, for meta-analytic reviews),
suggesting that IQ-discrepant and IQ-consistent (non-discrepant, low-achieving) readers
show minimal differences on measures of reading and phonological processing and are
not qualitatively different as proposed by this definition.
The dimensional model (otherwise known as the spectrum, or low-achievement
model), by contrast, provides the idea of an unbroken continuum of reading ability and
disability, with RD representing the lower tail of a normal unimodal distribution of
reading (Gilger, Borecki, Smith, DeFries, & Pennington, 1996; Shaywitz, Escobar,
Shaywitz, Fletcher, & Makuch, 1992; Shaywitz & Shaywitz, 2003). The method
associated with this model usually relies on the application of varying thresholds to
various psychometric measures, such as standardised reading scores. The threshold

19
nominated might be, for example, a performance level of the individual that falls, say,
1.5 SDs or more below the mean for his/her age cohort) on the word attack subtest of
the WRMT. Alternatively, RD might equate in another version of this definition to a
reading level of, say, 18 or more months below that of an individual‟s normally-
developing peers on the same subtest (Snowling, 2002). Many researchers now favour
the dimensional model (Arnold et al., 2005; Gilger et al., 1996; Shaywitz et al., 1992). It
is this model that is favoured in the current study.
3.2 Prevalence of RD
Prevalence estimates for RD have varied widely over time, and are dependent on the
definitional and diagnostic criteria used (Coffey & Brumback, 2005; Prior, 1989). The
prevalence rates quoted in the literature range from 5 to10% in clinic-identified samples
(Interagency Committee on Learning Disabilities, 1987; Shaywitz et al., 1995), from 5
to 15% in school-aged populations (Benton & Pearl, 1978; Mash, Heffernan, & Barkley,
2003; O‟Brien, Wolf, Morris, & Lovett, 2004; Snowling, 2000), and up to 17.5% in
unselected population-based samples (Shaywitz, 1998), though rates as high as 30%
have been cited in American samples (Benton, 1975; Hallahan et al., 1985). Moreover,
longitudinal population-based data place the prevalence rate at between 17 and 20%
(Lyon, 1998). Twenty percent of Australian and New Zealand students are presumed to
have learning difficulties, and 5% are reputed to have specific learning disabilities, with
reading the predominant cause of such disabilities (Westwood & Graham, 2000).
It appears that the prevalence of RD is not affected by gender, the gender ratio
being close to 1:1 (DeFries & Gillis, 1991; Felton & Brown, 1991; Flynn & Rahbar,
1994; Hallgren, 1950; Lubs et al., 1993; Shaywitz, Shaywitz, Fletcher, & Escobar,
1990; Wadsworth, DeFries, Stevenson, Gilger, & Pennington, 1992; Wood & Felton,
1994). While other estimates indicate a higher preponderance of males to females
within clinical and educational samples, this is thought to be attributable to a referral
bias (Fletcher, Lyon, Fuchs, & Barnes, 2007; Hallgren, 1950). Shaywitz et al. (1990),
for example, have found that schools tend to over-identify males. Lambe (1999) points
out that the proportion of boys is higher in dyslexic samples the larger the discrepancy
between reading level and IQ; whereas the ratio is more likely equal if children are

20
included on the basis of being RD for their age, without reference to their IQ. Thus, two
possible reasons for the discrepancy in gender ratio may be referral bias and whether the
discrepancy between reading level and IQ is used in identifying cases.
Shaywitz, Gruen, and Shaywitz (2007) report that both prospective (Francis,
Shaywitz, Steubing, Shaywitz, & Fletcher, 1996; Shaywitz et al., 1995) and
retrospective (Bruck, 1992; Felton, Naylor, & Wood, 1990; Scarborough, 1990)
longitudinal studies indicate that the reading gap in dyslexia is fairly persistent over
time and does not represent a transient developmental lag (Pennington, 1991). Thus,
most dyslexic individuals identified as such as children tend to remain so as adults. Poor
readers and good readers remain relatively fixed in their position on the continuum of
reading ability (Francis et al., 1996; Shaywitz et al., 1995) so that their dyslexia does
not remit over time, and problems concerning phonological decoding and dysfluency
largely remain unresolved, persisting into adolescence and early adulthood (Prior,
Smart, Samson, & Oberklaid, 1999; Williams & McGee, 1996). Word reading and
phonological deficits have been charted in adult dyslexic samples also (Bruck, 1987;
Cirino, Israelian, Morris, & Morris, 2005; Ransby & Swanson, 2003).
3.3 Focal Theory and Prevailing Model of RD
For two decades up to the close of the last century, the dominant theoretical area
investigated in reading research, particularly reading acquisition, was that of
phonological awareness (PA). (For more complex reviews of possible causal models in
dyslexia up to the present date, refer Gayan, 2001; Lyon, Fletcher, & Barnes, 2003;
Ramus, 2006.) PA is the understanding that the sound structure of oral language
comprises constituent parts which can be manipulated (Chard & Dickson, 1999; plus
see Chapter 6 for a fuller discussion). This manipulation can vary from the manipulation
of larger units at the word level (as in rhyming songs and sentence segmentation),
through to manipulation at the syllable level, and down to the finer-grained
manipulation of individual phonemes, or the individual sounds in words. (See Figure 3-
1 for a range of phonological tasks of varying complexity.) The coarticulation of these
speech elements, or their merging, during speech production, however, can obscure the
segmental characteristics of the speech stream (Blachman, 1997).

21
The single (phonological) deficit hypothesis of RD was first mooted by Pringle-
Morgan, in 1896. The seminal work in this area was that conducted by Liberman and
colleagues (Liberman, 1971; Liberman & Shankweiler, 1979; Liberman, Shankweiler,
Fisher, & Carter, 1974; Liberman, Liberman, Mattingly, & Shankweiler, 1980) who
demonstrated the critical importance of PA in the process of learning to read (Lundberg,
1991).
Wagner and Torgesen (1987) suggest that PA is one of three processes subsumed
under the umbrella of phonological processing the other two are lexical retrieval and
phonetic recoding (see Figure 3-2). Lexical retrieval, alluded to by Wagner and
Torgesen as “phonological recoding in lexical access” in this diagram, is usually
assessed via RN tasks (refer Chapter 12 for a fuller discussion of these tasks). Naming
speed is the key measure derived from RN tasks, and naming speed indexes the degree
Figure 3-1. A continuum of difficulty of PA tasks (adapted from Yopp, 1988).
of efficiency with which a reader can retrieve the names associated with visual symbols
from long-term memory, somewhat akin to the way the reader retrieves the phonemes
corresponding to printed letters. The final ability, phonetic recoding, is used to maintain
information in short-term memory: the novice reader must first decode the printed word

22
into its constituent graphemes, generate the corresponding phonemes, hold these on-line
in a sound-based store, then blend the resultant sounds to finally interpret the written
material. Laboratory tasks like digit span tasks and list learning have been used to test
this aspect of phonological processing. Whilst all three factors are considered to
contribute to reading success, Torgesen and Hecht (1996), in an analysis of several
studies, concluded that PA and RN show causal relationships to reading acquisition.
Stanovich (1987, 1988, 1991; Stanovich & Siegel, 1994) developed this model of
dyslexia further, re-naming his version as the phonological core-variable differences
model, but again placing phonological processing impairment as the key underlying
deficit experienced by poor readers. This model of reading is one in which reading
Figure 3-2. Wagner and Torgesen‟s (1987) outline of phonological processing and its
constituent processes (adapted from Wagner, 1988).
difficulty is viewed as consisting of an invariant, primary deficit in phonological
processing, but with variability in the contribution of other cognitive skills (Fletcher,
Foorman, Shaywitz, & Shaywitz, 1999). Purportedly, the closer to this core deficit that a
particular skill lays, the more likely the RD child will experience difficulty performing
that skill. Skills considered close to the phonological core deficit are nonword reading
and PA; skills less proximal include working memory and listening comprehension
(Catts & Kamhi, 1999). Wolf and Bowers (1999), however, argued that Stanovich‟s
causal model of reading difficulties is incomplete. Their double deficit hypothesis (see

23
Figure 3-3) is based on the proposal that RN makes an independent contribution to word
reading, beyond that of PA.
Accordingly, Wolf and Bowers propose three main subtypes groups of RD
children: two single-deficit groups and one double-deficit group (refer Figure 3-4).
Thus, Wolf and Bowers identified four groups of readers: (1) the average or no deficit
group, (2) those with a rate or naming speed deficit, (3) those with a phonological
deficit, and (4) those evidencing a double deficit in both phonological decoding and
naming speed (Bowers, 1995; Wolf & Bowers, 1999; Wolf & Obregon, 1992).They
found that the rate group (2) evidenced phonological processing skills that were not
Figure 3-3. Model of the double deficit hypothesis proposed by Bowers and Newby-Clark,
2002, showing the dual contribution of PA and RN to the successful acquisition of reading.
significantly different from those of normal readers. However, their naming speed
results produced longer latencies compared to those of the unimpaired readers and
readers with a phonological deficit. By contrast, readers with a phonological deficit (3)
manifested naming rates that corresponded with the RTs of average readers, whereas
their phonological decoding ability was poorer than that of both average readers and
readers with a naming rate deficit. Moreover, those children identified as having a
double deficit (4) recorded both slower naming rates and poorer phonological decoding
skills when compared with average readers, but their phonological decoding scores did
not differ from those of the phonological single deficit group, nor did their naming

24
latencies differ from those of the naming rate single deficit group. Both single deficit
groups lagged on measures of reading comprehension by as much 1-2 years; the double
deficit group lagged by 2.5-3 years. Those children showing a single deficit in
phonological decoding or a double deficit in both phonological decoding and naming
speed were generally identified earlier within the school system, whereas children with
a single deficit in naming rate were not usually identified till approximately fourth grade
(Breznitz, 2006). Finally, children with a double deficit obtain the least benefit from
reading intervention (Bowers, 1995; Bowers & Wolf, 1993; Torgesen, Wagner, &
Rashotte, 1994; Wolf & Bowers, 1999).
Figure 3-4. The double deficit hypothesis (adapted from Wolf, 1997, p. 78).
Thus, the confluence of these theories mandates the investigation of two
overriding domains as candidate cognitive markers for the reading impaired child;
namely, PA and naming speed. The literature indicating whether deficits on each of
these possible markers reliably demarcate the RD population is outlined in Chapter 4. A
separate literature investigating the performance of ADHD children on tasks
operationalising PA and naming speed is also considered in that chapter, along with the
literature that has brought together all of the groupings (RD, ADHD, and ADHD+RD)

25
in a 2 x 2 design to explore the specificity of each of the two deficits for the RD
population.
3.4 Summary
The accepted concept of RD mandates consideration of the two core deficits suggested
by both the single and double deficit hypotheses relevant to this disorder; namely, the
inclusion of PA and RN measures in the current design. Further, a dimensional model
for diagnosing RD is favoured in the current research over the discrepancy-based
definition of RD that followed from the categorical model discussed earlier. In terms of
the prevalence statistics for this disorder, Australian statistics place the incidence of RD
at around 5%, with a possible referral bias resulting in males being over-represented in
some samples. Like its counterpart, RD is a chronic condition persisting beyond
adolescence into adulthood.

26
Chapter 4: Literature Reviews
This chapter provides reviews of the existing research for the five cognitive domains in
which empirical studies will be reported later in the thesis: PA, memory, inhibition, RN
and speed of processing. As each domain is reviewed, brief consideration will be given
to what is meant by each cognitive construct and then the literature is reviewed for both
of the single special populations, RD and ADHD, before considering any literature for
the comorbid ADHD+RD population.
4.1 Phonological Awareness
Reading is basically an alphabetic transcription, whereby the successful reader is able to
connect the arbitrary symbols of orthography – that is, letters - to the phonological
segments represented by these symbols – that is, sounds (Shaywitz & Shaywitz, 2003).
Accordingly, for this connection to occur, the reader needs to come to awareness that all
words can be decomposed into their phonological segments. Once this connection is
made and cemented, and the reader is able to make all the correct letter-sound
associations, the reader is said to have mastered the reading code (Perfetti, 1986;
Shaywitz & Shaywitz, 2003).
Research in dyslexia has traditionally focused on deficits in phonological
processing which have had a long association with reading impairment (Adams &
Bruck, 1995; Brady & Shankweiler, 1991; Byrne & Fielding-Barnsley, 1989; Ehri &
Wilce, 1980; Goswami & Bryant, 1990; Hulme & Snowling, 1992; Liberman &
Shankweiler, 1985; Liberman et al., 1974; Mann, 1986; Perfetti, Beck, Bell, & Hughes,
1987; Rack, Snowling & Olson, 1992; Scarborough, 1989; Shankweiler et al., 1995;
Stanovich, 1981, 1985; Vellutino, 1979; Wagner & Torgesen, 1987; also see Stanovich
& Siegel, 1994, for a review). This association is represented in the phonological (or
single) deficit hypothesis of RD. Pennington (1999) describes these deficits in
phonological coding as the standard explanation of dyslexia. Phonological processing
refers to the use of phonological or sound information by the individual in processing
spoken and written language. The three phonological processing skills considered

27
critical to the successful acquisition of reading skill are (a) PA, (b) verbal short-term
memory, and (c) RN (Rathvon, 2004).
Phonological awareness describes a process of deliberate reflection on, or explicit
metalinguistic awareness of, the sound structure of language (Schneider, Roth, &
Ennemoser, 2000), which taps the individual‟s ability to encode, access, and manipulate
(segment and blend) the phonological elements of speech, particularly the identification
and manipulation of a single phoneme. A phoneme is the smallest (potentially
meaningful) unit of language that distinguishes one word (or word element) from
another; for example, the letter t in tin distinguishes this word from pin or fin. PA is the
awareness of sounds in spoken language as distinct from the sounds in written language
(Sodoro, Allinder, & Rankin-Erickson, 2002). Aurally-received words from the spoken
language must be parsed into their phonemic units before an individual can identify,
interpret, store, or recall them. Speech, on the other hand, requires blending these
phonemic units into complete words (which, to the ear, appear a seamless, coherent
whole). Reading can be viewed as a two-stage process, requiring the segmentation of
letters into sound segments, and then blending these sound segments to form words. It
follows that PA has been shown to be a precursor to subsequent word reading (Mann,
1991; Stanovich, Cunningham, & Cramer, 1984; Wagner et al., 1994; for reviews, see
Adams, 1990; Castles & Coltheart, 2004; Ehri et al., 2001; Goswami & Bryant, 1990;
Gough, Ehri, & Treiman, 1992; National Reading Panel, 2000; Wagner & Torgesen,
1987).
Measures of PA and verbal short-term memory (VSTM) are strongly correlated
(Stanovich et al., 1984) and are assumed to tap a common phonological processing
substrate (de Jong, Seveke, & van Veen, 2000; Garlock, Walley, & Metsala, 2001). PA
tasks are therefore often divided into simple (low VSTM burden; i.e., blending and
segmentation) tasks and complex (higher VSTM load; i.e., elision and phoneme
deletion). Blending tasks usually require the participant to blend aurally-presented
syllables and/or phonemes to form a word or nonword when the resultant sounds are
synthesized. For example, “What word do these sounds make? /m/-/a/-/d/”, where the
correct response is ―mad‖. Segmentation tasks require breaking the aurally-presented
constituent word or nonword into its separate phonemes. For example, “Say „It‘. Now

28
say ‗it‘ one sound at a time”, where the correct response is /i/-/t/. Elision tasks require
repeating an aurally-presented word, then saying the remaining word formed when an
indicated sound is deleted. For example, “Say ‗cup‘. Now say ‗cup‘ without /k/”, where
the correct response is ‗up‘. Phoneme reversal tasks entail the repetition of an aurally-
presented nonword, then the pronunciation of the real word formed when the constituent
sounds in the nonword are reversed. For example, “Say ‗tis‘. Now tell me the word you
get if you say ‗tis‘ backwards”, where the correct answer is ‗sit‘. Non-word tasks
impose a higher working memory load compared to word tasks.
Children with RD have shown consistent deficits on measures of PA when their
performance has been contrasted with that of their normally developing peers (Bradley
& Bryant, 1983; Fawcett & Nicolson, 1994; Fletcher et al., 1994; Fox & Routh, 1980;
Katz, 1986; Nittrouer, 1999; Pennington, Cardoso-Martins, Green, & Lefly, 2001;
Shankweiler & Crain, 1986; Swan & Goswami, 1997; Torgesen, 1999; Vellutino &
Denckla, 1991; Vellutino, Scanlon, & Sipay, 1997). Some illustrative studies are
described below.
4.1.1 Research on PA and RD
Fletcher et al. (1994) reported substantially poorer performance on a phoneme deletion
test developed by Rosner and Simon (1971) for two RD groups (IQ-discrepant and low-
achievement poor readers) relative to a control group of children, all aged 7.5 to 9.5
years. Fawcett and Nicolson (1994) used the same phoneme deletion task and a PA
sound categorization task (i.e., detection of rhyme and alliteration) in comparing three
groups of dyslexic children aged 8, 13, and 17 years, with three groups of normally
achieving children matched for age and IQ. The dyslexic children performed
significantly worse than their age-matched peers on both tasks. Additionally, the 17-
year-old dyslexic group‟s results were closest to, but inferior to, those of the 8-year-old
control group.
Swan and Goswami (1997) used syllable-tapping, phoneme-tapping, onset-rime
judgment, initial-phoneme/final-phoneme judgment, and picture-naming tasks to
investigate PA in dyslexia. The syllable-tapping and phoneme-tapping tasks required
naming the picture presented, and then segmenting the word by tapping out the number
29
of syllables (or phonemes) with a pencil. For the onset-rime task, the participant read
two words and decided if the words had any sounds in common (e.g., ‗coat-goat‘,
‗sling-slot‘). The initial-final phoneme judgment tasks required deciding what sound
was common to two spoken words (e.g., ‗crust-cloud‘, ‗flood-shed‘). Swan and
Goswami‟s sample comprised conventionally-diagnosed RD children, and “garden-
variety” poor readers (i.e., children whose IQ was 85 or lower). Comparison with
chronologically age-matched control children showed the RD children to be
significantly poorer on the PA tasks at all linguistic levels (i.e., syllables, onsets, &
rimes), as were the garden-variety poor readers.
Pennington et al. (2001) compared school-aged and adolescent RD children with
both chronologically age-matched and reading age-matched control groups. At both age
levels, the RD children evidencing clear-cut deficits relative to both control groups in
PA involving a Pig Latin task and a phoneme reversal task. (Pig Latin production
requires listening to a word, such as “pig”, and generate the pig Latin version; i.e.,
“igpay”, by taking the initial consonant sound “p”, transposing it to the final position in
the word, and then affixing the letters “ay” to it.)
Felton and Wood (1989) examined the cognitive deficits associated with RD and
ADHD. The RD results will be considered here and the ADHD results referred to in a
later section (see 4.1.2). Their RD sample (identified as those children falling below the
5th
percentile on the word identification subtest of the 1977 Woodcock-Johnson Psycho-
Educational Battery) demonstrated significant deficits on measures of PA when
compared to nondisabled readers (readers falling between the 16th
and 84th
percentiles).
The PA tasks were a „final consonant differentiating task‟ (which required listening to
four words and choosing the one with a different end sound), a phoneme deletion task, a
syllable counting test, a word string memory task, and a task taken from Lindamood and
Lindamood (1971) where the participant manipulates coloured blocks to indicate sound
patterns (e.g., the stimulus pattern might be three different coloured blocks in a row,
where the instruction is "If this says aps, show me asp‖, and the correct response would
be to exchange the second and third blocks). While the RD group‟s level of
performance was below that of the nondisabled readers for all tasks, the difference was
significant only for the final consonant and elision tasks.

30
However, the interpretation of the results of these individual studies should be
tempered by a meta-analytic study (of 49 independent samples) undertaken by Swanson,
Trainin, Necoechea, and Hammill (2003). This study suggests the significance of PA
deficits as a contributing factor in dyslexia has been overstated within the literature.
Interestingly, in this study, average correlations for PA measures with real-word reading
measures ranged from 0.44 to 0.48, which were unexpectedly low given that PA is
usually accepted as an index of reading efficiency. Similarly Hammill (2004) found PA
to be a moderate predictor for reading success in his meta-analytic study (of 450
studies) with the correlation coefficient gauged from this meta-analysis of three meta-
analyses in the region of 0.40.
In conclusion, despite the wealth of individual studies attesting to the impaired
performance of RD children on tests investigating the levels of PA, the two meta-
analytic studies completed in this area suggest that, whilst an important correlate for
RD, nevertheless PA cannot solely account for the problems experienced by these
children when reading. In terms of the current study, though, it is anticipated that RD
children will evidence a pattern of deficits in measures assessing PA.
4.1.2 Research on PA and ADHD
There appear to be only three studies other than that reported by Felton and Wood
(1989) that have investigated the performance of ADHD children on measures of PA.
Felton and Wood found deficits on an elision task for two first-grade groups classified
as unambiguous and borderline ADHD (according to the Diagnostic Interview for
Children and Adolescents, Herjanic, 1983) relative to two no-ADHD groups (classified
as normal and supernormal on the same assessment measure).
In a population-based sample across four international sites, Willcutt et al. (2007)
examined 809 preschool twin pairs, 8.2% of whom met DSM-IV criteria for ADHD.
The authors found that ADHD-PI preschool children had significant correlations
between DSM-IV inattention ratings and six pre-reading composite measures (including
PA, RN, verbal memory, vocabulary, grammar/morphology, and print knowledge). The
PA composite score was derived from six measures, including sound matching
(identifying a word that starts or ends with the same sound as the target word), rhyme

31
and final sounds (identifying words that rhyme or share the same final phoneme),
syllable and phoneme blending, syllable and phoneme elision, word elision (deleting
one word from a compound word), and phoneme identity training (assessing the child‟s
ability to learn phonemes). The same correlations were not evident for ADHD-HI
symptoms in this sample.
Gomez-Betancur, Pineda, and Aguirre-Acevedo (2005) compared three groups of
children aged 7 to 11 years, classified as ADHD-CT, ADHD-PI, or normally-
developing control group children. Both ADHD groups performed similarly to control
group children on tests of auditory discrimination, visual recognition, sequential
repetition, similar words reading and writing, pseudo words reading and writing, and
two PA tasks involving oral segmentation and syllable inversion (the latter presumably
incurring increased verbal working memory allocation).
Palacios and Semrud-Clikeman (2005) compared adolescents with ADHD-CT,
Oppositional Defiant Disorder (ODD), and ADHD-CT+ODD, and control group
children on a PA cluster (comprising a sound blending task and a task requiring
recognizing a complete word based on hearing a portion of it) and a reading
comprehension cluster (reading vocabulary and reading comprehension). Although
there were no significant differences between groups on either cluster measure, in terms
of nonsignificant trends it is worth noting that the ADHD-CT+ODD group performed
worst on the PA cluster, with the ADHD-CT group actually performing better than the
remaining three groups (though higher mean IQ scores were evident for the ADHD-CT
group relative to the other groups).
Given the dearth of studies in this area, it is difficult to draw any strong
conclusions about the performance of ADHD children on measures of PA. Whilst
inconclusive, the available data do suggest that ADHD children of reading age may be
unimpaired on measures of PA involving segmentation and blending. It is unclear from
the literature reviewed how ADHD children of reading age may perform on tests of
elision and phoneme reversal, though Felton and Wood‟s (1989) study suggests the
elision task may pose difficulties for younger ADHD children. The greater VSTM load
on the latter task bears consideration.

32
4.1.3 Research on PA and ADHD+RD
Korkman and Pesonen (1994) assessed ADHD, RD, and ADHD+RD groups on a set of
neuropsychological measures standardised on a normative sample (i.e., the
Neuropsychological Assessment of Children, Korkman, 1988). ADHD children
manifested specific deficits in inhibition measures, whereas children with RD showed
specific deficits on language-based measures (assessing verbal memory span, story-
telling, and auditory analysis, where the latter required selecting a picture corresponding
to an aurally presented word fragment). ADHD+RD children showed a pattern of
deficits reflecting these combined difficulties and, in addition, more pervasive attention
problems and visual-motor problems than either of the two single disorder groups.
Pennington, Groisser, and Welsh (1993), using a fully crossed design, compared
RD, ADHD, ADHD+RD, and control school-aged boys on measures of phonological
processing and executive functioning. Phonological processing measures were the
Woodcock Johnson Psychoeducational Battery (1989) word attack subtest and
Pennington, Van Orden, Smith, Green, and Haith‟s (1990) pig Latin test. The two RD
groups (RD, ADHD+RD) performed significantly worse than the ADHD and control
groups on the phonological processing composite. On the word attack subtest alone, the
two RD groups performed significantly more poorly than both the ADHD and control
groups. On the pig Latin test alone, the two RD groups performed significantly more
poorly than the control group; and the combined ADHD+RD group performed
significantly more poorly than the ADHD group. The ADHD group mean fell between
the means of the RD and control groups on the pig Latin test, but did not differ
significantly from either.
Swanson, Mink, and Bocian (1999) employed a range of phonological processing
measures in testing four groups of poor readers subdivided on the basis of ADHD and
IQ: ADHD+RD-Low IQ, ADHD+RD-Average IQ, RD-Low IQ, and RD-Average IQ.
The phonological processing measures used were the Woodcock (1987) word attack
subtest, and phonological oddity and phoneme deletion tasks. In the phonological oddity
task, children were asked to identify which of four words differed in its initial sound
(e.g., "rat," "roll," "ring", ―pop‖). However, when verbal intelligence, word
recognition, and age were partialled out from the analysis, children with and without

33
RD and ADHD shared a common problem in phonological processing. The combined
effects of the comorbid groups (i.e., ADHD+RD-Low IQ & ADHD+RD-Average IQ)
did not differ from those of the RD groups alone (i.e., RD-Low IQ & RD-Average IQ).
This study‟s results, however, may be limited in interpretation because of some
methodological concerns: ADHD children were classified using a behaviour rating scale
administered only to a classroom teacher, and there was no control group involved.
Purvis and Tannock (2000) tested four groups of children aged 7 to 11 years on
their phonological processing capabilities using a fully crossed design; that is, two
single disorder ADHD and RD groups, a comorbid ADHD+RD group, and a control
group of normally developing children. The measures of phonological processing
included the Woodcock word attack subtest, a phoneme deletion task, a blending task,
and a phoneme segmentation task. The two reading groups (RD, ADHD+RD) were
significantly impaired relative to the two non-reading groups (ADHD, Control) on all
three measures of phonological processing. The two ADHD groups, in contrast, were
significantly impaired on the two tests of inhibition, although the RD group also showed
some impairment relative to the control group on one inhibition measure (a variant of
the stop signal task). The comorbid group exhibited the impairments of both of the
single disorder groups.
Willcutt et al. (2001) tested twins aged 8 to 16 years, who had been classified into
RD, ADHD, ADHD+RD, and control groups, on measures of PA, verbal working
memory and executive functioning. The PA composite score was indexed by
performance on a pig Latin test, a phoneme deletion task, and Lindamood and
Lindamood‟s (1971) tasks requiring the reorganization of sounds. The researchers found
the ADHD groups to be more impaired on inhibition tasks (i.e., control, RD > ADHD >
ADHD+RD), whereas the RD groups had significant deficits on a PA composite score
(i.e., control, ADHD > RD, ADHD+RD) and a measure of verbal working memory (i.e.,
control, ADHD > RD > ADHD+RD).
Willcutt, Pennington, et al. (2005) used this same triad of tasks to assess PA within
another battery of linguistic and cognitive tasks administered to ADHD, RD,
ADHD+RD, and control groups of twin pair children aged 8 to 18 years. The ADHD
and control groups consistently outperformed the two RD groups on the PA tasks, with

34
no differences evident between the single disorder ADHD group and the control group,
and no differences between the RD and ADHD+RD groups.
In conclusion, the most consistent pattern of deficits for the comorbid group on
measures of PA indicates that the results of this group are generally the same as those of
the RD group which consistently underperforms relative to the performances of both the
ADHD and control group.
4.1.4 Summary of the Literature on PA
Theories of dyslexia have traditionally held deficits in PA as a tenet of faith and
research into the performance of RD individuals on PA tasks has had a long and
substantial history. The model of RD has evolved though from the single deficit model
first proposed by Pringle-Morgan (1896) and developed later by Stanovich (1987, 1988,
1991), to a more recent consideration of RN in the double deficit model of Wolf and
Bowers (1999). Both PA and RN will be included in the research project as viable
candidate markers for RD. While consistent deficits have been found on PA tasks for
the RD population, meta-analytic findings suggest that deficits in other skills may also
be central to understanding dyslexia.
Whether PA deficits exist for ADHD and ADHD+RD children is a less researched
area. It may be that ADHD children are expected to show deficits on more complex
tasks such as the more complex elision task, which has an increased VWM load
compared to the simpler blending and segmentation tasks. The use of a range of PA
tasks indexing increased VWM involvement, however, has not been systematically
investigated so these findings remain unclear.
Where an ADHD+RD group has been included in the research design, there have
been mixed results across the range of PA tasks involved; predominantly, though, the
ADHD+RD group has shown consistent deficits on PA tasks, evidencing a similar
pattern of performance to that of the RD group in each study. A more systematic
investigation of PA across a range of clearly constructed tasks indexing increased
complexity (and verbal working memory) is mandated in order to acquire a clear
conception of this construct and its relation to the two primary disorders of interest here.
Nevertheless the bulk of the evidence appears to indicate that PA deficits might be

35
expected to surface for the RD and ADHD+RD groups, but not for the ADHD group of
children to be examined in the current research (unless, for the latter group, a deficit on
more complex versus simple PA tasks emerges).
4.2 Memory
Memory as a domain of interest for the ADHD population has only been investigated
over the past decade. Some researchers theorise whether the consistent deficits in
inhibition generally accorded the ADHD child may in fact be better attributed to deficits
in working memory (Tannock, 1998; Tannock & Martinussen, 2001). Research on
memory in the RD child, on the other hand, has spanned several decades but has
predominantly centered on an investigation of verbal short-term memory deficits
(Pickering, 2006).
Research into memory for both disorders shares a number of methodological
problems that mandate attention. These problems contribute to a lack of consensus in
the literature as to the specificity of performance deficits for ADHD and RD across
different memory tasks. Rarely, for example, are deficits systematically examined for
ADHD or RD across both verbal and visuospatial short-term memory and working
memory (some exceptions are McInnes, Humphries, Hogg-Johnson, & Tannock, 2003,
& Bedard, Jain, Hogg-Johnson, & Tannock, 2007, on the ADHD side, & Smith-Spark
& Fisk, 2007, on the RD side). Moreover, no literature exists to date investigating the
possible range of deficits as a function of modality type (verbal versus visuospatial) and
processing type (short-term memory versus working memory) across both ADHD and
RD populations. Whilst this review covers research conducted on immediate (rather
than long-term) memory in the ADHD and RD populations, for the sake of clarity,
memory measures are categorised according to both modality and the type of processing
required.
Interest in the Baddeley and Hitch (1974) model and its use in the systematic study
of both ADHD and RD is relatively recent (Pickering, 2006; Roodenrys, 2006).
According to Baddeley (1986; Baddeley & Hitch, 1974), memory comprises three
separate systems: the “central executive” is the over-arching attention-controlling
system, which acts in a supervisory capacity, controlling the flow of information to and

36
from two subsidiary systems, the phonological loop and the visuospatial sketchpad.
These subsidiary systems are considered to be domain-specific; hence, the phonological
loop is a subsystem which stores and rehearses phonological (or speech-based)
information, and the visuospatial sketchpad holds visual images or spatially-coded
information.3
Adopting the definition favoured by Miyake, Friedman, Rettinger, Shah, and
Hegarty (2001), short-term memory tasks (sometimes called simple working memory
tasks) in this document refer to those memory tasks which have only a storage
component, the simplest of these being the forwards span tasks (though several non-
span tasks also fall in this category). These simpler tasks are generally thought to be
managed by one of Baddeley‟s slave systems, and operate without any substantial
involvement of the central executive. Short-term memory tasks, therefore, are tasks that
involve the simple storage, rehearsal, and retrieval of information, processes that
purportedly occur in the phonological loop or visuospatial sketchpad (Baddeley, 1986;
Baddeley & Hitch, 1974). The term working memory tasks will refer to those complex
span and non-span tasks which involve storage-plus-processing (see Miyake et al.,
2001; Baddeley, 1992). Thus, these more complex tasks make processing demands over
and above (and overlapping with) the storage, rehearsal and retrieval processes
associated with the slave systems, and additionally tap the central executive (Baddeley
& Hitch, 1974; Baddeley & Logie, 1999). Thus, short-term memory and working
memory tasks are separable in that working memory tasks require a substantial
investment of controlled attention (Lecerf & Roulin, 2006), and draw on the resources
of the central executive. Working memory task entail some inference, transformation,
and/or monitoring of relevant and irrelevant information (Swanson, 2006) whereas
short-term memory tasks do not. Given this distinction, the added manipulation
requirement for reversing the order of any given sequence, verbal or visuospatial,
3 In a more recent revision, Baddeley‟s (2000) proposes an “episodic buffer” as a third slave system, of
limited storage capacity, that receives input from many sources. The buffer holds multi-modal
representations and is episodic in the sense that “episodes”, or life events, are held temporarily and
integrated in order to represent what is being experienced in the immediate present. However, because of
the limited research on this proposed subsystem in relation to ADHD and RD, it is not considered in the
review.

37
renders backwards span tasks working memory tasks under the task taxonomy used in
this review4.
Sometimes visuospatial tasks have been subdivided by researchers into visual and
spatial tasks. This dichotomy is essentially analogous to memory for object features (the
“what”) versus memory for object location (the “where”) a distinction that is made in
some sections of the literature. Whilst this distinction is valid (see Della Sala, Gray,
Baddeley, Allamano, & Wilson, 1999; De Renzi, Faglioni, & Previdi, 1977; De Renzi
& Nichelli, 1975; Logie, 1995; Vicari, Bellucci, & Carlesimo, 2003), it has little
influence in terms of task selection for the present research, and findings for both facets
of memory will be reported under the visuospatial task umbrella.
The memory section is broken down into three sub-sections. Firstly, the utility of
each of the four aspects of memory (verbal/visuospatial x short-term/working memory)
in differentiating ADHD and no-ADHD samples or, alternatively, RD and no-RD
samples, will be considered. Secondly, the conclusions drawn from prominent reviews
of the memory literature for the two special populations of interest are considered, again
being guided by the weight of meta-analyses, whenever available, in each area. Thirdly,
consideration is given to the development of appropriate guidelines (suitable tasks,
research designs, etc.) for the investigative study of memory across ADHD and RD to
follow.
4.2.1 Verbal Short-term Memory
Verbal short-term memory (VSTM) is typically assessed by simple span tasks. These
tasks require the participant to recall a short sequence of presented items, such as digits,
letters, words, etc., in correct serial order immediately after presentation of the list. The
items are argued to be temporarily held in short-term memory where they are stored in a
4 Inclusion of digit span backward in the verbal short-term memory category here follows accepted
practice. Indeed, forwards and backwards digit span measures are distinguishable by factor analysis
(Reynolds, 1997). However, Rapport et al. (2008) report recent studies by Swanson and Kim (2007) and
others (e.g., Colom, Abad, Rebollo, & Shih, 2005; Colom, Flores-Mendoza, Quiroga, & Privado, 2005;
Rosen and Engle, 1997) that indicate that forward and backward span tasks load on a single dimension
(Swanson et al., 1999) and are both measures of verbal short-term memory rather than involving any
central executive processing as proposed for working memory tasks. This issue pertaining to backwards
span tasks should be kept in mind, but does not impact on the final task selection process for this study.

38
phonological code and subvocally rehearsed (Jarrold, Baddeley, & Phillips, 2002); they
are not operated upon or transformed in any manner, but are recalled in their original
format. Probably the best example of a VSTM task is the digit span forwards task,
which appears in the WISC, the Children‟s Memory Scale (Cohen, 1997), the Test of
Memory and Learning (Reynolds & Bigler, 1994), the Kaufman Assessment Battery for
Children, Second Edition (Kaufman & Kaufman, 1983) and the Working Memory Test
Battery for Children (Pickering & Gathercole, 2001). In this form of task, the participant
typically must orally recall sequences of auditorily-presented, randomly-ordered
numbers of increasing length presented (usually) at the rate of one number per second.
It is one of the tasks recommended by Gathercole and Alloway (2006) as a diagnostic
instrument for the detection of VSTM deficits in children. (See Gathercole, Pickering,
Ambridge, & Weaving, 2004, for construct validation of the digit span forwards and
backwards tasks.)
In their meta-analytic review of VSTM in ADHD, Frazier, Demaree and
Youngstrom (2004) reported a significant weighted mean effect size of d = 0.64 for the
digit span task from the Wechsler scales, indicating moderate deficits for ADHD
children relative to typically developing children on this task. In fact, many studies have
shown significant effects of ADHD on digit span tasks (Anastopoulos, Spisto, &
Maher,1994; Chelune, Ferguson, Koon, & Dickey, 1986; Faraone et al., 1993;
Holdnack, Moberg, Arnold, Gur, & Gur, 1995; Loge, Staton, & Beatty, 1990; Lufi &
Cohen 1985; Mariani & Barkley, 1997; Milich & Loney, 1979; Oie, Sundet, & Rund,
1999; Roodenrys, Koloski, & Grainger, 2001; Schmitz et al., 2002; Stevens, Quittner,
Zuckerman, & Moore, 2002; Warner-Rogers, Taylor, Taylor, & Sandberg, 2000; Wiers,
Gunning, & Sergeant, 1998). In their breakdown of results by subtype, Schmitz et al.
(2002) determined that the ADHD-HI group did not differ from controls on this task,
but the ADHD-PI and ADHD-CT groups were significantly impaired. There have been,
however, other studies that have failed to find significant deficits for undifferentiated
ADHD groups on forwards digit span tasks (e.g., Adams & Snowling, 2001; Barkley,
Edwards, Laneri, Fletcher, & Metevia, 2001; Benezra & Douglas, 1988; Breen, 1989;
Karatekin, 2004; Karatekin & Asarnow, 1998; Korkman & Pesonen, 1994; Lazar &
Frank, 1998; Mariani & Barkley, 1997; McInnes et al., 2003; Oie et al., 1999;

39
Rucklidge & Tannock, 2002; Shue & Douglas, 1992; Siklos & Kerns, 2004; West,
Houghton, Douglas, & Whiting, 2002; Williams, Stott, Goodyer, & Sahakian, 2000).
Turning to tasks other than digit span, Benezra and Douglas (1988) and Siegel and
Ryan (1988), using letter span tasks, discerned no differences between their ADHD and
control groups. Schmitz et al. (2002) found that a word span task did not discriminate
the performance of any of the ADHD subtypes from control group performance.
Similarly, Felton and Wood (1989) and Roodenrys et al. (2001) concluded that the word
span task failed to distinguish ADHD and control groups; on the other hand, RD and
ADHD+RD groups were impaired relative to the control group on this task. Kalff et al.
(2002), in contrast, revealed that the word span task readily differentiated 5- and 6-year
old children with ADHD from those without ADHD; however, whilst the presence of
oppositional defiant disorder and conduct disorder were controlled, reading ability was
not, and so the poorer memory performance of the ADHD children may have been
mediated by comorbid reading problems in some of the sample.
Adams and Sheslow (1990, 2003) included a number-letter span task in their Wide
Range Assessment of Memory and Learning test compendium. In this task, the clinician
asks the child to repeat sequences of intermixed numbers and letters of increasing
length. Muir-Broaddus, Rosenstein, Medina, and Soderberg (2002) reported that their
ADHD sample performed significantly below the test norms on this task. Also, Kaplan,
Dewey, Crawford, and Fisher (1998) showed that this span task differentiated their
ADHD, RD, and ADHD+RD groups from a control group of children5.
Early investigations of VSTM in RD report consistent deficits on the digit span
forwards task (Rugel, 1974; Byrne & Arnold, 1981; Koppitz, 1975; Owen, Adams,
5 Phelps (1996), on the other hand, found little discriminative validity for the Wide Range Assessment of
Memory and Learning subtests, including the number-letter subtest, between the ADHD and RD samples
used. However, both her samples were community-based, there was little stringency in the diagnostic
criteria applied, plus they contained an uneven mix of the sexes. These methodological flaws have likely
diluted group differences (in fact, none of the verbal, visual, learning, or general memory Wide Range
Assessment of Memory and Learning domains examined showed any significant differences between the
ADHD, RD, and control groups used).

40
Forrest, Stolz, & Fisher, 1971; Rizzo, 1939; Spring, 1976). Reiter, Tucha, and Lange
(2005) showed their dyslexic sample to be impaired on a digit span forwards task (effect
size, d = 0.43). Likewise, O‟Shaunessy and Swanson (1998) report digit span forwards
performance to be impaired in the reading disabled sample used (effect size, g = -0.80).
Brosnan et al. (2002), Everatt, Weeks, and Brooks (2008), Miller-Shaul (2005),
Pickering and Gathercole (2005), and Pickering and Zacharof (2005) report comparable
findings from their studies. In contrast, McDougall and Hulme (1994) stated that
Stothard and Hulme (1992) could not find any differences between poor comprehenders
and chronological age-matched control children on the digit forwards task. Similarly,
Karatekin (2004; Study 2) and Wimmer (1993) reported nonsignificant differences
between the scores of their samples of reading impaired children and the corresponding
control groups.
Turning to other tasks, Mann and Liberman (1984), based on a longitudinal design,
argued that problems with recalling word sequences can presage future difficulties in
the successful attainment of reading skills. De Jong (1998) reported that a simple word
span task differentiated his reading-disordered and reading age-matched controls from
neurotypical controls, but this result was not replicated by de Jong and van der Leij
(2003) or Oakhill, Yuill, and Parkin (1986), who found this task unsuccessful in
distinguishing good and poor readers (as defined by outcomes on a reading
comprehension task). Roodenrys et al. (2001) found that their RD and ADHD+RD
groups performed worse than their control group on their digits forward task, as well as
on span tasks involving short and long words. As mentioned above, Kaplan et al.
(1998) demonstrated that their ADHD, RD, and ADHD+RD groups were impaired
relative to a group of typically developing individuals on a number-letter span task.
However, their RD group also scored significantly lower than the ADHD group on this
memory task.
In conclusion, on digit span forwards tasks, ADHD children showed a moderate
effect size in the available review study of this task (Frazier et al., 2004), but this task
does not consistently and reliably demarcate the performance of ADHD and control
groups of children. From the (limited) data available, letter and word span tasks do not
appear to differentiate ADHD children from control group children either. In contrast,

41
the number-letter span task shows some promise as it appears to discriminate ADHD,
RD, and ADHD+RD children from typically developing children. The bulk of the work
on digit span in RD children suggests this task has potential to distinguish RD children
from control children. Word span, on the other hand, seems a less reliable indicator for
RD. Letter-number span tasks, however, do appear promising, given they have
differentiated ADHD and RD children from each other, as well as from control group
children (Kaplan et al., 1998). Admittedly, though, data are limited and further
investigation is needed to corroborate the results of this study.
4.2.2 Visuospatial Short-term Memory
In a visuospatial short-term memory (VSSTM) analogue of the digit span task
(Roodenrys, 2006), the participant must recall increasingly longer sequences of
locations, arrayed in a quasi-random pattern, with the possible locations coming from a
clearly delimited set. The most widely used task of this kind is the Corsi blocks span
test. (Refer to Berch, Krikorian, & Huha, 1998, Vandierendonck, Kemps, Fastame, &
Szmalec, 2004, and Vandierendonck & Szmalec, 2004, for discussions of
methodological considerations for the Corsi blocks task.) The issue with the three
dimensional version of this task is that it may be confounded by the movement
trajectory of the examiner (adding an added processing dimension for the examinee).
Chuah and Maybery (1999), however, used a two-dimensional Corsi task in their
developmental study where sequences of illuminated squares on a computer screen were
recalled by a succession of screen touches.
ADHD and control children prove consistently separable on the Corsi task (Barnett
et al., 2001; Kempton et al., 1999; Scheres et al., 2003; Tripp, Ryan, & Pearce, 2002;
Williams et al., 2000). Kempton et al. (1999) established that unmedicated ADHD
individuals performed worse than both medicated ADHD and control groups on the
CANTAB version of this task; Williams et al. (2000) reported that their ADHD group
showed impaired Corsi (CANTAB) task performance compared to both a control group
and a group of children with specific language impairment.
The finger windows subtest from the Wide Range Assessment of Memory and
Learning necessitates participants retrace a sequence of holes mapped out by the

42
examiner over nine available holes, with sequence length incrementally increasing over
trials. The holes (“windows”) are randomly arrayed on a vertical sheet. The examiner
places a pencil through each item in the sequence and the child, who sits opposite the
examiner, must then reproduce the same visuospatial sequence using his or her finger.
Sequence length increases as for span tasks. The task hence assesses memory for
sequences of visuospatial locations in very similar fashion to the Corsi span task, and
purportedly draws on the simple storage and rehearsal functions of the visuospatial
sketchpad. Using this task‟s standardized forward administration, Kaplan et al. (1998)
determined that his RD, ADHD, and ADHD+RD groups were impaired relative to the
control group, though indistinguishable from one another. McInnes et al. (2003)
revealed ADHD children to be unimpaired on this task.
In the spatial span task (Case, 1992a, 1992b) participants are required to encode a
pattern of shaded cells formed over a 4 x 4 matrix, and then point to the same locations
on a blank matrix, often with a filler pattern falling in between the encoding and recall
phases. This task differs from the Corsi span task in that there is no requirement to
encode a series of locations in correct order. Using this task, Westerberg, Hirvikoski,
Forssberg, and Klingberg (2004) reported marked impairment for an undifferentiated
ADHD group relative to control children, these results replicating those of Cohen et al.
(2000). Everatt, Smythe, Ocampo and Gyarmathy (2004) showed that a similar task
differentiated ADHD but not dyslexic children from controls.
The visual sequential memory task (from the Illinois Test of Psycholinguistic
Ability) requires participants to reconstruct sequences of abstract designs which are
viewed for 5 s each. However, there is a motor confound and possibly verbal labeling
confound evident with this task. August and Garfinkel (1989) reported both ADHD and
ADHD+RD children to be impaired relative to a control group of children on this task.
The Corsi task has often been used to assess VSSTM in RD studies. Corkin (1974)
ascertained that the Corsi task differentiated reading-impaired and able readers only
when recall was delayed by 6 s (as opposed to the immediate recall condition).
However, Jorm (1983) criticized this study on the basis that participants were likely to
have used a verbal code for rehearsing the order of the taps during the 6 s delay for
recall (during which the blocks themselves were out of sight). The performance of

43
individuals with dyslexia on the Corsi block span task has generally shown no
difference in recall relative to the performance of control groups (e.g., Gould &
Glencross, 1990; Jeffries & Everatt, 2004; Palmer, 2000; Pickering & Gathercole,
2005).
As mentioned previously, the finger windows subtest has been shown to
differentiate RD, ADHD, and ADHD+RD groups from control group children (Kaplan
et al., 1998). Further, the spatial span task differentiated ADHD but not dyslexic
children from a control group of children. For the visual sequential memory task
described earlier, Kass (1966) found reading disabled early elementary school children
deficient on this task, whereas Golden and Steiner (1969) failed to replicate this result.
The possible involvement of verbal coding for some children but not others could
potentially explain the discrepancy in results for Kass versus those of Golden and
Steiner. (See Jorm‟s 1983 discussion of evidence from Hicks, 1980, that is consistent
with some children coding the visual sequential memory task symbols verbally.)
In summary, the Corsi span task reliably differentiates ADHD from control groups
of normally developing children, but has not been shown to differentiate RD and control
group children. Case‟s spatial span task also shows promise as it appears to distinguish
ADHD children, but not RD children, from control group children. Given the dearth of
studies replicating group differences on the fingers windows and spatial span tasks, the
Corsi span task seems the most viable candidate task for operationalising VSSTM.
Clearly, the bulk of the literature indicates this task has discriminative validity for the
ADHD and RD populations.
4.2.3 Verbal Working Memory
Complex span tasks are those that require ongoing processing and storage of
information during presentation, followed by sequential recall, or followed by recall of
the manipulated material in some transformed pattern (Roodenrys, 2006). Only one
non-span task, the n-back task, is considered here. However, this task still requires the
storage, maintenance, updating, and transformation of the items to be remembered and
therefore fulfils the storage and processing requirements of the current taxonomy.

44
The simplest example of the verbal working memory (VWM) task is the
backwards version of the digit span task discussed previously. Some studies have
concluded that ADHD children tend to perform comparatively worse than control
children on this task (e.g., Mariani & Barkley, 1997; McInnes et al., 2003; Milich &
Loney, 1979; Pasini, Paloscia, Alessandrelli, Porfirio, & Curatolo, 2007; Shue &
Douglas, 1992), while others have not replicated such findings (e.g., Barkley et al.,
2001; Benezra & Douglas, 1988; Korkman & Pesonen, 1994; Lazar & Frank, 1998; Oie
et al., 1999; Rucklidge & Tannock, 2002; Shue & Douglas, 1992; Siklos & Kerns,
2004; West et al., 2002; Williams et al., 2000). Tiffin-Richards, Hasselhorn, Woerner,
Rothenberger, and Banaschewski (2008) used a digit span backwards task and both their
ADHD and dyslexic groups were shown to perform significantly poorer than their
control group on this task.
However, one of the best-known VWM tasks is the letter-number sequencing task
of the Wechsler Adult Intelligence Scale Version III and the Wechsler Memory Scale
III (Wechsler,1997). In this task, the examiner verbally presents increasingly longer
sequences of intermixed numbers and letters at a rate of one per second. After each
sequence, the participant is asked to repeat the numbers in ascending order first and then
the letters in alphabetical order. Thus, the presented information must be held on-line
and rehearsed, whilst it is argued that a separate processing mechanism is employed to
transform the order of these rehearsed items into two separate sequences. The letter-
number sequencing task was used by Schweitzer, Hanford and Medoff (2006), with an
adult ADHD sample performing worse than control participants; this provided the
clearest discrimination of the two groups across the working memory measures used in
that study. The technical manual of the WISC-IV suggests its learning-disabled ADHD
group had significantly depressed scores on the letter-number sequencing subtest when
their performance was compared to that of the control group (reported in Prifitera,
Saklofske, & Weiss, 2004). Rapport et al. (2008) reported that their variation on the
letter-number sequencing task showed poorer performance for ADHD children relative
to typically developing children.
The counting span task (Case, Kurland, Goldberg, 1982) involves participants
counting aloud the number of target objects embedded in a field of distracters for each
45
card in a series, then recalling in temporal order the tallies for the cards. Thus, there is
an immediate processing demand, followed by a serial recall task. Kunsti, Oosterlaan
and Stevenson (2001), Siegel and Ryan (1989) and Willcutt et al. (2001) did not
discriminate between control and ADHD participants on this task. Significant
discrepancies between a control (showing superior performance) and ADHD group on
this task were reported by Pickering (2006); however, 4 of the 18 ADHD participants
had comorbid dyslexia, weakening the generalisability of any conclusions drawn from
this study.
For the reading span task (Daneman & Carpenter, 1980) participants read
sentences aloud and recall the final word of each sentence in a particular series in
correct serial order. Thus there is a significant processing load over and above the
storage demands of this task. Daneman and Carpenter, in their study, concluded that
performance on the complex reading span task correlated better with reading
proficiency than did performance on a simple word span task. However, this complex
span task potentially confounds reading comprehension with working memory. As
McInnes et al. (2003) point out, the task combines sentence-level language processing
with working memory demands. Kuntsi, et al. (2001), Siegel and Ryan (1989) and
Willcutt et al. (2001) reported no significant differences between ADHD and control
participants on this task. (Kuntsi et al. concluded that the initial differences between
their hyperactive and control groups dissipated once IQ was controlled.)
For n-back tasks (see, e.g., Smith & Jonides, 1997) participants typically must
monitor a sequence of verbal stimuli and respond whenever the current stimulus is the
same as that presented n trials previously, where n is a pre-specified number between 0
and 3. Hence, this task requires on-line monitoring, updating, and manipulation of
remembered information and is therefore assumed to tap working memory. Shallice et
al. (2002) and Pasini et al. (2007) found that ADHD children performed poorly on this
task when their performance was contrasted with that of typically-developing children.
Turning to studies of RD, using the digit span backwards task, Lange (2005)
showed that a dyslexic sample was impaired on this task, with a moderate effect size
reported (d = 0.54). Pickering and Chubb (2005) found that a sample of dyslexic
children differed significantly on digits backward recall from reading-age matched

46
controls, but not on the digits forward version. As mentioned previously, Tiffin-
Richards et al. (2008) reported that both of their ADHD and dyslexic groups performed
significantly more poorly than the control group on a digit span backwards task.
Pickering and Gathercole (2005) reported that an RD group fared worse on digit span
forwards than their chronologically-age-matched control group, and worse than both the
chronological-age-matched and the reading-age-matched control group children on digit
span backwards.
When compared to a matched control group, children with RD in the clinical
validity studies conducted for the WISC-IV (Williams, Weiss, & Rolfhus, 2003)
obtained significantly lower mean scores (d = 1.10) on the working memory index, of
which the letter-number sequencing task is a component. Shaywitz (2005)
recommended the letter-number sequencing task as a dyslexia assessment instrument
when probing working memory deficits in this population. It has been shown to be
helpful in the identification of adults with dyslexia (Ramus et al., 2003).
On the counting span task, Yuill, Oakhill, and Parkin (1989) reported deficiencies
in their impaired reading group relative to a control group. De Jong (1998) found that
performance on this task successfully discriminated both his reading-disordered group
and reading age-matched control group from his chronological age-matched control
participants. Pickering and Gathercole (2005), in contrast, found that the counting span
task differentiated their RD group from both their age-matched and younger reading-
age-matched control groups.
On the reading span task, Siegel and Ryan (1989) showed that RD children were
less able than proficient readers. Chiappe, Hasher and Siegel (2000) showed that poor
readers performed consistently worse than efficient readers on this task across the life
span. Willcutt et al (2001) ascertained that RD was significantly associated with
impairment in WM on the reading span task. The RD deficit remained significant even
when controlling for full scale IQ scores, digit span, and symptoms of ADHD. Stothard
and Hulme (1992) failed to find any differences between poor comprehenders and
chronological age-matched control children on the reading span task. More broadly,
meta-analytic results for this task (Jerman & Swanson, 2005) indicate a large pooled

47
effect size for the RD population (d = 1.17), indicating a marked disadvantage for this
population when compared with chronological age- and IQ-matched readers.
In conclusion, the digit span backwards task has questionable value in
discriminating ADHD and control children, though it has been shown to distinguish RD
and control children. Further, there is currently some conjecture as to whether this task
falls more naturally into the STM or WM category of tasks (refer footnote 5, p. 52).
Results on the letter-number sequencing task of the WISC-IV, though, have demarcated
ADHD children and adults from no-ADHD children and adults. Further, this task has
been shown to be helpful in the identification of dyslexic adults and is a recommended
instrument for the detection of dyslexia in children. In contrast, the counting span and
reading span tasks appear to reliably differentiate RD and control group children, but
not ADHD children from typically developing children.
4.2.4 Visuospatial Working Memory
Most tasks in the visuospatial working memory (VSWM) literature are non-span tasks.
McInnes et al. (2003), however, devised a backwards version of the finger windows task
which qualifies as a VSWM span task because it involves both the retention and on-line
manipulation of the stimulus material. McInnes et al. (2003) found that both their
ADHD groups (differentiated as to the presence of language impairment) performed
worse than a control group of neurotypical children on this particular task. Bedard et al.
(2007) also used this backwards finger windows task to assess methylphenidate effects
on ADHD memory performance across three dosage levels and a control (placebo)
level. Medium and high level dosage groups were found to outperform control and low
dosage groups on the finger windows task in its forwards format (i.e., tapping VSSTM).
In contrast, all three dosage conditions yielded statistically superior results to that of the
control condition on the backwards version.
The self-ordered pointing task (Petrides & Milner, 1982) consists of sets of cards
containing abstract stimulus items and participants are instructed to point to a different
item on each successive card. The locations of the items differ across successive cards
so to be successful on this task, participants need to remember the designs themselves
and not the locations to which they have previously pointed. Hence, participants must

48
maintain the successive designs in memory and choose an item not previously selected
on each successive card. Deficits in performance on this task for ADHD samples
compared to control samples have been reported in numerous studies (Cairney et al.,
2001; Kempton et al., 1999; Minshew, Goldstein, Muenz, & Payton, 1992; Oosterlaan,
Scheres, & Sergeant, 2005; Shue and Douglas, 1992; Wiers et al., 1998; see Pennington
and Ozonoff, 1996, for a review), but this deficit was not replicated in Geurts, Vertie,
Oosterlan, Roeyers, and Sergeant (2004), Kerns, McInerney, and Wilde (2001),
Scheres et al.(2003), and van Goozen et al. (2004). Using a task with similar demands to
the self-ordered pointing task, in which participants searched for a token hidden behind
boxes, Kerns et al. (2001) and Williams et al. (2000) reported no significant differences
between ADHD and control groups of children.
The finger windows backward task has been used in the RD literature. Martinussen
and Tannock (2006) tested groups with ADHD (with and without comorbid reading and
language impairment), a group with RD and comorbid language impairment, and a
control group of children on digit span forwards (i.e., assessing VSTM), digit span
backwards (VWM), finger windows forwards (VSSTM), and finger windows
backwards (VSWM). Overall, children with ADHD (with and without comorbid RD
and language impairment) and those with RD and language impairment showed
weaknesses in digit span backwards and finger windows forwards and backwards.
Children with RD and language impairment (with and without ADHD) additionally
showed weaknesses in digit span forwards.
Summing up, the finger windows backwards task has been investigated in a
limited fashion in both ADHD and RD populations. Whether or not it has some
discriminative ability for use in these two groups, however, is as yet undecided. Results
on the self-ordered pointing task are inconclusive for the ADHD population, and
untested in the RD population. There do not appear to be any suitable candidate tasks
from the literature for the operationalisation of VSWM.
4.2.5 Reviews of the Literature on Memory and ADHD and RD
Four significant reviews have been conducted in the ADHD area. The first, that of
Pennington and Ozonoff (1996), occurred nearly a decade before the other three

49
reviews, and the taxonomy used is not consistent with that used in the current review, so
it will not be considered here.
Martinussen, Hayden, Hogg-Johnson, and Tannock‟s (2005) meta-analytic review
of WM impairment in children with ADHD concluded that this population exhibited
deficits in multiple components of WM that were independent of comorbidity with
language learning disorders and weaknesses in general intellectual ability. Overall effect
sizes for VSSTM over nine studies (d = 0.85) and VSWM over eight studies (d = 1.06)
were greater than those obtained for VSTM (d = 0.47) and VWM (d = 0.43). These
effect sizes suggest verbal memory may be compromised in ADHD, but not to the same
degree as visuospatial memory.
Willcutt, Brodsky, et al. (2005) in their meta-analytic review of executive
functioning studies determined that six of eight studies that included a measure of
VSWM detected a significant impairment for ADHD samples relative to typically
developing samples (d = 0.63). When two small effect sizes (outlier studies) were
removed, the mean effect size increased to d = 0.75 for this domain. Six of 11 VWM
studies were significant (d = 0.55) when results for the ADHD group were compared to
those of a control group of children.
Similarly, Roodenrys (2006) argued in his review of simple and complex span
tasks in ADHD that there was little evidence for an impairment of VWM in ADHD but
stronger evidence for impairment in VSWM. Roodenrys‟ incisive critique dismantled
the memory tasks by type and pointed out design and methodological errors in most of
the studies. He concluded that ADHD children do have a deficit on visuospatial span
tasks that is unrelated to IQ.
In summary, review studies of verbal and visuospatial memory impairments in
children with ADHD indicate that the most robust deficits occur in VSWM. In fact, as
reported by Nigg (2006), Martinussen et al.‟s (2005) findings constitute the largest
effect in the literature for an ADHD neuropsychological weakness.
There are many reviews in both article and chapter form recording predominantly
verbal rather than visuospatial deficits for RD children compared to the reading
unimpaired. Several reviews document reduced VSTM with intact VSSTM (i.e., Mann,

50
Cowin, & Schoenheimer, 1989; McDougall & Hulme, 1994; Snowling, 1991; Torgesen,
1978, 1985). Further, Jorm (1983) summarized evidence of reduced VSTM in reading
impaired children, but their VSSTM performance was deemed inconclusive.
In terms of the available meta-analyses, this review must, perforce, be very
selective as few of the available studies can be readily adapted to the current taxonomy.
(For example, Hammill‟s 2004 meta-analysis used tests of verbal and visuospatial
memory but collapsed them together, concluding that there was a moderate relationship
between memory performance and reading ability.)
More specifically, there are two meta-analytic studies of note, the first focused on
STM tasks, the second on WM tasks. In the first instance, O‟Shaughnessy and Swanson
(1998) conducted a meta-analytic study across 38 studies of STM and reading
disabilities, covering 186 effect sizes. The overall mean effect size across all studies
was g = 0.64. The VSTM effect size was also moderate (g = 0.68); however, simple
span measures showed the largest effect size (g = 0.80) amongst all the VSTM tasks
overviewed. In contrast, the overall VSSTM effect size was small (g = 0.15), with
simple span measures yielding a slightly larger effect size (g = 0.17).
Jerman and Swanson (2005) reviewed 28 studies of reading disabled and able
participants (from kindergarten through adulthood) for a total of 207 effect sizes. Tasks
canvassed included those fitting the current VWM and VSWM classification as they all
involved both storage and processing. Interestingly, two of the verbal categories, those
tasks using digits or counting, and Daneman and Carpenter‟s (1980) reading span task,
achieved large effect sizes (d = 0.77, and d = 1.17, respectively); however, the
visuospatial category of tasks also achieved a substantial effect size (d = 0.95).
In summary, the bulk of the research on WM in children with RD shows the most
robust impairments for VSTM and VWM span tasks. Less consistent deficits are
evident across VSSTM tasks; however, VSWM tasks realize a more consistent pattern
of deficits for the RD population.
Thus, despite the equivocal findings on many of the tasks outlined above, overall
the existing body of literature suggests that both VWM and VSWM are affected in
ADHD, but with more pronounced and robust deficits evident in VSWM and VSSTM.

51
Similarly, most investigations of memory functioning in children with developmental
RD have demonstrated reduced VSTM skills with intact VSSTM. An area of conjecture
for the presence of a deficit for both RD and ADHD children is presented by VSWM.
Candidate tasks for the empirical study should be confined to a set of tasks
matched as closely as practicable in various aspects. This set of tasks should also
represent the verbal versus visuospatial and STM versus WM dichotomies as accurately
as possible without introducing confounds. There is also the danger in task selection that
some of the more common manipulations intended to introduce processing in moving
from short-term to working memory may introduce unwanted confounds, too. For
example, Li and Lewandowsky (1995), in investigating forward and backward recall of
verbal items, argued that backward recall relies on a visuospatial representation of the
study material. Similarly, Maybery and Do (2003) argued that backward Corsi span is
not an ideal index of VSWM. Thus, it is imperative that as “clean” a set of tasks as
possible be created to index the four memory domains.
In conclusion, four components of memory will be investigated in the forthcoming
study examining the comparative memory performances of ADHD and RD samples;
these components will vary in terms of their processing demands (storage versus
manipulation of information) and modality (auditory-verbal versus visual-spatial). Few
studies have used the full 2 x 2 set of tasks proposed for this investigation, and none has
done so in investigating both ADHD and RD populations. Simple and complex span
tasks will be favoured given the more consistent and robust findings for each special
population on such tasks. The two STM tasks would be expected to index the
phonological loop and visuospatial sketchpad under Baddeley and Hitch‟s model,
whereas the two WM tasks should, in addition, index central executive functioning.
These tasks will be fashioned on versions of the letter-number task of the Wide Range
Assessment of Memory and Learning battery and the letter-number sequencing task of
the WISC-IV to create suitable indexes of VSTM and VWM, respectively. The Corsi
blocks task will provide an index of VSSTM, and a counterpart WM task will be
fashioned to index VSWM. A preliminary dual-task interference study will be used to
validate the set of memory tasks.

52
4.3 Inhibition
Barkley‟s self-control model (1997a, 1997b) indicates that poor self-regulation and
impulsivity are the primary behavioural manifestations of ADHD6, with both problems
stemming from a core deficit in inhibition control. Response inhibition, in this model, is
the fundamental mechanism facilitating the other executive functions (refer Section
2.3). According to this account, a deficit in response inhibition thereby negatively
impacts on the other executive functions most strongly associated with ADHD.
Recall that Barkley proposed that three aspects of inhibition are affected in the
ADHD child: (a) the inability to delay the initial prepotent response to an event long
enough to consider the consequences of the response; (b) being unable to interrupt an
ongoing response in reaction to feedback; and (c) poor interference control (protecting a
delay period from disruption by competing events and responses). Note that the first two
inhibition concepts stress the blocking or dampening process that underlies their
operation (i.e., suppression, referred to by Nigg, 2001, as executive inhibition), whereas
the third implies a performance deficit arises because of the presence of competing
stimuli (i.e., interference control, also referred to as “late selection” by Nigg, 2006). The
operationalisation of inhibition, however, is somewhat unclear (Scheres et al., 2003).
Barkley (1999), for example, in his landmark treatise on inhibition, uses the stop signal
task paradigm to index both the inhibition of a prepotent response, and the inhibition of
an ongoing response. Barkley (1999) also uses the Stroop Colour Word Test
(henceforth, referred to as the Stroop) to index interference control, while many
researchers (e.g., Klingberg et al., 2005; Miyake et al., 2000) use this task to index the
inhibition of a prepotent response. It may be, of course, that more than one form of
inhibition is indicated by the demands of a particular task. However, the fusion of
Barkley‟s (1999) and Nigg‟s (2001, 2006) efforts to fractionate inhibition processes into
those tasks indexing executive inhibition and those indexing late selection would
suggest the following categorisation of tasks roughly satisfies the criteria of both
parties, and it is from these categories that viable measures of disinhibition should be
selected.

53
Nigg‟s executive inhibition encompasses Barkley‟s initial two concepts: that is, the
inability to delay the initial prepotent response, and the inability to interrupt an ongoing
response. Tasks falling into the first category include the antisaccade task (Hallett &
Adams, 1980), the continuous performance task (Rosvold, Mirsky, Sarason, Bransome,
& Beck, 1956), the matching familiar figures task (Kagan, Rosman, Day, Albert, &
Phillips, 1964; Kagan, 1966; Arizmendi, Paulsen, & Domino, 1981), the go/no-go task
(Donders, 1868/1969; Drewe, 1975), the stop signal task (Logan, 1994; Logan &
Cowan, 1984), and the Stroop (Stroop, 1935; Golden, 1978; or MacLeod, 1991, for a
review).
The antisaccade task requires participants to inhibit the reflexive tendency to look
at a sudden-onset visual target and instead execute an eye movement in the opposite
direction (for reviews, see Everling & Fischer, 1998; Hutton & Ettinger, 2006). Young
children, in general, appear susceptible to high error rates on this task (Everling &
Fischer, 1998). However, concentration difficulties or deficits in STM also cause
concerns for this task in relation to the RD population (Everling & Fischer, 1998).
Hence, the application of this task in the present study is questionable.
The continuous performance task requires the child to press a key in response to a
rarely-occurring target over an extended period of time (see Losier, McGrath, & Klein,
1996, and Frazier et al., 2004, for meta-analyses). Because most studies report most
errors are errors of omission (e.g., Barkley, Grodzinsky, & DuPaul, 1992; Carter,
Krener, Chaderjian, Northcutt, & Wolfe, 1995; Reader et al., 1994; Seidman et al.,
1995; Seidman, Biederman, Faraone, Weber, & Ouelette, 1997b), Schiffer, Rao, and
Fogel (2003) suggest that inattention is the primary underlying problem assessed by the
continuous performance task, not inhibition. Also, this task has not been successful in
discriminating ADHD from other psychopathologies (Barkley, DuPaul, & McMurray,
1991; McGee, Clark, & Symons, 2000; Tarnowski, Prinz, & Nay, 1986). (See Corkum
& Siegel, 1993, and Koelega, 2007, for critiques.)
6 Though, as noted in Section 2.3, this model is used by Barkley to account for ADHD-CT and ADHD-HI
subtypes.

54
In the matching familiar figures task the participant is shown a card containing a
target stimulus and an array of six similar visual stimuli, one of which is identical to the
target; the child is required to circle the matching stimulus. Breen and Altepeter (1990),
however, questioned the construct validity of this task and suggested it should be
thought of as sensitive to general cognitive ability or information processing speed,
rather than as strictly being a measure of impulsivity or disinhibition.
The go/no-go task requires monitoring a series of visual stimuli that are repetitions
of two alternatives (e.g., “A”, or “X”), and responding as rapidly as possible to target
stimuli (i.e., go cues, such as “A”), while withholding responses to non-target stimuli
(i.e., no-go cues, such as “X”). The go cue is usually presented more often to create a
prepotency towards responding that the individual must then inhibit in order to respond
appropriately to the no-go cue. Most of the research on this task indicates that ADHD
children tend to make excessive go errors on no-go trials (refer Barkley, 1997b;
Pennington & Ozonoff, 1996; Sergeant, Oosterlaan, & van der Meere, 1999, for meta-
analytic reviews). However, Nigg (2006) states that the major criticism of this task is
that it does not functionally isolate inhibition, questioning the construct validity of the
task; thus, failure to withhold a response may occur because of the strong prepotency of
the go process, rather than indicating a failure to inhibit a response to the no-go cue.
The two most widely used tasks in the ADHD literature to index Nigg‟s executive
inhibition are the stop signal task and the Stroop, both of which will receive separate
consideration shortly.
In terms of tasks that highlight an individual‟s inability to interrupt an ongoing
response, examples are the Wisconsin card sorting task (Heaton, 1981; Grant & Berg,
1948), the card playing test (Newman, Widom, & Nathan, 1985), and the stop signal
task.
The Wisconsin card sorting task requires sorting a series of cards to match either
the colour, form, or number of shapes on target cards, deducing the sorting rule on the
basis of feedback from the examiner (see Romine et al., 2004, for review). However,
research has yielded highly inconsistent results for the ADHD population (Barkley &
Murphy, 2005), and meta-analytic findings (e.g., Frazier et al., 2004) have produced
only small to moderate effect sizes for this task.

55
The card playing task requires participants to bet on whether a face card will
appear rather than a number card. The game creates a dominant response for reward in
the initial 10 trials, but the probability of a face card appearing diminishes over each set
of 10 successive trials, till the participant has no chance of winning if betting on the
appearance of a face card. However, this task (although considered appropriate for
inclusion in this category of inhibition tasks by Nigg, 2006) was introduced first to
assist in the detection of clinical psychopathy, and is perhaps better used to discern
those ADHD children with comborbid conduct disorder than those children diagnosed
with ADHD alone (Barkley & Murphy, 2005; Nigg, 2006). Clearly, task performance
would also be affected by factors unrelated to inhibition, such as sensitivity to the
changing frequencies of face cards.
Nigg‟s late selection category of tasks is essentially the same as those tasks
specified by Barkley under interference control, which is the preferred term hereafter.
Tasks indexing interference control include the flanker task (Eriksen & Eriksen, 1974),
the Simon task (Simon, 1969), and the directed forgetting task (Johnson, 1994); most
studies in ADHD research, however, operationalise this concept of interference control
with the Stroop.
In the flanker task, participants are asked to identify the stimulus presented at
fixation and ignore flanking stimuli (see Eriksen, 1995, and Mullane, Corkum, Klein, &
McLaughlin, 2008, for a review). Participants might make a left-handed key press, for
example, if the letter T were presented centrally, or a right-handed response if the letter
H appears centrally. On some trials, the target and flanker letters are congruent (e.g., all
the letter T), and on other trials are incongruent (e.g., central T flanked by Hs). RTs are
slowed on the incongruent condition relative to the congruent condition. However,
Facoetti and Turatto (2000) found evidence of a left-side mini-neglect indicated in their
dyslexic sample, suggesting the results of children with RD might be unfairly
compromised in the use of this task to index inhibition performance.
The Simon task requires making a right- or left-hand response depending on some
feature of the stimulus (e.g., whether it is red or green). However, participants record
faster and more accurate responses when the stimulus appears on the same side as the
appropriate response than when it appears on the opposite side. Thus, the irrelevant
56
spatial code appears to facilitate responding by pre-activating the corresponding
response code (Ivanoff, 2003). At this point in time, though, only five studies can be
identified that have evaluated this task in ADHD samples (refer Mullane et al., 2008).
In directed forgetting studies, participants are shown a series of words, or two
consecutive lists of words, and given an instruction to either remember or forget each
word (or list). The fewer the number of words successfully recalled from the to-be-
remembered set, or the more words recalled from the to-be-ignored set, the greater the
degree of disinhibition accorded the individual. Although mentioned by Nigg (2006),
like the Simon task, there is still too little data to recommend the use of this task in the
current study.
Because inhibition is not a singular concept, Band and Scheres (2005) exhort
researchers to investigate various domains of inhibition in each sample. In the ADHD
literature, despite the varying taxonomies, executive inhibition has most frequently been
measured with the stop signal task, while late selection/ interference control has been
primarily assessed with the Stroop (Mullane et al., 2008). These tasks will now be
examined in further detail.
4.3.1 Overview of the Stop Signal Task
The stop signal task is a measure of inhibitory control in which participants are
essentially engaged in a forced-choice discrimination task, making differential manual
responses to two primary stimuli as swiftly as possible without mistake (e.g., pressing
one key if an “O” appears, and another key if an “X” appears). RTs on these trials
represent the time taken to encode the visual input and give the pre-trained motor
response, referred to as the go RT (Alderson, Rapport, & Kofler, 2007). However,
occasionally and unpredictably, a second stimulus is presented; for instance, a tone may
follow presentation of the target stimulus (typically) on 25-30% of the trials. When this
second stimulus occurs, participants are required to abort their impending response to
the primary stimulus.
Essentially, therefore, the stop signal task involves two concurrent tasks: a „go‟
(primary) and a „stop‟ (secondary, response inhibition) task compete to determine the
behavioural outcome (refer Figure 4-1). According to Logan (1994; Logan & Cowan,

57
1984), if the „go‟ process wins the race, a response occurs; if the „stop‟ process wins the
race, the response is withheld. Integral to this concept is the timing of the stop signal
relative to the presentation of the primary task stimulus: the earlier the stop signal
occurs (i.e., the closer its temporal proximity to the primary task stimulus), the greater
the likelihood the individual will inhibit, withholding the response (see Band & van
Boxtel, 1999, for a recent review).
Figure 4-1 illustrates the assumptions and predictions of the race model for short
(part a) and long (part b) stop signal delays. The first figure shows how the probability
of successfully inhibiting a stop signal trial depends on the distribution of the RTs on
the go task for a particular participant, the stop signal delay, and the stop signal RT
specific to that participant. Stop signal RT can be estimated from the distribution of RTs
to the go task trials (i.e., trials without a stop signal), the probability of unsuccessfully
inhibiting (i.e., the probability of responding), and the stop signal delay. Figure 4-1 (b)
shows that when a longer stop signal delay is used, the probability of successfully
stopping the ongoing response to the primary stimulus on that trial is reduced.
Figure 4-1 (a) illustrates the assumptions and predictions of the race model across
go signal RT distributions for short and long stop signal delays. The first figure shows
how the probability of successfully inhibiting a stop signal trial depends on the
distribution of the RTs on the go task for a particular participant, the stop signal delay,
and the stop signal RT specific to that participant. Stop signal RT can be estimated from
the distribution of RTs to the go task trials (i.e., trials without a stop signal), the
probability of unsuccessfully inhibiting (i.e., the probability of responding), and the stop
signal delay. Figure 4-1 (b) shows that, when a longer stop signal delay is used, the
probability of successfully stopping the ongoing response to the primary stimulus on
that trial is reduced. Stop signal RT is assumed to be constant in this diagram and in the
race model.
Timing of the tone (stop signal delay) is varied dynamically after each trial in the
newer versions of the stop signal task. If the participant successfully inhibited the
response on the preceding stop signal trial, the stop signal delay resets so that it now
occurs later (e.g., by 50 ms) on the subsequent stop signal trial (making it harder to stop

58
Figure 4-1. The stop signal paradigm (figure adapted from Logan & Cowan, 1984, and
Rodriguez-Fornells, Lorenzo-Seva, & Andres-Pueyo, 2002).
the next time round); if the individual has been unsuccessful in inhibiting their response
and in fact responds on a particular stop signal trial, then the stop signal delay resets so
that it now occurs 50 ms earlier on the subsequent stop signal trial (making it easier to
stop the next time). The idea behind this tracking mechanism is that, eventually, both
go and stop processes will be drawn into equilibrium. The probability of stopping
successfully is, therefore, maintained at approximately 50% (Nigg, 1999). Thus, the

59
dynamic adjustments to the stop signal delay are designed to force a tie between the go
(excitatory) and stop (inhibitory) processes, with the individual‟s probability of
responding or not responding being equal. It is considered critical to this task that the
tone signal occurs occasionally, and is unpredictable. Stop signal RT is the main
outcome measure. This RT is an estimate of the time an individual needs to stop their
usual behaviour in response to the stop signal. Stop signal RT is simply estimated by
subtracting mean stop signal delay from the mean RT on the primary task trials.
The following section will examine those studies published to date on the
specificity of a deficit on the stop signal task for the ADHD population. Despite a long
and intensive interest in this task and its application to the ADHD population, there is
scant data comparing the performance of the RD population and typically-developing
children on this task.
4.3.2 Review of the Stop Signal Task Literature
Given the substantial research available in the ADHD area, this portion of the review
will focus on six meta-analytic studies. Oosterlaan, Logan, and Sergeant (1998) were
specifically interested in determining the specificity of a stop signal task deficit for
ADHD children given Quay‟s (1988, 1997) assertion that children with conduct
disorder and increased anxiety levels might also exhibit difficulties on tasks measuring
disinhibition. The authors examined eight studies (n = 456) involving children aged 6-
12 years. In the seven studies containing a group of ADHD children, ADHD children
were on average 103 ms slower than control children in terms of stop signal RT, and a
medium effect size was found for both go RT and stop signal RT (d = 0.49; d = 0.64,
respectively). A slower go RT may be indicative of a more generalised cognitive
slowing problem or, indeed, a general inattention problem on the forced choice RT task;
however, inhibition deficits are considered to be reflected in the disproportionately
longer stop signal RT relative to the go RT. Children with conduct disorder (in four of
the eight studies) were 18 ms slower than control children, and a medium effect size
was found (d = 0.51). Results, however, were quite variable. The stop signal task was
unable to distinguish ADHD, conduct disordered, and ADHD+conduct disordered
children across these studies, though anxious children did not differ from normally
developing children on stop signal task performance. Oosterlan et al. (1998) concluded

60
that there was clear evidence to support the notion of an inhibitory dysfunction in
ADHD, but that results for conduct disorder were less robust. A more recent review
(Sergeant, Geurts, & Oosterlaan, 2002) found that the stop signal task distinguished
ADHD and autistic children, but not ADHD and oppositional defiant/conduct
disordered children, and concluded a deficit on the task was not specific to ADHD.
In their meta-analysis, Frazier et al. (2004) found a weighted mean effect size on
go RTs of 0.66, and 0.54 on stop signal RTs. Executive functioning measures of
behavioural inhibition, focused and sustained attention, working memory, and verbal
fluency best distinguished the ADHD children from their no-ADHD counterparts in
Frazier et al.‟s findings.
Willcutt, Doyle, et al. (2005) recently completed a meta-analytic review examining
the validity of the executive function theory of ADHD. The meta-analysis resolved
there were significant differences between groups with (n = 3,734) and without (n =
2,969) ADHD on all 13 executive function tasks selected across the 83 studies covered.
The most consistent group differences were found on the stop signal task (82% of 27
studies) and the continuous performance task omission errors (77% of 30 studies). The
weighted mean effect size for the stop signal RT was 0.61.
Lijffijt, Kenemans, Verbaten, and van Engeland (2005) conducted a meta-analytic
review of stopping performance in ADHD to determine if this disorder was associated
with deficient inhibitory motor control or a more generalised inattention deficit. They
hypothesized that an attention deficit would be characterized by longer go and stop RTs,
and more lapses of attention (signaled by larger RT variability); an inhibitory deficit, on
the other hand, would be characterized by a disproportionately longer stop signal RT,
compared with the go RT. Twenty-nine studies of ADHD (n = 977) and no-ADHD (n =
1,078) matched controls were included. Lijffijt et al. (2005) reported effect sizes of
0.52 and 0.58, respectively, for go RT and stop signal RT, corresponding to a difference
in elongation between go RT and stop signal RT of 16 ms when comparing ADHD and
control group children. Furthermore, an additional analysis showed this difference was
not statistically significant. ADHD individuals were particularly susceptible to more
variable RTs, as indicated by the significant difference between ADHD and no-ADHD
groups on RT variability. Lijjfijt et al. (2005) concluded that the comparable slowing in

61
performance of responding and stopping, together with the enhanced variability in
performance, suggested that a mechanism other than deficient inhibitory control was
operating, and they proposed that that mechanism was more likely to be ascribed to
generalized inattention when ADHD children were performing the stop signal task.
In the last of the meta-analyses on the stop signal paradigm, Alderson et al. (2007)
criticized Lijjfijt et al.‟s (2005) review because of the heterogeneity of samples and stop
signal task versions in the studies selected. Alderson et al. felt that including fixed and
dynamically changing stop signal delay studies seriously compromised the findings
reported: fixed stop signal delays have no associated within- or between-subject
variability so they might artificially deflate any between-group differences in stop signal
delay effect size estimates. Whilst 25 studies were included in the Alderson et al. (2007)
review, eight dynamically tracked the stop signal delay. Alderson et al. found dynamic
stop signal delays were associated with a larger effect size estimate, suggesting that
findings cannot be generalized across studies using fixed and dynamic methodologies.
As with Lijjfijt et al. (2005), however, the overall results revealed significantly slower
go RTs and slower stop signal RTs in children with ADHD relative to typically
developing control children, plus greater RT variability. The slower go RTs may have
been due to inefficient cognitive processing and/or inattention, and the greater RT
variability might have been due to more lapses of attention, or a greater inhibition
deficit; but, overridingly, the disproportionately longer stop signal RTs relative to the go
RTs were again taken as the key indicator for an inhibition deficit. The effect size for go
RT was 0.49, and 0.63 for stop signal RT, comparable to those reported by both
Oosterlaan et al. (1998) and Lijjfijt et al. (2005).
In summary, the finding of prolonged go RT and stop signal RT in ADHD
children, coupled with more variable RTs overall, is a robust finding among the meta-
analytic studies completed in this area to date.
In the only study specifically examining inhibition deficits in children with a RD,
van der Schoot, Licht, Horsley, and Sergeant (2000) examined children with two
hypothesised types of dyslexia: a guessing subtype (those who read fast, but
inaccurately) and a spelling subtype (those who read slowly, but accurately). They
compared 40 RD participants (20 spellers, 20 guessers) with 20 typically developing

62
children, all aged 9-12 years. In comparison with control children, dyslexic children had
slower go RTs, slower stop signal RTs, and greater RT variability. In comparison with
spellers, guessers were found to have a slower stop signal RT, and showed greater
variability in RT data, but comparable go RTs. Additionally, guessers were more
susceptible to interference on a Stroop task, and also made more inaccurate moves on a
Tower of London task, than spellers. However, given this is the only study investigating
inhibition and RD that came to light after an extensive search, it is not possible to draw
any firm conclusions. It does appear, however, that for some RD participants (the
guessers, who also, it should be noted, had more elevated scores than both spellers and
control children on an ADHD behaviour rating scale), problems with inhibition-type
tasks are indicated. These results are mitigated, somewhat, however, by the following
findings where levels of ADHD and RD are disentangled in carefully selected samples.
Only three studies have been undertaken to date investigating the differential
performance of ADHD, RD, and ADHD+RD groups on the stop signal task. First,
Purvis and Tannock (2000) tested these three groups (n =17 per group) and 17
comparison children who were free of an ADHD or RD diagnosis. All the clinical
groups, however, were rated highly on teacher ratings of emotional disorders relative to
the comparison group, the RD and ADHD+RD group were rated higher on parent
anxiety ratings, and the ADHD group were rated higher on parent and teacher ratings of
conduct and oppositional defiant disorders. On the stop signal task, there was a main
effect for ADHD on go RTs and also on a measure of variability in these RTs.
Surprisingly, a main effect for RD was found on stop signal RTs. However, a trend for
ADHD to be associated with longer stop signal RTs was also observed. ADHD children
were slower and more variable when responding to the go portion of the stop signal
task. However, contrary to expectations, Purvis and Tannock (2000) found poorer
inhibition, as indicated by longer RTs to the stop signal, was associated with both
ADHD and RD but to a greater (statistically significant) extent with RD.
Rucklidge and Tannock (2002) assessed 35 ADHD, 12 RD, and 24 ADHD+RD
participants, along with 37 normally-developing control participants. They employed a
dynamic stop signal task and the Stroop to assess varying levels of disinhibition
amongst these groups. The two ADHD groups were more impaired on the stop signal

63
task than the control group, showing greater variability in go RTs, with the ADHD+RD
group proving the most impaired, showing greater variability relative to the ADHD and
RD groups as well. The ADHD+RD group also had significantly slower go RTs than
the control group. Both ADHD groups had slower stop signal RTs than the comparison
group.
Willcutt, Pennington, et al. (2005) examined 113 ADHD, 109 RD, 64 ADHD+RD,
and 151 typically-developing comparison children using both the stop signal task and
the continuous performance task to assess response inhibition. Using categorical
comparisons between groups with and without ADHD and multiple regression analyses,
Willcutt, Pennington, et al. (2005) determined that ADHD was associated with slower
stop signal RTs and more commission errors on the continuous performance task.
Moreover, the ADHD main effect was larger on a composite score based on the two
inhibition tasks than for any of the other neuropsychological variables under
investigation. However, Willcutt, Pennington, et al. (2005) found that the two RD
groups were significantly slower on the go RT variable than the ADHD and control
groups. Relative to the control children, all three clinical groups were significantly more
variable in go RT latencies, and had significantly longer stop signal RTs. The effect size
for the inhibition composite score was somewhat larger for RD than ADHD. The
authors concluded that mild inhibition deficits may be evident in RD and exhorted
researchers to determine if the same underlying processes that lead to a lack of
inhibition in ADHD also contribute to the trend for RD indicated in their research
report.
In conclusion, given the support for this task in the literature, the stop signal task
appears to be a viable vehicle for the investigation of that form of inhibition which
indexes the individual‟s ability to interrupt an ongoing response. The above
investigations appear to confirm the general findings in the ADHD area (i.e., of
prolonged go RT and stop signal RTs, plus increased variability for ADHD), but also
question the specificity of stop signal task deficits for ADHD given the findings of
Purvis and Tannock (2005), Willcutt, Pennington, et al. (2005), and van der Schoot et
al. (2000). Slowed stop signal RT, coupled with slowed go RTs, is indicative of a
specific inhibition deficit in children with ADHD only if there is a disproportionately

64
longer stop signal RT relative to the go RT (Lijffijt et al., 2005), and if their stop signal
RT is also longer than that of the control group (Alderson et al., 2007). An attention
deficit for ADHD, on the other hand, would be signaled by longer go and stop RTs, and
more lapses of attention (i.e., larger RT variability) in this group relative to control
children.
In relation to the findings in the RD area, the overall pattern of results suggests
that there may also be a general impairment in attention (reflected on all measures) and
also a possible more specific inhibitory problem (reflected in stop signal RTs) for this
population.
4.3.3 Overview of the Stroop Task
The Stroop task is a classic test of response inhibition in the sense that it produces a
clear response conflict: in its colour-word condition, the participant must suppress an
automatic, overlearned, prepotent response (e.g., reading the word „red‟) in favour of a
less automatic response in stating the colour of the written word (which, e.g., might be
printed in blue ink). Whereas the stop signal task involves inhibition of an ongoing
motor response, the Stroop requires inhibition of a cognitive representation, which is
competing with the correct response option during the delay period before the final
response is made (Nigg, 2001; Ossman & Mulligan, 2003).
The Stroop task is widely used as a measure of interference control in studies with
ADHD groups. The test in hardcopy format consists of three cards with 100 stimuli
each, typically ordered in five columns of 20 stimuli. It comprises three conditions
administered in fixed order: a word-naming condition (colour words printed in black); a
colour-naming condition („xxxx‟ printed in various colours); and an incongruent, or
response-conflict condition, in which words denoting colours are printed in an
incongruent colour (such as the example given previously; i.e., the word „red‟ printed in
blue ink). To perform correctly on the last card, instructions explicitly advocate
participants inhibit the automatic reading response, and instead name the colour of the
ink for each given stimulus. Commonly used indices of performance are the latency to
complete each card or a rate measure such as the number of items completed in 45 s.

65
Given this task‟s dual emphasis on speeded naming and suppression of a
conflicting response, it has had application in both RD and ADHD research. The
following section summarizes previous studies of Stroop performance in ADHD, RD,
and comorbid groups. Much of this research comprises separate investigations, though
some studies have employed a fully crossed designed and are weighted more heavily for
direction in the current research. Review and meta-analytic papers again provide a
launching pad for this portion of the review.
4.3.4 Review of the Stroop Literature
Almost all studies over the past few decades have found ADHD children impaired on
the Stroop, in that this population exhibits pronounced increases in latency on the
critical incongruent condition relative to control children. See, for example, Barkley et
al.‟s (1992) review of five studies in which the Stroop colour-word condition
distinguished (undifferentiated) ADHD and control children. Several more reviews have
since found that ADHD children regularly exhibit deficits on the Stroop interference
condition (Barkley, 1997b; Pennington & Ozonoff, 1996). Frazier et al. (2004), for
example, report a weighted mean effect size in their meta-analysis of 20 studies of 0.56
for the ADHD versus control group comparison on Stroop colour-word scores.
Likewise, Nigg, Willcutt, Doyle, and Sonuga-Barke (2005) found effect sizes of 0.50-
0.84 for the colour-word condition across three sites (n = 287 ADHD & n = 600 control
participants).
More cautiously, Nigg (2001) argued that support for an ADHD inhibition deficit
was inconclusive because those studies cited in his review did not reliably control for
response output speed (i.e., word and colour naming ability), raising concern that poorer
results for ADHD children were equally likely to be attributed to deficiencies in
response output, or speeded naming, as to deficits in interference control. Lending
support to this notion, Homack and Riccio (2004), in their meta-analysis of 33
published studies, indicated that ADHD children and adolescents typically demonstrate
poorer performance than their control peers across all three subtests of the Stroop (d =
0.50 or greater).

66
Researchers are now urged to compute interference scores by correcting colour-
word scores using word and colour scores (Bedard, Ickowicz, & Tannock, 2002; refer
Homack & Riccio, 2004, for a fuller report on the various calculations used to arrive at
an interference score, and van Mourik, Oosterlaan, & Sergeant, 2005, for the
implications for results depending on the method of calculation employed). Those
studies failing to correct for basic word naming (the purported reading ability measure)
and colour naming (the purported naming speed measure) fail to take observed RN
deficiencies (see Tannock, Martinussen, & Fritjers, 2000) into account (Bedard et al.,
2002). Willcutt et al. (2001) also endorsed this view; they stressed that if ADHD is
associated with a specific deficit in interference control, rather than difficulties with
speeded naming, any difference in performance for ADHD versus control samples for
colour-word performance should remain significant after scores for the word and colour
trials are controlled. Van Mourik et al.‟s (2005) meta-analysis specifically examined
word and colour scores to determine if an RN deficit was more likely to explain
deficiencies on the colour-word portion of the Stroop task for ADHD children. Despite
finding that the effect for the adjusted interference score was nevertheless significant,
indicating some impairment to inhibition, van Mourik et al. questioned whether
interference control was the primary deficit in ADHD. For example, whilst they found a
medium effect size for the word and colour conditions across the 16 studies they
examined (d = 0.49 & 0.58, respectively), the effect size for the interference score
(factoring in scores on the word and colour conditions) was small (d = 0.35).
When examining individual studies that use the Stroop task to investigate
neuropsychological functioning in ADHD children, Bedard et al. (2002), like Nigg
(2001), caution that many researchers have concluded support for the inhibition
hypothesis based on a more marked decrement in the performance of ADHD children
relative to that of control children on the colour-word condition, ignoring results
obtained on the word and colour conditions (e.g. Boucugnani & Jones, 1989; Miller,
Kavcic, & Leslie, 1996; Perugini, Harvey, Lovejoy, Sandstrom, & Webb, 2000).
Findings from Barkley et al.‟s (1992) own investigations, for example, revealed that
both of their ADHD groups (with and without hyperactivity) scored significantly lower
than the neurotypical group on the word condition as well as the colour-word condition

67
of this task. The fact that groups were differentiated across several conditions points to
the possibility that factors other than inhibitory capacity may moderate such results.
Likewise, Seidman et al. (1997b) found that ADHD children were significantly
impaired on all three Stroop conditions compared to a normally-developing comparison
group. Semrud-Clikeman et al. (2000b) reported that her ADHD-CT sample of children
performed significantly more poorly on all of the Stroop measures relative to a control
group‟s performance. Nevertheless, several researchers have reported a specific
interference control deficit even after controlling for naming speed; for example, studies
by Carter et al. (1995), Seidman, Biederman, Mounteaux, Weber, and Faraone (2000),
Lufi, Cohen, and Parish-Plass (1990), and MacLeod and Prior (1996) concluded there
were grounds for an ADHD inhibition deficit, given that significant discrepancies
remained between ADHD and control group colour-word scores after adjustments were
made for performance in the other Stroop conditions. In contrast, Gorenstein,
Mammato, and Sandy (1989), Grodzinsky and Diamond (1992), Leung and Connolly
(1996), Houghton et al. (1999), Nigg et al. (2002), and Rucklidge and Tannock (2002)
failed to find support for the inhibition hypothesis once response speed was controlled
in this fashion, such calculations diminishing disparities between the ADHD and control
groups under investigation. Barkley et al. (1992), in their review study, noted that
discrepant results on the Stroop may be due to the use of small and mixed-sex samples,
and variation in ADHD diagnosis or diagnostic procedures.
Typically in the ADHD literature, RTs for this population for the word and colour
conditions are significantly slowed in comparison to RTs for the control group. Overall
response output speed, though, will be an important consideration in the current study to
ensure deficiencies exhibited on the Stroop by ADHD children are not attributable to a
lack of proficiency in speeded naming rather than a specific deficit in interference
control. With this view in mind, two indices will be brought into play: both a frequency
count (in Section 10.1.3) and a RT per item. This will allow for a more complete
evaluation of the impact of the Stroop on naming/interference control in ADHD
children.
Only a handful of studies have investigated Stroop performance in RD children.
Given the deficit in RN normally accorded the RD population, it is not unreasonable to

68
anticipate difficulties on the word and colour subtests of this task; their problem with
reading will also obviously impact on their performance in the word condition. Because
the colour-word condition of this task relies on the significant development of
automaticity in reading, it is generally hypothesised that RD children will show less
interference than control and ADHD children (Everatt, Warner, Miles, & Thomson,
1997; Golden & Golden, 2002), but show slower latencies on the word and colour
conditions than both these groups. This hypothesis was supported by the Golden and
Golden (2002) study. However, Everatt et al. (1997) and Reiter et al. (2005) found
dyslexic children impaired on both the word and colour-word subtests, but not the
colour naming subtest, relative to the performance of typically-developing control
children (no ADHD groups were used). Greater interference for the reading-impaired
groups in the colour-word condition is consistent with the findings of Kelly, Best, and
Kirk (1989) and Protopapas, Archonti, and Skaloumbakas (2006). Helland and
Asbjornsen (2000), and Wolff, Cohen, and Drake (1984) found impaired readers
significantly slowed across all three subtests when their scores on the Stroop were
compared to those of a control group of normal readers. Similarly, Das et al. (1990)
found the three subtests to consistently distinguish good and poor readers.
Rucklidge and Tannock (2002) employed a design in which ADHD status and RD
status were fully crossed factors. Their RD group performed at the same level as their
control group on both the colour naming and the colour-word subtests, but was
significantly slower on the word naming task. Their ADHD group performed worse
than the control group on the colour and colour-word subtests. Their ADHD+RD group
proved significantly more impaired than both control and ADHD children on the word
subtest, but not more impaired than the single disorder RD group. Their comorbid group
and ADHD group were both more impaired than the control children on the colour
subtest, and were more impaired than both single disorder groups on the colour word
subtest. Willcutt et al. (2001), on the other hand, found impaired readers significantly
slowed across all three subtests compared to a typically-developing control group. Their
ADHD group was only significantly more impaired than the control group on the colour
and colour-word subtests. Their ADHD+RD group demonstrated deficient
performances across all three conditions in comparison to the control group. Finally, in

69
the Willcutt, Pennington, et al. (2005) investigation, the RD, ADHD, and ADHD+RD
groups all had significantly lower output than the control group on the word, colour, and
colour-word conditions. No differences were found on interference scores between any
of the clinical groups and the control group children in any of the three fully crossed
designs mentioned.
In summary, with Barkley‟s identification of inhibitory control as the core
impairment in ADHD, the colour-word condition of the Stroop task became the focus in
research on this disorder. However, it is now apparent that outcomes on the critical
interference condition cannot be considered in isolation, but must be indexed in some
fashion by word and colour naming before any deficit demonstrated can be ascribed to
inhibition impairment for this population. The available evidence indicates that children
with ADHD typically show slowing relative to typically developing children for all
Stroop conditions. It is unclear whether performance in the colour-word condition is
adversely affected by an additional impairment in inhibition. Limited research has been
conducted on RD using the Stroop, and the outcomes of this research are equivocal.
4.3.5 Summary of the Literature on Inhibition
The initial part of this section used Barkley‟s and Nigg‟s taxonomies of inhibition tasks
to justify focusing on the stop signal and Stroop tasks. The review then moved to
consider research on the stop signal task. Findings in the ADHD literature pertaining to
this task indicate prolonged go RTs and longer stop signal latencies, coupled with
greater overall variability in RTs. Because of the limited data available (only one study
emerged) it is not possible to speculate on RD performance on the stop signal task. Van
der Schoot et al. (2000) did find slower go RTs, slower stop signal RTs, and greater RT
variability when they compared RD and typically-developing children. Where 2 x 2
designs have been employed (3 instances), results were inconsistent, but the RD groups
were generally distinguishable from the ADHD groups, and the ADHD from the control
groups, depending on the measure examined.
Research on the Stroop task indicates that slowing may be evident for the colour
and word conditions for both the ADHD and RD populations. Whether an additional
deficit in inhibition influences performance in the colour-word condition for either

70
disorder is a moot point. Further analysis using a 2 x 2 design is required to tease out the
underlying processes that disadvantage the ADHD, RD and ADHD+RD populations on
each particular condition of this task. Two dominant issues to be addressed in further
research concern clarity around the interpretation of results from the Stroop and the
specificity of deficits on the Stroop in relation to the two the RD and ADHD
populations, and their comorbid overlap.
4.4 Rapid Naming
The foundation for the RN task lies in Geschwind‟s (1965) hypothesis that the same
processes drawn upon by colour naming would also underpin word reading (Wolf,
1997). Geschwind and Fusillo (1966) described a case reported in 1892 by French
neurologist, Dejerine, detailing a patient with alexia without agraphia, or „pure word
blindness‟ (cited in Denckla & Cutting, 1999). A stroke had left the patient unable to
read, but still able to spell and write words. The patient was also unable to name
colours, despite evidencing normal colour-matching ability; moreover, object and letter
naming skills remained intact. The inference drawn was that perhaps the same
neurological substrate governing word reading also governed colour naming.
4.4.1 Origins of the RN Task
These findings led Denckla (1972) to conjecture that children with unexpected reading
failure might also be unable to generate colour names. In the continuous RN colour
(RNC-colour) task devised by Denckla (1972), square patches of five common colours
were randomly repeated so that 50 squares were presented in a 5 x 10 array, with time to
name all 50 colours recorded. Denckla (1972), in her study, found that rather than being
unable to generate colour names, children with unexpected reading failure in the first
grade demonstrated longer colour-naming latencies. This hesitancy was ascribed to a
lack of automaticity.
Subsequently, Denckla and Rudel (1974) introduced the four traditional
continuous RN conditions to examine naming in typically-developing children: that is,
RNC-letter, RNC-number, RNC-colour, and RNC-object (the graphological stimuli
consisted of single letters or numbers, the nongraphological categories comprising

71
coloured squares or pictured objects). They observed that, although the two
graphological categories were acquired last developmentally amongst the four
categories of items, they were named at increasingly faster speeds than the two
nongraphological categories across childhood. Denckla and Rudel (1976b) then tested
typically-developing children and children with either dyslexic (with a reading lag of at
least two years) or other learning disabilities on the four RN conditions. These
conditions successfully differentiated the dyslexic children from the other two groups of
children. The utility of the four RNC conditions in differentiating dyslexic children
from children with other learning disabilities was confirmed by Denckla, Rudel, and
Broman (1981)
4.4.2 Review of the Continuous Rapid Naming Literature
4.4.2.1 Processes Underlying RN
Continuous rapid naming is a natural analogue of the reading process (Blachman, 1984).
Most researchers claim that differences in the degree of automatisation of certain classes
of stimuli may only be revealed on continuous naming tasks that, like reading, require
more than the retrieval of a single name (e.g., subprocesses, like scanning, relevant to
both reading and RNC, are not tapped by, say, the discrete version of the RN task).
Similarly, Stanovich (1981) suggests that serial naming speed might be related to
reading due to something other than the time taken to access phonological codes or to
identify symbols, such as the attentional processes required for managing and
processing serial information. To this list, Fawcett and Nicolson (1994) would add rapid
tiring, place-keeping, and error recovery. Denckla and Cutting (1999) suggest that the
added cognitive demands of the continuous format highlight why the slowness and
inefficiency observed in RD may overlap with the executive dysfunction characteristic
of ADHD children: the authors feel that RNC tasks tax those executive processes of the
language system (e.g., scanning and sequencing) that lie at the „intersection‟ of the
neurological domains hypothesized to underlie ADHD and RD. Consistent with these
proposals, Bowers and Swanson (1991) found that RNC performance accounted for
variance in reading ability after controlling for performance in a discrete version of the
RN task. Moreover, slow RNC performance in kindergarten is predictive of later

72
reading performance (see Scarborough, 1998, for review), and RNC deficits continue
into adolescence (Korhonen, 1995), and adulthood (Felton et al., 1990) for the dyslexic
population.
4.4.2.2 Differential Effects and Age-related Change in Rapid Naming
There are considered to be differential effects for the various RNC conditions, both in
relation to reading and in comparing the two populations of interest, RD and ADHD
children. In particular, RNC-letter and RNC-number are considered to be robust
predictors of single word reading (Denckla & Cutting, 1999), particularly RNC-letter
(Neuhaus, Foorman, Francis, & Carson, 2001), but not of reading comprehension
(Meyer, Wood, Hart, & Felton, 1998; Scarborough & Domgaard, 1998, reported in
Wolf & O‟Brien, 2001). RNC-colour and RNC-object, on the other hand, are considered
to be less predictive of word reading as the individual ages (Blachman, 1984, Compton,
2003; Compton, Olson, DeFries, & Pennington, 2002; Denckla & Rudel, 1974; Denckla
& Rudel, 1976a; Manis & Doi, 1995, reported in McBride-Chang & Manis, 1996;
Wimmer, 1993; Wolf, 1991; Wolf, Bally, & Morris, 1986).
All RNC conditions (letters, numbers, colours, objects) have proven to be good
predictors of reading in kindergarten-aged children, and are performed at similar general
rates at that age, though RNC-colour and RNC-objects lose some of their predictive
ability by 1st and 2
nd grade for average readers, and there is further decline thereafter
(Badian, 1996; Schatschneider, Fletcher, Francis, Carlson & Foorman, 2004; Semrud-
Clikeman et al., 2000a; Wolf et al., 1986). Savage (2004), for example, noted that in the
beginning stages of letter recognition (i.e., during the kindergarten years),
nongraphological stimuli are named either faster than, or as fast as, graphological
stimuli. It is not until after the start of formal schooling that letters and numbers are
named faster than colours and objects (Cronin & Carver, 1998; Denckla & Rudel,
1976a; Misra, Katzir, Wolf, & Poldrack, 2004; Wolf et al., 1986). This is arguably
because the naming latencies of graphological stimuli decrease as their processing
becomes more automatic. Differences between good and poor readers are consistently
greater for alphanumeric stimuli than for non-alphanumeric stimuli thereafter (e.g.,

73
Bowers, Steffy, & Tate, 1988; Compton, Defries, & Olson, 2001; Felton & Brown,
1990; Murphy, Pollatsek, & Well, 1988; Wolf, 1999; Wolf et al., 1986).
4.4.2.3 Patterns of Deficit for RD and ADHD Children
Given the vast number of studies that have been conducted showing consistent deficits
for poor readers on the traditional RN tasks, this review looks only to those studies that
have examined together the two special populations of interest, that is, RD and ADHD
children. Ackerman and Dykman (1993) compared ADHD children with two groups of
poor readers (IQ-discrepant and IQ-consistent) on RNC-letter and RNC-number tasks.
A control group of typically developing children was not included. ADHD children
were indistinguishable in their performance on both tasks from the IQ-discrepant poor
readers, but were significantly faster than the IQ-consistent poor readers. Cutting et al.
(1998) found both RNC-letter and RNC-number to be good discriminators between
good and poor readers among children with ADHD. Schuerholz et al. (1995) found that
RD children with greater levels of inattention or hyperactivity had greater deficits on
RNC-letter and RNC-number than those with RD alone. Felton, Wood, Brown,
Campbell, and Harter (1987) found that children with ADHD did not have deficits
across RNC-letter, RNC-number, RNC-colour, and RNC-object unless comorbid RD
was present. These various data would seem to suggest that the ADHD+RD population
should be more challenged by all RNC conditions included in the current study.
Ghelani, Sidhu, Jain, and Tannock (2004) reported that their RD group showed a
generalized naming deficit for letter, number, colours, and objects, whereas the ADHD
group showed impairment only in objects and colours. This coincides with the findings
of Carte et al. (1996), Semrud-Clikeman et al. (2000a), and Tannock et al. (2000).
Purvis and Tannock (2000) found RNC-number and RNC-letter deficits in their RD and
ADHD+RD groups relative to the performance of their ADHD group. Tannock et al.
(2000) performed a discriminant functions analysis on RNC-letter and RNC-colour
performances for control, ADHD, and ADHD+RD children. The analysis isolated two
factors: phonological processing, RNC-letter, and arithmetic scores loaded on one factor
and RNC-colour on the other factor. The ADHD+RD group was slower than the ADHD
and control groups of children on RNC-letter, whereas both the ADHD and the

74
ADHD+RD groups were slower than the control group of children on RNC-colour. The
suggestion was that RNC-colour involves more effortful semantic processing (Tannock
et al., 2000) or more executive processing (Stringer, Toplak, & Stanovich, 2004) and
that ADHD children are therefore differentially disadvantaged on this condition.
Greater executive demands (i.e. less automatic and more effortful processing) are
purportedly made not just for colours (Tannock et al., 2000), but also for the rapid
naming of objects (Carte et al., 1996), relative to the naming of digits and letters. Colour
naming is believed by Tannock et al. (2000) to involve controlled effortful semantic
processing because colour terms, like objects, are proposed to have „fuzzy‟, or vague,
variable and boundaries (Braisby & Dockrell, 1999; Moore & Price, 1999). Johnson,
Paivio, and Clark (1996) referred to this stimulus characteristic as increased
„uncertainty‟ (i.e., increased multiplicity and strength of referential relations between a
symbol and its name), and hypothesized that increased uncertainty is likely to increase
RTs in naming tasks. Letter-naming and number-naming, on the other hand, are
considered to be drawn from a limited set, with distinct, non-overlapping boundaries
which are more readily routinised, become overlearned, and therefore require less
effortful processing (and, hence, eventually become more automatic).
These views, however, were challenged by Pocklington (2000) using four RNC
conditions: letters, the primary colours (red, green, blue, and yellow) used by Tannock
et al. (2000), derived colours (orange, brown, purple, and pink), and emotions expressed
in a child‟s face (happy, sad, scared and angry). Pocklington reasoned that if „fuzzy‟
boundaries contribute to a RNC-colour deficit in ADHD, then a more pronounced
deficit should be observed for RN using derived colours or emotions. However, her
results revealed that the ADHD group (n = 19) were slower than their typically
developing age-matched peers (n = 19) on each of the four RN tasks, and these
differences remained when age, verbal IQ, nonverbal IQ, and reading ability were
introduced as covariates. These results suggest that children with ADHD have pervasive
problems in naming speed for any stimuli, regardless of whether the stimulus requires
semantic access to the lexicon, as in colour- and emotion- naming, or grapheme-
phoneme decoding, as occurs in letter-naming (Braisby & Dockrell, 1999).

75
Paulik (2003) analysed the results of 18 studies that investigated RNC in RD
children. Greater mean effect sizes for RD versus control comparisons were observed
for graphological stimuli (letters and numbers) than nongraphological stimuli (colours
and objects). Another unpublished meta-analysis investigating the relative impairment
in naming graphological and nongraphological stimuli (Paulik, Maybery, & Hogben,
2003) provides some basis for the claims of differential impairment across ADHD and
RD populations. All ADHD studies included yielded a greater mean effect size for the
naming of nongraphological stimuli than for the naming of graphological stimuli. In
contrast, the RD studies showed a greater mean effect size for naming graphological
stimuli than for naming nongraphological stimuli. Additionally, ADHD and RD child
samples showed significant slowing across all RNC conditions when compared to
typically developing control children.
4.4.2.4 A Meta-analysis of RNC Studies
In order to clarify the situation further, a meta-analysis designed to update the
unpublished findings of Paulik et al. (2003) was undertaken. The methodology departs
from Paulik et al. (2003) in several respects: Paulik et al. (2003) had included some
adult studies in their review article whereas the new meta-analysis only considered
children and adolescents. Additionally, Paulik et al. (2003) only required that the
selected published and unpublished studies contained at least one graphological and one
nongraphological RNC condition; the current review only considers those published
studies including all four RNC conditions.
4.4.2.4.1 Method
The review protocol encompassed empirical studies of RD, ADHD or ADHD+RD
samples published from 1976 through to 2009 that utilised the RNC task originally
devised by Denckla and Rudel (1976a), or a variant thereof.
First, an online search was conducted by consulting the PubMed and PsycINFO
bibliographic databases, employing the key terms of reading disorder and rapid
naming. Further search combined terms related to RNC (such as rapid automatised
naming, RAN, naming speed, naming, processing speed) with terms related to RD (such

76
as reading disability, dyslexia). Additionally, key journals were searched; these
included the Journal of Educational Psychology, the Journal of Learning Disabilities,
the Journal of Experimental Child Psychology, and Reading and Writing: An
Interdisciplinary Journal.
The selection criteria retained a degree of methodological rigour without being
overly restrictive. The guidelines ensured that each study: (a) was a published work; (b)
was reported in English; (c) used a control or comparison group design; (d) used the
standard RNC task devised by Denckla and Rudel (1976a) or a close approximation; (e)
employed all four conditions of the RNC task; (f) examined children and/or adolescents
aged 6-20 years (kindergarten children were specifically excluded because of their
assumed lesser familiarity with alphanumeric symbols); (g) included a reading group
identified as being at least one SD below the normative mean on a standardized reading
test, or at least 1 year behind expected grade or age level (“garden-variety”, non-
discrepant, poor readers were specifically excluded, given their presumed slower overall
processing ability); and (h) reported data in a format amenable to this type of analysis;
that is, mean RTs, or measures that could be converted to such, were reported. Where a
study reported latency data in another format (e.g., graphical or t-score format), attempts
were made to locate the leading author who was asked to provide the raw group latency
means for each condition. Data were also excluded for RD samples for which all
individuals carried a comorbid condition (e.g., ADHD). Finally, all participant samples
were independent from each other.
The search for empirical studies of RNC in ADHD samples first used the key
words attention deficit and rapid naming. Increased sensitivity was achieved by
combining search terms related to ADHD (such as ADHD, ADD, hyperactivity,
inattention) with search terms related to RNC (such as rapid automatised naming, RAN,
naming speed, naming, processing speed). The electronic search was supplemented by
checking key journals, as above, and also the reference lists of review articles and the
sole meta-analytic study located in this area (Swanson et al., 2003). Eligibility
requirements for the studies paralleled those used for the RD RNC investigation
(outlined above), with the proviso that the study now included an ADHD group

77
diagnosed according to DSM-III or DSM-IV criteria. Experimental groups carrying a
comorbid diagnosis of ADHD+RD were dealt with separately.
4.4.2.4.2 Description of the Studies
A total of 22 independent published studies met the review inclusion criteria: 14 RD
studies (n = 1043), 6 ADHD studies (n = 334), and 2 ADHD+RD (n = 127) studies
were located. See Tables 4-1, 4-2, and 4-3 for summaries of the main features of the
eligible studies in each category.
Across the 14 RD RNC data sets, the mean sample size for RD participants was
27.56 (range = 7-72) and for control participants it was 37.62 (range = 14-120). The
mean age for RD participants was 11.39 years (range 7.03-20 years), and for control
participants it was 11.03 years (range 7.01–17 years). (See Table 4-1 for the age ranges
for individual studies.)
Across the 6 ADHD RNC data sets, the mean sample size for ADHD participants
was 24.83 (range 10-35) and for control participants it was 30.83 (range 11-41). The
mean age for ADHD participants was 12.78 years (range 10.48-15.18 years), and for
control participants it was 13.19 years (range 10.45-15.52 years). (See Table 4-2 for the
age ranges for individual studies.)
There were too few ADHD+RD studies located (see Table 4-3) to conduct viable
analyses; however, wherever possible, relevant statistics are reported.
4.4.2.4.3 Effect Size Analyses
The core statistics recorded as the basis for the meta-analysis included: (1) the group
mean naming latencies for each RNC condition; (2) the number of participants in each
group; and (3) the corresponding SDs. Using this core data, Cohen‟s d was calculated
for the comparison of each experimental group (RD, ADHD, or ADHD+RD) with the
corresponding control group for each of the RNC conditions (i.e., RNC-letter, RNC-
number, RNC-colour, and RNC-object) (see Tables 4-4, 4-5, & 4-6), weighted by
sample size. In three RD studies, multiple data sets were provided: one longitudinal
study tested the same sample of RD participants on three occasions across a three-year
period (Wolf et al., 1986); another study, cross-sectional in nature (Badian, 1996),

78
tested two age groups separated by as little as two academic years; and the final study
(Pennington et al., 2001, Study 3) examined two age groups separated by as much as
five academic years. In the case of the latter study, both age groups were included
separately in the analyses due to the large age gap, while in the case of the former two
studies, a mean d was calculated across occasions or across groups (Lyons, 2003).
4.4.2.4.4 Results and Discussion
To test whether significant slowing manifested for each RNC category for each
disorder, single-sample t tests (two-tailed) were conducted using the effect size
estimates obtained from the individual studies and a null hypothesis of d = 0. There was
evidence of significant naming slowing for each of the four RNC conditions for both
RD and ADHD groups (see Tables 4-4 to 4-6 for mean effect sizes and Table 4-7 for t
tests). Mean effect sizes weighted for sample sizes closely approximated the respective
unweighted means (Tables 4-4 to 4-6). Effect sizes based on larger sample sizes
typically prove more accurate reflections of the population mean than those based on
small samples.
As can be seen from Figure 4-1, all 14 of the RD studies yielded a greater mean
effect size for the naming of graphological than for the naming of nongraphological
stimuli. By contrast, four of the six ADHD studies showed a greater mean effect size for
naming nongraphological stimuli than for naming graphological stimuli (see Figure 4-
2). (In comparison, both of the ADHD+RD studies revealed a greater mean effect size
for naming graphological than nongraphological stimuli.)
A comparison of these effect sizes was analysed using a 2 (group: RD, ADHD) x 2
(stimulus type: graphological, nongraphological) analysis of variance (ANOVA). The
first factor was an independent groups factor and the second was a repeated measures
factor. Mauchly‟s assumption of sphericity was violated so Greenhouse-Geisser
corrections are reported. The analysis revealed a main effect of stimulus type, F(1.951,
35.111) = 3.57, p < .040, ŋ2 = .17, and an interaction between stimulus type and group,
F(1.951, 35.111) = 5.56, p < .008,

79
0
0.5
1
1.5
2
2.5
3
3.5
4
1 2 3 4 5 6 7 8 9 10 11 12 13 14
RD Studies
Mean
d
.
letter/number
colour/object
Figure 4-2. Mean RN latency effect sizes for graphological and nongraphological stimuli for
RD studies. Numbering of studies is consistent with Table 4-1.
ŋ2 = .24. To examine the interaction further, two paired sample t tests were conducted.
The first compared graphological (collapsing means across letter and number
conditions) and nongraphological (collapsing means across colour and object
conditions) stimuli effect sizes for RD samples and proved significant, t(13) = 4.30, p <
.001, indicating that RD samples are more challenged by graphological than
nongraphological stimulus types. The second compared graphological and
nongraphological stimuli effect sizes for ADHD samples, but did not reach significance,
indicating the ADHD samples were equally challenged by both stimulus types.
However, the sample of effect sizes was limited (6) in this case, and so the analysis may
have lacked sufficient power as a result.
There are two important conclusions to be drawn from the meta-analysis of the
performances of RD and ADHD child and adolescent samples on the RNC task. Firstly,
consistent with Paulik et al. (2003), both clinical groups showed significant slowing
relative to control group children on all RNC conditions (letters, numbers, colours, and
objects). Secondly, RD samples showed relatively greater RNC deficits when naming

80
0
0.2
0.4
0.6
0.8
1
1.2
1.4
1.6
1.8
1 2 3 4 5 6
ADHD Studies
Mean
d
.
letter/number
colour/object
Figure 4-3. Mean RN latency effect sizes for graphological and nongraphological stimuli for
ADHD studies. Numbering of studies is consistent with Table 4-2.
graphological items than nongraphological items, while ADHD samples showed
consistent deficits across all stimulus categories. In conclusion, in terms of the forecast
findings for the empirical investigation to be undertaken, it is reasonable to anticipate
that both special populations will be disadvantaged across all RNC conditions in
comparison to the performance of their normally developing peers. It is also forecast
that the RD group will be more impaired on the graphological than the
nongraphological stimulus categories, but that the ADHD group will show similar
margins of deficits across all four stimulus categories. Whilst there are insufficient data
to draw any strong conclusions from the two ADHD+RD studies, the mean
graphological effect size (1.54) was substantially greater than the mean
nongraphological effect size (1.23), suggesting that the ADHD+RD group may show
the same relative deficits as the RD group rather than the ADHD group.
4.4.3 Review of the Discrete Rapid Naming Literature
The discrete version of the rapid naming task (RND) provides latency data for isolated
target stimuli. The employment of a discrete version of the standard rapid

81
Table 4-1. Primary experiments on RN generated from the RD literature review
Author RD
and Control
Samples (n)
Age
(Years)
and
Gender
RD Criteria Used Possible Moderators
Controlled
e.g., ADHD
RN Subtests
Used
Findings Regarding RD
Performance
1. Badian,
1996
Older Gp:
29 Dyslexic
24 Average
Readers;
Younger Gp:
26 Dyslexic
30 Average
Younger
= 6.2-7.9
Older =
8.0-10.4 ;
(67%
male)
WISC-R/WISC-III/WIPPSI-R,
WRMT-R WI subtest;
Dyslexia = verbal IQ > 1 SD and
Woodcock WI standard score <
85; Garden Variety = verbal IQ <
1 SD and Woodcock WI standard
score < 85
None indicated. All RD
children were being tested
for possible education
services; many of the
Adequate Readers were
referred for suspected
ADHD
RNC-letter
RNC-
number
RNC-colour
RNC-object
Older Dyslexics = Reading-level
matched younger control;
Older Dyslexics (less discrepant from
verbal IQ) = Reading-level matched
younger controls across all RN tasks
2. Badian et
al., 1991
7 Dyslexic
7 Mildly
Dyslexic
30 Average
Readers
(only Grade
2 results
used)
6-10
(male
only)
WRMT, 1973; Basic
Achievement Skills Screener,
1983; Kaufman Test of
Educational Achievement;, 1985;
Gray Oral Reading, 1967, 1986;
Dyslexic= Mean reading score >
15 points less than age level, >
1.5 SDs below normative mean;
Mildly Dyslexic = Mean reading
score > 11 points below age level,
< 95
Exclusion criteria included
a history of seizures,
neurological or emotional
problems, or serious vision
or hearing impairment.
RNC-letter
RNC-
number
RNC-colour
RNC-object
Grade 2:
Average Readers > Dyslexic on
RNC-number;
Average Readers = Mildly Dyslexic
= Dyslexic on RNC-letter
3. Decker,
1989
40 RD
Adolescents
40 Control
Adolescents
16-20
(teens)
PIAT, WAIS-R, PMA; RD =
Reading achievement level of
one-half grade level expectancy
or lower
Screening for emotional,
behavioural, social,
academic, and
neurological problems
RNC-letter
RNC-
number
RNC-colour
RNC-object
Control > RD across all subtests
4. Eden,
Stein,
Wood, &
Wood, 1995
26 RD
39 Control
10.2-12.6
(58%
male)
Woodcock-Johnson Psycho-
Educational Battery, 1977,
WISC-R, DICA;
RD = WJRSS < 85 (1 SD); IQ
between 85-115 at Grade 5
ADHD comorbid in 38%
of RD group and 5% of
Controls; visual acuity
checked
RNC-letter
RNC-
number
RNC-colour
RNC-object
Control > RD on RN-number and
RN-letter;
Control = RD on RNC-colour and
RNC-object

82
Author RD
and Control
Samples (n)
Age
(Years)
and
Gender
RD Criteria Used Possible Moderators
Controlled
e.g., ADHD
RN Subtests
Used
Findings Regarding RD
Performance
5. Felton et
al., 1987
19 RD
40 Control
8-12
Male +
female
(91%
male)
Diagnostic Interview for Children
and Adolescents, 1983, Peabody
Picture Vocabulary Test - R,
1981, Boder Test of Reading/
Spelling Patterns, 1982; RD =
based on Boder test scores
Parent interview, plus
DICA administered to
detect ADD/+H symptoms
within a reading-disabled
group and a non-reading-
disabled group; 5 RD and
1 Control had comorbid
ADHD
RNC-letter
RNC-
number
RNC-colour
RNC-object
Control > RD
across all conditions
6. Lovett,
1987
32 RD
(Accuracy-
Disabled)
32 Control
(Fluent)
8-13 WISC-R; Durrell Analysis of
Reading, 1955; Gates-McKillop
Reading, 1962; Gilmore Oral
Reading, 1968; Peabody
Individual Achievement, 1970;
Slosson Oral Reading, 1963; Test
of Rapid Reading Responses,
1976; Biemiller Reading, 1981;
WRAT-R, 1984; RD ≥ 1.5 yrs
below grade on ≥ four tests
Yes. Screening for
hyperactivity, sensory
impairment, neurological
damage, emotional
disturbance and chronic
medical conditions
conducted.
RNC-letter
RNC-
number
RNC-colour
RNC-object
Fluent Normals >Accuracy Disabled
across all subtests
7. Miller-
Shaul,
2005
(Hebrew
study)
25 Dyslexic
25 Control
Note:
Dyslexic ≥ 1
SD below
control
reading
scores
9-12.4
Male +
female
Ravens, 1974; Word List Test for
Children, 1997; Connected Text
Test for Children, 1997
Dyslexic = ≥ 1 SD below average
in word and pseudoword reading
accuracy and rate as compared to
the control group
Some screening for
sensory and neurological
problems.
RNC-letter
RNC-
number
RNC-colour
RNC-object
Control > Dyslexic across all subtests
8. Murphy
et al., 1988
14 Dyslexic
14 Control
10-11
Male +
female
(82.15%
male)
WISC-R; (WRAT reading, 1978,
1984, and Gray Oral Reading
Test, 1967; Dyslexic = >24-mth
lag for age & grade, plus slowest
RAN rates amongst 31 dyslexics
Screening for emotional &
sensory deficits. Dyslexic
sample from special school
for learning-disabled plus
public school.
RNC-letter
RNC-
number
RNC-colour
RNC-object
Control > Dyslexic across all
conditions (though Dyslexic were
especially selected on the basis of
their RN scores)

83
Author RD
and Control
Samples (n)
Age
(Years)
and
Gender
RD Criteria Used Possible Moderators
Controlled
e.g., ADHD
RN Subtests
Used
Findings Regarding RD
Performance
9.
Pennington
et al.,
2001
– Study 3
35 Dyslexic
21 Control
Children
7-11
Male +
female
(87.5%
male)
WISC-R,; Peabody Individual
Achievement Test‟s Reading
Recognition subtest, 1970; RD=
IQ discrepancy (as measured by
either the reading quotient or
specific dyslexic algorithm
ADHD status unclear.
Screened for perinatal
complications, sensory,
neuron-logical and socio-
cultural deficits.
RNC &
RND letter,
number,
colour, &
object
Child Sample:
Control = Dyslexic across all subtests
(though trend for Dyslexic being
slower than Control identified)
10.
Pennington
et al.,
2001
– Study 3
36 Dyslexic
20 Control
Teen
12-18
Male +
female
(76.8%
male)
WISC-R,; Peabody Individual
Achievement Test‟s Reading
Recognition subtest, 1970;
Dyslexic = reading and spelling
scores ≥ 1.5 SD below IQ
prediction
ADHD status unclear.
Screened for perinatal
complications, sensory,
neurological and socio-
cultural deficits.
RNC &
RND letter,
number,
colour, &
object
Teen Sample:
Control > Dyslexic
(though when VIQ covaried, only a
trend for Dyslexic being slower than
Control was identified)
11.
Rucklidge
& Tannock,
2002
12 RD
37 Control
13-16
(55%
male)
K-SADS-PL; OCHSS; Conners;
WRMT-R; WRAT3; WISC-III;
RD = standard score below 25th
%ile (SS=90) on at least one of
WRMT-R, or WRAT3 subtests
Yes. Comprehensive
screening by psychiatry
department of child
hospital.
RNC-letter
RNC-
number
RNC-colour
RNC-object
ADHD, Control >ADHD+RD
on RNC-number;
Control > ADHD+RD, RD,
ADHD > ADHD+RD on RNC-letter;
ADHD, RD, Control >ADHD+RD
on RNC-colour;
Control > ADHD, ADHD+RD,
RD >ADHD+RD on RNC-object
12. Semrud-
Clikeman et
al., 2000a
13 RD
26 Control
8-16
Males &
females
(74%
male)
WISC-R, 1974; Woodcock-
Johnson, 1977; RD= ≥ 20
standard score point discrepancy
between WISC-R FSIQ and
Woodcock reading composite
score
Yes.
ADHD and some other
psychopathology (anxiety
+ depression) assessed
RNC-letter
RNC-
number
RNC-colour
RNC-object
Control > ADHD > RD
on RN-colour and RN-object;
Control = ADHD > RD
on RN-letter and RN-number
13. Van
Daal, & van
der Leij,
1999
44 Dyslexic
32 Control
12-13
Males +
females
OTIS, 1971; Ravens, 1979; One
Minute Test, 1973; Bell Listening
subtest, 1996; Garden Variety =
standard score < 7 on reading
tests; Dyslexic = standard score ≤
Sample drawn from single
school district
RNC-letter
(capital
letters A-Z)
RNC-
number
Control > Dyslexic on composite
alphanumeric latencies;
Group effect on composite non-
alphanumeric latencies; no pairwise
comparison reached significance

84
Author RD
and Control
Samples (n)
Age
(Years)
and
Gender
RD Criteria Used Possible Moderators
Controlled
e.g., ADHD
RN Subtests
Used
Findings Regarding RD
Performance
(Dutch
study)
7 on reading; standard score > 7
on comprehension (discrepancy ≥
3 points)
(digits 0-9)
RNC-colour
RNC-object
(5x10 – time
to name 50)
14. Wolf et
al., 1986
11 Severely
Impaired
Readers,
72 Control
Kinder-
garten,
Grade 1,
and
Grade 2
Gates-McGinitie Reading, 1978;
Gray Oral Reading – Form A,
1967; Single-Word Reading;
Severely Impaired Readers = 1.5
years below reading level
Screening for gross
neurological,
psychological, intellectual
or environmental deficits
RNC-letter
RNC-
number
RNC-colour
RNC-object
(5x10 – time
to name 50)
Control > Severely Impaired Readers
across all subtests across all years

85
Table 4-2. Primary experiments on RN generated from the ADHD literature review
Author ADHD
and
Control
Samples
(n)
Age (Years)
and Gender
ADHD Criteria Used plus
Medication Washout
Possible
Moderators
Controlled
e.g., RD
RAN Subtests
Used
Findings Regarding ADHD
Performance
1. Felton et
al., 1987
13
ADD/+H,
40 Control
8-12
(ADD group
older)
(91% male)
DICA, 1983, Peabody Picture
Vocabulary Test – R, 1981,
Boder Test of Reading/
Spelling Patterns, 1982
Parent interview,
plus DICA to
detect ADHD; 5
RD and 1 Control
with comorbid
ADHD included
RNC-letter
RNC-number
RNC-colour
RNC-object
Control = ADD/+H
across all conditions
2. Healey &
Rucklidge,
2006
29 ADHD
(normal
creativity,
mixed
subtyping)
30 Control
10-12
(male = 72%
ADHD, 43%
control,
Connors Scales – R, 1997 –
Parent and Teacher versions;
K-SADS, 1996; Torrance
Tests of Creative Thinking.
Comorbid
psychopathology.
RNC-letter
RNC-number
RNC-colour
RNC-object
ADHD>Control on RNC-letter;
ADHD>Control on RNC-colour;
ADHD>Control on RNC-object
3. Rucklidge
& Tannock,
2002
35 ADHD
(DSM-IIIR
/DSM-IV),
24
ADHD+
RD
37 Control
13-16
(55% male)
K-SADS-PL; OCHSS;
Conners; WRMT-R;
WRAT3; WISC-III; RD =
standard score < 25th
%ile
(SS=90) on at least one of
WRMT-R/WRAT3 subtests
Comprehensive
screening by
psychiatry
department of
child hospital
RNC-letter
RNC-number
RNC-colour
RNC-object
Control > ADHD on RNC-object
4.
Rucklidge,
2006
30 ADHD,
41 Control,
12 ADHD
+ Bipolar
Male = 46%
Control, 43%
ADHD, 58%
ADHD+
Bipolar,
17% Bipolar
Child Behaviour Checklist,
1991; Connors‟ Ratings
Scales-Revised, 1997.
Washout on day.
K-SADS and
Washington
University K-
SADS used
RNC-letter
RNC-number
RNC-colour
RNC-object
RNC-colour/
number/letter
ADHD>Control on RNC-number;
Control>ADHD on RNC-letter;
Control>ADHD on RNC-colour;
Control>ADHD on RNC-object;
Control>ADHD on RNC-colour/
number/letter
5. Semrud-
Clikeman et
32 ADHD
(DSM-
8-16
Males &
WISC-R, 1974; Woodcock-
Johnson Psycho-educational
ADHD and some
other
RNC-letter
RNC-number
Control > ADHD
on RNC-colour and RNC-object;

86
Author ADHD
and
Control
Samples
(n)
Age (Years)
and Gender
ADHD Criteria Used plus
Medication Washout
Possible
Moderators
Controlled
e.g., RD
RAN Subtests
Used
Findings Regarding ADHD
Performance
al.,
2000a
IIIR),
26 Control
females
(74% male)
Battery, 1977
RD = ≥ 20 standard score
point discrepancy between
WISC-R FSIQ and
Woodcock scores
psychopathology
(anxiety +
depression)
assessed, though
measures for
latter not
indicated
RNC-colour
RNC-object
Control = ADHD
on RNC-letter and RNC-number
6. Semrud-
Clikeman, et
al., 2000b
10
ADD/+H
(DSM-III)
11 Control
8-17
ADD/+H,
9-18 Control;
Males
None indicated K-SADS, K-
SADS ADHD,
CBCL,
Woodcock
RNC-letter
RNC-number
RNC-colour
RNC-object
Control > ADHD
on RNC-color, RNC-letter, RNC-
object;
Control = ADHD
on RNC-number

87
Table 4-3. Primary experiments on RN generated from the ADHD+RD literature review
Author ADHD
and
Control
Samples
(n)
Age (Years)
and Gender
ADHD Criteria Used
plus Medication
Washout
Possible Moderators
Controlled
e.g., RD
RAN Subtests
Used
Findings Regarding ADHD
Performance
1. Felton et
al., 1987
26
ADD/+H +
RD
40 Control
8-12
Male +
female
(91% male)
DICA, 1983, Peabody
Picture Vocabulary Test
– R, 1981, Boder Test of
Reading/ Spelling
Patterns, 1982
Parent interview, plus
DICA to detect ADHD;
5 RD and 1 Control with
comorbid ADHD
included
RNC-letter
RNC-number
RNC-colour
RNC-object
Control > ADHD+RD
across all conditions
2. Rucklidge
& Tannock,
2002
24
ADHD+
RD
37 Control
13-16
(55% male)
K-SADS-PL; OCHSS;
Conners; WRMT-R;
WRAT3; WISC-III; RD
= standard score < 25th
%ile (SS=90) on at least
one of WRMT-
R/WRAT3 subtests
Comprehensive
screening by psychiatry
department of child
hospital
RNC-letter
RNC-number
RNC-colour
RNC-object
Control > ADHD+RD across all
conditions

88
Table 4-4. RD studies included in the meta-analysis: Sample sizes (N) and effect sizes (d) for RNC latencies. Numbers correspond to those studies
listed in Table 4-1.
_______________________________________________________________________________________________________________
N d
Study Control RD Letters Numbers Colours Objects
_______________________________________________________________________________________________________________
1. Badian, 1996 * 27 27.5 1.07 1.04 0.48 0.82
2. Badian et al., 1991 30 7 2.00 1.11 0.84 1.10
3. Decker, 1989 40 40 1.35 0.95 0.71 0.69
4. Eden et al., 1995 39 26 3.27 3.79 1.85 0.98
5. Felton et al., 1987 40 19 1.55 1.20 0.89 1.81
6. Lovett, 1987 32 32 1.11 1.14 0.60 0.84
7. Miller-Shaul, 2005 25 25 1.55 1.24 0.57 0.69
8. Murphy et al., 1988 14 14 2.70 4.00 2.04 2.76
9. Pennington et al., 2001 - Child 20 35 0.80 0.41 0.16 0.47
10. Pennington et al., 2001 – Teen 20 36 0.81 0.56 0.58 0.71
11. Rucklidge & Tannock, 2002 37 12 1.60 0.98 0.43 0.05
12. Semrud-Clikeman et al., 2000a 26 13 1.10 1.12 0.85 1.06
13. Van Daal & van der Leij, 1999 32 44 1.76 0.96 0.30 0.26
14. Wolf et al., 1986 ** 72 11 1.43 1.57 0.87 1.10
Means (weighted for sample size) 1.58 1.43 0.80 0.95
Means (unweighted) 1.51 1.42 0.85 0.94
_______________________________________________________________________________________________________________
* mean across two groups
* * mean across three occasions

89
Table 4-5. ADHD studies included in the meta-analysis: Sample sizes (N) and effect sizes (d) for RNC latencies. Numbers correspond to those studies
listed in Table 4-2.
_______________________________________________________________________________________________________________
N d
Study Control ADHD Letters Numbers Colours Objects
_______________________________________________________________________________________________________________
1. Felton et al., 1987 40 13 0.66 0.49 0.16 0.58
2. Healey & Rucklidge, 2006 30 29 0.66 0.58 0.82 0.77
3. Rucklidge & Tannock, 2002 41 30 1.31 1.16 1.03 1.14
4. Rucklidge, 2006 37 35 0.71 0.47 0.77 0.86
5. Semrud-Clikeman et al., 2000a 26 32 0.54 0.47 0.65 0.67
6. Semrud-Clikeman et al., 2000b 11 10 1.51 0.79 1.69 1.64
Means (weighted for sample size) 0.90 0.66 0.85 0.94
Means (unweighted) 0.91 0.66 0.87 0.93
_______________________________________________________________________________________________________________

90
Table 4-6. ADHD+RD studies included in the meta-analysis: Sample sizes (N) and effect sizes for RNC latencies. Numbers correspond to those studies
listed in Table 4-3.
_______________________________________________________________________________________________________________
N d
Study Control ADHD+RD Letters Numbers Colours Objects
_______________________________________________________________________________________________________________
1. Felton et al., 1987 40 26 1.56 1.40 0.91 1.39
2. Rucklidge & Tannock, 2002 37 24 1.74 1.43 1.16 0.96
Means (weighted for sample size) 1.65 1.42 1.04 1.18
Means (unweighted) 1.68 1.40 1.04 1.16
_______________________________________________________________________________________________________________

91
Table 4-7. Single-sample t-tests conducted on effect sizes (Ho: d = 0) for each RN category for
RD and ADHD studies.
_______________________________________________________________________
df t p (two-tailed)
________________________________________________________________________
RD Studies
Letters 13 8.48 < .001
Numbers 13 4.97 .002
Colours 13 5.59 .009
Objects 13 5.33 .002
ADHD Studies
Letters 5 5.43 .003
Numbers 5 5.91 .002
Colours 5 4.16 .009
Objects 5 5.90 .002
________________________________________________________________________
naming tasks within the current research design is likely to reduce the impact of
executive processing, as well as some of the additional variables already mentioned,
such as scanning, sequencing, and motor-production strategies (Fawcett & Nicolson,
1994; Stanovich, 1981; Wolf, 1991). However, given that (as already noted) Obregon
(1994) concluded that RD children and their nondisabled probands differed on the inter-
stimulus intervals occurring between inter-response intervals, but not articulation rates
per se, it might be reasonable to anticipate no difference in RND performance between
good and poor readers.
Perfetti, Finger, and Hogaboam (1978) found a weak relationship of RND-letter
and RND-number performance with reading in a sample of typically developing
children. This same weak relationship was also reported in subsequent studies
(Stanovich, 1981; Stanovich, Feeman, & Cunningham, 1983). However, Levy and
Hinchley (1990) reported strong correlations between RND-object naming latencies and
reading in a large cross-sectional study of children in grades 3 to 6 unselected for
reading skill. Stanovich, Nathan, and Vala-Rossi (1986), however, reported only weak
correlations between RND-letter naming and reading in children of a similar age

92
unselected for reading skills. Swanson (1989) looked at poor and average readers from
grades 1, 3 and 6 and found RNC and RND performances were both associated with
reading after controlling for variance due to grade and IQ.
Ehri and Wilce (1983) reported slowed RND performance for numbers, objects,
and words for less skilled readers compared to skilled readers across Grades 1, 2, and 4.
Lorsbach and Gray (1985) found significant differences between RD and typically
developing children on the discrete trial format of RND-letter and RND-number.
Fawcett and Nicolson (1994) found that RD children across three age groups (8, 13 &
17 years) performed significantly worse than chronologically age-matched control
children across all four RND tasks. RD children across the three age groups performed
equivalent to reading age-matched controls across RND-letter, RND-number, and RND-
colour, but significantly worse than reading age-matched controls on RND-object.
Perfetti et al. (1978) examined third grade unskilled readers (those individuals
performing one year below grade level in reading) and their typically developing skilled
reading peers (0.5 to one year above grade level) on discrete-trial rapid naming of
words, pictures, colours, and numbers. The poor readers demonstrated slowed naming
relative to their able peers only on the word condition. Stanovich (1981) reported the
same pattern of results when comparing poor readers only a few months below grade
level in reading and normally developing readers, and also found nonsignificant
differences between the two groups for an RND-letter subtask. Bowers and Swanson
(1991) critiqued these previous studies on the basis that severely disabled readers were
not well represented in their samples. Both Wolff, Michel, and Ovrut (1990) and
Bowers and Swanson (1991) noted that RNC studies tended to source more impaired
reading groups than did the RND studies. It is rare for discrete and continuous measures
to have been used for the same samples; thus differing sample and stimuli
characteristics may account for the inconsistent results observed for the RNC and RND
tasks.
In a much more tightly controlled study exempt from the above criticisms, Bowers
and Swanson (1991) examined poor readers (defined as those readers who scored below
the 25th
percentile on the word identification task of the WRMT) with unimpaired
readers in Grade 2 using an RND task with varying interstimulus intervals. They also

93
included an RNC version of the same task. They found group differences for both task
versions, with unimpaired readers faster at naming both letters and numbers than poor
readers. Both poor and unimpaired readers were slower when they had to identify
targets in a continuous format than when the target was discrete. Additionally, poor
readers were differentially impaired by the use of short rather than long interstimulus
intervals on the RND task. Bowers (1995) followed these same children longitudinally,
and reported that the group differences were maintained on the continuous and discrete
versions of letter and number RN tasks across Grades 2, 3, and 4.
In conclusion, where samples have included children with more severe reading
difficulties, and the same samples have been tested across continuous and discrete
versions of the RN task, deficits have been found on discrete tasks for the RD
population. Performance for the ADHD population on discrete versions of the RN task
has not been evaluated in the literature. Thus, it will be very informative to investigate
performance for ADHD, RD and ADHD+RD samples on both discrete and continuous
RN tasks using the four standard stimulus conditions (i.e., letter, number, colour, and
object).
From the review of the RN literature and the meta-analysis conducted, several
hypotheses arise. The first set of hypotheses refers to the categories of stimuli used.
Graphological categories should be named faster than nongraphological categories
(Cronin & Carver, 1998; Denckla & Rudel, 1974; Denckla & Rudel, 1976a; Meyer et
al., 1998; Misra et al., 2004; Wolf et al., 1986). Poor readers, in particular, should
perform relatively worse (compared to controls) on graphological than
nongraphological stimuli given outcomes of the meta-analysis and also the greater
predictive ability of graphological performance for reading (Blachman, 1984; Compton,
2003; Compton et al., 2002; Denckla & Cutting, 1999; Denckla & Rudel, 1974;
Denckla & Rudel, 1976a; Manis & Doi, 1995; Neuhaus et al., 2001; Wimmer, 1993;
Wolf, 1991; Wolf et al., 1986). Similarly, because of the greater executive demands
made by nongraphological stimuli (Carte et al., 1996; Tannock et al., 2000), it is
possible to hypothesise that ADHD children might be more impaired on those tasks
examining the rapid naming of colours and objects; however, the meta-analytic results
suggest that ADHD children will instead be forecast to show consistent deficits across

94
all RNC conditions. The second set of hypotheses relates to the specific format of the
task used (i.e., continuous or discrete). It is predicted that there will be significant
slowing for each of the RNC conditions for both RD and ADHD children. Children with
ADHD+RD will be more challenged by all RNC conditions than children with ADHD
or RD alone. There will be significant slowing for each of the RND conditions for
children with RD. Whilst there is no available literature investigating the performance
of ADHD children on RND tasks, it is anticipated that ADHD children would be more
likely to be disadvantaged by RNC tasks than RND tasks because researchers (e.g.,
Denckla & Cutting, 1999) believe RNC tasks are more likely to tap those executive
processes of the language system (e.g., scanning and sequencing) that will prove
problematic for this population.
4.5 Speed-of-Processing
Anderson (2002) outlined four discrete but interrelated executive domains in his model
of executive functioning in childhood: attentional control, cognitive flexibility, goal
setting, and information processing7. He described information processing as an
umbrella term embracing fluency, efficiency, and speed of information processing. Kail
(1991, 1992) stated that speed-of-processing (SOP) is a global property of cognition
(like intelligence) that imposes limits on the individual‟s ability to process information
(refer Cerella & Hale, 1994). Kleinman, Lewandowski, Sheffield, and Gordon (2005)
stated that SOP refers to “how quickly and efficiently an individual gathers,
manipulates, stores, retrieves, and classifies information” (p. 6). The confluence of these
articles suggests that information processing deficits may be indexed by reduced output,
delayed responses, hesitancy, and slowed RTs.
SOP deficits have been operationalised via a variety of speeded measures, such as
RN tasks, the trailmaking test, visual search tasks (including digit symbol coding and
symbol search), and RT tasks (Kleinman et al., 2005). However, in the absence of any
clear gold standard in this area (see Shanahan et al., 2006), it is acknowledged that
different speeded tasks may measure different sub-processes (e.g., different perceptual,
cognitive, or output processes), or different combinations of such. RD children have a

95
long history of poorer performance on those RN tasks devised by Denckla and Rudel
(see Section 4.4), and ADHD children have a similar pattern of poor performance on
those RN tasks devised by Stroop (see Section 4.3.3). The underlying processes in these
tasks are likely to vary from those required, for example, in symbol search, which
requires the identification of a target symbol among rows of distracter symbols. This
chapter seeks to clarify if RD and ADHD children also show deficits on speeded tasks
without a linguistic foundation. For this reason, both linguistic and nonlinguistic tasks
will be reviewed. Given that RN studies have been covered elsewhere, the current focus
is on examining the research that supports or discredits the notion of specific deficits for
each special population on tasks with a linguistic component, such as the trailmaking
test, and nonlinguistic tasks, such as RT tasks and visual search tasks.
4.5.1 Review of the Literature on SOP and ADHD
One of the most popular tasks that has a clear linguistic foundation and is used widely to
index SOP in ADHD samples is the trailmaking test (Lezak, 1995; Reitan, 1958; Reitan
& Wolfson, 1985). Part A of this test, though, has also been taken to be a measure of
focused attention (Frazier et al., 2004). This part requires the participant to connect (via
pencil) a series of circles containing numbers located in a random array in direct
numerical sequence. In a meta-analysis examining various neuropsychological tasks
comparing ADHD and control group performance, Frazier et al. (2004) found a mean
effect size of .45 for Part A (n = 13 studies). Part B of the test is generally taken as a
measure of focused attention and working memory (Frazier et al., 2004). It also requires
the connection of circles in the given array, but the connections alternate between
numbers and letters (i.e., 1-A-2-B-3-C, etc.). Successful candidates on this task are
presumed, therefore, to be proficient at inhibiting automatic sequential responding, and
repeatedly shifting set. The dependent measure is time to complete each part. Frazier et
al. (2004) found a mean effect size of .64 for this part (n = 14 studies).
Chhabildas et al. (2001) compared ADHD-PI (n = 67), ADHD-HI (n = 14),
ADHD-CT (n = 33) and a control group (n = 82) of twin pairs aged 8-18 years, across a
range of tasks that included the trailmaking test and the coding subtest from the WISC-
7 Diamond (2005) argues that information processing is not an executive domain.

96
R, mixing linguistic and nonlinguistic tasks. The coding subtest requires transcribing a
digit-symbol code. A key is provided indicating the symbol associated with each digit,
and the child must code, then copy, for a given series of digits the designated symbols
indicated by the key for each digit. Chhabildas et al. found that ADHD-HI and control
samples performed very similarly on each of the SOP tasks, both groups outperforming
the ADHD-PI and ADHD-CT samples on both trailmaking parts. Complicating
interpretation of the results, several of the groups differed in either intelligence test
scores or a reading score. Additionally, more males were represented in each of the
ADHD samples than in the control sample.
Nigg et al. (2002) tested ADHD-CT (n = 46), ADHD-PI (n = 18), and control (n =
41) groups of mixed gender students aged 7-12 years. To assess response speed, they
looked at the go RT for the stop signal task, the colour naming subtest of the Stroop,
and Part A of the trailmaking test, all tasks arguably having a linguistic base. Both
ADHD subtypes evidenced slow go RTs compared to the control group, but did not
differ significantly from one another. Similar effects held for colour naming. On
trailmaking Part A, the ADHD-PI group showed a sizeable deficit, but the ADHD-CT
results were indistinguishable from those of the control group. However, two aspects of
the design of this study warrant caution: eight ADHD participants were on psychotropic
medications and the ADHD participants were assigned to subtype groupings in a
nonstandard way using the parent and teacher symptom reports. Not all researchers,
have found consistent deficits for the ADHD population on the trailmaking test (e.g.,
Barkley et al., 1992; Frazier et al., 2004; Gorenstein et al., 1989; Grodzinsky &
Diamond, 1992; Houghton et al., 1999).
Turning to simple and choice RT tasks, Shanahan et al. (2006) observed that a
consistent finding is that children with ADHD are slower on both continuous
performance choice RT tasks and on go/no go type tasks (e.g., Kuntsi & Stevenson,
2001; Nigg, 2001; Rubia, Oosterlaan, Sergeant, Brandeis, & van Leeuwen, 1998;
Rucklidge & Tannock, 2002; Scheres, Oosterlaan, & Sergeant, 2001; Slusarek, Velling,
Bunk, & Eggers, 2001; van der Meere & Stermerdink, 1998; van der Meere,
Stermerdink, & Gunning, 1995; Willcutt, Pennington, et al., 2005). Frazier et al. (2004)

97
report a mean effect size of .71 for RT tasks (n = 10 studies) when ADHD and control
group performance was compared in their meta-analysis.
Coding and symbol search subtests have been used in some studies to show
consistent ADHD deficits (Calhoun & Mayes, 2005; Mayes & Calhoun, 2006;
Rucklidge & Tannock, 2002; Weiler, Berstein, Bellinger, & Waber, 2000; Willcutt,
Pennington, et al., 2005). However, Nyden, Gillberg, Hjelmquist, and Heiman (1999)
found deficits for their ADHD group in relation to control group performance only on
the coding subtest. Attention is a factor in both these tasks as effort must be sustained
for two minutes for their successful completion. In their meta-analysis comparing
ADHD and control samples, Frazier et al. (2004) found a medium effect size for the
WISC SOP aggregate (comprising coding, symbol search, and cancellation subtests),
and the coding subtest by itself had a (large) weighted mean effect size of 0.82 (n = 15
studies).
Visual search tasks have also been used with the ADHD population. This category
of task examines selective attention (Mullane & Klein, 2008; Quinlan, 2003) and is
considered to provide a useful index of SOP (Hommel, Li, & Li, 2004; Kail, Wolters,
Yu, & Hagen, 2000; Kleinman et al., 2005). Visual search tasks, as defined by Mullane
and Klein (2008), “require the rapid scanning of spatial locations in a systematic manner
to locate a target among a field of one or more „nontarget‟ (i.e., distracter) items” (p.
44). Treisman and Gelade (1980) highlighted the distinction between single-feature
targets (e.g., searching for a red square among blue squares) and conjunction targets
(e.g., searching for a red square among red triangles and blue squares). Searching for
single-feature targets is presumably more automatic, and searching for conjunction
targets is assumed to require more effortful processing. In their review, Mullane and
Klein (2008) located seven studies examining visual search tasks for ADHD samples.
Across the studies that used a single-feature target, the ADHD and control groups did
not differ significantly in search efficiency. However, for the studies that used the more
difficult conjunction target, children with ADHD demonstrated less efficient search than
normally developing children in the majority of cases.
In conclusion, the modest and inconsistent findings in this area in relation to the
ADHD population and their performance on both linguistic and non-linguistic measures

98
of SOP make it difficult to draw any firm conclusions when speculating about any
purported performance deficits on SOP tasks in general. However, more consistent
deficits have been identified with ADHD on simple and choice RT tasks. Serial visual
search tasks also appear to hold some promise in demarcating this special population
from children of typical development, along with the SOP index from the WISC-III and
WISC-IV, particularly the coding subtest component of that index. Serial search tasks
have the additional benefit that they can be constructed to tap both linguistic and
nonlinguistic sets of target and distracter stimuli.
4.5.2 Review of the Literature on SOP and RD
As within the ADHD literature, some researchers have focused their attention on the
trailmaking test to delineate purported SOP differences between RD children and
normally developing children. Reiter et al. (2005), for example, compared 42 children
with dyslexia and 42 nondyslexic children and found no significant group differences on
processing speed for either Parts A or B of this test. Likewise, Narhi, Rasanen,
Metsapelto, and Ahonen (1997) reported no significant differences between their
dyslexia and nondyslexia samples on either part of the trailmaking test. These results are
somewhat surprising given the alphanumeric stimuli of the test.
Choice RT tasks have a much richer history in the RD arena. Nicolson and Fawcett
(1990) employed a choice RT task requiring discrimination of two tones differing in
pitch, but no differences were found between the RTs of RD and control group children.
Using this same task, Nicolson and Fawcett (1994) found longer RTs for their RD group
in comparison to those of their control group. However, when they modified the choice
RT tasks to investigate simple speed of reaction to any auditory tone, response times
were comparable across groups. Yap and van der Leij (1994) actually found
significantly faster choice RTs for a younger group of 14 dyslexic children on the same
auditory choice RT task compared to reading age-matched control children, but not
when compared to chronological age-matched control children. Savage (2004), in a
review of studies, concluded that choice RT does not reliably distinguish RD and
control samples.
99
Several studies have looked at the coding and symbol search subtests to investigate
proposed SOP deficits for RD on tasks involving non-linguistic stimuli. Kail and Hall
(1994, 1999), Catts, Gillespie, Leonard, Kail, and Miller (2002), Nyden et al. (1999),
and Willcutt, Pennington, et al. (2005) all reported consistent deficits for their RD
groups on these tasks compared to typically developing children, but not Rucklidge and
Tannock (2002).
Visual search tasks have also been used within the RD literature. Iles, Walsh, and
Richardson (2000) tested 8 control children, 8 dyslexic children with normal motion
coherence thresholds, and 8 dyslexic children with elevated motion detection thresholds.
They employed eight non-linguistic visual search tasks, comprising both single feature
and feature-conjunction tasks, and a simple RT task. Similar to other reports reviewed
in this section, no differences were found between groups on the RT task. Results
showed, though, that dyslexic children with elevated motion coherence thresholds were
impaired on feature-conjunction but not single-feature visual search tasks. Dyslexic
children with normal motion coherence thresholds, on the other hand, were impaired on
only one of the feature-conjunction visual search tasks. In another study using a visual
search task, Catts et al. , Gillespie, Leonard, Kail, and Miller (2002) compared low IQ
poor readers (n = 36), normal IQ poor readers (n = 30), and 117 good readers, in second
and fourth grades. Their visual search task required detecting whether a simple target
nonsense figure was present in an array of distracters. For a second, mental rotation
task, the same figures were used, but this time the child needed to indicate if the
distracter array contained a mirror image of the target stimulus. The low-IQ poor reader
group was significantly less accurate than the good reader group on the visual search
task. Normal-IQ poor readers and good readers did not differ on this task; normal-IQ
poor readers were far less accurate, however, on the mental rotation task.
In conclusion, as with the ADHD literature on SOP, the breadth of tools used to
operationalise SOP, both linguistic and non-linguistic in nature, and the inconsistency in
results even for a common measure, lead to a very confused pattern of results for SOP
in the RD literature. There are too few studies that have used the trailmaking test with
RD samples to recommend this task as a viable index of SOP. Simple and choice RT
task results have proved variable; the same may be said for the coding and symbol

100
search subtests. Non-lexical visual search tasks have, however, shown some promise in
demarcating RD and typically developing children.
4.5.3 Review of the Literature on SOP and ADHD+RD
Willcutt, Pennington, et al. (2005) compared 113 ADHD, 109 RD, 64 ADHD+RD, and
151 control twin pair children, aged 8-18 years on the trailmaking test, with its linguistic
foundation, and the coding and symbol search subtests, with a nonlinguistic foundation.
There was no clear-cut dissociation of ADHD and RD in this investigation, perhaps
because the SOP index used was a composite score based on performance on the
linguistic and nonlinguistic tasks. Processing speed was similarly impaired in their
ADHD, RD, and comorbid groups, suggesting (they inferred) that SOP is a shared
cognitive risk factor for ADHD and RD. Note that the comorbid group‟s deficits were
similar in magnitude to those of the two single disorder groupings.
Similarly, Shanahan et al. (2006) examined 105 ADHD, 95 RD, 51 ADHD+RD
and 144 control group children, aged 8-18 years, using the trailmaking test, Denckla and
Rudel‟s (1976) RN tasks, the Stroop, and the stop signal task, all with a linguistic base,
and the coding subtest, with a nonlinguistic base, among others. They concluded that
both single disorder groups share a similar profile, but RD and ADHD+RD children
demonstrate greater deficits in processing speed than children with ADHD, possibly
because of the greater focus of the bulk of these tasks on lexical knowledge and facility.
Rucklidge and Tannock (2002) compared 35 ADHD, 12 RD, 24 ADHD+RD, and
37 normal control adolescents aged 13-16 years across a range of tasks, including the
symbol search and coding subtests. The two ADHD groups were significantly slower
than the two RD groups. Arguable, this result may have eventuated because of the
nonlexical tasks used to index SOP.
Weiler et al. (2000) were specifically interested in ascertaining the role of SOP in
the predominantly inattentive subtype of ADHD. They explored the neuropsychological
profile of 16 ADHD-PI, 33 RD, 9 ADHD-PI+RD, and 24 control group children aged 7-
11 years using the coding and symbol search subtests. Findings indicated a main effect
of ADHD-PI for each SOP measure, that is, the two ADHD-PI groups showed
impairment on both the coding and symbol search subtests relative to the RD and

101
Control groups. Here again, the nonlexical tasks appeared to challenge the ADHD
groupings more than the RD and control group children.
Further, in a follow-up investigation, Weiler, Bernstein, Bellinger, and Waber
(2002) tested 15 ADHD-PI, 33 RD, 9 ADHD-PI+RD, and 149 control children aged 7-
11 years using a large set of SOP tasks that included a simple RT task, a go-no-go task,
a choice RT task, nonlinguistic single-feature and feature-conjunction visual search
tasks. A tone discrimination task (expected to demarcate RD children) was also used.
The two groups of ADHD-PI children performed more poorly on the visual search task,
but not on the auditory processing task; the reverse findings emerged for children with
RD. ADHD children processed information more slowly overall, but particularly more
slowly on those tasks with an increased cognitive load. All the referred groups (ADHD-
PI, RD, ADHD-PI+RD) performed worse than the control group on both the SOP and
auditory processing tasks).8
It is clear from the literature review that the lack of a systematic line of
investigation into the impact of any proposed deficits in SOP for the ADHD and RD
populations has hampered research in this area. Clearer definitions, simpler measures
with fewer likely confounds, and the separation of linguistic and non-linguistic stimuli
when creating such measures will work towards resolving some of the more endemic
issues surrounding findings in the SOP literature. Visual search tasks appear to be the
most viable candidate category of task reviewed thus far. The empirical study reported
below (Chapter 13) examined whether in fact RD and ADHD samples exhibit a similar
profile of deficits on SOP tasks, or whether certain deficits differentiate the two
disorders.
8 On a cautionary note, when interpreting these findings, it should be borne in mind that the ADHD-
PI+RD group was younger than the remaining groups (and that age was not covaried), plus males were
overrepresented in the two ADHD-PI groups (though gender was covaried in the analyses).

102
Chapter 5: Rationale and General Methodology for the
Empirical Studies
The major child investigation used a double-dissociation design to evaluate whether
unique cognitive profiles differentiate the two primary disorders under investigation,
ADHD and RD. Five cognitive domains emerged as suitable candidates for
investigation based on an examination of theoretical accounts of each disorder, and the
reviews of existing empirical research further narrowed the range of tasks that might be
used in each domain. The candidate domains are: phonological awareness, memory,
inhibition, RN, and speed-of-processing. The candidate tasks include: (1) a range of PA
tasks indexing increasing VWM involvement, (2) memory tasks that cross modality
(verbal, visuospatial) with processing demand (STM, WM), (3) inhibition tasks (i.e., the
stop signal and Stroop tasks), (4) continuous and discrete versions of Denckla and
Rudel‟s (1974) RN tasks, and (5) visual search tasks employing linguistic and
nonlinguistic stimuli.
The two disorders were investigated using a 2 x 2 design in which ADHD status
(ADHD, No ADHD) was crossed with RD status (RD, No RD), yielding four groups:
those with neither disorder (controls), those with RD only or ADHD only, and those
with both disorders (comorbid group). The ADHD samples (i.e. the ADHD-only and
comorbid groups) were differentiated at intake into two subtypes, ADHD-CT and
ADHD-PI. Although (sometimes) inadequate cell sizes precluded the use of this subtype
classification in the major analyses, the demarcation of the subgroups was kept in mind
when considering the results in more detail.
5.1 Domain Hypotheses Arising from the Literature Review
5.1.1 PA Hypotheses
Based on the literature review of research on PA, for the present investigation it was
hypothesised that:

103
(i) Skill on measures indexing PA ability will be differentially impaired in children
with RD and not ADHD (unless a pattern of ADHD impairment emerges on the more
complex PA tasks); and
(ii) Deficits for RD and ADHD+RD children will be more pronounced on the more
complex PA tasks (i.e., elision and phoneme reversal) as these tasks make increased
demand on VWM.
5.1.2 Memory Hypotheses
The hypotheses formulated from the memory literature review are:
(i) ADHD children (i.e. the ADHD and ADHD+RD groups) will demonstrate
greater impairment on visuospatial than verbal STM/WM tasks relative to the control
group.
(ii) In contrast, RD children (i.e. the RD and ADHD+RD groups) are expected to
be more impaired on the verbal than the visuospatial memory tasks, compared to the
control group children. While the RD children are expected to demonstrate equivalent
span scores to the control group children on VSSTM, the RD groups may show some
impairment on VSWM.
(iii) ADHD children are also expected to demonstrate greater impairment on WM
than on STM tasks.
5.1.3 Inhibition Hypotheses
Hypotheses for the stop signal task are conditional upon theoretical positions, in
particular:
(i) If Barkley‟s model of inhibition holds, ADHD children will perform more
poorly than their control group counterparts on the stop signal task. Given the findings
of Lijffijt et al. (2005), it is further hypothesized that ADHD children will show
disproportionately longer stop signal RTs than control group children, with intact go RT
performance.

104
(ii) If poor ADHD stop signal performance is better attributed to an attentional
deficit, it is anticipated that the ADHD group will show longer go and stop signal RTs,
with attentional failures signaled by greater variability in go RTs.
(iii) Given the findings in the literature (e.g., van der Schoot et al., 2000; Purvis &
Tannock, 2000; Willcutt, Pennington, et al., 2005), it is hypothesized that the two RD
groups will also show some inhibition deficits as signaled by longer stop signal RTs, but
it is difficult to speculate beyond this due to the variability in results across those few
studies examining the populations of interest in a 2 x 2 design.
The empirical study of Stroop performance uses the standard colour, word and
colour-word conditions, and an additional negative-priming condition in which the word
name suppressed on one (prime) trial is the colour to be named on the subsequent
(probe) trial. Hypotheses for the Stroop task are also conditional on theoretical
positions:
(i) If Barkley‟s theory of inhibition holds, then ADHD children will be more
impaired on interference scores for the Stroop task than the control group of children.
Response output speed will be compromised on the colour-word condition but not on
the colour condition or the word condition.
(ii) If the primary deficit for ADHD children is accorded to impaired speeded
naming, response output speed across all Stroop conditions will be compromised. Thus,
when word and colour naming speed are factored in, the discrepancies between ADHD
and control group data on the colour-word condition should be negligible, indicating a
more generalized naming speed deficit for ADHD children rather than a specific deficit
in inhibition.
(iii) In terms of their performance on the negative priming condition, it is assumed
that ADHD children will be less able to suppress the distracter information on the prime
trial which will in turn facilitate their performance on the probe trial. Thus, the two
ADHD groups may show less negative priming than the two no-ADHD groups.
(iv) Because of their poor reading, RD children should perform poorly in
comparison to No-RD children on the word condition. An impairment associated with
RD is also expected based on existing literature for the colour condition. Poor reading

105
for the RD groups may limit the extent of deficit they show in the colour-word
condition.
(v) Because of the lack of empirical investigation of negative priming in RD, it is
not possible to conjecture on the performance of this population for this condition.
5.1.4 RN Hypotheses
From the results of the meta-analytic review on the performances of RD and ADHD
samples on the RNC task, it is hypothesised that:
(i) Both clinical groups will evidence significant slowing of performance relative
to that of their typically developing peers on all RNC conditions;
(ii) Graphological stimuli will be named faster overall than nongraphological
stimuli;
(iii) RD children will show greater performance deficits for the RNC condition
employing graphological stimuli (i.e., RNC-letter) than on the conditions employing
nongraphological stimuli (i.e., RNC-colour and RNC-object);
(iv) ADHD children, by contrast, are expected to show consistent deficits in RNC
performance across all stimulus categories;
(v) ADHD+RD children are expected to demonstrate the same pattern of deficits
as RD children (rather than those demonstrated by the ADHD group of children).
For the RND task, based on the existing literature, it is hypothesised that:
(i) RD children will show performance deficits relative to those of their typically
developing peers on all RND conditions.
(ii) As no data exists in the literature to determine outcomes for the ADHD
population on the RND tasks, it is difficult to speculate how this population might
perform relative to their normally developing peers. However, given that some
researchers propose that RNC tasks are more likely to tap executive processes, ADHD
children may be more likely to be disadvantaged by RNC than RND conditions.

106
5.1.5 SOP Hypotheses
Due to the dearth of a consistent approach to studying SOP in relation to RD and
ADHD, the SOP study will necessarily be exploratory in nature. From the results of the
few existing studies, tentative hypotheses are that:
(i) RD children will perform less well relative to control children on those visual
search tasks with a linguistic basis.
(ii) ADHD children will demonstrate poorer performance relative to the control
children on those visual search tasks that do not have a linguistic foundation.
5.2 General Method
As with much of the literature on ADHD, an all-male sample was obtained. The
investigation was restricted to male participants to control for the possibility that gender
differences influence neuropsychological task performance (Gaub & Carlson, 1997;
Gershon, 2002).Many studies have reported no gender differences in executive
functioning for ADHD (Houghton et al., 1999; Lewinsohn, Hops, Robert, Seeley, &
Andrews, 1993; McGee et al., 1990; Verhulst et al., 1997; Vikan, 1985); though others
cautiously suggest discrepancies are plausible between males and females (Seidman et
al., 1997a). Known comorbid disorders other than ADHD and RD were a criterion for
exclusion to avoid obvious possible confound. Medication status was also controlled by
establishing a 24-hour washout period for anyone on medication.
5.2.1 Screening Tasks
5.2.1.1 The SNAP-IV Teacher and Parent Rating Scale
The SNAP-IV (Swanson, 1994) is a broad-based, informant-rated instrument that
assesses the presence and severity of symptomatology of ADHD and various other
psychiatric disorders. The 90 items of the SNAP-IV are derived directly from the DSM-
III, DSM-III-R, and DSM-IV. A set of 18 symptoms of ADHD, replicating those listed
in the DSM-IV, are divided into two subsets, each with 9 items, representing the
domains of inattention and hyperactivity/impulsivity. DSM-IV categorical diagnoses are
based on symptom counts. A child with 6 or more of the 9 symptoms in a domain, as

107
affirmed by two sources (i.e., parents and teacher) is considered to meet the criterion in
that domain. The three subtypes of ADHD can then be designated based on whether the
criterion is met in a single domain or in both domains.
In order to make these judgments, the SNAP-IV utilises a 4-point semantic
differential rating scale (i.e., 0 = Not at all, 1 = Just a little, 2 = Quite a bit, 3 = Very
much). Severity ratings of 2 or 3 are deemed significant in terms of the dimensional
categorization of ADHD. A dimensional severity rating, labeled the average rating per
item (ARI) score, can be calculated by taking the mean rating for the 9 items in each
domain, and an overall ARI can be calculated for the 18 items.
Because the SNAP-IV incorporates the symptom lists of the DSM-IV ADHD
criteria, it also provides a threshold tally to determine whether a categorical definition of
ADHD can be applied. This is important because, where the diagnostic algorithm
devised for this study suggested the pediatric diagnosis was not confirmed, a check was
run to show that the categorical SNAP-IV diagnosis nevertheless supported the pediatric
diagnosis. Thus, the combination in the SNAP-IV of a standard rating scale format and
the DSM-IV symptom list for various disorders provides a method to quantify the
degree of symptom presence on either a dimensional or a categorical basis, respectively.
The SNAP-IV also provides critical values to identify those children whose scores
fall at the most extreme placement on the ADHD dimension (i.e., at the 95% percentile)
for teachers and parents. Comparing the ARI score to the clinical cut-off score
determines if the score is clinically significant. In most instances, these cut-off scores
approximate an ARI rating of 2. The ARI and 5% cut-off points provided an index of
“severity”, which was one of three criteria (along with “pervasiveness” and “burden of
impact” outlined below) used to confirm or disconfirm ADHD diagnosis or to pinpoint
a suspected diagnosis.
The SNAP-IV contains items covering 16 major DSM-IV disorders that may
overlap with or masquerade as symptoms of ADHD, including oppositional defiant
disorder and conduct disorder. For the purposes of the present study, high ratings
(exceeding a certain critical value) on a competing DSM-IV disorder subscale served as
an exclusionary criterion.
108
In conclusion, the inclusion of the SNAP-IV teacher and parent rating scales were
valuable in that: (i) its use confirmed the specific DSM-IV-defined psychiatric
symptoms of ADHD in the pediatrically-diagnosed ADHD and comorbid ADHD/RD
clinical groups, either via a dimensional or a categorical evaluation; (ii) its use
sometimes suggested a pediatric diagnosis may have been overlooked where an existing
RD diagnosis stood; (iii) it corroborated clinical ADHD subtyping information; (iv) it
screened for otherwise undiagnosed comorbid disorders, such as oppositional defiant
disorder, conduct disorder, mood disorders, and a range of other mental health
problems, in both the control and clinical groups; and (v) ratings were obtained from
both parents and teachers to obtain a cross-context validation of the clinical ADHD
diagnosis.
5.2.1.2 Strengths and Difficulties Questionnaire
The Strengths and Difficulties Questionnaire (SDQ; Goodman, 1997) served to screen
for undiagnosed attention or hyperactivity problems amongst the control and RD
populations and to confirm pediatric diagnoses among the ADHD and comorbid groups.
The SDQ is a brief standardised behavioural screening questionnaire that is
informant-rated and has demonstrated sensitivity in detecting emotional and behavioural
problems in children and adolescents (Goodman, Renfrew, & Mullick, 2000a;
Goodman, Ford, Simmons, Gatward, & Meltzer, 2000; Mathai, Anderson, & Bourne,
2002). It has been shown to possess sound discriminant and predictive validity
(Goodman, 1997, 2001; Goodman & Scott, 1999), and has reasonable concurrent
validity with the Health of the Nation Outcome Scales for Children and Adolescents
(HoNOSCA), now widely used for clinical screening in Australia (Garralda et al., 2000;
Goodman, 2001; Gowers et al., 1999, Mathai et al., 2002). Moreover, Mathai et al.
(2002) have confirmed the SDQ‟s applicability for the Australian population. More
important to the needs of the current research, however, the SDQ has been proven to be
superior to other available instruments (e.g., Achenbach & Edelbrock‟s Child Behaviour
Checklist, 1983) at discriminating inattention and hyperactivity problems (Goodman &
Scott, 1999).

109
The SDQ comprises 25 checklist items (rated on a 3-point scale; i.e., Not True,
Somewhat True, Certainly True), tapping both positive and negative attributes. These 25
items are divided between five clinical scales (of five items each): conduct problems,
hyperactivity/inattention, emotional symptoms, peer relationship problems, and
prosocial behaviour (i.e., positive behaviours). Each scale is scored from 0 to 10. All but
the prosocial scale are summed to generate a total difficulties score (range 0-40). Total
scores are compared to normative data and assigned a „normal‟, „borderline‟, or
„abnormal‟ banding. The SDQ has parent and teacher versions available aimed at the 4-
16 year old age group, and thus satisfies the DSM-IV requirement for multi-informant,
cross-context verification of ADHD.
An additional impact supplement measures the chronicity of symptoms and the
respondent‟s evaluation of the resultant burden of care, stress, and social disadvantage,
and is thus geared toward assessing the effect of any impairment on the child‟s quality
of life. There are five relevant items on the parent-rated version: distress, impairment in
home life, impairment in friendships, impairment in classroom learning, and impairment
in leisure activities. The teacher-completed version, on the other hand, contains only
three relevant items: distress, impairment in friendships, and impairment in classroom
learning. Each item is rated on a 4-point scale (i.e., not at all, only a little, quite a lot, a
great deal, which are scored 0, 0, 1 & 2, respectively). Hence, total impact scores range
from 0-10 for the parent-rated version and 0-6 for the teacher-rated version. A total
impact score of 2 or more is accorded an „abnormal‟ banding, a score of 1 is deemed to
be „borderline‟, and a score of 0 is rated as „normal‟. A score of 2 from either informant
is considered as within the ADHD diagnostic parameters.
5.2.1.3 Ishihara Tests for Colour Blindness
The tests for colour blindness (Ishihara, 1954) were designed to swiftly and accurately
normally-sighted individuals from those with either total colour-blindness
(achromatopsia), or red-green blindness (a form of dyschromatopsia). The tests consist
of pseudo-isochromatic plates, each composed of a large number of dots of differing
colour saturation. The participant‟s task is to differentiate a number (made up of various
coloured dots) located somewhere in the centre of a circle of dots of another colour.

110
Participants are designated „normal‟, „total colour blind‟, or „red-green colour blind‟ on
the basis of their interpretation of each of the colour plates.
5.2.1.4 Wechsler Intelligence Scale for Children - Third Edition
General cognitive ability was assessed by means of four subscales of the WISC-III
(Wechsler, 1991) – vocabulary, similarities, block design, and object assembly – which
were selected because they sample from both verbal ability and performance ability
constructs and because of their strong relation to the full scale IQ (Sattler, 1992). These
subtests correlated .93 to .95 with the full-scale WISC-III scores (Groth-Marnat, 1990).
5.2.1.5 Woodcock Reading Mastery Tests – Revised
The total reading full scale cluster (Form G) from the Woodcock Reading Mastery Tests
– Revised (WRMT-R; Woodcock, 1987, 1998) comprises four reading achievement
tests - word identification, word attack, word comprehension, and passage
comprehension – and yields an age-referenced composite standard score. This battery
was selected because it measures both decoding skills and comprehension, the two
components essentially involved in reading (Shaywitz, 1998). The Woodcock battery
has the added advantage of having both an aptitude-achievement discrepancy analysis
readily available (to plot a participant‟s expected achievement, as predicted by the
WISC-III verbal scale against his actual achievement) and a percentile rank profile
indicating a participant‟s standing compared to norms. These components assisted in
determining if a child was sufficiently reading delayed to assume the presence of a RD,
according to the criteria outlined in this study. The total reading full scale cluster has
shown a split-half reliability coefficient ranging from .92 to .99 across Grades 1 to 11
(Woodcock, 1987).
The word identification test requires reading words presented in isolation and
serves as a measure of sight recognition for single written word vocabulary. Word
stimuli vary in spelling-to-sound regularity (i.e., contain phonetically regular and
irregular sight words), level of difficulty, and frequency of occurrence within the
English language. Participants are required to produce an accurate reading of the word
within a five-second time limit for it to be scored correct. There are 106 items in total,

111
arranged in order of difficulty. A table of suggested entry levels is provided. Split-half
reliability for word identification is reported to be between .86 and .98 for Grades 1 to
11 (Woodcock, 1987).
The word attack test requires the pronunciation of isolated nonsense words or
words used infrequently in the English language in an untimed format. Given that they
lack contextual cues, the participant is compelled to complete a phonic and structural
analysis, decoding the unfamiliar pseudo-words to derive their correct pronunciation.
The nonsense words vary in the complexity of their syllabic content, and increase in
order of difficulty across the test. There are 2 sample and 45 test items, with all
participants starting at the first item. Split-half reliability is reported between .84 and .94
for Grades 1 to 11 (Woodcock, 1987).
The word comprehension test contains 146 items comprising three subtests –
antonyms, synonyms, and analogies. Each subtest commences with demonstration and
practice items and has a table of entry points. For antonyms, the participant is urged to
read aloud the written word and is then required to provide a word antithetical in
meaning to the stimulus word. For synonyms, the participant is required to pronounce
the written word and then provide a word analogous in meaning to the stimulus word.
For analogies, the participant must read a pair of words, ascertain the relationship
indicated by their pairing, then read the first word of a second pair and use the same
relationship to supply a word to complete the analogy (e.g., foot is to toes, as hand is to
fingers). Split-half reliability for word comprehension was reported to be between .90
and .95 for Grades 1 to 11 (Woodcock, 1987).
The passage comprehension test uses a modified cloze procedure requiring
participants to study a short passage and supply the missing word represented by a blank
line. Semantic and syntactic contextual clues need to be extracted to arrive at one of the
correct answers. The simplest levels occur at the beginning, are one sentence in length,
and nearly all contain picture clues to the text. Participants are asked to read each
passage to themselves and then supply an appropriate word to complete the passage.
The task commences with a sample item read by the examiner. The participant silently
reads all other items, though this is a non-mandatory requirement if the child persists in
reading aloud. A table of suggested entry points is supplied. Split-half reliability for

112
passage comprehension was reported to be between .68 and .94 for Grades 1 to 11
(Woodcock, 1987).
5.2.2 Participants
Participants were recruited using procedures approved by the Human Research Ethics
Committee of the University of Western Australia. Informed written consent was
obtained from parents and verbal assent was obtained from the participating children
themselves. All volunteers were screened for colour blindness, using the Ishihara tests
for colour blindness. Participants were required to be in the normal range of
intelligence, as defined by a full scale prorated intelligence quotient (FSIQ) greater than
70, with either verbal IQ (VIQ) or performance IQ (PIQ) greater than 80 (as per Helland
& Asbjornsen, 2000), these scores being based on the four WISC-III subtests. There
was an additional requirement that, in keeping with the DSM-IV, no global intellectual,
neurological, emotional, behavioural, or environmental irregularities were reported that
might better account for any behavioural or reading deficits. Major sensorimotor
handicaps and uncorrected problems in visual acuity also eliminated participants from
consideration. The control group‟s status was verified by both teachers and principals in
the relevant schools, and both parents and teachers completed two behavioural
checklists to ensure this sample was free from ADHD, and the children completed a
standardized reading test to ensure this sample was free from RD.
A total of 99 males were recruited. Piloting of several of the specially-created
tasks was completed with 10 of these participants. A further 29 participants failed to
meet the various selection criteria for the four experimental groups (see below). The
final sample comprised a total of 60 males. These participants were aged between 8
years, 6 months and 13 years, 4 months. There were 16 ADHD, 10 RD, 14 ADHD+RD
and 20 typically-developing control children. Table 5-1 provides descriptive statistics
for the groups on age and IQ estimates, as well as comparisons between the two ADHD
groups on the number and severity of ADHD symptomatology, and between the two
RD groups on the type and severity of reading difficulties. A one-way ANOVA
indicated that the four groups were not substantially different in age, F(3, 56) = 2.06, p
= .117, or PIQ, F(3, 62) = 1.57, p = .207. Given the composition of the groups,

113
discrepancies on VIQ were anticipated; nevertheless, whilst these differences
approached significance, they did not prove substantial, F(3, 56) = 2.71, p = .054. There
were no significant differences revealed across the ADHD subtypes (i.e., ADHD-PI,
ADHD-CT) on the age, VIQ, or PIQ estimates. A one-way ANOVA revealed no
differences between the ADHD and ADHD+RD groups across the number of
predominantly inattentive symptoms present, F(1, 28) = 0.00, p = .996, or across the
number of hyperactive-impulsive symptoms present, F(1, 28) = 0.04, p = .841. Nor
was there any noticeable difference between the ADHD and ADHD+RD groups in
terms of the severity of symptoms (i.e., on SNAP-IV ARI ratings), F(1, 28) = .00, p =
.949. A one-way ANOVA showed no significant differences between the severity of
symptoms (as determined by the length of the lag in months between the child‟s
chronological age and their reading age) either across basic word skills, F(1, 22) = .13,
p = .718, or across total word skills, F(1, 22) = .68, p = .420, as indicated on the
outcomes for the Woodcock Reading Mastery Tests.
Table 5-1. Descriptive characteristics for the control, RD, ADHD, and ADHD+RD groups (SDs
in parentheses; N = 60).
_______________________________________________________________________
Comparison ADHD only RD only RD+ADHD
(N = 20) (N = 16) (N = 10) (N = 14)
M (SD) M (SD) M (SD) M(SD)
_______________________________________________________________________
Age (in months) 129.56 (15.03) 124.62 (12.74) 134.95 (12.10) 136.75 (17.20)
Performance IQ 101.95 (12.84) 98.94 (15.61) 96.40 ( 7.52) 92.00 (14.85)
Verbal IQ 99.00 ( 9.63) 102.69 (10.73) 93.29 (10.14) 94.33 (11.28)
# PI symptoms 15.69 (2.44) 15.69 (2.69)
# HI symptoms 9.00 (5.18) 9.38 (4.99)
Symptom Severity 1.75 (0.58) 1.77 (1.01)
Basic Lag (mths) 31.30 (8.50) 33.00 (12.62)
Total Lag (mths) 29.30 (9.88) 33.15 (11.99)
________________________________________________________________________

114
5.2.2.1 ADHD Participants
The concise multi-gating classification approach adopted in this research employed both
a DSM-IV-based instrument and a suitable burden of impact measure for the screening
phase, incorporated both teacher and parent reports.
The ADHD participants were pooled from volunteers to the University of Western
Australia‟s Centre for Attention and Related Disorders, referrals from mental health
professionals, community referrals, and responses from advertisements placed in the
Learning and Attention Disorders Society‟s newsletter and the newsletters of several
metropolitan and country government schools. Hence, this was a mixed clinical and
community sample9.
Eligibility for the ADHD group required the child already having received a
pediatric diagnosis; this criterion ensured that the sample not only met the gold standard
here in Australia, but that any „soft‟ signs of physical, neurological, sociological, or
confounding psychiatric impairment that might better account for the behavioural
deficits particular to this group had been investigated. Both parent and teacher versions
of the SNAP-IV and SDQ were administered to all participants to confirm the ADHD
pediatric diagnoses and to screen for undiagnosed ADHD in control and RD
participants. The SNAP-IV indexed the degree of functional impairment created for the
ADHD individual by the disorder and allowed for the exclusion of a range of comorbid
conditions. The SDQ provided an additional marker of functional impairment and also
allowed for an estimation of the degree of “caseness” (or clinical significance) of any
abnormality so highlighted. Of especial importance, however, was the SDQ‟s provision
of an indicator for the burden of impact any problems underscored by this instrument
9 Although this was a largely community sample, a recent meta-analytic study covering similar
tasks of executive functioning in ADHD to the current study (Willcutt, Doyle, et al., 2005),
found the 8 community studies included in that selection showed an only slightly smaller effect
size (d = 0.49 ± 0.06) than the effect size in clinic-referred samples (d = 0.56 ± 0.04) and that
the group difference was significant for 18 of the 28 comparisons in the community samples.
The authors of this study concluded that the strong relationship between poor performance on
executive function tasks and ADHD was not restricted to clinic-referred samples.
115
imposed for the individual in the home and/or school setting. Thus, canvassing both
parent and teacher informants on the SNAP-IV and the SDQ yielded two main
measures: firstly, an indication of whether the severity was considered clinically
significant; and, secondly, the degree to which the individual was affected by the
disorder in one or more contexts.
Several criteria varying in stringency existed for the identification of the ADHD
participant. Firstly, to be declared a case of ADHD, 6 of the 9 DSM-IV criteria for the
inattentive dimension, and/or 6 of the 9 criteria on the hyperactivity-impulsivity
dimension had to be endorsed with a severity of 2 or 3 on both the parent and teacher
reports. Thus, appropriate subtype grouping could then be assigned. Additionally,
impairment across school and home contexts needed to be endorsed on the SDQ Burden
of Impact section, again across both parent and teacher reports. Where symptom tallies
for both informants were threshold for a particular diagnosis, but only one of the
informants reported a SNAP-IV ARI or SDQ burden of impact rating of 2 or higher,
conferral of the ADHD diagnosis was also assigned.
The second criterion for ADHD „caseness‟ was met if 6 of the 9 DSM-IV criteria
from the inattentive and/or 6 of the 9 criteria from the hyperactivity-impulsivity scale
were endorsed by either the parent or the teacher (this criterion corresponds to Lahey et
al.‟s, 1994, and/or algorithm). However, in addition, children needed to demonstrate at
least three symptoms of inattention and/or three symptoms of hyperactivity-
impulsivity, with impairment from those symptoms rated a “2” or “3” in terms of
severity, in each setting (as per Rowland et al., 2001), thus constraining modest
concordance between the parent and teacher reports. Again, this allowed consignment to
an appropriate subgroup type. The conferral of a “pervasive” case of ADHD-CT was
also made when a child displayed inattentive symptoms in one setting and hyperactive-
impulsive symptoms in the other setting, the diagnosis reflecting both sets of symptoms
(as per the recommendations of Mitsis, McKay, Schulz, Newcorn, & Halperin, 2000).
However, in this instance, only a single context needed to be endorsed on the SDQ
burden of impact scale. Hence the DSM-IV interpretation mandated in this instance is
that the child be impaired at school and at home and severely impaired in at least one
setting.

116
For the third ADHD criterion, the algorithms of Crystal, Ostrander, Chen, and
August (2001) were borrowed and extended. Accordingly, an ADHD participant was
identified when 6 out of the 9 criteria for inattention and/or 6 out of the 9 criteria for
hyperactivity-impulsivity (plus any corresponding criterion for the SDQ BOI) were met
for one informant, but where it was not met for the other informant.
Finally, those ADHD participants failing to satisfy the above criteria, but had a
pediatric diagnosis of ADHD, were then coded as “subthreshold”, where insufficient
items were endorsed to meet the cutoff for each category, possibly indicating some
symptom resolution, or the benefit of medication; thus, less than three symptoms of
inattention and less than three symptoms of hyperactivity-impulsivity were endorsed
when parent and teacher scores were blended, despite the relevant participant bearing a
pediatric diagnosis. Alternatively, the SDQ burden of impact scale may have failed to
reach clinical significance (despite the ADHD participant reaching symptom threshold
for a diagnosis), further suggesting medication benefit for the individual. Three of the
ADHD and three of the ADHD+RD participants fell into this category.
A total of 21 ADHD participants responded to the recruitment drive. Testing for
three children from the ADHD group was discontinued on the basis of their red-green
colour blindness, and two did not meet the age requirements (one of whom also showed
the presence of possible comorbid disorders on both the SDQ and SNAP-IV). The final
sample comprised 16 ADHD participants, including 9 ADHD-PI boys and 7 ADHD-CT
boys.
5.2.2.2 RD Participants
The approach adopted here paralleled that used to define the clinical ADHD group in
that it allowed for the study of a broad spectrum of the disability in question. RD
participants were referred by specialist tutoring agencies that responded to an
advertisement placed in the newsletter of the Dyslexia Speld Foundation10
and the
newsletters of several metropolitan and country government schools, plus additional
participants were recruited from another study conducted at the University of Western

117
Australia. One RD participant was selected from the control group screening carried out
in a government primary school in the metropolitan area on the basis of his poor reading
results; his class teacher confirmed his RD status based on his results on the annually-
administered Neale Reading Analysis (Neale, 1989).
All RD participants needed to demonstrate a history of reading problems. RD
children were defined as those children whose reading age lagged at least 1.5 years
behind their chronological age on the WRMT-R (Woodcock, 1987, 1998) total reading
full scale cluster (up to 1.5 SDs below the normative mean of 100). This cut-off point
ensured a wide range of participants were included who met a variety of criteria used in
the research literature. Participants with a standard score at or below the 25th percentile
(i.e., attaining a standard score equal or below 90, or scaled approximately 0.75 SDs
below the norm) on at least one of the oral reading or reading comprehension subtests of
the WRMT-R have generally been judged as poorly achieving, and are said to have
significant reading problems for their age (Badian et al., 1991; Bowers et al., 1988;
Bowers & Swanson, 1991; Bruck, 1992; Catts et al., 2006; Dykman & Ackerman, 1992;
Fletcher et al., 1998; Foorman, Francis, Beeler, Winikates, & Fletcher, 1997; Francis et
al., 1996; Frankenberger & Fronzaglio, 1991; Joanisse, Manis, Keating, & Seidenberg,
2000; Shankweiler et al., 1995; Shaywitz et al., 1995; Siegel, 1989; Siegel & Heaven,
1986; Wolf, 1984), so the criterion used in the present study is sufficiently rigorous.
A total of 16 RD participants was recruited. One RD participant was disallowed
because he failed to meet the IQ benchmark. Another RD child withdrew from the
study. A third child was disallowed because his reading scores did not meet the
stringent criteria for this category of participant. Three RD participants had parent and
teacher reports that met all accepted criteria for the first (and most stringent) criterion
for classifying ADHD participants11
, but there had been no prior pediatric investigation.
Such cases were included in the ADHD+RD clinical group and flagged for suggested
pediatric diagnosis. The final RD sample therefore comprised 10 participants.
10 The Dyslexia Speld Foundation provide literacy and clinical services to WA children and adults with
learning and reading difficulties.
11 In these 3 instances, both parent and teacher reports indicated 6 of the 9 criteria on the 2 subtype
listings, a clinically significant severity rating of 2 or 3, plus a clinical significant burden of impact.

118
5.2.2.3 ADHD+RD Participants
A total of 25 ADHD+RD participants responded to the recruitment advertising. Testing
for 14 of these children was discontinued: two of these children fell outside the age
requirements (one of the latter also rating highly for the presence of another comorbid
disorder on the SDQ and SNAP-IV), nine did not meet the RD criteria outlined earlier,
two failed to meet the IQ criterion cut-off point, and one was excluded on the basis of
colour blindness.
There were an additional 3 RD participants who met the very stringent initial
criterion otherwise taken in this study as an indication of the presence of ADHD (refer
5.2.2.1), satisfying the dimensional (not just the categorical) indicators on the SNAP-IV
for either ADHDPI or ADHDCT12
. A decision was made to include these participants in
the ADHD+RD grouping based on the assumption that the primary diagnosis of RD
may have precluded further investigation of comorbidity.
The total number of ADHD+RD participants included in the sample was 14. The
breakdown was 10 ADHD-PI participants with a concurrent RD diagnosis, and 4
ADHD-CT participants with comorbid RD.
5.2.2.4 Control Participants
Volunteers for this group were from Grades 2-8 of two local government primary
schools and one local government high school, all situated in a middle-class
socioeconomic area of Perth. School psychological assessments and academic records
indicated no diagnosed conditions, including learning difficulties, among the control
children. Control participants were screened for both ADHD and RD using the SNAP-
IV, SDQ, and WRMT-R.
A total of 26 typically developing children was recruited. Testing was only
partially completed for six of these children: two did not meet the age requirements, one
12Recall that SNAP-IV severity ratings of 2 or 3 are deemed significant in terms of the dimensional
categorization of ADHD. Because the SNAP-IV incorporates the symptom lists of the DSM-IV ADHD
criteria, it also provides a threshold tally to determine whether a categorical definition of ADHD can be
applied. (Refer 5.2.1.1.)

119
failed to meet the IQ criterion, one was deemed ineligible when screened for colour
blindness, one was disallowed because of language problems (an undisclosed
dyspraxia), one showed signs of fatigue (attributed to participation in an earlier sporting
program) so testing was discontinued, and the last had missing data on one of the RN
tasks. Thus, there was a total of 20 eligible children for the control group.
5.2.3 General Procedure
As noted above, all parents provided written, informed consent, and all children gave
verbal assent, and a 24 hour washout period was used for any child on medication.
All tasks were piloted on 10 children, aged 8-13 years; eight were considered
neither RD nor ADHD; one carried an ADHD pediatric diagnosis, and one carried an
RD diagnosis from an educational psychologist; none subsequently participated in the
experimental tasks to be reported.
Experimental participants were tested individually in two sessions lasting
approximately 85 minutes each. In the initial screening session, the following tests were
administered in the listed order: the Ishihara test, the four WISC-III subtests, and the
WRMT-R. Requests for completion of the SNAP-IV and SDQ by a parent and class
teacher were made at this session.
The experimental tasks were completed in the second session. In order to
counterbalance the order of administration of the alternative versions of some tasks, and
also the allocation of different stimulus sets to those versions, four test profiles were
constructed. The four profiles were used approximately equally often within each group
of participants. Participants received the four initial PA tasks13
first, in fixed order.
Either discrete or continuous versions of the RN tasks appeared next, dependent on the
test profile allotted a particular participant. The Stroop conditions occurred in a preset
order of presentation (word, colour, then colour-word, with a nonstandard negative
priming condition last) and intervened between the first and second presentation of the
RN tasks. The stop signal task was undertaken next. Then, in a change of pace designed
13 Taken from Wagner & Torgesen‟s Comprehensive Test of Phonological Processing (CTOPP; Wagner,
Torgesen, & Rashotte, 1999). (Refer Chapter 6.)

120
to enhance the participant‟s level of engagement, a shift was made to touch-screen tasks
for the second half of the testing session. Next, the four test profiles ensured a
counterbalanced order of presentation of both the short-term and working memory
tasks, and also the verbal and visuospatial versions for each of those tasks. Finally,
depending on the allocated test profile, the visuospatial or the verbal version of the SOP
search tasks took precedence in terms of presentation order. Full details on the
procedures for the experimental tasks are provided in subsequent chapters. A short
break and general conversation was provided between administration of the tests.
5.2.4 General Approach to Statistical Analysis
Typically, to test whether cognitive deficits are attributable to the presence of ADHD,
RD, or their comorbidity, 2 x 2 factorial ANOVAs were conducted for each individual
cognitive measure falling within the five domains under investigation (that is, PA,
memory, inhibition, RN, and SOP). In some cases, additional repeated-measure factors
were added to test for differences between experimental conditions. If either the main
effects of ADHD or RD or their interaction proved significant, further analyses were
conducted among the four groups to disentangle the respective contributions of the two
disorders to these outcomes. SPSS Version 15 was used for all analyses and the chosen
significance level was α = .05 throughout.
The complexity of stratifying the ADHD and RD groups into additional subtypes
(i.e., ADHD-PI, ADHD-CT, ADHD-PI+RD, ADHD-CT+RD, RD-Single Deficit, RD-
Double Deficit, ADHD-PI+RD-Single Deficit, ADHD-CT+RD-Single Deficit, ADHD-
PI+RD-Double Deficit, ADHD-CT+RD-Double Deficit, or along other lines) with such
a small cell size for each of the four main groupings was simply not viable. Because this
research is considered exploratory in nature, however, ADHD-PI and ADHD-CT
subtypes were compared to ascertain their pattern of performance across all the major
domains investigated.

121
Chapter 6: An Empirical Investigation of Phonological
Awareness
The aim of this investigation was to assess the importance of PA as a
neuropsychological correlate in the identification of children with RD, ADHD, and/or
their comorbid grouping. The literature review indicated that PA makes a substantial, if
not overriding, contribution to reading, and RD children show a consistent pattern of
deficits on those tasks traditionally purported to tap PA. Additionally, a systematic
investigation of PA (stepped in terms of task complexity and, hence, increased VWM
load) in school-aged ADHD children across a broad range of ages has not occurred to
date. This investigation therefore undertakes to increase our understanding of the impact
of a carefully selected range of PA skills on such children.
Tasks employed to index PA for this study were taken from the Comprehensive
Test of Phonological Processing (CTOPP; Wagner et al., 1999). The CTOPP is one of
the norm-referenced tests of PA and possesses strong psychometric properties (refer
Sodoro et al., 2002, for a review of this test‟s psychometric properties compared to
other tasks in this category). It was selected in favour of other tests of PA commonly
assessed in the literature review because the CTOPP contains core and supplementary
subtests tapping a wider range of skills deemed necessary to infer an individual‟s
competence in PA (i.e., blending, segmenting, deleting, and manipulation of phonemes;
refer Adams, 1990; Yopp, 1988). Many PA tasks impose significant burdens on verbal
working memory (Alloway, Gathercole, Willis, & Adams, 2004); however, the CTOPP
tasks are stepped in terms of their level of complexity, ranging from simple to complex.
Thus, two pairs of tasks were selected so that the range of tasks was stepped in terms of
the memory load associated with each; that is, the simpler blending and segmentation
tasks versus the more complex (increased working memory load) elision (i.e., deletion)
and phoneme reversal tasks. The use of word versions over non-word versions, where
available, reduced VWM demands and ensured a sharper contrast between the terms
“simple” and “complex” used in the current PA task dichotomy.

122
6.1 Experimental Design and Hypotheses
The current study used a fully-crossed (ADHD status x RD status) design to test
ADHD, RD, ADHD+RD, and typically-developing children on four subtests from the
CTOPP compendium of tasks tapping phonological processing, namely the elision,
blending, phoneme reversal, and segmentation subtests. The aim was to evaluate
whether a particular profile of PA deficits characterises RD, ADHD or their
comorbidity. The study also undertakes to investigate RD and ADHD with a more
comprehensive range of PA tasks than those previously employed in the literature.
Given the evidence from the literature review in this area, it was hypothesized,
firstly, that the phonological system would be more intact for school-aged children with
ADHD when compared to similarly-aged children classified as RD and ADHD+RD. It
has been established that the CTOPP‟s elision and phoneme reversal subtests should
make heavier demands on VWM than this battery‟s blending and segmentation subtests
(Yopp, 1988). It is also conjectured that children with RD, either alone, or in
combination with ADHD, would have increased difficulty with tasks that exercise
greater demands on VWM (refer Section 4.2.3). Hence, the second hypothesis states
that deficits on the PA tasks associated with RD will be more pronounced for the elision
and phoneme reversal subtests than for the blending and segmentation subtests.
6.2 Method
6.2.1 Participants
Participants were as described in Section 4.1; that is, 16 ADHD participants, 10 RD
participants, 14 ADHD+RD participants, and 20 control group children.
6.2.2 Procedure
Subtest administration followed the CTOPP manual. Each subtest was discontinued
when the ceiling of 3 consecutively incorrect items was reached. Correct answers were
recorded as 1 and incorrect answers as 0.

123
6.2.2.1 Elision
This sound deletion subtest was introduced as a word game. The subtest comprised 20
items that required the individual to repeat a word spoken by the examiner, and then say
the residual word when the designated sound was deleted. To familiarise the participant
with the subtest, the examiner began the assessment with three sample compound
words. In each instance, the participant practiced repeating the word verbatim, then
formulating the remaining word when one word from the compound word was
removed, with feedback provided. For example, Say ―popcorn‖. Now say ―popcorn‖
without saying ―corn‖. Three test items following this format (i.e., removing a single
word from a compound word) were then completed by the participant. The examiner
next presented three new sample items. In each case, a specific sound (rather than a
specific word) had to be dropped from the stimulus word, and correct/incorrect
feedback was given. For example, Say ―cup‖. Now say ―cup‖ without saying ―/k/‖. The
participant then went on to complete the remaining test items, with feedback
permissible on the first 2 of the 17 items next presented. The items deleted across the
subtest stimuli were single initial phonemes (e.g., /b/ from bold), final phonemes (e.g.,
/k/ from mike), central phonemes (e.g. /g/ from tiger), the second of two consonants
from initial blends (e.g., /n/ from snail), the first of two consonants from initial blends
(e.g., /f/ from flame) or final blends (e.g., /l/ from silk), and phonemes from initial
trigraph blends (e.g., /r/ from strain) or final trigraph blends (e.g., /k/ from fixed).
6.2.2.2 Blending Words
This 20-item subtest measured the participant‟s ability to combine individually
presented sounds to form whole words. For example, What word do these sounds make?
s-un. The separate sounds were presented by a female voice one sound at a time on an
audiocassette recorder, but were repeated once if the examinee requested the examiner
to do so. Six sample items ensured the participant was familiar with the subtest. The
first three test items involved blending of two syllables (e.g., num-ber), and feedback
was permissible on these initial test items only. The remaining test items involved the
blending of the sounds that make up a syllable (e.g., n-ap), or the blending of single
phonemes, ranging from two phonemes (e.g., i-t) to eight phonemes (e.g., g-r-a-ss-h-o-
pp-er).

124
6.2.2.3 Phoneme Reversal
Phoneme reversal required the repetition of 18 nonwords, reversing the order of sounds,
and pronouncing the resultant word. For example, Say ―ood‖; now say ―ood‖
backwards. The to-be-reordered nonwords became increasingly more complex as the
subtest progressed. For example, one of the last items reads: Say ―tīndim‖ (as in ―fine-
dim‖). Now say ―tīndim‖ backwards. The items were presented by a female voice on
the audiocassette recorder. The examinee had to repeat the nonword correctly (with the
cassette being replayed for a maximum of three times), then report the word obtained
when the nonword was reversed. If the examinee did not answer within 10 s he was
encouraged to try the next test item. Four sample items were presented initially, with
feedback provided. The test items were then presented, with feedback permissible on
the first three test items.
6.2.2.4 Segmenting Words
This 20-item subtest was designed to measure an individual‟s ability to say the separate
phonemes that made up a constituent stimulus word. Hence, the participant was
instructed to repeat a word, then to say the sounds individually. For example, Say ‗it‘.
Now say ‗it‘ one sound at a time. The item was scored as incorrect if the participant said
a phoneme incorrectly, omitted a phoneme, said the phonemes out of order, or failed to
segment the word adequately into the required number of phonemes. The number of
phonemes gradually increased, with up to eight phonemes being incorporated in any one
stimulus word. For example, one of the last items reads: Say ―important‖. The correct
response is the phonetic breakdown, ―i-m-p-ŏr-t-∂-n-t‖.
6.3 Results
The standard scores for the four CTOPP subtests were screened for outliers (scores
more than three SD units from the mean of the overall sample), and any such extreme
values were trimmed to be three SD units from the mean. Two outliers were revealed on
the segmenting words subtest (both ADHD participants) and dealt with accordingly. To
examine differences between groups with respect to each of the PA subtests, four (RD
status: RD, No RD) x 2 (ADHD status: ADHD, No ADHD) ANOVAs were conducted.

125
The subtests are considered in the order of complexity indicated by Yopp (1988). Mean
standard scores for the four groups on the four subtests are shown in Figure 6-1.
0
2
4
6
8
10
12
14
Blend Segment Elision PhonRev
CTOPP SUBTESTS
ME
AN
ST
AN
DA
RD
SC
OR
ES
__
__
RD
ADHD
ADHD+RD
Control
Figure 6-1. Mean CTOPP subtest standard scores (with standard errors shown as error bars) for
the four experimental groups.
On the simplest subtest, blending words, which makes the least demands on
working memory, no differences emerged across the four groups. However, there were
some anomalous findings for the segmenting words subtest. The univariate ANOVA
revealed an RD status by ADHD status interaction, F(1, 56) = 7.60, p = .008, ŋ2 = .119.
On further analysis, independent-samples t tests revealed the control group successfully
segmented more words than the ADHD group, t(34) = 3.21, p = .003. However, the
ADHD+RD group outperformed the ADHD group, t(28) = 2.38, p = .024. The ADHD
group was the poorest performing group overall (see Figure 6-1). The RD mean fell in
between the ADHD and ADHD+RD means, but did not differ significantly from that of
the control group. It is difficult to account for these results.
The results for the more complex elision and phoneme reversal subtests are more
clear-cut. RD status proved to be the most influential factor for both the elision subtest,
F(1, 56) = 38.21, p < .001, ŋ2 = .41, and for the phoneme reversal subtest, F(1, 56) =
36.84, p < .001, ŋ2 = .40. As can be seen in Figure 6-1, the RD and ADHD+RD groups

126
performed substantially more poorly than the control and ADHD groups on each of
these subtests. No other effects were significant in the ANOVAs for these two subtests.
Further analyses of the PA data for the ADHD-PI and ADHD-CT subgroups did
not reveal any significant differences between these subgroups.
6.4 Discussion
Given that PA is highly associated with reading ability (refer the phonological
processing literature review in Section 4.1.1), the finding that the performances of the
RD and ADHD+RD groups were compromised on the more difficult phonological
processing tasks (i.e., the elision and phoneme reversal subtests) is not surprising,
particularly given the increased VWM load associated with these more complex tasks.
On the simplest task, the blending words subtest which makes the least demands
on VWM, the four groups were indistinguishable in their success rates. On the
segmenting words subtest, the results for the control, RD, and ADHD+RD groups were
not significantly different from one another. However, the ADHD group was the poorest
performing group overall, with scores significantly below those of the control and the
ADHD+RD groups.
The initial hypothesis that PA skills would be differentially impaired in RD
children and not ADHD children was partially supported by this study. Both groups of
RD males exhibited depressed scores when their performance was contrasted with that
of the control and ADHD groups on the elision and phoneme reversal subtests (Figure
6-1.).
This outcome does support the second hypothesis, since the RD and ADHD+RD
children had greater difficulty on those tasks associated with increased verbal working
memory demands; that is, on the elision and phoneme reversal subtests. Note, too, that
this study explicitly removed a potential additional working memory burden from these
tasks by including only word (not nonword) versions. The results from the CTOPP
reinforce the notion that PA deficits in dyslexia become apparent if the tasks used to tap
this construct share a common substrate with some other construct thought to contribute
to RD.

127
Finally, it is worth noting that the combination of the two disorders did not result
in the ADHD+RD group performing more poorly than the two single-disorder groups.
Thus, there does not appear to have been an additive effect of RD and ADHD resulting
in lowered ADHD+RD performance.

128
Chapter 7: An Empirical Study of Memory
Performance in ADHD and RD
Few studies exist that have systematically investigated Baddeley‟s tripartite memory
system in ADHD and RD. Moreover, as stated previously, working memory has taken
new prominence in the hierarchy of deficits accorded the ADHD individual. Barkley
(1997a, 2003b) proposed that impairment in behavioural (dis)inhibition has a cascade
effect leading to deficits in executive functioning and working memory. More recently,
however, Tannock (1998; Tannock & Martinussen, 2001) proposed that ADHD is not a
behavioural disorder, but a learning disorder, and that its symptomatology is
intrinsically linked to working memory deficits, placing working memory as the central
core deficit. Tannock exhorted us to examine the specificity of working memory deficits
to ADHD and also to control for comorbid learning problems, such as RD.
The aim of the current study was to examine the nature of executive processing in
working memory as a core deficit in ADHD as distinct from deficits associated with
RD. It is one of a few studies to endeavour to achieve parity in stimulus types and task
structure across short-term and working memory versions of verbal and visuospatial
tasks, respectively, and to systematically investigate type of memory processing and
modality type across these two clinical populations.
Short-term memory tasks are those memory tasks which only have a storage
component. These tasks are operationalised via simple span tasks across the verbal and
visuospatial modalities. The verbal modality is linked to the phonological loop, whereas
the spatial modality is serviced by the visuospatial sketchpad. Working memory tasks,
on the other hand, require storage plus processing, and are assumed to tax the central
executive.
Recall, the interleaved number and letter task of the Wide Range Assessment of
Memory and Learning battery was the best candidate task resulting from the literature
review to tap VSTM. Its counterpart for assessing verbal working memory proved to be
the letter-number sequencing task of the Wechsler Adult Intelligence Scale. The most

129
viable contender for a suitable index of VSSTM was the Corsi span task. No suitable
candidate emerged from the literature review for the operationalisation of VSWM.
Importance was placed on matching the four tasks representing the verbal versus
visuospatial and short-term versus working memory dichotomies as closely as possible,
whilst avoiding likely confounds. Thus, a „clean‟ set of tasks was constructed to index
the four memory domains.
7.1 Method
7.1.1 Experimental Design and Hypotheses
The four memory tasks - VSTM, VSSTM, VWM, and VSWM - were presented in a
repeated measures design, with the order of tasks counterbalanced across participants.
This enabled the investigation of memory for the two disorders of interest in a 2 (RD
status: RD, No RD) x 2 (ADHD status: ADHD, No ADHD) x 2 (modality: verbal,
visuospatial) x 2 (processing: short-term memory, working memory) design. Four sets
of letter and number sequences were created and assigned in counterbalanced fashion to
the VSTM and VWM tasks across the participants in each group. Similarly, four sets of
sequences of locations were constructed and were used in counterbalanced assignment
for the VSSTM and VSWM tasks. Thus the allocation of stimulus sets to short-term
memory and working memory versions was counterbalanced across participants.
Given the preponderance of findings from the literature review, it is hypothesised
that ADHD children will demonstrate greater weakness in the visuospatial modality
than the verbal modality, as evidenced by shorter span scores for VSSTM and VSWM
relative to VSTM and VWM, compared to the control group. Based on the literature
review, it is further hypothesized that ADHD children will be more disadvantaged on
working memory tasks compared to short-term memory tasks (relative to the control
group) as a consequence of the greater executive demands of the working memory
tasks. In contrast, RD children are expected to demonstrate greater weakness in the
verbal modality than the visuospatial modality, as evidenced by shorter spans on the
VSTM and VWM measures than on the VSSTM and VSWM measures compared to
those achieved by the control group children.

130
7.1.2 Participants
Participants were as described in Section 5.2.2; that is, 16 ADHD participants, 10 RD
participants, 14 ADHD+RD participants, and 20 control group children.
7.1.3 Equipment
Apparatus for the memory tasks was the same as for an adult memory (validation) study
(see Appendix). Additionally, however, the VSWM task included directional cues that
were attached to the left casing of the monitor, alongside the upper and lower screen
halves (the cues were right-pointing arrow stickers, in black on yellow; see Figure 7-4).
Figure 7-1. Illustration of a trial of the VSTM task for the child study.
7.1.4 Verbal and Visuospatial Short-term Memory Tasks
The child versions of the short-term memory tasks were the same as the adult versions
described in the Appendix, except that there were no secondary task components
intervening between the encoding and recall phase of each trial (and, consequently, the
retention interval was reduced by 8 s). The procedure for single trials of the two tasks is
illustrated in Figures 7-1 and 7-2.
Ready
1s
Lapse of 2 s, plus elongated tone of 500 ms
Encoding and Maintenance Phase
Recall Phase
?
Verbal Task: Auditory presentation of letters and numbers at a rate of 1 per second
F 9
B 2
M

131
Figure 7-2. Illustration of a trial of the VSSTM task for the child study.
7.1.5 Verbal Working Memory Task
The VWM task presented mixed sequences of letters and numbers and required that the
two classes of items be recalled separately. This task paralleled the letter-number
sequencing subtest from the WAIS-III (Wechsler, 1997). It is accepted as a measure of
working memory performance and can be construed as a more complex processing-
plus-storage span measure (as per Miyake et al.‟s 2001 distinction). Like the letter-
number sequencing subtest, the current task involved the oral presentation of a series of
letters and numbers and the examinee was required to recall the two classes of items
separately, with first the numbers in ascending numeric order, and then the letters in
alphabetical order.
Instructions were adapted from those used in the letter-number sequencing subtest
and adhered as closely as possible to those of the VSTM task. Participants were
instructed that they would hear some numbers and letters. They were to listen carefully
and then, once they saw the question mark appear on screen, they were to say the
numbers first, starting with the smallest number and going up to the biggest, then say
Start
1 s
Lapse of 2 s, plus elongated tone of 500 ms
Spatial Task:
Presentation of spatial locations at a rate of 1 per second
Encoding and
Maintenance Phase
Recall Phase
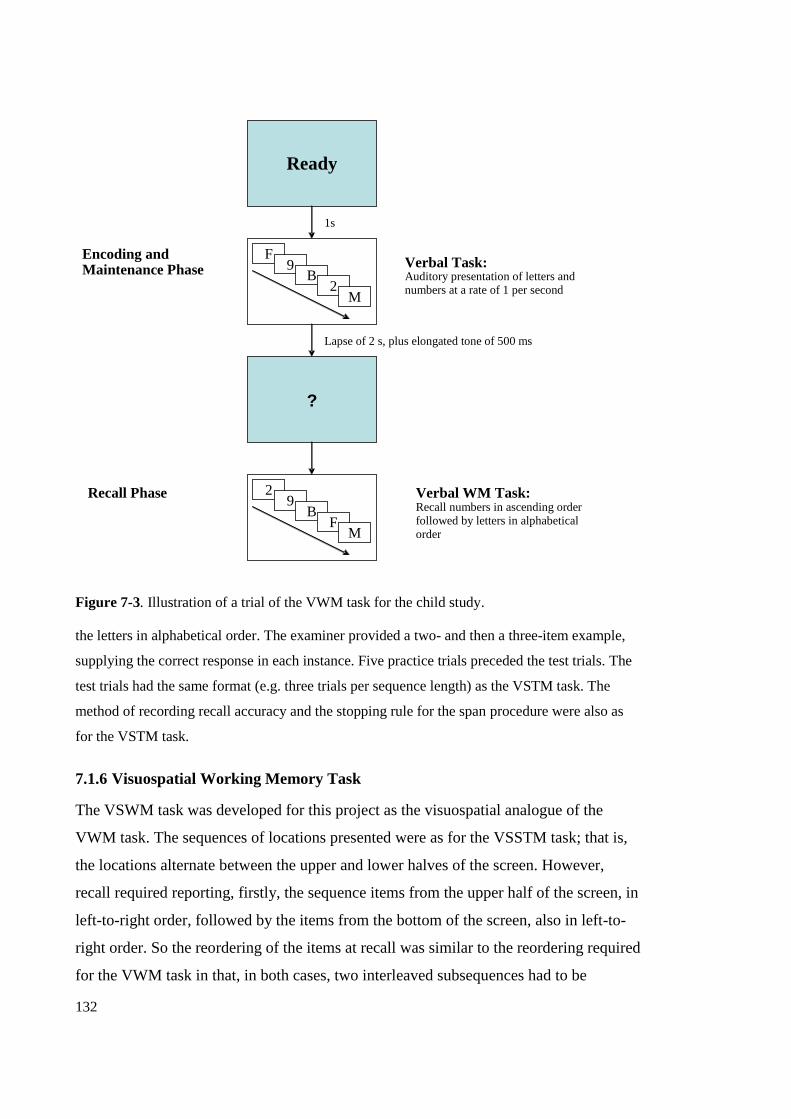
132
Figure 7-3. Illustration of a trial of the VWM task for the child study.
the letters in alphabetical order. The examiner provided a two- and then a three-item example,
supplying the correct response in each instance. Five practice trials preceded the test trials. The
test trials had the same format (e.g. three trials per sequence length) as the VSTM task. The
method of recording recall accuracy and the stopping rule for the span procedure were also as
for the VSTM task.
7.1.6 Visuospatial Working Memory Task
The VSWM task was developed for this project as the visuospatial analogue of the
VWM task. The sequences of locations presented were as for the VSSTM task; that is,
the locations alternate between the upper and lower halves of the screen. However,
recall required reporting, firstly, the sequence items from the upper half of the screen, in
left-to-right order, followed by the items from the bottom of the screen, also in left-to-
right order. So the reordering of the items at recall was similar to the reordering required
for the VWM task in that, in both cases, two interleaved subsequences had to be
Ready
1s
Lapse of 2 s, plus elongated tone of 500 ms
Encoding and Maintenance Phase
Recall Phase
?
Verbal Task: Auditory presentation of letters and numbers at a rate of 1 per second
F 9
B 2
M
2 9
B F
M
Verbal WM Task: Recall numbers in ascending order followed by letters in alphabetical order

133
Figure 7-4. Illustration of a trial of the VSWM task for the child study.
separated, and each recalled in a different order to the order in which it had been
presented.
Prior to task commencement, the armrest was positioned and the directional
arrows were then affixed to the left upper and lower monitor casing. Participants were
advised that when they saw the question marks appear in each of the boxes after the
sequence of illuminating boxes had completed, they were to report the boxes that
appeared above the central line first, starting with the one closest to the left-most side of
the screen and going across, then the boxes that appeared below the line, starting with
the one closest to the left-most side of the screen again (the experimenter sweeping her
index finger across upper and lower halves of the screen where appropriate). Two
Start
1 s
Lapse of 2 s, plus elongated tone of 500 ms
Spatial Task: Presentation of spatial locations at a rate of 1 per second
Encoding and
Maintenance Phase
Recall Phase Spatial WM Task: Original sequence re - formatted into upper serial order and lower serial order

134
examples followed to ensure the examinee had grasped the task requirements. The
procedure followed that outlined for the VSSTM task in all other respects.
7.2 Results and Discussion
The fractional scoring method used in the adult study was employed here also. One
univariate outlier amongst the VSTM scores was identified and subsequently trimmed
to fall 3 SD units from the mean. One set of memory data was missing for an ADHD
participant and that participant was removed from the analyses.
Table 7-1. Means (with standard errors in italics) for the four groups on VSTM, VWM,
VSSTM, and VSWM tasks.
________________________________________________________________________
ADHD RD ADHD+RD Control
________________________________________________________________________
VSTM 4.29 3.93 3.90 4.41
.13 .23 .18 .16
VWM 3.60 3.27 3.05 3.73
.15 .18 .20 .12
VSSTM 3.31 3.77 3.57 4.32
.23 .29 .27 .19
VSWM 2.87 3.10 3.29 3.90
.18 .27 .21 .19
__________________________________________________________________
A 2 (RD status: RD, No RD) x 2 (ADHD status: ADHD, No ADHD) x 2
(Modality: verbal, visuospatial) x 2 (processing: STM, WM) ANOVA with repeated
measures on the last two factors was conducted. Span scores were higher for the verbal
memory tasks (M = 3.82, SE = .07) than for the spatial memory tasks (M = 3.57, SE =
.10), F(1, 55) = 7.68, p = .008, ŋ2 = .12, plus span scores were also higher for the short-
term memory tasks (M = 4.04, SE = .09) than for the working memory tasks (M = 3.41,
SE = .79), F(1, 55) = 71.42, p < .001, ŋ2 = .56 (see Table 7-1). There was a two-way
interaction between modality and ADHD status, F(1,55) = 9.27, p =.004, ŋ2 = .14,
which was modified by a three-way interaction between modality, ADHD status, and

135
RD status, F(1, 55) = 4.19, p = .045, ŋ2 = .07. No other effects in the ANOVA were
significant.
To investigate the three-way interaction further, scores were collapsed across STM
and WM data and two separate 2 (RD status: RD, No RD) x 2 (ADHD status: ADHD,
No ADHD) ANOVAs were performed firstly on the verbal and then on the visuospatial
(combined) scores. For the verbal scores, the only significant effect was a main effect
for RD status, F(1, 55) = 12.38, p < .001, ŋ2 = .18, indicating that the RD and
ADHD+RD groups performed poorly compared to both the ADHD and Control groups
in this memory modality, whilst differences as a function of ADHD status were not
discernible (see Figure 7-5).
3.3
3.4
3.5
3.6
3.7
3.8
3.9
4
4.1
4.2
4.3
RD ADHD ADHD+RD Control
Groups
V
erb
al
Mem
ory
Sp
an
.
Figure 7-5. Means (and standard errors) of verbal memory span scores (collapsed across the
VSTM and VWM tasks) for each of the experimental groups.
When the visuospatial modality was examined in the same manner, there was a
main effect for ADHD status, F(1, 55) = 4.94, p =.030, ŋ2 = .08, and a two-way
interaction between RD status and ADHD status, F(1, 55) = 9.61, p = .003, ŋ2 = .15.
Follow-up tests using independent-samples t tests conducted on the visuospatial
(combined) scores revealed that the control group outperformed each of the other
groups, with t(33) = 4.333, p < .001, for the comparison with the ADHD group, t(28) =

136
2.279, p = .031, for the comparison with the RD group, and t(32) = 2.597, p = .014, for
the comparison with the ADHD+RD group (see Figure 7-6). The only contrast between
the special populations came with the ADHD group producing longer spans than the
ADHD+RD group on the verbal span tasks.
2.8
3
3.2
3.4
3.6
3.8
4
4.2
4.4
RD ADHD ADHD+RD Control
Groups
Vis
uo
spa
tia
l M
emo
ry S
pa
n .
Figure 7-6. Means (and standard errors) of spatial memory span scores (collapsed across the
VSTM and working memory tasks) for each of the experimental groups.
Further analyses of the memory data for the ADHD-PI and ADHD-CT subgroups
did not reveal any significant differences between these subgroups
In relation to the hypotheses, ADHD children were found to be impaired in
relation to control group performance on the visuospatial tasks (i.e., when short-term
and working memory scores were collapsed across modality), as predicted.
Furthermore, the subsidiary analysis of the combined span scores from the two verbal
tasks indicated that ADHD status did not affect performance, consistent with ADHD not
affecting verbal STM/WM to the same extent as it affects visuospatial STM/WM.
Concerning the effect of RD on memory, RD children (i.e., RD and ADHD+RD
children) performed significantly more poorly on verbal span measures (i.e., the
combination of verbal short-term and working memory scores) than the control and
ADHD children, consistent with predictions. However, surprisingly, deficits for the RD

137
and ADHD+RD groups in comparison to the control group for the visuospatial span
measures as well as the verbal measures. Given the way the tasks were especially
created for this research (i.e., to achieve some parity across domains), these findings are
particularly clear-cut. These memory profiles associated with RD and ADHD are
discussed further in Section 13.2.
Thus, as predicted, in terms of modality, the two RD groups showed verbal
memory deficits in comparison to control group performance when scores were
collapsed across short-term and working memory data sets, whereas the performances
of the ADHD and control groups were indistinguishable. Visuospatial memory
performance (when scores were collapsed across short-term and working memory data
sets) reliably distinguished the control group from all three of the atypical development
groups.

138
Chapter 8: An Empirical Study of Stop Signal Task
Performance in ADHD and RD
The aim of the current study was to examine the nature of that form of disinhibition
expressed in Barkley‟s self-control model (1997a, 1997b), and referred to by Nigg
(2001) as executive inhibition, whereby ADHD participants are said to be unable to
delay their initial prepotent response to an event. This form of inhibition is best
operationalised in the stop signal paradigm (see Section 4.3.2). The present study is one
of a few studies to systematically investigate inhibition across the two special clinical
populations of interest, namely ADHD and RD.
If Barkley‟s theory of inhibition is correct, the performance of ADHD children
will be compromised on the stop signal task. As per Lijffijt et al. (2005), it is
hypothesised, more specifically, that the performance of ADHD children will be
characterised by a disproportionately longer stop signal RT compared with the go RT go
RT, relative to no-ADHD children. If, however, an attention deficit might better explain
the performance of ADHD children, then their pattern of responding should reveal
longer go RTs and stop signal RTs, and more lapses of attention (signaled by larger
variability in the go RT), relative to no-ADHD children.
In line with the results reported by van der Schoot et al. (2000), Purvis and
Tannock (2000), and Willcutt, Pennington, et al. (2005), it is reasonable to anticipate
inhibition deficits in the two RD groups as well, signaled by longer stop signal RTs.
However, whether or not the RD and ADHD groups will be differentially impaired
across any of the remaining key variables of the stop signal task is unclear given the
disparities that exist in the current literature.
8.1 Method
8.1.1 Experimental Design
A 2(RD status: RD, No RD) x 2(ADHD status: ADHD, No ADHD) ANOVA design
was used to investigate each of the variables of interest.

139
8.1.2 Participants
Participants were as described in Section 5.2; that is, 16 ADHD participants, 10 RD
participants, 14 ADHD+RD participants, and 20 control group children.
8.1.3 Equipment
The stop signal task was programmed in Metacard 2.2. Stimuli were presented on a 38
cm computer screen connected to an Acer TravelMate 527TXV laptop computer, also
fitted with enclosed Bilsom Viking 2421 headphones through which the auditory signal
could be presented at a suitable volume independent of background noise. Each child
was seated facing the computer screen, with the seat adjusted for height so that the
child‟s arms rested comfortably on the keyboard and his head was in line with the centre
of the screen. The keyboard was placed so the arrow keys were situated at the child‟s
midline. Stickers labeled „X‟ and „O‟ were affixed to the arrow keys ( and ,
respectively) of the keyboard.
8.1.4 Stimuli
The stimuli selected for the choice RT task were the uppercase letters X and O. The stop
signal was a 500 ms, 1,000 Hz tone administered binaurally through the headphones.14
8.1.5 Procedure
The task comprised two phases: the go task practice phase established a prepotency to
respond on the first block of trials; the stop task phase started with the second block of
trials as practice (introducing the idea of inhibiting responses in response to the stop
signal tone) and the subsequent six blocks (blocks 3-8) were test trials on which the
bulk of the analyses are based. The entire task comprised 256 trials divided into eight
trial blocks separated by rest blocks. Responses were recorded automatically, with
timing to millisecond accuracy.
14 Whilst the use of an auditory stop tone in combination with a visual go stimulus might be construed as
a possible complication, nevertheless Rubia, Oosterlaan, Sergeant, Brandeis, and Leeuwen (1998) tested
two version of the stop signal task, one with the customary auditory stop signal and the other with a visual
stop signal. ADHD children showed consistent problems with inhibition on both stop signal task versions.

140
The go task practice phase comprised a single block of 32 trials in which the two
target stimuli were presented with equal probability. Each go task practice trial
commenced with a 500-ms fixation cross (2 mm x 2 mm), presented mid-screen. Next,
one of the stimuli for the choice RT task (either X or O in 48 point Times Roman
uppercase font) was presented centre screen for 1 s. The child was required to make an
X/O discrimination and could do so both at the time of presentation and during the time
in which the screen remained blank for 1 s after stimulus presentation. Thus, in total,
each trial covered a 2.5 s interval for the primary go task, with a 2 s interval available in
which the child could make a response. The stop signal was presented at a range of
delays (0-300 ms) after the primary task stimulus on 8 trials in this block so that
participants could become accustomed to it (see Figure 8-1).
Participants were instructed that they would see a fixation point followed by a
letter and that their task was to respond by pressing the associated key on the keyboard
as quickly as possible whilst avoiding errors. Children were encouraged to keep their
left- and right-hand index fingers on the X and O buttons respectively. Children were
also told that occasionally an auditory tone would be presented, but that they were to
ignore it.
The second block of trials constituted the stop task practice block. As with the
remaining six test trial blocks, this block also contained 32 trials. In each block, except
for the first trial being a go trial, the sequence of trials was generated at random by
computer, with the constraints being that: (i) Xs and Os appeared with equal frequency;
(ii) that the sequences so generated would not exceed runs of four Xs or four Os in
succession; (iii) that there should be 16 go trials, and that the stop signal should be
equally distributed between X and O presentations on the remaining 16 trials; and (iv)
that there would be no more than five go or stop trials in succession. As per the
introductory go task phase, one trial was presented every 2.5 s, during the last 2 s of
which the participant could respond to the go instruction for a particular trial or inhibit
response execution in accordance with task demands (see 8-1).
The tracking procedure used is similar to that set out by Schacher, Mota, Logan,
Tannock, and Klim (2000), varying only in that a longer initial stop signal delay (300
ms) was chosen for the present study (Schacher et al., 2000, used 250 ms), since a

141
Figure 8-1. Timing of events for stop signal trials.
longer delay was more in keeping with findings from the literature. As described earlier
(Section 4.3.1), the stop signal delay is the interval from onset of the primary stimulus
to onset of the stop signal tone. Following the initial 300 ms setting, the stop signal
delay was altered dynamically, that is, it increased by 50 ms if the participant
successfully inhibited responding on the previous stop trial; otherwise, it decreased by
50 ms. With this adaptive procedure in place, the race between go and stop responses
was expected to become tied, such that each participant would only be able to stop
responding on 50% of the stop signal trials, a necessary stipulation for estimating stop
signal RT. The stop signal delay at which participants inhibit approximately 50% of the
time represents the amount of handicapping necessary to tie the race between go and
stop processes (Schacher et al., 2000); this point of equilibrium is where the inhibition
process finishes on average (see Figure 8-2). Stop signal RT can thus be estimated by
subtracting mean stop signal delay from mean go signal RT for a period of performance
over which the participant is able to stop responding on approximately 50% of the stop
task trials.
The stop signal delay was reset to 300 ms at the beginning of each experimental
block (see Crosbie, 2000; Epstein, Johnson, Varia, & Connors, 2001; Potter &
Newhouse, 2004). A potential disadvantage of this procedure is that it may take some
trials at the start of each block for the stop signal delay to track to the optimal stop
signal delay for each child. However, some significant advantages are: (a) By resetting
the stop signal delay, each block of trials provides an independent assessment of the
ability to inhibit a response; (b) The reset meant that each block commenced with some
500 ms
Fixation
(+)
1,000 ms
X or O
1,000 ms
Blank
1,000 Hz
Tone
Stop signal delay

142
trials for which inhibiting the response should have been relatively easy, which should
have provided encouragement to the child and reinforced the goals of the task; (c) The
reset meant that the stop signal delay would be brought back to a reasonable level for
any children who were particularly inattentive towards the end of the preceding block,
or who were deliberately delaying a response to extend the stop signal delay.
For the second practice block of trials, as with the succeeding test blocks of trials,
participants were instructed to continue discriminating X and O stimuli as they had on
the previous (go task practice) block, but this time when they heard a tone, they were to
withhold responding on that trial (and not to worry if they were unable to do so). They
were instructed that the stop signal would occur randomly, infrequently, and at different
rates, affecting their ability to inhibit across trials (i.e., sometimes it would be very easy
to stop and other times nearly impossible). Additionally, it was emphasised that
participants were not to just wait for the stop signal in the event that it might occur.
Figure 8-2. Illustration of stop signal response time estimation (adapted from Williams,
Ponesse, Schachar, Logan, & Tannock, 1999).
After each block, children were reminded about the importance of maintaining
speed and accuracy of their responses to the go signal and that, wherever possible, they
should not respond on trials where an auditory tone was presented (i.e., emphasising
GO-SIGNAL REACTION TIME
STOP-SIGNAL
DELAY
STOP
SIGNAL
STOP-SIGNAL
REACTION TIME
Time

143
both stop and go processes to participants). Total testing time was approximately 15
minutes.
8.2 Results
The range of response permutations is outlined in Table 8-1. The key variables of
interest for the analyses are: a) go RT; b) the variability of go RT (i.e., SD of go RT); c)
stop signal RT; d) accuracy of go task responding; and e) the probability of inhibition.
Each variable of interest was calculated for each of blocks 3-8 and then averaged across
blocks. In order to give the participant time to “settle”, the data from block 2 was not
incorporated into the analyses. Go RT referred to the mean latency of responding across
correctly-executed responses on go trials. (For later comparison purposes, a measure
was also taken of go RT across both correctly and incorrectly executed responses on go
trials to determine if any of the groups was particularly disadvantaged here.) The
variability of go RT was the SD of RTs for correct responses on go trials. Stop signal
RT was calculated as the difference between mean go RT and mean stop signal delay.
Accuracy of go task responding was percent correct for go trials (calculated to account
for both omission and commission response errors). The probability of inhibition was
the probability of stopping given a stop signal occurred.
Several checks on data integrity were run to ensure that only valid blocks of data
were included in the analyses. Invalid blocks were: (i) those blocks where accuracy was
less than 70%, indicating either failure to attend on the part of the participant, or an
administration error; (ii) those blocks where the probability of stopping was less than
20% or greater than 80%, indicating that the participant was either waiting for or,
alternatively, ignoring the tone on that particular block; and (iii) those blocks where the
stop signal RT was less than 50 ms, indicating failure on the participant‟s behalf to
comply with the task demands. Participants had all their data excluded if their overall
accuracy was less than 75%.
The data of two participants (one ADHD, one ADHD+RD) were unusable because
of technical problems related to the running of the stop signal program. A further two
participants (both ADHD+RD) failed to meet the criterion of 75% accuracy overall, so
their data were removed from further analyses. One outlier data point was trimmed for
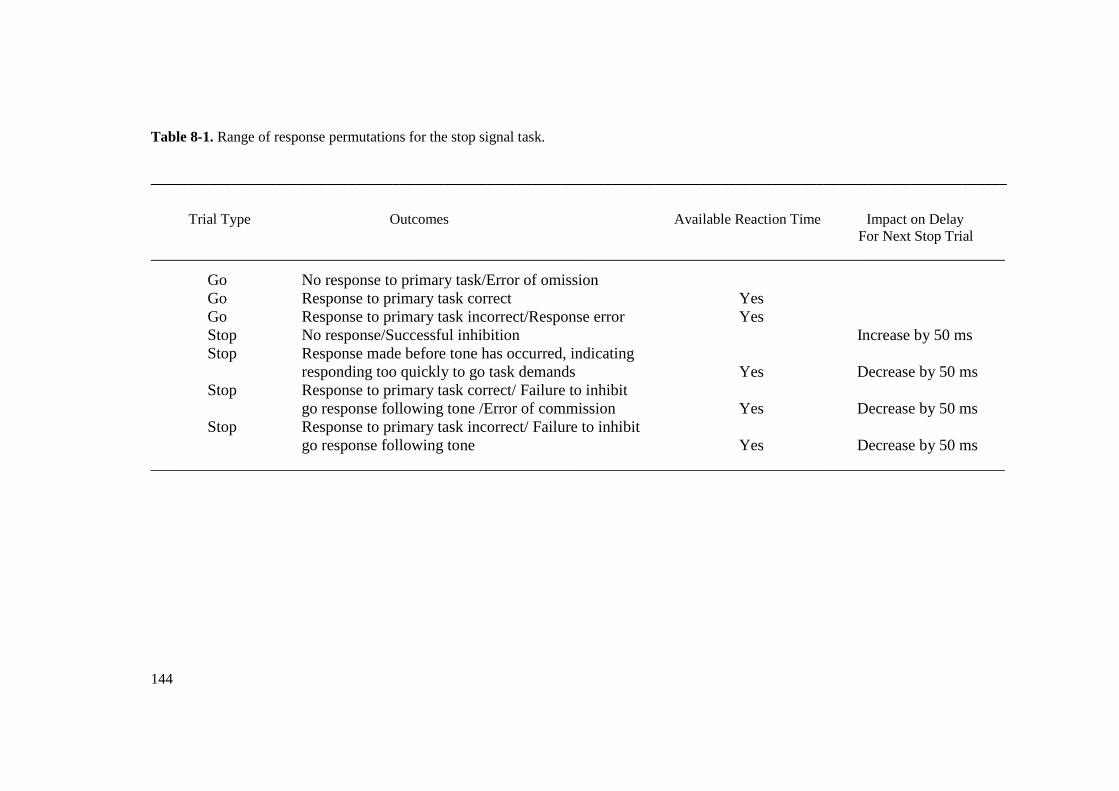
144
Table 8-1. Range of response permutations for the stop signal task.
_____________________________________________________________________________________________________________________
Trial Type Outcomes Available Reaction Time Impact on Delay
For Next Stop Trial
___________________________________________________________________________________________________________
Go No response to primary task/Error of omission
Go Response to primary task correct Yes
Go Response to primary task incorrect/Response error Yes
Stop No response/Successful inhibition Increase by 50 ms
Stop Response made before tone has occurred, indicating
responding too quickly to go task demands Yes Decrease by 50 ms
Stop Response to primary task correct/ Failure to inhibit
go response following tone /Error of commission Yes Decrease by 50 ms
Stop Response to primary task incorrect/ Failure to inhibit
go response following tone Yes Decrease by 50 ms
___________________________________________________________________________________________________________

145
go RT variability (the participant was categorised as ADHD+RD) to be three SD units
from the group mean. A 2 (ADHD status: ADHD, No ADHD) x 2 (RD status: RD, No
RD) univariate ANOVA was then performed for each of the variables of interest.
Table 8-2 shows stop signal task performance for children in each of the four
diagnostic groups. There were no significant effects in the ANOVA conducted on the
latency of the go RT either for the mean RT taken only from correctly-performed trials,
or for a mean RT based on all go trials (covering correctly- and incorrectly-performed
trials). On the variability of go RT (correct trials only), the main effect of RD status was
significant, F(1, 52) = 6.52, p = 0.014, ŋ2 = 0.11, indicating that there was greater
variability for RD participants compared to No-RD participants. The ADHD status main
effect yielded F(1, 52) = 3.96, p = 0.052, ŋ2 = 0.07, with the trend being for ADHD to
contribute to greater RT variability (see Table 8-2). On examination of the accuracy
rates on the go task, main effects were found for both RD status, F(1, 52) = 14.12, p <
0.001, ŋ2 = 0.21, and ADHD status, F(1, 52) = 8.48, p = 0.005, ŋ
2 = 0.14, indicating
that the presence of the disorders lowered accuracy in an additive way (see Table 8-2).
There were no differences found between any of the groups on the probability of
inhibiting given a stop signal occurred (which is not surprising, since the stop signal
delay was adjusted dynamically with the aim of achieving a 50% probability for each
participant).
On the critical stop signal RT measure, a main effect was found for RD status, F(1,
52) = 6.34, p = 0.015, ŋ2 = 0.11, indicating that participants with RD took longer to stop
compared to those participants without RD, and the two-way interaction between RD
status and ADHD status just failed to reach significance, F(1, 52) = 3.82, p = 0.056, ŋ2
= 0.07. Surprisingly, the main effect of ADHD status on stop signal RT was not
significant. However, because the two-way interaction indicated a trend towards
significance, and to maintain comparability to analyses conducted on other measures,
some pairwise comparisons were conducted. Each of the three disorder groups had
significantly longer stop signal RTs than the control group, with t(34) = 3.27, p = .002,
for the ADHD group, t(28) = 3.61, p < .001, for the RD group, and t(28) = 3.13, p =
.004, for the ADHD+RD group (see Table 8-2).

146
Table 8-2. Comparison of diagnostic groups on stop signal paradigm performance.
_____________________________________________________________________
Variable of Interest Control ADHD RD ADHD+RD
(n = 20) (n = 16) (n = 10) (n = 10)
M M M M
( SD) ( SD) ( SD) ( SD)
____________________________________________________________________
Go reaction time (ms) 716.90 727.22 797.70 751.51
(109.06) (96.27) (157.46) (138.14)
Go reaction time SD (ms) 173.36 225.07 234.21 246.95
(46.92) (50.73) (75.93) (68.60)
Accuracy of go task (%) 94.93 90.46 89.17 84.80
(3.89) (6.00) (5.42) (7.01)
Probability of inhibition 0.63 0.55 0.59 0.56
(0.11) (0.12) (0.12) (0.12)
Stop signal reaction time (ms) 300.48 388.90 422.53 404.29
(61.70) (99.63) (125.06) (121.77)
_____________________________________________________________________
In further analyses of performance on the go task trials, the levels of omission
errors (failure to respond on go trials) and response errors (making an incorrect response
on go trials, such as pressing the X key when the O stimulus appeared) were considered
separately. Both types of errors were calculated across the 16 go task trials within each
block of test trials, and a mean then calculated across the six blocks. Two outliers
comprising especially high error rates were truncated to be three SD units from the
mean (both ADHD+RD participants). There were main effects found of RD status, F(1,
52) = 6.00, p = 0.018, ŋ2 = 0.10, and of ADHD status, F(1, 52) = 11.27, p < 0.001, ŋ
2 =
0.18 on errors of omission, indicating the presence of RD and ADHD had essentially
additive effects on these errors. Only a main effect of RD status was found for the
analysis of response errors, F(1, 52) = 6.57, p = 0.013, ŋ2 = 0.11, indicating that RD
participants were more likely to make these errors than no-RD participants (see Table 8-
3).

147
Table 8-3. Mean number of errors of omission and response errors for the four groups.
________________________________________________________________________
Control ADHD RD ADHD+RD
(n = 20) (n = 16) (n = 10) (n = 10)
M (SD) M (SD) M (SD) M (SD)
________________________________________________________________________
Omission 0.37 (0.32) 0.91 (0.66) 0.75 (0.81) 1.41 (0.88)
Response Error 0.44 (0.54) 0.63 (0.57) 1.06 (0.89) 0.98 (0.82)
________________________________________________________________________
Finally, Cohen‟s d was estimated for the key variables. Note that positive effect
sizes here indicate that a particular clinical group had higher scores (i.e., longer go RTs,
stop signal RTs, and larger variability in go RTs) than the control group. All
comparisons in the current study resulted in positive effect sizes (see Table 8-4); in all
cases, a larger effect size for stop signal RT was obtained than that for mean go RT. The
most pronounced effect sizes occurred for the stop signal RTs and the variability of go
RT latencies.
Table 8-4. Effect sizes for stop signal task variables.
________________________________________________________________________
Comparison Go Variability Stop Signal
Reaction Time Reaction Time Reaction Time
________________________________________________________________________
ADHD vs. Control 0.10 1.06 1.10
RD vs. Control 0.61 0.99 1.31
ADHD+RD vs. Control 0.28 1.27 1.13
________________________________________________________________________
Further analyses of the stop signal data for the ADHD-PI and ADHD-CT
subgroups did not reveal any significant differences between these subgroups.
8.3 Discussion
Recall that, according to Barkley‟s model of inhibition (see Section 4.3.2), ADHD
children should perform more poorly than their control group counterparts on the stop
signal task. Specifically, their inhibition deficit should be characterised by intact go RT
but longer stop signal RTs. On the other hand, Lijffijt et al. (2005) conjectured that the

148
combination of comparable slowing in go and stop signal RTs, and enhanced variability
in performance, would point to a mechanism other than deficient inhibitory control.
Slower go RTs were thought to be attributable to inefficient cognitive processing and/or
inattention, and the greater RT variability might also be due to more lapses of attention.
The available literature examining the ADHD and RD populations in a 2 x 2 design
(e.g., van der Schoot et al., 2000; Purvis & Tannock, 2000; Willcutt, Pennington, et al.,
2005), however, suggested that the two RD groups may show some inhibition deficits as
signaled by longer stop signal RTs, but it was difficult to speculate further because of
the small number of studies available.
The results for the current study indicate that all three clinical groups (ADHD, RD,
& ADHD+RD) had intact go RT, with no differences occurring between groups on
correctly-performed trials. The ADHD groups showed a trend towards longer stop
signal RTs and there was a trend for the ADHD groups to show greater variability when
compared to no-ADHD groups. Note from the table of effect sizes for comparisons of
the clinical groups to the control group (see Table 8-4) that the ADHD group showed a
substantial effect size for stop signal RT. Similarly, the ADHD+RD group also showed
a large effect size for stop signal RT, combined with a small effect size for go RT.
These results suggest that an inhibition deficit was apparent for the ADHD groups
The RD group also showed a substantial effect size for stop signal RT (see Table
8-4). However, for this group Table 8-4 shows a medium effect size for RD for go RT
(though there were no significant group differences on this measure), and there was a
significant effect of RD status in the analysis of go RT SDs that showed high variability
of responding responding for the two RD groups compared to the two no-RD groups
(but note from Table 8-4 that variability effect sizes for all three clinical groups are
large). These results suggest that RD children may have a combination of inattention
and inhibition deficits driving their poorer performances.
The presence of RD and ADHD contributed additively to errors of omission on go
trials. However, RD children made more response errors on go trials than the no-RD
children. Epstein et al. (2003) contend that errors of omission are thought to reflect
inattention, and response errors are thought to reflect impulsivity. Thus, inattention
associated with both ADHD and RD may have contributed to the omission errors. Plus,

149
this suggests that RD children have a range of inattention and inhibition deficits
impacting on their poorer performances.
Alternatively, it is possible that the equiprobable nature of the occurrence of stop
and go trials in the current study may have elicited more deliberate strategic processing
from RD and ADHD participants; therefore, RD and ADHD participants may have
either failed to respond or missed the deadline when they were uncertain (see Frobel-
Smithee, Klorman, Brumaghim, & Borgstedt, 1998), resulting in increased omission
errors.
Recall that van der Schoot et al. (2000) hypothesized that hasty and inaccurate
readers might overlap with the impulsivity and distractibility characteristics of ADHD
and might, therefore, perform similarly on tasks purported to measure disinhibition.
Their study showed that poor readers (specifically, those poor readers who manifested a
fast and global reading style characterized by errors) also failed to inhibit inappropriate
responding on the stop signal task. According to this view, however, ADHD
participants should also record higher response errors, but no main effect of ADHD
group was found on this measure. It is difficult to account for this anomaly (see Table 8-
3).
There are a few other idiosyncrasies within the results worth noting. Firstly, the
overall go RTs summarised in Table 8-2 are long when compared to some of the results
within the literature. Logan, Cowan, and Davis (1984) has previously stated that low-
frequency stop signals are usually preferred so as to avoid participants trading speed for
accuracy (i.e., inhibition success). Logan et al. (1984) assumed that participants would
sacrifice faster response to the go signal trials for accuracy if more frequent stop signal
trials were built into the stop signal task. Less frequent stop signal trials might be
assumed to create a stronger bias to the go stimuli (Ramautar, Kok, & Ridderinkhof,
2004); this greater prepotency to respond means that, when a stop signal occurs, a
concomitantly greater level of inhibitory pressure must be drawn upon to overcome the
demands of the go execution part of the task in order for the stop inhibition processes to
“win the race” in terms of the race model. Nevertheless, the go RTs achieved for the
ADHD group in the current study using a stop signal probability of 50% (M = 727 ms)
are comparable to those achieved by Schacher et al. (2007) for his ADHD participants

150
aged 7-16 years with a stop signal probability of 25% (M = 729 ms). However,
Schacher et al.‟s (2007) control group achieved a comparably shorter go RT mean of
611 ms, compared to the current mean of 717 ms, so it may be that only the control
groups in Schacher et al.‟s study and the current study conform to Logan et al.‟s (1984)
expectations. Moreover, the mean go RTs in the current study (i.e., those for the ADHD
and control groups) are comparable to those achieved by Brandeis et al. (1998) for their
ADHD and control groups. Brandeis et al. (1998) also instituted equiprobable go and
stop trials.
Ramautar et al. (2004) set out to specifically investigate the comparative impact of
low (20%) and high (50%) probability stop signal occurrences in adult participants. RTs
in the go task condition were, indeed, shorter in the low rather than the high condition,
in line with the hypotheses set forth by Logan et al. (1984). The percentage of misses on
the go task condition was minimal for both the high and low probability conditions,
whereas the percentage of incorrect responses on the go task condition were 5.1% in the
50% condition, and 11.6% in the 20% condition, suggesting accuracy may have been
swapped for speed in the lower probability condition. With regard to the RTs on
unsuccessful stop signal trials, RTs for these commission errors were faster in the 20%
than the 50% condition. Thus, when stop signals occurred less frequently on the stop
signal task with an adult sample, go stimuli elicit faster RTs and stop signals elicit more
commission errors than when stop signals occur more frequently. It can be said,
therefore, that adult participants (not carrying a clinical diagnosis) sacrifice accuracy for
speed when stop signals are presented less frequently. Stop signal RT in fact remained
constant over the two probability conditions, indicating that the latency of response
inhibition was itself unaffected by the frequency of the presentation of stop signals
(Ramautar et al., 2004). Therefore, the faster go RTs indicated for the lower probability
stop trials indicated an increased set-to-go prepotency as the dominant mechanism
driving such outcomes. If participants are, indeed, more accurate on a higher stop
probability condition of the stop signal task, and less prone to error when a stop signal
actually occurs, this raises the question of whether ADHD participants are similarly
advantaged under higher probability stop conditions. In the current study, there were no
differences between the groups on the probability of their inhibiting a response when a

151
stop signal occurred on a given trial, but the ADHD participants still remained more
inaccurate than the control group.
There are only two extant studies that specifically examine the performance of
ADHD children on the stop signal task using go and stop trials of equal frequency. In
the first one, that previously referred to of Brandeis et al. (1998), 11 ADHD children
and 9 control group children, with a mean age of 11 years, were examined on a forced
choice RT task; on 50% of the trials, an additional secondary stop stimulus occurred at
one of three delays (short, medium, or long). ADHD children made more errors on the
go task than did control children. Go RTs were actually faster for ADHD children than
control children, particularly at the shorter delay. Recall that meta-analytic results for
ADHD children on studies using low frequency stop signals generally indicate slower
and more variable go RTs for ADHD children than control children, along with slower
stop signal RTs. In Brandeis et al.‟s (1998) study, however, the percentage of successful
stop signal trials did not differ significantly between groups, nor did the length of stop
signal RTs differ significantly between groups either, suggesting the inhibition process
was similar for both groups.
Rubia et al. (1999) investigated whether ADHD is associated with dysfunction of
prefrontal brain regions during motor response inhibition while performing the stop
signal task, by comparing the frontal brain activation of seven adolescent ADHD males
with that of nine non-ADHD males, all aged 12-18 years, and matched for age, sex, and
IQ. In the control condition, participants were required to respond via a button press
whether the go task stimulus of an aeroplane appeared alone or was followed 250 ms
later by a zeppelin, in order to set up a prepotency for response. For the stop task itself,
on 50% of the trials, a bomb replaced the zeppelin, appearing 250 ms after the aeroplane
onset. The go portion of the task required participants to respond when the aeroplane
appeared alone, and withhold their response when the aeroplane was followed by a
bomb. The ADHD group showed a trend towards significantly shorter RT than the
comparison group on the go trials, and a trend towards lower probability of inhibition
on the stop signal trials; statistically, though, the ADHD results were undifferentiated
from those of the control group. Thus, the results of Brandeis et al. (1998) and Rubia et
al. (1999) contrast sharply with the customary slower go RTs evidenced in the review of

152
the ADHD literature for ADHD children when compared to typically-developing
children, and the forecast slower go RTs of Logan et al. (1984) if a higher frequency
probability is employed. Both of the existing ADHD studies with equiprobable go and
stop trials report faster go RTs for the ADHD samples than the control groups of
children; it appears that with higher frequency probability stop signals, ADHD children
allow the go task demands to have primacy, and do not just delay their response in
anticipation that a stop signal could occur on any particular trial. Thus, increased
frequency of stop signals appears to impact on the stop signal task for the ADHD child
by decreasing the go RT.
The advantage conferred by the increased probability of stop signal trials is
evident in the current results. None of the three clinical groups in the current study
showed significant differences from the control group in terms of go RT. Thus, the
increased frequency of stop signals possibly allowed the ADHD child to respond more
consistently to task demands; this, in turn, possibly led to the typical go RTs evidenced.
An alternative explanation of the pattern of performance of ADHD samples with
different probabilities of the stop signal comes from a body of work investigating goal
neglect. Goal neglect is said to account for some instances of performance failure. It
occurs when an individual ignores a task requirement despite being able to describe
what should occur in the task context (Duncan, Emslie, Williams, Johnson, & Freer,
1996; Duncan et al., 2008). This sort of behaviour is sometimes ascribed to frontal lobe
patients. Goal neglect, by its association with Spearman‟s g factor (Duncan et al., 1996),
has also been linked with the ability to focus on task-relevant information (Kane &
Engel, 2002; Kyllonen & Christal, 1990). Additionally, goal neglect has been linked to
working memory capacity (Kane, Conway, Hambrick, & Engle, 2007). Kane and Engle
(2003) found that presenting many congruent trials (e.g., the word RED in red) on a
Stroop-type task resulted in less successful inhibition on the rarer incongruent trials
(e.g., the word BLUE in red). Moreover, those participants with lower working memory
capacity committed 50-100% more errors than those participants with higher working
memory capacity. McVay and Kane (2009) suggest that lower working memory
capacity participants are less able than higher working memory capacity participants to
sustain attention to the demands of the ongoing task, particularly where the ongoing task

153
involves conflict of some nature. It may be that the higher frequency of stop signal
appearance may have made it easier for the ADHD child to maintain their goal (or
instructional set) and to efficiently inhibit responses to the nontarget items.
In summary, the overall results of the current study suggest that the poorer
performance of ADHD children compared to that of their neurotypical peers on the stop
signal task is characterised predominantly by an inhibition deficit, though there are
some signs that inattention may play a part in the occurrence of more errors of omission.
This inhibition deficit results in intact go RT, a trend towards prolonged stop signal
RTs, and increased variability when confronted with the demands of the stop signal
task. On the other hand, the poorer performance of RD children compared to that of
their normally developing peers on the stop signal task is characterised by an attention
deficit, though there are some signs that disinhibition may play a part in the production
of more incorrect responses on go trials (i.e., response errors). This attention deficit
results in prolonged reaction times on both go and stop trials, and increased variability
in reaction times. A small effect sizes for go RT for the ADHD+RD group (when their
results are contrasted with those of control group children) is indicative that their
combination of deficits more closely approximates those of the ADHD than the RD
group of children.

154
Chapter 9: An Empirical Study of Stroop Performance
in ADHD and RD
Barkley (1997a, 1997b) views problems with response inhibition as central to ADHD.
The Stroop is the classic test of response inhibition in that one of its conditions requires
that the individual inhibit a cognitive representation that is competing with the correct
response option. (The stop signal task, on the other hand, required inhibition of an
ongoing motor response.) For the present study, a computerised variant15
of the
standardised Stroop task (Golden, 1978) was devised, encompassing the customary
word, colour and colour-word subtasks, and a less-commonly used negative priming
condition.
In the word condition of the Stroop, participants read a list of colour names
presented in black typeface; the task, therefore, essentially assesses reading speed (see
Figure 9-1).
Figure 9-1. Stroop word condition, where the task is to read the words.
15 Computerised formats of the Stroop reveal more reliable deficits in inhibition for ADHD children
(Lansbergen, Kenemans, and van Engeland, 2007).
RED GREEN GREEN RED RED
YELLOW YELLOW YELLOW GREEN GREEN
GREEN BLUE BLUE BLUE YELLOW
BLUE RED RED GREEN BLUE
GREEN YELLOW BLUE RED YELLOW
RED GREEN YELLOW YELLOW GREEN
YELLOW YELLOW RED GREEN BLUE
BLUE RED GREEN BLUE RED
RED GREEN YELLOW RED BLUE
BLUE BLUE BLUE YELLOW YELLOW
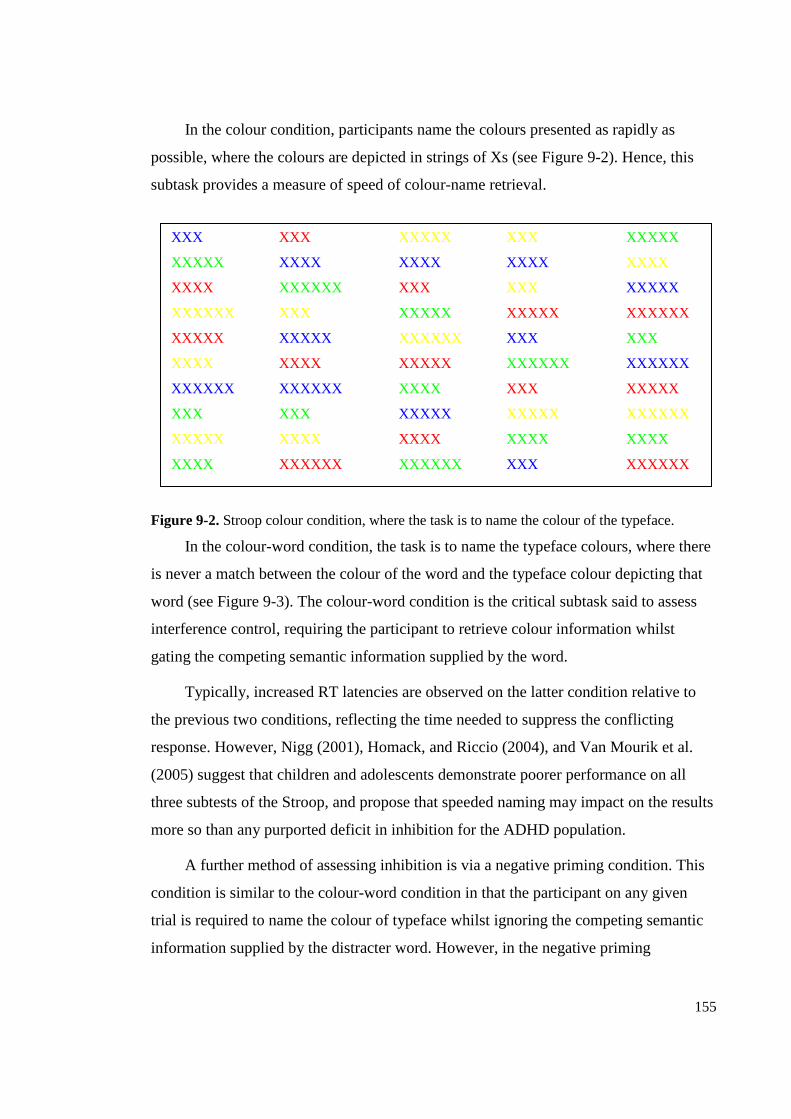
155
In the colour condition, participants name the colours presented as rapidly as
possible, where the colours are depicted in strings of Xs (see Figure 9-2). Hence, this
subtask provides a measure of speed of colour-name retrieval.
Figure 9-2. Stroop colour condition, where the task is to name the colour of the typeface.
In the colour-word condition, the task is to name the typeface colours, where there
is never a match between the colour of the word and the typeface colour depicting that
word (see Figure 9-3). The colour-word condition is the critical subtask said to assess
interference control, requiring the participant to retrieve colour information whilst
gating the competing semantic information supplied by the word.
Typically, increased RT latencies are observed on the latter condition relative to
the previous two conditions, reflecting the time needed to suppress the conflicting
response. However, Nigg (2001), Homack, and Riccio (2004), and Van Mourik et al.
(2005) suggest that children and adolescents demonstrate poorer performance on all
three subtests of the Stroop, and propose that speeded naming may impact on the results
more so than any purported deficit in inhibition for the ADHD population.
A further method of assessing inhibition is via a negative priming condition. This
condition is similar to the colour-word condition in that the participant on any given
trial is required to name the colour of typeface whilst ignoring the competing semantic
information supplied by the distracter word. However, in the negative priming
XXX XXX XXXXX XXX XXXXX
XXXXX XXXX XXXX XXXX XXXX
XXXX XXXXXX XXX XXX XXXXX
XXXXXX XXX XXXXX XXXXX XXXXXX
XXXXX XXXXX XXXXXX XXX XXX
XXXX XXXX XXXXX XXXXXX XXXXXX
XXXXXX XXXXXX XXXX XXX XXXXX
XXX XXX XXXXX XXXXX XXXXXX
XXXXX XXXX XXXX XXXX XXXX
XXXX XXXXXX XXXXXX XXX XXXXXX

156
Figure 9-3. Stroop colour-word condition, where the task is to name the colour of typeface and
ignore the printed word.
condition, for the subsequent trial, the to-be-ignored distracter word from the previous
trial becomes the to-be-named colour in the current trial (see Figure 9-4). The effect in
the neurotypical adult population of negative priming is to slow naming relative to the
colour-word condition: thus, the previously-ignored stimulus item (on what is termed
the prime trial) takes longer to identify when it switches on the subsequent (or probe)
trial to become the target stimulus item (Dalrymple-Alford & Budayr, 1966; Neill,
1977). Inhibiting a distracter item on the prime trail makes it more difficult to process
that item on the following probe trial.
Thus, the neurotypical participant seems to continue to inhibit the previously
ignored word on the resultant trial. It would appear that it is not easy to suppress the
negative salience associated with the irrelevant word and make it more salient when
required (hence the general term applied to such phenomena is negative priming).
Negative priming is, therefore, purported to involve a more automatic, or involuntary,
inhibition process than the executive form of inhibition involved in the colour-word
condition; in the latter instance, the individual must consciously struggle to inhibit the
interfering aspect of the stimulus (the word) to correctly name the target aspect of the
stimulus (the colour of the typeface), whereas the involuntary persistence of the
distracter on the probe trial appears a more automatic process.
RED GREEN GREEN RED RED
YELLOW YELLOW YELLOW GREEN GREEN
GREEN BLUE BLUE BLUE YELLOW
BLUE RED RED GREEN BLUE
GREEN YELLOW BLUE RED YELLOW
RED GREEN YELLOW YELLOW GREEN
YELLOW YELLOW RED GREEN BLUE
BLUE RED GREEN BLUE RED
RED GREEN YELLOW RED BLUE
BLUE BLUE BLUE YELLOW YELLOW

157
Figure 9-4. Stroop negative priming condition, where the task is to name the colour of the
typeface and ignore the printed word.
Dalrymple-Alford and Budayr (1966) were the first to incorporate negative
priming into the Stroop. They discovered that response times increased when the target
hue on one interference trial matched the distracter word on the preceding trial relative
to those response times achieved when the colour-word lists were unrelated from one
trial to the next.
Studies by Pritchard and Neumann (2004) and Frings, Feix, Rothig, Bruser, and
Junge (2007), using neurotypical child samples, have shown that young children are
susceptible to a negative priming effect. Pritchard and Neumann (2004), for example,
showed the negative priming effect to be present from the age of 5 to 12 years for both a
flanker and a Stroop task. Very few studies, though, have investigated the impact of
negative priming on children with ADHD, and negative priming is, as yet, unexplored
territory in the RD population.
A reduced negative priming effect has been found on letter or syllable flanker
tasks for ADHD, as well as the more traditional Stroop task (Ossmann & Mulligan,
2003; Ozonoff, Strayer, McMahon, & Filloux, 1998), across child, adolescent, and adult
ages. Pritchard, Neumann, and Rucklidge (2007) reported a reduced, but nonsignificant,
negative priming effect in their largely ADHD-Predominantly Inattentive adolescent
sample, using a 50% density of negative priming items and 50% unrelated trials.
RED RED YELLOW BLUE RED
GREEN YELLOW BLUE RED YELLOW
BLUE RED RED GREEN GREEN
YELLOW BLUE GREEN BLUE BLUE
GREEN GREEN YELLOW YELLOW GREEN
RED YELLOW RED RED YELLOW
BLUE BLUE BLUE BLUE RED
YELLOW YELLOW GREEN RED BLUE
BLUE GREEN YELLOW GREEN RED
GREEN RED GREEN YELLOW GREEN

158
Christiansen and Oades (2009) investigated Stroop negative priming in children with
ADHD-Combined subtype and targeted children 6 to 17 years using a computerized
task format. There was a high degree of comorbidity (including 66% comorbid
oppositional defiant disorder, 51% conduct disorder, and 40% internalizing
mood/anxiety disorder) within the ADHD sample. Across the five test blocks used,
ADHD participants showed a reduced negative priming effect in the initial blocks of
congruent trials (where the colour and the word were congruent on the probe trial), but
not incongruent trials (where the colour and the word were incongruent on the probe
trial). Shin (2005), also using a computerized format, found that children with ADHD
showed a reduced negative priming effect on a Stroop-like task under a 500 ms
presentation time condition, but not a 100 ms presentation time condition. Gaultney,
Kip, Weinstein, and McNeill (1999) and Pritchard, Healy, and Neumann (2006) failed
to find a reduced negative priming effect in ADHD children using stimuli presented in a
card format. Thus, ADHD children appear more susceptible to the negative priming
effect if a computerized format for Stroop task condition is employed, and the effect is
more likely to appear when participants are exposed to stimuli for longer periods.
Further investigation is mandated given the mixed findings for the Stroop negative
priming effect on ADHD children.
9.1 Method
9.1.1 Experimental Design and Hypotheses
Each participant completed the four Stroop conditions in the fixed order of the word,
colour, colour-word, and negative priming conditions. The design was a 2(RD status:
RD, No RD) x 2(ADHD status: ADHD, No ADHD) x 4(Stroop condition: word, colour,
colour-word, negative priming) mixed design.
In terms of hypotheses pertaining to ADHD, this research evaluated several
hypotheses. If Barkley is correct and disinhibition is the central deficit for ADHD, then
ADHD children should be more impaired on the Stroop colour-word condition than
their typically developing peers. Alternatively, according to the meta-analytic findings
of Van Mourik et al. (2005), equivalent levels of Stroop interference between ADHD
children and their typically-developing peers will be achieved when word and colour

159
naming speed are taken into account. Hence, if naming speed is the dominant deficit,
ADHD children should be impaired across all three Stroop subtests compared to the
results of the control group of children, and ADHD children should yield interference
scores congruent with those of the control group of children. If inhibition is the
dominant deficit, on the other hand, ADHD children should be especially impaired
relative to the control children on the critical colour-word condition. Finally, in terms of
performance on the negative priming condition, whilst it is assumed that ADHD
children will be less effective in suppressing the irrelevant information on the prime
trial, which should subsequently facilitate their identification of the colour hue on the
probe trial, the results to date remain equivocal.
In terms of hypotheses for the RD population, several possibilities emerge for
investigation. Firstly, given the colour-word subtest relies on reading to be already
established as an automatic process, it might be anticipated that RD children would in
fact demonstrate less interference than ADHD and control children on this subtest. The
rationale here is that, if RD children are not automatically processing the word, one
would expect they would be less susceptible overall to the interference effect (Everatt et
al., 1997). Most researchers (Das et al., 1990; Everatt et al., 1997; Helland &
Asbjornsen, 2000; Kelly et al., 1989; Protopapas et al., 2007; Reiter et al., 2005; Wolff
et al., 1984; Willcutt et al., 2001; Willcutt, Pennington, et al., 2005), however, report
deficiencies for RD children on the colour-word portion of the Stroop as well when their
performance is contrasted to that of control samples. That is, the performance of RD
children is slower for the colour-word condition than for the colour condition, indicating
that the words are read by the RD children. (In fact, because RD children are slower
than control children across all three conditions, there may be another as-yet-unnamed
factor involved; that is, perhaps the RD child‟s slower performance across all three
subtests may point to a slower overall processing speed. This hypothesis will be
examined more fully in Chapter 11.) In terms of the negative priming condition, it is not
possible to draw on any extant research to couch an hypothesis. Nevertheless, from a
theoretical standpoint, if word-reading is less automatic for the RD population, it would
be reasonable to assume a lower negative priming effect for this group of children as the
distracter word on the prime trials would not have been sufficiently processed to have

160
substantial impact (in terms of overcoming or suppressing its degree of salience) when
it becomes the probe hue on the subsequent trial.
Because it is difficult to ascertain whether poorer outcomes on the Stroop are
attributable to deficits in inhibition control or deficits in speeded naming, an attempt
was made to control for speeded naming across the word and colour conditions by
employing the Golden method of calculating interference scores (recommended by Van
Mourik et al., 2005; refer also Pritchard et al., 2007).
9.1.2 Participants
Participants were as described in Section 4.1; that is, 16 ADHD participants, 10 RD
participants, 14 ADHD+RD participants, and 20 control group children.
9.1.3 Equipment
Apparatus for all RN tasks (Stroop, RNC, RND) included a 38-cm NEC MultiSync
V500 LCD micro-touch monitor using MicroTouch Touchscreen Version 3.4,
connected to an Acer TravelMate 527SV laptop computer. Experimental sessions were
recorded and directly inputted to computer in .wav file format via a compact Olympus
Digital Voice Recorder DW-90 digital voice recorder with Digital Wave Player
software.
Participants were seated in a height-adjustable chair. The monitor was placed
approximately 45 cm in front of the participant at head height. The Olympus DW90
directional microphone was placed on a stand at the base of the monitor. Standardised
conditions of average daylight (CIE Source C) were adhered to for all RN tasks. A table
was placed by a large window, providing plenty of natural daylight, effort being made
to eliminate direct sunlight and avoid reflection (as specified by Kelly & Judd, 1976, for
optimal colour viewing conditions).
9.1.4 Procedure
The experimenter was present throughout the experiment. When she launched each
condition, a sample 5 (column) x 10 (row) matrix of the appropriate stimuli appeared on
screen to familiarize participants with both the format and stimuli involved. This sample

161
screen also allowed the experimenter to visually direct the participant‟s gaze with a
manual gesture (i.e., by sweeping a finger down successive columns) to indicate that the
sequence direction progressed by column, consistent with the corresponding verbal
instructions outlining the task demands.
A key press by the experimenter signaled the commencement of each trial.
Participants were advised that the computer would warn them when the task was about
to commence by flashing up a cross in the middle of the screen and emitting a tone
signal. Both practice and experimental trials were preceded by the 500 ms, 1000 Hz
warning tone.
All conditions contained two test trials, each trial comprising a 5 x 10 matrix of
items. The participant‟s task was to name, as rapidly as possible, without error, as many
of the 50 items as possible, working down each column and from left to right across the
columns, and returning to start at the left-most column if the list was still in view when
the participant came to the end of the fifth column. The critical measure was the number
of items named in 25 s. An audio recording was made of each child‟s speech stream to
enable accurate scoring.
In the word condition, the sample matrix referred to earlier was used to familiarise
participants with the condition. They were told that “this is a test of how fast you can
read the words in a list just like this one”. When the test list appeared, participants were
instructed that they would need to read down the columns, starting with the first one
(whereby the instructor pointed to the left-most column) until completed, and then
continue without stopping down the remaining columns in order (with the instructor
running her finger down the columns in order), returning to the first column to begin
again if time permitted. If they made a mistake, the examiner would simply say “No”
and they were to self-correct and continue without stopping till the list disappeared. The
word condition consisted of 50 colour names presented in black capitalized typeface
(Times Roman font). Each set of four successive items involved the four colour words
„red‟, „green‟, „yellow‟, and „blue‟ presented in random order. No word was repeated
consecutively. Upon completion of each trial, participants were given a few seconds to
settle whereupon scripted instructions cued the next trial.

162
When the sample screen appeared for the colour condition, participants were
informed that the task was similar to the last one, excepting it required naming colours.
Each of the two trials of the colour condition consisted of 50 colour items, with each set
of four successive primary colours („red‟, „green‟, „yellow‟, or „blue‟) presented as a
four strings of Xs of random length (3, 4, 5, or 6) and in random order, with the
stipulation that the length of the string did not match the length of the colour name.
Colours corresponded to those colours indicated in the word condition (red, green,
yellow, and blue). These four primary colours were matched to focal category
exemplars from Berlin and Kay‟s (1969) landmark anthropological study. It was
possible to code these colour exemplars precisely via the Munsell colour scaling system
(Munsell, 1929). The Munsell colour specifications were: red (5R 4/14), yellow (2.5Y
8/16), green (7.5G 5/10), and blue (2.5B 5/12). The hue, value and chroma attributes for
each colour were matched with those listed in the Munsell colour library available in the
Adobe PageMaker6 software program. Screen captures of each of the colours were
taken and an RGB reading was obtained via Adobe Photoshop 5.5 to check for the
authentic reproduction of each of the Munsell colours in MetaCard. No colour was
repeated on consecutive trials, and each colour occurred equally often across the two
trials. Inter-trial rests were provided as in the previous condition. Participants were
again instructed to await the warning tone, and then begin.
For the colour-word condition, a sample screen was again used to introduce the
task requirements for this condition. The task was to name the colour of the „ink‟ the
words were printed in, ignoring the word that was printed for each item. Answers to the
first three items in the first column were elicited and feedback given. The two test
screens each displayed 50 items in the column formation common to the previous two
conditions. This time, though, each display consisted of the words in the word condition
presented in the colours of the colour condition, where there was never a match between
the word and the typeface colour in which it appeared. Care was also taken to ensure
negative primes were avoided in this condition. (See Figure 9-3.)
The negative priming condition was as for the colour-word condition, but with the
added complexity that the to-be-ignored distracter word for one item became the to-be-
named colour on the subsequent item. (See Figure 9-4.)

163
9.1.5 Scoring of Responses
The digitized recordings of the participants‟ responses were imported to Audacity 1.2.0,
an open source digital audio editor, for scoring. Any extraneous verbalizations were
coded as errors or self-corrections. A total mistakes proportion was calculated by taking
the mean number of total errors, missed items, and self-corrections across the two trials
for each subtest, and dividing by the mean number of responses across the two trials.
Errors were non-target responses (i.e., items that are not part of the to-be-named
sequence). Self-corrections were again non-target items, such as partially and fully
articulated errors, that were subsequently corrected by the participant, either self-
instigated or in response to cueing by the experimenter. Response rate was determined
by computing the mean number of items named in the 25 s for each test display. Stroop
interference scores were also calculated. Van Mourik et al. (2005) provide the Golden
(1978) formula for calculating an interference score that indexes colour-word (CW)
scores with reference to the number of items achieved on the word (W) and colour (C)
naming subtests:
Stroop Interference = CW – [(W x C)/(W + C)].
Thus, in Golden‟s method, a colour-word score is first predicted, and the predicted score
subtracted from the uncorrected colour-word score. The predicted colour-word score is
based on the assumption that the time to read a colour-word item is an additive function
of the time to read a word plus the time to name a colour.16
9.2 Results
Negative priming data were missing for one ADHD participant who was subsequently
deleted from the analyses. Preliminary inspection of the data revealed no outliers.
For the response rates, as is evident in Figure 9-5, several of the expected patterns
of results for the Stroop emerged. Firstly, the number of items produced was less for the
colour-word condition compared to the colour and word conditions. However, contrary
16 There is an alternative regression formula for calculating the predicted colour-word score, based on a
mean score corrected for the participants‟ age and education. However, the theoretical method illustrated
and the regression method, according to van Mourik et al. (2005), yield comparable results (r = .96).

164
to expectations, there was no additional difficulty associated with the negative priming
condition. Secondly, the neurotypical group produced more items than each of the other
groups for each condition.
The analysis of response rates comprised a 2 (RD status: RD, No RD) x 2 (ADHD
status: ADHD, No ADHD) x 4 (Stroop condition: word, colour, colour-word, negative
priming) ANOVA, with repeated measures for the last factor. Mauchly‟s assumption of
sphericity was violated so Greenhouse-Geisser corrections are reported. This analysis
revealed a main effect of Stroop condition, F(1.775, 97.642) = 775.37, p < .001, ŋ2 =
.93. Three paired sample t tests were conducted to test expected differences. The
comparison between word and colour conditions proved significant, t(58) = 19.19, p <
.001, as did the comparison between colour and colour-word conditions, t(58) = 26.67,
p < .001, showing the degree of difficulty increased in moving from the word to the
colour and then to the colour-word conditions. However, the comparison between the
colour-word and negative priming conditions was not significant, indicating a similar
level of difficulty for these two conditions.
0
10
20
30
40
50
60
Word Colour Colour-Word Negative Priming
Stroop Conditions
Res
pon
se R
ates
.
RD
ADHD
ADHD+RD
Control
Figure 9-5. Response rates, showing mean and standard error, achieved by each of the four
groups.

165
A main effect was found for RD status, F(1, 55) = 12.18, p < .001, ŋ2 = 0.18, along
with a two-way interaction between RD status and ADHD status, F(1, 55) = 7.63, p =
.008, ŋ2 = 0.12. Additionally, there was a two-way interaction between Stroop condition
and RD status, F(1.775, 97.642) = 9.21, p < .001, ŋ2 = .14. To clarify the interactions
further, independent-samples t tests were undertaken to compare the groups for each of
the four conditions of the Stroop. For the word condition, the control group achieved a
higher output (in terms of the number of items named correctly) than all three clinical
groups, t(33) = 3.17, p = .003, t(28) = 5.78, p < .001, and t(32) = 4.17, p < .001, for the
ADHD, RD, and ADHD+RD groups respectively. Additionally, as might be anticipated,
output for the ADHD group was significantly higher than that of the RD group on this
condition, t(23) = 2.42, p= .024. On the colour condition, the control group named
significantly more colours than all three clinical groups, t(33) = 4.06, p < .001, t(28) =
3.63, p < .001, and t(32) = 3.03, p = .005, for the ADHD, RD, and ADHD+RD groups
respectively. This pattern of superior control group performance was repeated for the
colour-word condition also, t(33) = 2.17, p = .037, t(28) = 3.12, p = .004, and t(32) =
2.13, p = .041, for the ADHD, RD, and ADHD+RD groups. However, the control group
performance was superior only to that of the two RD groups on the final negative
priming condition, t(28) = 2.93, p = .007, and t(32) = 2.08, p = .045, for the RD and
ADHD+RD groups respectively. The comparison of the control and the ADHD group
yielded t(33) = 1.83, p = .076, with the trend being for the ADHD group to produce
fewer correct responses. None of the other pairwise comparisons among the groups was
significant for any of the Stroop task conditions. The overall pattern of results,
therefore, shows evidence of slowing for both ADHD and RD children on the other
Stroop conditions, including the word and colour conditions, not just the critical colour-
word condition.
Next, a 2 (RD status: RD, No RD) x 2 (ADHD status: ADHD, No ADHD)
between groups ANOVA was conducted on Stroop interference scores. No significant
effects were found among the interference scores for the four experimental groups (see
Table 9-1 for descriptive statistics).

166
Table 9-1. Stroop interference scores for the four experimental groups.
__________________________________________________________________
Control ADHD RD ADHD+RD
__________________________________________________________________
Mean -1.39 -1.45 -2.05 -1.74
SD 3.37 3.22 4.57 3.79
________________________________________________________________________
The final set of analyses was of the accuracy data (see Figure 9-6 for descriptive
statistics). One outlier (an ADHD+RD participant) had his poorer accuracy score
adjusted to fall three SD units from the mean. A 2 (RD status) x 2 (ADHD status) x 4
(Stroop condition) ANOVA was conducted on the accuracy percentages. As Mauchly‟s
assumption was compromised, Greenhouse-Geisser corrections are reported. There was
a main effect for RD status, F(1, 55) = 12.68, p <.001, ŋ2 = 0.19, but no significant
effects involving ADHD status. A significant main effect was found for Stroop
condition, F(2.107, 115.884) = 70.97, p < .001, ŋ2 = 0.56, and a two-way interaction
0
10
20
30
40
50
60
70
80
90
100
Word Colour Colour-Word Negative
Priming
Stroop Conditions
Per
cen
tage
Acc
ura
cy
-
RD
ADHD
ADHD+RD
Control
Figure 9-6. Percentage accuracy, showing mean and standard error, achieved by the four
groups.

167
between Stroop condition and RD status was also significant, F(2.107, 115.884) = 6.55,
p = .002, ŋ2 = 0.11. To break down the main effect of Stroop condition, pairwise
comparisons of conditions were made. Significant differences were found for the word
and colour comparison, t(58) = 7.17, p < .001, and the colour and colour-word
comparison, t(58) = 7.86, p < .001, consistent with increased difficulty in moving from
the word to the colour condition and then to the colour-word condition. The accuracy
data again, though, failed to reveal any significant step in difficulty between the colour-
word and negative priming conditions.
In order to test the simple effect of RD status for each Stroop condition,
independent-samples t tests were conducted for each condition to compare the control
and ADHD groups combined with the RD and ADHD+RD groups combined.
Significant effects were found for the colour-word condition, t(57) = 2.94, p = .005, and
the negative priming condition, t(57) = 3.66, p <.001. The two RD groups had lower
accuracy scores on these two conditions than the control and ADHD groups (see Figure
9-6). Thus, the two interference conditions proved the most taxing for the two RD
groups, as evidenced by the substantial number of errors produced across these two
subtests.
Further analyses of the Stroop task data for the ADHD-PI and ADHD-CT
subgroups did not reveal any significant differences between these subgroups.
9.3 Discussion
Several points are worth noting. The results of the current study confirm the meta-
analytic findings of van Mourik et al. (2005), suggesting that equivalent levels of Stroop
interference between ADHD children and their neurotypical peers are achieved when
word and colour naming speed are taken into account. It seems clear that any deficits in
the performance of ADHD children relative to the control group children were
attributable to slowed naming rather than disinhibition, given ADHD children were
impaired across all three standard Stroop conditions.
The finding of no significant differences across the four experimental groups when
comparing the calculated interference scores further confirms the conclusion that
naming speed was the dominant factor affecting these results. ADHD children were

168
impaired (relative to their neurotypical peers) on the word and colour conditions as well
as the colour-word condition. Moreover, in accordance with the central outcomes in the
literature, RD children did not prove less susceptible than ADHD and control group
children on the colour-word condition. Instead, they demonstrated clear deficiencies on
this condition, in addition to a lower number of items achieved on the word and colour
conditions, suggesting slowed naming (or some other factor, such as slowed overall
cognitive processing speed) may be responsible for their lower overall performances
across each of the Stroop conditions.
In terms of the investigation of negative priming, the current study failed to find a
significant drop in performance for this condition compared to the colour-word
condition. However, because the negative priming condition was presented last, it is
possible that any cost associated with negative priming was balanced by a general task
practice effect. ) The negative priming condition was introduced as an additional test of
inhibition, providing a more automatic (involuntary) form of inhibition than the
executive form of inhibition said to be drawn upon when performing the colour-word
portion of the Stroop. However, given the results, the negative priming condition may
not reflect any additional processes than those operating in the colour-word condition.
The two RD groups (RD, ADHD+RD) showed a more marked decrement in
performance to the control group performance than the single disorder ADHD group on
the negative priming condition; the RD groups were also less accurate than the No RD
groups on this condition. Instead, the current study found a trend towards significance
for a more enhanced negative priming effect for the ADHD group relative to control
group performance (p = .076); that is, the trend was towards ADHD children producing
a lower number of items than control children on the negative priming subtest.
In conclusion, the current study failed to demonstrate that an inhibition deficit was
central to the performance of any of the three clinical groups. Instead, a naming speed
deficit proved a more likely candidate to explain the slow performance across each of
the Stroop subtests for each of the three clinical groups relative to those obtained by the
control group. It was difficult, however, to discern whether a naming speed deficit, or a
more central processing speed deficit, might more parsimoniously account for the
observed results. RN will be investigated as a separate domain in Chapter 10, and

169
processing speed in Chapter 11. The following chapter, however, examines a way of
disentangling the Stroop results obtained thus far to determine whether a more general
slowing factor may impact on the result of speeded naming tasks for the special
populations of interest.

170
Chapter 10: An Empirical Study of Continuous and
Discrete Rapid Naming in ADHD and RD
Rapid naming is one of the prototypical tasks used to assess dyslexia, but its application
has broadened over the past decade with its increasing usage as an index of
neuropsychological functioning in children, adolescents, and adults exhibiting the
symptomatology of ADHD. Rarely, though, have fully-crossed designs using these two
populations and both graphological and nongraphological RN stimuli been employed.
Moreover, there are no extant studies investigating together serial and discrete versions
of RN tasks in the RD and ADHD populations; indeed, the performance of ADHD
children on discrete RN tasks has not been examined.
The RN task is (standardly) a continuous, serial naming task (see Chapter 4.4.1).
The conventional task uses an array of 50 stimuli comprising five different items
selected from a single semantic category (usually letters, numbers, colours, or objects),
repeated 10 times in recurrent, pseudorandom order as a matrix of five rows and 10
columns. Performance is typically scored as the latency to complete the naming of items
in a left-to-right, top-to-bottom sequence. The time it takes for spontaneous self-
correction or recovery from error is counted in the total time.
Because the literature review established that letters and numbers are typically
named at equivalent rates17
, a decision was made to use only three RN conditions:
letters, colours, and objects.
17 Numbers and letters are named at approximately the same rate (Denckla & Rudel, 1976a; Wolf
et al., 1986; Badian, Duffy, Als, & McAnulty, 1991; Korhonen, 1995) at all age levels. Moreover, RNC-
letters and RNC-numbers continue to correlate significantly at least until age 18 years (Bowers, 1993;
Wolf et al., 1994; Wolf et al., 2000). Because of their graphological nature, numbers and letters are
assumed to reflect more of a combination of naming speed and fluency acquired via print exposure.
Further, because the symbols relevant to reading are letters, the more proximal association with reading
may be letter fluency (Bowers, Sunseth, & Golden, 1999). It is reasonable to assume that the processes
underlying successful performance on the rapid naming of letters most closely resembles the laying down
of Perfetti‟s (1986) alphabetic code, the paired associate learning of letters and sounds referred to earlier.

171
10.1 Method
10.1.1 Experimental Design and Hypotheses
The three RNC and three RND conditions were administered as repeated measures, with
the order of presentation counterbalanced across participants. Thus a 2(RD status: RD,
No RD) x 2(ADHD status: ADHD, No ADHD) x 3(RN condition: RN-letter, RN-
colour, RN-object) design was used. The hypotheses developed in Chapter 5 in relation
to RN were:
i) Both ADHD and RD children will evidence significant slowing of
performance relative to that of their typically developing peers on all
RNC conditions;
ii) Graphological stimuli will be named faster overall than nongraphological
stimuli (Cronin & Carver, 1998; Denckla & Rudel, 1974; Denckla &
Rudel, 1976a; Meyer et al., 1998; Misra et al., 2004; Wolf et al., 1986);
iii) RD children will show greater performance deficits for the RNC
condition employing graphological stimuli (i.e., RNC-letter) than on the
conditions employing nongraphological stimuli (i.e., RNC-colour and
RNC-object);
iv) ADHD children, by contrast, are expected to show consistent deficits in
RNC performance across all stimulus categories;
v) ADHD+RD children are expected to demonstrate the same pattern of
deficits as RD children (rather than those demonstrated by the ADHD
group of children).
For the RND task, based on the existing literature, it is hypothesised that:
i) RD children will show performance deficits relative to those of their
typically developing peers on all RND conditions.
For these reasons, it was decided to include only the letter condition in the child study, and to exclude the
number condition.

172
ii) As no data exists in the literature to determine outcomes for the ADHD
population on the RND tasks, it is difficult to speculate how this
population might perform relative to their normally developing peers.
However, given that some researchers propose that RNC tasks are more
likely to tap executive processes, ADHD children may be more likely to
be disadvantaged by RNC than RND conditions.
10.1.2 Participants
Participants were as described in Section 5.2; that is, 16 ADHD participants, 10 RD
participants, 14 ADHD+RD participants, and 20 control group children.
10.1.3 RNC Task
The apparatus was as listed for the Stroop task (see Section 9.1.1). The stimuli used in
the three conditions (i.e., letter, colour, and object) for both the RNC and RND tasks
duplicated those used in the RN tasks originally devised by Denckla and Rudel (1974).
All RNC conditions used a 5(column) x 4(row) matrix of items. A decision was
made to reduce the number of stimuli per trial from 50 items (as occurs in the original
task) to 20 items to curtail the possible influence of lapses in sustained attention.
However, to compensate for this reduction and to ensure a stable measure of latency
was obtained, four experimental trials were prepared for each condition. Care was taken
to ensure the stimuli for the three semantic domains (letter, colour, object) occupied
approximately the same visual area and spatial configuration. Matrix specifications
were for a 1.6 cm distance between row stimuli and a 2.1 cm distance between column
stimuli. Each stimulus filled an approximate 3 cm x 3 cm space. The matrices were
constructed such that the row configuration dominated visually. Additionally, there was
no juxtapositioning of the same stimulus in neighbouring matrix positions, either along
rows or down columns, and no end-of-row stimulus was duplicated at the beginning of
the successive row. Two sets of stimulus orders were developed for each condition, and
these were assigned to the RNC and RND tasks in a counterbalanced manner. The order
of the administration of the three RN conditions was counterbalanced across
participants for each task.

173
The letter condition used the stimuli s, d, a, o, and p in 48-point lowercase Times
font. The stimuli for the colour condition used red, green, blue, and yellow as described
for the Stroop task (Chapter 9.1.2), plus the achromatic colour, black. The black colour
was again matched to a focal category exemplar from Berlin and Kay‟s (1969) study,
coded as black (N1/) in the Munsell colour scaling system (Munsell, 1929), and
converted via graphics editing in the same manner as the four primary colours of the
Stroop task. The resulting colour matrices were presented embedded on screen in a light
grey Munsell V5 surround specifically created to reduce the effects of colour contrast.
The object condition used black-on-white simple line drawings selected from Snodgrass
and Vanderwart‟s (1980) standardized set of 200 pictures. Identical objects were used
by Denckla and Rudel (1974). The objects were: comb (#65 in Snodgrass &
Vanderwart, 1980), key (#128), scissors (#197), umbrella (#245), and watch (#250).
To start each condition in the RNC task, a sample 5 x 4 matrix of the appropriate
stimuli appeared on screen. This sample screen allowed the experimenter to visually
direct the participant‟s gaze across the screen with a manual gesture (i.e., by sweeping a
finger along successive rows) to indicate that the sequence progressed by row,
consistent with the corresponding verbal instructions outlining task demands. The
instructions paralleled those used by Wagner, Torgesen, and Rashotte (CTOPP, 1999).
Participants were urged to complete vocalization of the array as quickly as possible
without error. Two practice sets (each consisting of a single row of five stimuli) ensured
participants were able to accurately identify the stimuli with their standard names.
Participants were corrected where non-standard stimulus names were used during this
familiarization phase only.
A key press by the experimenter signaled the commencement of each trial.
Participants were advised that the computer would warn them when the task was about
to commence by flashing up a cross (500 ms in duration) in the middle of the screen and
emitting a tone (overlapping the final 100 ms of the display of the cross). This tone
permitted later marking of voice onset delay, and additional soundwave segmentation
allowed extraction of the voiced interval data to provide the critical measure of time to
name the array.

174
The key variable investigated was the mean RT to complete the naming of the 20
stimuli across the four trials. A percentage accuracy score was also calculated. Any
extraneous verbalizations that were not the properly sequenced stimuli were coded as
errors or self-corrections. Missed items were coded as such. The mean number of errors,
self-corrections, and missed items across the four trials was calculated to create a
percent correct score for each RNC condition for each participant.
10.1.4 RND Task
The RND task mirrored the RNC task in design, except that the to-be-named stimuli
were presented individually rather than in a matrix for the RND task. As indicated in
Section 10.1.1, two sets of stimulus sequences were generated for the RNC and RND
tasks for each of the three conditions, and these were assigned in a counterbalanced way
to the two tasks.
One practice set preceded each RND condition. Each practice set comprised 10
singly-presented stimuli. Corrective feedback was given when non-standard stimulus
names were used. Succeeding trials of the practice set were initiated by the
experimenter when the participant appeared re-settled. No feedback was given during
the experimental trials. For each condition (letter, colour and object) there were two
runs of experimental trials, each comprising 40 trials. Thus, there were an equal
number of presentations for each condition across the RND and RNC tasks (i.e., 80
items).
The stimuli were presented individually and centre screen in an unpaced,
experimenter-controlled, single-trial format. The interstimulus interval comprised
random intervals between 1 and 1.5 s duration (as recommended by Bowers &
Swanson, 1991, as poor readers have been show to be differentially impaired by use of a
paced continuous format). As in RN-Continuous trials, each trial was preceded by a
short visual fixation point (crosshairs), accompanied by an overlapping warning tone (a
1-kHz beep), cuing the presentation of the central stimulus. Further instructions
emphasised both speed and accuracy, adapted from those used in the RN-Continuous
task. Once the participant had responded, a key press initiated by the experimenter
prompted another beep to be emitted. This beep served as a tonal demarcation stressing

175
the end-of-articulation point for the response item; it also cued the re-appearance of the
fixation point, thus signalling commencement of the next stimulus presentation. In cases
where the experimenter delayed (e.g., anticipating a self-correction from the
participant), later manual demarcation via one of the digital audio packages employed
was required, assisted by visual and auditory inspection of the spectrograph. Thus, voice
onset latency data (from tone onset to initial phoneme vocalization), as well as total
vocalization time (from onset of articulation to end of articulation) was available.
The critical measure was the time taken to name the stimulus (i.e., the interval
from onset of the stimulus to completion of the child‟s articulation of the word). Scores
were determined by computing the mean latency to voice the 40 items in each set and
these means were subsequently collapsed across the two sets per condition (only
correctly trials were used). The RND audio files were processed using the Olympus
Digital Wave Player and Audacity 1.2.0 as described for the Stroop task (see Chapter
9). A percentage accuracy score was also calculated.
10.2 Results
10.2.1 RNC Task
Only partial data were available for two participants (one control and one ADHD
participant), so these participants were excluded from analyses. Three extreme latencies
were trimmed to be three SDs from the mean (RNC-letter had one RD outlier, and
RNC-colour and RNC-object had one ADHD outlier each). Latency and error data for
each RND subtest were collapsed across the two trials by taking means.
A 2 (RD status: RD, No RD) x 2 (ADHD status: ADHD, No ADHD) x 3 (RNC
condition: RNC-letter, RNC-colour, RNC-object) ANOVA with repeated measures on
the last factor was used to analyse the mean latency data.18
The sphericity assumption
was compromised, so the Greenhouse-Geisser correction was adopted. See Figure 10-1
for descriptive statistics for the four groups in the three conditions.

176
All between-subject effects were significant; that is, for RD status, F(1, 54) = 5.55,
p = .022, ŋ = .09, for ADHD status, F(1, 54) = 4.96, p = .030, ŋ = .08, and for the RD
status x ADHD status interaction, F(1, 54) = 8.28, p = .006, ŋ = .13. There was
additionally a main effect of RNC condition, F(1.63, 88.23) = 257.52, p < .001, ŋ = .83,
and the two-way RNC condition x ADHD status interaction reached significance,
F(1.63, 88.23) = 7.84, p < .001, ŋ = .13.
A univariate ANOVA was undertaken for each condition to disentangle the
differences suggested by these interactions. Significant effects of RD status, F(1, 54) =
10.99, p = .002, ŋ = .17, and the interaction between RD status and ADHD status, F(1,
54) = 6.97, p= .011, ŋ = .11, were found for the RNC-letter condition. Independent-
samples t tests revealed consistently superior results for the control group over those
achieved by the three clinical groups, t(18) = 2.32, p = .032, t(11) = 4.27, p < .001, t(18)
= 3.07, p = .007, for the ADHD, RD, and ADHD+RD groups, respectively, with no
significant differences for these latter groups (see Figure 10-1). (Levene‟s test indicated
unequal variances, so degrees of freedom were adjusted for these tests.)
0
5
10
15
20
25
30
Letter Colour Object
RN Conditions
Mean
Reacti
on
Tim
es (
Seco
nd
s)
.
RD
ADHD
ADHD+RD
Control
Figure 10-1. Reaction time, showing mean and standard error, achieved by the four
experimental groups on the three RNC conditions.
18 Because reaction time distributions are skewed, median latencies were also calculated to avoid the
possibility that outliers might unduly influence the mean. Outcomes were the same whether the mean or
median data were used in both RNC and RND analyses.

177
A univariate ANOVA conducted on the RNC-colour latencies results yielded a
main effect for ADHD status, F(1, 54) = 5.07, p = .028, ŋ = .09, and a two-way
interaction between RD status and ADHD status, F(1, 54) = 67.91, p = .007, ŋ = .13.
Independent-samples t tests reinforced the emerging pattern of control group
superiority, with t(19) = 3.78, p < .001, t(27) = 4.85, p < .001, and t(31) = 3.10, p =
.004, for the comparisons with the ADHD, RD, and ADHD+RD groups, respectively,
with no significant differences among the latter three groups. (Levene‟s test was
significant in the control and ADHD group comparison, so the degrees of freedom were
adjusted.)
Lastly, on RNC-object naming, the univariate ANOVA confirmed significant main
effects for RD status, F(1, 54) = 4.15, p = .047, ŋ = .07, and ADHD status, F(1, 54) =
7.47, p = .008, ŋ = .12, as well as an interaction effect between these factors, F(1, 54) =
5.98, p = .018, ŋ = .10. The three disorder groups were indistinguishable in their poor
performance on the RNC-object condition, with t tests providing t(17) = 3.70, p = .002,
t(27) = 5.59, p < .001, t(16) = 3.80, p= .002, for comparisons of the control group with
the ADHD, RD, and ADHD+RD groups, respectively. (Levene‟s test showed unequal
variances existed for both the ADHD and ADHD+RD comparisons, so the degrees of
freedom were adjusted.)
Finally, the percent correct accuracy data were submitted to an ANOVA of the
same design as used for the other measures, after the trimming of one control
participant‟s score to fall 3 SD units from the group mean. Since Mauchly‟s assumption
was contravened, Greenhouse-Geisser corrections were applied. The only significant
effect was the main effect of RNC condition, F(1.76, 95.12) = 36.70, p < .001, ŋ = .40,
reflecting the progressive decrease in accuracy across the respective RNC-letter, RNC-
colour, and RNC-object conditions (see Table 10-1).
Further analyses of the RNC RT and accuracy data for the ADHD-PI and ADHD-
CT subgroups did not reveal any significant differences between these subgroups.

178
Table 10-1. Means (and standard errors) for the RNC conditions across the groups.
________________________________________________________________________
RNC-letter RNC-colour RNC-object
________________________________________________________________________
ADHD 97.03 93.50 92.75
(0.90) (1.08) (1.39)
RD 97.25 90.38 90.75
(0.69) (1.95) (2.23)
ADHD+RD 96.84 92.86 90.27
(0.72) (0.87) (1.54)
Control 97.00 94.28 91.91
(0.77) (0.90) (1.23)
________________________________________________________________________
10.2.2 RND Task
Latency (for correct responses only) for each RND condition were collapsed across the
two trials by taking means. Data were missing on some of the RND conditions for two
participants (one control, one ADHD) and these individuals were subsequently deleted
from further analyses. Four extreme latency values were truncated to be 3 SD units from
their respective means. These included long latencies from two ADHD participants
(RND-colour and RND-object) and one RD participant (RND-letter) and one overly
fast latency for the RND-object condition from an ADHD participant. Descriptive
statistics for the latency data are provided in Figure 10-2. Descriptive statistics for the
latency data are provided in Figure 10-2.
A 2 (RD status: RD, No RD) x 2 (ADHD status: ADHD, No ADHD) x 3 (RND
condition: letter, colour, object) ANOVA was used to analyse the latency data with
Greenhouse-Geisser adjustments made to the degrees of freedom because sphericity did
not hold. All between-subjects effects were significant with the main effects for RD
status and ADHD status, F(1, 54) = 4.63, p = .036, ŋ = .08, and F(1, 54) = 11.93, p <
.001, ŋ = .18, respectively, superseded by the interaction between these two factors,
F(1, 54) = 18.95, p < .001, ŋ = .26. There was a main effect of RND condition, F(1.73,
93.32) = 152.92, p < .001, ŋ = .74; however, the three-way interaction between RND

179
condition, RD status, and ADHD status took precedence over these effects, F(1.73,
93.32) = 5.35, p = .006, ŋ = .09.
Investigating the three-way interaction using univariate ANOVAs, the RND-letter
condition yielded a main effect for ADHD status, F(1, 54) = 13.85, p < .001, ŋ = .20,
and a two-way interaction between RD status and ADHD status, F(1, 54) = 13.50, p <
.001, ŋ = .20. Independent-samples t tests confirmed the faster control group output-rate
over each of the three clinical groups, with t(32) = 5.86, p < .001, t(27) = 5.51, p < .001,
and t(19) = 3.87, p < .001, for the comparisons with the ADHD, RD, and ADHD+RD
groups respectively. No significant differences showed up between the three clinical
groups. (As Levene‟s statistic was significant for the control versus ADHD+RD
comparison, the degrees of freedom were adjusted.)
0
0.2
0.4
0.6
0.8
1
1.2
1.4
1.6
1.8
Letter Colour Object
RN Conditions
Mean
Reacti
on
Tim
es (
Seco
nd
s)
.
RD
ADHD
ADHD+RD
Control
Figure 10-2. Reaction time, showing mean and standard error, achieved by the four
experimental groups on the three RND conditions.
An examination of the RND-Colour condition yielded similar results: again, there
was a main effect for ADHD status, F(1, 54) = 5.37, p = .024, ŋ = .09, and an
interaction between RD status and ADHD status, F(1, 54) = 11.98, p < .001, ŋ = .18;
the RD effect narrowly failed to reach significance, F(1, 54) = 3.22, p = .078, ŋ = .06.
Once more, t tests revealed the superior speed for the control group relative to the
clinical groups, with t(32) = 4.40, p < .001, t(27) = 4.34, p < .001, and t(31) = 3.24, p =
.003, for the comparisons for the ADHD, RD, and ADHD+RD groups, respectively,

180
these latter groups failing to prove significantly different in output rates (see Figure 10-
2).
Finally, assessment of the RND-Object condition showed that the step up in task
complexity proved difficult for both disorders, all effects proving significant: that is, for
RD status, F(1, 54) = 4.73, p = .034, ŋ = .08, for ADHD status, F(1, 54) = 10.19, p =
.002, ŋ = .16, and for the interaction, F(1, 54) = 17.33, p < .001, ŋ = .24. Again,
significantly faster rates were achieved by the control group over the ADHD, RD and
ADHD+RD groups with, respectively, t(18) = 5.28, p < .001, t(27) = 6.45, p < .001, and
t(31) = 4.83, p < .001. Differences between clinical group means were not significant.
(Levene‟s assumption was violated when comparing the ADHD and control groups
requiring adjustment of the degrees of freedom.)
A review of the accuracy data followed. This involved the trimming of one ADHD
participant‟s outcome data for RND-letter accuracy, and one ADHD+RD participant‟s
outcome data for RND-object accuracy. For the 2 (RD status) x 2 (ADHD status) x 3
(RND condition) ANOVA, Mauchly‟s assumption was contravened; hence,
Greenhouse-Geisser corrections were applied. However, little differences occurring
between the various groups were demonstrated, the only significant effect being that of
the RNC condition factor, F(1.61, 86.88) = 70.53, p < .001, ŋ = .57, reflecting the
progressive decrease in accuracy across the respective RND-letter, RND-colour, and
RND-object conditions (see Table 10-2).
Table 10-2. Means (and standard errors) for the RND conditions across the groups
________________________________________________________________________
RND-letter RND-colour RND-object
________________________________________________________________________
ADHD 98.54 94.92 90.92
(0.47) (0.99) (1.43)
RD 99.00 94.62 91.25
(0.36) (1.13) (1.80)
ADHD+RD 98.93 94.82 90.97
(0.34) (0.55) (1.49)
Control 98.75 96.12 95.20
(0.23) (0.53) (0.80)
________________________________________________________________________

181
Further analyses of the RND RT and accuracy data for the ADHD-PI and ADHD-
CT subgroups did not reveal any significant differences between these subgroups.
10.3 Discussion
The first hypothesis regarding RNC performance across the two special populations of
interest proposed that both ADHD and RD children would show significant slowing in
performance relative to control group performance on these tasks. Consistent with this
hypothesis, the results showed that the control group produced consistently superior
results to those of each of the three clinical groups when latencies were analysed, with
no significant disparities emerging across the clinical groups. All groups performed with
equivalent rates of accuracy, so higher error rates for one group over another do not
appear to be impacting on these results.
The second hypothesis suggested that the RNC-letter condition (comprising
graphological stimuli) would be named faster overall than the RNC-colour and RNC-
object conditions (comprising nongraphological stimuli). Outcomes of the latency
analyses also confirmed this hypothesis. There was a main effect of condition in the
RNC analysis, and also in the RND analysis, reflecting the fact that all groups were
faster to name letters than colours, and faster to name colours than objects. Thus,
graphological items do appear to be named more automatically than nongraphological
stimuli, regardless of the group allocation of participants.
The third hypothesis stated that RD children would show greater performance
deficits for the RNC condition employing graphological stimuli (i.e., RNC-letter) than
on the conditions employing nongraphological stimuli (i.e., RNC-colour and RNC-
object). Although the three clinical groups were statistically indistinguishable in terms
of their poorer performances across the conditions, Figure 12-1 shows that the two RD
groups performed slightly (if not significantly) worse than both ADHD and control
children on the RNC-letter condition, as might be expected, with the RD group
manifesting the longest latencies among these groups. In contrast, the nonsignificant
trend was for the ADHD group to provide the longest latencies on the colour and object
conditions (Figure 10-1).

182
The fourth hypothesis stated that ADHD children were expected to show
consistent deficits in RNC performance across all stimulus categories. This conjecture is
borne out by the statistically poorer performance of the ADHD group comparative to
that of the control group of children across all stimulus conditions. The fifth hypothesis
for the RNC task stated that ADHD+RD children were expected to demonstrate the
same pattern of deficits as RD children (rather than those demonstrated by the ADHD
group of children). This hypothesis was supported to the extent that the RD and
ADHD+RD groups underperformed the control group for all RNC conditions, and did
not differ significantly from each other. However, the ADHD group showed the same
consistent pattern of deficits as the other two clinical groups.
On the RND task, it was hypothesised, firstly, that RD children would show
performance deficits relative to those of their typically developing peers on all RND
conditions. RD children did indeed perform consistently poorer than control group
children on all three RND conditions. Interestingly, though, ADHD children recorded
the longest mean latencies across each of these conditions, although their results were
indistinguishable from those of the RD and ADHD+RD groups. Recall that it had been
anticipated in the hypotheses that ADHD children would be less disadvantaged on the
RND task than the RNC task given the latter‟s speculated involvement of some
executive functioning.
In conclusion, RD, ADHD, and ADHD+RD children showed comparable
performance deficits relative to control group children across both versions of the RN
task, and across all task conditions. There is little evidence to support the notion the two
single disorders contributing additive effects to the comorbid group in these findings.

183
Chapter 11: An Empirical Study of Speed-of-
Processing in ADHD and RD
Kleinman et al. (2005) defined SOP as a concept that refers to “how quickly and
efficiently an individual gathers, manipulates, stores, retrieves, and classifies
information” (see Chapter 4.5). It emerged from the literature review that the systematic
investigation of SOP in ADHD and RD research has been hampered by the lack of clear
definitions, the use of diverse tasks with possible confounds muddying interpretation,
and the lack of separation between stimuli with both a linguistic and nonlinguistic
foundation (i.e., those tasks employing lexical and nonlexical stimuli). The research of
Willcutt, Pennington, et al. (2005) and Shanahan et al. (2006) concluded that SOP was a
shared cognitive risk factor in both ADHD and RD, with Shanahan et al. (2006)
suggesting RD children were more impaired than ADHD children. The current project
continues this research at a finer-grained level to examine whether RD and ADHD
samples exhibit a contrasting profile of deficits on visual search tasks, or whether these
deficits are in fact shared by the two disorders; it also seeks to determine if a differential
profile of deficits is revealed when visual search tasks using contrasting lexical and
nonlexical stimuli are employed.
Visual search tasks “require the rapid scanning of spatial locations in a systematic
manner to locate a target among a field of one or more „nontarget‟ items” (Mullane &
Klein, 2008, p. 44). Because visual search tasks with a linguistic foundation may further
disadvantage the RD child, it is important to devise differing versions of the SOP task,
tapping both verbal and spatial domains, along the lines suggested by Chuah and
Maybery (1999). In their developmental paper on verbal and spatial STM, Chuah and
Maybery (1999) constructed spatial and verbal speed-of-search conditions that matched
the stimuli used in their verbal and spatial memory tasks. The verbal condition of the
search task used consonants, and the spatial condition used scaled-down Corsi stimuli.
The single-target versions of these conditions were adapted for the current study.
Accordingly, a verbal version used the consonants employed in the Verbal STM and
WM tasks outlined earlier in Sections 7.1.4 and 7.1.5, and a spatial version used the

184
scaled-down Corsi stimuli from the Spatial STM and WM tasks described in Sections
7.1.4 and 7.1.6. Each condition assessed the speed at which a single target stimulus
could be located within a set of four stimuli.
11.1 Method
11.1.1 Experimental Design and Hypotheses
The four groups of participants described in Section 5.2 (ADHD, RD, ADHD+RD, &
control) completed the verbal and spatial SOP conditions, with the order of the two
conditions counterbalanced across participants.
It is hypothesised that RD children will perform less well relative to control
children on those visual search tasks with a linguistic basis. In contrast, ADHD children
are hypothesised to demonstrate poorer performance relative to the control children on
those visual search tasks that do not have a linguistic foundation.
11.1.2 Participants
Participants were as described in Section 5.2; that is, 16 ADHD participants, 10 RD
participants, 14 ADHD+RD participants, and 20 control group children.
11.1.3 Equipment
Stimuli were programmed in MetaCard Version 2.4.1, and presented on the equipment
outlined in Section 7.1.3.
11.1.4 Verbal Search Condition
On each trial a target letter was presented at the top of the screen and four choice letters
were presented below. One of these was a duplicate of the target, and the child‟s task
was simply to press the duplicate letter as soon as possible. As in the Verbal STM and
WM tasks (see Sections 8.1.3.1 & 8.1.3.3), all vowels, the consonant „y‟, and the
trisyllabic consonant „w‟ were excluded from the stimulus set. Hence the stimulus set
comprised 19 consonants in total. The use of any combination of letters susceptible to
phonemic confusion (e.g., B, D, T) within the same trial was avoided. There were 18
test trials preceded by two practice trials. The target and four distracters for each test
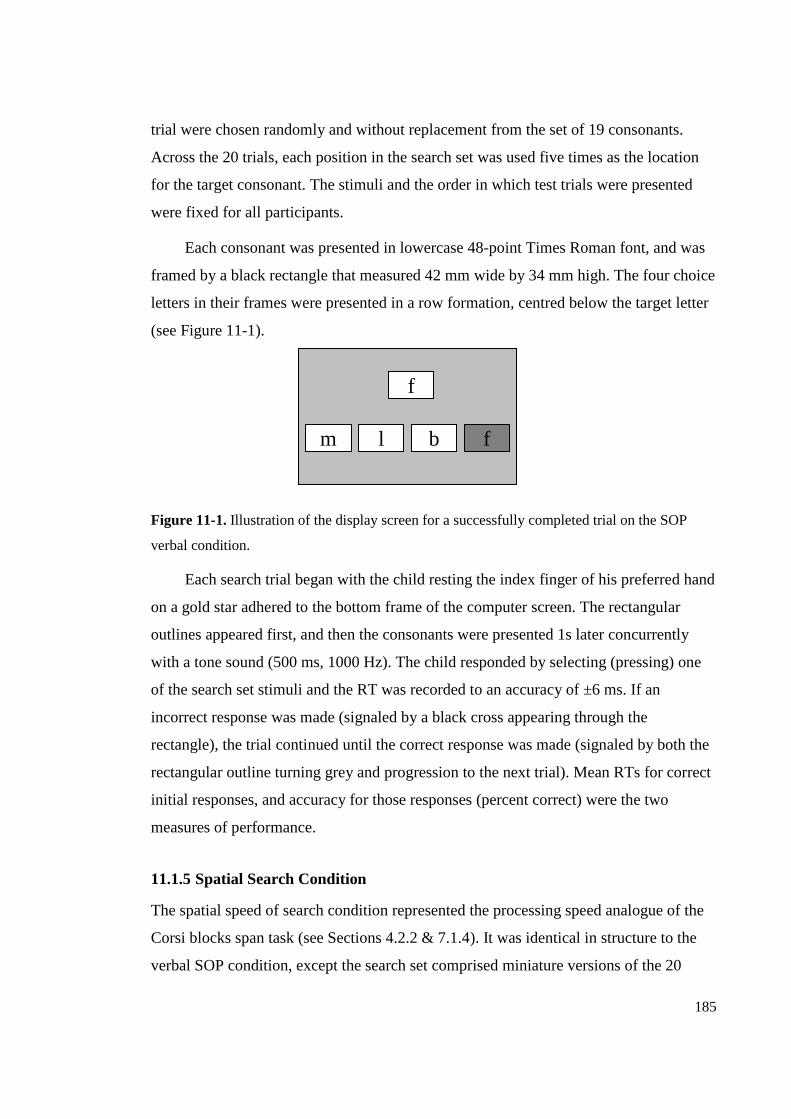
185
trial were chosen randomly and without replacement from the set of 19 consonants.
Across the 20 trials, each position in the search set was used five times as the location
for the target consonant. The stimuli and the order in which test trials were presented
were fixed for all participants.
Each consonant was presented in lowercase 48-point Times Roman font, and was
framed by a black rectangle that measured 42 mm wide by 34 mm high. The four choice
letters in their frames were presented in a row formation, centred below the target letter
(see Figure 11-1).
f
m l b f
Figure 11-1. Illustration of the display screen for a successfully completed trial on the SOP
verbal condition.
Each search trial began with the child resting the index finger of his preferred hand
on a gold star adhered to the bottom frame of the computer screen. The rectangular
outlines appeared first, and then the consonants were presented 1s later concurrently
with a tone sound (500 ms, 1000 Hz). The child responded by selecting (pressing) one
of the search set stimuli and the RT was recorded to an accuracy of ±6 ms. If an
incorrect response was made (signaled by a black cross appearing through the
rectangle), the trial continued until the correct response was made (signaled by both the
rectangular outline turning grey and progression to the next trial). Mean RTs for correct
initial responses, and accuracy for those responses (percent correct) were the two
measures of performance.
11.1.5 Spatial Search Condition
The spatial speed of search condition represented the processing speed analogue of the
Corsi blocks span task (see Sections 4.2.2 & 7.1.4). It was identical in structure to the
verbal SOP condition, except the search set comprised miniature versions of the 20

186
fixed squares presented in haphazard arrangement in the Corsi blocks memory tasks
(i.e., the 20 positions that the illuminated squares occupied in their rectangles are the
scaled-down positions of the 20 squares for the other spatial tasks).
Figure 11-2. Illustration showing the display screen for an unsuccessful first attempt on a trial
of the SOP spatial condition.
Each stimulus comprised a black 4 x 4-mm square outline positioned within an
otherwise empty 42-mm by 34-mm rectangular outline (see Figure 11-2). The
participant‟s task was to encode the position of the opaque square in the rectangular
outline of the target and then scan the four search stimuli to find the one that had an
opaque square in the same location. Trials proceeded in all other respects as per the
verbal SOP condition.
11.1.6 Procedure
An armrest was provided and participants were instructed to rest the index finger of
their preferred hand on a gold star adhered to the bottom of the computer screen. They
were advised that the purpose of the task was to see how fast they could match the
letter/block that appeared at the top of the screen with one of the four letters/blocks that
appeared below it. The computer would warn them when the search task was about to
begin by emitting a small beep. The computer would also emit a small beep when the
target and distracter stimuli appeared on the screen. If the participants made an error,
they were to locate the correct block and press it as quickly as they could. Feedback was
given only for the two practice trials.

187
11.2 Results
Mean RTs for correct responses only were calculated for each participant in each
condition.19
Accuracy was calculated as the percentage of trials correct. Data for the
SOP conditions was missing for one ADHD participant who was subsequently removed
from the analyses. An ANOVA with two between-subjects factors (RD status: RD, No
RD) and (ADHD status: ADHD, No ADHD) and a single within-subjects factor
(condition: spatial, verbal) was used for each dependent variable. Mauchly‟s assumption
was not violated in any of the following analyses. Two outlier scores, one in each
condition for a single ADHD participant, were pruned to a score 3 SD units from the
corresponding mean.
Main effects were found for both RD status, F(1, 55) = 9.43, p = .003, ŋ = .15, and
ADHD status, F(1, 55) = 8.87, p = .004, ŋ = .14, with the two-way interaction between
these factors being not significant. There was a significant slowing of responses
associated with both RD and ADHD, with the ADHD+RD group showing a level of
slowing consistent with the additive influence of the two disorders (see Figure 11-3).
Tests of within-subject effects showed a main effect for condition, F(1, 55) =
148.08, p < .001, ŋ = .73, with RT faster for the verbal SOP condition (M = 1380.44 ms,
SE = 43.75 ms) than for the spatial SOP condition (M = 2258.93 ms, SE = 98.91 ms).
There was also a two-way interaction between condition and RD status, F(1, 55) = 4.27,
p = .044, ŋ = .07. To follow-up on this interaction, the simple effect of RD status was
tested for each of the conditions. This effect was significant for both the verbal
condition, F(1, 55) = 5.58, p = .022, ŋ2 = .09, and the spatial condition, F(1, 55) = 8.39,
p =.005, ŋ2 = .13.
Because these results did not adequately explain the interaction effect, t tests were
conducted. All three clinical groups were slower than the control group on the verbal
condition, with t(33) = 2.84, p < .008, t(28) = 2.94, p < .006, and t(32) = 4.14, p < .001,
for the ADHD, RD and ADHD+RD contrasts, respectively. On the spatial condition,
though, only the RD and ADHD+RD groups were significantly slower than the control
19 Median reaction times were also calculated, but yielded the same pattern of results as for the means,
and so are not reported here.

188
group, with t(28) = 2.06, p < .049, and t(32) = 4.02, p < .001, respectively. However, the
ADHD+RD group also performed significantly more slowly than the ADHD group on
the spatial condition, t(27) = 2.08, p < .047. As can be seen in Figure 11-3, differences
between the two RD groups and the other two groups are more pronounced for the
spatial compared to the verbal condition.
0
500
1000
1500
2000
2500
3000
3500
ADHD RD ADHD+RD CONTROL
Group
SO
P R
eact
ion
Tim
es
.
Verbal Spatial
Figure 11-3. Means (and standard errors) of reaction time data (in milliseconds) for Verbal and
Spatial SOP conditions.
For the accuracy data, there was a main effect for condition, F(1, 55) = 25.04, p <
.001, ŋ = .31, all groups performing more accurately on the verbal (M = 97.66, SE =
0.55) than the spatial (M = 91.66, SE = 1.25) condition. However, no other effects
were significant in this analysis.
Further analyses of the RT and accuracy data for the ADHD-PI and ADHD-CT
subgroups did not reveal any significant differences between these subgroups.
11.3 Discussion
Overall, longer and less accurate RTs were recorded on the spatial condition than on the
verbal condition (see Figures 11-3 & 11-4). This would seem to indicate that the spatial
condition proved to be more effortful for all groups.

189
80
85
90
95
100
105
ADHD RD ADHD+RD CONTROL
Group
SO
P A
ccu
racy
(%
)
. Verbal Spatial
Figure 11-4. Means (and standard errors) of accuracy data (in percentages) for verbal and
spatial SOP conditions.
Longer serial search times on the spatial condition may reflect the greater
complexity (in terms of the number of features to be searched) of the target and
distracter items on this task. However, RT and accuracy for the verbal and spatial
conditions did not differentiate the two disorders in the hypothesised fashion. Whilst all
three clinical groups were indistinguishable in performance on the verbal SOP
condition, it was the RD and ADHD+RD groups, and not the ADHD group, that were
significantly disadvantaged on the SOP spatial condition relative to the control group.
These results are not consistent with the hypotheses that were tentatively advanced. It
was proposed that different profiles may have emerged showing longer latencies for RD
children on those tasks employing lexical stimuli, and longer latencies for ADHD
children on those tasks employing nonlexical stimuli. Nevertheless, the pattern of
performance on the verbal SOP condition, showing deficits in performance to that of
control group children for all three special populations fits with many of the findings
that have emerged throughout this research.
Recall in Chapter 9 that the outcomes for the empirical investigation of Stroop
performance in ADHD and RD raised the question of whether disinhibition was central
to the performance of ADHD (and, indeed, RD) children. Rather, it was proposed that
slowed naming or slowed speed of processing might prove more central to an

190
explanation of the poorer performance of ADHD and RD children compared to that of
their neurotypical peers. Subsequent Brinley plot analyses (see Chapter 12) support the
claim for proportional slowing in the ADHD population relative to their typically
developing peers, with an inflation of 27% in ADHD latencies across the three
conditions of the Stroop. RD children show proportional slowing relative to
neurotypical control children, with again a 27% inflation for latencies across the three
Stroop conditions. Finally, the plotting of ADHD+RD data in Brinley space reveal a
slowing of 30% relative to neurotypical controls, though the data produced are from a
limited set of studies for the comorbid grouping. It would seem that the SOP outcomes,
in indicating poorer performance for all three special populations on tasks with a lexical
foundation, supports these findings, too. Similarly, on both the RNC and RND tasks
outlined in Chapter 10, control group performance was superior to RD, ADHD, and
ADHD+RD performance across all three conditions (letter, colour, and object). Thus, a
general SOP deficit may be characteristic of the three special populations.

191
Chapter 12: Stroop Brinley Plot Analyses
Developmental changes in speed of information processing across the lifespan have
been the subject of much research (Cerella & Hale, 1994; Hale, 1990; Hale, Fry, &
Jessie, 1993). RTs and inspection times (the two major methods for measuring speed of
processing) decrease with age (Nettlebeck & Wilson, 1985; Hale, 1990; Kail, 1986) and
developmental changes in cognitive ability may be bootstrapped to developmental
changes in speed of processing. In early childhood, there is a spike in verbal fluency and
response speed between 3 and 5 years of age (Anderson, 2002). Miller and Vernon
(1997) showed substantial gains in processing speed between ages 4 and 6 years.
Brewer and Smith (1989) observed a notable increase in processing speed between ages
5 and 9 years. Fry and Hale (1996) found that speed of information processing increased
from 7 to 9 years, creating a cascade effect with improvements in memory performance
and, in turn, intelligence, also reported. Kail (1986) showed that processing speed and
fluency continue to increase during middle childhood (Anderson, Anderson, Northam,
& Taylor, 2000; Hale, 1990; Welsh et al., 1991), with acceleration noted between the
ages of 9-10 years and 11-12 years (Kail, 1986). Individuals within the 9-12 age range
showed verbal fluency at near adult levels (Kail, 1986). Small increases in speed of
processing continue into adolescence (Anderson, Anderson, Northam, Jacobs, &
Catroppa, 2001; Kail, 1986), with minimal increments observed after 15 years, at which
age speed of processing appears fully mature (Hale, 1990; Kail, 1986). Adolescents
generally process information as quickly as young adults (Kail, 2004). Processing speed
shows a non-linear relationship to age across the lifespan, and is often reported to be
slower in the elderly, which may have flow-on effects for performance decrements on a
number of other cognitive measures for older adults (Salthouse & Kail, 1983).
Kail (1991) conducted a Brinley plot analysis to map the processing speed of
children systematically to that of adults to determine the rate of developmental change.
A Brinley plot is a graphing technique which plots the mean response time for one
category of respondent (e.g., children) against the mean response time of another
category of respondent (e.g., adults) to determine whether the effect of another variable
(such as the complexity of a task) has a differential effect on one of the groups of

192
respondents (Spirduso, Francis, & MacRae, 2005). If the relationship between
children‟s RTs (on the Y axis) and adults‟ RTs (on the X axis) for a set of tasks or
conditions is linear, and the slope of the function is greater than one, one interpretation
of this pattern of results is that the response times for the children are slowed relative to
those of the adults by a single common factor, with the slope of the linear functioning
indicating the degree of slowing. Kail‟s Brinley plot meta-analysis covered 72 studies,
and 1,826 pairs of youth and adult mean RTs. The youths were aged from 3-14 years of
age. The slopes of the linear functions for the performances of younger age groups
plotted against adult performance reduced substantially from early to middle childhood,
and reductions in slope were reduced after these ages.
Kail (1986, Experiment 3) had earlier tested 8-year-old children and adults on a
mental rotation task. There were 24 conditions in which participants determined
whether pairs of letters presented in different orientations were identical or mirror
images of one another. The correlation between the RTs of children and adults was .93,
with a slope, or slowing coefficient, of the linear function, of 1.66. Hale (1990)
examined the relationship between the RTs of children and adolescents, aged 10, 12, 15
years old, and young adults, on four speeded tasks. The correlation between the three
child and adolescent age groups and the young adult RTs was .99 at each of the age
levels. The slowing factor was 1.82, 1.56, and 1.00 for the 10, 12, 15 years olds,
respectively, indicating a gradual approximation to the processing speed of young
adults. Thus, in summary, Hale (1990) and Kail (1986, 1991) found that linear
relationships between children‟s and adults‟ response times, with the slowing
coefficient behaving in a negative decelerating curvilinear fashion, suggesting speed of
processing increases globally as participants age.
Brinley (1965) used this same plotting technique to find support for the hypothesis
that speed of processing was slowed in older adults by predicting mean response times
for older adults from the mean response times for younger adults across a variety of
conditions and cognitive tasks. His analysis showed that the relationship between older
and younger adult performance was linear. This form of relationship can temper the
interpretation of pronounced differences between the scores of older and younger
people on complex tasks. Rather than indicate that older adults are especially

193
disadvantaged on such tasks, the pronounced differences may be in proportion to more
moderate differences observed on simpler task variants, and so may reflect a consistent
pattern of slowing in the older adults across conditions of varying complexity.
Some researchers investigating aging have argued for a general slowing factor.
The hypothesis for a general slowing factor, supported primarily by what is referred to
as the proportional model, states that one group (e.g., older adults) will demonstrate
longer latencies, by a constant factor, relative to another group (e.g., younger adults), to
complete each step of a task (Windsor, Milbraith, Carney, & Rakowski, 2001).
Accordingly, more complex tasks, which involve a greater number of processing steps,
result in a proportionate increase in response latencies (Cerella, Poon, & Williams,
1980; cited in Windsor et al., 2001; see also Brinley, 1965, for an account of the
complexity effect, based on Hick‟s 1952 law). Brinley plots and regression analyses
typically reveal a linear relationship between younger adults‟ RTs on the X axis and
older adults‟ RTs on the Y axis (e.g. Cerella, 1990; Lima, Hale, & Myerson, 1991;
Myerson, Ferraro, Hale, & Lima, 1992), with a slope greater than one, consistent with
proportional slowing.
12.1 A Brinley Plot Analysis of Stroop Performance for ADHD and
Control Samples
Recall from Chapter 4.5.1 that a number of researchers have found speed of processing
deficits for the ADHD population (e.g., Chhabildas et al., 2001; Frazier et al., 2004;
Kalff et al., 2005; Nigg et al., 2002; Reardon & Naglieri, 1992). To apply Brinley plot
mapping to the field under examination here, for each study for which appropriate data
are available, mean RTs of ADHD children on the three Stroop conditions need to be
regressed against the corresponding mean RTs of control group children to determine
whether a linear function fits the data, and to quantify the degree of slowing. In
illustration of the method, consider results taken from Houghton et al. (1999), for which
response output rates were converted to RTs, expressed as time per item. Means for the
ADHD group considered by these authors are 0.71s for the word condition, 1.02s for the
colour condition, and 1.83s for the colour-word condition, and the corresponding values
for the control children are 0.62s, 0.86s, and 1.56s, respectively. The Brinley plot would

194
then contain the (x, y) pairs (0.62s, 0.71s), (0.86s, 1.02s) and (1.56s, 1.83s). With
Brinley plots, the parameters of interest are the regression coefficient, or slope, and r2,
the squared correlation coefficient, or coefficient of determination.
To apply this methodology to the slowed naming hypothesis, broached here as an
alternative explanation to the inhibition hypothesis for the results thus far demonstrated
by the ADHD population on the Stroop task, we need to: (a) demonstrate that ADHD
versus control performance across the different Stroop conditions can be captured by a
linear function; and then (b) determine the numerical value of any slowing, that is, any
proportionate increase in reaction times for the ADHD sample relative to the control
sample. To do this, pairs of ADHD-control data points from conditions in the Stroop
task are fitted using a linear regression equation. As introduced above, this type of
graphical and statistical analysis is referred to as a Brinley analysis or plot (after
Brinley, 1965; Verhaeghen, Cerella, Bopp, & Basak, 2005).
Certainly, given the speeded naming conditions involved in the Stroop, it is
plausible that a more basic naming deficit may underpin the demonstrated impairment
of ADHD children on this task. A reported interaction between group (ADHD versus
control) and Stroop condition, with a more pronounced difference between the groups
for the colour-word condition, may reflect a general processing speed or naming
problem, with performance simply impaired to the same proportional extent on the more
difficult colour-word condition as it is on the easier word and colour conditions. A
similar interpretation can be given to interference scores calculated as differences across
conditions (but not to interference scores based on ratios). Effect sizes might be
expected to be constant across the different Stroop conditions based on a general
slowing perspective. However, this expectation rests on the assumption that the SDs of
score distributions (which contribute to the denominator of effect size estimates)
increase in proportion to the means of those distributions (which contribute to the
numerator). The Brinley method has the advantage that a single index of slowing (the
slope) can be derived. Also, r2
represents the fit to the group data of an assumption that
proportional slowing can account for the across-condition group differences.
Another advantage of the Brinley method is that it yields an index of influence of
any group difference in interference control over and above any general slowing. Any

195
dysfunction in interference control associated with ADHD should be reflected in
impaired colour-word performance rather than in impaired word or colour performance.
Thus a plot of ADHD versus control group RTs (on the x and y axes, respectively)
should show the influence of any interference-control deficit associated with ADHD
through a positive deviation of the colour-word data point from the best-fitting linear
function formed across the pairs of data points for the three conditions.
In summary, existing meta-analyses performed in the ADHD area have attempted
to capture some consistency in findings across studies involving the Stroop by
examining effect sizes for the three conditions, and such findings have largely been used
to support or contradict the dominant inhibition hypothesis pertaining to ADHD (see
Homack & Riccio, 2004; van Mourik et al., 2005). The current perspective suggests that
a different methodological approach might bear entertaining. The present meta-analytic
study uses Brinley-plot analyses of existing data sets to quantify the influence of
proportional slowing (through the slope parameter and r2
from linear regression) and the
influence of inhibitory dysfunction (through the deviation of the colour-word data point
from the best-fitting linear function). The analyses pooled the available research
literature on the Stroop in ADHD children for which comparison data from a group of
typically developing children were available. Each independent data set was used to
construct a Brinley plot from which the slope, r2, and deviation of the colour-word data
point from the regression line were calculated.
12.1.1 Method
The literature review covered 62 studies published between 1980 and 2009. The focus
was on experimental reports that used the Stroop as a measure of inhibitory control or
RN. Literature concerning ADHD was identified through an initial search of the
PubMed and PsycINFO bibliographic databases, using keywords of Stroop and
attention deficit. Further refinement was obtained by combining search terms related to
the Stroop (such as Stroop, interference, executive, inhibition) with search terms related
to ADHD (such as ADHD, ADD, hyperactive, inattention), including ‗and‘ as an
operator where relevant. Additional suitable studies were generated from the reference
lists of empirical papers, from review articles by Barkley et al. (1992), Barkley (1997b),

196
Pennington and Ozonoff (1996), and Nigg (2001), and from meta-analytic studies by
Homack and Riccio (2004), Frazier et al. (2004), Nigg et al. (2005), and van Mourik et
al. (2005). The search cutoff date was December, 2009.
Criteria for inclusion in the meta-analysis were that the study: (a) was a published
work (dissertation abstracts were excluded); (b) was reported in English; (c) contained
at least one ADHD group and a comparison group of typically developing control
children or adolescents; (d) used criteria for attention deficit disorder provided in the
DSM-III, DSM-III-R, or the later DSM-IV version; (e) used the standard Stroop or a
close variant; (f) employed at least three conditions of the Stroop; and (g) reported
Stroop mean RTs or measures that could be converted to mean RT (e.g. response rate).
Where studies did not report three Stroop conditions, or latency data were reported in
another format, attempts were made to locate the primary author to provide the group
latency means for each unreported condition.
Two studies (Seidman et al., 1995; Seidman et al., 1997a) were excluded because
of sample overlap with other studies included in this analysis. Where computerized
versions of the Stroop were used, checks were made to ensure they were compatible
with the standard version, in terms of response mode, the stimuli used, and their
presentation in an array format (requiring continuous rather than discrete naming).
Studies by Carter et al. (1995), Miller et al. (1996), and Gaultney et al. (1999) used
incompatible versions and were excluded from the present analysis. We also excluded
data for ADHD samples for which all individuals carried a comorbid condition (e.g.,
RD).
Six data sets from four additional studies were excluded from the Brinley analyses
because the reported ordering of difficulty of the three Stroop conditions for the
ADD/ADHD samples did not conform to the typical ordering reported in the substantial
majority of studies of the Stroop (word < colour < colour-word). (See Table 12-1.) Four
data sets from three studies (Barkley et al., 1992; Lawrence et al., 2004; Semrud-
Clikeman et al., 2000b), for example, showed the following ordering: word < colour >
colour-word for RTs. This unusual ordering of RTs was also observed for the control
samples in each of the first two studies, and an

197
Table 122-1. Mean reaction time per item (in seconds) for atypical data sets.
Study
Group
Stroop Condition
Word Colour Colour-Word
Barkley et
al., 1992
Control 0.852 0.936 0.870
ADD/+H 0.955 1.021 1.016
ADD/-H 0.982 1.007 0.982
Lawrence
et al.,
2004
Control .953 .961 .958
ADHD 1.025 1.094 1.036
Semrud-
Clikeman
et al.,
2000b
Control 0.826 0.836 0.795
ADD/H 1.046 1.119 1.069
Semrud-
Clikeman
et al.,
2008
Control
0.449 0.445 0.447
ADHD-CT
(treatment)
Data set A
0.468 0.498 0.476
ADHD-CT
(treatment-naïve)
Data set B
0.474 0.506 0.506
equally unusual colour-word < colour > word pattern was reported for the control
sample in the Semrud-Clikeman et al. (2000b) study. In the Semrud-Clikeman et al.
(2008) data set A, the following ordering was obtained on the Stroop subtests: colour <
word < colour-word for the control group results, and colour < colour-word < word for
the ADHD-CT (stimulant-treatment) results. In the Semrud-Clikeman et al. (2008) data
set B, the control group obtained the same ordering reported in the 2008 data set A, but
the ADHD-CT (treatment-naïve) group recorded the following ordering: colour =
colour-word < word. Where the ordering of conditions departs from the typical
ordering, it compromises the interpretation of statistics such as slope, r2, and colour-
word deviation. For instance, whereas the slope for typically ordered data sets reflects
the proportionate increase in RTs from the word to colour to colour-word condition, in
the atypical data sets the slope would partly reflect an increase in RTs from the colour-
word to the colour condition. Although the confusing results from these four studies
were excluded from the analysis, they are considered at length in the discussion.

198
The application of these various criteria yielded 14 eligible studies, which
contained 18 independent data sets. These formed the basis of the meta-analysis. Table
12-2 summarises the main features of the 14 studies. Across the 18 data sets, the mean
sample size for ADHD participants was 48.11 (range = 10-113) and for control
participants it was 48.41 (range = 10-151). The overall mean of the mean ages reported
was 8.92 years (range = 8.92-17.42 years) for the ADHD samples, and 9.17 years
(range = 9.17-18.08 years) for the control samples. (See Table 12-2 for the age ranges
for individual studies.) Strict sampling criteria (exclusion of current or past history of
psychiatric disorders, neurological disorder, and dyslexia, and inclusion of a suitable
drug protocol) were present in only two studies. The rest of the studies reported some,
but not all, of the above restrictive criteria.
12.1.2 Results
To facilitate comparison of the data sets, the means reported in the published studies for
either latencies to complete naming for individual cards or the numbers of items
completed in a fixed interval were converted to a uniform RT measure ─ mean latency
per item. Using this mean latency for each Stroop condition and each group (ADHD,
control), a Brinley plot was then constructed for each of the 18 data sets. These plots are
displayed in Figure 12-1. In each plot, the data point closest to the origin is for the word
condition, the next point is for the colour condition, and the point furthermost from the
origin is for the colour-word condition. The best-fitting linear function is also shown for
each data set. Table 12-3 shows the r2 and slope values for these functions, and also the
deviation of the colour-word data point from the regression line.
The Brinley plots show close conformity to linear functions, with r2 values ranging
from .9909 to 1 (mean = .998). Table 12-7 shows that the slope of the best-fitting linear
function was greater than one for 17 of the 18 data sets. The mean of these slope values
(1.268) differs significantly from unity, t(17) = 24.53, p < .001. This suggests that
ADHD children do show proportional cognitive slowing relative to their typically
developing peers, with approximately a 27% inflation in latencies for ADHD
individuals relative to control children.

199
Table 1212-2. Summaries of the designs of studies that investigated Stroop performance in ADHD and control samples.
Author ADHD
and Control
Samples (n)
Clinical
Control
Group(s)
(n)
Age
(Years)
and
Gender
DSM Criteria
Used
Drug
Protocol
Possible Moderators
Controlled
Stroop
Version
Used
Findings Regarding ADHD
Performance
August &
Garfinkel, 1989
16 ADHD
43 Control
11
ADHD+RD
23
ADHD+CD
5-14
Males &
females
Teacher
ratings based
on DSM-III
and DSM-IIIR
criteria
None
indicated
Reading, Conduct Disorder
and IQ controlled
Golden,
1978
Control = ADHD across all
conditions;
Control > ADHD-CD and
ADHD+RD on Stroop colour and
Stroop colour-word conditions;
August &
Garfinkel, 1990
70 ADHD
42 Control
45
ADHD+RD
7-17
Males
DSM-III-R None
indicated
Reading, comorbid
psychopathology, and IQ
controlled
Golden,
1978
Controls = ADHD across all
conditions;
Controls, ADHD > ADHD+RD
on Stroop word and Stroop
colour-word conditions
Golden & Golden,
2002
43 ADHD
(24 ADHD-CT,
14 ADHD-HI,
5 ADHD-PI)
43 Control
43 LD,
43 Other
(Psychiatric
Group)
6-15
Males &
females
DSM-IV None
indicated
Reading, comorbid
disorders and IQ controlled
Golden,
1978
Control > ADHD on Stroop
colour-word condition only;
Control > LD across all three
Stroop conditions;
ADHD = Other (Psychiatric Gp)
Holtmann et al.,
2006
16 ADHD,
16 Control
16 ADHD+
Benign
Epilepsy
6-15
Males
females
(87.5%
male)
Connors
Rating Scale;
German Child
Behaviour
Checklist
24-hour
washout
Comorbid
psychopathology and IQ
controlled
Golden,
1978
Control = ADHD across all
conditions; Control >
ADHD+Benign Epilepsy on
Stroop colour-word and Stroop
interference
Houghton et al.,
1999
32 ADHD-PI
62 ADHD-CT
28 Control
6-12
Males &
females
(57%
male)
DSM-IV 15-20
hour
washout
Comorbid
psychopathology, reading
and IQ controlled
Stroop,
1935
Control > ADHD-PI
on Stroop word condition;
Control > ADHD-CT
across Stroop word, colour, and
colour-word conditions;
No significant effects for gender

200
Lavoie, &
Charlebois, 1994
16 ADHD-
Inattentive
16 Control
16
Disruptive
12 Male Modified
Behar
Preschool
Behavior
(Parent and
Teacher)
None
indicated
IQ, aggression and anxiety
controlled; reading and
other psychopathology
uncontrolled
Golden,
1978
Control > Disruptive > ADHD-
Inattentive on Stroop colour-word
condition;
Control, Disruptive > ADHD-
Inattentive on errors on Stroop
colour-word condition
Lufi et al., 1990
29 ADHD
20 Control
21
Emotionally-
disturbed
9-16
Male
DSM-III-R None
indicated
IQ, conduct disorder, and
anxiety controlled
Golden,
1978
Control > ADHD across all three
Stroop conditions;
Emotionally-disturbed > ADHD
on Stroop word, Stroop
interference
Nigg et al., 2002
18 ADHD-PI
46 ADHD-CT
41 Control
7-12
Males &
females
(68%
male)
DSM-IV 22-56
hour
washout
IQ controlled; Reading and
other psycho- pathology
assessed but not controlled
(e.g., ADHD-PI
= 7% ADHD-PI+RD;
= 65% ADHD-PI+ODD;
ADHD-CT
=17% ADHD-CT+RD;
= 22% ADHD-CT+ODD)
Golden,
1978
Control > ADHD-PI, ADHD-CT
across all Stroop conditions,
except the interference scores;
Authors conclude slowed naming
specific to ADHD rather than
interference control
Perugini et al.,
2000
21 ADHD
22 Control
6-12
Males
DSM-IV 24-hour
min
washout
Conduct Disorder and
Oppositional Defiant
Disorder assessed, but not
controlled (e.g.,
ADHD = 76% ADHD+
ODD or ADHD+CD)
Stroop,
1935
Control = ADHD on Stroop
colour and word condition (other
conditions not assessed)
Reeve &
Schandler, 2001
10 ADHD
10 Control
12-17
Males &
females
(90%
male)
DSM-IV At least
48-hours‟
duration
IQ, reading, conduct
disorder, oppositional
defiant disorder, and other
psychopathologies
controlled
Golden,
1978
Control > ADHD across Stroop
colour, colour-word and
interference conditions

201
Seidman et al,
1997b
65 ADHD <15
years
53 ADHD >15
years
41Control <15
years
58 Control >15
years
9-22
into 2
groups:
<15 and
≥15
Males
and
females
DSM-III-R 48% on
psycho-
stimulants
33% on
mood
control
drugs
27% on
other
drugs
Psychiatric comorbidity
controlled through
regression analyses; e.g.,
ADHD
= 64% psychiatric
comorbidity,
= 21% learning disability;
Control
= 15% psychiatric
comorbidity,
= 13% learning disability
Golden,
1978
Control > ADHD across all
Stroop conditions;
Control > ADHD
on Stroop colour-word condition
after statistical correction for
psychopharmacological treatment,
comorbid disorders and learning
disability;
Older cohort > younger cohort
Seidman et al.,
2005
204 ADHD
179 Control
(101 ADHD-
Females
103 ADHD-
Males
109 Control-
Females
70 Control-
Males)
9-17
Males &
females
(45%
male)
DSM-III-R 64% on
psycho-
stimulants
Psychiatric comorbidity
controlled through
regression analyses; e.g.,
ADHD
= 57% psychiatric
comorbidity,
= 32% learning disability
Control
= 9% psychiatric
comorbidity,
= 8% learning disability
Golden,
1978
Control > ADHD across all
Stroop conditions, regardless of
gender and medication effects
Willcutt et al.,
2001
28 ADHD
102 Control
93 RD
48
ADHD+RD
24
ADHD+LD
8-16
Males &
females
DSM-III 24-hour
washout
IQ and reading controlled;
ODD\CD controlled only
for a subset, but no other
psychopathology assessed;
ADHD & ADHD+LD
results collapsed into
single grouping for
analyses
Golden,
1978
Control > ADHD
across Stroop word, colour, and
colour-word conditions;
Control = ADHD
on interference scores
(when controlling for word
reading and colour naming)

202
Willcutt,
Pennington, et al.,
2005
113 ADHD
151 Control
109 RD
64
ADHD+RD
8-18
Males &
females(5
3% male)
DSM-IV 24-hour
washout
IQ and reading controlled;
Other psychopathology
unspecified
Golden,
1978
Control > ADHD > ADHD+RD,
RD on Stroop word condition;
Control > ADHD, ADHD+RD,
RD on Stroop colour condition;
Control > ADHD, ADHD+RD,
RD on Stroop colour-word
condition;
Control = ADHD, ADHD+RD,
RD on interference scores

203
A positive deviation of the colour-word data point from the regression line for the
Brinley plot can be interpreted as reflecting inhibitory dysfunction in the ADHD
sample. Twelve of the 18 data sets yielded a positive deviation (see Table 12-7), a
proportion not significantly different from .5 using a binomial test (p = .238). Also, the
mean deviation across the 18 data sets is negative (-.003), and does not differ
significantly from zero, t(17) = -0.224, p = .825. However, notice that one data set in
Table 12-7 (10a) yielded an extreme deviation of -.187, which falls more than 3 SD
units from the mean of the set of deviations. When this value is excluded, the mean
deviation across the remaining 17 data sets is .0084, which differs significantly from
zero, t(16) = 3.059, p = .007. Note, however, that this mean deviation is in seconds, so it
represents a small increment in latency compared to the 27% inflation in latencies
attributed to proportional slowing. Thus evidence of a difficulty in interference control
associated with ADHD is, at best, modest.
12.1.3 Discussion
The present study examined differences in RT between ADHD children and their
typically developing age-matched peers across the three conditions of the Stroop using
18 accessible data sets from 14 studies. The principal analysis for each data set
consisted of mapping the relation between performance of ADHD children and
performance of control children in a Brinley plot. Central outcomes of the analyses of
these sets of latency data were: (1) a linear function provided a close fit for each data
set; (2) with just one exception, the slopes of these functions were greater than one, and
the mean slope substantially exceeded unity; (3) the deviation of the colour-word data
point from the regression line was typically small, and the mean deviation significantly
exceeded zero only when a large negative deviation was excluded.
The Brinley plot analyses therefore provide substantial support for proportional
slowing in the ADHD population relative to their typically developing peers. The strong
linear relationship between ADHD and control-group performance across the three
conditions of the Stroop, with an inflation of approximately 27% in ADHD latencies,
indicates a substantial difference in processing speed for the two populations.
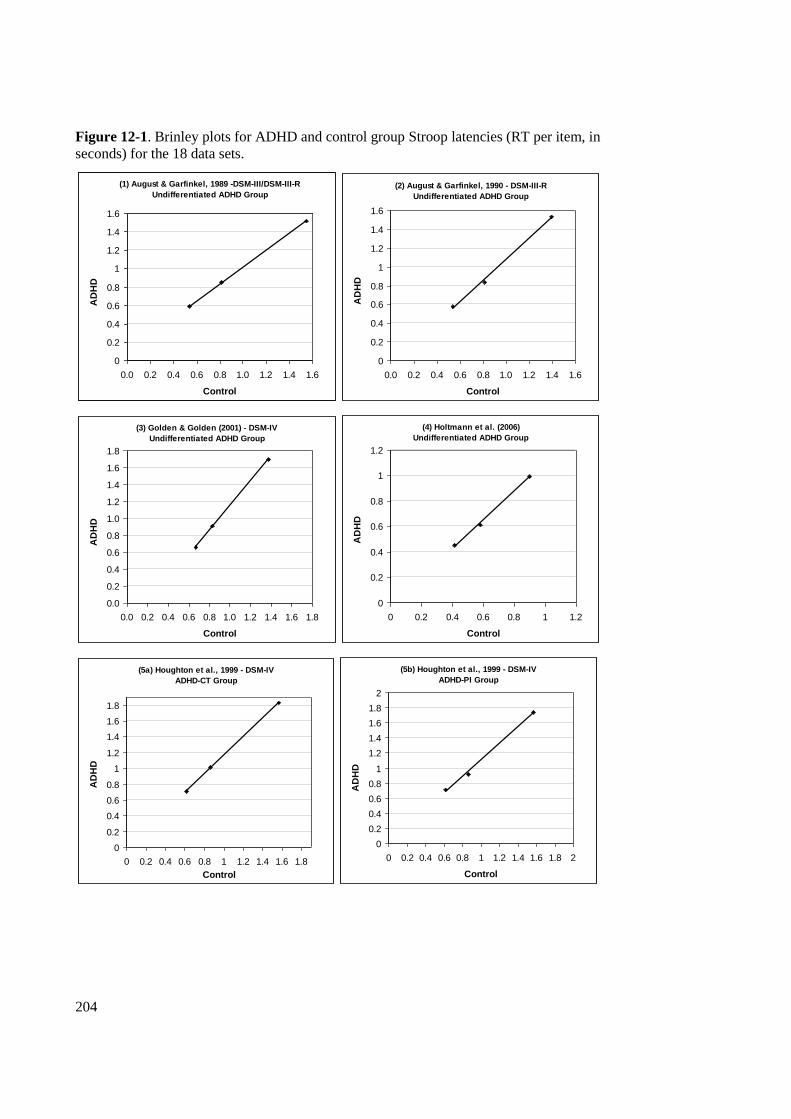
204
Figure 12-1. Brinley plots for ADHD and control group Stroop latencies (RT per item, in
seconds) for the 18 data sets.
(1) August & Garfinkel, 1989 -DSM-III/DSM-III-R
Undifferentiated ADHD Group
0
0.2
0.4
0.6
0.8
1
1.2
1.4
1.6
0.0 0.2 0.4 0.6 0.8 1.0 1.2 1.4 1.6
Control
AD
HD
.
(2) August & Garfinkel, 1990 - DSM-III-R
Undifferentiated ADHD Group
0
0.2
0.4
0.6
0.8
1
1.2
1.4
1.6
0.0 0.2 0.4 0.6 0.8 1.0 1.2 1.4 1.6
Control
AD
HD
.
(3) Golden & Golden (2001) - DSM-IV
Undifferentiated ADHD Group
0.0
0.2
0.4
0.6
0.8
1.0
1.2
1.4
1.6
1.8
0.0 0.2 0.4 0.6 0.8 1.0 1.2 1.4 1.6 1.8
Control
AD
HD
.
(4) Holtmann et al. (2006)
Undifferentiated ADHD Group
0
0.2
0.4
0.6
0.8
1
1.2
0 0.2 0.4 0.6 0.8 1 1.2
Control
AD
HD
.
(5a) Houghton et al., 1999 - DSM-IV
ADHD-CT Group
0
0.2
0.4
0.6
0.8
1
1.2
1.4
1.6
1.8
0 0.2 0.4 0.6 0.8 1 1.2 1.4 1.6 1.8
Control
AD
HD
.
(5b) Houghton et al., 1999 - DSM-IV
ADHD-PI Group
0
0.2
0.4
0.6
0.8
1
1.2
1.4
1.6
1.8
2
0 0.2 0.4 0.6 0.8 1 1.2 1.4 1.6 1.8 2
Control
AD
HD
.

205
(6) Lavoie & Charlebois, 1994
Undifferentiated ADHD Group
0
0.2
0.4
0.6
0.8
1
1.2
1.4
1.6
1.8
2
0.0 0.2 0.4 0.6 0.8 1.0 1.2 1.4 1.6 1.8 2.0
Control
AD
HD
.
(7) Lufi et al., 1990 - DSM-III-R
Undifferentiatd ADHD Group
0
0.2
0.4
0.6
0.8
1
1.2
1.4
1.6
1.8
0 0.2 0.4 0.6 0.8 1 1.2 1.4 1.6 1.8
Control
AD
HD
.
(8a) Nigg et al., 2002 - DSM-IV
ADHD-CT Group
0
0.2
0.4
0.6
0.8
1
1.2
1.4
1.6
1.8
2
0 0.2 0.4 0.6 0.8 1 1.2 1.4 1.6 1.8 2
Control
AD
HD
.
(8b) Nigg et al., 2002 - DSM-IV
ADHD-PI Group
0
0.2
0.4
0.6
0.8
1
1.2
1.4
1.6
1.8
2
0.0 0.2 0.4 0.6 0.8 1.0 1.2 1.4 1.6 1.8 2.0
Control
AD
HD
.
(9) Perugini et al., 2000 - DSM-IV
Mixed ADHD-CT/ADHD-HI Group
0
0.2
0.4
0.6
0.8
1
1.2
0 0.2 0.4 0.6 0.8 1 1.2
Control
AD
HD
.
(11) Reeve & Schandler, 2001 -
Undifferentiated ADHD Group
0
0.2
0.4
0.6
0.8
1
1.2
1.4
1.6
0 0.2 0.4 0.6 0.8 1 1.2 1.4 1.6
Control
AD
HD
.

206
(11a) Seidman et al., 1997a - DSM-III
Younger (<15yrs) Undifferentiated ADHD Group
0
0.2
0.4
0.6
0.8
1
1.2
1.4
1.6
0 0.2 0.4 0.6 0.8 1 1.2 1.4 1.6
Control
AD
HD
.
(11b) Seidman et al., 1997a - DSM-III
Older (>15yrs) Undifferentiated ADHD Group
0
0.2
0.4
0.6
0.8
1
1.2
1.4
0 0.2 0.4 0.6 0.8 1 1.2 1.4
Control
AD
HD
.
(12a) Seidman et al., 2005 - DSM-III-R
Undifferentiated Male ADHD Group
0
0.2
0.4
0.6
0.8
1
1.2
1.4
1.6
0.0 0.2 0.4 0.6 0.8 1.0 1.2 1.4 1.6
Control
AD
HD
.
(12b) Seidman et al., 2005 - DSM-III-R
Undifferentiated Female ADHD Group
0
0.2
0.4
0.6
0.8
1
1.2
1.4
1.6
0.0 0.2 0.4 0.6 0.8 1.0 1.2 1.4 1.6
Control
AD
HD
.
(13) Willcutt et al., 2001 - DSM-III
Undifferentiated ADHD Group
0
0.2
0.4
0.6
0.8
1
1.2
1.4
1.6
1.8
0.0 0.2 0.4 0.6 0.8 1.0 1.2 1.4 1.6 1.8
Control
AD
HD
.
(14) Willcutt et al., 2005 - DSM-IV
Mixed ADHD-CT/ADHD-PI Group
0
0.2
0.4
0.6
0.8
1
1.2
1.4
1.6
1.8
0.0 0.2 0.4 0.6 0.8 1.0 1.2 1.4 1.6 1.8
Control
AD
HD
.

207
Proportional slowing means that the absolute difference in RTs for ADHD and
control samples is greater for the most difficult colour-word condition relative to the
easier word and colour conditions. Accordingly, proportional slowing can account for
much of the data imputed within the literature to demonstrate an inhibition deficit in the
ADHD population. Further, an account based on general slowing can provide a more
parsimonious explanation of the naming deficits observed across all three conditions of
the Stroop for the ADHD population.
The inhibition theory garners only limited support from this meta-analysis. The
critical colour-word condition requires the control of interference from word reading.
However evidence that the mean RT for this condition was especially elevated for the
ADHD samples (relative to the best-fitting linear function in the analyses) was obtained
only when an outlier data point was eliminated, and even then the mean elevation in
ADHD latencies was small.
As indicated in the method section, the data sets reported in Barkley et al. (1992),
Lawrence et al. (2004), and Semrud-Clikeman et al. (2000b) are unusual in that the
control and ADD/ADHD groups failed to show an elevation in RTs in moving from the
colour condition to the colour-word condition (see Table 12-1 for these data). Some of
the data sets reported by Semrud-Clikeman, Pliszka, and Liotti (2008, data set A) show
a similar disruption to the expected ordering of difficulty of the three conditions. This
unusual pattern would seem to indicate some unidentified reading difficulties, yet
screening was completed across all three groups, and the control group outcomes are
identical in patterning to the other two ADHD-CT groups. Although Semrud-Clikeman
et al. (2008, data set A) comment that the Stroop traditionally requires more time to
name the colours than the words and the most time to read the colour of the word
printed in the wrong colour in their outline of the task itself, nevertheless they make no
remark on the odd outcomes for all three of their groups of participants. Latencies for
the three Stroop conditions occur in the more typically-ordered of word < colour <
colour-word, on the other hand, in each of the 18 panels of Figure 12-1. With the data
sets reported by Barkley et al. (1992), Lawrence et al. (2004), Semrud-Clikeman et al.
(2000b), and Semrud-Clikeman et al. (2008, data set A) showing an atypical ordering of

208
Table 12-3. Outcomes for Brinley plot analyses of Stroop performance for ADHD and control
group samples (where deviation refers to the deviation of the colour-word data point from the
regression line).
__________________________________________________________________
Study Author r2
Slope Deviation
__________________________________________________________________
1 August & Garfinkel, 1989 1.0000 0.9204 -0.0010
2 August & Garfinkel, 1990 0.9969 1.1293 0.0102
3 Golden & Golden, 2002 0.9997 1.4705 -0.0024
4 Holtmann et al., 2006 0.9976 1.1264 0.0051
5a Houghton et al., 1999 (ADHD-CT) 0.9996 1.1838 -0.0035
5b Houghton et al., 1999 (ADHD-PI) 0.9968 1.1036 0.0088
6 Lavoie & Charlebois, 1994 0.9924 1.7336 0.0199
7 Lufi et al., 1990 0.9958 1.4845 0.0099
8a Nigg et al., 2002 (ADHD-CT) 0.9972 1.2472 0.0109
8b Nigg et al., 2002 (ADHD-PI) 0.9909 1.3668 0.0219
9 Perugini et al., 2000 1.0000 1.0228 -0.0006
10 Reeve & Schandler, 2001 0.9996 1.7658 -0.0034
11a Seidman et al., 1997b - Younger 0.9972 1.2344 -0.1874
11b Seidman et al., 1997b - Older 0.9972 1.2344 0.0416
12a Seidman et al., 2005 (M) 0.9974 1.2272 0.0090
12b Seidman et al., 2005 (F) 0.9987 1.2812 0.0060
13 Willcutt et al., 2001 0.9989 1.1689 0.0051
14 Willcutt, Pennington, et al., 2005 0.9993 1.1274 0.0048
________________________________________________________________________
condition difficulty, they would necessitate a different interpretation of r2, slope and
colour-word deviation values than the interpretation placed on the values derived from
the data sets shown in Figure 12-1. For this reason the data sets summarized in Table
12-1 were excluded from the Brinley-plot analyses.
Although interpretation of the statistics is clouded for these atypical data sets,
nevertheless it is noteworthy that in only one instance was a small positive colour-word
deviation obtained when the Brinley analyses were in fact applied (i.e., for Semrud-

209
Clikeman et al., 2000b). Thus there is little indication that disinhibition exerted a
noticeable effect in these aberrant results.
In what ways could the sampling of participants or other aspects of the
methodology of these four studies account for the unusual patterns of results? Firstly, it
is noteworthy that the four studies yielded RTs for the three conditions that are more
similar in magnitude than is typically observed. That is, the gradient in RTs across the
word, colour and colour-word conditions is shallow, and indeed reversed in one
transition. This pattern of results would normally indicate substantial reading problems
within the groups: difficulty in reading would be expected to slow word responses, not
affect colour responses, and potentially facilitate colour-word responses through
limiting the availability of a competing response derived from reading. However, while
it is unclear whether Barkley et al. (1992) screened for reading difficulties, Lawrence et
al. (2004) reported using school records to ensure their participants had no indication of
reading difficulties, and Semrud-Clikeman et al. (2000b) reported that all participants
fell within normal ranges across the three reading measures used in their study. In the
Semrud-Clikeman et al. (2008) study, all groups were screened for reading ability.
Perhaps the unusual results of these three studies partly reflect the modest sample sizes:
Barkley et al. (1992) separately reported Stroop data for 12 ADD-With Hyperactivity
participants and 12 ADD-Without Hyperactivity participants, Lawrence et al. (2004)
collapsed Stroop data over ADHD-Predominantly Inattentive (n = 6) and ADHD-
Combined Type (n = 16) participants, and Semrud-Clikeman et al. (2000b) reported
Stroop data for 10 ADD-With Hyperactivity participants. However, sample sizes for the
relevant groups in the Semrud-Clikeman et al. (2008) study were 39 control
participants, 23 ADHD-CT (treatment) participants, and 16 ADHD-CT (treatment-
naïve) participants. Other features of the samples of the four studies (e.g. ages, gender
distribution, drug protocol) do not differ markedly from the features of studies that were
included in the analysis, so we can offer no compelling account of these unusual sets of
results.
The studies included in the meta-analysis were diverse in design (see Table 12-2).
For instance, few studies systematically controlled for comorbid conditions, and those
that did adopted a variety of screening procedures or statistical methods. Despite the

210
solid evidence supporting proportionate slowing in ADHD across these studies (Figure
12-1), it was considered that it would be beneficial to examine ADHD groups
differentiated in respect of the presence of RD (accordingly, see Section 12.2). It was
noted above how the Brinley analyses could potentially be ambiguous in outcome when
reading levels are low, a problem not overcome by matching ADHD and control groups.
This will be the focus of the next section.
A final cautionary note is that the influence of some particular sources of
processing difficulty is not precluded in accounting for the Stroop results summarized in
Figure 12-1. For instance, it is possible that a particular difficulty in colour naming
elevates latencies for ADHD participants in the colour and colour-word conditions
(Brock & Knapp, 1996; Carte et al., 1996; Nigg et al., 1998; Semrud-Clikeman et al.,
2000a; Semrud-Clikeman et al., 2000b; Rucklidge & Tannock, 2002; Tannock et al.,
2000). However, as Figure 12-1 shows, the elevation in latencies from the word to the
colour condition for the ADHD participants is matched by an additional increment in
latencies from the colour to the colour-word condition, so this additional feature of the
results needs to be accommodated in any complete account of ADHD Stroop
performance. Problems in colour perception might account for the difficulty in the
colour conditions experienced by both ADHD-CT groups in the Semrud-Clikman et al.
(2008, data set A) results.
The results of the meta-analysis, in the form of Brinley plots of the mean RTs of
ADHD and control groups on the Stroop task, support the notion of a general slowing
hypothesis and provide a more parsimonious account of ADHD performance on the
Stroop than that furnished by the inhibition account previously favoured in this domain.
The research, however, mandates an examination of that research differentiating
subgroups of ADHD, and reporting data for all three conditions of the Stroop in order to
closer investigate the contributions of proportional slowing, disinhibition, and other
factors to the observed longer latencies in the ADHD population on this task. It is
heartening that these findings are shored up by a recent meta-analysis which drew
similar conclusions (Schwartz & Verhaeghen, 2008).

211
12.2 A Brinley Plot Analysis of Stroop Performance for RD and
ADHD+RD Samples Relative to Control Samples
In order to complete a comprehensive review of findings on the Stroop task, a Brinley
plot meta-analysis was conducted for studies of RD and control groups of children and
adolescents on this task, as well as for studies of comorbid ADHD+RD samples and
their corresponding control peers on the same task. As indicated previously, it is
predicted that impaired reading will impact on Stroop performance, and have specific
influence on the Brinley plot analyses. That is, poor reading is expected to elevate the
latency for the word condition for the RD and ADHD+RD samples relative to the
control group‟s performance. One might suspect that the Brinley function might be
relatively flat in moving from the word to the colour condition, rather that showing the
linear trend that was typically observed for the ADHD samples.
12.2.1 Method
Literature concerning RD was identified through an initial search of the PubMed and
PsycINFO bibliographic databases, using keywords of Stroop and reading disorder.
Detection of suitable research was enhanced by the pairing of search terms related to the
Stroop (such as Stroop, interference, executive, inhibition) with search terms related to
RD (such as reading disability, dyslexia), including ‗and‘ as an operator where required.
Additional related studies were generated from the reference lists of empirical papers;
no review papers were found in this area. The search cutoff date was December, 2009.
Criteria for inclusion in the meta-analysis were that the study: (a) was a published
work (dissertation abstracts were excluded); (b) was reported in English; (c) contained
at least one RD group and a comparison group of typically developing control children
or adolescents; (d) use one or more standardized reading tests for the identification of
dyslexia; (e) used the standard Stroop task or a close variant; (f) employed at least three
conditions of the Stroop task; and (g) reported Stroop mean RTs or measures that could
be converted to mean RT (e.g. response rate). Where studies did not report three Stroop
conditions, or latency data were reported in another format, attempts were made to
locate the primary author to provide the group latency means for each unreported
condition.

212
The literature search uncovered 12 RD studies published between 1966 and 2009
which used the Stroop task; only 7 of these complied with inclusion criteria (Table 12-
4). Similarly, of the 6 extant studies specifically including a comorbid ADHD+RD
group discovered through the literature search, only 4 were deemed suitable for
inclusion (Table 12-5).
12.3 Results and Discussion
Latency data on the Stroop for the RD and the ADHD+RD groups and their
corresponding control peers were also mapped in Brinley space, despite the low number
of data sets in both instances. To this end, as depicted in Figure 12-2, firstly RD RTs
were regressed on control group RTs for the 7 available data sets. There was a good
linear fit for 5 of the data sets, but less clear linear fits for the other 2 data sets, which
will be discussed in further detail below. The r2 values ranged from .8663 to .9996
(mean = .968). Table 12-6 shows that the slope of the best-fitting linear function was
greater than one in all 7 data sets. The mean of these slope values (1.269) differs
significantly from unity, t(6) = 4.469, p = 0.004. This suggests that RD children may
also show proportional cognitive slowing relative to their typically developing peers,
with approximately a 27% inflation in latencies for RD individuals relative to controls.
Note, however, the apparent “pull” away from the regression line of the data point
for the word condition (the leftmost data point) in the results of Everatt et al. (1997),
and Helland and Asbjornesen (2000). It is suggested that the (comparatively worse)
results for the word condition for these two dyslexic groups are pulling the regression
line up (i.e. flattening the slope of the Brinley plot) for these two studies. (It should be
noted that the data point for the word condition sits above the regression line in five of
the seven plots depicted in Figure 12-2).
As outlined earlier, it would be anticipated that a specific deficit in reading would
increase latencies for the word condition, not affect times on the colour condition, and
potentially facilitate colour-word responses by gating the competing reading response.
Indeed, the data reported in two studies demonstrate remarkably close RTs per item for
the word and colour conditions for the RD groups. Helland and Asbjornsen‟s (2000)
reported latency data for their RD group that convert to processing rates of .901 s per

213
item on the word condition, and .914 s per item on the colour condition; Everatt et al.‟s
(1997) results suggest their RD group is actually performing at a marginally slower rate
on the word condition than the colour condition, with processing rates of .694 s and
.688 s, respectively. (It is difficult, however, to discern any facilitatory effect on the
colour-word condition in either case.) Yet neither the stringency of the RD diagnostic
criteria, nor the age groups used, differ in any remarkable way for these two studies
compared to the remaining studies depicted in these plots (i.e., dismissing possible
suggestions that these participants were simply demonstrating a greater reading deficit,
or that they might have been simply younger, less proficient readers).
Additionally, observe that the mean deviation for the colour-word point from the
regression line across the 7 data sets is positive (.0251), and does not differ significantly
from zero [t(6) = 1.931, p = .102]. Whilst five of the seven data sets show minimal
residuals from the regression lines for the colour-word data point, nevertheless two
studies report large positive residuals (i.e., those studies mentioned earlier, Everatt et al,
1997, and Helland & Asbjornsen, 2000), perhaps suggesting a possible increment in
colour-word latencies associated with an inhibition problem in these two RD samples,
but more likely reflecting the elevated latencies on the word condition, which flattens
the slope of the function.
Table 1212-4. Outcomes for Brinley Plot analyses of Stroop performance for RD and control
group samples.
______________________________________________________________________
Study Author r2
Slope Colour-Word Word
Deviation Deviation
______________________________________________________________________
1 Everatt et al., 1997 0.9264 1.5697 0.0716 0.1872
2 Golden & Golden, 2002 0.9993 1.2911 -0.0031 -0.0106
3 Helland & Asbjornsen, 2000 0.8663 1.1095 0.7772 0.1253
4 Reiter et al, 2005 0.9939 1.1001 0.0113 0.5050
5 Willcutt et al., 2001 0.9964 1.2079 0.0097 0.0274
6 Willcutt, Pennington, et al., 2005 0.9968 1.33 0.0119 0.0278
7 Wolff et al., 1984 0.9996 1.276 -0.0032 -0.0107
_____________________________________________________________________________

214
Table 122-5. Summaries of the designs of studies that investigated Stroop performance in RD and control samples.
Author RD
and Control
Samples (n)
Clinical
Control
Group(s)
(n)
Age
(Years)
and
Gender
RD Criteria Used Possible Moderators Controlled Stroop
Version
Used
Findings Regarding RD
Stroop Performance
Everatt et al.,
1997
20 Dyslexic
20 Control
(chronological
match)
20 Control
(reading age
match)
10.5 mean
years
Males &
females
RD ≥ 1.5 yr lag in
reading skills for age
(British Ability
Scales, 1958)
Screening for gross organic and
behavioural problems, plus colour
blindness
Modified
Stroop
(name 40
items)
Control > Dyslexic across all
three conditions;
Dylsexic = Reading-matched
controls on colour naming
Golden &
Golden, 2002
43 LD
(Reading)
43 Control
43 ADHD,
43 Other
(Psychiatric
Group)
6-15
Males &
females
RD ≥ 15 point
difference in IQ and
Achievement test
scores
Comorbid disorders and IQ
controlled
Golden,
1978
(output in
45s)
Control > LD (Reading) across
all three conditions
Helland &
Asbjornsen,
2000
(Norwegian
study)
25 Dyslexic
20 Control
18 RD+SLI 12.39
mean years
Males &
females
RD ≥ 2-year lag in
reading or writing
skills for actual grade
Screening for Specific Language
Impairment, sensory and
neurological impairment, ADHD and
other psychopathology
Hugdahl,
undated
(name 48
items)
Control > Dyslexic across all
three conditions
Reiter et al.,
2005
(German study)
42 Dyslexic
42 Control
10.7 mean
years
Males &
females
RD ≤ 5%-ile on
Reading Test of
Zurich; ≤ 16%-ile on
other reading, writing
tests
Screening for neurogical and
psychiatric disease in Dyslexic
sample, but not Control sample.
Stroop,
1935
(name 100
items)
Control > Dyslexic across all
three conditions
Willcutt et al.,
2001
93 RD
102 Control
28 ADHD
48 ADHD+
RD
24 ADHD+
LD
8-16
Males &
females
RD ≥ 1.65 SD below
reading mean of the
control group -age
discrepancy
RD ≥ 1.65 SD below
the FSIQ and reading
score - IQ discrepancy
IQ and ADHD controlled;
ODD\CD controlled only for a
subset, but no other psychopathology
assessed; ADHD & ADHD+LD
results collapsed into a single
grouping for the analyses
Golden,
1978
(output in
45s)
Control > ADHD
across Stroop word, colour, and
colour-word conditions;
Control = ADHD
on interference scores
(when controlling for word
reading and colour naming)

215
Willcutt,
Pennington, et
al., 2005
109 RD
151 Control
113 ADHD
64
ADHD+RD
8-18
Males &
females
(53%
male)
RD ≥ 1.75 SD below
the FSIQ score and
reading discriminant
score
IQ and reading controlled;
Other psychopathology unspecified
Golden,
1978
(output in
45s)
Control > ADHD >
ADHD+RD, RD on Stroop
word condition;
Control > ADHD, ADHD+RD,
RD on Stroop colour condition;
Control > ADHD, ADHD+RD,
RD on Stroop colour-word
condition;
Control = ADHD, ADHD+RD,
RD on interference scores
Wolff et al.,
1984
20 Retarded
Readers
15 Control
12-13
years;
Males only
RD ≥ 2 years below
grade level on the
Gray Oral Reading
Test
Screening for physical, organic,
neurological, and emotional
disorders; ADHD indicated, but not
assessed, in 3 of the RD sample.
Clark
University,
1962
(name 100
items)
Control > RD across all three
conditions

216
Table 12-6. Summaries of the designs of studies that investigated Stroop performance in ADHD+RD and control samples.
Author ADHD+R
D
and
Control
Samples
(n)
Clinical
Control
Group(s)
(n)
Age
(Years)
and
Gender
RD Criteria Used ADHD Criteria
Used
+ Washout
Possible Moderators
Controlled
Stroop
Version
Used
Findings Regarding ADHD+RD
Stroop Performance
August &
Garfinkel,
1989
11
ADHD+
RD
43 Control
16 ADHD
23
ADHD+
CD
5-14
Males
&
females
RD ≥ 1 SD below
population reading mean
and ≥ 1 SD below
expected IQ
Teacher ratings on
scales based on
DSM-III and
DSM-III-R criteria;
No washout
Reading, Conduct Disorder
and IQ controlled
Golden,
1978
Control = ADHD across all
conditions;
Control > ADHD-CD and
ADHD+RD on colour and colour-
word conditions
August &
Garfinkel,
1990
45
ADHD+
RD
42 Control
70 ADHD 7-17
Males
RD ≥ 1 SD below
population reading mean
and ≥ 1 SD below
expected IQ
DSM-III-R;
No washout
indicated
Reading, comorbid
psychopathology, and IQ
controlled
Golden,
1978
Controls = ADHD across all
conditions;
Controls, ADHD > ADHD+RD
on word and colour-word conditions
Willcutt et
al., 2001
48
ADHD+
RD
102
Control
28 ADHD
93 RD
24
ADHD+
LD
8-16
Males
&
females
RD ≥ 1.65 SD below
reading mean of control
group (age discrepancy
criterion);
RD ≥ 1.65 SD below
FSIQ and reading score
(IQ discrepancy criterion)
DSM-III;
24-hour washout
IQ, ADHD and reading
controlled;
ODD\CD controlled only for a
subset, but no other
psychopathology assessed
Golden,
1978
(output in
45s)
Control > ADHD
Across word, colour, and colour-
word conditions;
Control = ADHD on interference
scores (when controlling for word
reading and colour naming)
Willcutt,
Penning-
ton, et al.,
2005
64
ADHD+
RD
151
Control
113
ADHD
109 RD
8-18
Males
&
females
(53%
male)
RD ≥ 1.75 SD below the
FSIQ score and reading
discriminant score
DSM-IV;
24-hour washout
IQ, ADHD and reading
controlled;
Other psychopathology
unspecified
Golden,
1978
(output in
45s)
Control > ADHD > ADHD+RD, RD
on word condition;
Control > ADHD, ADHD+RD, RD
on colour condition;
Control > ADHD, ADHD+RD, RD
on colour-word condition;
Control = ADHD, ADHD+RD, RD
on interference scores

217
To verify if slowed reading is in effect influencing the profile of these data points,
the deviation of the data point for the word condition from the regression line was
calculated. The mean deviation for the word data point from the regression line across
the 7 studies was positive (.1216), but did not differ significantly from zero, t(6) =
1.745, p = .132.
Table 12-7. Outcomes for Brinley Plot analyses of Stroop performance for ADHD+RD and
control group samples.
______________________________________________________________________
Study Author r2
Slope Colour-Word Word
Deviation Deviation
______________________________________________________________________
1 August & Garfinkel, 1989 0.9991 1.2091 0.0058 0.0152
2 August & Garfinkel, 1990 0.9468 1.1618 0.0644 0.0922
3 Willcutt et al., 2001 0.9953 1.4317 -0.0892 0.0372
4 Willcutt, Pennington, et al., 2005 0.9933 1.3764 -0.0929 0.0359
______________________________________________________________________
In conclusion, although the paucity of data means there is insufficient power for
informative tests of slopes and deviations to be executed and meaningfully interpreted,
there are several aspects worth noting when inspecting the Brinley plots for the RD
samples. Across the small number of data sets (see Table 12-6), the tentative trend still
suggests a slowing factor may be evident (mean slope = 1.269). This 27% increase in
response times for RD children and adolescents in comparison to their control peers
across all three conditions of the Stroop task corresponds with the 27% increase found
in the equivalent ADHD population.
A separate examination of results of the Brinley plots for the four data sets for the
comorbid ADHD+RD samples (see Figure 12-3), reveals a slowing factor of 30%
(mean slope = 1.295), consistent with findings for the previous groups, and the r2 for the
fit of the function ranged from .9933 to .9991 (mean = .9836). The mean deviation of
the word-colour data point from the regression line across the available data sets (see

218
Figure 12-2. Brinley plots for RD and control group Stroop latencies (RT per item, in seconds)
for the seven data sets.
Everatt et al., 1997
0
0.2
0.4
0.6
0.8
1
1.2
1.4
1.6
1.8
2
2.2
0 0.2 0.4 0.6 0.8 1 1.2 1.4 1.6
Control
Read
ing
Dis
ord
er
.
Golden & Golden, 2002
0
0.2
0.4
0.6
0.8
1
1.2
1.4
1.6
1.8
0 0.2 0.4 0.6 0.8 1 1.2 1.4 1.6
Control
Read
ing
Dis
ord
er
.
Helland & Asbjornsen, 2005
0
0.2
0.4
0.6
0.8
1
1.2
1.4
1.6
1.8
0 0.2 0.4 0.6 0.8 1 1.2 1.4 1.6
Control
Read
ing
Dis
ord
er
.
Reiter, Tucha, & Lange, 2004
0
0.2
0.4
0.6
0.8
1
1.2
1.4
1.6
1.8
0 0.2 0.4 0.6 0.8 1 1.2 1.4 1.6 1.8
Control
Read
ing
Dis
ord
er
.
Willcutt et al, 2001
0
0.2
0.4
0.6
0.8
1
1.2
1.4
1.6
1.8
2
0 0.2 0.4 0.6 0.8 1 1.2 1.4 1.6 1.8 2
Control
Read
ing
Dis
ord
er
.
Willcutt et al, 2005
0
0.2
0.4
0.6
0.8
1
1.2
1.4
1.6
1.8
2
0 0.2 0.4 0.6 0.8 1 1.2 1.4 1.6 1.8 2
Control
Read
ing
Dis
ord
er
.

219
Wolff, Cohen, & Drake, 1984
0
0.2
0.4
0.6
0.8
1
1.2
1.4
1.6
1.8
2
0 0.2 0.4 0.6 0.8 1 1.2 1.4 1.6 1.8 2
Control
Read
ing
Dis
ord
er
.
Figure 12-3. Brinley plots for ADHD+RD and control group Stroop latencies (RT per item, in
seconds) for the four data sets.
August & Garfinkel, 1989
0
0.2
0.4
0.6
0.8
1
1.2
1.4
1.6
1.8
2
0 0.2 0.4 0.6 0.8 1 1.2 1.4 1.6
Control
AD
HD
+R
D
.
August & Garfinkel, 1990
0
0.2
0.4
0.6
0.8
1
1.2
1.4
1.6
1.8
0 0.2 0.4 0.6 0.8 1 1.2 1.4 1.6
Control
AD
HD
+R
D
.
Willcutt et al, 2001
0
0.2
0.4
0.6
0.8
1
1.2
1.4
1.6
1.8
2
0 0.2 0.4 0.6 0.8 1 1.2 1.4 1.6 1.8 2
Control
AD
HD
+R
D
.
Willcutt et al, 2005
0
0.2
0.4
0.6
0.8
1
1.2
1.4
1.6
1.8
2
0 0.2 0.4 0.6 0.8 1 1.2 1.4 1.6 1.8 2
Control
AD
HD
+R
D
.

220
Table 12-7) is positive (.0247). August and Garfinkel (1990), however, yielded a much
larger residual than the other three studies. This data set also provides a poorer linear fit
than the other data sets, with the latency for the word condition also falling above the
regression line for this ADHD+RD group (see Figure 12-3). Thus it is difficult to
pinpoint whether the poor linear fit for the data from August and Garfinkel (1990)
reflects impaired reading in the ADHD+RD group or an inhibitory deficit. The mean
deviation for the word point from the regression line across the 4 word deviations was
positive (.0451), but did not differ significantly from zero [t(3) = 2.738, p = .071]. All
four word deviations were positive.
Finally, it is an interesting exercise to map results from the current study (reported
in Chapter 9) in Brinley space. As is evident in Figure 12-4 and Table 12-8, a linear
function describes the data sets for the RD, ADHD and ADHD+RD groups quite
adequately. Also, it is worth mentioning that the slopes are greater than one in all
instances. Even more compelling, the deviation of the colour-word point from the
regression line is again small. Thus it appears that there is little evidence to support an
interference control deficit in the ADHD population. Rather, the impact of the argument
presented here is that there is generalized slowing manifested by ADHD, RD, and
ADHD+RD groups across all three standard conditions of the Stroop task. Rather, the
impact of the argument presented here is that there is generalized slowing manifested by
ADHD, RD, and ADHD+RD groups across all three standard conditions of the Stroop
task.
Table 12-8. Outcomes of Brinley plot analyses of Stroop task results from the current study.
__________________________________________________________________
Group r2
Slope Colour-word
Deviation
__________________________________________________________________
RD 0.9961 1.4120 -0.0134
ADHD 0.9959 1.2455 0.0478
ADHD+RD 0.979.1 1.2306 -0.02721
________________________________________________________________________

221
Figure 12-4. Brinley plots for RD, ADHD, and ADHD+RD and control group Stroop latencies
(RT per item, in seconds) for the data from the current study.
Pocklington, 2008
0
0.5
1
1.5
2
2.5
0 0.2 0.4 0.6 0.8 1 1.2 1.4 1.6 1.8
Control
RD
Pocklington, 2008
0
0.2
0.4
0.6
0.8
1
1.2
1.4
1.6
1.8
0 0.2 0.4 0.6 0.8 1 1.2 1.4 1.6 1.8
ControlA
DH
D
Pocklington, 2008
0
0.2
0.4
0.6
0.8
1
1.2
1.4
1.6
1.8
2
0 0.2 0.4 0.6 0.8 1 1.2 1.4 1.6 1.8
Control
AD
HD
RD

222
Chapter 13: Mapping the Neuropsychological
Correlates of ADHD and RD
The current research explored the specificity of each of five cognitive domains in
providing cognitive markers for two frequently comorbid disorders of childhood,
ADHD and RD. This thesis adds to the current international research effort by mapping
the cognitive correlates for ADHD, RD, and ADHD+RD in a fully crossed design.
Moreover, exploration of the neuropsychological profiles of ADHD and RD has the
potential to shed more light on the genetic origins of the two disorders and their overlap.
De Jong, Oosterlaan, and Sergeant (2006) stated that, given the recent interest in
determining the genetic origins of ADHD and RD (Almasy & Blangero, 2001; Doyle et
al., 2005; Gottesman & Gould, 2003; Snowling, 2008), “it is a challenge to the field to
discover those neuropsychological deficits that are distinctive to the two disorders and
those that are common”. The emergence of distinctive neuropsychological profiles for
the ADHD and RD children investigated in this study has the potential to inform the
prevailing focal theory of each disorder. Finally, such findings also may have
nosological import as they have the potential to establish the discriminative validity of
the two disorders.
Clues to understanding each disorder can be discerned if some components of
ADHD and RD can be identified as common whilst others are seen to be unique. Single
dissociation and double dissociation studies have the potential to reveal if ADHD and
RD have different neuropsychological correlates. Single dissociation studies utilize a
single task to determine if ADHD and RD samples differ in their performance, with one
but not the other demonstrating a deficit with reference to a neurotypical control sample.
The inclusion of an ADHD+RD sample permits an assessment of whether a task deficit
identified for one of single-disorder groups is worsened with the presence of the
comorbid disorder. In double dissociation studies, ADHD and RD children are
compared for two cognitive domains, and a double dissociation is said to occur if
ADHD children only show a deficit in one domain, and RD children only show a deficit
in the other domain. Comparing the profile of the ADHD+RD group with those of the

223
exclusive (i.e., single) disorder ADHD and RD groups may then determine the etiology
of comorbidity between the two disorders.
In the quest to determine the cognitive profiles of ADHD, RD, and their comorbid
grouping, ADHD+RD, the systematic reviews earlier in the thesis focused on
investigations of five key cognitive domains. These domains were selected on the basis
of their theoretical significance in explicating each disorder. Three key domains were
derived from Barkley‟s self-control model (Barkley, 1997a) of neuropsychological
functioning in ADHD, namely memory, inhibition, and speed-of-processing. Wolf and
Bowers‟ double deficit hypothesis of RD (Bowers & Wolf, 1993; Wolf & Bowers,
1999) suggested the remaining two domains under investigation, namely phonological
awareness and rapid naming. The literature reviews covering each domain further
refined the most appropriate operationalisation of each construct and emphasized the
gaps in the literature where new and more appropriate tasks would need to be developed
to enable comparisons of performance profiles for ADHD and RD using carefully
matched task variants (e.g., refer Section 13.3 for the tasks assessing verbal and non-
verbal STM and WM).
The investigations reported in the thesis included meta-analyses, where
appropriate, and empirical studies based on a fully-crossed ADHD status x RD status
design for which rigorous sets of criteria were used in screening children. In discussing
the findings for each of the key domains in the following sections, implications for
theoretical accounts of RD, ADHD and their comorbidity will be considered.
13.1 Phonological Awareness as a Cognitive Correlate for RD and
ADHD
The single deficit hypothesis of RD posits that weaknesses in the ability to break the
sound structure of language down into smaller units and to manipulate those units are
central to the etiology of the disorder. Hence this model and focal theory suggested that
the performances of RD children will be compromised on PA tasks. The double deficit
hypothesis of RD proposes that RN makes an independent contribution to reading
beyond the contribution of PA. Results on tasks tapping PA and RN, accordingly, have
the potential to reveal RD children with PA deficits (but intact RN), with RN deficits

224
(but intact PA), or both PA and RN deficits. (However, modest sample sizes meant that
this more detailed division was not feasible in the current study.)
Several hypotheses emerged from the literature review of PA research. The first
hypothesis in the investigative study into RD, ADHD, and ADHD+RD, stated that PA
skills would be differentially impaired in children with RD and not ADHD. This
hypothesis received only partial support from the current research (see Table 13-1). The
RD and ADHD+RD groups had poorer PA scores compared to the ADHD and control
groups on the two more complex PA tasks, namely the elision and phoneme reversal
tasks, but not on the simpler blending and segmentation PA tasks. Surprisingly, the
ADHD group showed impaired performance on the segmentation task, relative to not
only the control and ADHD groups, but also the ADHD+RD group. Accordingly, this
result is difficult to interpret with reference to any theoretical accounts of ADHD and
RD.
The second hypothesis was that RD and ADHD+RD children would have greater
difficulty on the more complex PA tasks (i.e., elision and phoneme reversal) as these
tasks have increased VWM demands. This hypothesis was supported by the results of
the empirical investigation (see Table 13-1). Interestingly, the working memory burden
of these latter tasks was not as great as it may have been due to the selection of word
over nonword versions. Nevertheless, it would appear that PA deficits may only be
identified with RD if the tasks selected to operationalise PA share a common substrate
with some other construct thought to contribute to RD, such as VWM.
In conclusion, the role of all PA tasks in providing neuropsychological markers for
RD was questioned by the current research. PA has the potential to demarcate RD
groups only on complex PA tasks (i.e., elision and phoneme reversal) where VWM may
be implicated, and not on simple PA tasks (i.e., blending and segmentation). The poorer
performance of RD children on VWM tasks is supported in the following findings for
the memory domain.
13.2 Memory as a Cognitive Correlate for RD and ADHD
My investigation of immediate memory adopted a taxonomy comprising four aspects of
memory based on two dichotomies: verbal versus visuospatial, and short-term

225
Table 13-1. Mapping the neuropsychological correlates of PA in ADHD and RD.
PA Predictions Arising from the
Focal Theories of RD (Chapter 3)
Hypotheses from the Literature Review
(Chapter 5.3.1)
Outcomes from the Empirical
Investigation using the CTOPP
(Chapter 6.1.3)
Cognitive Profiling of ADHD, RD and
ADHD+RD Children Supported by the
Outcomes
Single deficit hypothesis
The performances of RD children will be
compromised on tasks tapping PA
ability.
Double deficit hypothesis
Results on tasks tapping PA and RN
ability may reveal individuals diagnosed
as RD who exhibit PA deficits (with RN
intact), RN deficits (with PA intact), or
both PA and RN deficits.
Hypothesis 1
PA ability will be differentially impaired
in children with RD and not ADHD
(unless a pattern of ADHD impairment
emerges on the more complex PA tasks).
Hypothesis 2
RD and ADHD+RD children will have
greater difficulty on the more complex
PA tasks (i.e., elision and phoneme
reversal) as these tasks make increased
demand on VWM.
Hypothesis 1
Both RD groups were impaired on
complex (but not simple) PA tasks
compared to control and ADHD groups.
The ADHD group was impaired on the
(simple) Segmentation task.
Hypothesis 2
RD and ADHD+RD children had greater
difficulty on the more complex PA tasks.
Blending
Blending tasks do not provide a cognitive
marker for RD, ADHD, or ADHD+RD.
Segmentation
While my study indicated that
segmentation tasks may provide a
cognitive marker for ADHD, this
outcome is anomalous in relation to the
broader literature.
Elision & Phonological Reversal
These more complex PA tasks may
provide cognitive markers for RD.

226
memory versus working memory. The VSTM and VSSTM tasks used in the empirical
investigation of memory were expected to index the phonological loop and visuospatial
sketchpad subsystems under Baddeley and Hitch‟s (1974) model, and the two VWM
and VSWM tasks were expected to, in addition, index central executive functioning.
Given that few studies had explored ADHD and RD functioning in this manner, a
decision was made to adapt the letter-number span task of the Wide Range Assessment
of Memory and Learning series of tests, and the letter-number sequencing task of the
WISC-IV to create suitable measures of VSTM and VWM. A parallel task to index
VSSTM was based on the Corsi task, and a suitable VSWM counterpart was created.
The review of verbal and visuospatial impairment in immediate memory in
children with ADHD showed that the most robust deficits occur in VSWM, but some
also in VWM. The same review in RD children showed deficits in VSTM and VWM
tasks, and in VSWM also (see Table 13-2).
Validation of the especially created VSTM and VSSTM memory tasks using a
dual-task methodology paved the way for their use and expansion in the primary child
study (see Appendix). In the validation study, articulatory suppression selectively
interfered with performance on the VSTM span task, and matrix tapping selectively
interfered with performance on the VSSTM span task. The selective interference
demonstrated for the two secondary tasks (i.e., articulatory suppression and matrix
tapping) supported the architectural distinction of the two domain-specific memory
slave systems (i.e., the phonological loop and the visuospatial sketchpad) and the double
dissociation that emerged supported the construct validity of the two memory tasks.
Suitable working memory versions of the same tasks were then constructed for use in
the primary study.
Drawing from the conclusions reached in the literature survey of such tasks, it was
hypothesized that ADHD children in the primary study would demonstrate greater
impairment on visuospatial than verbal tasks. It was anticipated that ADHD children,
therefore, would demonstrate shorter span scores on the VSSTM and VSWM tasks
compared to those achieved by the control group children (see Table 13-2). ADHD, RD,
and ADHD+RD children were more impaired than control children on VSSTM and

227
VSWM; however, ADHD children were not more impaired than control children on
VSTM and VWM tasks.
In contrast, RD children were expected to be more impaired on the verbal than the
visuospatial memory tasks, as evidenced by shorter VSTM and VWM span scores
compared to those achieved by the control group children. Given the findings in the
literature, it was further conjectured that RD children would demonstrate equivalent
span scores to the control group on VSSTM, but VSWM might be more impaired for
the RD group (see Table 13-2). RD and ADHD+RD children in fact performed more
poorly on verbal span measures (collapsing across VSTM and VWM scores) than both
their normally-developing peers and ADHD children. RD children also performed
worse than control group children across all four areas (VSTM, VWM, VSSTM, and
VWM).
These various data are unusual in that they emerge from a set of especially-created
tasks that achieve some parity across domains and, secondly, that they are so clear-cut
in their demarcation of specific deficits across each of the special populations. However,
a profile of contrasting performances for ADHD and RD groups across visuospatial and
verbal modalities in the way of a double dissociation failed to emerge. Both RD groups
were more impaired than the no RD groups on those tasks tapping the verbal modality,
consistent with a deficit in a subsystem like the phonological loop characterizing RD.
However, equivalent levels of deficit for the three clinical groups emerged on those
tasks tapping the visuospatial modality. Thus, a deficit in immediate serial memory for
spatial information may be common to the two disorders.
13.3 Inhibition as a Cognitive Correlate for RD and ADHD
Few studies have set out to systematically examine inhibition in a design that crosses
RD status with ADHD status. Amalgamating Barkley‟s and Nigg‟s efforts to analyse
the concept of inhibition led to consideration of those inhibition tasks falling into two
categories: (1) “executive inhibition”, concerning “the inability to delay the initial
prepotent response to an event”, indexed best by the stop signal task, and (2) “the
inability to interrupt an ongoing response”, indexed best by the Stroop task. Nigg‟s late

228
Table 13-2. Mapping the neuropsychological correlates of memory in ADHD and RD across modality and processing type.
Memory Predictions Arising from the
Focal Theory of ADHD (Chapter 2)
Hypotheses from the Literature Review
(Chapter 5.3.2)
Outcomes from the Empirical
Investigation of Memory (Chapter 8.1.4)
Cognitive Profiling of ADHD, RD and
ADHD+RD Children Supported by the
Outcomes
WM is one of the four secondary areas of
executive functioning affected under
Barkley‟s (1997b) self-control model of
ADHD.
ADHD children will evidence a pattern
of deficits on measures of nonverbal (i.e.,
visuospatial) and verbal working
memory.
Hypothesis 1
ADHD children will be more impaired on
VSSTM and VSWM tasks than on
VSTM and VWM tasks.
Hypothesis 2
RD children will be more impaired on
VSTM and VWM tasks than on VSSTM
and VSWM tasks.
Hypothesis 3
ADHD children will be more impaired on
WM than STM tasks.
Hypothesis 4
RD children will not be impaired on the
VSSTM task, but will be impaired on the
VSWM task.
Hypothesis 1
ADHD, RD, and ADHD+RD children
were more impaired than control children
on VSSTM and VSWM. ADHD children
were not more impaired than control
children on VSTM and VWM tasks.
Hypothesis 2
RD and ADHD+RD children were more
impaired on verbal tasks than the control
and ADHD children. However, the RD
and ADHD+RD children also showed
impairment relative to the control group
on the spatial tasks.
Hypothesis 3
ADHD children were equally impaired
on WM and STM tasks.
Hypothesis 4
RD and ADHD+RD children performed
worse than control children on all tasks
(i.e., the verbal and visuospatial short-
term and working memory).
A profile of contrasting performances for
ADHD and RD groups across
visuospatial and verbal modalities in the
way of a double dissociation failed to
emerge.
Evidence of a visuospatial memory
deficit common to the two disorders was
found.
Verbal tasks differentiated RD and
ADHD+RD children from ADHD and
control children, consistent with a verbal
memory deficit specific to RD.

229
selection category of tasks corresponded to Barkley‟s interference control tasks, again
best indexed by the Stroop task.
13.3.1 The Stop Signal Task
Chapters 4.3 and 8 focused on the first of the inhibition tasks, the stop signal task.
Findings in the ADHD literature pertaining to this task indicated prolonged go RTs and
longer stop signal latencies, coupled with greater overall variability in RTs. Because of
the limited data available (only one study emerged) it was not possible to speculate on
RD performance on the stop signal task (see Table 13-3). Van der Schoot et al. (2000)
did find slower go RTs, slower stop signal RTs, and greater RT variability when they
compared RD and typically-developing children. Where 2 x 2 (RD status x ADHD
status) designs have been employed (3 studies located), results were inconsistent, but
RD groups and ADHD groups were generally distinguishable from the control groups,
with the RD groups sometimes proving more impaired on the inhibition variables
explored.
The empirical chapter hypothesised that, according to Barkley‟s model of
inhibition, ADHD children would perform more poorly than their control group
counterparts on the stop signal task. Specifically, their inhibition deficit would be
characterised by intact go RT, longer stop signal RTs and increased variability. Lijffijt
et al. (2005) had suggested that disproportionately longer stop signal RTs to go RTs
were the signature evidence of an inhibition deficit. They proposed that ADHD children
will be more susceptible to variable RTs as indicated by significant differences between
ADHD and no-ADHD groups on RT variability. Inattention problems, on the other
hand, would be characterised by a combination of comparable slowing in go and stop
signal RTs, and enhanced variability in performance.
ADHD performance was compromised compared to control group performance on
the stop signal task: ADHD children were significantly less accurate in their go task
responses, there was a trend for them to show greater variability in go RTs and they also
showed a trend towards longer stop signal RTs. In follow-up analyses, ADHD and
ADHD+RD groups showed significantly longer stop signal RTs than the control group
children, but no significant group differences were found for go RTs, and only

230
marginally significant effects were found in relation to variability in go RTs. This
provides some support for an inhibition deficit in ADHD.
Secondly, given the findings in the literature (e.g., van der Schoot et al., 2000;
Purvis & Tannock, 2000; Willcutt, Pennington, et al., 2005), it was hypothesized that
the two RD groups (i.e., RD, ADHD+RD) would also show some inhibition deficits as
signaled by longer stop signal RTs, but it was difficult to speculate beyond this due to
the variability in results across those few studies examining the populations of interest
in a 2 x 2 design. Surprisingly, RD children showed greater variability in go RTs than
no-RD children, less accuracy on the go portion of the task (eliciting more errors of
omission and more response errors than no-RD children), and longer stop signal RTs
than no-RD children.
Lijffijt et al.‟s (2005) assertion that a higher instance of lapses of attention would
be signaled by slower average responding to go stimuli, and slower average stopping, as
well as higher variability of responding fitted the profile of deficits shown by RD
children. It was concluded that RD children are likely to have a combination of
inattention and inhibition deficits driving their poorer performances on the stop signal
task.
Given the equiprobable occurrence of go and stop trials in the primary child study,
it is possible that the increased frequency of stop signals allowed the ADHD child to
respond more consistently to task demands. Alternatively, the area of investigation
know as „goal neglect‟ proposes that the higher frequency of the stop signal occurrence
may have allowed RD and ADHD children to maintain their goal more easily and so to
more efficiently inhibit responses when required.
In summary, the stop signal task has not yielded a unique neuropsychological
correlate for ADHD as there was a more definite trend for RD children to be associated
with impairment across most stop signal measures. The findings indicated a
predominant inhibition deficit for children with ADHD, with indications that inattention
has some impact on their poorer performances on the stop signal task. There was a
further conclusion that a predominant inattention deficit characterises the poorer
performances of RD children on the stop signal task, with some evidence of an
inhibition deficit also having impact. These findings would appear to be supportive of a

231
Table 13-3. Mapping the neuropsychological correlates of inhibition in ADHD and RD using the stop signal task.
Stop Signal Task Predictions Arising
from the Focal Theory of ADHD
(Chapter 2)
Hypotheses from the Literature Review
(Chapter 5.3.3)
Outcomes from the Empirical
Investigation using Stop Signal Task
(Chapter 9.2)
Cognitive Profiling of ADHD, RD and
ADHD+RD Children Supported by the
Outcomes
Behavioural disinhibition is the
overarching executive dysfunction in
Barkley‟s (1997) model of self-control.
Behavioural inhibition includes the
ability to stop a prepotent response.
Thus, ADHD children will be
compromised on inhibition tasks such as
the Stroop task.
Hypothesis 1
Based on an inhibition deficit, ADHD
children will demonstrate
disproportionately longer stop signal RTs
than control children, with intact go RT.
Hypothesis 2
If poor ADHD children stop signal
performance is attributable to an
attentional deficit, ADHD children will
demonstrate longer go and stop signal
RTs, with greater variability in go RT
due to inattention.
Hypothesis 3
RD and ADHD+RD children may show
some inhibition deficits; i.e., longer stop
signal RTs. However, the RD profile is
otherwise unknown.
Hypothesis 1
ADHD children showed a trend towards
longer stop signal RTs than controls, and
there was no evidence of go RT
differences.
Hypothesis 2
ADHD children showed a trend towards
longer stop signal RTs, less accuracy on
the go task, and showed a trend towards
greater variability in go RT relative to
control children, suggesting a
predominant inhibition deficit.
Hypothesis 3
RD and ADHD+RD children showed
more variable go RTs, less accuracy on
the go task, and longer stop signal RTs
than their no-RD peers, suggesting a
range of inattention and inhibition
problems.
The validity of the stop signal task as a
unique cognitive marker for ADHD is
called into question by these results.
Equivalent performances by the three
clinical groups in terms of more variable
go RT and longer stop signal RT is
suggestive of a common etiology.

232
common etiology account for the two disorders. Barkley‟s view of inhibition (1997a,
1997b) as an ADHD-specific phenomenon is also called into question by these results.
13.3.2 The Stroop Task
It was hypothesized firstly that, if Barkley‟s theory of inhibition held, then ADHD
children would be more impaired on their calculated interference scores for the Stroop
than the control group of children (see Table 13-4). ADHD children were, in fact, not
more impaired than the control children for the interference scores in the primary child
study. Indeed, ADHD children were impaired relative to control children on the all three
of the standard Stroop conditions.
Alternatively, according to the second hypothesis, if the meta-analytic findings of
van Mourik et al. (2005) bore weight then ADHD children should be impaired relative
to control group children on all three of the standard Stroop conditions. Since this
pattern of results was observed in the child study, these findings suggest that
impairment on Stroop performance for ADHD children is better attributed to slowed
naming performance rather than to inhibition. (Slowed naming performance might, in
turn, be attributable to slowed general slowing processing speed.)
Thirdly, in terms of their performance on the negative priming condition, it was
presumed that ADHD children would be less able to suppress the distracter information
on the prime trial which would in turn facilitate their performance on the probe trial
(though results in the literature survey proved somewhat equivocal on this point). In
results similar to those outline by Pritchard et al. (2007), the main child study failed to
demonstrate any difference between the results of the ADHD and control group children
on negative priming. However, it would be premature to argue that the negative priming
effect is intact for ADHD children since the negative priming condition was not more
difficult than the colour-word condition across all participants, which questions the
validity of this test of negative priming.
In relation to RD performance on the Stroop task, firstly it was hypothesized that,
given RD children are presumed to be less automatised in their reading skills, this
population might be expected to show less interference than ADHD and control group
children on the colour-word condition. RD children in the primary child study did not

233
prove to be less susceptible than ADHD or control group children on the colour-word
condition. In fact, like their ADHD counterparts, RD children showed generalized
slowing (suggesting a possible naming speed deficit, or even a more generalized
processing speed deficit) across all three standard Stroop task conditions. Whilst no
hypotheses were formulated regarding the performance of RD children on the
introduced negative priming condition, both RD groups performed worse than the
control group on this condition, suggesting that the negative priming effect may be
intact for these two groups of children, however, the reservation voiced above in
relation to the validity of the negative priming condition prevents drawing any definitive
conclusion.
In summary, the current study failed to demonstrate that the Stroop task can
provide a satisfactory marker for any of the special populations of interest. Instead, a
naming speed deficit represents a more likely candidate to explain the slowed results
achieved by each of the clinical groups across all four Stroop conditions. A Stroop
Brinley plot analysis was undertaken to determine if slowed naming provides a more
parsimonious account of the findings for each of the clinical populations, and
processing speed was further investigated in a later chapter.
Novel Brinley plot meta-analyses were completed to investigate the potential role
of slowed speed of processing in cognitive impairment associated with ADHD and RD.
By mapping the RT data of one group of respondents against the data of another group
in Brinley space, it is possible to determine whether the effect of another variable has an
effect specific to one of the groups (Spirduso et al., 2005). The proportional slowing
model (proposed in this thesis as an alternative account for the SCWT and RN results
obtained for the special populations of interest) proposes that both ADHD and RD
children will demonstrate longer latencies, by a constant factor, than control group
children to complete each step of each naming condition. Accordingly, more complex
tasks involving a greater number of processing steps should result in a proportionate
increase in response latencies for each special population relative to control group
performance. Regression analyses of ADHD and RD children‟s mean RTs as a function
of control group mean RTs for the SCWT conditions should, therefore, reveal a linear
relationship, with a slope greater than one, consistent with proportional slowing.

234
Table 13-4. Mapping the neuropsychological correlates of inhibition in ADHD and RD using the Stroop task.
Stroop Task Predictions Arising from the
Focal Theory of ADHD (Chapter 2)
Hypotheses from the Literature Review
(Chapter 5.3.3)
Outcomes from the Empirical
Investigation using the Stroop Task
(Chapter 10.2)
Cognitive Profiling of ADHD, RD and
ADHD+RD Children Supported by the
Outcomes
Behavioural disinhibition is the
overarching executive dysfunction in
Barkley‟s (1997) model of self-control.
Behavioural inhibition includes
interference control (i.e., the ability to
resist disruption by competing events or
responses).
Thus, ADHD children will be
compromised on inhibition tasks such as
the colour-word condition of the Stroop
task.
Hypothesis 1
Based on Barkley‟s theory, ADHD more
impaired on interference scores and on
the colour-word condition in particular,
relative to controls.
Hypothesis 2
If RN (not inhibition) is the primary
deficit in ADHD, ADHD group will be
impaired across the 3 Stroop conditions.
Hypothesis 3
ADHD groups will show less negative
priming than no-ADHD groups.
Hypothesis 4
RD groups (due to poorer reading) will
perform more poorly than no-RD groups
on the word condition. RD groups may
also show a deficit on the colour
condition, but not on the colour-word
condition.
Hypothesis 1
ADHD were impaired on all 3 standard
Stroop conditions (word, colour, and
colour-word) relative to controls. ADHD
were not more impaired on interference
scores than controls.
Hypothesis 2
ADHD were impaired across all three
Stroop conditions, suggesting an RN
deficit, rather than an inhibition deficit.
Hypothesis 3
ADHD and control performance was
equivalent on the negative priming
condition.
Hypothesis 4
RD children were impaired on the word,
colour, and colour-word conditions.
Both RD and ADHD+RD performance
was impaired compared to controls on the
negative priming condition.
The validity of the Stroop task in
providing a unique cognitive marker for
ADHD is called into question by these
results.
In line with the results from a Stroop
Brinley plot analysis of the literature, the
current study indicated little support for
an interference control deficit in ADHD.
Generalized slowing was instead
indicated in ADHD, RD, and ADHD+RD
results on all three standard SCWT
conditions, based on both a Brinley plot
analysis of the literature and the results
from the current study.
Since the negative priming condition was
not more difficult than the colour-word
condition, the Stroop task does not
appear to offer a robust paradigm for
investigating negative priming.

235
When the available ADHD Stroop task data from the literature were assessed in
this manner, using 18 sets of data from 14 studies, a strong linear relationship between
ADHD and control group data was revealed, with an inflation of 27% in ADHD
latencies indicating a substantial difference in naming speed for the two populations
under scrutiny. With just one exception, the slopes of these functions were greater than
one, and the mean of these slope values differed significantly from unity. Moreover, the
deviation of the colour-word datum point from the regression line was generally small
and the mean deviation was greater than zero only when a large negative deviation was
excluded, lending, at best, only limited support for the inhibition theory.
When the RD data for the SCWT in the literature was surveyed in the same
fashion, 7 available data sets were identified and, again, a linear relationship was
revealed (across at least 5 of the data sets), with an approximate 27% inflation in RD
latencies, indicating a difference in naming speed for the RD and control group
populations. The slopes of these functions were greater than one in all instances, and the
mean of these slope values differed significantly from unity. Moreover, the deviation of
the colour-word datum point from the regression line was small in all but two instances,
discounting an inhibition account of SCWT performance for the RD population. When
the ADHD+RD data were treated to the same Brinley plot analyses across the four
available data sets, a 30% slowing factor emerged, with strong linearity across all data
sets.
Finally, mapping the results for the primary child study in Brinley space showed
that a linear function described the sets adequately. All slopes were greater than one and
the deviation of the colour-word point from the regression line was minimal. In
summary, there is little evidence to support the notion of an inhibition deficit in ADHD
and, in particular, little evidence of an interference control deficit in ADHD. Rather,
generalized slowing was manifest in the ADHD, RD, and ADHD+RD results on all
three standard Stroop task conditions, both within the literature covered and in the
primary child study.
236
13.4 Rapid Naming as a Cognitive Correlate for RD and ADHD
Continuous RN tasks were included in the child study because they use some of the
same processes involved in reading. Performance on RNC tasks have been shown to
make a unique contribution to predicting reading proficiency, even when results for
discrete RN tasks have been taken into account (Bowers & Swanson, 1991). The
alphanumeric RNC conditions (RNC-Letter, RNC-Number) are good predictors of
single word reading (Denckla & Cutting, 1999). The nonalphanumeric RNC stimuli
(RNC-Colour, RNC-Object) are considered less predictive of reading success after the
kindergarten years (e.g., Neuhaus et al., 2001). Letters and numbers become more
automated (i.e., faster to name) than colours and objects after the start of formal
schooling (e.g., Wolf et al., 1986). Because numbers and letters are named at the same
rate and because letter-naming more closely approximates the laying down of Perfetti‟s
alphabetic code, a letter-naming condition was favoured for the child study over its
number-naming counterpart in both RNC and RND task conditions.
It was hypothesised that RD and ADHD groups would be more impaired than
control group children on all RNC conditions. The results of the child study confirmed
this first hypothesis in that all three clinical groups were impaired in their performance
for all conditions (Letter, Colour, and Object) of the RNC task, relative to control group
performance. The same pattern of group differences was observed for the RND task.
Paulik et al.‟s (2003) meta-analytic findings suggested that there would be
differential findings for a fully-crossed design, varying according to the stimulus type:
the RD population should be more impaired for graphological stimuli than for
nongraphological stimuli, but in contrast, ADHD children should be more impaired on
nongraphological stimuli than graphological stimuli. A new meta-analysis of the data
from 22 studies was conducted to better substantiate the unpublished findings of Paulik
et al. (2003). The profile of RN deficits for ADHD and RD that emerged suggested RD
children are indeed more impaired on graphological than nongraphological stimuli,
whereas there was a trend suggesting that ADHD children are more impaired on
nongraphological than graphological stimuli. This directional difference prevailed on
the RNC conditions (refer Figure 10-1), but did not reach statistical significance in the

237
Table 13-5. Mapping the neuropsychological correlates of RN in ADHD and RD using the RNC task.
RNC Predictions Arising from the Model
and Focal Theories of RD
(Chapter 3)
Hypotheses from the Literature Review
and Anticipated Outcomes
(Chapter 5.3.4)
Outcomes from the Empirical
Investigation using the RNC Task
(Chapter 12.1.3)
Cognitive Profiling of ADHD, RD and
ADHD+RD Children Supported by the
Outcomes
Double deficit hypothesis
Results on tasks tapping PA and RN
ability may reveal individuals diagnosed
as RD who exhibit PA deficits (with RN
intact), RN deficits (with PA intact), or
both PA and RN deficits.
Hypothesis 1
RD and ADHD groups will be more
impaired than control group children on
all RNC conditions.
Hypothesis 2
Graphological stimuli will be named
faster overall than nongraphological
stimuli.
Hypothesis 3
RD children will be more impaired on the
graphological task (i.e., letter condition)
than non-graphological tasks (i.e., colour
and object conditions).
Hypothesis 4
ADHD children will be impaired on all
RNC conditions (graphological and
nongraphological).
Hypothesis 5
ADHD+RD children are expected to
demonstrate the same pattern of deficits
as RD children (rather than ADHD
children).
Hypothesis 1
The control group performed better than
RD, ADHD, and ADHD+RD groups on
all RNC and RND conditions.
Hypothesis 2
Graphological items were named faster
than nongraphological items by all groups
for the RNC conditions.
Hypothesis 3
RD children were impaired to a similar
extent across all conditions.
Hypothesis 4
ADHD children were impaired to a
similar extent across all conditions.
Hypothesis 5
ADHD+RD children produced results
indistinguishable from those of the RD
and ADHD groups.
The validity of RN tasks as a unique
cognitive marker for RD is called into
question by these results.
The equivalency of the results across RD,
ADHD, and ADHD+RD groups provides
support for the common etiology
hypothesis.

238
Table 13-6. Mapping the neuropsychological correlates of ADHD and RD in RN using the RND task.
Predictions Arising from the Model and
Focal Theories of RD (Chapter 3)
Hypotheses from the Literature Review
and Anticipated Outcomes (Chapter
5.3.4)
Outcomes from the Empirical
Investigation using the RND Task
(Chapter 12.1.3)
Cognitive Profiling of ADHD, RD and
ADHD+RD Children Supported by the
Outcomes
Double deficit hypothesis
Results on tasks tapping PA and RN
ability may reveal individuals diagnosed
as RD who exhibit PA deficits (with RN
intact), RN deficits (with PA intact), or
both PA and RN deficits.
Hypothesis 1
RD children will be impaired on all RND
conditions relative to control group
performance.
Hypothesis 2
Given that some researchers propose that
RNC tasks tap executive processes,
ADHD children may be more likely to be
disadvantaged by RNC than RND
conditions.
Hypothesis 3
RD children are speculated to produce
slower RTs in naming targets on RNC
than RND conditions.
Hypothesis 1
RD, ADHD, and ADHD+RD children
were more impaired than the control
group across all RND conditions.
Hypothesis 2
ADHD children were more impaired than
control group children across all RNC and
RND conditions.
Hypothesis 3
RD children were more impaired than
control group children across all RNC and
RND conditions.
The validity of RN tasks as a unique
cognitive marker for RD is called into
question by these results.
The equivalency of the results across RD,
ADHD, and ADHD+RD groups provides
support for the common etiology
hypothesis.

239
analyses. However, as Figure 13-2 shows, the ADHD group performed the worst
(though, again, not statistically so) across all conditions on the RND conditions. The
literature would also suggest that ADHD samples would be slower than RD samples on
the RNC-Colour condition, but results would be analogous for the RNC-Object
condition. As previously discussed, this was not borne out by the results, the clinical
groups proving indistinguishable across all conditions. Additionally, it was
hypothesized that ADHD and RD samples would be significantly slower than the
control group samples across all four RNC classes of stimuli; this hypothesis was
supported by the RNC empirical findings.
In the literature review it was argued that RND tasks provide a purer index of
processing speed because of the removal of extraneous variables. Results across RND
studies are very inconsistent. Few studies exist that have used the same subset of RND
tasks, the same age ranges, sample sizes, etc. Still fewer have tracked the performance
of RD or ADHD children across both RND and RNC tasks. When RD samples have
included children with more severe reading difficulties, and the same samples have been
tested across RND and RNC versions of the RN task, the RD population has been found
to be differentially impaired when their scores were compared to those of the control
groups on RND tasks. There has been no parallel RND study conducted for the ADHD
population. The current research indicated that the ADHD population was impaired
across both RND and RNC conditions.
Given the impairment of all three clinical groups relative to control group
performance across both versions of the RN task (i.e., continuous and discrete), this
research reinforces the findings from the Stroop Brinley plot analysis: children with
ADHD and RD show a generalized slowing across speeded tasks. This may have its
locus in naming, or may be a more basal speed of processing concern.
13.5 Speed-of-Processing as a Cognitive Correlate for RD and ADHD
Serial visual search tasks, along with the Coding task of the WISC-IV, showed promise
in the demarcation of ADHD and control group children. The pattern of deficits for the
RD and ADHD+RD populations were confused, partly because of methodological
variations across studies. This literature review led to the conclusion that a new

240
Table 13-7. Mapping the neuropsychological correlates of SOP in ADHD and RD.
SOP Predictions Arising from the Focal
Theory of ADHD (Chapter 2)
Hypotheses from the Literature Review
(Chapter 5.3.2)
Outcomes from the Empirical
Investigation
(Chapter 8.1.4)
Cognitive Profiling of ADHD, RD and
ADHD+RD Children Supported by the
Outcomes
SOP comes under the last domain
signposted for consideration in Barkley‟s
model of ADHD: that of motor control,
fluency, and syntax (or behavioural self-
regulation).
Deficits in motor control and fluency will
lead to reduced output, delayed responses,
hesitancy, and slowed RTs in individuals
with ADHD (Anderson, 2002).
Hypothesis 1
RD children will perform less well on
those visual search tasks with a linguistic
basis.
Hypothesis 2
ADHD children will demonstrate poorer
performance relative to control group
children on those visual search tasks that
do not have a linguistic foundation.
Hypothesis 1
All 3 clinical groups (RD, ADHD, &
ADHD+RD) performed significantly
more poorly on the verbal SOP condition
than the control group.
Hypothesis 2
Contrary to expectations, the two RD
groups (RD, ADHD+RD) performed
significantly worse on the visuospatial
SOP condition than both the control and
ADHD groups.
A profile of contrasting performances for
ADHD and RD groups across
visuospatial and verbal modalities in the
way of a double dissociation failed to
emerge.
Equivalent deficits for ADHD, RD, and
ADHD+RD groups were demonstrated on
the verbal SOP condition.
Both reading groups (RD & ADHD+RD)
were significantly impaired in their
performance on the visuospatial SOP
condition relative to the performance of
the control and ADHD groups.

241
measure separating linguistic and nonlinguistic stimuli should be created to discern the
pattern of deficits pertaining to each special population.
On the verbal SOP condition, the control group outperformed all three clinical
groups. On the spatial SOP condition, the control group children only outperformed the
two reading impaired groups. These results are not consistent with any of the proposed
hypotheses.
Deficits on speeded tasks (e.g., RN, Stroop, stop signal, SOP tasks) may be a
possible shared cognitive risk factor in ADHD and RD (e.g., Shanahan et al., 2006;
Willcutt, Pennington, et al., 2005), which would partly explain some of their
comorbidity. However, the profiles of performance of ADHD and RD groups on the
linguistic and nonlinguistic components of SOP diverged, suggesting SOP was not be
unitary construct.
13.6 Towards an Endophenotypy of ADHD and RD
There has been a concentrated effort since the publication of Pennington et al.‟s (1993)
paper to determine the endophenotypy of ADHD and RD. Johanssen (1903) first
distinguished between the concept of a genotype, the genetic makeup of an individual,
and a phenotype, the expressed features of the genotype of an individual. A phenotype
represents the observable characteristics of an individual, the joint product of both
genotypic and environmental influences (Andreasen, 2005). Endophenotypes are the
biological marker(s) of a particular brain disorder (Kroptov, 2009). The term was first
coined for use in psychiatric genetics by Gottesman and Shields in 1972. An
endophenotype is less obvious (i.e., not visible to the naked eye) than a phenotype; it is
an internal, intermediate, and heritable subtype of the phenotype, and is hypothesized to
lie within the etiological link between genes and clinical disease or disorder (Beyer,
2010; de Jong et al., 2006; Rao & Gu, 2008).
Endophenotypes represent changes on a more basal level than actual identification
of the genes involved in a particular disorder (e.g., measurable changes in brain
functioning). Thus, endophenotypes define features related to the disorder rather than
the genes themselves (O‟Moldin & Rubenstein, 2006). An endophenotype of a disorder
can be any measurable feature (i.e., cognitive, behavioural, structural, etc.). The

242
endophenotype sought in this discovery is a cognitive marker(s) of ADHD or RD20
.
Several hypotheses can be advanced in relation to the particular endophenotypy of a
disorder: the phenocopy hypothesis, the common etiology hypothesis, the cognitive
subtype hypothesis, and the three independent disorders hypothesis.
The phenocopy hypothesis presupposes that one disorder will prove primary and
the other secondary in terms of its influence on the comorbid group; hence, the
comorbid group‟s profile will prove more similar to one of the single disorder groups.
Pennington et al. (1993), for example, proposed that ADHD+RD children do not
demonstrate the core deficits of ADHD, but simply display the behavioural problems
(e.g., inattention) that develop as a secondary consequence of their reading problems.
Thus, according to the phenocopy hypothesis, each of the single disorder groups (i.e.,
RD-only, ADHD-only) would need to emerge from a classical double dissociation
design study with contrasting profiles on a particular domain (e.g., RD on PA, and
ADHD on measures of executive functioning), demonstrating that each domain is
considered central to the underpinning of one disorder and not the other. (This would,
necessarily, also validate the core theories proposed for each disorder.) If the
ADHD+RD group demonstrated deficits on measures of PA, but not on executive
functioning measures, then they may be said to demonstrate the behavioural symptoms
of ADHD, but not the executive functioning deficits thought to be common to that
disorder. Hence, the phenocopy hypothesis actually refers to a symptom phenocopy
hypothesis. Where less clear-cut results emerge (i.e., where an interaction surfaces), it is
then possible to clarify the nature of the comorbidity of ADHD and RD; that is, to test
which disorder contributes most significantly to outcomes on the criterion variable for
the comorbid ADHD+RD group. The outcome results on the PA tasks from the CTOPP
used in the primary study are suggestive of support for the phenocopy hypothesis, in
20 An alternative non-random mating hypothesis of endophenotypy was first proposed by Farone et al.,
1993. This hypothesis states that partners of ADHD adults have significantly higher rates of RD than
partners of those without ADHD, and that the two disorders were then genetically transmitted to progeny.
Friedman, Chhabildas, Budhiraja, Willcutt, and Pennington (2003) dismissed this argument in a large
twin study indicating that cross-assortment of RD and ADHD was not significantly different than chance
levels, and that cross-assortment partners did not contribute to the production of comorbid progeny more
than would be expected by chance.

243
that the complex PA tasks show a single deficit association for RD; the presence of
ADHD, however, appears to lessen the impact for the ADHD+RD group who actually
performed better than the RD group on both these tasks.
However, the extant literature and the results from the primary child study from
this thesis suggest that the two disorders are characterized more by communality than
uniqueness. Given that ADHD is more commonly portrayed as a frontal lobe
dysfunction and RD more commonly portrayed as a planum temporale dysfunction (de
Jong, Oosterlaan, & Sergeant, 2006), it is all the more difficult to reconcile superficially
equivalent performances on standard laboratory cognitive tasks than otherwise. The
common etiology hypothesis, however, is an alternative endophenotypy account based
on the supposition that the two disorders possess a common genetic basis and is
supported when equivalent outcomes are present for all three groups (de Jong et al.,
2006; refer, for example, Willcutt, Pennington et al., 2005, where ADHD, RD, &
ADHD+RD groups produced deficits in SOP of similar magnitude, suggesting SOP was
a shared risk factor for ADHD and RD). Viewing the outcomes from the primary study
from an endophenotypy perspective, equivalent outcomes were obtained for the three
clinical groups (i.e., ADHD, RD, & ADHD+RD) on the VSSTM and VSWM tasks, the
stop signal inhibition task, all three standard conditions of the Stroop employed (i.e.,
letter, colour, & object), and the verbal SOP condition.
The cognitive subtype hypothesis of endophenotypy, on the other hand, states that
the presence of the comorbidity suggests an additive incremental effect of any
dysfunction, such that the deficits in performance are greater for the ADHD+RD group
than either of the single disorder groups (Nigg et al., 1998; Reader et al., 1994; Willcutt
et al., 2001). There was little support garnered for this hypothesis in the results for the
current study.
Finally, the three independent disorders hypothesis of endophenotypy (Pennington,
2006) presupposes that ADHD+RD is a disorder distinct from the two „pure‟ single
disorder groups, ADHD and RD (e.g., Hall, Halperin, Schwartz, & Newcorn, 1997).
Again, the current study provided little support for the three independent disorders
hypothesis.

244
13.7 Clinical and Educational Implications for the Thesis Findings
The current research findings indicate that ADHD and RD children may have problems
with phonological awareness, working memory, response inhibition, rapid naming, and
speed-of-processing. This confluence of problems may contribute to impairments in
academic achievement and contribute to problems with inattention and problems with
impulsivity. Identifying problems in phonological awareness, memory, inhibition, rapid
naming, and speed of processing can help educators and caregivers understand a child‟s
difficulty in academic work and community activities.
Behavioural intervention to address each area of deficit requires specific focus.
For example, deficient PA abilities of children with RD have been remediated by
treatment programs by Lovett et al. (1994) and Olson and Wise (1992). Klinberg,
Forssberg, and Westerberg (2002) have developed a computerised working memory
training program where task difficulty was closely matched to the child‟s performance
and adjusted over time. Children with inhibition deficits may benefit from the Cognitive
Remediation Program (Butler, 2007), adapted from brain injury rehabilitation (Butler &
Copeland, 2002; Butler & Mulhern, 2005). The RAVE-O (Retrieval, Automaticity,
Vocabulary Elaboration, Orthography) reading intervention program developed at Tufts
University was specifically designed to address naming-speed deficits in severely
impaired readers (Wolf et al., 2009). Finally, speed-of-processing remediation training
has been used with older adults (Vance, Keltner, McGuinness, Umlauf, & Yuan, 2010),
and adaptations of some of the tasks for younger populations seems feasible.
In terms of clinical diagnosis, the current research has implications for the
screening of either disorder. As part of assessing for ADHD or RD, it is important to
exclude the presence of the other disorder. It is difficult to determine, however, whether
the presence of ADHD symptomatology exacerbates reading problems, or if the
presence of RD problems exacerbates ADHD symptomatology.
13.8 Limitations of the Current Design
The current results should be interpreted in the light of several limitations. It might be
considered (e.g., Willcutt, Pennington, et al., 2005) that artifactual comorbidity might
result from sampling bias. However, RD and ADHD co-occur at a greater frequency

245
level than that indicated by chance in both clinic-referred and community-referred
samples (Willcutt, Pennington, et al., 2005). The current design uses a community-
referred sample with an existing pediatric diagnosis in the case of the ADHD sample,
and a significant history of reading problems in the case of the RD sample. The
ADHD+RD sample uses a community-referred sample with an existing pediatric
ADHD diagnosis, plus a significant history of reading problems also. Children in the
RD and ADHD+RD samples also had a reading age that lagged at least 1.5 years behind
their chronological age on the WRMT-R (Woodcock, 1987, 1998) total reading full
scale cluster.
As for rater bias, it is noteworthy that one of the sampling criteria for the ADHD
sample used in the primary study was that these children needed to be pediatrically
diagnosed for consideration. Both parent and teacher ratings were used to confirm the
existing pediatric diagnosis. The criterion of previous pediatric diagnosis mitigates
against parent or teacher bias in this particular instance.
Although the sample sizes of children were adequate for conducting the various
domain investigations, as attested by the many significant differences reported, the
ADHD and ADHD+RD groups were not of sufficient size to allow for the
differentiation of ADHD subtypes in a meaningful way that could be incorporated into
the analyses. Limited sample sizes also prevented any attempt to try to differentiate RD
children according to the three possible subgroups proposed under the double-deficit
hypothesis. Any future research mandates the investigation of the suggested correlates
across larger sample sizes to facilitate investigations allowing for a more fine-tuned
differentiation of the target groups.
The ADHD groups also included a large proportion of ADHD-PI [9 of the 16
(56%) males in the ADHD group, and 10 of the 14(71%) males of the ADHD+RD
group were classified as ADHD-PI]. Given that the ADHD-PI subtype is over-
represented in the samples, it should be bourne in mind that this uneven weighting may
have predisposed the findings to a positive finding for slowed speed of processing.
Recall that Barkley (p. 9, Chapter 2 of the thesis) notes that ADHD-PI may be
characterized by deficits in speed of processing. Nevertheless, the meta-analytic

246
findings for deficits in speed of processing for all ADHD subtypes (Stroop chapter) do
suggest that this limitation may not be confined to the ADHD-PI subtype.
Kaplan, Crawford, Wilson, and Dewey (1997) found the level of comorbidity
between Developmental Coordination Disorder (DCD), ADHD, and RD to be high:
nearly 25% of their sample were found to carry all three diagnoses, while 10% had both
ADHD and DCD, and 22% had reading disorder and DCD. All children in the current
thesis had had a pediatric diagnosis for ADHD assigned. The standard workup for
ADHD clinical diagnosis does include checking for subtle neurological soft signs,
including a brief examination of motor coordination. For example, an informal screen
for DCD involves asking the child to hop, jump, or stand on one foot (to test gross
motor coordination), finger-tap or tie shoelaces (to test fine motor coordination), or
catch a ball or copy letters (to test for hand-eye coordination (Sadock, Kaplan, &
Sadock, 2007). All children in the current thesis had had a significant history of reading
problems for a diagnosis of RD to be assigned. Teaching staff were able to supply
additional information as the SNAP-IV and SDQ information was collected; in this
way, a student with comorbid DCD (also known as dyspraxia) was excluded from
further testing. It is difficult, though, within the confines of the current thesis, to rule out
comorbid DCD and its purported impact on any of the populations of interest. As Gilger
and Kaplan (2001) attest “in developmental disorders comorbidity is the rule not the
exception”. The DCD comorbidity aspect, though, warrants further intensified research
effort.
Finally, the memory validation study listed (see the Appendix study) used young
adults as its target population. These results, however, may not be generalisable to
children, and may not be generalisable to children with atypical development such as
the special populations of interest, namely ADHD and RD children.
13.9 Conclusions
The current study does provide limited support for the double deficit hypothesis of RD.
PA measures from the more complex tasks thought to carry a higher WM load did
discriminate the RD and ADHD+RD samples form the ADHD and control samples,
providing limited support for the phenocopy hypothesis. RN measures, in either

247
continuous or discrete formats, failed to distinguish the clinical groups from one
another, indicating that the two disorders may share a common etiology. Given the
significant genetic overlap between ADHD and RD (Light, Pennington, Gilger, &
DeFries, 1995; Stevenson, Pennington, Gilger, DeFries, & Gillis, 1993; Willcutt,
Pennington, & DeFries, 2000), it is not really surprising that both the inhibition and
rapid naming domains yielded a pattern of neuropsychological deficits common to the
two disorders. The non-specificity of RNC and RND deficits was highlighted by the
inability of these differing versions of the RN task to differentiate any of the populations
of interest.
The current study also provided only limited support for Barkley‟s self-control
model of ADHD. Equivalent performances on the VSSTM and VSWM tasks suggest
that differences in visuospatial immediate memory do not demarcate the ADHD and RD
populations. VSTM and VWM tasks, on the other hand, still show some promise, RD
children performing significantly worse on these tasks than both their control and
ADHD peers.
Both inhibition tasks, the stop signal task and the standard Stroop task, failed to
differentiate ADHD and RD children. All three clinical groups were equally impaired
on both tasks relative to control group performances.
On the final domain investigated in relation to Barkley‟s model of self-control, that
of behavioural self-regulation, SOP was used as an index of motor control, fluency, and
syntax. The three clinical groups were indistinguishable in their performance on the
SOP verbal condition, though they all had significantly slower RTs than control group
children. Different performance profiles did emerge, however, for the two reading
disordered groups (RD, ADHD+RD) on the SOP spatial condition, both groups showing
significant impairment when their RTs were compared to those of the control and
ADHD groups. This difference in profile, however, was not the difference represented
in the hypotheses developed from the literature, which was that longer latencies for RD
children should emerge on those tasks employing lexical stimuli, and longer latencies
for ADHD children should emerge on those tasks employing nonlexical stimuli.
This is one of a handful of studies that examines ADHD and RD from a
comprehensive executive functions and cognitive processing perspective. The results

248
from the current study question the specificity of some of the standard measures said to
demarcate RD or ADHD children from their typically developing peers. The results
suggest that complex phonological awareness, verbal memory, and visuospatial speed-
of-processing may be cognitive markers for RD. In contrast, visuospatial memory,
naming speed (as indexed by the Stroop task, and continuous and discrete rapid naming
tasks), and verbal speed-of-processing may be common markers for ADHD and RD. It
should be noted that, whilst both ADHD and RD populations produced performance
deficits on the stop signal task relative to control group performance, this task appeared
to index predominantly inhibition (and some attention) deficits for the ADHD
population, and predominantly inattention (and some inhibition) difficulties for the RD
population.
The quest to investigage a particular phenotypy of ADHD and RD ended with the
conclusion that the cognitive profile for the two disorders is characterised more by
communality than uniqueness.

249
Appendix: An Empirical Validation of Memory Measures
Pilot testing of two memory span tasks especially created for the primary child study
was conducted to assess their construct validity. The functional dissociation of the
verbal and visuospatial short-term memory systems each task purported to tap was
explored by means of a classical dual-task interference methodology. The logic of this
methodology is that, if a primary task and a range of secondary (or interference) tasks
are performed concurrently, and the secondary tasks are differentially involved with
distinct cognitive modules, then performance of the primary task will be more impaired
when the secondary task relies on the same underlying cognitive module as the primary
task, than when the secondary task draws on the resources of another cognitive module
(Shallice, 1979; Klauer & Zhao, 2004; Zhao, 2004).
As outlined earlier, Baddeley (1986) has proposed that WM includes separate
subsystems specializing in the retention of verbal and visuospatial information. The
current design therefore employed two primary memory tasks (one verbal, one
visuospatial), crossed with three secondary task conditions (no interference, articulatory
suppression, and matrix tapping). Of interest was the impact of these three secondary
tasks when they intervened between the encoding and retrieval phases for each primary
task.
The verbal primary task required standard forward recall of aurally presented
letter-number sequences. In contrast, the visuospatial primary task required forward
recall of sequences of locations presented in a visual layout. When administered in
isolation, each primary task was followed by an 8s retention level filled with syncopated
tones (16 tones delivered at a rate of 2 per s). No additional activity was linked to the
tones in the no interference secondary-task condition. The articulatory suppression
secondary-task condition involved repeating aloud a predictable sequence of numbers in
time with the syncopated tones used in the no interference condition (Murray, 1967).
The matrix tapping secondary condition involved the tapping of a predetermined
visuospatial pattern, again in time to the consistent beat emitted by the computer
(Farmer, Berman, & Fletcher, 1986).

250
1.0 Method
1.1 Experimental Design and Hypotheses
The present study used a repeated-measures design with two factors: (a) memory task
(verbal, visuospatial); and (b) interference task (no interference, articulatory
suppression, matrix tapping). The combination of these factors yielded six experimental
conditions. The order of presentation of the six experimental conditions was
counterbalanced across participants.
It was hypothesized, firstly, that performance on the verbal span task would be
more impaired by articulatory suppression than by matrix tapping because performance
of the primary verbal short-term memory task and the secondary articulatory
suppression task should be mediated by and compete for the resources of the
phonological loop, with the load of the secondary task on the articulatory rehearsal
process limiting the role of this process in the primary task and undermining the
maintenance of the verbal sequence (see, e.g., Baddeley & Andrade, 2000; Baddeley,
Lewis, & Vallar, 1984; Chincotta & Underwood, 1997; Milner, Jeeves, Ratcliff, &
Cunnison, 1982). Conversely, the second hypothesis was that performance on the
visuospatial span task was expected to be more impaired by matrix tapping than by
articulatory suppression because performance of the primary visuospatial memory task
and the secondary matrix tapping task should both engage and compete for resources of
the visuospatial sketchpad, with the load of the secondary task on active visuospatial
rehearsal limiting the role of this process in the primary task and likewise jeopardizing
successful maintenance of the memory sequence (see, e.g., Beech, 1984; Logie, 1995;
Logie & Marchetti, 1991; Sussman, 1982). This predicted interaction between memory
task and interference task is consistent, for example, with the findings of Baddeley et al.
(1984), Baddeley, Grant, Wight, and Thornson (1975), Brooks (1968), Logie (1986),
and Smyth and Scholey (1994, 1996).
The no interference condition serves as a baseline condition. Whilst there may be
some interference of articulatory suppression on visuospatial recall and matrix tapping
on verbal recall (because of general demands on the resources of the central executive),

251
the no interference condition provides a reference against which these effects may be
evaluated.
1.2 Participants
Forty-eight undergraduate students, with a mean age of 20 years (SD = 3.78 years),
were enrolled in an introductory psychology course and received partial course credit
for participation. All were fluent in English, had normal or corrected-to-normal vision
and hearing, and gave informed written consent.
1.3 Equipment
The tasks were programmed using MetaCard 2.2 software and presented on a 38 cm
NEC MultiSync V500 LCD micro-touch monitor using MicroTouch Touchcreen
Version 3.4. Employed also was a Hyundai IBM-compatible personal computer (PC)
connected to the monitor and to a Sound Source stereo speaker system with built in
stereo amplifier and internal power adaptor. Verbal output was recorded via a
directional microphone on an Olympus Digital Voice Recorder DW-90. Sound wave
files were downloaded directly onto the PC.
1.4 The Verbal Memory Task
The primary verbal memory span task was structured along the lines of the digit span
forward subtest from the WAIS III (Wechsler, 1997) and resembles Adams and
Sheslow‟s (2003) number-letter memory task from the Wide Range Assessment of
Memory and Learning battery of tasks. It employed an auditory stimulus presentation
and vocal response format and had the same trial structure for each interference
condition.
Span procedures are taken as reliable measures of temporary, short-term storage
capacity (Groth-Marnat, 2003). The task version outlined here varied from the two
source tasks listed above in that it was presented under computer control. It was also
constructed to use letter-number sequences comparable to those used in the letter-
number sequencing task. Although the emphasis here was on VSTM, the intention was
to create stimulus sequences that could be adapted for use on a VWM task to be

252
introduced later in the empirical study of memory (refer Chapter 8). The six stimulus
sets created therefore used a combination of numbers and letters, each stimulus set
including 11 levels of differing sequence length, with three trials at each sequence
length. Only three of the six stimulus sets were used in the adult study. The first level
had a sequence length of two items (i.e., one letter, one number), graduating to a
sequence length of 12 intermixed alphanumeric stimuli to prevent possible ceiling
effects (the letter-number sequencing task is limited to seven levels, or a sequence
length of eight items). The stimulus sequences were designed to exclude some other
possible weaknesses of the letter-number sequencing subtest. Namely, the to-be-recalled
items in this instance were selected from 19 consonants and eight digits, specifically
excluding the set of vowels and the consonant “y” (to avoid inadvertent word or
acronym formation in the string of letters and numbers) and also the consonant “w”, and
the digit “7” (to avoid multisyllabic stimuli; see Baddeley, Thompson, & Buchanan,
1975, for the word-length effect). Stimulus construction also avoided the use of those
letters susceptible to phoneme confusions (e.g., B, D, T) within the same trial (see
Conrad, 1970, for the phonological similarity effect).
Other constraints in the construction of the verbal stimuli included: (a) each
sequence involved alternating numbers and letters; (b) stimuli were never repeated
within a sequence; (c) sequences were constructed to ensure equal sampling of the eight
digits, and also the 19 consonants across the stimulus sets; (d) whether each sequence
commenced with a letter or a number was roughly even (i.e., numbers started the
sequence as frequently as letters, plus or minus one frequency count) across the total
sets of trials; and (e) sequences were constructed to minimize simple progressions in
successive letters or successive digits (as with B-6-C or 3-G-4), but that otherwise the
ordering of letters and digits was randomized.
Numbers and consonants were spoken by an Australian-born female without
inflection and recorded using SoundForge 4.5. The individual sound files for the letters
and numbers were then matched in duration and intensity (i.e., each was recorded with a
44.1 kHz sampling rate, in a 16-bit mono format, and then trimmed or compressed to
approximately 450 ms in length).

253
Instructions were adapted from those used in the WAIS-III digit span forwards
subtest. Participants were advised that they would hear some numbers and letters,
followed by a long tone. The experimenter then explained the requirements of
whichever interference condition was applicable (tones, counting, or tapping). An
opportunity was subsequently provided to either listen to the tones (for the no
interference condition), or to practice the secondary articulatory suppression or matrix
tapping tasks, if appropriate. Next it was explained that, after initially hearing the
numbers and letters and conducting the allocated interference task, the participant could
expect another long tone and a central question mark would appear on screen. The
participant was instructed to then repeat the numbers and letters that were presented
before the interference task, verbatim. In a demonstration of the memory task, a string
of three letters and numbers was articulated by the experimenter, and the participant was
prompted to provide the correct response (i.e., duplicating the sequence).
Once these instructions were given, the practice phase began. Five practice trials
were activated by the experimenter. Each was cued by the word “Ready” appearing
mid-screen, followed by a 1 s delay. Next followed the audio presentation of a sequence
for that trial, presented at the rate of one item per second, then a question mark (centre
screen) to cue the participant‟s response. Verbal feedback was provided. If the
participant answered incorrectly, the correct sequence was modeled, the instructions
repeated and a facility was available to cycle through the practice items until it was
clear the task requirements were fully grasped. The first two practice trials required
recall of a sequence of two items, with the last three practice trials graduating to recall
of a sequence of three items. In the test phase, the sequence length for the test trials
gradually incremented from two items per sequence to a possible 12 items per sequence.
Each sequence length was tested over three trials. The criterion for progressing to the
next sequence length was at least one trial recalled in correct sequence at the preceding
sequence length. Items of the to-be-recalled auditory sequence were presented
consecutively with a 1 s stimulus onset asynchrony. After the presentation of the last
target item, the 8 s interference task was presented, cued by an elongated tone (500ms,
1,000 Hz sine-wave signal) and the word “Ready” appearing centre-screen. Upon
completion of the interference phase, a 2 s delay occurred. The beginning of the recall

254
phase was then signaled by both auditory and visual cues (a 500 ms, 1,000 Hz tone
and a question mark appearing centre-screen; refer Figure A1). The recall phase
required the participant to orally recall the presented sequence in correct serial order.
Hence, a response was incorrect if a number or letter was omitted or if the numbers or
letters were not said in the specified sequence. Responses were recorded via the digital
voice recorder and downloaded directly to the computer hard drive, but were also
separately recorded by the experimenter who entered the accuracy of recall using the
keyboard. This initial coding of the accuracy of recall enabled the computer program to
establish whether any of the three trials at a particular level had been passed and,
therefore, whether to proceed to the next sequence length or to automatically end the
task.
1.5 The Visuospatial Memory Task
The primary visuospatial memory span task employed a visual presentation and manual
response format; it served as the nonverbal analogue of the VSTM task described above.
The VSSTM task was a modified version of the Corsi blocks task which assesses serial
short-term memory (Corsi, 1972; de Renzi & Nichelli, 1975; Milner, 1971).
Stimuli in the computerised touch-screen version especially created for the current
research used 20 blocks in total: the task is similar in construction to the visuospatial
span task of Smyth and Scholey (1996) except the screen for our task was divided in
half by a clearly visible horizontal line, with ten blocks appearing in the upper half of
the screen, and ten blocks in the lower half in fixed but haphazard locations. This
demarcation of upper and lower screen space was necessary to ensure the same stimulus
configuration used in this VSSTM task could be replicated in a VSWM task to be
introduced later in the experimental program. Target locations were presented as black
outlines, with each location in the sequence presented as a black filled square (27-mm
side length) on a light grey background. Their relative positions were as shown in
Figure A2. Thus, the visuospatial task comprised sequences of visually presented blocks
ranging in length from two to 12 stimuli, with the sequence being built up of
consecutive locations that alternated across the upper and lower halves of the screen. As
per the verbal task, there were three trials at each sequence length and sequence length

255
incremented by one unit across each set of three trials. Visuospatial sequences differ
in complexity (and difficulty) according to the number of crossings of the paths traced
by successive stimuli (Parmentier, Elford, & Maybery, 2005). The number of path
crossings in any given sequence was therefore minimised. The participant‟s task was to
both recall and reproduce the pattern described by the illuminated sequence of squares
appearing on the screen, regardless on which half of the screen they appeared.
Figure A1. Primary verbal span task with secondary visuospatial interference task.
Start (Start screen displayed
for 1 s duration)
Ready
Secondary Spatial Interference Task: Keyboard tapping with tones presented at a rate of 2 per second (8 s duration)
Encoding Phase
Maintenance Phase
2 s lapse, then
auditory cue for recall (elongated tone of
500 ms)
Recall Phase
?
Primary Verbal Task: Auditory presentation of letters and numbers at a rate of 1 per second
F 9
B 2
M
Auditory cue for interference task (elongated tone
of 500 ms)

256
Other task parameters were as follows: (a) each sequence involved alternating
upper and lower screen stimuli; (b) a stimulus was never repeated within a sequence; (c)
sequences were constructed to ensure equal sampling of all stimulus items; (d) whether
each sequence commenced with a square positioned in the upper or lower half of the
screen was evenly distributed across the trials. Apart from restrictions (a)-(d), the
selection of locations for each sequence was essentially random.
Instructions paralleled those of the verbal task. In the demonstration phase of this
task, a sample screen of black outlined boxes appeared and participants were instructed
they would be required to indicate their response in this task by touching some boxes on
the computer screen in order to replicate a presented sequence. For all touch screen
tasks, the participant was positioned just to the left or right of the screen dependent on
handedness. A wedge-shaped armrest was set up on the appropriate side of the screen,
with the participant instructed to place the index finger of his/her dominant hand on a
gold star positioned at the bottom of the monitor casing. This was described as the
participant‟s starting position. Next, the participants were told they would see some
boxes light up and then switch off, one at a time, above and below the line in the middle
of the screen. Then they were given an opportunity to practise the interference condition
allocated for the current block of trials. Next, the method of response for the memory
task was explained. Participants were told they would hear a long tone and see some
question marks appear on the screen, and this would be the signal to replicate the pattern
the boxes made, by pressing them in the order in which they had appeared.
In the demonstration phase of this task, the experimenter initiated a sample
sequence of three boxes (all demonstration, practice, and test sequences always
involved successive locations that alternated between the top and bottom halves of the
screen). The participant was prompted to execute the response by pressing each box to
recreate the sequence. In the practice phase, trials mimicked those of the verbal task:
two trials used a sequence length of two, and three trials used a sequence length of
three. Again, verbal feedback accompanied each practice trial, and if an error was made,
the correct sequence was modeled, the instructions repeated and the practice items
presented again until the experimenter was confident the task had been fully
comprehended.

257
In the test phase, the to-be-recalled sequence was presented with each square
illuminated for 1 s, and followed immediately by its successor in the sequence (refer
Figure A2). After the presentation of the last target item, a 500 ms, 1,000 Hz tone cued
the start of interference task. The (unilluminated) Corsi array remained on-screen while
the 8 s interference task was presented. Hence, the pool of visuospatial locations from
which the memory items were sampled remained visible throughout the maintenance
and recall phases. Immediately following the maintenance phase (which was filled by
the interference task), there was a 2 s unfilled interval, then the recall phase was
signaled by another 500 ms, 1,000 Hz tone and the presentation of 20 question marks
appearing centrally within the squares. Participants attempted to recall the sequence in
its presented serial order by touching the appropriate target squares on the monitor.
Each square was illuminated upon contact and remained lit until the end of that trial.
The computer recorded the sequence recalled by the participant as well as whether it
was correct or not (with respect to both the locations reported and their sequence),
though progression through the trials relied on a space bar press by the experimenter21
.
The computer automatically discontinued the task when all three trials were failed
for a particular sequence length. The computer recorded the sequence recalled by the
participant as well as whether it was correct or not (with respect to both the locations
reported and their sequence).
1.6 Interference Tasks
Three interference conditions were used – no interference, articulatory suppression, and
matrix tapping. In the no interference condition, the long (500 ms) tone alerted
participants that the maintenance phase was about to commence. A sequence of 16 200
ms, 1000 Hz sine-wave tones followed at a rate of 2 per second. Hence, the no
interference condition filled the maintenance phase with the tones heard in the other two
interference conditions. An unfilled interval of 2 s followed the 8s of brief tones.
21Prior (limited) pilot testing on children (N = 10) of a computer-controlled version of this task created
problems because of the computer-imposed time-constraints. Presentation of trials in both the adult and
child versions of this task were, therefore, brought under experimenter control; this allowed more time for
the adult and child to re-settle after each trial, particularly when errors were made.

258
Another long tone and a visual stimulus (question mark/s) signaled the
commencement of the recall phase.
Figure A2. Primary visuospatial span task with secondary verbal interference task.
Start
(Start screen displayed for 1 s duration)
Ready
Secondary Verbal
Interference Task: Repetition of number sequence in
time with tones presented at a rate
of 2 per second (8 s duration)
Primary Spatial Task: Presentation of matrices at a rate of 1 per second
Encoding Phase
Recall Phase
Maintenance Phase
Auditory cue for interference task (elongated tone
of 500 ms)
2 s lapse, then
auditory cue
(elongated tone
of 500 ms)

259
For the articulatory suppression condition, the same 16 tones employed in the
no interference condition were presented over the 8 s of the maintenance phase that
followed the first long tone (see Figure A2). This auditory prompt coincided with a
visual prompt (“Ready”) appearing for 1 s in the centre of the screen. The articulatory
suppression task involved the repetition of a predictable sequence: participants were
required to say “1, 2, 3, 4” repeatedly in time with the tones, articulating one digit with
each tone. Again, a 2 s period elapsed upon completion of the articulatory suppression
phase. As for the other secondary task conditions, a second long tone and a visual cue
(question mark/s) signaled the commencement of the recall phase. This task was
analogous to that used by Baddeley (1986).
The matrix tapping condition involved the paced tapping of a predetermined
visuospatial pattern in a clockwise direction: participants were required to tap around
locations denoted by a 2 x 2 array of four specially-marked keys on the digit pad of the
keyboard. Upon receiving the auditory and visual signals for the start of the
maintenance phase, the participant was required to tap the four keys in a clockwise
fashion commencing with the top left key, in time with the presented tones. Again, a 2 s
unfilled period then followed prior to memory task recall. This task was similar to that
used by Logie and Salway (1990).
2.0 General Procedure
Participants were tested individually in a quiet testing cubicle in an anechoic room with
dim background lighting. They were seated in a height-adjustable chair in front of the
touch-screen monitor. The screen was at a 90 angle to the desk surface and the 45 arm
rest was used to facilitate the screen‟s use as a touch interface. The participant‟s head
was not constrained. The experimenter was present throughout the experiment.
Participants were provided with instructions outlining the procedure for the tasks, and
instructed to complete any manual tasks using the index finger of their dominant hand.
The order of presentation of the experimental conditions was counterbalanced across
participants. Following the completion of trials for the six experimental conditions,
participants were thanked and fully debriefed.

260
3.0 Results and Discussion
For the span tasks, the fractional scoring method implemented by Hulme, Maughan, and
Brown (1991) was employed, where:
Span Score = 1 + ∑ (# trials correct at a given sequence length)
(# trials at that sequence length)
Given that there were three trials at each sequence length, if a participant, for example,
had three trials correct at each of sequence lengths of two, three, and four items, two
trials correct at a sequence length of five items, and none correct at a sequence length of
six items, their span score would be calculated as:
Span Score = 1 + [3(.3333) + 3(.3333) + 3(.3333) + 2(.3333)] = 4.6666.
Accuracy on the articulatory suppression task for each trial was recorded manually by
the experimenter in terms of the number of articulations (counting responses: 1, 2, 3, 4,
1, 2, 3, 4, etc.) made over the 16 tones. The computer recorded the accuracy on each
trial of the matrix tapping task (i.e., how many key presses occurred across the 16
tones).
The data were screened for outliers. Univariate outliers on each of the memory
tasks were defined as span scores more than 3 SD units from the mean. One such outlier
was identified and subsequently trimmed to a score 3 SD units from the mean. All
participants were able to meet the task requirements, correctly tapping, rehearsing
verbal information, or withholding response during the maintenance phase according to
the interference task condition, and thus no participants were excluded on this basis.
Preliminary analyses were conducted to examine whether memory performance differed
for the three sets of sequences used for each task, but no significant differences were
found.
The means and standard errors of the span scores for each memory task crossed
with the three interference conditions appear in Figure A3. This figure indicates that
performance under the control condition (i.e., no interference) was superior to that
under the other two interference conditions (i.e., articulatory suppression, matrix
tapping), and that performance seems to show more interference when the primary and
secondary tasks purportedly draw on the same short-term memory subsystem (i.e., the

261
phonological loop in respect of the verbal memory and articulatory suppression
tasks, and the visuospatial sketchpad in respect of the visuospatial memory and matrix
tapping tasks).
The fractional span scores were analysed using a 2 (memory task: verbal,
visuospatial) x 3 (interference condition: none, verbal, visuospatial) repeated measures
ANOVA. Mauchly‟s assumption had not been compromised, therefore sphericity was
presumed. Analyses revealed no effect of memory task, indicating that participants
performed equally well across the verbal and visuospatial modalities. There was also a
main effect of interference condition, F(2, 94) = 40.03, p < .001, ŋ2 = .46, and a
significant interaction between memory task and interference condition, F(2, 94) =
53.64, p < .001, ŋ2 = .53. As can be seen from Figure A3, the pattern of interaction is
consistent with that of selective interference and a double dissociation, with articulatory
suppression appearing to affect verbal memory more than visuospatial memory, and
matrix tapping appearing to affect visuospatial memory more than verbal memory. Two
paired-samples t tests explored this interaction further. For each memory task,
performance was compared for articulatory suppression and matrix tapping. Both
contrasts were significant; that is, for VSTM, t(47) = 8.83, p < .001, and for VSSTM,
t(47) = 6.17, p < .001, indicating that the two forms of memory differed in their specific
vulnerability to the two kinds of interference. Thus, as expected, memory for verbal
sequences was more impaired by articulatory suppression than by matrix tapping,
whereas memory for visuospatial sequences was more impaired by matrix tapping than
by articulatory suppression. This pattern of results is therefore consistent with the view
that immediate serial recall of a sequence of verbal items taps the resources of the
phonological loop, whereas immediate serial recall of a sequence of spatial locations
taps the resources of the visuospatial sketchpad.
Finally, memory for verbal sequences was substantially impaired, relative to the no
interference condition, by articulatory suppression, t(47) = 10.27, p < .001, and memory
for visuospatial sequences was substantially impaired, relative to the no interference
condition, by matrix tapping, t(47) = 6.59, p < .001. There was some evidence of cross-
modality interference in that verbal memory was minimally impaired by matrix tapping,
relative to the no interference baseline t(47) = 3.01, p = .004. Spatial memory, by

262
contrast, was not significantly impaired by articulatory suppression compared to the
no interference baseline. Because the reiteration, „1, 2, 3, 4‟, is a highly-practised
sequence, and tapping four squares is arguably less well-practised, the latter might draw
more heavily on the resources of the central executive and this may, therefore, account
for its effect on verbal memory.
3.6
3.8
4
4.2
4.4
4.6
4.8
5
5.2
5.4
5.6
No Interference Articulatory Suppression Matrix Tapping
Interference Task
Mem
ory
Sp
an
Spatial Memory Task
Verbal Memory Task
Figure A3. Means (and standard errors) of memory span scores for each combination of
memory task and interference condition.
Because it is important when using dual-task methods to scrutinize performance on
both tasks to establish whether performance trade-offs are occurring, checks on
secondary task compliance were carried out. To this end, paired-samples t tests were
conducted on the number of taps executed across the 16 beats during the matrix tapping
task run in conjunction with the VSTM task versus the VSSTM task. The means in
Table A1 show that the number of taps across the 16 tones can exceed 16. As is also
evident from Table A1, there were fewer responses on the matrix-tapping task when it
was paired with the VSSTM task rather than the VSTM task, t(47) = 2.82, p = .007.

263
This is consistent with matrix tapping and VSSTM competing for the resources of
the visuospatial sketchpad. However, the number of vocalisations executed across the
16 beats in the articulatory suppression task condition did not differ for the VSTM and
VSSTM tasks (refer Table A1).
The hypothesis that articulatory suppression would be more detrimental to
performance outcomes when run in conjunction with the verbal span task, and that
matrix tapping would impede performance more substantially when paired with the
visuospatial span task, has been supported by these results, with patterns of selective
interference and double dissociation emerging quite clearly. We can conclude,
therefore, that the construct validity of the respective verbal and visuospatial tasks and
the architectural distinction of the two purportedly domain-specific memory slave
systems said to underlie performance of these two tasks has been duly demonstrated
Table A1. Level of compliance (as measured by the number of taps and the number of
vocalizations) on secondary task performance for the verbal and spatial memory tasks.
_____________________________________________________________
Mean SD
_____________________________________________________________
VSTM Taps 16.61 0.69
SSTM Taps 16.35 0.42
VSTM Vocalisations 15.99 0.14
SSTM Vocalisations 15.98 0.14
_____________________________________________________________
by these results. Finally, matrix tapping was demonstrated to interfere to a modest
extent with verbal memory; however, this result can arguably be explained with
reference to some demand placed on central executive resources in tapping out the four
locations repeatedly.
Despite the validation of the memory measures demonstrated in this study, a
limitation of the design that bears consideration is that the population studies were
young adults. These results, therefore, may not be generalisable to children in general,

264
and/or children who develop atypically, such as the special populations of interest,
namely ADHD and RD children.

265
Glossary of Terms
ADD/H Attention deficit disorder - with hyperactivity
ADD/+H Attention deficit disorder - with hyperactivity
ADD/-H Attention deficit disorder - without hyperactivity
ADHD Attention-deficit/hyperactivity disorder
ADHD-CT Attention-deficit/hyperactivity disorder, combined type
ADHD-HI Attention-deficit/hyperactivity disorder, hyperactive-impulsive
ADHD-PI Attention-deficit/hyperactivity disorder, predominantly
inattentive
ADHD+RD Comorbid overlap of attention-deficit/hyperactivity disorder and
reading disorder
ANOVA Analysis of variance
APA American Psychiatric Association
ARI Average rating per item
CTOPP Comprehensive Test of Phonological Processing
DCD Developmental Coordination Disorder
DSM Diagnostic and Statistical Manual
FSIQ Full scale intelligence quotient
IQ Intelligence quotient
PA Phonological awareness
PIQ Performance intelligence quotient
RD Reading disorder
RN Rapid naming
RNC Rapid naming continuous

266
RND Rapid naming discrete
RT Reaction time
SDQ Strengths and Difficulties Questionnaire
SNAP-IV Swanson, Nolan, and Pelham-IV rating scale
SOP Speed-of-processing
STM Short-term memory
VSSTM Visuospatial short-term memory
VSTM Verbal short-term memory
VWM Verbal working memory
WAIS Wechsler Adult Intelligence Scale
WISC Wechsler Intelligence Scale for Children
WM Working memory
WRMT Woodcock Reading Mastery Tests
WRMT-R Woodcock Reading Mastery Tests – Revised
VSWM Visuospatial working memory
VIQ Verbal intelligence scale

267
References
Achenbach, T. M., & Edelbrock, C. S. (1983). Manual for the child behavior profile and child
behaviour checklist. Burlington, VT: Achenbach (author).
Ackerman, P. T., & Dykman, R. A. (1993). Phonological processes, confrontational naming,
and immediate memory in dyslexics. Journal of Learning Disabilities, 26, 597-609.
Adams, J. W., & Snowling, M. J. (2001). Executive function and reading impairments in
children reported by their teachers as „hyperactive‟. British Journal of Developmental
Psychology, 19, 293-306.
Adams, M. J. (1990). Beginning to read: Thinking and learning about print. Cambridge, MA:
MIT Press.
Adams, M. & Bruck, M. (1995). Resolving the „great debate.‟ American Educator, Summer, 7-
20.
Adams, W., & Sheslow, D. (1990) WRAL. Wide range assessment of memory and learning.
Wilmington, Delaware: Wide Range, Inc.
Adams, W., & Sheslow, D. (2003) WRAML2. Wide range assessment of memory and learning,
2nd
Ed. Wilmington, Delaware: Wide Range, Inc.
Alderson, R. M, Rapport, M. D., & Kofler, M. J. (2007). Attention-deficit/hyperactivity disorder
and behavioral inhibition: A meta-analytic review of the stop-signal paradigm. Journal of
Abnormal Child Psychology, 35, 745-758.
Alloway, T. P., Gathercole, S. E., Willis, C., Adams, A. M. (2004). A structural analysis of
working memory and related cognitive skills in early childhood. Journal of Experimental
Child Psychology, 87, 85-106.
Almasy, L., & Blangero, J. (2001). Endophenotypes as quantitative risk factors for psychiatric
disease: Rationale and study design. American Journal of Medical Genetics, 105, 42-44.
American Psychiatric Association. (1968). Diagnostic and statistical manual of mental
disorders (2nd
ed.). Washington, District of Columbia: Author.
American Psychiatric Association. (1980). Diagnostic and statistical manual of mental
disorders (3rd ed.). Washington, District of Columbia: Author.
American Psychiatric Association. (1987). Diagnostic and statistical manual of mental
disorders (3rd ed., text revision). Washington, District of Columbia: Author.

268
American Psychiatric Association. (1994). Diagnostic and statistical manual of mental
disorders (4th ed.). Washington, District of Columbia: Author.
American Psychiatric Association. (2000). Diagnostic and statistical manual of mental
disorders (4th ed., text revision). Washington, District of Columbia: Author.
Anastopoulos, A. D., Spisto, M. A., Mahler, M. C. (1994). The WISC-III freedom from
distractibility factor: its utility in identifying children with Attention Deficit Hyperactivity
Disorder. Psychological Assessment, 6, 368-371.
Anderson, J. C., Williams, S., McGee, R., & Silva, P. A. (1987). DSM-III disorders in
preadolescent children. Prevalence in a large sample from the general population. Archives
of General Psychiatry, 44, 69-76.
Anderson, P. (2002). Assessment and development of executive function (EF) during childhood.
Child Neuropsychology, 8, 71-82.
Anderson, P., Anderson, V., Northam, E., Jacobs, R., & Catroppa, C. (2001). Development of
executive functions through late childhood and adolescence in an Australian sample.
Developmental Neuropsychology, 20, 385-406.
Anderson, P., Anderson, V., Northam, E., & Taylor, H. (2000). Standardisation of the
Contingency Naming Test for school-aged children: A measure of reactive flexibility.
Clinical Neuropsychological Assessment, 1, 247-273.
Anderson, P. L., & Meier-Hedde, R. (2001). Early case reports of dyslexia in the United States
and Europe. Journal of Learning Disabilities, 34, 9-21.
Andreasen, N. C. (2005). Research advances in genetics and genomics: Implications for
psychiatry. Arlington, VA: American Psychiatric Publishing.
Arbib, M.A., Caplan, D. & Marshall, J.C. (1982). Neurolinguistics in historical perspective. In
M. A. Arbib, D. Caplan, & J. C. Marshall (Eds.), Neural models of language processes.
New York: Academic Press.
Arizmendi, T., Paulsen, K., & Domino, G. (1981). The Matching Familiar Figures Test: A
primary, secondary, and tertiary evaluation. Journal of Clinical Psychology, 37, 812-818.
Arnold, E. M., Goldston, D. B., Walsh, A. K., Reboussin, B. A., Daniel, S. S., Hickman, E., &
Wood, F. B. (2005). Severity of emotional and behavioral problems among poor and
typical readers. Journal of Abnormal Child Psychology, 33, 205-217.
Ashley, S. (2005). The ADD & ADHD Answer Book. Sourcebooks: Illinois.

269
August, G. J., & Garfinkel, B. D. (1989). Behavioral and cognitive subtypes of ADHD.
Journal of American Academy of Child and Adolescent Psychiatry, 28, 739-748.
August, G. J., & Garfinkel, B. D. (1990). Comorbidity of ADHD and reading disability among
clinic-referred children. Journal of Abnormal Child Psychology, 18, 29-45.
August, G. J., Stewart, M. A., & Holmes C. S. (1983). A four-year follow-up of hyperactive
boys with and without conduct disorder. British Journal of Psychiatry, 143, 192-198.
Baddeley, A. D. (1986). Working memory. Oxford: Oxford University Press.
Baddeley, A. D. (1992). Working memory. Science, 255, 556-559.
Baddeley, A. D. (2000). The episodic buffer: A new component of working memory? Trends in
Cognitive Science, 4, 417-423.
Baddeley, A. D., & Andrade, J. (2000). Working memory and the vividness of imagery. Journal
of Experimental Psychology: General, 129, 126-145.
Baddeley, A. D., Grant, S., Wight, E., & Thomson, N. (1975). Imagery and visual working
memory. In P. M. A. Rabbitt & D. Dornic (Eds.), Attention and performance V (pp. 205-
217). London: Academic Press.
Baddeley, A. D., & Hitch, G. (1974). Working memory. In G. A. Bower (Ed.), The psychology
of learning and motivation (vol. 8, pp. 47-89). New York: Academic Press.
Baddeley, A. D., & Logie, R. H. (1999). Working memory: The multiple component model. In
A. Miyake & P. Shah (Eds.), Models of working memory: Mechanisms of active
maintenance and executive control (pp. 28-61). New York: Cambridge University Press.
Baddeley, A., Lewis, V., & Vallar, G. (1984). Exploring the articulatory loop. The Quarterly
Journal of Experimental Psychology, 36, 233-252.
Baddeley, A. D., Thomson, N., & Buchanan, M. (1975). Word length and the structure of short-
term memory. Journal of Verbal Learning and Verbal Behaviour, 14, 575-589.
Badian, N. A. (1996). Dyslexia: A validation of the concept at two age levels. Journal of
Learning Disabilities, 29, 102-112.
Badian, N. A., Duffy, F. H., Als, H., & McAnulty, G. B. (1991). Linguistic profiles of dyslexics
and good readers. Annals of Dyslexia, 41, 221-245.
Band, G. P. H., & Scheres, A. (2005). Commentary: Is inhibition impaired in ADHD? British
Journal of Developmental Psychology, 23, 517-521.

270
Band, G. P. H., & van Boxtel, G. J. M. (1999). Inhibitory motor control in stop paradigms:
Review and reinterpretations of neural mechanisms. Acta Psychologica, 101, 179-211.
Barabasz, M. & Barabasz, A. (1996). Attention deficit disorder: Diagnosis etiology, and
treatment. Child Study Journal, 26, 1-36.
Barkley, R. A. (1990). Attention-deficit hyperactivity disorder: A handbook for diagnosis and
treatment. New York: Guilford Press.
Barkley, R. (1996). The North American perspective on Attention Deficit Hyperactivity
Disorder. The Australian Educational and Developmental Psychologist, 13, 2-23.
Barkley, R. A. (1997a). ADHD and the nature of self-control. New York: Guildford Press.
Barkley, R. A. (1997b). Behavioral inhibition, sustained attention, and executive functions:
Constructing a unifying theory of ADHD. Psychological Bulletin, 121, 65-94.
Barkley, R. (1998). Attention-deficit hyperactivity disorder. Scientific American, 279, 66-71.
Barkley, R. (2001). Genetics of childhood disorders: XVII. ADHD, Part 1: The executive
functions and ADHD. Journal of the American Academy of Child and Adolescent
Psychiatry, 39, 1064-1068.
Barkley, R. (2003a). Attention-deficit/hyperactivity disorder. In E. J. Mash & R. A. Barkley
(Eds.), Child psychopathology (2nd ed., 75-143). New York: Guilford Press.
Barkley, R. A. (2003b). Issues in the diagnosis of attention-deficit/hyperactivity disorder in
children. Brain & Development, 25, 77-83.
Barkley, R. A., DuPaul, G. J., & McMurray, M. B. (1991). Attention deficit disorder with and
without hyperactivity: Clinical response to three dose levels of methylphenidate.
Pediatrics, 87, 519–531.
Barkley, R. A., Edwards, G., Laneri, M., Fletcher, K., & Metevia, L. (2001). Executive
functioning, temporal discounting, and sense of time in adolescents with Attention Deficit
Hyperactivity Disorder (ADHD) and Oppositional Defiant Disorder (ODD). Journal of
Abnormal Child Psychology, 29, 541-556.
Barkley, R. A., Fischer, M., Edelbrock, C. S., & Smallish, L. (1990). The adolescent outcome of
hyperactive children diagnosed by research criteria: I. An 8-year prospective follow-up
study. Journal of the American Academy of Child and Adolescent Psychiatry, 29, 546-557.

271
Barkley, R. A., Grodzinsky, G., & DuPaul, G. J. (1992). Frontal lobe functions in attention
deficit disorder with and without hyperactivity: A review and research report. Journal of
Abnormal Child Psychology, 20, 163-188.
Barkley, R. A., & Murphy, K. R. (2005). Attention-deficit hyperactivity disorder (3rd
Ed.). New
York: Guilford Press.
Barkley, R. A., & Murphy, K. R. (2006). Attention-deficit hyperactivity disorder: A clinical
workbook. New York: Guilford Press.
Barnett, R., Maruff, P., Vance, A, Luk, E. S. L., Costin, J., Wood, C., & Pantelis, C. (2001).
Abnormal executive function in attention deficit hyperactivity disorder: the effect of
stimulant medication and age on spatial working memory. Psychological Medicine, 31,
1107–1115.
Baumgaertel, A., Wolraich, M. L., & Dietrich, M. (1995). Comparison of diagnostic criteria for
attention deficit disorders in a German elementary school sample. Journal of the American
Academy of Child and Adolescent Psychiatry, 34, 629-638.
Bedard, A., Ickowicz, A., & Tannock, R. (2002). Methylphenidate improves Stroop naming
speed, but not response interference, in children with attention deficit hyperactivity
disorder. Journal of Child and Adolescent Psychopharmacology, 12, 301-309.
Bedard, A., Jain, U., Hogg-Johnson, S., & Tannock, R. (2007). Effects of methylphenidate on
working memory components: influence of measurement. Journal of Child Psychology
and Psychiatry, 48, 872-880.
Beech, J. R. (1984). The effects of visual and spatial interference on spatial working memory.
Journal of General Psychology, 110, 141-149.
Benezra, E. & Douglas, V. I. (1988). Short-term serial recall in ADDH, normal, and reading-
disabled boys. Journal of Abnormal Child Psychology, 16, 511-525.
Benton, A.L. (1994). Neuropsychological assessment. Annual Reviews of Psychology, 45, 1-23.
Benton, A. L. (1975). Developmental dyslexia: Neurological aspects. In. W. J. Friedlander
(Ed.). Advances in neurology (Vol. 7). New York: Raven Press.
Benton, A. L., & Pearl, D. (1978). Dyslexia: An appraisal of current knowledge. New York:
Oxford University Press.
Berch, D. B., Krikorian, R., & Huha, E. M. (1998). The Corsi block-tapping task:
Methodological and theoretical considerations. Brain and Cognition, 38, 317-338.

272
Berlin, B., & Kay, P. (1969). Basic colour terms: Their universality and evolution.
Berkeley: University of California Press.
Berlin, R. (1884). Über dyslexie [About dyslexia]. Archiv für Psychiatrie , 15, 276-278.
Berninger, V. W. & Abbott, R. D. (1994). Redefining learning disabilities: Moving beyond
aptitude achievement discrepancies to failure to respond to validated treatment protocols.
In G. R. Lyon (Ed.), Frames of reference for the assessment of learning disabilities: New
views on measurement issues (pp. 163-183). Baltimore, MD: Paul H. Brookes Publishing
Co.
Beyer, C. (2010). Next generation antidepressants: Moving beyond monamines to discover
novel treatment strategies for mood disorders. Cambridge, UK: Cambridge University
Press.
Biederman, J., Faraone, S. V., & Lapey, K. (1992). Comorbidity of diagnosis in attention-deficit
hyperactivity disorder. In G. Weiss (Ed.), Child and adolescent psychiatric clinics of North
America: Attention deficit disorder (pp. 335-360). Philadelphia: Saunders.
Bird, H., Canino, G., Rubio-Stipec, M., Gould, M., Ribera, J., Sesman, M., Woodbury, M.,
Huertas-Goldman, S., Pagan, A., Sanchez-Lacay, A., & Moscoso, M. (1988). Estimates of
the prevalence of childhood maladjustment in a community survey in Puerto Rico.
Archives of General Psychiatry, 45, 1120-1126.
Blachman, B. A. (1984). Relationship of rapid naming ability and language analysis skills to
kindergarten and first-grade reading achievement. Journal of Educational Psychology, 76,
610-622.
Blachman, B. A. (1997). Foundations of reading acquisition and dyslexia: Implications for
early intervention. Mahwah, NJ: Lawrence Erlbaum Associates.
Boucugnani, L. L., & Jones, R. W. (1989). Behaviors analogous to frontal lobe dysfunction in
children with attention deficit hyperactivity disorder. Archives of Clinical
Neuropsychology, 4, 161-173.
Bowers, P. (1993). Text reading and rereading: Predictors of fluency beyond word recognition,
Journal of Reading Behaviour, 25, 133–153.
Bowers, P. G. (1995). Tracing symbol naming speed‟s unique contributions to reading
disabilities over time. Reading and Writing: An Interdisciplinary Journal, 7, 189-216.

273
Bowers, P. G., & Newby-Clark, E. (2002). The role of naming speed within a model of
reading acquisition. Reading and Writing: An Interdisciplinary Journal, 15, 109-126.
Bowers, P., Steffy, R., & Tate, E. (1988). Comparison of the effects of IQ control methods on
memory and naming speed predictors of reading disability. Reading Research Quarterly,
23, 304-319.
Bowers, P. G., Sunseth, K., & Golden, J. (1999). The route between rapid naming and reading
progress. Scientific Studies of Reading, 3, 31-53.
Bowers, P., & Swanson, L. (1991). Naming speed deficits in reading disability: Multiple
measures of a singular process. Journal of Experimental Child Psychology, 51, 195-219.
Bowers, P. G., & Wolf, M. (1993). Theoretical links among naming speed, precise timing
mechanisms and orthographic skill in dyslexia. Reading and Writing: An Interdisciplinary
Journal, 5, 69-85.
Braaton, E. B., & Rosen, L. A. (2000). Self-regulation of affect in attention deficit-hyperactivity
disorder (ADHD) and non-ADHD boys: Differences in empathic responding. Journal of
Consulting and Clinical Psychology, 68, 313-321.
Bradley, L. & Bryant, P. E. (1983). Categorising sounds and learning to read: A causal
connection, Nature, 301, 419-421.
Brady, S. A., & Shankweiler, D. P. (1991). Phonological processes in literacy: A tribute to
Isabelle Y. Liberman. Hillsdale, NJ: Erlbaum.
Braisby, N., & Dockrell, J. (1999). Why is colour naming difficult? Journal of Child Language,
26, 23-47.
Brandeis, D., van Leeuwen, T. H., Rubia, K., Vitacco, D., Steger, J., Pascual-Marqui, R. D., &
Steinhausen, H. (1998). Neuroelectric mapping reveals precursor of stop failures in
children with attention deficits. Behavioural Brain Research, 94, 111-125.
Breen, M. J. (1989) Cognitive and behavioural differences in ADHD boys and girls. Journal of
Child Psychology and Psychiatry, 30, 711–716.
Breen, M. J., & Altepeter, T. S. (1990). Situational variability in boys and girls identified as
ADHD. Journal of Clinical Psychology, 46(4), 486-490.
Brewer, N., & Smith, G. A. (1989). Developmental changes in processing speed: Influence of
speed-accuracy regulation. Journal of Experimental Psychology: General, 118, 298-310.

274
Breznitz, Z. (2006). Fluency in reading: Synchronisation of processes. Mahwah, NJ:
Lawrence Erlbaum Associates.
Brinley, J. F. (1965). Cognitive sets, speed and accuracy of performance in the elderly. In A. T.
Welford and J. E. Birren (Eds.), Behavior, aging, and the nervous system: Biological
determinants of speed of behavior and its changes with age (pp.114-149). Springfield,
Illinois: Charles C. Thomas.
Brock, S. E., & Knapp, P. K. (1996). Reading comprehension abilities of children with
attention-deficit/hyperactivity disorder. Journal of Attention Disorders, 1, 173-185.
Bronowski, J. (1977). Human and animal languages. In J. Bronowski (Ed.), A sense of the future
(pp. 104-131). Cambridge, MA: MIT Press.
Brooks, L. R. (1968). Spatial and verbal components of the act of recall. Canadian Journal of
Psychology, 22, 349-368.
Brosnan, M., Demetre, J., Hamill, S., Robson, K., Shepherd, H., & Cody, G. (2002). Executive
functioning in adults and children with developmental dyslexia. Neuropsychologia, 40,
2144-2155.
Brown, M. B. (2000). Diagnosis and treatment of children and adolescents with attention-
deficit/hyperactivity disorder. Journal of Counseling and Development, 78, 195-203.
Bruck, M. (1987). The long-term prognosis of children with learning disabilities. Annals of
Dyslexia, 37, 252-263.
Bruck, M. (1992). Persistence of dyslexics' phonological awareness deficits. Developmental
Psychology, 28, 874-886.
Burks, H. (1960). The hyperkinetic child. Exceptional Children, 27, 18.
Butler, R.W., Copeland, D.R., Furlough, D.L., Mulhern, R.K., Katz, E.R., & Kazak, A.E.
(2008). A multicenter randomized clinical trial of a cognitive remediation program for
childhood survivors of a pediatric malignancy. Journal of Consulting and Clinical
Psychology, 76, 367-378.
Butler R. W., Copeland, D. R. (2002). Attentional processes and their remediation in children
treated for cancer: A literature review and the development of a therapeutic approach.
Journal of the International Neuropsychology Society, 8, 115–124.

275
Butler, R. W., & Mulhern, R. K. (2005). Neurocognitive interventions for children
and adolescents surviving cancer. Journal of Pediatric Psychology, 30, 65–78.
Byrne, B., & Arnold, L. (1981). Dissociation of the recency effect and immediate memory span:
Evidence from beginning readers. British Journal of Psychology, 72, 371-376.
Byrne, B., & Fielding-Barnsley, R. (1989). Phonemic awareness and letter knowledge in the
child's acquisition of the alphabetic principle. Journal of Educational Psychology, 81, 313-
321.
Cairney, S., Maruff, P., Vance, A., Barnett, R., Luk, E., & Currie, J. (2001). Contextual
abnormalities of saccadic inhibition in children with attention deficit hyperactivity
disorder. Experimental Brain Research, 141, 507-518.
Calhoun, S. L., & Mayes, S. D. (2005). Processing speed in children with clinical disorders.
Psychology in the Schools, 42, 333-343.
Cantwell, D. P. (1996). Attention deficit disorder: A review of the past 10 years. Journal of the
American Academy of Child and Adolescent Psychiatry, 35, 978-987.
Carte, E. T., Nigg, J. T., & Hinshaw, S. P. (1996). Neuropsychological functioning, motor
speed, and language processing in boys with and without ADHD. Journal of Abnormal
Child Psychology, 24, 481-498.
Carter, C. S., Krener, P., Chaderjian, M., Northcutt, C., & Wolfe, V. (1995). Abnormal
processing of irrelevant information in attention deficit hyperactivity disorder. Psychiatry
Research, 56, 59-70.
Case, R., Kurland, M., & Goldberg, J. (1982). Operational efficiency and the growth of short
term memory. Journal of Experimental Psychology, 33, 386-404.
Case, R. (1992a). The role of the frontal lobes in the regulation of cognitive development. Brain
and Cognition, 20, 51-73.
Case, R. (1992b). The mind's staircase: Exploring the conceptual underpinnings of children's
thought and knowledge. Hillsdale, New Jersye: Erlbaum.
Case, R., Kurland, D. M., & Goldberg, J. (1982). Operational efficiency and the growth of
short-term memory span. Journal of Experimental Psychology, 33, 386-404.
Castles, A. & Coltheart, M. (2004). Is there a causal link from phonological awareness to
success in learning to read? Cognition, 91, 77-111.

276
Catts, H., Gillespie, M., Leonard, L., Kail, R., & Miller, C. (2002). The role of speed of
processing, rapid naming, and phonological awareness in reading achievement. Language,
Speech, and Hearing Services in Schools, 32, 38-50.
Catts, H. W., Adlof, S. M., & Weismer, S. E. (2006). Language deficits in poor comprehenders:
A case for the simple view of reading. Journal of Speech, Language, and Hearing
Research, 49, 278-293.
Catts, H. W., & Kamhi, A. G. (1999). Causes of reading disabilities. In H. W. Catts, & A. G.
Kamhi (Eds.), Language and reading disabilities (pp. 95-127). Boston: Allyn & Bacon.
Cerella, J. (1990). Aging and information-processing rate. In J. E. Birren & K. W. Schaie (Eds.),
Handbook of the psychology of aging. (3rd ed., pp. 201–221). San Diego, California:
Academic Press.
Cerella, J., & Hale, S. (1994). The rise and fall in information-processing rates over the life
span. Acta Psychologica, 86, 109-197.
Cerella, J., Poon, L. W., & Williams, D. H. (1980). Age and the complexity hypothesis. In L.
W. Poon (Ed.), Aging in the 1980‘s (pp. 332-340). Washington, District of Columbia:
American Psychological Association.
Chard, E. J., & Dickson, S. V. (1999). Phonological awareness: Instruction and assessment
guidelines. Intervention in School and Clinic, 34, 261-270.
Chelune, G. J., Ferguson, W., Koon, R. & Dickey, T. O. (1986). Frontal lobe disinhibition in
attention deficit disorder. Child Psychiatry and Human Development, 16, 221-234.
Chess, S. (1960). Diagnosis and treatment of the hyperactive child. New York State Journal of
Medicine, 60, 2379– 2385.
Chhabildas, N., Pennington, B. F., & Willcutt, E. G. (2001). A comparison of the
neuropsychological profiles of the DSM-IV subtypes of ADHD. Journal of Abnormal
Child Psychology, 29, 529-540.
Chiappe, P., Hasher, L., & Siegel, L. S. (2000). Working memory, inhibitory control, and
reading disability. Memory & Cognition, 28, 8-17.
Chincotta, D., & Underwood, G. (1997). Digit span and articulatory suppression: A cross-
linguistic comparison. European Journal of Cognitive Psychology, 9, 89-96.

277
Christiansen, H., & Oades, R. D. (2009). Negative priming within a stroop task in children
and adolescents with attention-deficit hyperactivity disorder, their siblings, and
independent controls. Journal of Attention Disorders. DOI: 10.1177/1087054708325974.
Chuah, Y. M. L., & Maybery, M. T. (1999). Verbal and Spatial Short-Term Memory: Common
Sources of Developmental Change? Journal of Experimental Child Psychology, 73, 7-44.
Cirino, P. T., Israelian, M. K., Morris, M. K. & Morris, R. D. (2005). Evaluation of the double-
deficit hypothesis in college students referred for learning disabilities. Journal of Learning
Disabilities, 38, 29-44.
Claude, D., & Firestone, P. (1995). The development of ADHD boys: A 12-year follow-up.
Canadian Journal of Behavioural Science, 27, 226-249.
Coffey, C. E., & Brumback, R. A. (2005). Pediatric neuropsychiatry. Philadelphia, PA:
Lippincott Williams & Wilkins.
Cohen, J. (1988). Statistical power analysis for the behavioral sciences (2nd ed.). Hillsdale,
New Jersey: Erlbaum.
Cohen, M. (1997). Children's memory scale. San Antonio: Psychological Corporation.
Cohen, N. J., Vallance, D. D., Barwick, M., Im, N., Menna, R., and Horodezky, N., & Isaacson,
L. (2000). The interface between ADHD and language impairment: An examination of
language, achievement, and cognitive processing. Journal of Child Psychology and
Psychiatry, 43, 353-362.
Colom, R., Abad, F., Rebollo, I., & Shih, P. C. (2005). Memory span and general intelligence:
A latent variable approach. Intelligence, 32, 623-642.
Colom, R., Flores-Mendoza, C., Quiroga, M. Á., & Privado, J. (2005). Working memory and
general intelligence: The role of short-term storage. Personality and Individual
Differences, 39, 1005-1014.
Compton, D. L. (2003). Modeling the relationship between growth in rapid naming speed and
growth in decoding skill in first-grade children. Journal of Educational Psychology, 95,
225-239.
Compton, D. L., DeFries, J. C, & Olson, R. K. (2001). Are RAN- and phonological awareness-
deficits additive in childrden with reading disabilities? Compton, D. L., DeFries, J. C, &
Olson, R. K. (2001). Are RAN- and phonological awareness-deficits additive in childrden
with reading disabilities? Dyslexia, 7, 125-149.

278
Compton, D. L., Olson, R. K., DeFries, J. C., & Pennington, B. F. (2002). Comparing the
relationships among two different versions of alphanumeric rapid automatized naming and
word level reading skills. Scientific Studies of Reading, 6, 343-368.
Conners, C. K. (1997). Conners' rating scales - revised: Instruments for use with children and
adolescents. New York, NY: Multi-Health Systems, Inc.
Corkin, S. (1974). Serial-ordering deficits in inferior readers. Neuropsychologia, 12, 347-354.
Corkum, P.V., & Siegel, L. S. (1993). Is the continuous performance task a valuable research
tool for use with children with attention-deficithyperactivity disorder? Journal of Child
Psychology and Psychiatry, 34, 1217-1239.
Corsi, P. M. (1972). Human memory and the medial temporal region of the brain. Unpublished
doctoral dissertation. McGill University, Montreal, Canada.
Critchley, M. (1964). Developmental dyslexia. London, UK: William Heinemann Medical
Books Limited.
Cronin, V., & Carver, P. (1998). Phonological sensitivity, rapid naming, and beginning reading.
Applied Psycholinguistics, 19, 447-461.
Crosbie, J. (2000). Inhibition as a marker for a familial subgroup of attention deficit
hyperactivity disorder. Unpublished masters thesis, University of Toronto.
Crystal, D. S., Ostrander, R., Chen, R. S., & August, G. J. (2001). Multimethod assessment of
psychopathology among DSM-IV subtypes of children with attention-deficit/hyperactivity
disorder: Self-, parent, and teacher reports. Journal of Abnormal Child Psycholoy, 29,
189-205.
Dalrymple-Alford, E. C., & Budayr, B. (1966). Examination of some aspects of the Stroop
colour-word test. Perceptual & Motor skills, 23, 1211-1214.
Daneman, M., & Carpenter, P.A. (1980). Individual differences in working memory and
reading. Journal of Verbal learning and Verbal Behavior, 19, 450–466.
Das, J. P., Mesink, D., & Mishra, R. K. (1990). Cognitive processes separating good and poor
readers when IQ is covaried. Learning and Individual Differences, 2, 423-436.
Decker, S. N. (1989). Cognitive processing rates among disabled and normal reading young
adults: A nine year follow-up study. Reading and Writing: An Interdisciplinary Journal, 2,
123-134.

279
DeFries, J. C., & Gillis, J. J. (1991). Etiology of reading deficits in learning disabilities:
Quantitative genetic analysis. In J.E. Obrzut & G.W. Hynd (Eds.), Neuropsychological
foundations of learning disabilities: A handbook of issues, methods and practice (pp. 29-
47). Orlando, FL: Academic Press.
Dejerine, J. (1892). Contribution a l‟etude anatomo-pathologique et clinique des differentes
varieties de cecite verbale [Contributions to the anatomic, pathologic, and clinical
investigation of different varieties of word blindness]. Memoires de la Societe de Biologie,
4, 61-90.
De Jong, P. F. (1998). Working memory deficits of reading disabled children. Journal of
Experimental Child Psychology, 70, 75-96.
De Jong, C. G. W., Oosterlaan, J., & Sergeant, J. A. (2006). The role of double dissociation
studies in the search for candidate endophenotypes for the comorbidity of attention deficit
hyperactivity disorder and reading disability. Journal of Disability, Development, and
Education, 53, 177-193.
De Jong, P. F., Seveke, M., & van Veen, M. (2000). Phonological sensitivity and the acquisition
of new words in children. Journal of Experimental Child Psychology, 76, 275-301.
De Jong, P. F., & van der Leij, A. (2003). Developmental changes in the manifestation of a
phonological deficit in dyslexic children learning to read a regular orthography. Journal of
Educational Psychology, 1, 22-40.
Della Sala, S., Gray, C., Baddeley, A., Allamano, N., & Wilson, L. (1999). Pattern span: A tool
for unwelding visuo-spatial memory. Neuropsychologia, 37, 1189-1199.
Denckla, M. B. (1972). Colour-naming deficits in dyslexic boys. Cortex, 8, 164-176.
Denckla, M. B. (1996). A theory and model of executive function: A neuropsychological
approach. In G. R. Lyon & N. A. Krasnegor (Eds.), Attention, memory, and executive
function (pp. 263-278). Baltimore: Paul H. Brookes.
Denckla, M. B., & Cutting, L. (1999). History and significance of rapid automatized naming.
Annals of Dyslexia, 49, 29-42.
Denckla, M., & Rudel, R. G. (1974). Rapid “automatized” naming of pictured objects, colors,
letters and numbers by normal children. Cortex, 10, 186-202.
Denckla, M. B., & Rudel, R. E. (1976a). Naming of objects by dyslexic and other learning-
disabled children. Brain and Language, 3, 1-15.

280
Denckla, M. B., & Rudel, R. G. (1976b). Rapid “automatized” naming (R.A.N.): Dyslexia
differentiated from other learning disabilities. Neuropsychologia, 14, 471-479.
Denckla, M. B., Rudel, R. G., & Broman, M. (1981). Tests that discriminate between dyslexic
and other learning-disabled boys. Brain and Language, 13, 118-129.
De Renzi, E., Faglioni, P., & Previdi, P. (1977). Spatial memory and hemispheric locus of
lesion. Cortex, 13, 424-433.
De Renzi, E., & Nichelli, P. (1975). Verbal and non-verbal short-term memory impairment
following hemispheric damage. Cortex, 11, 341-354.
Diamond, A. (2005). Attention-deficit disorder (attention-deficit/hyperactivity disorder without
hyperactivity): A neurobiologically and behaviorally distinct disorder from attention-
deficit/hyperactivity disorder (with hyperactivity). Developmental Psychopathology, 17,
807-825.
Donders, F. C. (1969). On the speed of mental processes. Acta Psychologica, 30, 412-431.
(Original work published 1868).
Douglas, V. I. (1972). Stop, look, and listen: The problem of sustained attention and impulse
control in hyperactive and normal children. Canadian Journal of Behavioural Science, 4,
259-282.
Douglas, V. I. (1980). Higher mental processes in hyperactive children: Implications for
training. In R. Knights & D. Bakker (Eds.), Treatment of hyperactive and learning
disordered children (pp. 65-92). Baltimore: University Park Press.
Douglas, V. I. (1983). Attentional and cognitive problems. In M. Rutter (Ed.), Developmental
neuropsychiatry (pp. 380-329). New York: Guilford Press.
Douglas, V. I. (1988). Cognitive deficits in children with attention deficit disorder with
hyperactivity. In L. M. Bloomingdale & J. A. Sergeant (Eds.), Attention deficit disorder:
Criteria, cognition, intervention (pp. 65-82). Oxford: Pergamon Press.
Douglas, V. I. (1989). Can Skinnerian theory explain attention deficit disorder? A reply to
Barkley. In L. M. Bloomingdale & J. Swanson (Eds.), Attention deficit disorder : Current
concepts and emerging trends in attentional and behavioral disorders of childhood (pp.
235-254). Elmsford, NY: Pergamon Press.

281
Douglas, V. I., Benezra, E. (1990). Supraspan verbal memory in attention deficit disorder
with hyperactivity, normal and reading disabled boys. Journal of Abnormal Child
Psychology, 18, 617-638.
Doyle, A. E., Willcutt, E. G., Seidman, L. J., Biederman, J., Chouinard, V. A., Silva, J., &
Faraone, S. V. (2005). Attention-deficit/hyperactivity disorder endophenotypes. Biological
Psychiatry, 57, 1324-1335.
Drewe, E. A. (1975). Go no-go learning after frontal lobe lesions in humans. Cortex, 11, 8-16.
Duncan, J., Emslie, H., Williams, P, Johnson, R., & Freer, C. (1996). Intelligence and the
frontal lobe: The organization of goal-directed behaviour. Cognitive Psychology, 30, 257-
303.
Duncan, J., Parr, A., Woolgar, A., Thompson, R., Bright, P., Cox, S., Bishop, S., & Nimmo-
Smith, I. (2008). Goal neglect and Spearman‟s g: Competing parts of a complex task.
Journal of Experimental Psychology: General, 137, 131-148.
Dykman, R., & Ackerman, P. T. (1991). ADD and specific reading disability: Separate but often
overlapping disorders. Journal of Learning Disabilities, 24, 96-103.
Dykman, R. A., & Ackerman, P. T. (1992). Diagnosing dyslexia: IQ regression plus cut points.
Journal of Learning Disabilities, 25, 574-576.
Eden, G. F., Stein, J. F., Wood, M. H., & Wood, F. B. (1995). Verbal and visual problems in
reading disability. Journal of Learning Disabilities, 28, 272-290.
Ehri, L., Nunes, S., Willows, D. Schuster, B. B., Yaghoub-Zadeh, Z., & Shanahan, T. (2001).
Phonemic awareness instruction helps children learn to read: Evidence from the National
Reading Panel's meta-analysis. Reading Research Quarterly, 36, 250-87.
Ehri, L. C., & Wilce, L. S. (1980). The influence of orthography on readers‟ conceptualisation
of the phonemic structure of words. Applied Psycholinguistics, 1, 371-385.
Ehri, L. C., & Wilce, L. S. (1983). Development of word identification speed in skilled and less
skilled beginning readers. Journal of Educational Psychology, 75, 3-18.
Elia, J., Ambrosini, P. J., & Rapoport, J. L. (1999). Treatment of attention-deficit-hyperactivity
disorder. The New England Journal of Medicine, 340, 780-789.
Epstein, J. N., Erkanli, A., Conners, C. K., Klaric, J., Costello, J. E., & Angold, A. (2003).
Relations between continuous performance test performance measures and ADHD
behaviours. Journal of Abnormal Child Psychology, 3, 543-554.

282
Epstein, J. N., Johnson, D. E., Varia, I. M. & Conners, C. K. (2001). Neuropsychological
assessment of response inhibition in adults with ADHD. Journal of Clinical and
Experimental Neuropsychology 23, 362–371.
Eriksen, V. A. (1995). The flander task and response competition: A useful tool for
investigating a variety of cognitive problems. Visual Cognition, 2, 101-118.
Eriksen, B. A., & Eriksen, C. W. (1974). Effects of noise letters on the identification of a target
letter in a nonsearch task. Perception and Psychophysics, 16, 143-149.
Everatt, J., Smythe, I., Ocampo, D., & Gyarmathy, E. (2004). Issues in the assessment of
literacy-related difficulties across language backgrounds: A cross-linguistic comparison.
Journal of Research in Reading, 27, 141-151.
Everatt, J., Warner, J., Miles, T. R., & Thomson, M. E. (1997). The incidence of Stroop
interference in dyslexia. Dyslexia, 3, 222-228.
Everatt, J., Weeks, S., Brooks, P. (2008). Profiles of strengths and weaknesses in dyslexia and
other learning difficulties. Dyslexia, 14, 16-41.
Everling, S., & Fischer, B. (1998). The antisccade: A review of basic research and clinical
studies. Neuropsychologia, 36, 885-889.
Facoetti, A., & Turatto, M. (2000). Asymmetrical visual fields distribution of attention in
dyslexic children: A neuropsychological study. Neuroscience Letters, 290, 216-218.
Faraone, S. V., Biederman, J., Lehman, B. K., Spencer, T., Norman, D., Seidman, L. J., Kraus,
I., Perrin, J., Chen, W. J., & Tsuang, M. T. (1993). Intellectual performance and school
failure in children with Attention Deficit Hyperactivity Disorder in their siblings. Journal
of Abnormal Psychology, 102, 616-623.
Farmer, E. W., Berman, J. V. F., Fletcher, Y. L. (1986). Evidence for a visuo-spatial scratchpad
in working memory. Quarterly Journal of Experimental Psychology, 38, 675-688.
Fawcett, A.J. (1989). Automaticity: A new framework for dyslexia research? PhD thesis,
University of Sheffield.
Fawcett, A., & Nicolson, R. (1994). Naming speed in children with dyslexia. Journal of
Learning Disabilities, 27, 641-646.
Felton, R. H., & Brown, I. S. (1990). Phonological processes as predictors of specific reading
skills in children at risk for reading failure. Reading and Writing: An Interdisciplinary
Journal, 2, 39-59.

283
Felton, R. H., & Brown, I. B. (1991). Nueorpsychological prediction of reading disabilities.
In J. E. Obrzut & G. W. Hynd (Eds.), Neuropsychological foundations of learning
disabilities (pp. 387-410). New York: Academic Press.
Felton, R. H., Naylor, C. E., & Wood, F. B. (1990). Neuropsychological profiles of adult
dyslexics. Brain and Language, 39, 485-497.
Felton, R. H. & Wood, F. B. (1989). Cognitive deficits in reading disability and Attention
Deficit Disorder. Journal of Learning Disabilities, 22, 3-13.
Felton, R. H., Wood, F. B., Brown, J. S., Campbell, S. K., & Harter, M. R. (1987). Separate
verbal memory and naming deficits in attention deficit disorder and reading disability.
Brain and Language, 31, 171-184.
Finn, R. (2009). Changes coming to ADHD diagnosis in the DSM-V. Pediatric News, 43, 1-2.
Fischer, K. W., Bernstein, J. H., & Immordino-Yang, M. H. (Eds.). (2007). Mind, brain, and
education in reading disorders. Cambridge, U.K.: Cambridge University Press.
Fischer, M., Barkley, R. A., Edelbrock, C. S., & Smallish, L. (1990). The adolescent outcome of
hyperactive children diagnosed by research criteria: II. Academic, attentional, and
neuropsychological status. Journal of Consulting and Clinical Psychology, 58, 580-588.
Fletcher, J. M., Coulter, W. A., Reschly, D. J., & Vaughn, S. (2004). Alternative approaches to
the definition and identification of learning disabilities: Some questions and answers.
Annals of Dyslexia, 54, 304-331.
Fletcher, J. M., Foorman, B. R., Shaywitz, S. E., & Shaywitz, B.A. (1999). Conceptual and
methodological issues in dyslexia research: A lesson for developmental disorders. In H.
Tager-Flusberg (Ed.), Neurodevelopmental disorders (pp. 271-306). Cambridge, MA:
MIT Press.
Fletcher, J. M., Francis, D. J., Shaywitz, S. E., Lyon, G. R., Foorman, B. R., Steubing, K. K., &
Shaywitz, B. A. (1998). Intelligent testing and the discrepancy model for children with
learning disabilities. Learning Disabilities Research and Practice, 13, 186-203.
Fletcher, J. M., Lyon, G. R., Fuchs, L. S., & Barnes, M. A. (2007). Learning disabilities: From
identification to intervention. New York: Guilford Press.
Fletcher, J. M., Shaywitz, S. E., Shankweiler, D. P., Katz, L., Liberman, I. Y., Stuebing, K. K.,
Francis, D. J., Fowler, A., & Shaywitz, B. A. (1994). Cognitive profiles of reading

284
disability: Comparisons of discrepancy and low achievement definitions. Journal of
Educational Psychology, 85, 1-18.
Flynn, J. M., & Rahbar, M. H. (1994). Prevalence of reading failure in boys compared with
girls. Psychology in the Schools, 31, 66-71.
Foorman, B. R., Francis, D. J., Beeler, T., Winikates, D., & Fletcher, J. (1997). Early
intervention for children with reading problems: Study designs and preliminary findings.
Learning Disabilities: A Multidisciplinary Journal, 8, 63-71.
Fox, B., & Routh, D. K. (1980). Phonemic analysis and severe reading disability in children.
Journal of Psycholinguistic Research, 9, 205-217.
Francis, D., Shaywitz, S., Steubing, K., Shaywitz, B., & Fletcher, J. (1996). Developmental lag
vs. deficit models of reading disability: A longitudinal, individual growth curves analysis.
Journal of Educational Psychology, 88, 3-17.
Frankenberger, W., & Fronzaglio, K. (1991). A review of states‟ criteria and procedures for
identifying children with learning disabilities. Journal of Learning Disabilities, 24, 495-
500.
Frazier, T. W., Demaree, H. A. & Youngstrom, E. A. (2004). Meta-analysis of intellectual and
neuropsychology test performance in attention-deficit/hyperactivity disorder.
Neuropsychology, 18, 543-555.
Frick, P. J., & Lahey, B. B. (1991). The nature and characteristics of attention-deficit
hyperactivity disorder. School Psychology Review, 20, 163-173.
Friedman, M. C., Chhabildas, N. Budhiraja, N., Willcutt, E. G., & Pennington, B. F. (2003).
Etiology of the comorbidity between RD and ADHD: Exploration of the non-random
mating hypothesis. American Journal of Medical Genetics, 120, 109-115.
Frings, C., Feix, S., Rothig, U., Bruser, C., & Junge, M. (2007). Children do show negative
priming: Further evidence for early development of an intact selective control mechanism.
Developmental Psychology, 43, 1269-1273.
Frobel-Smithee, J. A., Klorman, R., Brumaghim, J. T., & Borgstedt, A. D. (1998).
Methylphenidate does not modify the impact of response frequency or stimulus sequence
on performance and event-related potentials of children with attention deficit hyperactivity
disorder. Journal of Abnormal Child Psychology, 26, 233-245.

285
Fry, A. F., & Hale, S. (1996). Processing speed, working memory, and fluid intelligence:
Evidence for a developmental cascade. Psychological Science, 7, 237-241.
Funk, J. B., Chessare, J. B., Weaver, M. T., & Exley, A. R. (1993). Attention deficit
hyperactivity disorder, creativity, and the effects of methylphenidate. Pediatrics, 91, 816-
819.
Fuster, J. M. (1989). The prefrontal cortex (2nd
Ed.). New York: Raven Press.
Fuster, J. M. (1997). The prefrontal cortex (3rd ed.). New York: Lippincott-Raven.
Garlock, V. M., Walley, A. C., & Metsala, J. L. (2001). Age-of-acquisition, word frequency and
neighborhood density effects on spoken word recognition by children and adults. Journal
of Memory and Language, 45, 468-492.
Garralda, M. E., Yates, P., & Higginson, I. (2000). Child and adolescent mental health use.
HoNOSCA as an outcome measure. British Journal of Psychiatry, 177, 52-58.
Gathercole, S. E., & Alloway, T. P. (2006). Practitioner Review: Short-term and working
memory impairments in neurodevelopmental disorders: diagnosis and remedial support.
Journal of Child Psychology and Psychiatry, 47, 4-15.
Gathercole, S. E., Pickering, S. J., Ambridge, B., & Weaving, H. (2004). The structure of
working memory from 4-15 years. Developmental Psychology, 40, 177-190.
Gaub, M., & Carlson, C. L. (1997). Gender differences in ADHD: A meta-analysis and critical
review. Journal of the American Academy of Child and Adolescent Psychiatry, 36, 1036-
1045.
Gaultney, J. F., Kipp, K., Weinstein, J., & McNeil, J. (1999). Inhibition and mental effort in
attention deficit hyperactivity disorder. Journal of Developmental and Physical
Disabilities, 11, 105-114.
Gayán J. (2001). La evolución del estudio de la dislexia (The evolution of research on dyslexia).
Anuario de Psicología, 32, 3-30.
Gershon, J. (2002). A meta-analytic review of gender differences in ADHD. Journal of
Attention Disorders, 5, 143-154.
Geshwind, N. (1965). Disconnection syndromes in animals and man. I. Brain, 88, 237-294.
Geschwind, N., & Fusillo, M. (1966). Color-naming deficits in association with alexia. Archives
of Neurology, 15, 137-146.

286
Geurts, H.M., Vertie, S., Oosterlaan, J., Roeyers, H., & Sergeant, J.A. (2004). How specific
are executive functioning deficits in attention deficit hyperactivity disorder and autism?
Journal of Child Psychology and Psychiatry, 45, 836-854.
Ghelani, K., Sidhu, R., Jain, U., & Tannock, R. (2004). Reading comprehension and reading
related abilities in adolescents with reading disabilities and attention-deficit/hyperactivity.
Dyslexia, 10, 364-384.
Gilger, J. W., Borecki, I. B., Smith, S. D., DeFries, J. C., & Pennington, B. F. (1996). The
etiology of extreme scores for complex phenotypes: An illustration using reading
performance. In C. H. Chase, G. D. Rosen, & G. F. Sherman (Eds.), Developmental
dyslexia: Neural, cognitive, and genetic mechanisms (pp. 63-85). Baltimore, MD: York
Press.
Gilger, J. W., & Kaplan, B. J. (2001). Atypical brain development: a conceptual framework for
understanding developmental learning disabilities. Developmental Neuropsychology, 20,
465–481.
Gilger, J. W., Pennington, B. F., & DeFries, C. (1992). A twin study of the etiology of
comorbidity: Attention deficit hyperactivity disorder and dyslexia. Journal of the American
Academy of Child and Adolescent Psychiatry, 31, 343-348.
Gillberg, C. (2003). Deficits in attention, motor control, and perception: A brief review.
Archives of Disease in Childhood, 88, 904–910.
Gittelman, R., Mannuzza, S., Shenker, R., & Bonagura, N. (1985). Hyperactive boys almost
grown up. Archives of General Psychiatry, 42, 937-47.
Gittelman-Klein, R. (1987). Pharmacotherapy of childhood hyperactivity: An update. In H. Y.
Meltzer (Ed.), Psychopharmacology: The third generation of progress, (pp. 1215-1224).
New York: Raven Press.
Golden, C. J. (1978). The Stroop colour and word test. Chicago, Illinois: Stoelting Company.
Golden, N. E., & Steiner, S. R. (1969). Auditory and visual functions in good and poor readers.
Journal of Learning Disabilities, 2, 476-481.
Golden, Z. L., & Golden, C. J. (2002). Patterns of performance on the Stroop Colour and Word
Test in children with learning, attentional, and psychiatric disabilities. Psychology in the
Schools, 39, 489-495.

287
Gomez-Betancur, L. A., Pineda, D. A., & Aguirre-Acevedo, D. C (2005). Phonological
awareness in children with attention deficit disorder without learning disabilities. Revista
de Neurologia, 40, 581-586.
Goodman, R. SDQ: Information for researchers and professionals about the Strengths and
Difficulties Questionnaire. http://www.sdqinfo.com.
Goodman, R. (1997). The Strengths and Difficulties Questionnaire: A research note. Journal of
Child Psychology and Psychiatry, 38, 581-586.
Goodman, R. (1999). The extended version of the Strengths and Difficulties Questionnaire as a
guide to child psychiatric caseness and consequent burden. Journal of Child Psychology
and Psychiatry, 40, 791-801.
Goodman, R. (2001). Psychometric properties of the Strengths and Difficulties Questionnaire.
Journal of the American Academy of Child and Adolescent Psychiatry, 40, 1337-1345.
Goodman, R., Ford, T., Simmons, H., Gatward, R., & Meltzer, H. (2003). Using the Strengths
and Difficulties Questionnaire (SDQ) to screen for child psychiatric disorders in a
community sample. International Review of Psychiatry, 15, 166-172.
Goodman, R., Renfrew, D., & Mullick, M. (2000). Predicting type of psychiatric disorder from
Strengths and Difficulties Questionnaire (SDQ) scores in mental health clinics in London
and Dhaka. European Child and Adolescent Psychiatry, 9, 129-134.
Goodman, R., & Scott, S. (1999). Comparing the Strengths and Difficulties Questionnaire and
the Child Behavior Checklist: Is small beautiful? Journal of Abnormal child Psychology,
27, 17-24.
Gorenstein, E. E., Mammato, C. A., & Sandy, J. M. (1989). Performance of inattentive over-
active children on selected measures of prefrontal-type function. Journal of Clinical
Psychology, 45, 619-632.
Goswami, U., & Bryant, P. (1990). Phonological skills and learning to read. East Sussex, UK:
Erlbaum.
Gottesman, I. I., & Gould, T. D. (2003). The endophenotype concept in psychiatry: Etymology
and demographic features. American Journal of Psychiatry, 160, 636-645.
Gottesman, I., & Shields, J. (1972). Schizophrenia and genetics: A twin study vantage point.
New York: Academic Press.

288
Gould, J. H., & Glencross, D. J. (1990). Do children with a specific reading-disability have a
general serial ordering deficit? Neuropsychologia, 28, 271-278.
Gough, P. B., Ehri, L. C., & Treiman, R. (1992). Reading acquisition. Hillsdale, New Jersey:
Erlbaum.
Gowers, S. G., Harrington, R. C., Whitton, A., Lelliott, P., Beeevor, A., Wing, J., et al. (1999).
Brief scale for measuring the outcomes of emotional and behavioural disorders in children.
Health of the Nation Outcome Scales for Children and Adolescents (HoNOSCA). British
Journal of Psychiatry, 174, 413-416.
Grant, D. A., & Berg, E. A. (1948). A behavioral analysis of degree of reinforcement and ease
of shifting to new responses in a Weigl-type card-sorting problem. Journal of
Experimental Psychology, 38, 404-411.
Gray, J. A. (1987). The psychology of fear and stress (2nd
ed.). Cambridge, UK: Cambridge
University Press.
Green, W. (1992). Pharmacotherapy: Stimulants. Child and Adolescent Psychiatric Clinics of
North America, 1, 411-427.
Greenhill, L. L. (1992). Nonstimulant drugs in the treatment of ADHD. Child and Adolescent
Psychiatric Clinics of North America, 1, 449-465.
Grodzinsky, G. M., & Diamond, R. (1992). Frontal lobe functioning in boys with attention-
deficit hyperactivity disorder. Developmental Neuropsychology, 8, 427-445.
Groth-Marnat, G. (1990). Handbook of psychological assessment. New York: Wiley.
Groth-Marnat, G. (2003). Handbook of psychological assessment (4th ed.). New York: Wiley.
Hale, S. (1990). A global developmental trend in cognitive processing speed. Child
Development, 61, 653–663.
Hale, S., Fry, A. F., & Jessie, K. A. (1993). The effects of practice on speed of information
processing children and adults: Age sensitivity and age invariance. Developmental
Psychology, 29, 880-892.
Hall, S. J., Halperin, J. M., Schwartz, S. T., & Newcorn, J. H. (1997). Behavioural and
executive functions in children with attention-deficit hyperactivity disorder and reading
disability. Journal of Attention Disorders, 1, 234-247.
Hallahan, D. P., Kauffman, J. M., & Lloyd, J. W. (1985). Introduction to learning disabilities.
Englewood Cliffs, NJ: Prentice-Hall.

289
Hallet, P. E., & Adams, B. D. (1980). The predictability of saccadic latency in a novel
voluntary oculomotor task. Vision Research, 20, 329-339.
Hallgren, B. (1950). Specific dyslexia (congenital word-blindness): A clinical and genetic study.
Acta Psychiatrica et Neurologica, Supplement 65, 1-287.
Hammill, D. D. (2004). What we know about correlates of reading. Exceptional Children, 70,
453-468.
Healey, D., & Rucklidge, J. J. (2006). An investigation into the relationship among ADHD
symptomatology, creativity, and neuropsychological functioning in children. Child
Neuropsychology, 12, 421-438.
Heaton, R. K. (1981). Wisconsin card sort test manual. Odessa, FL: Psychological Assessment
Resources.
Helland, T., & Asbjornsen, A. (2000). Executive functions in dyslexia. Child Neuropsychology,
6, 37-48.
Herjanic, B. (1983). The Washington diagnostic interview for children and adolescents.
Missouri: Washington University Medical Centre.
Hick, W. E. (1952). On the rate of gain of information. Quarterly Journal of Experimental
Psychology, 4, 11-26.
Hicks, C. (1980). The ITPA Visual Sequential Memory Task: An alternative interpretation and
the implications for good and poor readers. British Journal of Educational Psychology, 50,
16-25.
Hinshelwood, J. (1895). Word-blindness and visual memory. Lancet, 2, 1564-1570.
Holborow, P. L., & Berry, P. S. (1986). Hyperactivity and learning difficulties. Journal of
Learning Disabilities, 19, 426-431.
Holdnack, J. A., Moberg, P. J., Arnold, S. E., Gur, R. C., & Gur, R. E. (1995). Speed of
processing and verbal learning deficits in adults diagnosed with attention deficit disorder.
Neuropsychiatry, Neuropsychology and Behavioral Neurology, 8, 282-292.
Holtmann, M., Matei, A., Hellmann, U., Becker, K., Poustka, F., & Schmidt, M. H. (2006).
Rolandic spikes increase impulsivity in ADHD: A neuropsychological pilot study. Brain
and Development, 28, 633-640.

290
Homack, S., & Riccio, C. A. (2004). A meta-analysis of the sensitivity and specificity of the
Stroop colour and word test with children. Archives of Clinical Neuropsychology, 19, 725-
743.
Hommel, B., Li, K. Z. H., & Li, S-C. (2004). Visual search across the life span. Developmental
Psychology, 40, 545-558.
Hoskyn, M., & Swanson, H. L. (2000). Cognitive processing of low achievers and children with
reading disabilities: A selective meta-analytic review of the published literature. School
Psychology Review, 29, 102-119.
Houghton, S., Douglas, G., West, J., Whiting, K., Wall, M., Langsford, S., Powell, L., &
Carroll, A. (1999). Differential patterns of executive function in children with attention-
deficit hyperactivity disorder according to gender and subtype. Journal of Child
Neurology, 14, 801-805.
Hoza, B. (2007). Peer functioning in children with ADHD. Journal of Pediatric Psychology, 32,
655-663.
Hoza, B., Waschbusch, D. A., Owens, J. S., Pelham, W. E., & Kipp, H. (2001). Academic task
persistence of normally achieving ADHD and control boys: Performance, self-evaluations,
and attributions. Journal of Consulting and Clinical Psychology, 69, 271-283.
Hulme, C., Maughan, S., & Brown, G. D. A. (1991). Memory for words and non-words:
Evidence for a long-term memory contribution to short-term memory tasks. Journal of
Memory and Language, 30, 685-701.
Hulme, C., & Snowling, M. (1992). Phonological deficits in dyslexia: a reappraisal of the verbal
deficit hypothesis. In N. Singh & I. Beale (Eds.), Current perspectives in learning
disabilities, (pp. 270-331). New York: Springer-Verlag.
Hutton, S. B., & Ettinger, U. (2006). The antisaccade task as a research tool in
psychopathology: A critical review. Psychophysiology, 43, 302-313.
Iles, J., Walsh, V., & Richardson, A. (2000). Visual search performance in dyslexia. Dyslexia, 6,
163-177.
Interagency Committee on Learning Disabilities. (1987). Learning disabilities: A report to
Congress. Bethesda, MD: National Institute of Health.
Ishihara, S. (1954). Tests for colour blindness (11th Ed.). London: H. K. Lewis.

291
Ivanoff, J. (2003). On spatial response code activation in a Simon task. Acta Psychologia,
112, 157-159.
Jarrold, C., Baddeley, A., & Phillips, C. (2002). Verbal short-term memory in Down syndrome:
A problem of memory, audition, or speech? Journal of Speech, Language, and Hearing
Research, 45, 531-544.
Jeffries, S., & Everatt, J. (2004). Working memory: Its role in dyslexia and other specific
learning difficulties. Dyslexia: An International Journal of Research and Practice, 10,
196-214.
Jerman, O., & Swanson, H. L. (2005). Working memory and reading disabilities: A selective
meta-analysis of the literature. In T. E. Scruggs, & M. A. Mastopieri (Eds.), Cognition and
learning in diverse settings (pp. 1-31).
Joanisse, M. F., Manis, F. R., Keating, P., & Seidenberg, M. S. (2000). Language deficits in
dyslexic children: Speech perception, phonology, and morphology. Journal of
Experimental Child Psychology, 77, 30-60.
Johannsen, W. (2003). Om arvelighed i samfund og i rene linier. Royal Danish Academy of
Sciences and Letters, 3, 247-270.
Johnson, C. J., Paivio, A., & Clark, J. M. (1996). Cognitive components of picture naming.
Psychological Bulletin, 120, 113-139.
Johnson, H. M. (1994). Processes of successful intentional forgetting. Psychological Bulletin,
116, 274-292.
Johnston, C. (2002). The impact of attention deficit hyperactivity disorder on social and
vocational functioning in adults. In P.S. Jensen & J.R. Cooper (Ed.), Attention Deficit
Hyperactivity Disorder: State of the science and best practices (pp 61-66). New Jersey:
Civic Research Institute, Inc.
Jorm, A. F. (1983). Specific reading retardation and working memory: A review. British
Journal of Psychology, 74, 311-342.
Kagan, J. (1966). Reflection-impulsivity: The generality and dynamics of conceptual tempo.
Journal of Abnormal Psychology, 71, 17-24.
Kail, R. (1986). Sources of age differences in speed of processing. Child Development, 57, 969-
987.

292
Kail, R. (1991). Developmental change in speed of processing during childhood and
adolescence. Psychological Bulletin, 109, 490-501.
Kail, R. (1992). Processing speed, speech rate, and memory. Developmental Psychology, 28,
899-904.
Kail, R. (2004). Cognitive development includes global and domain-specific processes. Merrill-
Palmer Quarterly, 50, 445-455.
Kail, R., & Hall, L. K. (1994). Processing speed, naming speed, and reading. Developmental
Psychology, 30, 949-954.
Kail, R., & Hall, L. K. (1999). Sources of developmental change in children‟s word-problem
performance. Journal of Educational Psychology, 91, 660-668.
Kail, R., Wolters, C. A., Yu, S. L., & Hagen, J. W. (2000). Brief report: Speed of information
processing in children with insulin-dependent diabetes mellitus. Journal of Pediatric
Psychology, 25, 515-520.
Kalff, A. C., De Sonneville, L. M. J., Hurks, P. P. M., Hendriksen, J. G. M., Kroes, M., Feron,
F. J. M. Steyaert, J., Van Zeben, T. M. C. B., Vles, J. S. H., & Jolles, J. (2005). Speed,
speed variability, and accuracy of information processing in 5 to 6-year-old children at risk
of ADHD. Journal of the International Neuropsychological Society, 11, 173-183.
Kalff, A. C., Hendriksen, J. G., Kroes, M., Vles, J. S., Steyaert, J., Feron, F. J., van Zeben, T., &
Jolles, J. (2002). Neurocognitive performance of 5- and 6-year-old children who met
criteria for attention deficit/hyperactivity disorder at 18 months follow-up: Results from a
prospective population study. Journal of Child Psychology and Psychiatry, 30, 589-598.
Kane, M. J., Conway, A. R. A., Hambrick, D. Z., & Engle, R. W. (2007). Variation in working-
memory capacity as variation in executive attention and control. In A. R. A. Conway, C.
Jarrold, M. J. Kane, A. Miyake, & J. Towse (Eds.), Variation in working memory (pp. 21-
48). Oxford: Oxford University Press.
Kane, M. J., & Engle, R. W. (2002). The role of prefrontal cortex in working-memory capacity,
executive attention, and general fluid intelligence: An individual differences perspective.
Psychonomic Bulletin & Review, 9, 637-671.
Kane, M. J., & Engle, R. W. (2003). Working memory capacity and the control of attention: The
contributions of goal neglect, response competition, and task set to Stroop interference.
Journal of Experimental Psychology: General, 132, 47-70.

293
Kaplan, B. J., Crawford, S. G., Wilson, B. N., & Dewey, D. (1997). Comorbidity of
developmental coordination disorder and different types of reading disability. Journal
of International Neuropsychology Society, 3, 54 .
Kaplan, B. J., Dewey, D., Crawford, S., & Fisher, G. (1998). Deficits in long-term memory are
not characteristic of ADHD. Journal of Clinical and Experimental Neuropsychology, 20,
518-528.
Karatekin, C. (2004). A test of the integrity of the components of Baddeley's model of working
memory in Attention-Deficit/Hyperactivity Disorder (ADHD). Journal of Child
Psychology & Psychiatry, 45, 912-926.
Karatekin, C., & Asarnow, R. F. (1998). Working memory in childhood onset schizo-phrenia
and attention-deficit hyperactivity disorder. Psychiatry Research, 80, 165-176.
Kass, C. E. (1966). Psycholinguistic disabilities of children with reading problems. Exceptional
Children, 32, 533-539.
Katz, R. B. (1986). Phonological deficiencies in children with reading-disability – evidence
from an object naming task. Cognition, 22, 225-257.
Kaufman, A. S., & Kaufman, N. L. (1983). K-ABC: Kaufman assessment battery for children.
Circle Pines, MN: American Guidance Service.
Kelly, K. L., & Judd, D. B. (1976). Colour: Universal language and dictionary of colour
names. National Bureau of Standards Special Publication 440. Washington, U.S.:
Government Printing Office.
Kelly, M. S., Best, C. T., & Kirk, U. (1989). Cognitive processing deficits in reading
disabilities: A prefrontal cortical hypothesis. Brain and Cognition, 11, 275-293.
Kempton, S., Vance, A., Maruff, P., Luk, E., Costin, J., & Pantelis, C. (1999). Executive
function and attention deficit hyperactivity disorder: stimulant medication and better
executive function performance in children. Psychological Medicine, 29, 527-538.
Kerns, K., McInerney, R. J., & Wilde, N. J. (2001). Time reproduction, working memory, and
behavioral inhibition in children with ADHD. Neuropsychology, Development, and
Cognition. Section C, Child Neuropsychology, 7, 21-31.
Klauer, K. C., & Zhao, Z. (2004). Double dissociations in visual and spatial short-term memory.
Journal of Experimental Psychology: General, 133, 355-381.

294
Klein, R. G., & Mannuzza, S. (1991). Long-term outcome of hyperactive children: A
review. Journal of the American Academy of Child and Adolescent Psychiatry. 30, 383-
387.
Kleinmann, A., Lewandowski, L., Sheffield, R., & Gordon, M. (2005). Processing speed and
ADHD. The ADHD Report, 13, 6-8.
Klingberg, T., Fernell, E., Olesen, P., Johnson, M., Gustafsson, P., Dahlstrom, K., Gillberg, C.
G., Forssberg, H., & Westerberg, H. (2005). Computerised training of working memory in
children with ADHD – a randomized controlled trial. Journal of the American Academy of
Child and Adolescent Psychiatry, 44, 177-186.
Klingberg, T., Forssberg, H., & Westerberg, H. (2002). Increased brain activity in
frontal and parietal cortex underlies the development of visuo-spatial working
memory capacity during childhood. Journal of Cognitive Neuroscience, 14, 1-
10.
Klorman, R., Brumaghim, J. T., Fitzpatrick, P. A., & Borgstedt, A. D. (1990). Clinical effects of
a controlled trial of methylphenidate on adolescents with attention deficit disorder. Journal
of the American Academy of Child and Adolescent Psychiatry, 29, 702-709.
Klorman, R., Hazel-Fernandez, L. A., Shaywitz, S. E., Fletcher, J. M., Marchione, K. E.,
Holahan, J. M., Stuebing, K. K., & Shaywitz, B. A. (1999). Executive functioning deficits
in attention-deficit hyperactivity disorder are independent of oppositional disorder or
reading disorder. Journal of the American Academy of Child and Adolescent Psychiatry,
38, 1148-1155.
Koelega, H. S. (2007). Is the continuous performance task useful in research with ADHD
children? Comments on a review. Journal of Child Psychology and Psychiatry, 36, 1477-
1485.
Koppiz, E. M. (1975). Bender Gestalt Test, visual aural digit span test and reading achievement.
Journal of Learning Disabilities, 8, 32-35.
Korhonen, T. T. (1995). The persistence of rapid naming problems in children with reading
disabilities: A nine-year follow-up. Journal of Learning Disabilities, 28, 232-239.
Korkman, M. (1988). NEPSY: Neuropsychological assessment of children. Helsinki, Finland:
Psykologien Kustannus.

295
Korkman, M. & Pesonen, A. E. (1994). A comparison of neuropsychological test profiles of
children with Attention Deficit-Hyperactivity Disorder and/or Learning Disorder. Journal
of Learning Disabilities, 27, 383-392.
Kropotov, J. (2009). Quantitative EEG, event-related potentials and neurotherapy. San Diego,
CA: Academic Press.
Kuntsi, J., Oosterlaan, J., & Stevenson, J. (2001). Psychological mechanisms in hyperactivity:
Response inhibition deficit, working memory impairment, delay aversion, or something
else? Journal of Child Psychology & Psychiatry, 42, 199-210.
Kuntsi, J., & Stevenson, J. (2001). Psychological mechanisms in hyperactivity: II The role of
genetic factors. Journal of Child Psychology & Psychiatry and Allied Disciplines, 42, 211-
219.
Kussmaul, A. (1878). Word-deafness and word-blindness. In H. v. Ziemssen (Ed.), Cyclopaedia
of the practice of medicine. London: Sampson Row, Maston, Searle, & Rivingstone.
Kyllonen, P. C., & Christal, R. E. (1990). Reasoning ability is (little more than) working-
memory capacity?! Intelligence, 14, 389-433.
Lahey, B.B., Applegate, B., McBurnett, K., Biederman, J., Greenhill, L., Hynd, G.W., Barkley,
R.A., Newcorn, J., Jensen, P., Richters, J., Garfinkel, B., Kerdyk, L., Frick, P.J., Ollendick,
T., Perez, D., Hart, E.L., Waldman, I., & Shaffer, D. (1994). DSM-IV field trials for
attention-deficit / hyperactivity disorder in children and adolescents. American Journal of
Psychiatry, 151, 1673-1685.
Lahey, B. B., Carlson, C. L., & Frick, P. J. (1997). Attention-deficit disorder without
hyperactivity. In T. A. Widiger, A. J. Frances, H. A. Pincus, R. Ross, M. B. First, & W.
Davis (Eds.), DSM-IV source book (pp. 163-188). Washington, DC: American Psychiatric
Association.
Lambe, E. K. (1999). Dyslexia, gender, and brain imaging. Neuropsychologia, 26, 410-425.
Lambert, N. M., & Sandoval, J. (1980). The prevalence of learning disabilities in a sample of
children considered hyperactive. Journal of Abnormal Child Psychology, 8, 33-50.
Landau, S., & McAninch, C. (1993). Young children with attention deficits. Young Children,
48, 49-58.
Lange, E. B. (2005). Disruption of attention by irrelevant stimuli in serial recall. Journal of
Memory and Language, 53, 513-531.
296
Langsford, S., Houghton, S., Douglas, G., & Whiting, K. (2001). Prevalence and
comorbidity of child and adolescent disorders in Western Australian mainstream school
students. Psychiatry On-Line: http://www.priory.com/psycont.htm.
Lansbergen, M. M., Kenemans, J. L., & van Engeland, H. (2007). Stroop interference and
attention-deficit/hyperactivity disorder: A review and meta-analysis. Neuropsychology, 21,
251-262.
Laufer, M., & Denhoff, E. (1957). Hyperkinetic behavior syndrome in children. Journal of
Pediatrics, 50, 463-474.
Lavoie, M. E., & Charlebois, P. (1994). The discriminant validity of the Stroop Colour and
Word Test: Toward a cost-effective strategy to distinguish subgroups of disruptive
preadolescents. Psychology in the Schools, 31, 98-107.
Lawrence, V., Houghton, S., Douglas, G., Durkin, K., Whiting, K., & Tannock, R. (2004).
Executive function and ADHD: A comparison of children‟s performance during
neuropsychological testing and real-world activities. Journal of Attention Disorders, 7,
137-149.
Lazar, J. & Frank, Y. (1998). Frontal systems dysfunction in children with Attention-
Deficit/Hyperactivity Disorder and learning disabilities. Journal of Neuropsychiatry &
Clinical Neurosciences, 10, 160-167.
Lecerf, T., & Roulin, J. L. (2006). Distinction between visuo-spatial short-term memory and
working memory tasks. Swiss Journal of Psychology, 65, 37-54.
Lemiere, J., Wouters, H., Sterken, C., Lagae, L, Sonuga-Barke, E., & Danckaerts, M. (2010).
Are children with ADHD predominantly inattentive and combined subtypes different in
terms of aspects of everyday attention? European Child & Adolescent Psychiatry, 19, 679-
685.
Leung, P. W. L., & Connolly, K. J. (1996). Distractibility in hyperactive and children. Journal
of Child Psychology and Psychiatry, 37, 305-312.
Levy, B.A., & Hinchley, J. (1990). Individual and developmental differences in the acquisition
of reading skills. In T.H. Carr, and B.A. Levy, (Eds.) Reading and its development:
Component skills approaches (pp. 81-128). New York: Academic Press.

297
Lewinsohn, P. M., Hops, H., Roberts, R. E., Seeley, J. R., & Andrews, J. A. (1993).
Adolescent psychopathology: I. Prevalence and incidence of depression and other DSM-
III-R disorders in high school students. Journal of Abnormal Psychology, 102, 133-144.
Lezak, M. (1995). Neuropsychological assessment (3th edn). New York: Oxford University
Press.
Li, S-C, & Lewandowsky, S. (1995). Forward and backward recall: Different retrieval
processes. Journal of Experimental Psychology: Learning, Memory, and Cognition, 21,
837-847.
Liberman, I. Y. (1971). Basic research in speech and lateralization of language: Some
implications for reading disability. Bulletin of the Orton Society, 21, 71-87.
Liberman, I., Liberman, A. M., Mattingly, I., & Shankweiler, D. (1980). Orthography and the
beginning reader. In J. F. Kavanaugh, & R. L. Venezky (Eds.), Orthography, reading, and
dyslexia. Baltimore: University Park Press.
Liberman, I. Y., & Shankweiler, D. (1979). Speech, the alphabet, and teaching to read. In L. B.
Resnick & P. A. Weaver (Eds.), Theory and practice of early reading (pp. 109-132). New
Jersey: Erlbaum.
Liberman, I. Y., & Shankweiler, D. (1985). Phonology and problems of learning to read and
write. Remedial and Special Education, 6, 8-17.
Liberman, I., Shankweiler, D., Fischer, F., & Carter, B. (1974). Explicit syllable and phoneme
segmentation in the young child. Journal of Experimental Child Psychology, 18, 201-212.
Liberman, I. Y., Shankweiler, D., & Liberman, A. M. (1989). The alphabetic principle and
learning to read. In D. Shankweiler & I. Y. Liberman (Eds.), Phonology and reading
disability: Solving the reading puzzle. Research Monograph Series. Ann Arbor: University
of Michigan Press.
Light, J. G., Pennington, B. F., Gilger, J. W., & DeFries, J. C. (1995). Reading disability and
hyperactivity disorder: Evidence for a common genetic etiology. Developmental
Neuropsychology, 11, 323–335.
Lijffijt, M., Kenemans, J. L., Verbaten, M. N., & van Engeland, H. (2005). A meta-analytic
review of stopping performance in attention-deficit/hyperactivity disorder: Deficient
inhibitory motor control? Journal of Abnormal Psychology, 114, 216-222.

298
Lima, S. D., Hale, S., & Myerson, J. (1991). How general is general slowing? Evidence
from the lexical domain. Psychology and Aging, 6, 416–425.
Lindamood, C., & Lindamood, P. (1971). Lindamood auditory conceptualization test. Boston:
Teaching Resources Corporation.
Logan, G. D. (1994). On the ability to inhibit thought and action: A users` guide to the stop-
signal paradigm. In D. Dagenbach, & T. H. Carr (Eds.), Inhibitory processes in attention,
memory, and language. (pp. 189-239). San Diego: Academic Press.
Logan, G. D., & Cowan, W. B. (1984). On the ability to inhibit thought and action: A theory of
an act of control. Psychological Review, 91, 295-327.
Logan, G. D., Cowan, W. B., & Davis, K. A. (1984). On the ability to inhibit responses in
simple and choice reaction time tasks: A model and a method. Journal of Experimental
Psychology: Human Perception and Performance, 10, 276-291.
Loge, D. V., Staton, R. D., & Beatty, W. M. (1990). Performance of children with ADHD on
tests sensitive to frontal lobe dysfunction. Journal of the American Academy of Child &
Adolescent Psychiatry, 29, 540-545.
Logie, R. H. (1986). Visuo-spatial processing in working memory. Quarterly Journal of
Experimental Psychology, 38, 229-247.
Logie, R. H. (1995). Visuo-spatial working memory. Hillsdale, New Jersey: Lawrence Erlbaum
Associates, Inc.
Logie, R. H., & Marchetti, C. (1991). Visuo-spatial working memory: Visual, spatial or central
executive? In C. Cornoldi & M. A. McDaniels (Eds.), Mental images in human cognition
(pp. 72-102). New York: Springer.
Logie, R. H., & Salway, A. F. S. (1990). Working memory and modes of thinking: A secondary
task approach. In K. Gilhooly, M. Keane, R. Logie & G. Erdos (Eds.), Lines of thinking:
Reflections on the psychology of thought (Vol. 2, pp. 99-113). Chichester: Wiley.
Lorsbach, T. C. & Gray, J. L. (1985). The development of encoding processes in learning
disabled children. Journal of Learning Disabilities, 18, 222-227.
Losier, B. J., McGrath, P. J., & Klein, R. M. (1996). Error patterns on the continuous
performance test in non-medicated and medicated samples of children with and without
ADHD: A meta-analytic review. Journal of Child Psychology and Psychiatry, 37, 971-
987.

299
Lovett, M. W. (1987). A developmental approach to reading disability: Accuracy and speed
criteria of normal and deficient reading skill. Child Development, 58, 234-260.
Lovett, M. W., Borden, S.L., DeLuca, T., Lacerenza, L., Benson, N. J., &
Blackstone, D. (1994). Treating the core deficits of developmental dyslexia:
Evidence of transfer of learning after phonological and strategy-based reading
training programs. Developmental Psychology, 30, 805-822.
Lubs, H. A., Rabin, M., Feldman, E., Jallad, B. J., Kushch, A., & Gross-Glenn, K. (1993).
Familial dyslexia: Genetic and medical findings in eleven three-generation families.
Annals of Dyslexia, 43, 44-60.
Lufi, D., & Cohen, A. (1985). Using the WISC-R to identify attentional deficit disorder.
Psychology in the Schools, 22, 40-42.
Lufi, D., Cohen, A., & Parish-Plass, J. (1990). Identifying attention deficit hyperactivity with
the WISC-R and the Stroop Colour and Word Test. Psychology in the Schools, 27, 28-34.
Lundberg, I. (1991). Reading as an individual and social skill. In I. Lundberg & T. Hoien (Eds.),
Literacy in a world of change (pp. 14-22). Stavanger: Centre for Reading Research.
Lyon, G. R. (1998). The NICHD research program in reading development, reading disorders,
and reading instruction: A summary of research findings. National Institute of Child
Health and Human Development, National Institutes of Health.
Lyon, G. R., & Fletcher, J. M. ( 2001). Early identification, prevention and early intervention
for children at-risk for reading failure. Basic Education, 46, 12-14.
Lyon, G. R., Fletcher, J. M., & Barnes, M. A. (2003). Learning disabilities. In E. J. Mash & R.
A. Barkley (Eds.), Child Psychopathology (2nd
Ed.) (pp. 520-588). New York: Guilford
Press.
Mackey, P., & Kopras, A. (2001). Medication for attention deficit/hyperactivity disorder
(ADHD): An analysis by federal electorate. Parliament of Australia Current Issues Brief,
11, 2000-2001.
MacLeod, C. M. (1991). Half a century of research on the Stroop effect: An integrative review.
Psychological Bulletin, 109, 163-203.
MacLeod, C. M., & Prior, M. (1996). Attention deficits in adolescents with ADHD and other
clinical groups. Child Neuropsychology, 2, 1-10.

300
Maedgen, J. W., & Carlson, C. L. (2000). Social functioning and emotional regulation in the
attention deficit hyperactivity disorder subtypes. Journal of Clinical Child Psychology, 29,
30-42.
Manis, F. R., & Doi, L. M. (1995). Word naming speed, phonological coding, and orthographic
knowledge in dyslexic and normal readers. Paper presented at the annual meeting of the
Society for Research in Child Development, Indianapolis, IN.
Mann, V. A. (1986). Why some children encounter reading problems. In J. K. Torgesen & B. L.
Wong (Eds.), Psychological and educational perspectives on learning disabilities (pp.
139-159). Orlando, Florida: Academic Press.
Mann, V. A. (1991). Phonological awareness and early reading ability: One perspective. In D. J.
Sawyer & B. J. Fox (Eds.), Phonological awareness in reading. The evolution of current
perspective (pp. 191-215). New York: Springer-Verlag.
Mann, V. A., Cowin, E., & Schoenheimer, J. (1989). Phonological processing, language,
comprehension and reading ability. Journal of Learning Disabilities, 22, 76-89.
Mann, V. A., & Liberman, I. Y. (1984). Phonological awareness and verbal short-term memory.
Journal of Learning Disabilities, 10, 592-599.
Mannuzza, S., & Klein, R. (1999). Adolescent and adult outcomes in attention
deficit/hyperactivity disorder. In H. C. Quay and A.E. Hogan (Eds.), Handbook of
disruptive behaviour disorders, (pp. 279-294). New York: Klumer Academic/Plenum
Publishers.
Mannuzza, S., Klein, R., Bessler, A., Malloy, P., & LaPadula, M. (1993). Adult outcome of
hyperactive boys: Educational achievement, occupational rank, and psychiatric status.
Archives of General Psychiatry, 50, 565-576.
Mariani, M. A. & Barkley, R. A. (1997). Neuropsychological and academic functioning in
preschool boys with Attention Deficit Hyperactivity Disorder. Developmental
Neuropsychology, 13, 111-129.
Martinussen, R., Hayden, J., Hogg-Johnson, S., & Tannock, R. (2005). A meta-analysis of
working memory impairments in children with attention-deficit/hyperactivity disorder.
Journal of the American Academy of Child and Adolescent Psychiatry, 44, 377-384.

301
Martinussen, R., & Tannock, R. (2006). Working memory impairments in children with
attention-deficit hyperactivity disorder with and without comorbid language learning
disorders. Journal of Clinical and Experimental Neuropsychology, 28, 1073-1094.
Mash, E. J., & Barkley, R. A. (2007). Assessment of childhood disorders. New York: Guildord
Press.
Mash, E. J., Heffernan, K., & Barkley, R. A. (2003). Child psychopathology. New York:
Guilford Press.
Mathai, J., Anderson, P., & Bourne, A. (2002). The Strengths and Difficulties Questionnaire
(SDQ-Deu) and the child behaviour checklist. European Child and Adolescent Psychiatry,
9, 271-276.
Maybery, M., & Do, N. (2003). Relationships between facets of working memory and
performance on a curriculum-based mathematics test in children. Educational and Child
Psychology, 20, 77-92.
Mayes, S. D., & Calhoun, S. L. (2006). WISC-IV and WISC-III Profiles in Children With
ADHD. Journal of Attention Disorders, 9, 486-493.
McBride-Chang, C., & Manis, F. R. (1996). Structural invariance in the associations of naming
speed, phonological awareness, and verbal reasoning in good and poor readers: A test of
the double deficit hypothesis. Reading and Writing: An Interdisciplinary Journal, 8, 323-
339.
McConaughy, S. H., Mattison, R. E., & Peterson, R. (1994). Behavioural/emotional problems of
children with serious emotional disturbance and learning disabilities. School Psychology
Review, 23, 81-98.
McDougall, S., & Hulme, C. (1994). Short-term memory, speech rate and phonological
awareness as predictors of learning to read. In C. Hulme & M. Snowling (Eds.), Reading
development and reading disabilities (pp. 31-44). London: Whurr.
McFarland, D.L., Kolstad, R., & Briggs, L.D. (1994). Education attention-deficit hyperactivity
disorder children. Education, 115, 597-603.
McGee, R. A., Clark, S. E., & Symons, D. K. (2000). Does the Conners‟ Continuous
Performance Test aid in ADHD diagnosis? Journal of Abnormal Child Psychology, 28,
415-424.

302
McGee, R., Feehan, M., Williams, S., Partridge, F., Silva, P. A., & Kelly, J. (1990). DSM-
III disorders in a large sample of adolescents. Journal of the American Academy of Child
and Adolescent Psychiatry, 29, 611-619.
McGough, J. J., & McCracken, J. T. (2006). Adult attention deficit hyperactivity disorder:
Moving beyond DSM-IV. The American Journal of Psychiatry, 163, 1673-1675.
McInnes, A., Humphries, T., Hogg-Johnson, S., & Tannock, R. (2003). Listening
comprehension and working memory are impaired in Attention-Deficit Hyperactivity
Disorder irrespective of language impairment. Journal of Abnormal Child Psychology, 31,
427-443.
McKeowan, R. E. (2004). Estimation of National Rates of ADHD: Impact of Impairment
Definitions and Analysis of Health Services Utilization. American Public Health
Association: Public Health and the Environment.
http://apha.confex.com/apha/132am/techprogram/paper_94506.htm
McVay, J. C., & Kane, M. J. (2009). Conducting the train of thought: Working memory
capacity, goal neglect, and mind wandering in an executive-control task. Journal of
Experimental Psychology: Learning, Memory, and Cognition, 35, 196-204.
Meyer, M. S., Wood, F. B., Hart, L. A., & Felton, R. H. (1998). Selective predictive value of
rapid automatized naming in poor readers. Journal of Learning Disabilities, 31, 106-117.
Milich, R., Carlson, C. L., Pelham, W. E., & Licht, B. (1991). Effects of methylphenidate on the
persistence of ADHD boys following failure experience. Journal of Abnormal Child
Psychology, 19, 519-536.
Milich, R., Hartung, C. M., Martin, C. A., & Haigler, E. D. (1994). Behavioural disinhibition
and underlying processes in adolescents with disruptive disorders. In D. K. Routh (Ed.),
Disruptive behaviour disorders in childhood (pp. 109-138). New York: Plenum Press.
Milich, R., & Loney, J. (1979). The role of hyperactive and aggressive symptomology in
predicting adolescent outcome among hyperactive children. Journal of Pediatric
Psychology, 10, 93-112.
Miller, D. C., Kavcic, V., & Leslie, J. E. (1996). ERP changes induced by methylphenidate in
boys with attention deficit hyperactivity disorder. Journal of Attention Disorders, 1, 95-
113.

303
Miller, L. T., & Vernon, P. A. (1997). Developmental changes in speed of information
processing in young children. Developmental Psychology, 33, 544-548.
Miller-Shaul, M. (2005). The characteristics of young and adult dyslexic readers on reading and
reading related cognitive tasks as compared to normal readers. Dyslexia, 11, 132-151.
Milner, A. D., Jeeves, M. A., Ratcliff, P. J., & Cunnison, J. (1982). Interference effects of verbal
and spatial tasks on simple visual reaction time. Neuropsycbologia, 20, 591- 595.
Milner, B. (1971). Interhemispheric differences in the localisation of psychological processes in
man. Cortex, 27, 272-277.
Minshew, N. J., Goldstein, G., Muenz, L. R., & Payton, L. R. (1992). Neuropsychological
functioning in nonmentally retarded autistic individuals. Journal of Clinical and
Experimental Neuropsychology, 14, 749-761.
Misra, M., Katzir, T., Wolf, M., & Poldrack, R. A. (2004). Neural systems of rapid automatized
naming in skilled readers: Unraveling the RAN-reading relationship. Scientific Studies of
Reading, 8, 241-256.
Missiuna, C. (Ed.). (2001). Children with developmental coordination disorder: Strategies for
success. New York: Haworth Press.
Mitsis, E. M., McKay, K. E., Schulz, K. P., Newcorn, J. H., & Halperin, J. M. (2000). Parent-
teacher concordance in DSM-IV attention-deficit/hyperactivity disorder in a clinic-referred
sample. Journal of the American Academy of Child and Adolescent Psychiatry, 39, 308-
313.
Miyake, A., Friedman, N. P., Emerson, M. J., Witzke, A. H., Howerter, A., & Wager, T. D.
(2000). The unity and diversity of executive functions and their contribution to complex
and “frontal lobe tasks”: A latent variable analysis. Cognitive Psychology, 41, 49-100.
Miyake, A., Friedman, N.P., Rettinger, D.A., Shah, P., & Hegarty, M. (2001). How are visuo-
spatial working memory, executive functioning and spatial abilities related? A latent-
variable analysis. Journal of Experimental Psychology General, 130, 621-640.
Moore, C. J., & Price, C. J. (1999). A functional neuroimaging study of the variables that
generate category-specific object processing differences. Brain, 122, 943-962.
Muir-Broaddus, J. E., Rosenstein, L. D., Medina, D., & Soderberg, C. (2002).
Neuropsychological test performance of children with ADHD relative to test norms and
parent behavioural ratings. Archives of Clinical Neuropsychology, 17, 671-689.

304
Mullane, J. C., Corkum, P., Klein, R. M., & McLaughlin, E. N. (2008). Interference control
in children with and without ADHD: A systematic review of flander and simon task
performance. Child Neuropsychology, 15, 321-342.
Mullane, J. C., & Klein, R. M. (2008). Literature review: Visual search by children with and
without ADHD. Journal of Attention Disorders, 12, 44-53.
Munsell, A. H. (1929). Munsell book of colour. Baltimore, MD: Munsell Colour.
Murphy, L. A., Pollatsek, A., & Well, A. D. (1988). Developmental dyslexia and word retrieval
deficits. Brain and Language, 35, 1-23.
Murray, D. J. (1967). The role of speech responses in short-term memory. Canadian Journal of
Psychology, 21, 263-276.
Myerson, J., Ferraro, F. R., Hale, S., & Lima, S. D. (1992). General slowing in semantic
priming and word recognition. Psychology and Aging, 7, 257-270.
Narhi, V., Rasanen, P., Metsapelto, R. L., & Ahonen, T. (1997). Trail Making Test in assessing
children with reading disabilities: A test of executive functions or content information.
Perceptual and Motor Skills, 84, 1355-1362.
National Reading Panel. (2000). Teaching children to read: An evidence-based assessment of
the scientific research literature on reading and its implications for reading instruction.
Washington, DC: National Institute of Child Health and Human Development.
Neale, M. (1989). Neale analysis of reading ability (Revised Ed.). Australia: ACER.
Neill, W. T. (1977). Inhibition and facilitation processes in selective attention. Journal of
Experimental Psychology: Human Perception and Performance, 3, 444-450.
Nettlebeck, T., & Wilson, C. (1985). A cross sequential analysis of developmental differences
in speed of visual information processing. Journal of Experimental Child Psychology, 40,
1-22.
Neuhaus, G.F., Foorman, BR., Francis, D.J., and Carlson, C. (2001). Measures of information
processing in Rapid Automatized Naming (RAN) and their relation to reading. Journal of
Experimental Child Psychology, 78, 359-373.
Neumarker, K. J. (2005). The Kramer-Pollnow syndrome: A contribution on the life and work
of Franz Kramer and Hans Pollnow. History of Psychiatry, 16, 435-451.

305
Newman, J. P., & Wallace, J. F. (1993). Diverse pathways to deficient self-regulation :
Implications for disinhibitory psychopathology in children. Clinical Psychology Review,
13, 699-720.
Newman, J. P., Widom, C. S., & Nathan, S. (1985). Passive avoidance in syndromes of
disinhibition: Psychopathy and extraversion. Journal of Personality and Social
Psychology, 48, 1316-1327.
Nicolson, R. I., & Fawcett, A.J. (1990). Automaticity: A new framework for dyslexia research.
Cognition, 35, 159-182.
Nicolson, R. I., & Fawcett, A.J. (1994). Reaction times and dyslexia, Quarterly Journal of
Experimental Psychology, 47, 29-48.
Nigg, J. T. (2001). Is ADHD a disinhibitory disorder? Psychological Bulletin, 127, 571-598.
Nigg, J. T. (2006). What causes ADHD?: Understanding what goes wrong and why. New York:
Guilford Press.
Nigg, J. T., Blaskey, L. G., Huang-Pollock, C. L., & Rappley, M. D. (2002). Executive
functions and DSM-IV ADHD subtypes. Journal of American Academy of Child and
Adolescent Psychiatry, 41, 59-66.
Nigg, J. T., Hinshaw, S. P., Carte, E. T., & Treuting, J. J. (1998). Neuropsychological correlates
of childhood attention-deficit/hyperactivity disorder: Explainable by comorbid disruptive
behavior or reading problems? Journal of Abnormal Psychology, 107, 468-480.
Nigg, J. T., Willcutt, E. G., Doyle, A. E., & Sonuga-Barke, E. J. S. (2005). Causal heterogeneity
in attention-deficit/hyperactivity disorder: Do we need neuropsychologically impaired
subtypes? Biological Psychiatry, 57, 1224-1230.
Nittrouer, S. (1999). Do terminal processing deficits cause phonological processing problems?
Journal of Speech, Language, and Hearing Research, 42, 925-942.
Nyden, A., Gillberg, C., Hjelmquist, E., & Heiman, M. (1999). Executive function/attention
deficits in boys with Asperger syndrome, attention disorder and reading/writing disorder.
Autism, 3, 213-223.
Oakhill, J. V., Yuill, N., & Parkin, A. J. (1986). On the nature of the difference between skilled
and less-skilled comprehenders. Journal of Research in Reading, 9, 80–91.
Obregon, M. (1994). Exploring naming timing patterns by dyslexic and normal readers on the
serial RAN task. Unpublished master‟s thesis, Tufts University, Boston.

306
O‟Brien, B. A., Wolf, M., Morris, R., & Lovett, M. (2004). An investigation of subtypes of
developmental dyslexia using taxometric classification. New Research Directions In
Neuroscience. http://www.tc.umn.edu/~athe0007/BNEsig/papers/OBrien.pdf
Offord, D. R., Boyle, M. H., Szatmari, P., Rae-Grant, N., Links, P. S., Cadman, D. T., Byles, J.
A., Crawford, J. W., Blum, H. M., Byrne, C., Thomas, H., & Woodward, C. A. (1987).
Ontario Child Health Study: II. Six-month prevalence of disorder and rates of service
utilization. Archives of General Psychiatry, 44, 832-836.
Oie, M., Sundet, K., & Rund, B. R. (1999). Contrasts in memory functions between adolescents
with schizophrenia or ADHD. Neuropsychologia, 37, 1351-1358.
Olson, R. K., & Wise, B. (1992). Reading on the computer with orthographic and
speech feedback: An overview of the Colorado remediation project. Reading
& Writing: An interdisciplinary Journal, 4, 107-144.
O‟Moldin, S. O., & Rubenstein, J. L. R. (2006). Understanding autism: From basic
neuroscience to treatment. Florida, US: CRC Press.
Oosterlaan, J., Logan, G. D., & Sergeant, J. A. (1998). Response inhibition in AD/HD, CD,
comorbid AD/HD+CD, anxious, and control children: A meta-analysis of studies with the
stop task. Journal of Child Psychology and Psychiatry and Allied Disciplines, 39, 411-425.
Oosterlaan, J., Scheres, A., & Sergeant, J. A. (2005). Which executive functioning deficts are
associated with AD/HD, ODD/CD and comorbid AD/HD+ODD/CD? Journal of Abnormal
Child Psychology, 33, 69-85.
O'Shaughnessy, T. E., & Swanson, H. L. (1998). Do immediate memory deficits in students
with learning disabilities in reading reflect a developmental lag or deficit?: A selective
meta-analysis of the literature. Learning Disability Quarterly, 21, 123-148.
Ossman, J. M., & Mulligan, N. W. (2003). Inhibition and attention deficit hyperactivity disorder
in adults. American Journal of Psychology, 116, 35-50.
Owen, F. W., Adams, P. A., Forrest, T., Stolz, L. M., & Fisher, S. (1971). Learning disorders in
children: sibling studies. Monographs of the Society for Research in Child Development,
36, (4, Serial No. 144).
Ozonoff, S., Strayer, D. L., McMahon, W. M., & Filloux, F. (1998). Inhibitory deficits in
Tourette syndrome: A function of comorbidity an symptom severity. Journal of Child
Psychology and Psychiatry, 39, 1109-1118.

307
Palacios, E. D., & Semrud-Clikeman, M. (2005). Delinquency, hyperactivity, and
phonological awareness: A comparison of adolescents with ODD and ADHD. Applied
Neuropsychology, 12, 94-105.
Palmer, S. (2000). Phonological recoding deficit in working memory of dyslexic teenagers.
Journal of Research in Reading, 23, 28-40.
Palmer, E. D., & Finger, S. 2001. An early description of ADHD (Inattention Subtype): Dr.
Alexander Crichton and the "Mental Restlessness" (1798). Child Psychology and
Psychiatry Reviews, 6, 66-73.
Parmentier, F. B. R., Elford, G., & Maybery, M. T. (2005). Transitional information in spatial
serial memory: Path characteristics affect recall performance. Journal of Experimental
Psychology: Learning, Memory, & Cognition, 31, 412-427.
Pasini, A., Paloscia, C., Allessandrelli, R., Porfirio, M. C., & Curatolo, P. (2007). Attention and
executive functions profile in drug naïve ADHD subtypes. Brain & Development, 29, 400-
408.
Pauc, R. (2005). Comorbidity of dyslexia, dyspraxia, attention deficit disorder (ADD), attention
deficit hyperactive disorder (ADHD), obsessive compulsive disorder (OCD) and
Tourette‟s syndrome in children: A prospective epidemiological study. Clinical
Chiropractic, 8, 189-198.
Paulik, G. (2003). Cognitive components underlying rapid automatized naming deficits in
ADHD and reading disorder. Unpublished Honours Thesis, University of Western
Australia, Crawley.
Paulik, G., Maybery, M. T., & Hogben, J. H. (2003). A meta-analysis of rapid automatized
naming studies: Divergent patterns of deficit for ADHD and reading disorder.
Unpublished study, University of Western Australia, Crawley.
Pennington, B. F. (1991). Diagnosing learning disorders: A neuropsychological framework.
New York: Guilford Press.
Pennington, B. F. (1999). Toward an integrated understanding of dyslexia: Genetic,
neurological, and cognitive mechanisms. Development and Psychopathology, 11, 629-654.
Pennington, B. R. (2006). From single to multiple deficit models of developmental disorders.
Cognition, 101, 385–413.

308
Pennington, B. F., Cardoso-Martins, C., Green, P. A., & Lefly, D. L. (2001). Comparing the
phonological and double deficit hypotheses for developmental dyslexia. Reading and
Writing: An Interdisciplinary Journal, 14, 707-755.
Pennington, B. F., Groisser, D., & Welsh, M. C. (1993). Contrasting cognitive deficits in
attention deficit hyperactivity disorder versus reading disability. Developmental
Psychology, 29, 511-523.
Pennington, B.F. & Olson, R.K. (2005). Genetics of dyslexia. In M. Snowling & C. Hulme
(Eds.), The science of reading: A handbook. (pp. 453–472). Oxford: Blackwell Publishing.
Pennington, B. F. & Ozonoff, S. (1996). Executive functions and developmental
psychopathology. Journal of Child Psychology & Psychiatry, 37, 51-87.
Pennington, B. F., Van Orden, G. C., Smith, S. D., Green, P. A., & Haith, M. M. (1990).
Phonological processing skills and deficits in adult dyslexics. Child Development, 61,
1753-1778.
Perfetti, C. A. (1986). Continuities in reading acquisition, reading skill, and reading disability.
Remedial and Special Education, 7, 11-21.
Perfetti, C.A., Beck, I., Bell, L.C. & Hughes, C. (1987). Phonemic knowledge and learning to
read are reciprocal: A longitudinal study of first grade children. Merrill-Palmer Quarterly,
33, 283-319.
Perfetti, C.A., Finger, E., and Hogabaum, T. (1978). Sources of vocalization latency differences
between skilled and less skilled young readers. Journal of Educational Psychology, 70,
730-739.
Perry, P., & Kuperman, S. (2004). Attention-deficit hyperactivity disorder pharmacotherapy.
http://www.vh.org/adult/provider/psychiatry/CPS/39.html
Perugini, E. M., Harvey, E. A., Lovejoy, D. W., Sandstrom, K., & Webb, A. H. (2000). The
predictive power of combined neuropsychological measures of
attentiondeficit/hyperactivity disorder in children. Child Neuropsychology, 6, 101-114.
Petrides, M., & Milner, B. (1982). Deficits on subject-ordered tasks after frontal- and temporal-
lobe lesions in man. Neuropsychologia, 12, 323-330.
Phelps, L. (1996). Discriminative validity of the WRAML with ADHD and LD children.
Psychology in the Schools, 33, 5-12.

309
Pickering, S. J. (2006). Working memory in dyslexia. In T. P. Alloway & S. E. Gathercole
(Eds.). Working memory and neurodevelopmental disorders (pp. 7-40). New York:
Psychology Press.
Pickering, S. J., & Chubb, R. (2005). Working memory in dyslexia: A comparison of
performance of dyslexics and reading age controls on the WMTB-C. [Reported in
Pickering, S. J. (2006). Working memory in dyslexia. In T. P. Alloway & S. E. Gathercole
(Eds.). Working memory and neurodevelopmental disorders (pp. 7-40). New York:
Psychology Press.] Manuscript in preparation.
Pickering, S. J., & Gathercole, S. E. (2001). Working memory test battery for children. London:
Harcourt.
Pickering, S. J., & Gathercole, S. E. (2005). The working memory test battery for children.
London: Psychological Corporation.
Pickering, S. J., & Zacharof, C. (2005). Identifiable patterns of working memory performance in
Greek children with developmental dyslexia. Manuscript in preparation.
Piek, J. P., Pitcher, T. M., & Hay, D. A. Motor coordination and kinaethesis in boys with
attention deficit-hyperactivity disorder. Developmental Medicine and Child Neurology, 41,
159-165.
Pitcher, T., Piek, J., & Hay, D. (2003). Fine and gross motor ability in males with ADHD.
Developmental Medicine and Child Neurology, 45, 525-535.
Pocklington, B. (2000). Naming speed performance indicates a phonological and semantic
deficit in attention-deficit/hyperactivity disorder. Unpublished honours thesis, University
of Western Australia, Crawley.
Pocklington, B., & Maybery, M. (2006). Proportional slowing or disinhibition in ADHD?: A
Brinley plot meta-analysis of Stroop colour and word test performance. International
Journal of Disability, Development, & Education, 53, 67-91.
Potter, A. S., & Newhouse, P. A. (2004). Effects of acute nicotine on behavioral
inhibition in adolescents with attention-deficit/hyperactivity disorder.
Psychopharmacology, 176, 182–194.
Prifitera, A., Saklofske, D. H., & Weiss, L. G. (2004). WISC-IV clinical use and interpretation:
Scientist-practitioner perspectives. San Diego, California: Academic Press.

310
Pringle-Morgan, W. (1896). A case of congenital word blindness. British Medical Journal,
2, 1378.
Prior, M. R. (1989). Reading Disability: "Normative" or "pathological". Australian Journal of
Psychology, 41, 135-158.
Prior, M., Smart, D., Sanson, A., & Oberklaid, F. (1999). Relationships between learning
difficulties and psychological problems in preadolescent children from a longitudinal
sample. Journal of the American Academy of Child and Adolescent Psychiatry, 38, 429-
436. doi:10.1097/00004583-199904000-00016
Pritchard, V. E., Healy, D., & Neumann, E. (2006). Assessing selective attention abilities in
ADHD, highly creative and normal young children via Stroop negative priming effects. In
C. M. Fletcher-Flinn & G. M. Habermann (Eds.), Cognition, language, and development:
Perspectives from New Zealand (pp. 207-224). Brisbane: Australian Academic Press.
Pritchard, V. E., & Neumann, E. (2004). Negative priming effects in children engaged in non-
spatial tasks: Evidence for early development of an intact inhibitory mechanism.
Developmental Psychology, 40, 191-203.
Pritchard, V. E., Neumann, E., & Rucklidge, J. J. (2007). Interference and negative priming
effects in adolescents with attention deficit hyperactivity disorder. American Journal of
Psychology, 120, 91-122.
Protopapas, A., Archonti, A., & Skaloumbakas, C. (2007). Reading ability is negatively related
to Stroop interference. Cognitive Psychology, 54, 251-281.
Purvis, K., & Tannock, R. (2000). Phonological processing, not inhibitory control, differentiates
ADHD and reading disability. Journal of the American Academy of Child and Adolescent
Psychiatry, 39, 485-494.
Quay, H. C. (1988). Attention-deficit disorder and the behavioral inhibition system: The
relevance of the neuropsychological theory of Jeffrey A. Gray. In L. M. Bloomingdale & J.
Sergeant (Eds.), Attention-deficit disorder: Criteria, cognition, intervention (pp. 117-126).
New York: Pergamon.
Quay, H. C. (1997). Inhibition and attention deficit hyperactivity disorder. Journal of Abnormal
Child Psychology, 25, 7-13.
Quinlan, P. T. (2003). Visual feature integration theory: Past, present, and future. Psychological
Bulletin, 129, 643-673.
311
Rack, J. P., Snowling, M. J., Olson, R. K. (1992). The nonword reading deficit in
developmental dyslexia: A review. Reading Research Quarterly, 27, 29-53.
Ramautar, J. R., Kok, A., & Ridderinkhof, K. R. (2004). Effects of stop-signal probability in the
stop-signal paradigm: The N2/P3 complex further validated. Brain and Cognition, 56, 234-
252.
Ramus, F. (2006). Genes, brain and cognition: A roadmap for the cognitive scientist. Cognition
Special Issue (Vol. 101). Amsterdam: Elsevier Press.
Ramus, F., Rosen, S., Dakin, S., Day, B., Catellote, J., White, S., & Uta, F. (2003). Theories of
developmental dyslexia: Insights from a multiple case study of dyslexic adults. Brain, 126,
841-865.
Ransby, M. J., & Swanson, H. L. (2003). Reading comprehension skills of young adults with
childhood diagnosis of Dyslexia. Journal of Learning Disabilities, 36, 538-555.
Rao, D. C., & Gu, C. C. (2008). Genetic dissection of complex traits. San Diego, CA: Academic
Press.
Rapport, M. D., Alderson, R. M., Kofler, M. J., Sarver, D. E., Bolden, J., & Sims, V. (2008).
Working Memory Deficits in Boys with Attention-deficit/Hyperactivity Disorder (ADHD):
The Contribution of Central Executive and Subsystem Processes. Journal of Abnormal
Child Psychology. DOI 10.1007/s10802-008-9215-y
Rathvon, N. (2004). Early reading assessment: A practitioners‘ handbook. New York: Guilford
Press.
Reader, M. J., Harris, E. L., Schuerholz, L. J., & Denckla, M. B. (1994). Attention Deficit
Hyperactivity Disorder and executive dysfunction. Developmental Neuropsychology, 10,
493-512.
Reardon, S. M., & Naglieri, J. A. (1992). PASS cognitive processing characteristics of normal
and ADHD males. Journal of School Psychology, 30, 151-163.
Reeve, W. V., & Schandler, S. L. (2001). Frontal lobe functioning in adolescents with attention
deficit hyperactivity. Adolescence, 36, 749-765.
Reitan, R. (1958). Validity of the Trail Making Test as an indication of organic brain damage.
Perceptual and Motor Skills, 8, 271-276.
Reitan, R. M., & Wolfson, D. (1985). Neuroanatomy and neuropathology. Tucson, Arizona:
Neuropsychology Press.

312
Reiter, A., Tucha, O., & Lange, K. W. (2005). Executive functions in children with dyslexia.
Dyslexia, 11, 116-131.
Reynolds, C. R. (1997). Forward and backward memory span should not be combined for
clinical analysis. Archives of Clinical Neuropsychology, 12, 29-40.
Reynolds, C. R., & Bigler, E. D. (1994). Test of memory and learning. Austin, TX: PRO-ED.
Riccio, C. A., & Jemison, S. J. (1998). ADHD and emergency literacy. Influence of language
factors. Reading and Writing Quarterly, 14, 43-59.
Rizzo, N. D. (1939). Studies in visual and auditory memory span with special reference to
reading disability. Journal of Experimental Education, 8, 208-244.
Rodriguez-Fornells, A., Lorenzo-Seva, U., & Andres-Pueyo, A. (2002). Are high-impulsive and
high risk-taking people more motor disinhibited in the presence of incentive? Personality
and Individual Differences, 32, 661-683.
Romine, C. B., Lee, D., Wolfe, M. E., Homack, S., George, C., & Riccio, C. A. (2004).
Wisconsin card sorting test with children: a meta-analytic study of sensitivity and
specificity. Archives of Clinical Neuropsychology, 19, 1027-1041.
Roodenrys, S. (2006). Working memory function in attention deficit hyperactivity disorder. In
T. P. Alloway & S. E. Gathercole (Eds.). Working memory and neurodevelopmental
disorders (pp. 187-212). New York: Psychology Press.
Roodenrys, S., Koloski, N., & Grainger, J. (2001). Working memory function in Attention
Deficit Hyperactivity Disordered and Reading Disabled children. British Journal of
Developmental Psychology, 19, 325-337.
Rosen, V. M., & Engle, R. W. (1997). The role of working memory capacity in retrieval.
Journal of Experimental Psychology: General, 126, 211-227.
Rosner, J., & Simon, D. P. (1971). The auditory analysis test: An initial report. Journal of
Learning Disabilities, 4, 40-48.
Rosvold, H. E., Mirsky, A. F., Sarason, I., Bransome, E. D. Jr., & Beck, L. H. (1956). A
continuous performance test of brain damage. Journal of Consulting Psychology, 20, 343-
350.
Rowland, A. S., Umbach, D. M., Catoe, K. E., Long, S., Rabiner, D., Naftel, A. J., Panke, D.,
Faulk, R., & Sandler, D. P. (2001). Studying the epidemiology of attention-deficit

313
hyperactivity disorder: Screening method and pilot results. Canadian Journal of
Psychiatry, 46, 931-940.
Rubia, K., Oosterlaan, J., Sergeant, J. A., Brandeis, D., & van Leeuwen, T. (1998). Inhibitory
dysfunction in hyperactive boys. Behavioural Brain Research, 94, 25-32.
Rubia, K., Overmeyer, S., Taylor, E., Brammer, M., Williams, S. C. R., Simmons, A., &
Bullmore, E. T. (1999). Hypofrontality in attention deficit hyperactivity disorder during
higher-order motor control: A study with functional MRI. American Journal of Psychiatry,
156, 891-896.
Rucklidge, J. J. (2006). Impact of ADHD on the neurocognitive functioning of adolescents with
bipolar disorder. Biological Psychiatry, 60, 921-928.
Rucklidge, J. J. & Tannock, R. (2002). Neuropsychological profiles of adolescents with ADHD:
Effects of reading difficulties and gender. Journal of Child Psychology & Psychiatry &
Allied Disciplines, 43, 988-1003.
Rugel, R. P. (1974). WISC subtest scores of disabled readers: a review with respect to
Bannatyne‟s recategorization. Journal of Learning Disabilities, 1, 57-64.
Sadock, B. J., Kaplan, H. I., & Sadock, V. A. (2007). Kaplan & Sadock's synopsis of psychiatry:
Behavioral sciences/clinical psychiatry. Philadelphia, PA: Lippincott Williams & Wilkins.
Salthouse, T. A., & Kail, R. (1983). Memory development throughout the life span: The role of
processing rate. In P. B. Baltes & O. G. Brim (Eds.), Life-span development and behaviour
(Vol. 5). New York: Academic Press.
Sattler, J. M. (1992). Assessment of children (3rd
Ed.). San Diego: Jerome M. Sattler, Publisher,
Inc.
Saunders, B., & Chambers, S. (1996). A review of the literature on attention deficit
hyperactivity disorder children: Peer interactions and collaborative learning. Psychology in
the Schools, 33, 333-340.
Savage, R. S. (2004). Motor skills, Automaticity and Developmental Dyslexia: A review of the
research literature. Reading and Writing: An Interdisciplinary Journal, 17, 301-324.
Sawyer, M.G., Arney, F. M., Baghurst, P. A., Clark, J. J., Graetz, B. W., Kosky, R. J.,
Nurcombe, B., Patton, G. C., Prior, M. R., Raphael, B., Rey, J. M., Whaites, L. C., &
Zubrick, S. R. (2000). The national survey of mental health and wellbeing: The mental

314
health of young people in Australia. Canberra: Commonwealth Department of Health
and Aged Care.
Scahill, L., & Schwab-Stone, M. (2000). Epidemiology of ADHD in school-age children. Child
and Adolescent Psychiatric Clinics of North America, 9, 541-555.
Scarborough, H. (1989). Prediction of reading disability from familial and individual
differences. Journal of Educational Psychology, 81, 101-108.
Scarborough, H. (1998). Predicting the future achievement of second graders with reading
disabilities: Contributions of phonemic awareness, verbal memory, rapid naming, and IQ.
Annals of Dyslexia, 48, 115-136.
Scarborough, H. S. (1990). Very early language deficits in dyslexic children. Child
Development, 61, 1728-1743.
Scarborough, H. S., & Domgaard, R. M. (1998). An exploration of the relationship between
reading and rapid serial naming. Poster presented at meeting of Society for Scientific
Study of Reading.
Schachar, R., Logan, G. D., Robaey, P., Chen, S., Ickowicz, A., & Barr, C. (2007). Restraint
and cancellation: Multiple inhibition deficits in attention deficit hyperactivity disorder.
Journal of Abnormal Child Psychology, 35, 229-238.
Schachar, R. J., Tannock, R., & Logan, G. (1993). Inhibitory control, impulsiveness, and
attention deficit hyperactivity disorder. Clinical Psychology Review, 13, 721-739.
Schachar, R., Mota, V. L., Logan, G. D., Tannock, R., & Klim, P. (2000). Confirmation of an
inhibitory control deficit in attention-deficit/hyperactivity disorder. Journal of Abnormal
Child Psychology, 28, 227-235.
Schatschneider, C., Fletcher, J. M., Francis, D. J., Carlson, C. D., & Foorman, B. R. (2004).
Kindergarten prediction of reading skills: A longitudinal comparative analysis. Journal of
Educational Psychology, 96, 265-282.
Scheres, A., Oosterlaan, J., Geurts, H., Morein-Zamir, S., Meiran, N., Schut, H., Vlasveld, L., &
Sergeant, J. A. (2003). Executive functioning in AD/HD: An inhibition deficit or more?
Archives of Clinical Neuropsychology, 19, 569-594.
Scheres, A., Oosterlaan, J., & Sergeant, J. A. (2001). Response Inhibition in children with
DSM-IV subtypes of ADHD and related disruptive disorders: the role of reward. Child
Neuropsychology, 7, 172-189.

315
Schiffer, R. B., Rao, S. M., & Fogel, B. S. (2003). Neuropsychiatry: A comprehensive
textbook. Philadelphia, PA: Lippincott Williams & Wilkins.
Schmitz, M., Cadore, L., Paczko, M., Kipper, L., Chaves, M., Rohde, L. A., Moura, C., &
Knijnik, M. (2002). Neuropsychological performance in DSM-IV ADHD subtypes: An
exploratory study with untreated adolescents. Canadian Journal of Psychiatry, 47, 863-
869.
Schneider, W., Roth, E., & Ennemoser, M. (2000). Training phonological skills and letter
knowledge in children at risk for dyslexia: A comparison of three kindergarten intervention
strategies. Journal of Educational Psychology, 92, 284-295.
Schuerholz, L. J., Harris, E. L., Baumgardner, T. L., Reiss, A. L., Freund, L. S., Church, R. P.,
Mohr, J., & Denckla, M. B. (1995). An analysis of two discrepancy-based models and a
processing-deficit approach in identifying learning disabilities. Journal of Learning
Disabilities, 28, 18-29.
Schwartz, K., & Verhaeghen, P. (2008). ADHD and Stroop interference from age 9 to age 41
years: a meta-analysis of developmental effects. Psychological Medicine, 38, 1607-1616.
Schweitzer, J., Hanford, R., & Medoff, D. (2006). Working memory deficits in adults with
ADHD: Is there evidence for subtype differences? Behavioral Brain Functions, 2, 43.
Seidman, L. J., Benedict, K., Biederman, J., Bernstein, J., Seiverd, K., Milberger, S., Norman,
D., Mick, E., & Faraone, S. (1995). Performance of ADHD children on the Rey-Osterrieth
complex figure: A pilot neuropsychological study. Journal of Child Psychology and
Psychiatry, 36, 1459-1473.
Seidman, H. J., Biederman, J., Faraone, S. V., Weber, W., Mennin, D., & Jones, J. (1997a). A
pilot study of neuropsychological function in girls with ADHD. Journal of the American
Academy of Child and Adolescent Psychiatry, 36, 366-373.
Seidman, H. J., Biederman, J., Faraone, S. V., Weber, W., & Ouelette, C. (1997b). Toward a
neuropsychology of attention deficit-hyperactivity disorder: Performance of children and
adolescents from a large clinically referred sample. Journal of Consulting and Clinical
Psychology, 65, 150-160.
Seidman, L. J., Biederman, J., Mounteaux, M. C.,Weber, W.,& Faraone, S. V. (2000).
Neuropsychological functioning in nonreferred siblings of children with Attention
Deficit/Hyperactivity Disorder. Journal of Abnormal Psychology, 109, 252–265.

316
Seidman, L. J., Biederman, J., Faraone, S. V., Milberger, S., Norman, D., Seiverd, K.,
Benedict, K., Guite, J., Mick, E., & Kiely, K. (1995). Effects of family history and
comorbidity on the neuropsychological performance of children with ADHD: Preliminary
findings. Journal of the American Academy of Child and Adolescent Psychiatry, 34, 1015-
1024.
Seidman, L. J., Biederman, J., Monuteaux, M. C., Valera, E. V., Doyle, A. E., & Faraone, S. V.
(2005). Impact of gender and age on executive functioning: Do girls and boys with and
without attention deficit hyperactivity disorder differ neuropsychologically in preteen and
teenage years? Developmental Neuropsychology, 27, 79-105.
Semrud-Clikeman, M., Biederman, J., Sprich-Buckminster, S., Lehman, B. K., Faraone, S. V.,
& Norman, D. (1992). Comorbidity between ADHD and learning disability: A review and
report in a clinically referred sample. Journal of the American Academy of Child and
Adolescent Psychiatry, 31, 439-448.
Semrud-Clikeman, M., Guy, K., Griffin, J. D., & Hynd, G. W. (2000a). Rapid naming deficits
in children and adolescents with reading disabilities and attention deficit hyperactivity
disorder. Brain and Language, 74, 70-83.
Semrud-Clikeman, M., Pliszka, S., & Liotti, M. (2008). Executive functioning in children with
attention-deficit/hyperactivity disorder: Combined type with and without a stimulant
medication history. Neuropsychology, 22, 329-340.
Semrud-Clikeman, M., Steingard, R. J., Filipek, P., Biederman, J., Bekken, K., & Renshaw, P.
F. (2000b). Using MRI to examine brain-behavior relationships in males with attention
deficit disorder with hyperactivity. Journal of the American Academy of Child and
Adolescent Psychiatry, 39, 477-484.
Sergeant, J. A., Geurts, H., & Oosterlaan, J. (2002). How specific is a deficit of executive
functioning for attention-deficit/hyperactivity disorder? Behavioural Brain Research, 130,
3-28.
Sergeant, J. A., Oosterlaan, J., & van der Meere, J. (1999). Information processing and energetic
factors in attention deficit/hyperactivity disorder. In H. C. Quay, & A. Hogan (Eds.),
Handbook of disruptive behavior disorders (pp. 75-104). New York: Kluwer/Plenum.
Shallice, T. (1979). Case study approach in neuropsychological research. Journal of Clinical
Neuropsychology, 1, 183–211.

317
Shallice, T., Marzocchi, G. M., Coser, S., Del Savio, M., Meuter, R. F., & Rumiati, R. I.
(2002). Executive function profile of children with Attention Deficit Hyperactivity
Disorder. Developmental Neuropsychology, 21, 43-71.
Shanahan, M. A., Pennington, B. F., Yerys, B. E., Scott, A., Boada, R., Willcutt, E. G., Olson,
R. K., & DeFries, J. C. (2006). Processing speed deficits in attention deficit/hyperactivity
disorder and reading disability. Journal of Abnormal Child Psychology, 34, 585-602.
Shankweiler, D., & Crain, S. (1986). Language mechanisms and reading disorder: A modular
approach. Cognition, 24, 139-168.
Shankweiler, D., Crain, S., Katz, L., Fowler, A. E., Liberman, A. M., Brady, S. A., Thornton,
R., Lundquist, E., Dreyer, L., Fletcher, J. M., Stuebing, K. K., Shaywitz, S. E., &
Shaywitz, B. A. (1995). Cognitive profiles in reading disabled children: Comparison of
language skills in phonology, morphology, and syntax. Psychological Science, 6, 149-156.
Shaywitz, S. E. (1998). Dyslexia. New England Journal of Medicine, 338, 307-312.
Shaywitz, S. (2005). Overcoming dyslexia: A new and complete science-based program for
reading problems at any level. New York: Alfred A. Knopf.
Shaywitz, S. E., Escobar, M. D., Shaywitz, B. A., Fletcher, J. M., & Makuch, R. (1992).
Evidence that dyslexia may represent the lower tail of a normal distribution of reading
ability. New England Journal of Medicine, 326, 145-150.
Shaywitz, B. A., Fletcher, J. M., & Shaywitz, S. E. (1995). Defining and classifying learning
disabilities and attention-deficit/hyperactivity disorder. Journal of Child Neurology, 10,
Suppl 1, S50-7.
Shaywitz, S., Gruen, J., & Shaywitz, B. (2007). Management of dyslexia, its rationale, and
underlying neurobiology. Pediatric Clinics of North America, 54, 609-623
Shaywitz, S. E., & Shaywitz, B. A. (1988). Attention deficit disorder: Current perspectives. In J.
F. Kavanagh & T. J. Truss (Eds.), Learning disabilities: Proceedings of the national
conference (pp. 368-523). Parkton, MD: York Press.
Shaywitz, S. E., & Shaywitz, B. A. (2003). Neurobiological indices of dyslexia. In H. L.
Swanson, K. R. Harris, & S. Graham (Eds.), Handbook of research on learning disabilities
(pp. 514-531). New York: Guilford.

318
Shaywitz, S. E., Shaywitz, B. A., Fletcher, J. M., & Escobar, M. D. (1990). Prevalence of
reading disability in boys and girls. Journal of the American Medical Association 264,
998-1002.
Shin, M. (2005). Interference and cognitive inhibition in children with ADHD using Stroop
task. Psychologia, 48, 171-181.
Shue, K. L. & Douglas, V. I. (1992). Attention Deficit Hyperactivity Disorder and the frontal
lobe syndrome. Brain & Cognition, 20, 104-124.
Siegel, L. S. (1989). IQ is irelevant to the definition of learning disabilities. Journal of Learning
Disabilities, 22, 469-479
Siegel, L. S., & Heaven, R. K. (1986). Categorisation of learning disabilities. In S. J. Ceci (Ed.),
Handbook of cognitive, social, and neuropsychological aspects of learning disabilities
(Vol. 1, pp. 95-121). Hillsdale, NJ: Erlbaum.
Siegel, L. S. & Ryan, E. B. (1988). Development of grammatical-sensitivity, phonological, and
short-term memory skills in normally achieving and learning disabled children.
Developmental Psychology, 24, 28-37.
Siegel, L. S. &Ryan, E. B. (1989). The development of working memory in normally achieving
and subtypes of learning disabled children. Child Development, 60, 973-980.
Siklos, S. & Kerns, K. A. (2004). Assessing multitasking in children with ADHD using a
modified Six Elements Test. Archives of Clinical Neuropsychology, 19, 347-361.
Simon, J. R. (1969). Reactions towards the source of stimulation. Journal of Experimental
Psychology, 81, 174-176.
Slee, P. T., & Shute, R. H. (2003). Child development: Thinking about theories. London:
Arnold.
Slusarek, M., Velling, S., Bunk, D., & Eggers, C. (2001). Motivational effects on inhibitory
control in children with ADHD. Journal of the American Academy of Child and
Adolescent Psychiatry, 40, 355-363.
Smith, B., Barkley, R. A., & Shapiro, C. (2007). Attention deficit hyperactivity disorder. In E. J.
Mash & R. A. Barkley (Eds.), Assessment of childhood disorders (4th Ed.). New York:
Guilford Press.
Smith, E. E., & Jonides, J. (1997). Working memory: A view from neuroimaging. Cognitive
Psychology, 33, 5-42.

319
Smith-Spark, J. H., & Fish, J. E. (2007). Working memory functioning in developmental
dyslexia. Memory, 15, 34-56.
Smyth, M. M., & Scholey, K. A. (1996). The relationship between articulation time and
memory performance in verbal and visuo-spatial tasks. British Journal of Psychology, 87,
179-191.
Smyth, M. M., & Scholey, K. A. (1994). Characteristics of spatial memory span: Is there an
analogy to the word length effect, based on movement time? Quarterly Journal of
Experimental Psychology, 47, 91-117.
Snodgrass, J. G., & Vanderwart, M. (1980). A standardized set of 260 pictures: Norms for name
agreement, image agreement, familiarity, and visual complexity. Journal of Experimental
Psychology: Human Perception and Performance, 6, 174-215.
Snowling, M. J. (1991). Developmental reading disorders. Journal of Child Psychology and
Psychiatry, 32, 49-77.
Snowling, M. J. (2000). Dyslexia. Oxford, UK: Blackwell Publishers.
Snowling, M. J. (2002). Reading and other learning difficulties. In M. Rutter & E. Taylor
(Eds.), Child and adolescent psychiatry (4th ed., pp. 682-296). Oxford: Blackwell Science.
Snowling, M. J. (2008). Specific disorders and broader phenotypes: The case of dyslexia. The
Quarterly Journal of Experimental Psychology, 61, 142-156.
Sodoro, J., Allinder, R. M., & Rankin-Erickson, J. L. (2002). Assessment of phonological
awareness: Review of methods and tools. Educational Psychology Review, 14, 223-260.
Southam-Gerow, M. A., & Kendall, P. C. (2002). Emotional regulation and understanding:
Implications for child psychopathology and therapy. Clinical Psychology Review, 22, 189-
222.
Spear-Swerling, L. (1998). The trouble with “reading disability”. The Educational Therapist,
19, 6-9.
Specifying Colour by the Munsell System, D-1535-68. ASTM, Philadelphia, PA, 1974 annual
index.
Spirduso, W. W., Francis, K. L., & MacRae, P. G. (2005). Physical dimensions of aging.
Champagne, IL: Human Kinetics Publishers.
Spring, C. (1976). Encoding speed and memory span in dyslexic children. Journal of Special
Education, 10, 35-40.

320
Stanovich, K. (1981). Relationships between word decoding speed, general name-retrieval
ability, and reading progress in first-grade children. Journal of Educational Psychology,
73, 809-815.
Stanovich, K. E. (1985). Explaining the variance in reading ability in terms of psychological
processes: What have we learned? Annals of Dyslexia, 35, 67-96.
Stanovich, K. E. (1987). Introduction: Children‟s reading and the development of phonological
awareness. Merrill-Palmer Quarterly, 33, 175-190.
Stanovich, K. E. (1988). Explaining the differences between the dyslexic and garden-variety
poor reader: The phonological-core variable-difference model. Journal of Experimental
Child Psychology, 38, 175-190.
Stanovich, K. E. (1991). Discrepancy definitions of reading disability: Has intelligence led us
astray? Reading Research Quarterly, 26, 1-29.
Stanovich, K. E., Cunningham, A. E., & Cramer, B. (1984). Assessing phonological awareness
in kindergarten children: Issues of task comparability. Journal of Experimental Child
Psychology, 38, 175-190.
Stanovich, K. E., Cunningham, A. E., & Feeman, D. J. (1984). The relation between early
reading acquisition and word decoding with and without context: A longitudinal study of
first grade children. Journal of Educational Psychology, 76, 668-677.
Stanovich, K. E., Feeman, D. J., & Cunningham, A. E. (1983). The development of the relation
between letter-naming speed and reading ability. Journal of the Psychonomic Society, 21,
360-364.
Stanovich, K. E., Nathan, R. G., & Vala-Rossi, M. (1986). Developmental changes in the
cognitive correlates of reading ability and the developmental lag-hypothesis. Reading
Research Quarterly, 21, 267-283.
Stanovich, K. E., & Siegel, L. S. (1994). Phenotypic performance profile of children with
reading disabilities: A regression-based test of the phonological-core variable-difference
model. Journal of Educational Psychology, 86, 24-53.
Stevens, J., Quittner, A. L., Zuckerman, J. B., & Moore, S. (2002). Behavioral inhibition, self-
regulation of motivation, and working memory in children with attention deficit
hyperactivity disorder. Developmental Neuropsychology, 21, 117-139.

321
Stevenson, J., Pennington, B. F., Gilger, J. W., DeFries, J. C., & Gillis, J. J. (1993).
Hyperactivity and spelling disability: Testing for shared genetic etiology. Journal of Child
Psychology and Psychiatry, 14, 1137–1152.
Still, G. F. (1902). Some abnormal psychical conditions in children: The Goulstonian
lectures. Lancet, 1, 1008-1012, 1077-1082, 1163-1168.
Stothard, S. E., & Hulme, C. (1992). Reading comprehension difficulties in children. Reading
and Writing: An Interdisciplinary Journal, 4, 245-256.
Stringer, R. W., Toplak, M. E., & Stanovich, K. E. (2004). Differential relationships between
RAN performance, behaviour ratings, and executive function measures: Searching for a
double dissociation. Reading and Writing, 17, 891-914.
Stroop, J. R. (1935). Studies of interference in serial verbal reactions. Journal of Experimental
Psychology, 18, 643-662.
Stuss, D. T., & Benson, D. F. (1986). The frontal lobes. New York: Raven.
Sussman, H. M. (1982). Contrastive patterns of intrahemispheric interference to verbal and
spatial concurrent tasks in right-handed, left-handed and stuttering populations.
Neuropsychologia, 20, 675-684.
Swan, D., & Goswami, U. (1997). Phonological awareness deficits in developmental dyslexia
and the phonological representations hypothesis. Journal of Experimental Child
Psychology, 66, 18-41.
Swanson, H. L. (2006). Working memory and reading disabilities: Both phonological and
executive processing deficits are important. In T. P. Alloway & S. E. Gathercole (Eds.).
Working memory and neurodevelopmental disorders (pp. 59-88). New York: Psychology
Press.
Swanson, H. L., Mink, J., & Bocian, K. M. (1999). Cognitive processing deficits in poor reader
with symptoms of reading disabilities and ADHD: More alike than different? Journal of
Educational Psychology, 91, 321-353.
Swanson, H. L., Trainin, G., Necoechea, D. M., & Hammill, D. D. (2003). Rapid naming,
phonological awareness, and reading: A meta-analysis of the correlation evidence. Review
of Educational Research, 73, 407-440.
Swanson, J. M. (1994). SNAP-IV scale. Irvine, CA: University of California Child Development
Center. http://www.adhd.net.

322
Swanson, L. B. (1989). Analyzing naming speed-reading relationships in children.
Unpublished doctoral dissertation, University of Waterloo, Waterloo, Ontario, Canada.
Swanson, L., & Kim, K. (2007). Working memory, short-term memory, and naming speed as
predictors of children’s mathematical performance. Intelligence, 35, 151-168.
Szatmari, P., Offord, D. R., & Boyle, M. H. (1989). Correlates, associated impairments, and
patterns of service utilization of children with attention deficit disorders: Findings from the
Ontario Child Health Study. Journal of Child Psychology and Psychiatry, 30, 205-217.
Tannock, R. (1998). Attention deficit hyperactivity disorder: Advances in cognitive,
neurobiological, and genetic research. Journal of Child Psychology and Psychiatry, 39, 65-
99.
Tannock, R. (2003). Neuropsychology of attention disorders. In S. J. Segalowitz, & I. Rapin
(Eds.), Handbook of neuropsychology (pp. 753-784). Amsterdam: Elsevier Press.
Tannock, R., & Martinussen, R. (2001). Reconceptualizing ADHD. Understanding Learning
Differences, 59, 20-25.
Tannock, R., Martinussen, R., & Fritjers, J. (2000). Naming speed performance and stimulant
effects indicate effortful, semantic processing deficits in Attention-Deficit/Hyperactivity
Disorder. Journal of the American Academy of Child and Adolescent Psychiatry, 28, 237-
252.
Tannock, R., & Schachar, R. (1996). Executive dysfunction as an underlying mechanism of
behaviour and language problems in attention deficit hyperactivity disorder. In J. H.
Beitchman, N. Clhen, M. M. Konstantareas, and R. Tannock (Eds.), Language, learning,
and behaviour disorders: Developmental, biological, and clinical perspectives (pp. 128-
155). New York: Cambridge University Press.
Tarnowski, K. J., Prinz, R. J., & Nay, S. M. (1986). Comparative analysis of attentional deficits
in hyperactive and learning-disabled children. Journal of Abnormal Psychology, 95, 341-
345.
Taylor, E., Sandberg, S., Thorley, G., & Giles, S. (1991). The epidemiology of childhood
hyperactivity. Oxford, UK: Oxford University Press.
Taylor, E., Sergeant, J., Doepfner, M., Gunning, B., Overmeyer, S., Möbius, H. J., & Eisert, H.
G. (1998). Clinical guidelines for hyperkinetic disorder. European Child and Adolescent
Psychiatry, 7, 184-200.

323
Tiffin-Richards, M. C., Hasselhorn, M., Woerner, W., Rothenberger, A., & Banaschewski,
T. (2008). Phonological short-term memory and central executive processing in attention-
deficit/hyperactivity disorder with/without dyslexia – evidence of cognitive overlap.
Journal of Neural Transmission, 115, 227-234.
Torgesen, J. K. (1978). Performance of reading disabled children on serial memory task: A
review. Reading Research Quarterly, 19, 57-87.
Torgesen, J. K. (1985). Memory processes in reading disabled children. Journal of Learning
Disabilities, 18, 350-357.
Torgesen, J. (1999). Assessment and instruction for phonemic awareness and word recognition
skills. In H. Catts & A. Kamhi (Eds.), Reading research: Advances in theory and practice
(pp. 159-198). New York: Academic Press.
Torgesen, J. K., & Hecht, S. A. (1996). Preventing and remediating reading disabilities:
Instructional variables that make a difference for special students. In M. F. Graves, P. van
den Broek, & B. M. Taylor (Eds.), The first R: Every child‘s right to read (pp. 133-159).
New York: Teachers College Press.
Torgesen, J. K., Wagner, R. K., & Rashotte, C. A. (1994). Longitudinal studies of phonological
processing and reading. Journal of Learning Disabilities, 27, 276-286.
Treisman, A., & Gelade, G. (1980). A feature-integration theory of attention. Cognitive
Psychology, 12, 97-136.
Tripp, G., Ryan, J., & Pearce, K. (2002). Neuropsychological functioning in children with
DSM-IV combined type attention deficit hyperactivity disorder. Australian and New
Zealand Journal of Psychiatry, 36, 771-779.
Vance, D. E., Keltner, N. L., McGuinness, T., Umlauf, M. G., & Yuan, Y. Y. (2010). The future
of cognitive remediation training in older adults. Journal of Neuroscience Nursing, 42,
255-264.
Van Daal, V., & van der Leij, A. (1999). Developmental dyslexia: Related to specific or general
deficits? Annals of Dyslexia, 49, 71-104.
Van der Meere, J., Shalev, R., Borger, N., & Gross-Tsur, V. (1995). Sustained attention,
activation, and MPH in ADHD: A research note. Journal of Child Psychology and
Psychiatry, 36, 697-703.

324
Van der Meere, J., & Stermerdink, N. (1998). The development of state regulation in normal
children: An indirect comparison with children with ADHD. Developmental
Neuropsychology, 16, 213-225.
Van der Meere, J., Stermerdink, N., & Gunning, B. (1995). Effects of presentation rate of
stimuli on response inhibition in ADHD children with and without tics. Perceptual and
Motor Skills, 81, 259-262.
Van der Schoot, M., Licht, R., Horsley, T. M., & Sergeant, J. A. (2000). Inhibitory deficits in
reading disability depend on subtype: Guessers but not spellers. Child Neuropsychology, 6,
297-312.
Vandierendonck, A., Kemps, E., Fastame, M. C. & Szmalec, A. (2004). Working memory
components involved in the Corsi block test. British Journal of Psychology, 95, 57-79.
Vandierendonck, A. & Szmalec, A. (2004). An asymmetry in the visuo-spatial demands of
forward and backward recall in the Corsi blocks task. Imagination, Cognition and
Personality, 23, 225-231.
van Goozen, S. H. M., Cohen-Kettenis, P. T., Snoek, H., Matthys, W., Swaab-Barneveld, H., &
van Engeland, H. (2004). Executvie functioning in children: A comparison of hospitalised
ODD and ODD/ADHD children and normal controls. Journal of Child Psychology &
Psychiatry, 45, 284-292.
Van Mourik, R., Oosterlaan, J., & Sergeant, J. A. (2005). The Stroop revisited: A metaanalysis
of interference control in AD/HD. Journal of Child Psychology and Psychiatry, 46, 150-
165.
Vassileva, J., & Fischer, M. (2003). Attention deficit/hyperactivity disorder. In R. B. Schiffer,
S. M. Rao, & B. S. Fogel (Eds.), Neuropsychiatry (pp. 605-629). Philadelphia, PA:
Lippincott, Williams, & Wilkins.
Vellutino, F. (1979). Dyslexia, theory, and research. Cambridge, MA: MIT Press.
Vellutino, F. R., & Denckla M. B. (1991). Cognitive and neuropsychological foundations of
word identification in poor and normally developing readers. In R. Barr, M. L. Kamil, P.
Mosenthal, & P. D. Pearson (Eds.), Handbook of reading research: Vol. 2 (pp. 571-608).
New York: Longman.
Vellutino, F. R., Scanlon, D. M., & Lyon, G. R. (2000). Differentiating between difficult-to-
remediate and readily remediated poor readers: More evidence against the IQ--

325
Achievement discrepancy definition of reading disability. Journal of Learning
Disabilities, 33, 223-238.
Vellutino, F. R., Scanlon, D. M., & Sipay, E. R. (1997). Toward distinguishing between
cognitive and experiential deficits as primary sources of difficulty in learning to read: The
importance of early intervention in diagnosing specific reading disability. In B. Blackman
(Ed.), Foundations of reading acquisition and dyslexia: Implications for early intervention
(pp. 347-379). Mahwah, NJ: Lawrence Erlbaum Associates.
Vellutino, F. R., Scanlon, D. M., & Zhang, H. (2007). Identifying reading disability based on
response to intervention: Evidence from early intervention research. In S. R. Jimerson, M.
K. Burns, & A. M. van der Heyden (Eds.), Handbook of response to intervention: The
science of practice of assessment (pp. 185-211). New York: Springer Science and Business
Media.
Verhaeghen, P., Cerella, J., Bopp, K. L., & Basak, C. (2005). Aging and varieties of cognitive
control: A review of meta-analyses on resistance to interference, coordination and task
switching, and an experimental exploration of age-sensitivity in the newly identified
process of focus switching. In R. W. Engle, G. Sedek, U. von Hecker, & D. N. McIntosh
(Eds.), Cognitive Limitations in Aging and Psychopathology: Attention, Working Memory,
and Executive Functions (pp. 160-189). Cambridge, Massachusetts: Cambridge University
Press.
Verhulst, F. C., Van der Ende, J., & Ferdinand, R. F., & Kasius, M. C. (1997). Determining the
prevalence of DSM-III-R diagnoses in a national sample of Dutch adolescents. Archives of
General Psychiatry, 54, 329-336.
Vicari, S., Bellucci, S., Carlesimo, G. A. (2003). Visual and spatial working memory
dissociation: Evidence from Williams syndrome. Developmental Medicine and Child
Neurology, 45, 269-273.
Vikan, A. (1985). Psychiatric epidemiology in a sample of 1,510 ten-year-old children: I.
Prevalence. Journal of Child Psychology and Psychiatry, 26, 55-75.
Wadsworth, S. J., DeFries, J. C., Stevenson, J., Gilger, J. W., & Pennington, B. F. (1992).
Gender ratios among reading-disabled children and their siblings as a function of parental
impairment. Journal of Child Psychology and Psychiatry, 33, 1229-1139.

326
Wagner, R. K. (1988). Causal relations between the development of phonological
processing abilities and the acquisition of reading skills: A meta-analysis. Merrill-Palmer
Quarterly, 34, 261-279.
Wagner, R. K., & Torgesen, J. K. (1987). The nature of phonological processing and its causal
role in the acquisition of reading skills. Psychological Bulletin, 101, 192-212.
Wagner, R. K., Torgesen, J. K., & Rashotte, C. A. (1994). The development of reading-related
phonological processing abilities: New evidence of bi-directional causality from a latent
variable longitudinal study. Developmental Psychology, 30, 73-87.
Wagner, R.K., Torgesen, J.K. & Rashotte, C.A. (1999). Comprehensive test of phonological
processing. Austin, Texas: ProEd.
Warner-Rogers, J., Taylor A., Taylor E., Sandberg, S. (2000). Inattentive behavior in childhood:
Epidemiology and implications for development. Journal of Learning Disabilities, 33,
520–536.
Wechsler, D. (1991). The Wechsler intelligence scale for children (3rd
Ed.). London, UK:
Psychological Corporation.
Wechsler, D. (1997). The Wechsler adult intelligence scale (2nd
Ed.). London: The
Psychological Corporation.
Wechsler, D. (2003). Wechsler intelligence scale for children (4th Ed.). London, UK:
Psychological Corporation.
Weiler, M. D., Bernstein, J. H., Bellinger, D. C., & Waber, D. P. (2000). Processing speed in
children with attention deficit/hyperactivity disorder, inattentive type. Child
Neuropsychology, 6, 218-234.
Weiler, M. D., Bernstein, J. H., Bellinger, D. C., & Waber, D. P. (2002). Information processing
deficits in children with attention-deficit/hyperactivity disorder, inattentive type, and
children with reading disability. Journal of Learning Disabilities, 35, 449-492.
Weiss, G., & Hechtman, L. (1993). Hyperactive children grown up (2nd ed.). New York:
Guilford Press.
Welsh, M., Pennington, B., & Groisser, D. (1991). A normative-developmental study of
executive function: A window on prefrontal function in children. Developmental
Neuropsychology, 7, 131-149.
327
Wender, P. H., Wolf, L. E., & Wasserstein, J. (2001). Adults with ADHD: An overview.
Annals of the New York Academy of Sciences, 931, 1-16.
Wertheim, C., Vogel, S., & Brulle, A. (1998). Studentsw with learning disabilities in teacher
education programs. Annals of Dyslexia, 48, 293-309.
West, J., Houghton, S., Douglas, G., & Whiting, K. (2002). Response inhibition, memory, and
attention in boys with Attention-Deficit/Hyperactivity Disorder. Educational Psychology,
22, 533-551.
Westerberg, H., Hirvikoski, T., Forssberg, H., Klingberg, T. (2004). Visuo-spatial working
memory: a sensitive measurement of cognitive deficits in ADHD. Child Neuropsychology,
10, 155-161.
Westwood, P., & Graham, L. (2000). How many children with special needs in regular classes:
Official predictions vs. teachers' perceptions in South Australia and New South Wales.
Australian Journal of Learning Disabilities, 5, 24-35.
Whalen, C. K., & Henker, B. (1991). Social impact of stimulant treatment for hyperactive
children. Journal of Learning Disabilities, 24, 231-241.
Whalen, C., Henker, B., Swanson, J., Granger, D., Kliewer, W., & Spencer, J. (1987). Natural
social behaviors in hyperactive children: Dose effects of methylphenidate. Journal of
Consulting and ClinicalPsychology, 55, 187-193.
Wiers, R. W., Gunning, W., & Sergeant, J. A. (1998). Is a mild deficit in executive functions in
boys related to childhood ADHD or to parental multigenerational alcoholism? Journal of
Abnormal Child Psychology, 26, 415-430.
Willcutt, E. G., Betjemann, R. S., Wadsworth, S. J., Samuelsson, S., Corley, R., DeFries, J. C.,
Byrne, B., Pennington, B. F., & Olson, R. K. (2007). Preschool twin study of the relation
between attention-deficit/hyperactivity disorder and prereading skills. Reading and
Writing, 20, 103-125.
Willcutt, E. G., Brodsky, K., Chhabildas, N., Shanahan, M., Yerys, B., Scott, A., & Pennington,
B. F. (2005). The neuropsychology of ADHD: Validity of the executive function
hypothesis. In D. Gozal & D. L. Molfese DL (Eds.). Attention deficit hyperactivity
disorder: From genes to patients (pp. 185-213). Totowa, N. J.: Humana Press.

328
Willcutt, E. G., Doyle, A. E., Nigg, J. T., Faraone, S. V., & Pennington, B. F. (2005).
Validity of the Executive Function Theory of Attention-Deficit/Hyperactivity Disorder: A
Meta-Analytic Review. Biological Psychiatry, 57, 1336-1346.
Willcutt, E. G., & Pennington, B. F. (2000). Comorbidity of reading disability and attention-
deficit/hyperactivity disorder: Differences by gender and subtype. Journal of Learning
Disabilities, 33, 179-191.
Willcutt, E. G., Pennington, B. F., Boada, R., Ogline, J. S., Tunick, R. A., Chhabildas, N. A., &
Olson, R. K. (2001). A comparison of the cognitive deficits in reading disability and
attention-deficit/hyperactivity disorder. Journal of Abnormal Psychology, 110, 157-172.
Willcutt, E. G., Pennington, B. F., Chhabildas, N. A., Olson, R. K., Hulslander, J. L. (2005).
Neuropsychological analyses of comorbidity between RD and ADHD: In search of the
common deficit. Developmental Neuropsychology, 27, 35-78.
Willcutt, E. G., Pennington, B. F., & DeFries, J. C. (2000). Twin study of the etiology of
comorbidity between reading disability and attention-deWcit/hyperactivity disorder.
American Journal of Medical Genetics, 96, 293–301.
Willcutt, E. G., Pennington, B. F., Smith, S. D., Cardon, L. R., Gayan, J., Knopic, V. S., Olson,
R. K., & DeFries, J. C. (2002). Quantitative trait locus for reading disability on
chromosome 6p is pleiotropic for ADHD. American Journal of Medical Genetics
(Neuropsychiatric Genetics), 114, 260-268.
Williams, B. R., Ponesse, J. S., Schachar, R. J., Logan, G. D., & Tannock, R. (1999).
Development of inhibitory control across the life span. Developmental Psychology, 35,
205-213.
Williams, S. M., & McGee, R. O. (1996). Reading in childhood and mental health in early
adulthood. In J. H. Beitchman, N. H. Cohen, M. M. Konstantareas, & R. Tannock (Eds.),
Language, Learning, and Behavior Disorders (pp. 530-554). New York: Cambridge
University Press.
Williams, D., Stott, C., Goodyer, I., & Sahakian, B. (2000). Specific language impairment with
or without hyperactivity: Neuropsychological evidence for frontostriatal dysfunction.
Developmental Medicine & Child Neurology, 42, 368-375.
Williams, P. E., Weiss, L. G., & Rolfhus, E. (2003). Clinical validity (WISC–IV Technical
Report No. 3). Retrieved April 27, 2008, from
http://harcourtassessment.com/hai/Images/pdf/wisciv/WISCIVTechReport3.pdf

329
Wimmer, H. (1993). Characteristics of developmental dyslexia in a regular writing system.
Applied Psycholinguistics, 14, 1-33.
Windsor, J., Milbrath, R., Carney, E., & Rakowski, S. (2001). General slowing hypothesis in
language impairment: Methodological considerations in testing the hypothesis. Journal of
Speech, Language, Hearing Research, 44, 446-461.
Wolf, M. (1984). Naming, reading, and the dyslexias: A longitudinal review. Annals of
Dyslexia, 34, 87-115.
Wolf, M. (1991). Naming speed and reading: The contribution of the cognitive neurosciences.
Reading Research Quarterly, 26, 123-141.
Wolf, M. (1997). A provisional, integrative account of phonological and naming-speed deficits
in dyslexia: Implications for diagnosis and intervention. In B. A. Blachman, Foundations
of reading acquisition and dyslexia: Implications for early intervention (pp. 67-92).
Mahwah, New Jersey: Lawrence Erlbaum Associates.
Wolf, M. (1999). What time may tell: towards a new conceptualization of developmental
dyslexia. Annals of Dyslexia, 49, 3-28.
Wolf, M., Bally, H., & Morris, R. (1986). Automaticity, retrieval processes, and reading: A
longitudinal study in average and impaired reading. Child Development, 57, 988-1000.
Wolf, M., Barzillai, M., Gottwald, S., Miller, L., Spencer, K., Norton, E., Lovett, M., & Morris,
R. (2009). The RAVE-O intervention: Connecting neuroscience to the classroom. Mind,
Brain, and Education, 3, 84-93.
Wolf, M., & Bowers, P. G. (1999). The double-deficit hypothesis for developmental dyslexias.
Journal of Educational Psychology, 91, 415-438.
Wolf, M., Bowers, P., & Biddle, K. (2000). Naming-speed processes, timing, and reading: A
conceptual review. Journal of Learning Disabilities, 33, 387-407.
Wolf, M., & Obregon, M. (1992). Early naming deficits, developmental dyslexia, and a specific
deficit hypothesis. Brain and Language, 42, 219-247.
Wolf, M., & O‟Brien, B. (2001). On issues of time, fluency, and intervention. In A. Fawcett &
R. Nicolson (Eds.), Dyslexia: Theory and good practice (pp. 124-140). London: Whurr
Publishers.
Wolff, P. H., Cohen, C., & Drake, C. (1984). Impaired motor timing control in specific reading
retardation. Neuropsychologia, 22, 587-600.

330
Wolff, P. H., Michel, G., & Ovrut, M. (1990). Rate variables and automatized naming in
developmental dyslexia. Brain and Language, 39, 556-575.
Wolraich, M . L., Hannah, J. N., Pinnock, T. Y., Baumgaertel, A., & Brown, J. (1996).
Comparison of diagnostic criteria for attention-deficit hyperactivity disorder in a country-
wide sample. Journal of the American Academy of Child and Adolescent Psychiatry, 35,
319-324.
Wood, F., & Felton, R. (1994). Separate linguistic and attentional factors in the development of
reading. Topics in Language Disorders, 14, 42-57.
Woodcock, R. W. (1987). Woodcock reading mastery tests—revised. Minnesota: Circle Pines
Press, American Guidance Service Inc.
Woodcock, R. W. (1998). Woodcock reading mastery tests – revised/normative update.
Minnesota: Circle Pines Press, American Guidance Service Inc.
Woodcock, R. W., & Johnson, M. B. (1977). Woodcock-Johnson psycho-educational battery.
Itasca, IL: Riverside.
Woodcock, R. W., & Johnson, M. B. (1989). Woodcock–Johnson psycho-educational battery–
revised. Itasca, IL: Riverside.
Yap, R. L., & van der Leij, A. (1994). Testing the automatization deficit hypothesis of dyslexia
via a dual-task paradigm, Journal of Learning Disabilities, 27, 660-665.
Yopp, H. (1988). The validity and reliability of phonemic awareness tests. Reading Research
Quarterly, 23, 160-177.
Yuill, N., Oakhill, J. V., & Parkin, A. (1989). Working memory, comprehension ability and the
resolution of text anomaly. British Journal of Psychology, 80, 351-361.
Zhao, Z. (2004). Functional dissociation between visual and spatial temporary maintenance.
Unpublished doctoral dissertation, University of Albert-Ludwigs, Freiburg.
http://deposit.ddb.de/cgi-bin/dokserv?idn=973382317&dok_
var=d1&dok_ext=pdf&filename=973382317.pdf.
Zubrick, S. R., Silburn, S. R., Gurrin, L., Teoh, H., Shepherd, C., Carlton, J., & Lawrence, D.
(1997). The Western Australian child health survey: Education, health & competence.
Perth, Western Australia: Australian Bureau of Statistics and TVW Telethon Institute for
Child Health Research.