Attachment to Testimony of Joseph Bowring Ohio Energy Mandates Study Committee April 16, 2015.
21
Attachment to Testimony of Joseph Bowring Ohio Energy Mandates Study Committee April 16, 2015
-
Upload
chloe-shields -
Category
Documents
-
view
219 -
download
0
Transcript of Attachment to Testimony of Joseph Bowring Ohio Energy Mandates Study Committee April 16, 2015.

Attachment to Testimony of Joseph Bowring Ohio Energy Mandates Study Committee
April 16, 2015

Figure 1-1 PJM’s footprint and its 20 control zones
©2015 www.monitoringanalytics.com 2
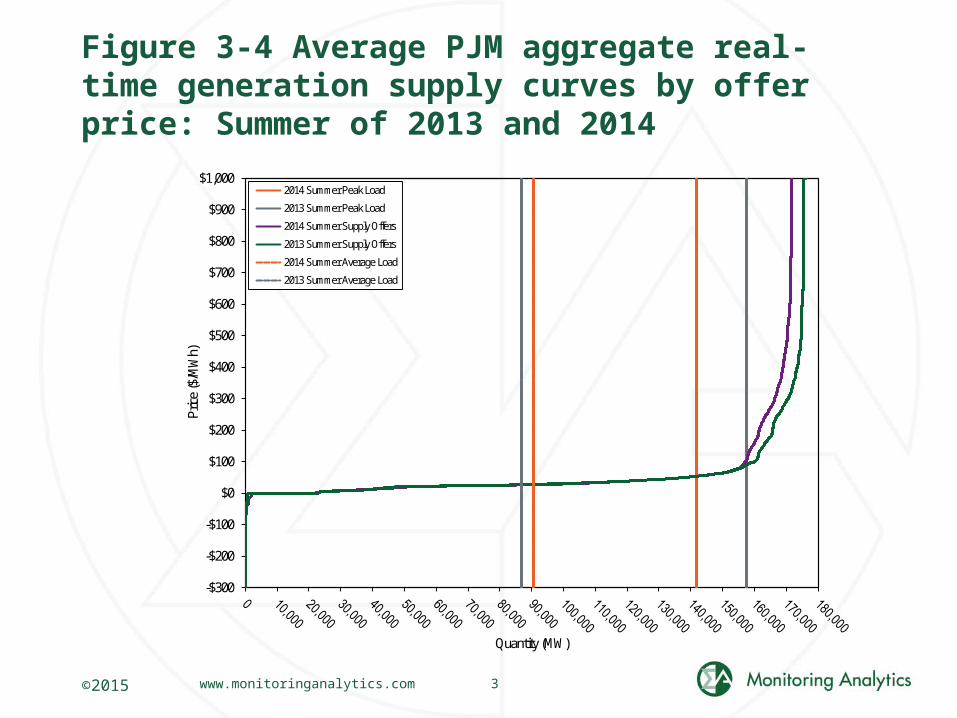
Figure 3-4 Average PJM aggregate real-time generation supply curves by offer price: Summer of 2013 and 2014
©2015 www.monitoringanalytics.com 3
-$300
-$200
-$100
$0
$100
$200
$300
$400
$500
$600
$700
$800
$900
$1,000Pr
ice ($
/MW
h)
Quantity (MW)
2014 Summer Peak Load
2013 Summer Peak Load
2014 Summer Supply Offers
2013 Summer Supply Offers
2014 Summer Average Load
2013 Summer Average Load

Figure 3-30 PJM real-time, monthly and annual, load-weighted, average LMP: 1999 through 2014
©2015 www.monitoringanalytics.com 4
$0
$20
$40
$60
$80
$100
$120
$140
Jan-
99Ju
l-99
Jan-
00Ju
l-00
Jan-
01Ju
l-01
Jan-
02Ju
l-02
Jan-
03Ju
l-03
Jan-
04Ju
l-04
Jan-
05Ju
l-05
Jan-
06Ju
l-06
Jan-
07Ju
l-07
Jan-
08Ju
l-08
Jan-
09Ju
l-09
Jan-
10Ju
l-10
Jan-
11Ju
l-11
Jan-
12Ju
l-12
Jan-
13Ju
l-13
Jan-
14Ju
l-14
LMP
($/M
Wh)
Yearly Average Load-Weighted LMP
Monthly Average Load-Weighted LMP

Figure 3-29 PJM real-time, load-weighted, average LMP: 2014
©2015 www.monitoringanalytics.com 5

Figure 5-4 History of PJM capacity prices: 1999/2000 through 2017/2018
©2015 www.monitoringanalytics.com 6
$38.80
$97.58
$57.75
$20.55
$13.64
$17.35$4.53 $5.22
$89.78
$127.67
$153.37
$172.71
$108.63
$75.08
$116.55$126.40
$159.99
$89.46
$123.19
$0
$50
$100
$150
$200
$250
$300
$350
$400
$450
$ pe
r MW
-day
Delivery year cleared MW weighted average price
CCM
RPM

Table 5-3 PJM installed capacity (By fuel source): January 1, May 31, June 1, and December 31, 2014
©2015 www.monitoringanalytics.com 7
MW Percent MW Percent MW Percent MW PercentCoal 75,544.6 41.3% 75,253.0 41.1% 74,785.5 40.6% 73,015.3 39.7%Gas 53,395.0 29.2% 53,841.6 29.4% 55,041.7 29.9% 56,364.5 30.7%Hydroelectric 8,106.7 4.4% 8,135.7 4.4% 8,463.8 4.6% 8,765.3 4.8%Nuclear 33,076.7 18.1% 33,073.7 18.0% 32,891.0 17.9% 32,947.1 17.9%Oil 11,314.2 6.2% 11,290.4 6.2% 11,155.7 6.1% 10,931.7 6.0%Solar 84.2 0.0% 84.2 0.0% 94.7 0.1% 97.5 0.1%Solid waste 701.4 0.4% 701.4 0.4% 780.0 0.4% 780.0 0.4%Wind 872.4 0.5% 872.4 0.5% 796.7 0.4% 822.7 0.4%Total 183,095.2 100.0% 183,252.4 100.0% 184,009.1 100.0% 183,724.1 100.0%
31-Dec-1431-May-141-Jan-14 1-Jun-14

Table 3-8 PJM generation (By fuel source (GWh)): 2013 and 2014
©2015 www.monitoringanalytics.com 8
Gwh Percent GWh PercentCoal 356,018.0 44.5% 351,456.5 43.5% (1.3%)
Standard Coal 346,188.8 43.3% 341,538.6 42.3% (1.3%)Waste Coal 9,829.2 1.2% 9,918.0 1.2% 0.9%
Nuclear 277,277.8 34.7% 277,635.6 34.3% 0.1%Gas 130,230.9 16.3% 140,076.4 17.3% 7.6%
Natural Gas 127,855.5 16.0% 137,503.6 17.0% 7.5%Landfill Gas 2,321.0 0.3% 2,369.4 0.3% 2.1%
Biomass Gas 54.5 0.0% 203.5 0.0% 273.3%Hydroelectric 14,116.4 1.8% 14,394.3 1.8% 2.0%
Pumped Storage 6,690.4 0.8% 7,138.7 0.9% 6.7%Run of River 7,426.0 0.9% 7,255.5 0.9% (2.3%)
Wind 14,854.1 1.9% 15,540.5 1.9% 4.6%Waste 5,040.1 0.6% 5,472.4 0.7% 8.6%
Solid Waste 4,185.0 0.5% 4,566.5 0.6% 9.1%Miscellaneous 855.1 0.1% 905.9 0.1% 5.9%
Oil 1,948.5 0.2% 3,299.9 0.4% 69.4%Heavy Oil 1,730.7 0.2% 2,742.1 0.3% 58.4%
Light Oil 187.2 0.0% 480.0 0.1% 156.5%Diesel 14.8 0.0% 52.5 0.0% 253.6%
Kerosene 15.7 0.0% 25.3 0.0% 61.3%Jet Oil 0.1 0.0% 0.1 0.0% (38.6%)
Solar, Net Energy Metering 355.0 0.0% 404.6 0.0% 13.7%Battery 0.7 0.0% 6.5 0.0% 807.7%Total 799,841.7 100.0% 808,286.8 100.0% 1.1%
2013 2014Change in Output

Figure 3-11 Map of PJM real-time generation less real-time load by zone: 2014
©2015 www.monitoringanalytics.com 9

Table 8-4 Renewable standards of PJM jurisdictions to 2024
©2015 www.monitoringanalytics.com 10
Jurisdiction 2014 2015 2016 2017 2018 2019 2020 2021 2022 2023 2024Delaware 10.00% 11.50% 13.00% 14.50% 16.00% 17.50% 19.00% 20.00% 21.00% 22.00% 23.00%Illinois 8.00% 9.00% 10.00% 11.50% 13.00% 14.50% 16.00% 17.50% 19.00% 20.50% 22.00%Indiana 4.00% 4.00% 4.00% 4.00% 4.00% 7.00% 7.00% 7.00% 7.00% 7.00% 7.00%Kentucky No StandardMaryland 12.80% 13.00% 15.20% 15.60% 18.30% 17.40% 18.00% 18.70% 20.00% 20.00% 20.00%Michigan 6.75% 10.00% 10.00% 10.00% 10.00% 10.00% 10.00% 10.00% 10.00% 10.00% 10.00%New Jersey 12.53% 13.76% 14.90% 15.99% 18.03% 19.97% 21.91% 23.85% 23.94% 24.03% 24.12%North Carolina 3.00% 6.00% 6.00% 6.00% 10.00% 10.00% 10.00% 12.50% 12.50% 12.50% 12.50%Ohio 2.50% 2.50% 2.50% 3.50% 4.50% 5.50% 6.50% 7.50% 8.50% 9.50% 10.50%Pennsylvania 10.72% 11.22% 13.72% 14.22% 14.72% 15.22% 15.72% 18.02% 18.02% 18.02% 18.02%Tennessee No StandardVirginia 4.00% 4.00% 7.00% 7.00% 7.00% 7.00% 7.00% 7.00% 12.00% 12.00% 12.00%Washington, D.C. 10.50% 12.00% 13.50% 15.00% 16.50% 18.00% 20.00% 20.00% 20.00% 20.00% 20.00%West Virginia No Standard

Table 8-6 Solar renewable standards of PJM jurisdictions 2014 to 2024
©2015 www.monitoringanalytics.com 11
Jurisdiction 2014 2015 2016 2017 2018 2019 2020 2021 2022 2023 2024Delaware 0.80% 1.00% 1.25% 1.50% 1.75% 2.00% 2.25% 2.50% 2.75% 3.00% 3.25%Illinois 0.12% 0.27% 0.60% 0.69% 0.78% 0.87% 0.96% 1.05% 1.14% 1.23% 1.32%Indiana No Solar StandardKentucky No StandardMaryland 0.35% 0.50% 0.70% 0.95% 1.40% 1.75% 2.00% 2.00% 2.00% 2.00% 2.00%Michigan No Solar StandardNew Jersey 2.05% 2.45% 2.75% 3.00% 3.20% 3.29% 3.38% 3.47% 3.56% 3.65% 3.74%North Carolina 0.07% 0.14% 0.14% 0.14% 0.20% 0.20% 0.20% 0.20% 0.20% 0.20% 0.20%Ohio 0.12% 0.12% 0.12% 0.15% 0.18% 0.22% 0.26% 0.30% 0.34% 0.38% 0.42%Pennsylvania 0.08% 0.14% 0.25% 0.29% 0.34% 0.39% 0.44% 0.50% 0.50% 0.50% 0.50%Tennessee No StandardVirginia No Solar StandardWashington, D.C. 0.60% 0.70% 0.83% 0.98% 1.15% 1.35% 1.58% 1.85% 2.18% 2.50% 2.50%West Virginia No Solar Standard

Figure 12-1 Map of PJM unit retirements: 2011 through 2019
©2015 www.monitoringanalytics.com 12

Figure 8-2 Average hourly real-time generation of wind units in PJM: 2014
©2015 www.monitoringanalytics.com 13
0
200
400
600
800
1,000
1,200
1,400
1,600
1,800
2,000
2,200
2,400
2,600
2,800
1 2 3 4 5 6 7 8 9 10 11 12 13 14 15 16 17 18 19 20 21 22 23 24
MW
Hour Ending (EPT)
February
January
March
June
May
April
July
September
August
November
December
October

Figure 8-4 Marginal fuel at time of wind generation in PJM: 2014
©2015 www.monitoringanalytics.com 14
0
200
400
600
800
1,000
1,200
1,400
1 2 3 4 5 6 7 8 9 10 11 12 13 14 15 16 17 18 19 20 21 22 23 24
Aver
age
MW
Disp
lace
d
Hour ending (EPT)
Waste Coal
Wind
Solar
Nuclear
Natural Gas
MSW
Misc
Light Oil
LFG
Kerosene
Interface
Hydro
Heavy Oil
Diesel
Coal

Table 8-16 Capacity factor of wind units in PJM: 2014
©2015 www.monitoringanalytics.com 15
Type of ResourceCapacity
FactorInstalled Capacity
(MW)Energy-Only Resource 18.2% 804Capacity Resource 28.8% 5,798All Units 27.8% 6,602
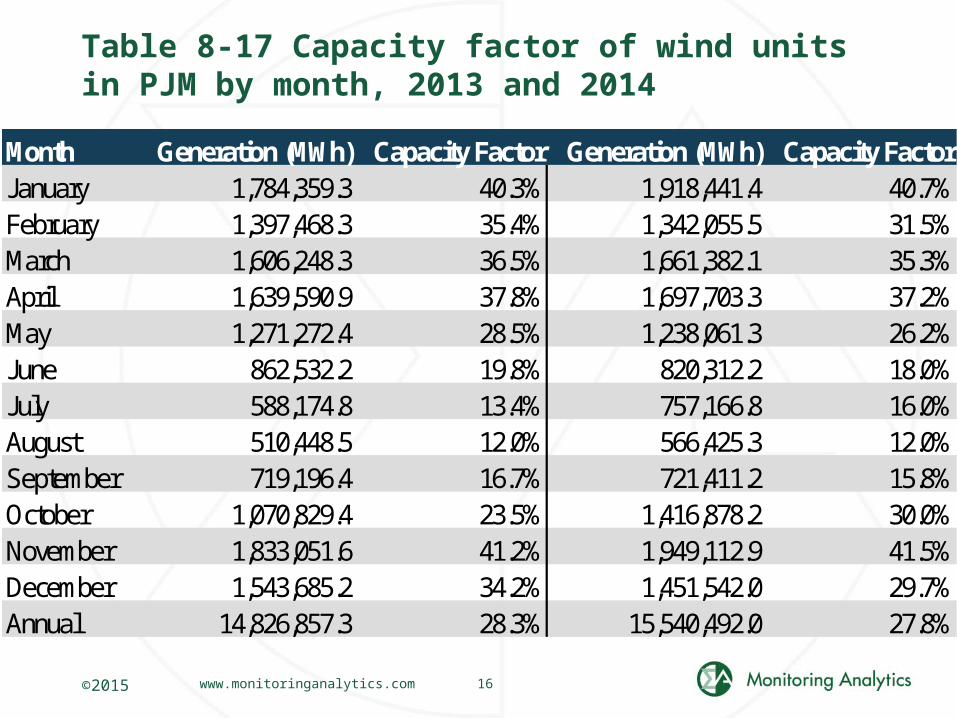
Table 8-17 Capacity factor of wind units in PJM by month, 2013 and 2014
©2015 www.monitoringanalytics.com 16
Month Generation (MWh) Capacity Factor Generation (MWh) Capacity FactorJanuary 1,784,359.3 40.3% 1,918,441.4 40.7%February 1,397,468.3 35.4% 1,342,055.5 31.5%March 1,606,248.3 36.5% 1,661,382.1 35.3%April 1,639,590.9 37.8% 1,697,703.3 37.2%May 1,271,272.4 28.5% 1,238,061.3 26.2%June 862,532.2 19.8% 820,312.2 18.0%July 588,174.8 13.4% 757,166.8 16.0%August 510,448.5 12.0% 566,425.3 12.0%September 719,196.4 16.7% 721,411.2 15.8%October 1,070,829.4 23.5% 1,416,878.2 30.0%November 1,833,051.6 41.2% 1,949,112.9 41.5%December 1,543,685.2 34.2% 1,451,542.0 29.7%Annual 14,826,857.3 28.3% 15,540,492.0 27.8%

Wind Percent Recovery of Levelized Costs
©2015 www.monitoringanalytics.com 17
Zone 2012 2013 2014 ComEd 67% 77% 93%PENELEC 64% 79% 99%

Figure 8-5 Average hourly real-time generation of solar units in PJM: 2014
©2015 www.monitoringanalytics.com 18
0
20
40
60
80
100
120
140
160
180
200
1 2 3 4 5 6 7 8 9 10 11 12 13 14 15 16 17 18 19 20 21 22 23 24
MW
Hour Ending (EPT)
January
February
March
April
May
June
July
August
September
October
November
December

Solar Percent Recovery of Levelized Costs
©2015 www.monitoringanalytics.com 19
Zone 2012 2013 2014 PSEG 100% 166% 190%

Table 1 Summary of sensitivity results: 2017/2018 RPM Base Residual Auction
©2014 www.monitoringanalytics.com 20
Scenario Scenario DescriptionRPM Revenue
($ per Delivery Year)RPM Revenue
($ per Delivery Year)Percentage
0 Actual Results $7,512,229,630 NA NA1 Annual Resources Only $9,738,222,922 $2,225,993,292 29.6%2 No Offers for DR or EE (Generation Resources Only) $16,859,658,203 $9,347,428,573 124.4%
3No Short-Term Resource Procurement Target Reduction from VRR Curve $9,947,329,539 $2,435,099,909 32.4%
3A No Short-Term Resource Procurement Target Reduction $9,967,834,187 $2,455,604,557 32.7%
4No Short-Term Resource Procurement Target Reduction and Annual Resources Only $10,932,522,889 $3,420,293,259 45.5%
5No Short-Term Resource Procurement Target Reduction and No Offers for DR or EE (Generation Resources Only) $23,870,404,571 $16,358,174,941 217.8%
Difference from Actual Results

Monitoring Analytics, LLC
2621 Van Buren Avenue
Suite 160
Eagleville, PA
19403
(610) 271-8050
www.MonitoringAnalytics.com
©2015 www.monitoringanalytics.com 21