ATTACHMENT B AGRICULTURAL RESOURCE ASSESSMENT: …
54
Tarrawonga Coal Project – Agricultural Resources and Productivity Assessment ATTACHMENT B AGRICULTURAL RESOURCE ASSESSMENT: “TARRAWONGA COAL PROJECT’, BOGGABRI, NSW (MCKENZIE SOIL MANAGEMENT, 2011)
Transcript of ATTACHMENT B AGRICULTURAL RESOURCE ASSESSMENT: …
Tarrawonga Coal Project – Agricultural Resources and Productivity Assessment
ATTACHMENT B
AGRICULTURAL RESOURCE ASSESSMENT: “TARRAWONGA COAL PROJECT’, BOGGABRI, NSW (MCKENZIE SOIL MANAGEMENT, 2011)
_______________________________Agricultural Resource Assessment: “Tarrawonga Coal Project”
McKenzie Soil Management Pty. Ltd. ___________________________________________________ i
Agricultural Resource Assessment: “Tarrawonga Coal Project”, Boggabri NSW
Prepared for Whitehaven Coal Mining Pty Ltd.
October 2011
Dr. David McKenzie McKenzie Soil Management Pty. Ltd.
Orange NSW

_______________________________Agricultural Resource Assessment: “Tarrawonga Coal Project”
McKenzie Soil Management Pty. Ltd. ___________________________________________________ i
Contents 1 INTRODUCTION.................................................................................................................1
1.1 Background ....................................................................................................................1
1.2 Scope and Objectives .....................................................................................................1
2 PROJECT OVERVIEW........................................................................................................5
3 PROJECT SITE DESCRIPTION .........................................................................................7
4 SOIL RESOURCES..............................................................................................................9
4.1 Existing Information ......................................................................................................9
4.2 Methodology ................................................................................................................13
4.3 Soil Types and Mapping...............................................................................................18
4.4 Soil Conditions.............................................................................................................23
5 RURAL LAND CAPABILITY ASSESSMENT................................................................27
5.1 Background ..................................................................................................................27
5.2 Existing Information ....................................................................................................28
5.3 Rural Land Capability Classification ..........................................................................28
6 AGRICULTURAL SUITABILITY....................................................................................30
6.1 Background ..................................................................................................................30
6.2 Existing Information ....................................................................................................31
6.3 Agricultural Suitability Classification .........................................................................31
7 REHABILITATION AND SOIL MANAGEMENT..........................................................34
7.1 Proposed Rehabilitation Strategy ................................................................................34
7.2 Soil Resource Estimate ................................................................................................34
7.3 Soil Constraints and Ameliorants ................................................................................38
7.4 Soil Resource Management Measures .........................................................................40
7.5 Rehabilitation – Agricultural Land Uses .....................................................................43
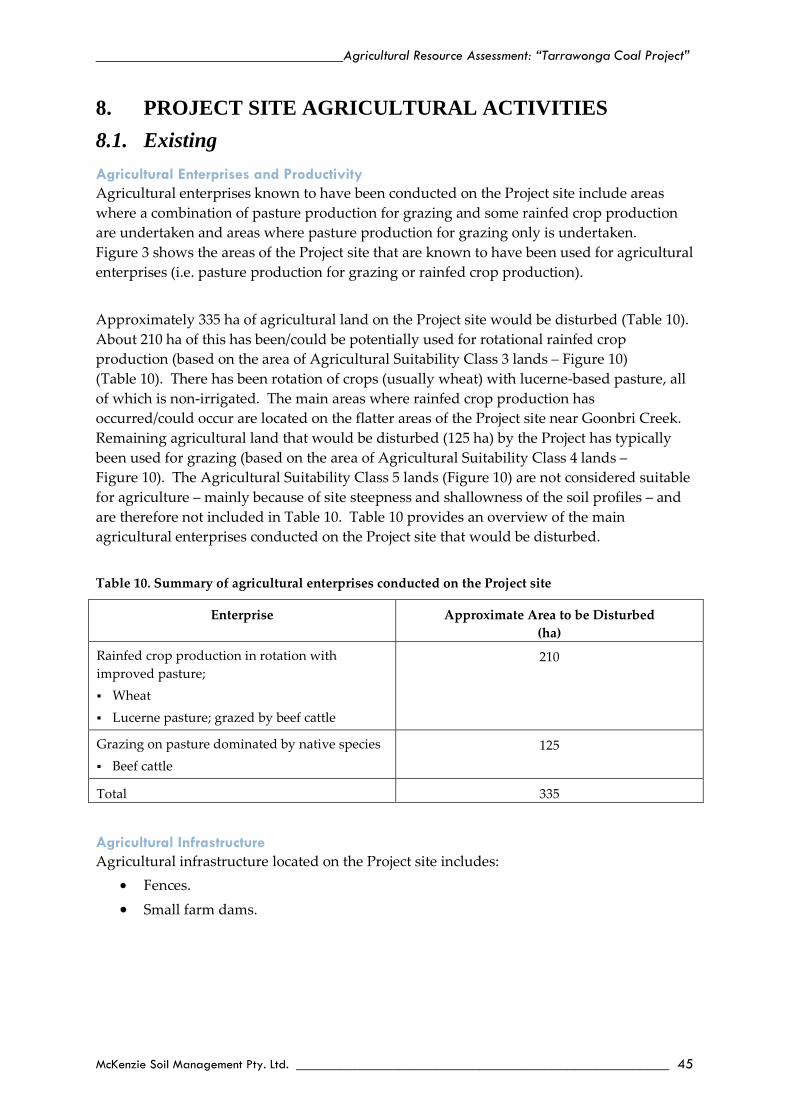
8. PROJECT SITE AGRICULTURAL ACTIVITIES ...........................................................45
8.1. Existing ........................................................................................................................45
8.2. Post-Mining..................................................................................................................47
9 REFERENCES....................................................................................................................48

_______________________________Agricultural Resource Assessment: “Tarrawonga Coal Project”
McKenzie Soil Management Pty. Ltd. ___________________________________________________ ii
List of Figures
Figure 1 Regional Location Figure 2 Project General Arrangement Figure 3 Existing Agricultural Enterprises on the Project Site Figure 4 Existing and Project Soil Pit Locations Figure 5 Boggabri 1:100 000 Sheet Soil Landscapes Mapping Figure 6 The Link between Aggregate Stability in Water (ASWAT) Results and Soil
Management Options (Prepared in conjunction with the Central West Catchment Management Authority 2007)
Figure 7 Examples of the Soil Types Identified during the Survey Figure 8 Soil Landscape Units Mapping Figure 9 Rural Land Capability Mapping Figure 10 Agricultural Suitability Mapping Figure 11 Agricultural Enterprises on the Project Site Post Mining Figure 12 Recommended Soil Stripping Depths
List of Tables
Table 1 Soil landscape units for the Project site (Banks and King, in press) Table 2 Relationship between hand texture descriptions and the clay content of a soil
(McDonald et al. 1990) Table 3 The relationship between the Emerson aggregate stability test and the ASWAT
test that assess the severity of dispersion when soil aggregates are added to water
Table 4 Soil types, according to the Australian Soil Classification Table 5 Association between Australian Soil Classification and Great Soil Groups for
Soil Table 6 Bore logs; drilling carried out by Mannion Drilling for Whitehaven Coal (10 to
13 May 2011) Table 7 Soil suitability criteria Table 8 Soil resource availability Table 9 Summary of soil constraints and ameliorants Table 10 Summary of agricultural enterprises conducted on the Project site Table 11 Approximate productivity of the agricultural enterprises on the Project site Table 12 Summary of agricultural enterprises conducted on the Project site post-mining

_______________________________Agricultural Resource Assessment: “Tarrawonga Coal Project”
McKenzie Soil Management Pty. Ltd. ___________________________________________________ iii
List of Maps
Map 1 Elevation data (5 m interval) Map 2 Soil types; Australian Soil Classification Map 3 Depth to rock Map 4 Depth to gravel/sand layers in alluvium/colluvium Map 5 Dispersion ASWAT scores Map 6 Dispersion; ESP values Map 7 Compaction severity; SOILpak score Map 8 Cation exchange capacity (meq/100g) Map 9 Salinity; electrical conductivity (ECe, dS/m) Map 10 pH (CaCl2) Map 11 Phosphorus (Colwell P, mg/kg) Map 12 Organic carbon (%)
List of Appendices
Appendix 1 Pre-existing Soil Information Appendix 2 Overview Data Appendix 3 Layer Data Appendix 4 Layer Data – Soil Structure Details Appendix 5 Laboratory Data Appendix 6 SCS Laboratory; Calibration Data Appendix 7 Agricultural Suitability of Key Sites under the Current Management
Regime
_______________________________Agricultural Resource Assessment: “Tarrawonga Coal Project”
McKenzie Soil Management Pty. Ltd. ___________________________________________________ 1
1 INTRODUCTION
1.1 Background The Tarrawonga Coal Mine is an open cut mining operation located approximately 15 kilometres (km) north-east of Boggabri and 42 km north-northwest of Gunnedah in New South Wales (NSW) (Figure 1). Tarrawonga Coal Pty Ltd (TCPL) is the owner and operator of the Tarrawonga Coal Mine, which is a joint venture between Whitehaven Coal Mining Pty Ltd (Whitehaven) (70% interest) and Boggabri Coal Pty Ltd (a wholly owned subsidiary of Idemitsu Australia Resources Pty Ltd) (30% interest). The Tarrawonga Coal Mine commenced operations in 2006 and currently produces up to approximately 2 million tonnes per annum (Mtpa) of run-of-mine (ROM) coal. The Tarrawonga Coal Project (the Project) would involve the continuation and extension of open cut mining operations at the Tarrawonga Coal Mine and would facilitate a ROM coal production rate of up to 3 Mtpa. The proposed life of the Project is 17 years, commencing 1 January 2013. This would extend the life of the currently approved operations at the Tarrawonga Coal Mine by approximately 12 years (i.e. until 2029). The approximate extent of the existing and approved surface development (including open cut, mine waste rock emplacement, soil stockpiles and infrastructure areas) at the Tarrawonga Coal Mine are shown on Figure 2. A detailed description of the Project is provided in Section 2 of the Main Report of the Environmental Assessment (EA).
1.2 Scope and Objectives This assessment has been prepared to assist with addressing of the following components of the Director General’s Environmental Assessment Requirements for the Project:
Agricultural Productivity – including:
- a description of the agricultural resources (especially soils and water resources used or capable of being used for agriculture) and agricultural enterprises of the locality;
- a detailed assessment of the potential impacts of the project on agricultural resources and/or enterprises of the locality;
- a detailed description of the measures that would be implemented to avoid and/or minimise the potential impacts of the project on agricultural resources and/or enterprises of the locality, and
- justification for any significant long term changes to agricultural resources, particularly if highly productive agricultural resources (eg alluvial lands) are proposed to be affected by the project;
Additional detail on the water resources used or capable of being used for agriculture is provided in the Groundwater Assessment (Heritage Computing 2011) (Appendix A of the EA), Surface Water Assessment (Gilbert & Associates 2011) (Appendix B of the EA) and the Agricultural Resources and Productivity Assessment (Resource Strategies 2011) (Appendix I of EA).


_______________________________Agricultural Resource Assessment: “Tarrawonga Coal Project”
McKenzie Soil Management Pty. Ltd. ___________________________________________________ 4
The objectives of this study were to provide the following:
• Describe the agriculture resources and enterprises of the lands associated with the Project site.
• Estimate the post mining agriculture resources of the lands associated with the Project site.
• Recommend management measures for agriculture resources.

_______________________________Agricultural Resource Assessment: “Tarrawonga Coal Project”
McKenzie Soil Management Pty. Ltd. _____________________________________________ 5
2 PROJECT OVERVIEW The main activities associated with the development of the Project would include (Figure 2):
• continued development of mining operations in the Maules Creek Formation to facilitate a Project ROM coal production rate of up to 3 Mtpa, including open cut extensions: to the east within Mining Lease (ML) 1579 and Mining Lease Application
(MLA) 2; and to the north within CL 368 (MLA 3) which adjoins ML 1579;
• ongoing exploration activities;
• construction and use of a services corridor (including haul road link) directly from the Project open cut mining operation to the upgraded Boggabri Coal Mine Infrastructure Facilities1;
• use of upgraded Boggabri Coal Mine Infrastructure Facilities for the handling and processing of Project coal and the loading of Project product coal to trains for transport on the Boggabri Coal Mine private rail spur to the Werris Creek Mungindi Railway1;
• construction and use of a new mine facilities area including relocation of existing mine facilities infrastructure and service facilities;
• use of an existing on-site mobile crusher for coal crushing and screening of up to 150,000 tonnes of domestic specification coal per annum for direct collection by customers at the mine site;
• use an existing on-site mobile crusher to produce up to approximately 90,000 cubic metres (m3) of gravel materials per annum for direct collection by customers at the mine site;
• progressive backfilling of the mine void behind the advancing open cut mining operation with waste rock and minor quantities of coarse reject material;
• continued and expanded placement of waste rock in the Northern Emplacement (including integration with the Boggabri Coal Mine emplacement) and Southern Emplacement, as mining develops;
• progressive development of new haul roads and internal roads, as mining develops;
• realignment of sections of Goonbri Road and construction of new intersections;
• construction of an engineered low permeability barrier to the east and south-east of the open cut to reduce the potential for local drainage of alluvial groundwater into the open cut;
• removal of a section of Goonbri Creek within the Project open cut and the establishment of a permanent Goonbri Creek alignment and associated flood bund to the east and south-east of the open cut;
1 Subject to approvals and upgrades being in place for the transfer of Project ROM coal to the Boggabri Coal
Mine Infrastructure Facilities.

_______________________________Agricultural Resource Assessment: “Tarrawonga Coal Project”
McKenzie Soil Management Pty. Ltd. ___________________________________________________ 6
• progressive development of sediment basins and storage dams, pumps, pipelines and other water management equipment and structures;
• continued development of soil stockpiles, laydown areas and gravel/borrow areas;
• ongoing monitoring and rehabilitation; and
• other associated minor infrastructure, plant, equipment and activities. The use of the Boggabri Coal Mine Infrastructure Facilities for the handling, processing and transportation of coal from the Tarrawonga Coal Mine would be authorised by an appropriately modified approval for the Boggabri Coal Mine. The proposed life of the Project is 17 years, commencing 1 January 2013. This would extend the life of the currently approved operations at the Tarrawonga Coal Mine by approximately 12 years.

_______________________________Agricultural Resource Assessment: “Tarrawonga Coal Project”
McKenzie Soil Management Pty. Ltd. ___________________________________________________ 7
3 PROJECT SITE DESCRIPTION The Project would be located within existing mining tenements ML 1579 and would extend into new MLA areas (MLA 1, MLA 2 and MLA 3) (Figure 2). MLA 3 would be located within the existing Coal Lease 368. The existing/approved Tarrawonga Coal Mine is located wholly within ML 1579 (Figure 2). The topography of the Project site comprises rolling hills in the north up to approximately 370 metres (m) Australian Height Datum (AHD) in elevation gradually decreasing to approximately 260 m AHD in the floodplains of Goonbri Creek in the south. This floodplain is part of the Central Mixed Soil Floodplain as defined in Namoi Catchment Water Study Independent Expert Phase 2 Report (Schlumberger Water Services 2011). Slope of the land ranges from approximately 0.5% in the alluvial areas to about 20% on the steepest hillsides. Agricultural areas are located in MLA 1 and the southern areas of ML 1579 and MLA 2 (Figure 2). No agricultural areas are currently located in MLA 3. Other areas of the Project site consist of the existing/approved Tarrawonga Coal Mine, the Boggabri Coal Mine, the Leard State Forest and vegetated areas (Figure 2). Agricultural enterprises known to have been conducted on the Project site include areas where a combination of pasture production for grazing and some rainfed crop production are undertaken and areas where pasture production for grazing only is undertaken. Figure 3 shows the areas of the Project site that are known to have been used for agricultural enterprises. There has been rotation of crops (usually wheat) with lucerne-based pasture, all of which is non-irrigated. The main areas where rainfed crop production has occurred/could occur are located on the flatter areas of the Project site near Goonbri Creek. Remaining more elevated agricultural land has typically been used for grazing. An aerial image of the Project site is shown on Figure 2. Elevation data supplied by TCPL are shown on Map 1.


_______________________________Agricultural Resource Assessment: “Tarrawonga Coal Project”
McKenzie Soil Management Pty. Ltd. ___________________________________________________ 9
4 SOIL RESOURCES 4.1 Existing Information The following existing information relevant to the Project site was available for this assessment:
• Soil Landscapes of the Boggabri 1:100 000 Sheet (Boggabri, Gunnedah, Maules Creek, Carroll) (Banks and King in press);
• Proposed East Boggabri Coal Mine: Soils and Land Capability Study of Proposed Mine Site (Cunningham 2005a);
• Proposed East Boggabri Coal Mine: Soils and Land Capability Study of the Proposed Transport Route (Cunningham 2005b); and
• Continuation of Boggabri Coal Mine Project Environmental Assessment: Soil Survey and Land Resource Assessment (GSS Environmental 2010).
A brief summary of relevant information from the reports above is provided below. Soil Landscapes of the Boggabri 1:100 000 Sheet Banks and King conducted a Soil Landscapes study across the region in 2004. The report remains unpublished (‘in press’), but was made available by Robert Banks (pers. comm.). The soil profile data used in their study are available from the NSW Government Soil Profile Attribute Data Environment (SPADE) Website (part of the NSW Natural Resource Atlas). Three soil profiles descriptions (Appendix 1) in the Project site are available from this study. Their locations are shown on Figure 4. A sub-set of the Soil Landscapes map prepared by Banks and King (in press) is shown on Figure 5. Features of the Soil Landscape units are described in Table 1. Proposed East Boggabri Coal Mine: Soils and Land Capability Studies Soil at the site of the existing Tarrawonga Coal Mine (i.e. ML 1579) was assessed by Cunningham (2005a); 46 soil pits (Figure 4) were assessed over an area of 395 hectares (ha). Pits 47 and 48 (Figure 4) in the investigation by Cunningham (2005b) are located in MLA 2 and therefore are particularly relevant to this assessment. Descriptions for these pits are shown in Appendix 1. In addition, the report provided a valuable preview of soil conditions and variability that were likely to be experienced in the hilly sections of MLA 2. There are two main sources of parent material at the study site (Wiram 1982, cited by Cunningham 2005a):
• the residuum of weathered sandy conglomerates; and
• alluvium and/or colluvium derived from weathering of former soil profiles and bedrock of surrounding volcanic and sedimentary outcrops.
The conglomerate is part of the coal-bearing ‘Maules Creek Formation’2.
2 http://www.dpi.nsw.gov.au/minerals/geological/overview/regional/sedimentary-basins/gunnedah


_______________________________Agricultural Resource Assessment: “Tarrawonga Coal Project”
McKenzie Soil Management Pty. Ltd. ___________________________________________________ 12
Table 1. Soil landscape units for the Project site (Banks and King, in press)
Soil Landscape Unit
Position in Landscape Soil Types (Australian Soil Classification)
Leard (lex)
Rolling to steep and low hills on Permian sandstones and conglomerates (Erosional).
Hillcrests and benches are dominated by well drained Rudosols and Tenosols, with Brown Kurosols and minor Red and Brown Chromosols on acidic shale/mudstone.
Blue Vale (bvy)
Undulating low hills and hills on Permian sandstones and conglomerates (Residual).
Brown Chromosols and Brown Sodosols are dominant.
Tally Ho (taw)
Undulating broad hillcrests, and plateaux, on Jurassic basalts and dolerites (Residual).
Very deep Red Ferrosols and Dermosols are dominant. Shallow Leptic Rudosols occur on some of the rocky crests. Red, Brown and Black Vertosols are occasionally present on broad crests and plateaux.
Brentry (byr)
Drainage plains and fans formed on Quaternary alluvium from Permian quartz sandstones and conglomerates (Transferral).
Footslopes are dominated by Grey Chromosols or by Brown Sodosols. Plain elements of the landscape are dominated by Brown Vertosols and Brown Sodosols.
Driggle Draggle (ddw)
Extensive plains created by ancient alluvial processes which are no longer evident (Stagnant Alluvial).
Soil distribution is complex. Soil types include Grey Chromosols, Brown Sodosols, Grey and Brown Vertosols and Brown Dermosols.
Hartfell (hay)
Rolling to undulating low hills on Permian-Carboniferous rhyolites, rhyolite tuffs and andesites of the Gunnedah and Boggabri Volcanics (Erosional).
Hillcrests dominated by very shallow Tenosols, with hillslopes on rhyolite dominated by Chernic Tenosols. Hillslopes on dacite and andesite tend to have heavier soils such as Grey or Black Vertosols.
Top Rock (tot)
Broad, long (1000-1500m) gently inclined footslopes on colluvium derived from Permian sandstones and conglomerates of the Curlewis Hills (Transferral).
Upper slopes are generally dominated by very deep Red Sodosols and some Bleached Red Chromosols; mid to lower footslopes are dominated by imperfectly to poorly drained deep to very deep Brown Sodosols.

_______________________________Agricultural Resource Assessment: “Tarrawonga Coal Project”
McKenzie Soil Management Pty. Ltd. ___________________________________________________ 13
Continuation of Boggabri Coal Mine: Soil Survey and Land Resource Assessment A soil survey for a proposed expansion of the Boggabri Coal Mine was conducted in the Leard State Forest, immediately to the north of the Project, by GSS Environmental (2010). Fourteen soil inspection sites were examined over an area of 2,924 ha. Data from this study are of limited value for this study because of the following problems:
• Soil horizon designations were not given as per the ‘Australian Soil and Land Survey Field Handbook’ (McDonald et al. 1990).
• The soil has not been classified according to the Australian Soil Classification (Isbell 2002).
• The methodology indicates that cation exchange capacity and exchangeable sodium (both important factors) are to be analysed, but the results are not provided in the report. This means that dispersibility and gypsum requirement cannot be determined with sufficient accuracy.
• The soil pit to area ratio is considered too low to obtain a reliable dataset. The review of previous studies indicated that very little information about soil condition was available for MLA 1, MLA 2 and MLA 3 areas. Further assessment of these areas was therefore required – particularly in the proposed extent of Project surface development (Figure 4). The soil survey component of this assessment therefore focuses on MLA 1, MLA 2 and MLA 3 areas of the Project site (Figure 4).
4.2 Methodology A soil survey was conducted to characterise and assess the soils in the survey area (Figure 4). This section provides a description of the soil survey methodology and outcomes. The following soil information is regarded by Ward (1998) as being important for soil and overburden assessment associated with mine site reclamation.
• Classification (structure, texture etc); allows existing data and experience on managing similar soils elsewhere to be applied.
• Dispersion index and particle size analysis; indicates soil structural stability and erodibility.
• pH; need to identify extreme ranges for treatment of lime or selection of suitable plant species.
• Electrical conductivity; indicates soluble salt status.
• Macro- and micro-nutrients.
_______________________________Agricultural Resource Assessment: “Tarrawonga Coal Project”
McKenzie Soil Management Pty. Ltd. ___________________________________________________ 14
More specifically, Elliott and Reynolds (2007) suggest that the following soil factors need to be considered when assessing suitability of topdressing materials for mine site reclamation:
• Structure grade, which affects the ability of water and oxygen to enter soil.
• The ability of a soil to maintain structure grade following mechanical work associated with the extraction, transportation and spreading of topdressing material.
• The ability of soil peds to resist deflocculation when moist.
• Macrostructure; where soil peds are larger than 100 millimetres (mm) in the subsoil, they are likely to slake or be hardsetting and prone to surface sealing.
• Mottling; its presence may indicate reducing conditions and poor soil aeration.
• Texture; soil with textures equal to or coarser than sandy loam are considered unsuitable as topdressing materials because they are extremely erodible and have low water holding capacities.
• Material with a gravel and sand content greater than 60% is unsuitable.
• Saline material is unsuitable. These soil factors have been taken into account when planning the soil assessment procedures for the Project.
Field Survey The field work was carried out over nine days between 2 and 7 February 2011 and 15 to 17 February 2011. Sixty-three backhoe pits (approx. 1.4 m deep; shallower where hard rock was encountered) were assessed and the locations are shown on Figure 4. The pits were located in a way that covered the main variations in vegetation type (FloraSearch 2011) and topography. It should be noted that the MLA 1 and MLA 2 boundaries were modified after the completion of the field survey conducted in February 2011 and therefore some pits are located outside of the Project area (Figure 4). A ‘Magellan Explorist 210’ GPS instrument with an accuracy of about ±4 m was used to record the pit coordinates (Appendix 2). The soil was examined using pits approximately 1.4 m deep that were dug with a backhoe. They were trimmed with a geological pick to allow photography and description of the undisturbed structure and root growth. Thirty-six of the pits were sampled for laboratory analysis. At most of these sites, extra pits were dug more deeply (and immediately refilled) to allow collection of deeper soil samples, where possible, to a depth of 3 m.
_______________________________Agricultural Resource Assessment: “Tarrawonga Coal Project”
McKenzie Soil Management Pty. Ltd. ___________________________________________________ 15
The field description methods were as described in the ‘Australian Soil and Land Survey Field Handbook’ (McDonald et al. 1990) and the ‘Guidelines for Surveying Soil and Land Resources, Chapter 29’ (McKenzie et al. 2008). The soil profiles have been classified (Appendix 2) according to the Australian Soil Classification (Isbell 2002).
Field Soil Observations/Testing The following characteristics were assessed for the layers identified in each of the soil profiles:
• thickness of each layer (horizon);
• soil moisture status at the time of sampling;
• pH (using Raupach test kit);
• colour of moistened soil (using Munsell reference colours);
• pedality of the soil aggregates;
• amount and type of coarse fragments (gravel, rock, manganese oxide nodules);
• texture (proportions of sand, silt and clay), estimated by hand;
• presence/absence of free lime and gypsum;
• root frequency; and
• dispersibility and the degree of slaking in deionised water (after 10 minutes). Field observations for each pit are presented in Appendices 2 and 3. The soil structure information (Appendix 4) has been summarised to give SOILpak ‘compaction severity’ scores (McKenzie 2001). This allows deep tillage recommendations to be made from the structure observations. The score is on a scale of 0.0 to 2.0, with a score of 0.0 indicating very poor structure for crop root growth and water entry/storage. Ideally, the SOILpak score of the root zone should be in the range 1.5–2.0. Hand texturing provides an approximation of the clay content of a soil (Table 2). In conjunction with the estimation of coarse fragment (gravel) content, it provides a low-cost alternative to particle size analysis (PSA).

_______________________________Agricultural Resource Assessment: “Tarrawonga Coal Project”
McKenzie Soil Management Pty. Ltd. ___________________________________________________ 16
Table 2. Relationship between hand texture descriptions and the clay content of a soil (McDonald et al. 1990)
Texture Description Approximate Clay Content (%)
Sand commonly <5%
Loamy sand about 5%
Clayey sand 5-10%
Sandy loam 10-20%
Loam about 25%
Silty loam about 25%
Sandy clay loam 20-30%
Clay loam 30-35%
Silty clay loam 30-35%
Light clay 35-40%
Light medium clay 40-45%
Medium clay 45-55%
Medium heavy clay 50% or more
Heavy clay 50% or more
Laboratory Soil Testing A total of 197 × 1 kilogram (kg) soil samples were collected from 36 pits:
• 0-15 centimetres (cm): 36 samples;
• 15-30 cm: 36 samples;
• 30-60 cm: 36 samples;
• 60-90 cm: 30 samples (some of the hill sites had hard rock below 60 cm);
• 90-120 cm: 11 samples (only collected where a contrasting/important layer of soil was observed below 90 cm);
• 2 m: 25 samples (mainly alluvial sites); and
• 3 m: 23 samples (mainly alluvial sites). Where a distinct A2 horizon was present, for example between 10-25 cm, the sampling depths were adjusted to keep the contrasting layers separate; in this case, 0-15 cm = 0-10 cm, 15-30 cm = 15-25 cm. The soil was analysed by Incitec-Pivot Laboratory, Werribee Victoria for exchangeable cations, pH, electrical conductivity, chlorides, nutrient status (nitrate-nitrogen, phosphorus, sulfur, zinc, copper, boron) and organic matter content. An ammonium acetate method was used for the extraction of exchangeable cations. The cation exchange capacity (CEC) values are the sum of exchangeable sodium, potassium, calcium, and magnesium. Phosphorus was determined using the Colwell method, sulphur by the CPC method, boron by a calcium chloride (CaCl2) extraction and zinc/copper by a DTPA extraction (see Rayment and Lyons [2011] for further details).

_______________________________Agricultural Resource Assessment: “Tarrawonga Coal Project”
McKenzie Soil Management Pty. Ltd. ___________________________________________________ 17
Soil dispersibility, as measured by the Aggregate Stability in Water (ASWAT) test (Field et al. 1997), was assessed by McKenzie Soil Management in Orange. The results are presented in Appendix 5. The ASWAT test has been related to the well known Emerson aggregate stability test by Hazelton and Murphy (2007) – see Table 3. An advantage of the ASWAT test is that the results can be linked with management issues such as the need for gypsum application and avoidance of wet working (Figure 6).
Table 3. The relationship between the Emerson aggregate stability test and the ASWAT test that assess the severity of dispersion when soil aggregates are added to water
Dispersibility Emerson Aggregate Classes
Probable Score for the ASWAT Test (Field et al. 1997)
Very high 1 and 2(3) 12-16
High 2(2) 10-12
High to moderate 2(1) 9-10
Moderate 3(4) and 3(3) 5-8
Slight 3(2), 3(1) and 5 0-4
Negligible/aggregated 4, 6, 7, 8 0
Figure 6 The Link between Aggregate Stability in Water (ASWAT) Results and Soil Management Options (Central West Catchment Management Authority 2007)

_______________________________Agricultural Resource Assessment: “Tarrawonga Coal Project”
McKenzie Soil Management Pty. Ltd. ___________________________________________________ 18
The conversion factors of Slavich and Petterson (1993) allowed the electrical conductivity of saturated paste extracts (ECe) to be calculated from the electrical conductivity of 1:5 soil: water suspensions (EC1:5) and texture. Seven calibration samples (2 kg samples from Pit 13 (0-15 cm, 15-30 cm, 30-60 cm) and Pit 27 (0-15 cm, 15-30 cm, 30-60 cm, 60-90 cm)3 were analysed by NSW Soil Conservation Service (SCS) Laboratory for the following analyses, which are part of the ‘Erosion and sediment control’ package (Appendix 6):
• Dispersion percentage.
• Emerson aggregate test.
• Organic carbon.
• Particle size analysis.
• Particle size analysis – mechanical dispersion.
• Soil erodibility factor (K factor). The following important key soil factors are attached in the form of colour coded maps (prepared by Paul Hatton, HRP Design, Orange): Map 2. Soil types; Australian Soil Classification. Map 3. Depth to rock. Map 4. Depth to gravel/sand layers in alluvium/colluvium. Map 5. Dispersion; ASWAT scores. Map 6. Dispersion; ESP values. Map 7. Compaction severity SOILpak score. Map 8. Cation exchange capacity (meq/100g). Map 9. Salinity; electrical conductivity (ECe, dS/m). Map 10. pH (CaCl2). Map 11. Phosphorus (Colwell P, mg/kg). Map 12. Organic carbon (%).
4.3 Soil Types and Mapping
General Description of Soil Types The Australian Soil Classification (Isbell 2002) has been used to determine soil types at each of the 63 pits (Map 2). A summary of the soil types observed during the survey is shown in Table 4.
3 Pit 13 is referred to as Pit T17 and Pit 27 is referred to as Pit T18 is in Appendix 6.

_______________________________Agricultural Resource Assessment: “Tarrawonga Coal Project”
McKenzie Soil Management Pty. Ltd. ___________________________________________________ 19
Table 4. Soil types, according to the Australian Soil Classification
SOIL GROUPINGS Australian Soil Classification Orders
Australian Soil Classification
Suborders
Number of Soil Profiles in Each
Category
Deep Recent Alluvium (28) Rudosol (28) Stratic 28
Leptic 4
Brown-Orthic 2
Yellow-Orthic 2
Shallow Stony Soil (11) Tenosol (11)
Bleached Leptic 3
Red 2
Brown 2
Chromosol (5)
Grey 1
Red 5
Brown 3
Grey 1
Sodosol (10)
Yellow 1
Duplex Soil – loam topsoil, clay-rich subsoil (17)
Kurosol (2) Red 2
Grey 3 Kandosol (5)
Yellow 2
Non-Duplex Loams (7)
Dermosol (2) Brown 2 The main soil types were Stratic Rudosols (all Stratic) (44%) and Tenosols (17%). Sodosols (16%), Chromosols (8%), Kandosols (8%), Kurosols (3%) and Dermosols (3%) were also observed4.
• Stratic Rudosols are characterised by a number of alluvial depositional layers that have been little altered by pedogenic processes except at or near the surface. The uppermost depositional layers may be as young as recent floods (McKenzie et al. 2004).
• Tenosols are shallow stony soils with only weak pedological development.
• Chromosols are duplex, ie. a strong contrast in texture between topsoil and subsoil. They have subsoil (B horizon) which is not strongly acidic and not sodic.
• Sodosols have a strong texture contrast between topsoil and sodic (ESP of 6 or greater) subsoil which is not strongly acidic.
• Kurosols are duplex soils with strongly acidic subsoil. Many of them have unusual subsoil chemical features (eg. high aluminium and sodium).
• Kandosols lack strong texture contrast and have poorly structured massive subsoils.
• Dermosols also lack strong texture contrast, but have structured B horizons.
4 Due to rounding, the percentages do not equal 100%.

_______________________________Agricultural Resource Assessment: “Tarrawonga Coal Project”
McKenzie Soil Management Pty. Ltd. ___________________________________________________ 20
Approximate correlations between the Australian Soil Classification (Isbell 2002) and the superseded Great Soil Group (Stace et al. 1968) terminology are shown in Table 5. Table 5. Association between Australian Soil Classification and Great Soil Groups for Soil
Australian Soil Classification Great Soil Group Stratic Rudosol Alluvial soils Tenosols Lithosols, silicious and earthy sands Chromosols Non-calcic brown soils, some red-brown earths and a
range of podzolic soils Sodosols Solodized solonetz and solodic soils, some soloths and
red-brown earths Kurosols Many podzolic soils and soloths Kandosols Red, yellow and grey earths, calcareous red earths Dermosols Prairie soils, chocolate soils, some red and yellow
podzolic soils Photos of representative soil profiles identified during the survey are presented in Figure 7.
In the forested areas, soil under the ‘white box – cypress pine’ communities tended to be deeper and less acidic than under adjacent ‘ironbark – cypress pine’ vegetation. At Pit 1, there was unusually moist soil around tree roots at a depth of 80-100 cm beneath the box trees. Most soil profiles in the area at that time were very dry following several weeks of extremely hot weather. It appears that the box tree roots were able to extract water from very deep layers and exude it into layers nearer the surface where nutrient availability may have been more favourable, ie. hydraulic lift (Caldwell et al. 1998).
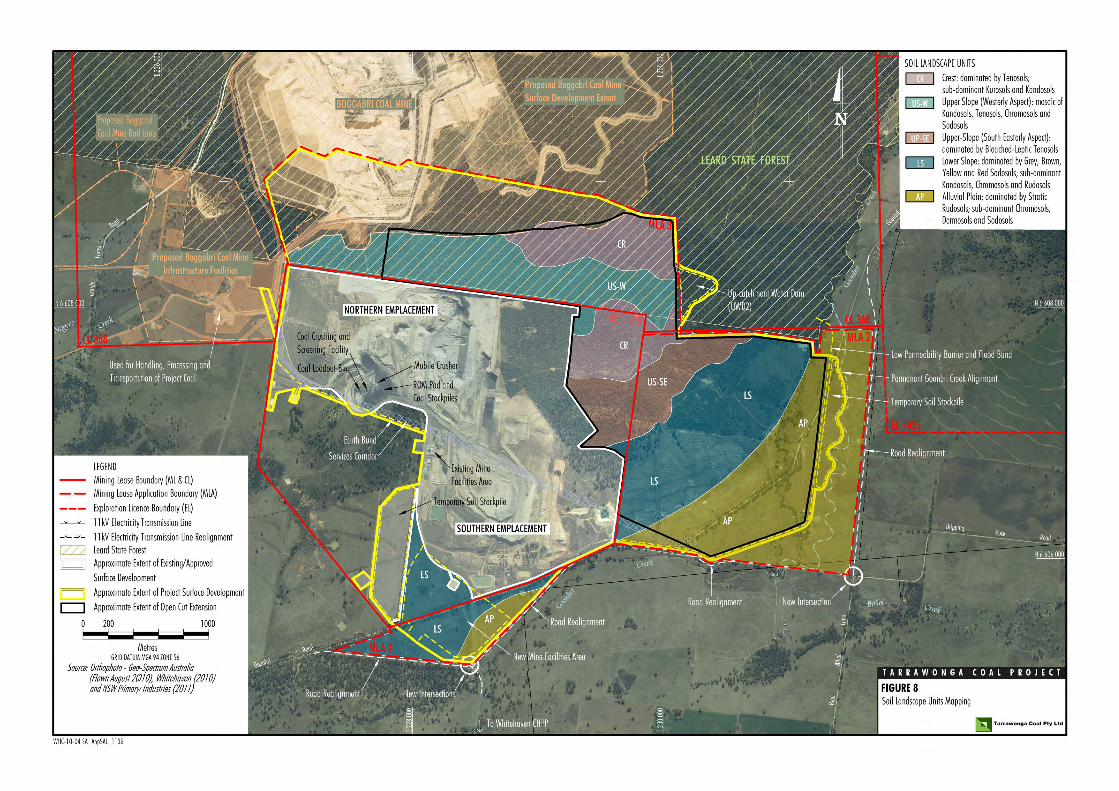
The soil landscapes associated with these soil types identified during the survey include:
• Crest (CR) is dominated by Tenosols; sub-dominant Kurosols and Kandosols.
• Upper Slope (westerly aspect) (US-W) is a mosaic of Kandosols, Tenosols, Chromosols and Sodosols.
• Upper Slope (south-easterly aspect) (US-SE) is dominated by Bleached-Leptic Tenosols.
• Lower Slope (LS) is dominated by Grey, Brown, Yellow and Red Sodosols; sub-dominant Kandosols, Chromosols, and Stratic Rudosols.
• Alluvial Plain (AP) is dominated by Stratic Rudosols; sub-dominant Chromosols, Dermosols and Sodosols.
As noted in Section 3, the alluvial plain associated with Goonbri Creek is part of the Central Mixed Soil Floodplain as defined in Namoi Catchment Water Study Independent Expert Phase 2 Report (Schlumberger Water Services 2011). The distribution of the soil landscapes is shown on Figure 8.

______________________________________________________________________Agricultural Resource Assessment: “Tarrawonga Coal Project”
McKenzie Soil Management Pty. Ltd. ________________________________________________________________________________________________ 21
Stratic Rudosol – Pit 41
Stratic Rudosol – Pit 43
Stratic Rudosol – Pit 57
Stratic Rudosol – Pit 59
Tenosol – Pit 14
Chromosol – Pit 23
Sodosol – Pit 17
Kurosol – Pit 2
Kandosol – Pit 12
Dermosol – Pit 7
Figure 7. Examples of the Soil Types Identified during the Survey

_______________________________Agricultural Resource Assessment: “Tarrawonga Coal Project”
McKenzie Soil Management Pty. Ltd. ___________________________________________________ 23
Accuracy of Soil Landscapes information for the Boggabri 1:100 000 Sheet The Soil Landscapes map shown in Figure 5 was prepared using a negligible amount of soil profile descriptions and analyses on the Project site, and several errors are evident:
• There was no evidence of Red Ferrosols and Dermosols on Jurassic basalts and dolerites (‘Tally Ho’ unit).
• The ‘Driggle Draggle’ unit is supposed to be dominated by soil with strong pedological development on alluvial plains that are no longer active, but the Stratic Rudosols with excellent subsoil conditions for root growth observed in this study did not fit the description.
4.4 Soil Conditions
Soil Depth, Texture and Water Holding Capacity As soil becomes shallower, stonier and/or sandier, its ability to store water declines (White 2006).
Map 3 shows the decrease in soil depth moving up the hill from the alluvial plain at the survey site. The shallow areas are associated with slopes of about 20%; erosion losses under the native vegetation on this steep infertile land would have prevented the development of deep soil profiles. With the surface texture being sandy loam and lighter at some of the hilly sites, wind erosion is likely to have occurred, in addition to erosion by water.
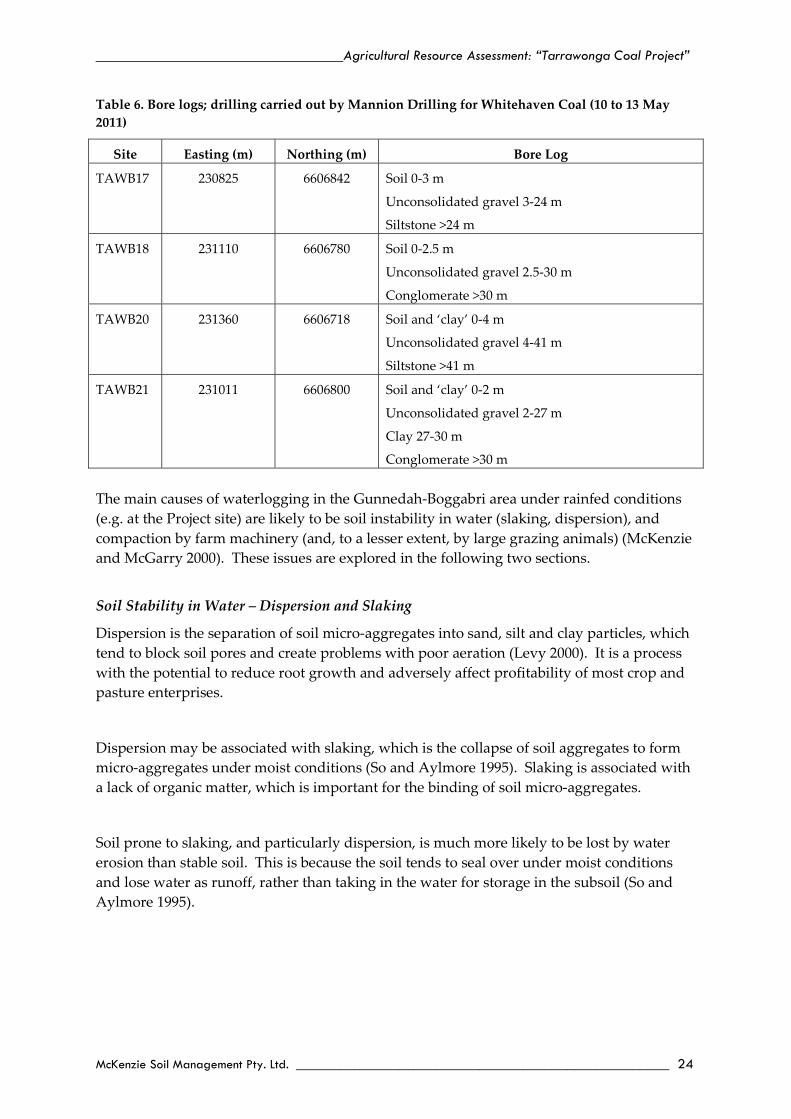
Some of the soil on the alluvial plains is underlaid by coarse sand and/or water-worn gravel (Map 4) (Figure 7, e.g. Pit 43). Recent drilling in alluvium near Goonbri Creek in the vicinity of Pits 27 and 35 (Table 6) indicated that the unconsolidated gravel extended to depths ranging from 24 m (beneath 3 m of ‘soil’) to 41 m (beneath 4 m of ‘soil’ and ‘clay’), and was underlaid by siltstone and conglomerate.
Plants are more likely to suffer drought stress where soil has a poor water storage capacity, particularly in hot weather with extended dry periods between rainfall events. At the Project site, the lack of waterholding capacity in shallow soils on the slopes (bedrock close to the surface) – and on alluvial soils with coarse gravel close to the surface – is a major constraint to agricultural productivity.
Waterlogging Hazard When soil is waterlogged, several adverse processes take place (Batey 1988):
• The lack of oxygen reduces the ability of plant roots to function properly.
• Anaerobic conditions can cause large losses of soil nitrogen to the atmosphere.
• Near-surface waterlogging is associated with inefficient storage of water due to excessive evaporation losses.
_______________________________Agricultural Resource Assessment: “Tarrawonga Coal Project”
McKenzie Soil Management Pty. Ltd. ___________________________________________________ 24
Table 6. Bore logs; drilling carried out by Mannion Drilling for Whitehaven Coal (10 to 13 May 2011)
Site Easting (m) Northing (m) Bore Log
TAWB17 230825 6606842 Soil 0-3 m
Unconsolidated gravel 3-24 m
Siltstone >24 m
TAWB18 231110 6606780 Soil 0-2.5 m
Unconsolidated gravel 2.5-30 m
Conglomerate >30 m
TAWB20 231360 6606718 Soil and ‘clay’ 0-4 m
Unconsolidated gravel 4-41 m
Siltstone >41 m
TAWB21 231011 6606800 Soil and ‘clay’ 0-2 m
Unconsolidated gravel 2-27 m
Clay 27-30 m
Conglomerate >30 m The main causes of waterlogging in the Gunnedah-Boggabri area under rainfed conditions (e.g. at the Project site) are likely to be soil instability in water (slaking, dispersion), and compaction by farm machinery (and, to a lesser extent, by large grazing animals) (McKenzie and McGarry 2000). These issues are explored in the following two sections.
Soil Stability in Water – Dispersion and Slaking
Dispersion is the separation of soil micro-aggregates into sand, silt and clay particles, which tend to block soil pores and create problems with poor aeration (Levy 2000). It is a process with the potential to reduce root growth and adversely affect profitability of most crop and pasture enterprises.
Dispersion may be associated with slaking, which is the collapse of soil aggregates to form micro-aggregates under moist conditions (So and Aylmore 1995). Slaking is associated with a lack of organic matter, which is important for the binding of soil micro-aggregates.
Soil prone to slaking, and particularly dispersion, is much more likely to be lost by water erosion than stable soil. This is because the soil tends to seal over under moist conditions and lose water as runoff, rather than taking in the water for storage in the subsoil (So and Aylmore 1995).

_______________________________Agricultural Resource Assessment: “Tarrawonga Coal Project”
McKenzie Soil Management Pty. Ltd. ___________________________________________________ 25
Two maps relating to soil stability in water are presented. The ASWAT score (Map 5) shows how prone the soil is to dispersion under conditions that existed when the soil was sampled (Field et al. 1997). The ‘working when wet’ procedure that is part of the ASWAT test is a simulation of processes such as raindrop impact on wet soil and the cutting/stockpiling of moist soil. Much of the topsoil and subsoil in the survey area is prone to dispersion, particularly after being worked when wet.
Exchangeable sodium percentage (ESP) values (Map 6) are mostly lower than expected for such dispersive soil (as indicated by the ASWAT scores). The Electrochemical Stability Index (ESI) values (Appendix 5) however are very low, indicating that most of the soil in the survey area has aggravation of dispersion because of very low electrolyte concentrations. A notable feature on Map 6 is the great depth (up to 3 m) to which the low-sodicity subsoil extends.
The main chemical factors influencing the behaviour of clay particles in sodic soils are exchangeable sodium and electrolyte concentration, but elevated exchangeable magnesium concentrations also can make clay particles in soil less stable in water (Levy 2000). On the non-alluvial areas, there are some very low ‘exchangeable calcium’ –‘exchangeable magnesium’ ratios that would contribute to dispersion problems.
Laboratory analysis results for soil erosion hazard are shown in Appendix 6 for two of the pits (Pit 17 and Pit 18).
Compaction Status
Compaction can strongly restrict plant growth because of poor water entry, poor efficiency of water storage, waterlogging when moist, and poor access to nutrients by plant roots (McKenzie 1998). The forested sites were relatively free of serious compaction problems, unlike the areas that had been farmed (Map 7).
Structure Self-repair Ability The ability of a soil to overcome compaction through shrinking and swelling induced by wet-dry cycles (soil structural resilience) can be estimated via CEC values (Map 8) (McKenzie 1998).
Much of the topsoil has a poor shrink-swell capacity, so the rate of recovery from compaction damage would be slow. However, the clay-rich subsoils in the Stratic Rudosols (south-east section of the survey area) have favourable self-repair capacity via shrink-swell processes.

_______________________________Agricultural Resource Assessment: “Tarrawonga Coal Project”
McKenzie Soil Management Pty. Ltd. ___________________________________________________ 26
Salt Concentrations and Watertable Status Most of the topsoil and subsoil in the area surveyed is non-saline (Map 9).
Groundwater in sand/gravel layers was observed between depths of 2.3 m and 3.0 m at Pits 31, 34, 35, 42 and 47.
pH Imbalance Topsoil acidity was widespread across the area surveyed (Map 10) and was associated with the presence of exchangeable aluminium (Appendix 5). However, the acidity only extended deeply into the subsoil under native vegetation in the hilly areas. The limitation was most extreme under the ‘ironbark-pine’ communities.
Nutrients Much of the soil was deficient (from an agricultural perspective) in phosphorus in the survey area (Map 11). Sulfur and nitrogen deficiencies (Appendix 5) were also widespread across the survey area. There was evidence of zinc deficiency below a depth of 15 cm for most sampling sites, and copper deficiency was evident in the non-alluvial soil.
As the sum of exchangeable cations (an approximation of CEC) increases, the ability of soil to hold cation nutrients such as calcium, magnesium and potassium becomes greater (White 2006). CEC values (Map 8) show CEC trends across the area surveyed. Nutrient holding capacity was much more favourable in the alluvial soil than soil on the slopes; the only exception was a ‘white box / pine’ site in the Leard State Forest (Pit 1) with higher CEC values than nearby ‘ironbark/pine’ sites.
Soil Carbon and Soil Biological Health At the time of sampling, organic matter content of the soil was poor, particularly below a depth of 15 cm (Map 12).
_______________________________Agricultural Resource Assessment: “Tarrawonga Coal Project”
McKenzie Soil Management Pty. Ltd. ___________________________________________________ 27
5 RURAL LAND CAPABILITY ASSESSMENT
5.1 Background The rural land capability classification in NSW was developed by the NSW SCS (Emery 1986). It was derived from the scheme of Klingebiel and Montgomery (1961).
Land is allocated to one of eight classes, with emphasis on the erosion hazards in the use of the land. The rural land capability classes are as follows (Emery 1986; Sonter and Lawrie 2007):
Land Suitable for Regular Cultivation / Cropping
Class I: No special soil conservation works or practices necessary.
Class II: Soil conservation practices such as strip cropping, conservation tillage and adequate crop rotations are necessary.
Class III: Soil conservation practices such as graded banks and waterways are necessary, together with all the soil conservation practices as in Class II.
Land Suitable Mainly for Grazing
Class IV: Soil conservation practices such as pasture improvement, stock control, application of fertiliser, minimal cultivation for the establishment or re-establishment of permanent pasture and maintenance of good ground cover.
Class V: Soil conservation works such as diversion banks and contour ripping, in addition to the practices in Class IV.
Land Suitable for Grazing
Class VI: Not capable of cultivation. Soil conservation practices include limitation of stock, broadcasting of seed and fertiliser, promotion of native pasture regeneration, prevention of fire, destruction of vermin, maintenance of good ground cover and possibly some structural works.
Land Suitable for Tree Cover
Class VII: Land best protected by trees.
Land Unsuitable for Agriculture
Class VIII: Cliffs, lakes or swamps where it is impractical to grow crops or graze pasture.
A New Approach: ‘Land and Soil Capability’ The existing rural land capability system (Emery 1986) has an emphasis on the construction of earthworks, which are no longer a frontline erosion control mechanism for cropping lands (B. Murphy, pers. comm.).

_______________________________Agricultural Resource Assessment: “Tarrawonga Coal Project”
McKenzie Soil Management Pty. Ltd. ___________________________________________________ 28
Staff from the NSW Office of Environment and Heritage are in the process of developing a ‘Land and Soil Capability’ (LSC) scheme that builds on the rural land capability system by including land degradation issues such as salinity, sodicity and acidity. As the LSC approach is still being developed and requires further testing, the existing Emery (1986) rural land capability system has been used in this assessment.
5.2 Existing Information The following existing information relevant to the Project site was available for this assessment:
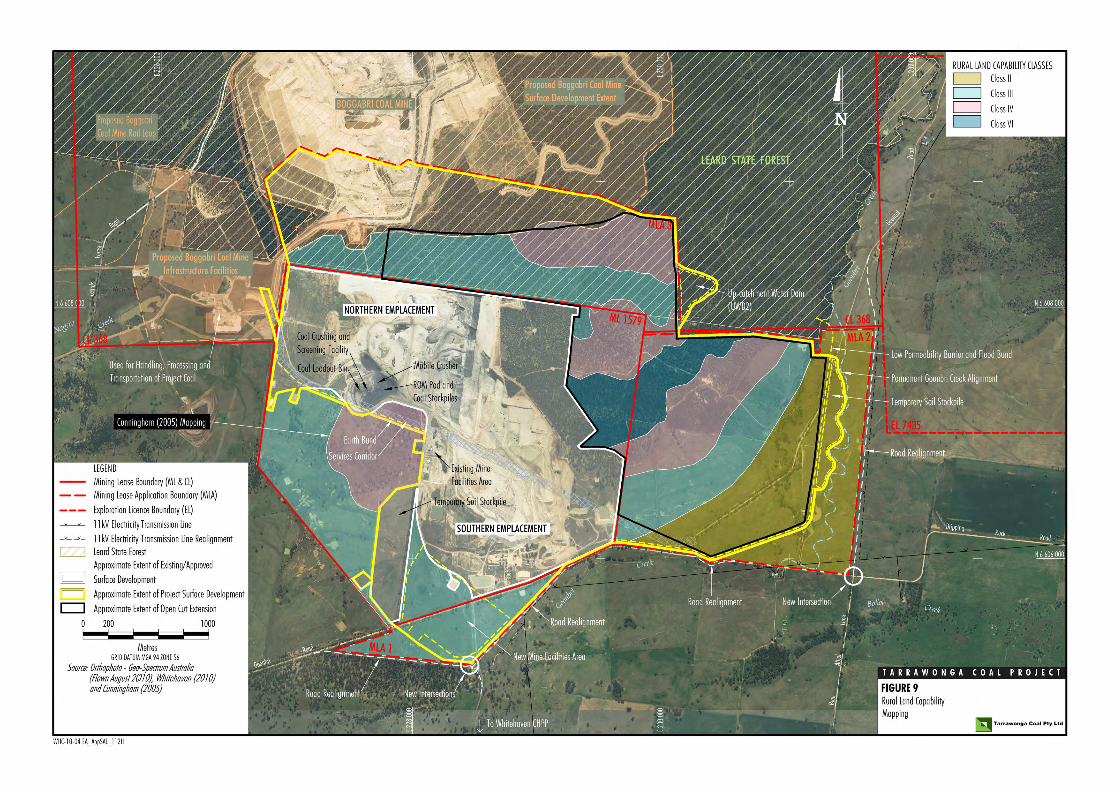
• Rural land capability mapping prepared by NSW government departments using data collected prior to the Banks and King (In Press) study.
• Rural land capability mapping in the south-western section of ML 1579 prepared by Cunningham (2005a) (Figure 9).
5.3 Rural Land Capability Classification Rural land capability mapping was prepared for the MLA 1, MLA 2, MLA 3 and the north-eastern section of ML 1579 based on the results of the soil survey (Section 4).
Land slope is a primary determinant of land capability because erosion hazard increases with slope steepness and because slope steepness imposes physical limits on many types of land usage (Sonter and Lawrie 2007). The slope categories in Table 1 of Murphy and Taylor (2008) assisted in determining the class allocation.
Estimates of rural land capability across the Project site are shown on Figure 9. Values ranged from Class II to Class VI. The major factor influencing the classification was land slope. The slope of the land ranged from approximately 0.5% in the Class II areas to about 20% on the steepest hillsides with a Class VI classification.
The presence – across the site – of soil with a strong potential to disperse, topsoil acidity and major nutrient deficiencies prevented the allotment of rural land capability categories that were more favourable. All of these factors reduce a landholder’s ability to create and maintain organic material to protect soil surfaces from water and wind erosion.
_______________________________Agricultural Resource Assessment: “Tarrawonga Coal Project”
McKenzie Soil Management Pty. Ltd. ___________________________________________________ 30
6 AGRICULTURAL SUITABILITY
6.1 Background This five class system used by NSW Agriculture classifies land in terms of its suitability for general agricultural use (Hulme et al. 2002). It was developed specifically to meet the objectives of the NSW Environmental Planning and Assessment Act, 1979.
Agricultural land is classified by evaluating biophysical, social and economic factors that may constrain the use of land for agriculture. In general terms, the fewer the constraints on the land, the greater its value for agriculture (Hulme et al. 2002). Higher quality lands (Classes 1 and 2) have fewer constraints and a greater versatility for agriculture than poorer quality lands.
The essential characteristics of the five classes are as follows (Hulme et al. 2002):
Class 1: Arable land suitable for intensive cultivation where constraints to sustained high levels of agricultural production are minor or absent.
Class 2: Arable land suitable for regular cultivation for crops, but not suited to continuous cultivation. It has a moderate to high suitability for agriculture but soil factors or environmental constraints reduce the overall level of production and may limit the cropping phase to a rotation with sown pastures.
Class 3: Grazing land or land well suited to pasture improvement. It may be cultivated or cropped in rotation with sown pasture. The overall production level is moderate because of soil or environmental constraints. Erosion hazard, soil structural breakdown or other factors, including climate, may limit the capacity for cultivation and soil conservation or drainage works may be required.
Class 4: Land suitable for grazing but not for cultivation. Agriculture is based on native pastures and improved pastures established using minimum tillage techniques. Production may be seasonally high but the overall production level is low as a result of major environmental constraints.
Class 5: Land unsuitable for agriculture, or at best suited only to light grazing. Agricultural production is very low or zero as a result of severe constraints, including economic factors which prevent land improvement.
Hulme et al. (2002) recognised that agriculture suitability classification maps have a limited life because of changes in social and economic factors. They also note that agricultural land classification maps produced at small scales (1:50,000 to 1:100,000) are inappropriate for making decisions about individual development applications because of a lack of detail.

_______________________________Agricultural Resource Assessment: “Tarrawonga Coal Project”
McKenzie Soil Management Pty. Ltd. ___________________________________________________ 31
6.2 Existing Information The following existing information relevant to the Project site was available for this assessment:
• Agriculture suitability mapping prepared by NSW government departments using data collected prior to the Banks and King (In Press) study.
• Agriculture suitability mapping in the south-western section of ML 1579 prepared by Cunningham (2005a) (Figure 10).
6.3 Agricultural Suitability Classification Agricultural suitability mapping was prepared for the MLA 1, MLA 2, the south-eastern corner of MLA 3 and the north-eastern section of ML 1579 based on the results of the soil survey (Section 4).
To help assess the agricultural suitability of the Project site, 10 soil related factors at 6 locations across the Project site were assessed; they are shown in Appendix 7.
In addition to the soil related factors reviewed in Appendix 7, land slope had a major bearing on the agricultural suitability of the Project site. Terracing is used to overcome slope and soil shallowness limitations in other parts of the world, but usually is not economically viable under Australian conditions. In contrast, topsoil limitations such as dispersion, compaction, acidity and nutrient deficiency can be overcome in a cost-effective manner through improved soil management.
Estimates of agricultural land suitability across the study site are shown on Figure 10. It is noted that the Leard State Forest is an exclusion zone (i.e. should not be mapped) as per the guidelines of Hulme et al. (2002):
i. Lands that need not be evaluated Before mapping begins, all lands that can be clearly excluded from agriculture are identified and marked on the map to reduce the area to be assessed. Such lands include: …
- state forests and timber reserves, although sometimes these areas may be suitable and available for grazing
…
The agricultural suitability mapping described here therefore did not extend north of the southern and eastern boundaries of the Leard State Forest (Figure 10).
Agricultural suitability classes identified across the site ranged from Class 3 to Class 5. The alluvial soil in the southeast of the study area has serious limitations for plant growth in the topsoil, although there are some excellent characteristics for root growth in the deep subsoil where gravel beds are not present.

_______________________________Agricultural Resource Assessment: “Tarrawonga Coal Project”
McKenzie Soil Management Pty. Ltd. ___________________________________________________ 33
Soil compaction is considered to be serious enough in the alluvial topsoil to create a Class 4 characterisation. The introduction of ‘best practice’ soil management techniques such as soil decompaction with agrowplowing and lime application almost certainly would improve its agricultural suitability class. However, the current degraded state of the land suggests that its full potential is unlikely to be achieved by existing land management practices implemented in the vicinity of the Project. Therefore, Class 3 is the most realistic agricultural suitability category for the alluvial soil in the Project area.
In the areas mapped as Classes 4 and 5, soil limitations include various combinations of the following factors: erosion hazard associated with steep slopes, shallowness, dispersion, acidity, nutrient deficiencies and compaction.

_______________________________Agricultural Resource Assessment: “Tarrawonga Coal Project”
McKenzie Soil Management Pty. Ltd. ___________________________________________________ 34
7 REHABILITATION AND SOIL MANAGEMENT
7.1 Proposed Rehabilitation Strategy The Project straddles the boundary of the Leard State Forest to the north and undulating predominantly cleared agricultural land used for livestock and occasional cropping to the south and east. The Project would be progressively rehabilitated in a manner that provides a sustainable balance between these existing land uses. The Project final landform and land uses at the end of the Project life are presented on Figure 11.
Woodland/forest regeneration areas would be incorporated into the rehabilitation program (Figure 11) and would be designed to link with remnant native vegetation and contribute to local and regional habitat corridors. Agricultural land would also be incorporated into the rehabilitation program and would consist of areas that are suitable for cropping/grazing (Figure 11).
The details of the proposed rehabilitation strategy for the Project are presented in Section 5 of the Main Text of the EA.
7.2 Soil Resource Estimate The available soil resource for rehabilitation at the Project has been estimated. The stripping depth has been selected such that only soils suitable for use as plant growth media for at least one of the following post-mine land uses at the Project would be stripped:
• Agriculture – cropping/grazing (improved pasture).
• Woodland/forest.
The suitability of the soils for each of these post-mine land uses has been determined based on a comparison of the results of the soil survey observations and laboratory analytical results against the criteria outlined in Table 7. It has also been assumed that appropriate management practices (Section 7.4) are implemented during soil handling and relevant amelioration measures (Section 7.3) are applied where necessary5.
5 Soil materials for mine site rehabilitation can be ameliorated for physical and chemical attributes that might otherwise preclude their general use (Elliot and Reynolds 2007)


_______________________________Agricultural Resource Assessment: “Tarrawonga Coal Project”
McKenzie Soil Management Pty. Ltd. ___________________________________________________ 36
Table 7. Soil suitability criteria
Parameter Cropping/Grazing targets
Compaction severity (SOILpak score) Topsoil: >1.5
Subsoil >1.0
Exchangeable Sodium Percentage Topsoil: <2
Subsoil <6
Acidity (pH CaCl2) >5.5, <8.0
Salinity (ECe, dS/m) <1.5
Cation Exchange Capacity (meq/100 g) >15
Phosphorus (Colwell; mg/kg >30
Depth 150 cm root zone
The suggested depth for soil stripping for the additional disturbance area at the Project is presented on Figure 12.
On the cleared creek flats (relatively recent alluvium; Stratic Rudosols), there is potential to collect soil – from an average depth of 3 m (Figure 12) – with the high quality soil to be used as topdressing material for agricultural post-mining land use, following treatment with coarse-grade gypsum (Section 7.3).
Sub-sections of the vegetated areas in the north of the Project site (white box trees rather than ironbark) have soil conditions that allow a cut of 25 cm (Figure 12). Because of major subsoil constraints, a cutting depth of 10 cm is recommended in the remaining Project disturbance areas (Figure 12). These soils could be used for woodland/forest rehabilitation.
Some of the pits surveyed showed that coarse gravel and sand exists near the surface (Map 4); it is much less suitable as a rehabilitation material than the nearby clay-rich soil. These pits, however, are located outside of the Project disturbance area.
It should be noted that confidence in the recommended stripping depths in the south-western and western areas of the Project site is lower than the other areas as there are fewer pits in these areas. However, soil would only be stripped in the new mine facilities area where cut and fill earthworks are required (i.e. the majority of the area would not be stripped).
In addition to high quality soil resource described above, large volumes of other soils could also be used in rehabilitation. This soil could also be used without amelioration to provide conditions suitable for the native woodland/forest. This additional soil could be obtained from the Class 3 Agricultural Suitability areas (Figure 10) that are not Stratic Rudosols to a depth of approximately 1 m.


_______________________________Agricultural Resource Assessment: “Tarrawonga Coal Project”
McKenzie Soil Management Pty. Ltd. ___________________________________________________ 38
The approximate volume of soil that would be available for rehabilitation purposes based on the mapping included on Figure 12 is provided in Table 8.
Table 8. Soil resource availability
Recommended Stripping Depth (cm) (refer Figure 12)
Approximate Stripping Area (ha)
Approximate Volume (m3)
0 – 10 405 405,000
0 – 25 30 75,000
0 – 300 80 2,400,000
Currently Stockpiled - 1,293,400
Total 515 4,173,400
Preliminary material balance calculations based on the recommended soil stripping depths outlined in Table 8 indicate an approximate topsoil/subsoil volume of 2,880,000 m3 would be available from the Project disturbance area for use during future rehabilitation6. In addition, 1,293,400 m3 of soil is currently stockpiled at the Tarrawonga Coal Mine (TCPL 2011). The total available soil resource is approximately 4,173,400 m3.
The available soil resource outlined in Table 8, is sufficient to allow for soil re-application to a depth of 1.5 m on 160 ha of rehabilitated agricultural areas (Section 8.2) and for up to approximately 20 cm to be used on other Project mine landforms.
7.3 Soil Constraints and Ameliorants In the areas cleared for agriculture, a broad range of soil physical and chemical constraints have been identified (Section 4.4).
Much of the cleared land had evidence of structural degradation in the topsoil. Compaction is the main issue. Causes are likely to be excessive cultivation, uncontrolled farm trafficking and trampling by livestock.
Topsoil and sub-surface acidity was observed across the survey area. This appears to be an inherent problem, but it would have likely been aggravated by decades of export of agricultural produce without a counter-balance via lime application.
A decline in organic matter content because of soil disturbance, and cultivation at moisture contents that were either too wet or too dry, appears to have made the soil more prone to instability in water. In the alluvial areas, however, many of the subsoils were excellent for root growth to a depth of 3 m.
6 The soil stripping volumes in Table 8 do not include the area associated with the new mine facilities area.

_______________________________Agricultural Resource Assessment: “Tarrawonga Coal Project”
McKenzie Soil Management Pty. Ltd. ___________________________________________________ 39
Notwithstanding the above, cost-effective methods are available to improve the soil for optimal production. Extension products such as the NSW Department of Primary Industries SOILpak manuals (eg. McKenzie 1998) are available to systematically assist farmers and graziers with the identification and treatment of problems such as soil structural decline and acidification.
A summary of the soil constraints and measures which could be implemented to ameliorate the constraints is provided in Table 9. The estimated application rates and associated costs are also provided in Table 9.
Table 9. Summary of soil constraints and ameliorants
Soil Constraint
Ameliorants Application Details
Estimated Cost
Dispersion Application of coarse-grade (20 mm-50 mm) recycled gypsum on the Sodosols.
Gypsum has a two-fold effect – it reduces sodicity through the displacement of exchangeable sodium and magnesium by calcium, and provides a mildly saline soil solution that creates a beneficial electrolyte effect.
Rate = 2.5 t/ha; So and McKenzie (1984)1
$225 per ha Cost includes purchase price (delivered to Gunnedah) and spreading; McKenzie et al. (1995) data2
Compaction Mechanical loosening with an implement such as an agrowplow across all of the farming and grazing land.
Procedures to minimise the risk of re-compaction, eg. GPS guidance of farm machinery, and avoidance – where possible – of grazing under moist conditions, would have to be implemented.
Shatter compacted layers to a depth of approx. 25 cm with a once-only agrowplowing (carried out, if possible, with soil water content at or just below the ‘plastic limit’)
$55 per ha This estimate is only approximate; the cost of mechanical loosening is strongly influenced by soil water content, stubble cover and machinery availability
Acidity Application of finely-ground Attunga limestone (‘lime’); incorporated via agrowplowing. Most of the cleared areas would benefit from 1 t/ha lime; areas represented by Pits 29, 41, 45 and 55 require double this rate.
Rate = 1 t/ha; Fenton (2003) calculations
$82-164 per ha Cost includes purchase price (delivered to Gunnedah), and spreading; McKenzie et al. (1995) data2

_______________________________Agricultural Resource Assessment: “Tarrawonga Coal Project”
McKenzie Soil Management Pty. Ltd. ___________________________________________________ 40
Table 9. Summary of soil constraints and ameliorants (cont)
Soil Constraint
Ameliorants Application Details
Estimated Cost
Organic Carbon
Application of organic amendments is effective, but unlikely to be economically viable under dryland cropping/farming in the Boggabri area. Instead, maximise soil organic matter via conservation of organic residues produced by cash crops and pasture
n/a n/a
Water Holding Capacity
There are no cost effective management measures to ameliorate the presence of bedrock and/or coarse gravel close to the surface.
n/a n/a
1 Follow-up applications may be needed if very wet weather rapidly leaches the dissolved gypsum
2 Estimated supply and delivery costs verified with Landmark, Gunnedah in August 2011.
7.4 Soil Resource Management Measures General soil resource management practices, where surface development is proposed within the Project area, should involve the stripping and stockpiling of soil resources prior to any mine-related disturbance, other than clearing vegetation. The general strategy should be for those disturbance areas to be rehabilitated progressively, or at the completion of mining activities.
The objectives of soil resource management for the Project are to:
• Identify and quantify potential soil resources for rehabilitation.
• Optimise the recovery of useable topsoil and subsoil during stripping operations.
• Manage topsoil and subsoil reserves so as not to degrade the resource when stockpiled.
• Establish effective soil amelioration procedures to maximise the availability of soil reserves for future rehabilitation works.
• Take into account both the natural soil requirements of the local native vegetation, and the need to provide soil conditions that minimise the risk of soil loss via wind and water erosion during and after rehabilitation.

_______________________________Agricultural Resource Assessment: “Tarrawonga Coal Project”
McKenzie Soil Management Pty. Ltd. ___________________________________________________ 41
Stripping The following management measures should be implemented during the stripping of soils at the Project (TCPL 2010):
• Areas of disturbance are to be stripped progressively, as required, to reduce potential erosion and sediment generation, and to minimise the extent of topsoil stockpiles and the period of soil storage.
• Areas of disturbance requiring soil stripping are to be clearly defined following vegetation clearing.
• Topsoil and subsoil stripping during periods of high soil moisture content (i.e. following heavy rain) is to be avoided to reduce the likelihood of damage to soil structure.
The degree of success of a stripping and stockpiling program is strongly influenced by soil water content. Attempts to strip soil under moist conditions with inappropriate machinery settings can aggravate structural degradation problems. Excessive compaction and/or remoulding of the soil by heavy machinery under wet conditions also can be a major problem.
Where soil dispersion problems are aggravated by stripping during periods of high moisture content, gypsum should be applied to encourage re-stabilisation of the stripped soil.
Stockpile Management The following management measures should be implemented during the stockpiling/storage of soils at the Project:
• Topsoil and subsoil stockpiles should be retained at a height of 3 m, with slopes no greater than 1:2 (vertical to horizontal [V:H]) and a slightly roughened surface to minimise erosion.
• Construct topsoil stockpiles in a way that minimises erosion, encourages drainage, and promotes revegetation.
• Where amendments such as lime, gypsum and fertiliser are needed to improve the condition of cut soil, they should be applied to the stockpiles in-between the application of separate layers from the scrapers.
• Wherever practicable, soil should not be trafficked, deep ripped or removed in wet conditions to avoid breakdown in soil structure.
• All topsoil and subsoil stockpiles should be seeded with a non-persistent cover crop to reduce erosion potential as soon as practicable after completion of stockpiling. Where seasonal conditions preclude adequate development of a cover crop, stockpiles should be treated with a straw/vegetative mulch to improve stability.

_______________________________Agricultural Resource Assessment: “Tarrawonga Coal Project”
McKenzie Soil Management Pty. Ltd. ___________________________________________________ 42
• Grow deep-rooting vegetation to encourage organic matter accumulation and maintain microbial activity. Stockpile height can be excessive because of limited space at mine sites, but try to keep it as low as possible. This maximises the chances of plenty of plant roots reaching the base of the stockpile as it awaits redistribution.
• There should be no vehicle access on soil stockpiles.
• Soil stockpiles should be located in positions to avoid surface water flows. Silt stop fencing would be placed immediately down-slope of stockpiles until stable vegetation cover is established.
• In the event that unacceptable weed generation is observed on soil stockpiles, a weed eradication program should be implemented.
• An inventory of soil resources (available and stripped) on the Project site should be maintained and regularly reconciled with rehabilitation requirements.
• In preference to stockpiling, wherever practicable, stripped topsoil and subsoil should be directly replaced on completed sections of the final landform.
Application of Soil on Rehabilitated Landforms The following management measures should be implemented during the application of soils on rehabilitated landforms at the Project:
• Topsoil and subsoil placement shall only proceed once the final landform and major drainage works (i.e. graded banks, drainage channels and rock waterways if required) have been completed.
• Topsoil and subsoil placement is to be undertaken from the top of slopes or top of sub drainage catchment to minimise erosion damage created by storm run-off from bare upslope areas.
• Topsoil and subsoil placement is to be conducted along the general run of the contour to minimise the incidence of erosion.
• Topsoil and subsoil is not to be placed in the invert of drainage lines or drainage works.
• Spread topsoil/subsoil profile thickness and quality is to be evaluated prior to sowing.
Rehabilitation Management Plan It is recommended that a Rehabilitation Management Plan for the Project be prepared by a suitability qualified expert to detail the soil resource management measures outlined in the sections above. The Rehabilitation Management Plan should be progressively updated to cater for the site-specific management requirements of soils as the Project progresses from west to east.

_______________________________Agricultural Resource Assessment: “Tarrawonga Coal Project”
McKenzie Soil Management Pty. Ltd. ___________________________________________________ 43
7.5 Rehabilitation – Agricultural Land Uses Chemical and physical assessment of the soil properties of the area surveyed indicate that the soil resources quantified in Table 8 would be suitable for rehabilitation purposes provided appropriate management practices (Section 7.4) are implemented during handling and relevant amelioration measures (Section 7.3) are applied where necessary. This section focuses on the rehabilitation of lands proposed for agricultural land uses post-mining.
The Stratic Rudosols located along the south-eastern section of the Project surface disturbance area have the potential to be stripped to a depth of at least 3 m (Figure 12) for use in rehabilitation (Section 7.2). It is considered that this soil could be used as a rehabilitation medium for agricultural uses (including cropping/grazing areas) post-mining, following treatment with coarse-grade gypsum (Section 7.3). This soil is considered suitable for this post-mining land use for the following reasons:
• pH values are favourable; • ESP values are low enough to be treated easily with coarse-grade gypsum; • Most of the soil is non-saline; and • CEC is high enough to allow natural decompaction through shrink-swell processes.
These chemical properties of the Stratic Rudosols would not be modified greatly during the stripping, stockpiling and spreading of the soils.
It is recommended that the Stratic Rudosols associated with the cleared creek flats be used to rehabilitate areas where a cropping/grazing post-mine land use is proposed. These areas should be prepared with a total soil profile depth of 150 cm. The waste rock that would underlie this layer is expected to have high porosity/permeability and is therefore expected to allow for beneficial deep drainage and deep root growth beyond a depth of 1.5 m. These areas should also be sloped to allow suitable drainage so that waterlogging can be avoided.
Soil profile reconstruction following major earthworks has been conducted in the Boggabri district previously. Cutting and filling operations (including soil profile reconstruction) associated with the landforming of nearby alluvial soil for irrigated cotton production has been very successful, despite some early challenges with soil structural degradation (McKenzie 1998). Soil structural problems induced by landforming for irrigated cotton have been addressed via a range of site-specific approaches that include deep ripping, gypsum spreading, nutrient application, and in-situ production of organic mulches.

_______________________________Agricultural Resource Assessment: “Tarrawonga Coal Project”
McKenzie Soil Management Pty. Ltd. ___________________________________________________ 44
The soil profile described above would provide rootzone chemical and physical conditions that are at least as favourable for cereal and pasture production as the existing agricultural areas. Based on the soil quantities detailed in Table 8 and a soil profile of 1.5 m, up to approximately 160 ha of agricultural land capable of cropping could be re-established post-mining.
_______________________________Agricultural Resource Assessment: “Tarrawonga Coal Project”
McKenzie Soil Management Pty. Ltd. ___________________________________________________ 45
8. PROJECT SITE AGRICULTURAL ACTIVITIES
8.1. Existing
Agricultural Enterprises and Productivity Agricultural enterprises known to have been conducted on the Project site include areas where a combination of pasture production for grazing and some rainfed crop production are undertaken and areas where pasture production for grazing only is undertaken. Figure 3 shows the areas of the Project site that are known to have been used for agricultural enterprises (i.e. pasture production for grazing or rainfed crop production). Approximately 335 ha of agricultural land on the Project site would be disturbed (Table 10). About 210 ha of this has been/could be potentially used for rotational rainfed crop production (based on the area of Agricultural Suitability Class 3 lands – Figure 10) (Table 10). There has been rotation of crops (usually wheat) with lucerne-based pasture, all of which is non-irrigated. The main areas where rainfed crop production has occurred/could occur are located on the flatter areas of the Project site near Goonbri Creek. Remaining agricultural land that would be disturbed (125 ha) by the Project has typically been used for grazing (based on the area of Agricultural Suitability Class 4 lands – Figure 10). The Agricultural Suitability Class 5 lands (Figure 10) are not considered suitable for agriculture – mainly because of site steepness and shallowness of the soil profiles – and are therefore not included in Table 10. Table 10 provides an overview of the main agricultural enterprises conducted on the Project site that would be disturbed. Table 10. Summary of agricultural enterprises conducted on the Project site
Enterprise Approximate Area to be Disturbed (ha)
Rainfed crop production in rotation with improved pasture; Wheat Lucerne pasture; grazed by beef cattle
210
Grazing on pasture dominated by native species Beef cattle
125
Total 335
Agricultural Infrastructure Agricultural infrastructure located on the Project site includes:
• Fences. • Small farm dams.

_______________________________Agricultural Resource Assessment: “Tarrawonga Coal Project”
McKenzie Soil Management Pty. Ltd. ___________________________________________________ 46
Agricultural Productivity A range of agricultural enterprises have been conducted at the Project site (Table 10). The productivities of the different agricultural enterprises in average rainfall years have been estimated for each of the agricultural areas on the Project site (Table 11). The productivities and rotation sequences have been estimated based on local farmer descriptions (collated by Whitehaven), Department of Primary Industries Farm Budget website7, and the ‘Soils, land use systems and land management practices’ Tables for the ‘Brigalow Belt South Bioregion’ (McKenzie and Mactaggart 2002). Table 11. Approximate productivity of the agricultural enterprises on the Project site
Enterprise Yield (t/ha)
Gross Margin ($/ha/year)
Rainfed crop production in rotation with improved pasture;
Wheat 1.7 grain 285 (70% of time)
Lucerne 4.0 DM 203 (30% of time)
Grazing (native pasture)
Beef cattle 2.0 DM 95 Note: DM = Dry Matter.
The following assumptions were used to estimate the information in Table 11:
• Dryland wheat produced with a ‘No Till, Short Fallow’ production system (Class 3 agricultural land).
• Improved (Lucerne) pasture used to grow out Steers 240-460 kg in 12 months (Class 3 agricultural land).
• Native pasture (Non-Lucerne) used to produce Inland Weaners (Class 4 agricultural land).
• It is important to note that crop and pasture productivity in the Boggabri district is influenced very strongly by year-to-year variations in rainfall, but the approximate yields and gross margins that have been presented are based on a year with an average rainfall.
• In some years, it is anticipated that stormwater from the up-slope Class 4 land will run onto the down-slope Class 3 areas and boost productivity through enhanced soil moisture availability.
7 http://www.dpi.nsw.gov.au/__data/assets/pdf_file/0004/176071/West-All-2011.pdf; http://www.dpi.nsw.gov.au/__data/assets/pdf_file/0008/175526/Grow-out-steers-240-420kg.pdf http://www.dpi.nsw.gov.au/__data/assets/pdf_file/0007/175534/Inland-weaners-stores.pdf http://www.dpi.nsw.gov.au/__data/assets/pdf_file/0006/175533/Summary.pdf

_______________________________Agricultural Resource Assessment: “Tarrawonga Coal Project”
McKenzie Soil Management Pty. Ltd. ___________________________________________________ 47
8.2. Post-Mining
Agricultural Enterprises As described in Section 7.1, areas of the rehabilitated Project site would be established for agricultural purposes (Figure 11). Approximately 210 ha of agricultural land would be established on Project disturbance areas post-mining. This area would consist of 160 ha of re-established agricultural land (Section 7.5) and approximately 50 ha of Class 3 agricultural land (i.e. the mine facilities area and the temporary soil stockpile) that would be returned to agricultural use post mining. A breakdown of this agricultural land is provided in Table 12. Table 12. Summary of agricultural enterprises conducted on the Project site post-mining
Enterprise Area (ha)
Rainfed crop production in rotation with improved pasture; Wheat Lucerne pasture
210
Grazing Cattle
0
Total 210
Agricultural Productivity The productivity of the agricultural enterprises that would be re-established post-mining are expected to be similar to the existing productivities (Section 7.5) provided in Table 11.
_______________________________Agricultural Resource Assessment: “Tarrawonga Coal Project”
McKenzie Soil Management Pty. Ltd. ___________________________________________________ 48
9 REFERENCES Banks RG, King D (In Press) Soil Landscapes of the Boggabri 1:100 000 Sheet (Boggabri, Gunnedah, Maules Creek, Carroll) (DIPNR, Gunnedah; unpublished draft).
Batey T (1988) Soil Husbandry. (Soil and Land Use Consultants: Aberdeen).
Caldwell MM, Dawson TE, Richards JH (1998) Hydraulic lift: consequences of water efflux from the roots of plants. Oecologia 113, 151-161.
Cunningham G (2005a) Proposed East Boggabri Coal Mine: Soils and Land Capability Study of Proposed Mine Site (Geoff Cunningham Natural Resource Consultants Pty Ltd, Killara).
Cunningham G (2005b) Proposed East Boggabri Coal Mine: Soils and Land Capability Study of the Proposed Transport Route (Geoff Cunningham Natural Resource Consultants Pty Ltd, Killara).
Elliot GL, Reynolds KC (2007) Soil rehabilitation for extractive industries. in Charman PEV, Murphy BW (eds.) Soils: Their Properties and Management, 3rd Edition, pp. 406-412 (Oxford University Press).
Emery KA (1986) Rural Land Capability Mapping (Soil Conservation Service of New South Wales: Sydney)
Fenton G (2003) Planning on liming (NSW Agriculture: Orange).
Field DJ, McKenzie DC, Koppi AJ (1997) Development of an improved Vertisol stability test for SOILpak. Australian Journal of Soil Research 35, 843–852.
FloraSearch (2011) Tarrawonga Coal Project Terrestrial Flora Assessment.
Gilbert & Associates (2011) Surface Water Assessment.
GSS Environmental (2010) Continuation of Boggabri Coal Mine Project Environmental Assessment: Soil Survey and Land Resource Assessment (GSS Environmental: Hamilton NSW).
Hazelton P, Murphy B (2007) Interpreting Soil Test Results: What do all the numbers mean? (CSIRO Publishing: Collingwood).
Heritage Computing (2011) Groundwater Assessment.
Hulme T, Grosskopf T, Hindle J (2002) Agricultural Land Classification; Agfact AC. 25 (NSW Agriculture: Orange).
Isbell, R (2002) The Australian Soil Classification, Revised Edition (CSIRO: Melbourne).
Klingbiel AA, Montgomery PH (1961) Land Capability Classification; US Department of Agriculture Handbook 210 (Government Printer: Washington DC).
Levy GJ (2000) Sodicity. In: Sumner ME (ed.) Handbook of Soil Science; pp. G27-G63. (CRC Press: Boca Raton).
McDonald RC, Isbell RF, Speight JG, Walker J, Hopkins MS (1990). Australian Soil and Land Survey Field Handbook, Second Edition (Inkata Press: Melbourne).
McKenzie DC (ed.) (1998) SOILpak for Cotton Growers, Third Edition. (NSW Agriculture: Orange).
McKenzie DC (2001). Rapid assessment of soil compaction damage. I. The SOILpak score, a semi-quantitative measure of soil structural form. Australian Journal of Soil Research 39, 117–125.
McKenzie DC, Abbott TS, Chan KY, Slavich PG, Hall, DJM (1995) The nature, distribution and management of sodic soils in New South Wales. In: Australian Sodic Soils; Distribution, Properties and Management (eds. R Naidu, ME Sumner, P Rengasamy), pp. 247-264. (CSIRO: Australia).

_______________________________Agricultural Resource Assessment: “Tarrawonga Coal Project”
McKenzie Soil Management Pty. Ltd. ___________________________________________________ 49
McKenzie D, McGarry D (2000) Soil management training courses: recent progress and possible future directions. In: Proceedings of the 10th Australian Cotton Conference, Brisbane, Qld., August 2000, pp. 309–314.
McKenzie D, Mactaggart B (2002) New South Wales report. In: Agricultural Land Use and Management Information (eds. R Swift, J Skjemstad), pp. 29–124. National Carbon Accounting System Technical Report No. 13. (Australian Greenhouse Office: Canberra).
McKenzie DC, Rasic J, Hulme PJ (2008) Intensive survey for agricultural management. In: Guidelines for surveying soil and land resources: Second edition (eds. NJ McKenzie, MJ Grundy, R Webster, AJ Ringrose-Voase); Chapter 29, pp. 469-490. (CSIRO Publishing: Collingwood).
McKenzie N, Jacquier D, Isbell R, Brown K (2004) Australian Soils and Landscapes: An Illustrated Compendium (CSIRO Publishing: Collingwood).
Murphy B, Taylor S (2008) Land and Soil Capability – How We Safely Manage the Land. (Central West Catchment Authority: Wellington NSW).
Rayment GE, Lyons DJ (2011) Soil Chemical Methods – Australasia (CSIRO Publishing: Collingwood).
Resource Strategies (2011) Agricultural Resources and Productivity Assessment.
Slavich PG, Petterson GH (1993) Estimating the electrical conductivity of saturated paste extracts from 1:5 soil:water suspensions and texture. Australian Journal of Soil Research 31, 73-81.
So HB, McKenzie DC (1984) Use of gypsum in the management of the grey and brown clays of the lower Gwydir Valley, NSW. In: The Properties and Utilisation of Cracking Clay Soils (eds. JW McGarity, EH Hoult, HB So), pp. 329-334. (University of New England: Armidale).
So HB, Aylmore LAG (1995) The effects of sodicity on soil physical behaviour. In Naidu R, Sumner ME, Rengasamy P (eds.) Australian Sodic Soils; Distribution, Properties and Management, pp. 71-79. (CSIRO Publications: East Melbourne).
Schlumberger Water Services (2011) Namoi Catchment Water Study Independent Expert Phase 2 Report.
Sonter RO, Lawrie JW (2007) Soils and Rural Land Capability. In Charman PEV, Murphy BW (eds.) Soils: Their Properties and Management, 3rd Edition, pp. 287-296 (Oxford University Press).
Stace HCT, Hubble GD, Brewer R, Northcote KH, Sleeman JR, Mulcahy MJ, Hallsworth EG (1968) A Handbook of Australian Soils (Rellim: Glenside SA).
Tarrawonga Coal Pty Ltd (2011) Annual Environmental Management Report Tarrawonga Coal Mine 1 May 2010 – 30 April 2011.
Ward S (1998) Mine Rehabilitation Handbook, Second Edition (Mineral Council of Australia).
White RE (2006) Principles and Practice of Soil Science, Fourth Edition (Blackwell Publishing: Oxford).
Wiram VP (1982) Soil-Overburden Characteristics of Boggabri Coal Prospect Area, Boggabri, NSW Australia. Appendix 4. Environmental Impact Statement, AMAX/BHP Joint Venture