Reactive Attachment Disorder (RAD) aka Attachment Disorder (AD) Its Time To Understand...

Attachment 1 to Item 229
Presentation from Infrastructure NSW/Water NSW - Warragamba Dam Environmental Impact Statement
Date of meeting: 23 November 2021 Location: By audio-visual link Time: 6:30 p.m.


Proposed Warragamba Dam
Raising for Flood Mitigation
Environmental Impact Statement
Briefing to Hawkesbury City Council
21 October 2021

Acknowledgement
of Country

Maree Abood Head, Hawkesbury-Nepean Flood Risk Management Directorate
Alison WhiteSenior Community Engagement SpecialistHawkesbury-Nepean Flood Risk Management Directorate
David Harper, Project Director
Emma HatelyProject Manager, Planning and Environmental Approvals
Bob Tilbury, EIS Director
Chris Masters, EIS Lead Author
Project Proponent EIS Preparation
The Flood Strategy
Representatives here tonight

Warragamba Dam Raising Briefing 20214
www.waternsw.com.au/wdr
Online consultation

Planning & assessment process and submissions
Warragamba Dam Raising Briefing 20215

The Flood Strategy
Warragamba Dam Raising Briefing 20216 Alison White
INSW –
The Flood Strategy

▪ High flood risk:
• highest flood risk in NSW, if not Australia
• flood risk is not mitigated
▪ Unique geography:
• the ‘bathtub effect’
• 5 major tributaries contribute floodwaters
• downstream gorges hold back floodwater
▪ Floods can be very deep and rapid:
• deeper than most Australian floodplains
▪ Large existing population at risk
The ‘bathtub effect’
The ‘bathtub effect’
Hawkesbury Nepean Valley
7 Warragamba Dam Raising Briefing 2021
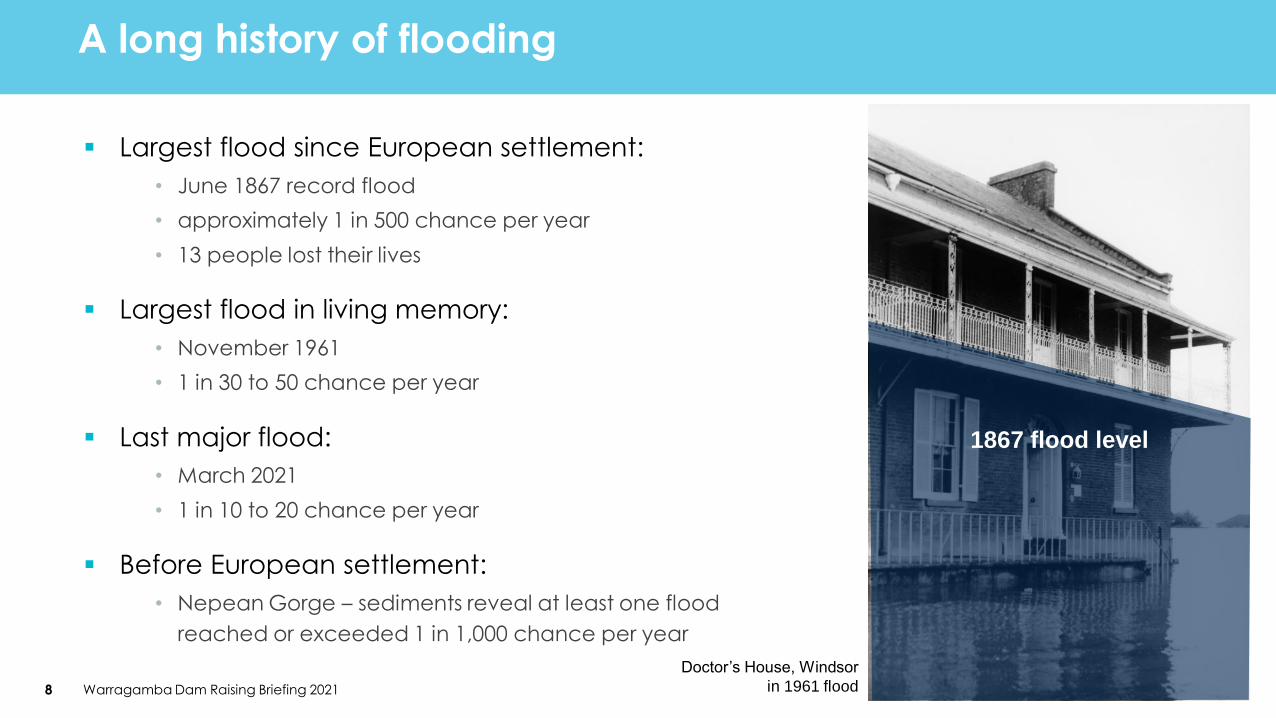
▪ Largest flood since European settlement:
• June 1867 record flood
• approximately 1 in 500 chance per year
• 13 people lost their lives
▪ Largest flood in living memory:
• November 1961
• 1 in 30 to 50 chance per year
▪ Last major flood:
• March 2021
• 1 in 10 to 20 chance per year
▪ Before European settlement:
• Nepean Gorge – sediments reveal at least one flood
reached or exceeded 1 in 1,000 chance per year
A long history of flooding
8 Warragamba Dam Raising Briefing 2021
1867 flood level
Doctor’s House, Windsor
in 1961 flood

Flood and drought dominated cycles
9

Flood and drought dominated cycles
10
1978 flood Windsor area
1990 flood at Pitt Town

Deeper floods in the Hawkesbury-Nepean
11 Warragamba Dam Raising Briefing 2021

▪ A dynamic community:
• ~140,000 people live or work on the floodplain
• 30% not living in valley five years earlier
• many thousands moved in since last flood cycle
• more than one generation grown up
▪ Diverse and changing
• most have limited experience of major floods
• large and growing CALD populations
• vulnerable groups & individuals at high flood risk
▪ Insurance affordabilitySource INSW
Photos: Adam Hollingworth
The floodplain communities
12 Warragamba Dam Raising Briefing 2021

7,600+
homes
impacted
~$3 billion damages
~ 55,000 people
need to
evacuate
▪ 1 in 100 chance per year flood
▪ 1 in 500 chance per year flood (similar to1867 flood of record):
~$8+ billion
damages
15,500+
homes
impacted
~ 90,000
people need
to evacuate
▪ Lifetime social costs to people impacted by major floods are likely to equal
damages to homes and infrastructure
140,000 people currently live or work on the floodplain
13 Warragamba Dam Raising Briefing 2021

River dredging
Currency Creek Diversion Channel
Local levees
Buy back of properties
Warragamba Dam options:
Regional road upgrades (10 different options)
Priority local road upgrades
Non-infrastructure measures
✓ Regional coordination
✓ Integrated land use, roads and
emergency planning
✓ An aware, prepared and responsive
community
✓ Better weather and flood predictions
✓ Best-practice response and recovery
✓ Ongoing monitoring, evaluation,
reporting and improvement
Lower full supply level (5 metres)
Lower full supply level (12 metres)
Lower full supply level & raise wall
Raise wall by 20 metres
Raise wall by 14 metres.
▪ Reduce risk to life and flood damages
to homes and infrastructure, including:▪ Reduce risk to life, including:
▪ Flood Strategy for the Hawkesbury-Nepean – released in 2017
• Taskforce Options Assessment Report - 4 years of investigations
14 Warragamba Dam Raising Briefing 2021
All options investigated and reassessed

▪ Very substantial existing flood risk
▪ Dam raising key in reducing risk –
now and for the future
▪ Regional Land Use Planning
Framework – essential to manage
future growth
▪ Existing flood planning levels would
not be reduced
Homes inundated in Windsor – March 2021 flood
Source: Spatial Services
15 Warragamba Dam Raising Briefing 2021
Land use planning in the floodplain

Upgrading regional evacuation roads
16Warragamba Dam Raising Briefing 2021
▪ Evacuation roads
• vital during a flood emergency
▪ New and major upgrades to regional
evacuation roads
• no benefit in reducing damages to existing
properties and assets
▪ Program to increase resilience of
existing local evacuation roads
• fixing existing constraints - minimise risk
routes cut by local catchment flooding
▪ Guidelines for building flood resilience
into new and upgraded regional roads
Flood Strategy - Local road resilience upgrade program
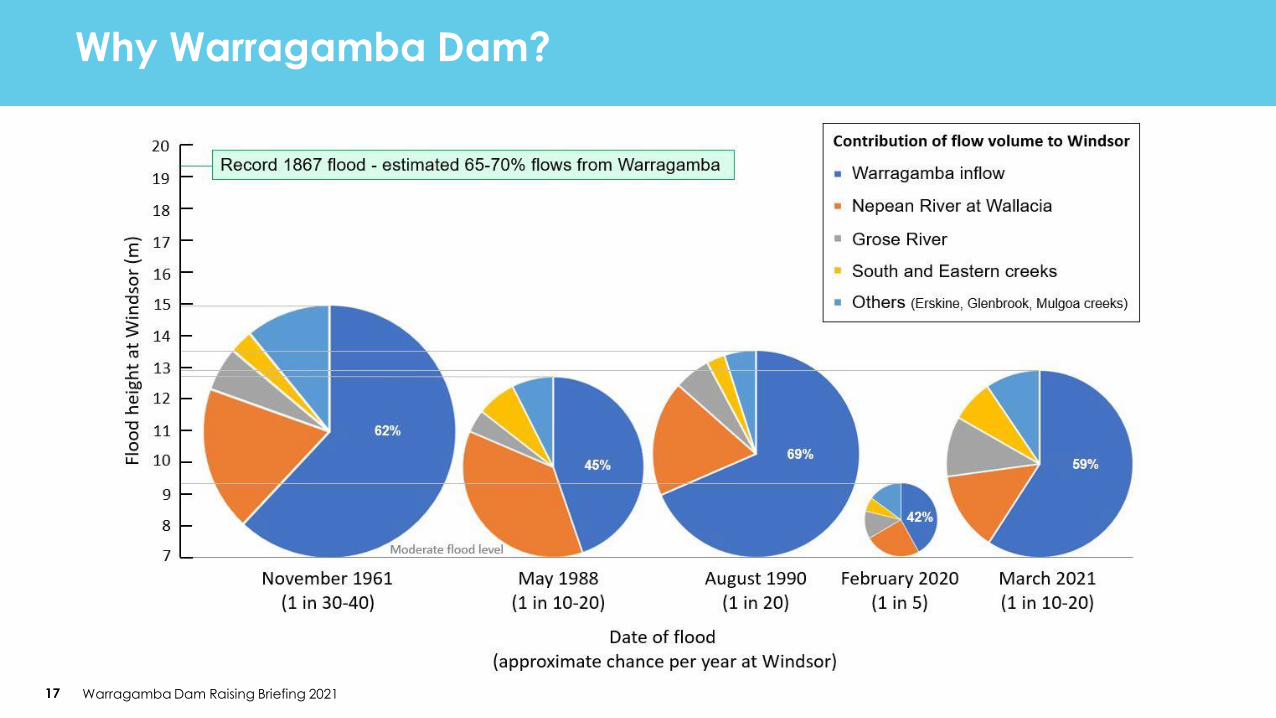
Why Warragamba Dam?
17 Warragamba Dam Raising Briefing 2021

Mitigation options at Warragamba Dam
18 Warragamba Dam Raising Briefing 2021
▪ Deep ‘V’ shaped valley
behind the dam-5m reduce storage ~18%
-12m reduce storage ~40%
Flood mitigation zone
- provide temporary storage ~50%
Same benefits
as dam raising -
reduce storage
by 25m or ~67%
Full supply level
▪ Warragamba - around 80% of
Greater Sydney’s water supply
▪ Water supply at its sustainable
limit
• any reduction in permanent
storage would need to be
replaced
▪ Warragamba historically
contributed up to 70%
of inflows to floods

▪ No low-cost options:
• water supply lowering options - major cost is
replacing lost supply
• dam raising – major costs relate to
construction and biodiversity offsets
• major road upgrades – high cost and do
nothing to reduce damages
• buy back dwellings – whole
suburbs, thousands of homes, massive cost
and social dislocation
• no new dwellings - doesn’t address large
existing risk.
▪ Current estimates of proposed
dam raising and alternatives
• outlined in Chapter 4 of EIS
▪ Final cost of dam raising:
• completed detailed design
• conditions of planning approval
• competitively priced proposals
• market conditions at the time.
Relative costs of options
19 Warragamba Dam Raising Briefing 2021

Project Construction and Operation
Warragamba Dam Raising Briefing 202120
Project Proponent
David Harper

Design and constructability
21 Warragamba Dam Raising Briefing 2021
https://caportal.com.au/wnsw/wd/virtual?hview=modalDesignConstructibilityPlay video at:

Environmental flows infrastructure
Warragamba Dam Raising Webinar 2021
▪ The environmental flows project would provide the
infrastructure necessary to enable environmental flows to
improve river health downstream
22

Construction program
Warragamba Dam Raising Briefing 202123

Biodiversity
Warragamba Dam Raising Briefing 202124 Chris Masters
EIS Preparation
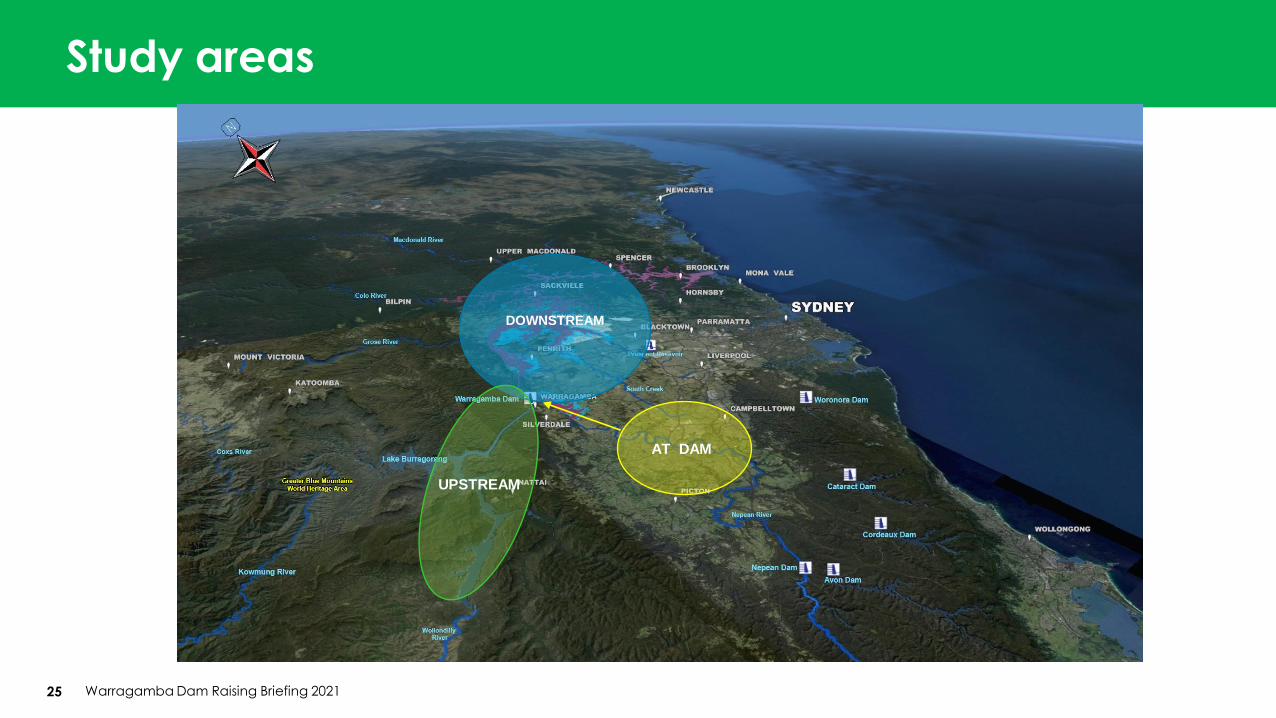
Study areas
Warragamba Dam Raising Briefing 202125
DOWNSTREAM
AT DAM
UPSTREAM
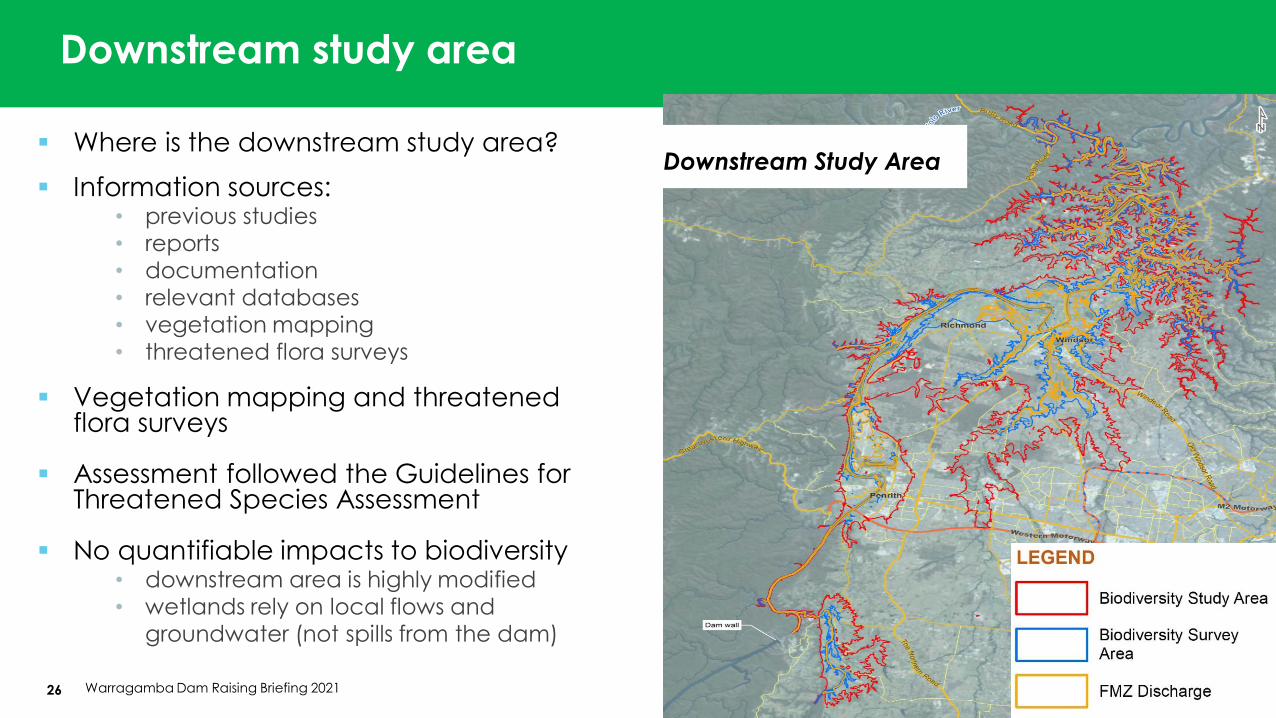
Downstream study area
Warragamba Dam Raising Briefing 202126
Downstream Study Area▪ Where is the downstream study area?
▪ Information sources:• previous studies • reports
• documentation• relevant databases• vegetation mapping • threatened flora surveys
▪ Vegetation mapping and threatened flora surveys
▪ Assessment followed the Guidelines for Threatened Species Assessment
▪ No quantifiable impacts to biodiversity• downstream area is highly modified• wetlands rely on local flows and
groundwater (not spills from the dam)

27
Upstream study area
Warragamba Dam Raising Briefing 2021
https://caportal.com.au/wnsw/wd/virtual?hview=modalBiodiversity
Play upstream biodiversity video at:
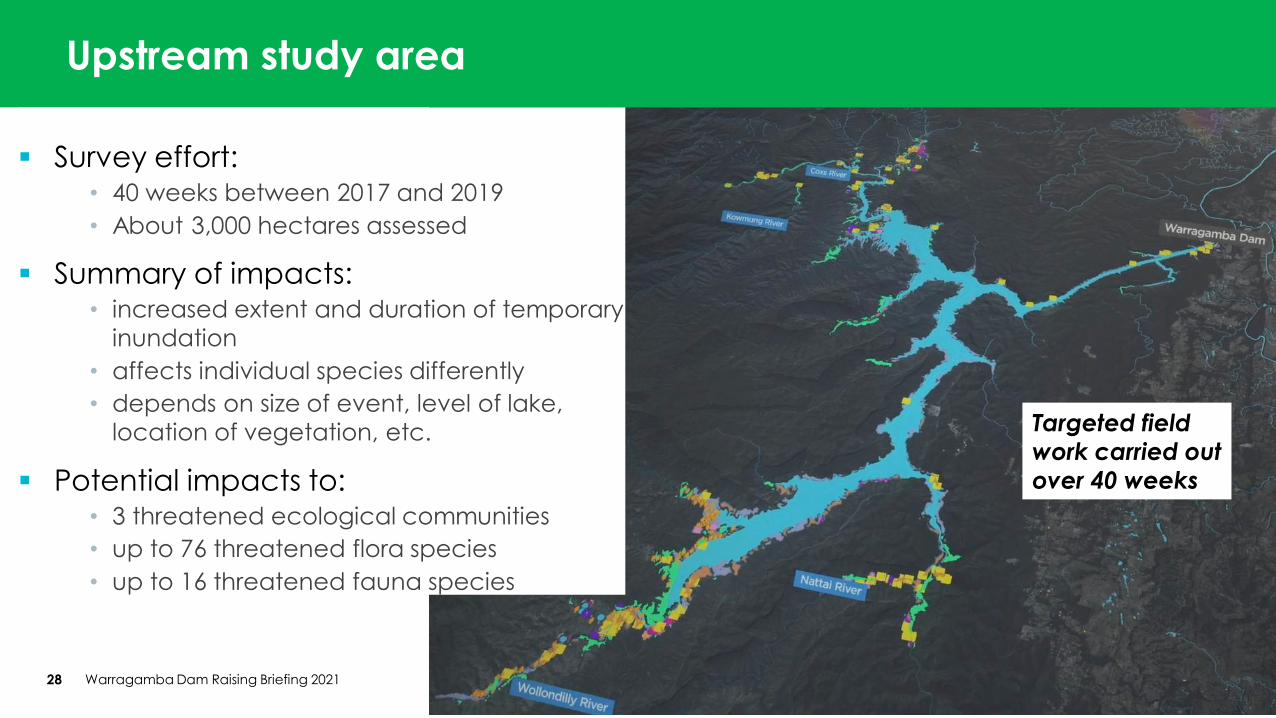
Targeted field
work carried out
over 40 weeks
28
Upstream study area
▪ Survey effort:• 40 weeks between 2017 and 2019
• About 3,000 hectares assessed
▪ Summary of impacts:• increased extent and duration of temporary
inundation
• affects individual species differently
• depends on size of event, level of lake,
location of vegetation, etc.
▪ Potential impacts to:• 3 threatened ecological communities
• up to 76 threatened flora species
• up to 16 threatened fauna species
Warragamba Dam Raising Briefing 2021

2019-2020 bushfires
Warragamba Dam Raising Briefing 202129
▪ For the study area:
• 55% of the upstream study area was mapped as ‘Low’ or ‘Unburnt’
• less than 10% mapped as ‘High’ or ‘Extreme’
▪ For the Greater Blue Mountains World
Heritage Area within the study area:
• 70% of the area was mapped as ‘Low’ or ‘Unburnt’ and about 12% mapped as ‘High’
or ‘Extreme’
▪ Field surveys occurred well before the fires
▪ EIS assessments are based on pre-fire
conditions
Extent of 2019/2020 bushfires

Species-specific questions
Warragamba Dam Raising Briefing 202130
▪ Camden White Gum:
• WaterNSW commissioned a controlled CSIRO study
• trees were inundated for up to 6 weeks
• monitored over 2 years
• small but statistically significant increase in growth
over the 2-year study period
• no evidence of negative impact on the growth or
survival of the trees
▪ Regent Honeyeater:
• was recorded in the study area
• suitable foraging and breeding habitat is not
limited to the impact area
• unlikely to have a significant impact on the local
population of this species
• not considered a key breeding area*
* National Recovery Plan for the Regent Honeyeater

Protected and Sensitive Lands
Warragamba Dam Raising Briefing 202131 Chris Masters
EIS Preparation

▪ Area extends for more than 250 km from edge of
Hunter Valley, to the Southern Highlands near
Mittagong
▪ Made up of 8 national parks and reserves
▪ Project overlaps with parts of 3 national parks
▪ At some locations, the boundary of the World
Heritage Area matches the full supply level of
Lake Burragorang, the waterbody formed by the
damming of the Warragamba River
Greater Blue Mountains World Heritage Area
Warragamba Dam Raising Briefing 202132
Source: L. Tasker, NPWS
Lake Burragorang

Protected and Sensitive Lands
World Heritage Assessment
33 Warragamba Dam Raising Briefing 2021
https://caportal.com.au/wnsw/wd/virtual?hview=modalWorldHeritage
Play World Heritage video at:

Wild rivers and national parks
Warragamba Dam Raising Briefing 202134
▪ Kowmung River
• approx. 40 km from the dam wall
• declared wild river section is approx. 3km upstream of
the junction with the Coxs River
• about 1,250 metres of the declared wild river section is
within the study area, but outside the impact area
• no change to the level or extent of inundation
▪ National Parks and Conservation Areas:
• some temporary inundation to areas of surrounding
parks and conservation areas
• some of these overlap with the World Heritage Area
• in the order of 0.2% to about 2% of the areas
• accounted for in the Offset Strategy
Location of the declared wild river section of the
Kowmung River relative to Project study area

Aboriginal Cultural Heritage
Warragamba Dam Raising Briefing 202135 Bob Tilbury
EIS Preparation

Approach to Aboriginal Cultural Heritage Assessment
Warragamba Dam Raising Briefing 202136
▪ Aboriginal Cultural Heritage Assessment includes:
• Archaeological Report: focus on sites & objects
• Cultural Values Assessment: focus on culture &
stories
▪ Consultation with Registered Aboriginal Parties:
• 22 Registered Aboriginal Parties identified
• commented on draft methodology and reports
• participated in field work
• provided information to improve the assessments
• reviewed the mitigation measures and
management options

Archaeological survey extent and process
Warragamba Dam Raising Briefing 202137
▪ Field works:
• 2 archaeologists
• 1-3 of the Registered Aboriginal Parties
• archaeological sites recorded
• 76 days of upstream field surveys
▪ Survey included:
• areas that have potential for Aboriginal objects
• previously recorded sites that are of high and very high significance
• areas selected by Registered Aboriginal Parties for cultural significance
▪ Covered an area of 2,655 hectares• larger than impact area (1,400 hectares)
▪ Produced a predictive model

What we found
38 Warragamba Dam Briefing 2021
▪ Types of sites identified:
• Open camp sites
• Ceremony and dreaming sites
• Resource and gathering sites
• Engraving sites
• Axe grinding and groove sites
• Scarred trees
• Rock shelter sites
• Stone arrangement sites
• Water hole sites
• Combinations of the above

Archaeological survey
Warragamba Dam Raising Briefing 202139
▪ Findings:• no sites in the construction area
• 334 sites identified (incl. 303 new sites) upstream
o 127 outside the study area
o 119 already affected by temporary inundation
o 43 within the impact area
• Predictive model → 174 sites within impact area
o assessment assumes all predicted sites within the impact area to be lost regardless of susceptibility to temporary inundation
Left: Hands on the
Rock, an art site
below the waters of
Lake Burragorang.
Below: Sketches of
carved trees from
the Burragorang
Valley; example of
the tangible
heritage lost in the
valley (Etheridge
1893).

Cultural Values Assessment
40
▪ Six strands of distinct but interrelated cultural values:
• Gurrangatch-Mirrigan Dreaming Track
• Buru (Kangaroo) Dreaming Story Places
• Living Places (history of occupation and use)
• Cultural Places (ritual life)
• Archaeological Sites
• Waterways (Wollondilly, Nattai, Warragamba & Coxs Rivers and their
tributaries)
▪ 32 cultural value places identified in the study area:
• 18 are already fully impacted
• 11 are already partially impacted and would be further impacted
• 3 are above the Project impact area
▪ Through the consultation process the Registered Aboriginal
Parties identify the area as highly significant
Warragamba Dam Raising Briefing 2021
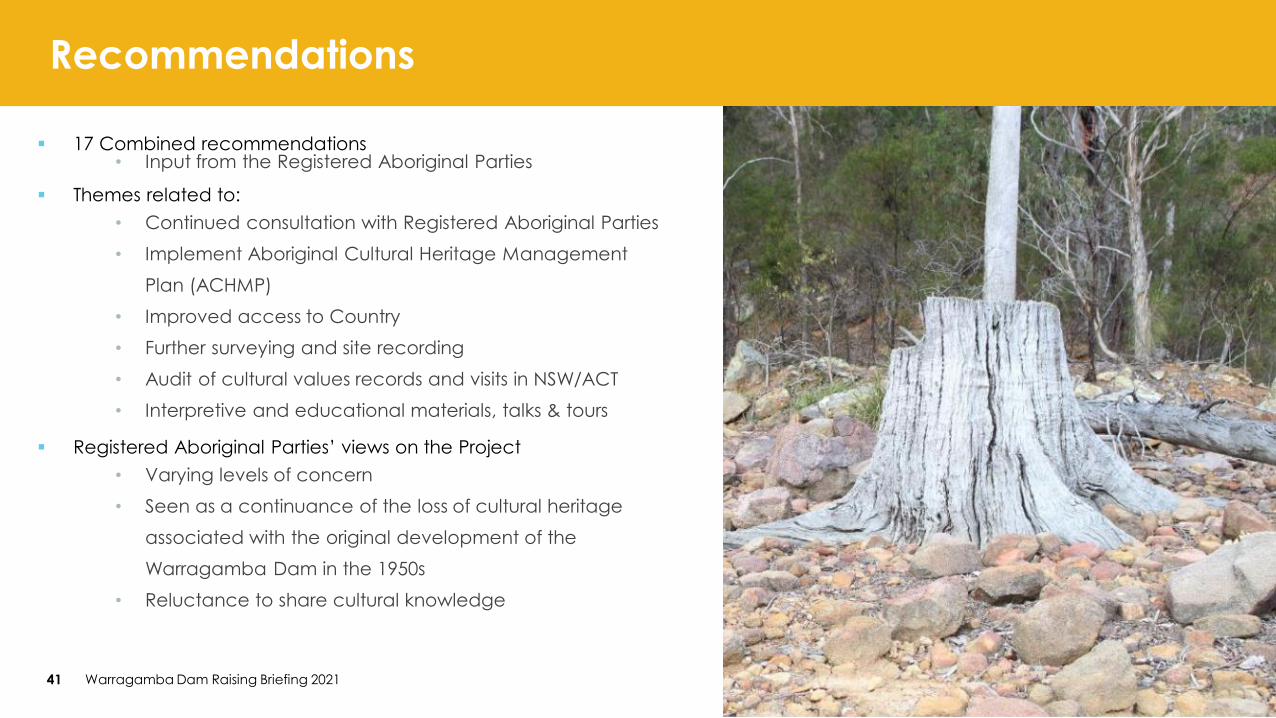
Recommendations
41 Warragamba Dam Raising Briefing 2021
▪ 17 Combined recommendations• Input from the Registered Aboriginal Parties
▪ Themes related to:
• Continued consultation with Registered Aboriginal Parties
• Implement Aboriginal Cultural Heritage Management
Plan (ACHMP)
• Improved access to Country
• Further surveying and site recording
• Audit of cultural values records and visits in NSW/ACT
• Interpretive and educational materials, talks & tours
▪ Registered Aboriginal Parties’ views on the Project
• Varying levels of concern
• Seen as a continuance of the loss of cultural heritage
associated with the original development of the
Warragamba Dam in the 1950s
• Reluctance to share cultural knowledge

Social Impact Assessment
Warragamba Dam Raising Briefing 202142 Bob Tilbury
EIS Preparation

43
Social impact methodology
▪ SEIA Scoping
• review of existing information
• identification of stakeholders and communities
(local, downstream, upstream)
• review of land use planning, demographics from
census data, etc
Warragamba Dam Raising Briefing 2021

44
Social impact methodology
▪ SEIA engagement
• scoping interviews
• phone-based surveys
• web-based surveys
• business surveys
• stakeholder workshops at Warragamba
• almost 3,500 consultation events from almost 3,000
registered stakeholders
Warragamba Dam Raising Briefing 2021

Social impact assessment
45 Warragamba Dam Raising Briefing 2021
https://caportal.com.au/wnsw/wd/virtual?hview=modalSocioEconomicImpact
Play Social Impact video at:

South Windsor during
the 1961 flood event46
George St Windsor during
the 1961 flood event
Social impacts and benefits
Avoiding loss of life is the single most significant
social change provided by the Project
▪ Each study area experiences different impacts
and benefits
• Local communities – construction impacts to local
amenity and economy
• Upstream communities – operational impacts to
Aboriginal cultural heritage and natural heritage
• Downstream communities - significant positive
social benefits include reduced risks to people’s
health & safety, homes, and livelihoods
Case Study:
March 2021 Flood
Warragamba Dam Raising Briefing 202147 Alison White
INSW –
The Flood Strategy

At Penrith:
▪ moderate flood – mostly within bank
▪ ~1 in 10 to 20 chance per year
▪ slightly higher than 1961 flood
At Windsor:
▪ first major flood since 1990
▪ inundated low lying areas - significant damage
and dislocation
▪ 1 in 10 to 20 chance per year
▪ around 2 metres lower than 1961 flood
▪ around 7 metres lower than record flood
March 2021 flood – in context
48 Warragamba Dam Raising Briefing 2021
Nepean River, Bellevue Road Regentville – near flood peak March 2021
Streets under water, McGraths Hill – near flood peak March 2021

Case Study: March 2021 Flood
March 2021 flood – reduction in flood peak levels
49 Warragamba Dam Raising Briefing 2021
Raised dam Lower full
supply 12m
Lower full
supply 5m
Releases ahead
of the floodMarch 2021 flood peak
(12.9m AHD Windsor)
-0.5m
-1.0m
-1.5m
-2.0m
-2.5m
-3.0m
-3.5m
-4.0m
Note: Review of the March 2021 flood is ongoing.
Figures presented are based on analysis of flood hydrology at Oct 2021.
This slide revised to
reflect updated
modelling as at
30 October 2021.

March 2021 flood – dam pre-releases?
50 Warragamba Dam Raising Briefing 2021
▪ Flood mitigation not an approved purpose
▪ Pre-releases ahead of a forecast flood could:
• bring forward downstream flood peak
• cut off evacuation routes earlier
▪ Pre-releases over a longer term:
• require precision in forecasting not currently possible
• could risk Greater Sydney’s water security
▪ To avoid dam spilling in March 2021:
• storage would have to be lowered to around 30%
– more than 2.5 years supply for Greater Sydney
– below levels in 2017-19 drought and millennium drought
• not been achievable in forecast time available for this event
Source INSW
Photo: Adam Hollingworth
Yarramundi Bridge – March 2021 flood

March 2021 and February 2020 – Richmond/Windsor
51 Warragamba Dam Raising Briefing 2021
▪ Had the dam been
raised, the March 2021
flood would have
been similar in extent
and depth to the
February 2020 event.

▪ March 2021
▪ February 2020
Source INSW
Image: Top Notch Video
Source INSW
Image: Top Notch Video
Flooding without and with a raised dam
52

Source Hawkesbury City Council
Some key benefits:
▪ 80% reduction in houses impacted -
from around 600 to around 100
▪ 60%+ reduction in manufactured
homes impacted
▪ Reduced evacuation and isolation
▪ Reduced closure of bridges:
• new Windsor Bridge delayed more than 13
hours and shortened by more than 4 days
▪ Major reduction in damages to roads
and other regional infrastructure
Source INSW: Photo: Adam Hollingworth
March 2021 – with raised dam
53 Warragamba Dam Raising Briefing 2021
Source Spatial Services
Source INSW: Image: Top Notch Video

In larger floods - supporting evacuation and saving lives
54

In larger floods - supporting evacuation and saving lives
55

7,600
Homes impacted
reduced to
2,500
$3 billion
Damages
reduced to
$0.4 billion
55,000
people to evacuate
reduced to
14,000
▪ 1 in 100 chance per year flood
▪ 1 in 500 chance per year flood (similar to1867 flood of record)
~$8 billion
Damages
reduced to
~$2 billion
15,500
Homes impacted
reduced to
5,000
90,000
People to evacuate
reduced to
45,000
Proposed dam raising - benefits in larger floods
56 Warragamba Dam Raising Briefing 2021

▪ Reassessment of dam raising and alternatives
▪ Confirmed dam raising offers most benefits in
reducing downstream flood risk
▪ Ongoing implementation of integrated Flood
Strategy measures
▪ EIS providing information to consider impacts
and benefits
Source INSW
Photo: Adam Hollingworth
Source INSW
Image: Top Notch Video
Re-assessment of options to inform EIS
57 Warragamba Dam Raising Briefing 2021