
Atrial fibrillatory signal estimation using blind source
13
Science in China Series F: Information Sciences © 2008 SCIENCE IN CHINA PRESS Springer Received December 28, 2006; accepted December 26, 2007; published online July 9, 2008 doi: 10.1007/s11432-008-0105-2 † Corresponding author (email: [email protected]) Supported by the project of the Training Foundation of Sichuan Academic and Technical Leaders (Grant No. 901008); the project of application groundwork of Sichuan (Grant No. J13 - 075) and the Training Plans of Young and Middle Elite of University of Electronic Science and Technol- ogy of China (Grant No. 601016) Sci China Ser F-Inf Sci | Oct. 2008 | vol. 51 | no. 10 | 1572-1584 www.scichina.com info.scichina.com www.springerlink.com Atrial fibrillatory signal estimation using blind source extraction algorithm based on high-order statistics WANG Gang 1 , RAO NiNi 1† & ZHANG Ying 2 1 School of life Science and Technology, University of Electronic Science and Technology of China, Chengdu 610054, China; 2 School of Automation Engineering, University of Electronic Science and Technology of China, Chengdu 610054, China The analysis and the characterization of atrial fibrillation (AF) requires, in a previ- ous key step, the extraction of the atrial activity (AA) free from 12-lead electrocar- diogram (ECG). This contribution proposes a novel non-invasive approach for the AA estimation in AF episodes. The method is based on blind source extraction (BSE) using high order statistics (HOS). The validity and performance of this algo- rithm are confirmed by extensive computer simulations and experiments on real- world data. In contrast to blind source separation (BSS) methods, BSE only extract one desired signal, and it is easy for the machine to judge whether the extracted signal is AA source by calculating its spectrum concentration, while it is hard for the machine using BSS method to judge which one of the separated twelve signals is AA source. Therefore, the proposed method is expected to have great potential in clinical monitoring. electrocardiogram (ECG), atrial fibrillation, blind source separation (BSS), blind source extraction (BSE) 1 Introduction Atrial fibrillation (AF) is the most common sustained arrhythmias encountered by clinicians and occurs in approximately 0.4%―1.0% of the general population. Its prevalence increases with age, and up to 10% of the population older than 70 years has been diagnosed with AF [1―5] . With the projected growth of the elderly population, the prevalence of AF will certainly increase. Thus the interest in the study and understanding of AF has considerably increased. There has not been an
Transcript of Atrial fibrillatory signal estimation using blind source

Science in China Series F: Information Sciences
© 2008 SCIENCE IN CHINA PRESS
Springer
Received December 28, 2006; accepted December 26, 2007; published online July 9, 2008 doi: 10.1007/s11432-008-0105-2 † Corresponding author (email: [email protected]) Supported by the project of the Training Foundation of Sichuan Academic and Technical Leaders (Grant No. 901008); the project of application groundwork of Sichuan (Grant No. J13 - 075) and the Training Plans of Young and Middle Elite of University of Electronic Science and Technol-ogy of China (Grant No. 601016)
Sci China Ser F-Inf Sci | Oct. 2008 | vol. 51 | no. 10 | 1572-1584
www.scichina.cominfo.scichina.com
www.springerlink.com
Atrial fibrillatory signal estimation using blind source extraction algorithm based on high-order statistics
WANG Gang1, RAO NiNi1† & ZHANG Ying2 1 School of life Science and Technology, University of Electronic Science and Technology of China,
Chengdu 610054, China; 2 School of Automation Engineering, University of Electronic Science and Technology of China, Chengdu
610054, China
The analysis and the characterization of atrial fibrillation (AF) requires, in a previ-ous key step, the extraction of the atrial activity (AA) free from 12-lead electrocar-diogram (ECG). This contribution proposes a novel non-invasive approach for the AA estimation in AF episodes. The method is based on blind source extraction (BSE) using high order statistics (HOS). The validity and performance of this algo-rithm are confirmed by extensive computer simulations and experiments on real- world data. In contrast to blind source separation (BSS) methods, BSE only extract one desired signal, and it is easy for the machine to judge whether the extracted signal is AA source by calculating its spectrum concentration, while it is hard for the machine using BSS method to judge which one of the separated twelve signals is AA source. Therefore, the proposed method is expected to have great potential in clinical monitoring.
electrocardiogram (ECG), atrial fibrillation, blind source separation (BSS), blind source extraction (BSE)
1 Introduction
Atrial fibrillation (AF) is the most common sustained arrhythmias encountered by clinicians and occurs in approximately 0.4%―1.0% of the general population. Its prevalence increases with age, and up to 10% of the population older than 70 years has been diagnosed with AF[1―5]. With the projected growth of the elderly population, the prevalence of AF will certainly increase. Thus the interest in the study and understanding of AF has considerably increased. There has not been an

WANG Gang et al. Sci China Ser F-Inf Sci | Oct. 2008 | vol. 51 | no. 10 | 1572-1584 1573
exhaustive epidemiologic study of AF in China. However, relative data in Beijing and Shanghai show that AF occurs in approximately 1.0% of the population older than 60 years. Thus, we can draw a conclusion that there are at least eight million people who suffer from AF in China (http://www.afib.com.cn/).
One normal cardiac cycle is started at the sinus node with the depolarization of the right atrium and spreads towards the entire atria in a well-ordered manner. Atrial wave is defined by atrial activity (AA) and ventricular wave is by ventricular activity (VA) in the electrocardiogram (ECG). Generally, the signal component associated with AA is P-wave, and the signal components with VA are QRS complex and T-wave. When AF occurs, it is described on the ECG by the replace-ment of consistent P-wave by rapid oscillation or fibrillatory waves that vary in size, shape and timing. Its frequency ranges from 350 to 600 per minute. This kind of wave is called an atrial fibrillatory wave, or AF signal.
In clinical medicine, the diagnosis methods, such as observing the clinical manifestation and the surface ECG, are usually utilized, but the doctors scarcely find the AF in time because they cannot observe the patients or ECG without rests. Then, if the monitoring machine can “intelli-gently” extract the AF signal from ECG, judge whether or not the AF is on, and give out different alarms according to the results, the doctor will find AF timely and adopt corresponding therapy. Thus the non-invasive approach for the AA estimation in AF episodes is a key step in the analysis and characterization of AF.
In this paper, we first analyze the previous methods dealing with AA estimation in AF episodes, and then propose a new frame, which is based on blind source extraction (BSE) using high order statistics (HOS). Compared with blind source separation (BSS) methods, this frame only extracts one desired signal, and it is easy for the machine to recognize whether the extracted signal is AA source, i.e., “machine recognition”.
2 New frame of AF signal extraction
2.1 BSS/PCA based frame of AF signal extraction
The 12-lead ECG of AF patients are composed of the independent sources of atrial and ventricu-lar cardiac activity and other nuisance signals. On the methodological standpoint, three kinds of methods have been proposed. They are spatiotemporal QRST cancellation (STC)[7], primary component analysis (PCA) [8], and BSS/ICA (independent component analysis) methods[1―3].
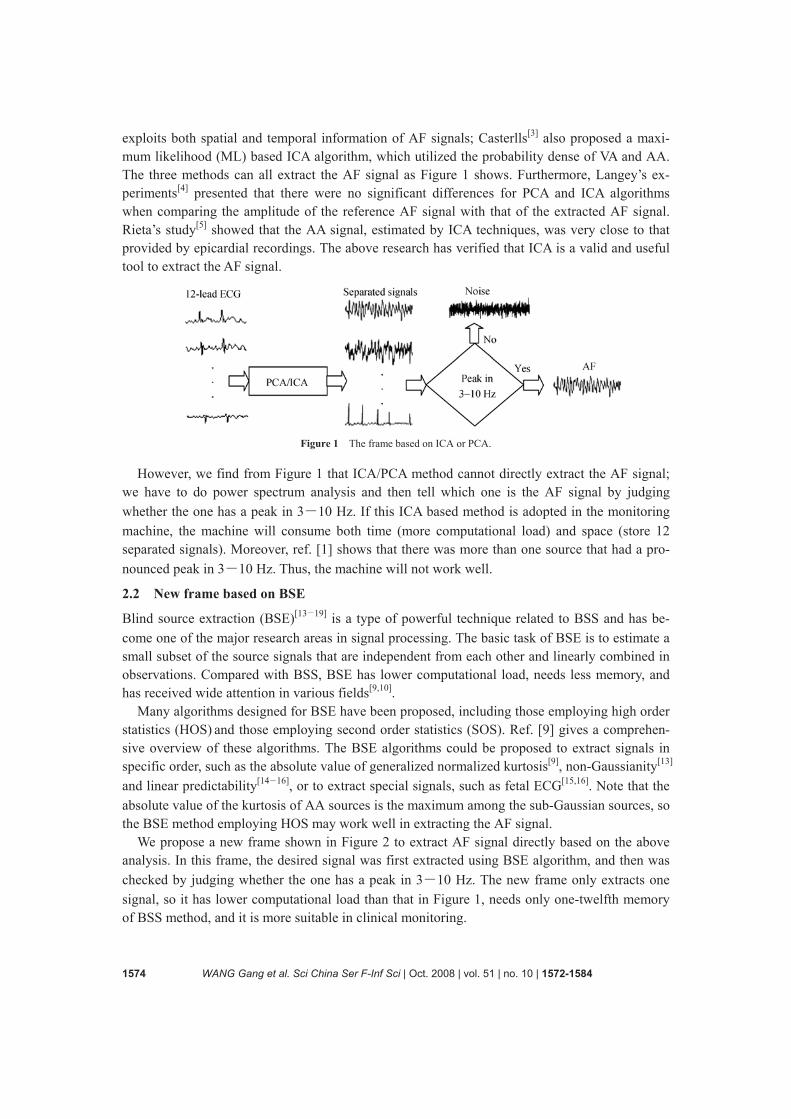
STC techniques obtain as many AA signals as leads processed by the cancellation algorithm. In contrast, the ICA/PCA based approaches estimate a single signal that is able to reconstruct the complete AA present in every ECG lead and thus the two methods are more robust. Figure 1 shows the corresponding frame.
The application of BSS-based technique in this biomedical problem is in connection with the following three main assumptions[1]. Firstly, in atrial arrhythmia episodes, the cardio electric sources generating AA and VA can be regarded as statistically independent. Second, both activi-ties present a non-Gaussian character. Finally, AA and VA are manifested on the body surface as an instantaneous linear mixture of the cardiac sources, in which the unknown mixture of coeffi-cients depend on the ECG electrode position and the conductivity of the body tissues.
As for the proposed BSS[9―12] methods for AA extraction, Rieta[1] first introduced Fast-ICA algorithm to extract the AF signal; Casterlls[2] put forward a two-step BSS-based technique which
1574 WANG Gang et al. Sci China Ser F-Inf Sci | Oct. 2008 | vol. 51 | no. 10 | 1572-1584
exploits both spatial and temporal information of AF signals; Casterlls[3] also proposed a maxi-mum likelihood (ML) based ICA algorithm, which utilized the probability dense of VA and AA. The three methods can all extract the AF signal as Figure 1 shows. Furthermore, Langey’s ex-periments[4] presented that there were no significant differences for PCA and ICA algorithms when comparing the amplitude of the reference AF signal with that of the extracted AF signal. Rieta’s study[5] showed that the AA signal, estimated by ICA techniques, was very close to that provided by epicardial recordings. The above research has verified that ICA is a valid and useful tool to extract the AF signal.
Figure 1 The frame based on ICA or PCA.
However, we find from Figure 1 that ICA/PCA method cannot directly extract the AF signal;
we have to do power spectrum analysis and then tell which one is the AF signal by judging whether the one has a peak in 3―10 Hz. If this ICA based method is adopted in the monitoring machine, the machine will consume both time (more computational load) and space (store 12 separated signals). Moreover, ref. [1] shows that there was more than one source that had a pro-nounced peak in 3―10 Hz. Thus, the machine will not work well.
2.2 New frame based on BSE
Blind source extraction (BSE)[13―19] is a type of powerful technique related to BSS and has be-come one of the major research areas in signal processing. The basic task of BSE is to estimate a small subset of the source signals that are independent from each other and linearly combined in observations. Compared with BSS, BSE has lower computational load, needs less memory, and has received wide attention in various fields[9,10].
Many algorithms designed for BSE have been proposed, including those employing high order statistics (HOS) and those employing second order statistics (SOS). Ref. [9] gives a comprehen-sive overview of these algorithms. The BSE algorithms could be proposed to extract signals in specific order, such as the absolute value of generalized normalized kurtosis[9], non-Gaussianity[13] and linear predictability[14―16], or to extract special signals, such as fetal ECG[15,16]. Note that the absolute value of the kurtosis of AA sources is the maximum among the sub-Gaussian sources, so the BSE method employing HOS may work well in extracting the AF signal.
We propose a new frame shown in Figure 2 to extract AF signal directly based on the above analysis. In this frame, the desired signal was first extracted using BSE algorithm, and then was checked by judging whether the one has a peak in 3―10 Hz. The new frame only extracts one signal, so it has lower computational load than that in Figure 1, needs only one-twelfth memory of BSS method, and it is more suitable in clinical monitoring.

WANG Gang et al. Sci China Ser F-Inf Sci | Oct. 2008 | vol. 51 | no. 10 | 1572-1584 1575
Figure 2 The new frame based on BSE.
3 AF signal extraction algorithm based on BSE
Note that the 12-lead ECG of AF patients are composed of the independent sources of AA, VA, and other nuisance signals. With respect to non-Gaussianity, VA presents high values within the heart beat (QRS complex) and low values in the rest of the cardiac cycle. Hence, the histogram analysis of VA reveals a super-Gaussian behavior with high positive kurtosis value. On the other hand, AA has been modeled as a sawtooth signal consisting of a sinusoid with several harmonics, which behaves as a sub-Gaussian random process with low negative kurtosis value [1]. The other nuisance signals can be regarded as Gaussian noises whose kurtosis approximates zero. When the mixtures contain both sub- and super-Gaussian signals, we can use the optimization criterion, minimization (maximization) of the value of normalized kurtosis, to extract the sub-(super-) Gaussian source with the minimal (maximal) kurtosis as the first output. Thus, the minimization criterion may work well to extract the AF signal.
However, our simulation showed that the extracted signal by this criterion was often polluted by VA and other noises. Since VA corresponds to the primary component of the ECG and the noises correspond to the minor component, we can remove some primary and minor components of the ECG using standard PCA technique before minimizing the value of normalized kurtosis. The following is the original BSE algorithm based on normalized kurtosis and its modification.
3.1 Principle of BSS algorithm based on HOS
In BSE, we observe an n-dimensional stochastic signal (ECG) vector X = (x1, x2, …, xn)T that is regarded as the linear mixture of an n-dimensional zero-mean and unit-variance vector S = (s1, s2,…, sn)T, i.e., ,X AS= (1) where A is an unknown mixing n×n matrix.
To make the algorithm more robust and faster, prewhitening is often used to transform the ob-served signals X to the following ,Z WX= (2) such that E{XXT}=WAE{SST}ATWT=VAATVT=I, where W is a prewhitening matrix and I is a unit matrix. Denote E{XXT} by Rx, and Rx can be eigenvalue decomposed as Rx= PDPT, where D = diag(d1, d2, …, dn) and the operator diag() denotes diagonal matrix. Thus the prewhitening matrix can be expressed as W = PD−1/2PT.
The goal of BSE is to find a vector w such that y=wTZ=wTWAS is an estimated source signal up to a scalar, i.e.,

1576 WANG Gang et al. Sci China Ser F-Inf Sci | Oct. 2008 | vol. 51 | no. 10 | 1572-1584
T ,y w Z= (3) where y has the minimal or maximal kurtosis. Cichocki and Amari[9] have employed normalized kurtosis as cost function which is
4min ( ) ( ),4
J w yβ κ= − (4)
where 4 ( )yκ is a normalized kurtosis and it is defined as follows:
{ }{ }
4
4 22( ) 3,
E yy
E yκ = − (5)
where parameter β determines the sign of the kurtosis of the extracted signal,
1, for extraction of a source signal with negative kurtosis,1, for extraction of a source signal with positive kurtosis.
β−⎧
= ⎨+⎩ (6)
The above expressions (4) and (6) mean that the sub-(super-)Gaussian source with the minimal (maximal) kurtosis can be extracted as the first output by minimizing (maximizing) the value of normalized kurtosis. Moreover, it has been shown in Chapter 5 of ref. [9] that such a cost func-tion has no spurious equilibria if sources are mutually independent and they do not have Gaussian distribution. Applying the standard gradient descent approach to minimize the cost function (4), we have
{ }{ }{ }
T
2
34
while (not converge)
,
( ) ,
( ) ,
/ || ||,end (while)
y w X
E yy y y
E y
w w E y Z
w w w
ϕ
βη ϕ+
+ +
=
= −
= −
=
(7)
where η is positive. The above algorithm will converge to a steady solution. For simplicity, we denote the above algorithm containing expressions (2), (6), and (7) by OrigALG.
3.2 Modified AF signal extraction algorithm
Since the kurtosis of the AF signal is negative, we have 1.β = − However, the above algorithm OrigALG does not always work well, and the extracted signal by this method is often polluted by VA and other noises. The corresponding experiment result is shown in Figure 3.
Then, we do the modifications as follows: the observed ECG data are preprocessed with PCA method before OrigALG works. In other words, we remove not only minor components associ-ated with noise as standard PCA method but also primary components that are manifested as VA. Thus the pollutions, such as VA and noises, will be reduced greatly by the preprocessing method. It contains two steps: First, the variance matrix of the normalized ECG data X=(x1, x2,…, xn)T is decomposed by PCA, or singular value decomposition (SVD):

WANG Gang et al. Sci China Ser F-Inf Sci | Oct. 2008 | vol. 51 | no. 10 | 1572-1584 1577
[ ][ ]
T
1 2
1 2
, , ( ( )),
diag , , ,.
n
n
U V SVD E XXΛ
Λ λ λ λ
λ λ λ
=
=
> > >
(8)
Second, m primary components and k minor components are removed as follows, and the mixtures become the following:
T(:, 1: ) .X U m n k X= + − (9) The dimensions of the mixtures will be
reduced to n-m-k after the preprocessing procedure. In expression (9), m is usually equal to 1, and k could be confirmed by standard PCA method.
Thus, our modification is summarized as follows:
Step 1: Remove primary and minor com-ponent
[ ] T
T
, , ( ( )),
(:, 1: ) .
U V SVD E XX
X U m n k X
Λ =
= + −
Step 2: Prewhiten
[ ] T
1/ 2 T
, , ( ( )),
,.
P D P EVD E XX
W PD PZ WX
−
=
==
Step 3: Set iterative direction β and initial value w 1, randn( ,1).w n m kβ = − = − −
Step 4: Extract y through iterations
{ }{ }{ }
T
2
34
while (not converge)
,
( ) ,
( ) ,
/ || ||, end (while)
y w X
E yy y y
E y
w w E y Z
w w w
ϕ
βη ϕ+
+ +
=
= −
= −
=
where EVD denote eigenvalue decomposition. Compared with OrigALG, the modified algorithm is denoted by OurALG.
4 Numerical experiments and discussions
To check the validity and good performance of the proposed algorithm, we have performed ex-
Figure 3 The extracted signal and its PSD using OrigALG. (a) The extracted signal containing VA; (b) the corresponding PSD.

1578 WANG Gang et al. Sci China Ser F-Inf Sci | Oct. 2008 | vol. 51 | no. 10 | 1572-1584
tensive computer simulations and experiments on real world data.
4.1 Simulations
In the first simulation, we generated five zeros-mean and unit-variance source signals (shown in Figure 4). Each signal had 15000 samples. They were a muscle artifact, a breathing artifact, a Gaussian signal, a lead normal ECG and an AF signal. Their kurtosises were −0.5021, −0.3021, −0.0103, 32.3432, and −0.9034, respectively. These source signals were randomly mixed, i.e., the mixing matrix A was generated randomly with dimension n=5. We ran the algorithm OurALG to extract the AF signal, where m=1, and k=0. To compare the extraction performance, we adopted the following measurement denoted by performance index (PI)
2
10 21
1PI( ) 10log 1 (dB),1
lj
j i
gi
l g=
⎛ ⎞⎛ ⎞⎜ ⎟⎜ ⎟= −
⎜ ⎟⎜ ⎟− ⎝ ⎠⎝ ⎠∑ (10)
where g=wTWU(:,2:5)TA=[g1, g2, …, gn]T is global vector, and gTg=1; since AF signal is the fifth, we have i= 5. Furthermore, we ran PCA, Fast-ICA, and OrigALG separately to extract the AF signal, and the simulation was independently repeated 100 times. The averaged PIs were 20.8, 21.1, and 21.5 dB. It means that there is no significant difference among the PIs. Since PCA and Fast-ICA algorithm have been proved efficiently to extract the AF signal, the newly proposed one will work as well.
4.2 Experiments on real world data and its analysis
The signal database provided by Lead2000 machine (Jinjiang Company) comprised recordings from eight patients suffering from AF. All of the ECGs were composed of 12 leads, and sampled at 1920 Hz. Each lead signal had 15000 samples. Figure 5 shows a 12-lead ECG segment from a patient in AF. The modified algorithm, OurALG, was used to extract the AF signal.
Figure 4 Five source signals. From the top down, they were, respectively, a muscle artifact, a breathing artifact, a Gaussian signal, a lead normal ECG, and an AF signal.
Figure 5 A 12 lead ECG segment from a patient (patient 1) in AF.

WANG Gang et al. Sci China Ser F-Inf Sci | Oct. 2008 | vol. 51 | no. 10 | 1572-1584 1579
In order to validate the AA identification, the power spectral density (PSD) was computed for the extracted signal. The procedure consisted of obtaining the modified periodogram using the Welch method with Hamming window of 4096 points length, a 50% overlapping between adja-cent windowed sections, and an 8192-point fast Fourier transform (FFT). The spectral content above 25 Hz was discarded due to its low contribution. Note that the AF signal has a peak be-tween 3 and 10 Hz; we utilized the spectral concentration (SC) around the main frequency peak in measuring performance in real AF recordings. The SC[2,3] was computed as follows:
1.17
0.82/ 2
0
( ),
( )
fp
AA ifp
fs
AA i
P fSC
P f=∑
∑ (11)
where PAA is the power spectrum of the AF signal, fp is the frequency peak and fs is the sample rate. The higher the SC, the better the performance[2―5]. Relative references showed that if the extracted signal had a peak between 3 and 10 Hz, the corresponding SC would be more than 40%[2,3], which could be a necessary condition when checking the AF signal.
By calculating the SC of the components of the ECGs which were decomposed by PCA method, we found that the SC would usually be more than 45% when a component had a peak in 3―10 Hz; otherwise, the SC would be no more than 20%. If we set a threshold, such as 30%, the machine would “intelligently” extract the corresponding signal. However, further experiments also showed that the signal that has a peak in 3―10 Hz will not for certain be the AF signal. Thus, this method is a necessary but not sufficient condition.
4.2.1 Comparison of OurALG and OrigALG. The modified algorithm, OurALG, added pre-processing steps to the original one, OrigALG. In order to demonstrate how the added steps in-fluence the extracted AF signal, the two algorithms were used to extract the AF signal from the eight ECGs in the experiments. The comparison is shown in Figures 5―9 using the data of pa-tient 1. The extracted signal and its PSD using OrigALG, OurALG (m=1, k=0), OurALG (m=1, k=4) and PCA algorithm are demonstrated in Figures 6―8.
Figure 6 shows the extracted signal and its PSD by OrigALG method. There exist more than one peak between 3 and 10 Hz in Figure 6(b), which means that the extracted signal contains VA components. Note that VA corresponded to primary component of the ECG. Thus, we then re-moved the primary component, and extracted the signal shown in Figure 7 using OrigALG method, i.e., OurALG (m=1, k=0). There exists only one peak in 3―10 Hz, which caters to the character of AF signal. However, Figure 7(a) shows that the extracted signal contained noise, which corresponded to the minor component of the ECG. Furthermore, we remove four minor components, and extract the signal shown in Figure 8 using OrigALG method, i.e., OurALG (m=1, k=4). Meanwhile, we extracted AF signal shown in Figure 8 with PCA method. After the signals shown in Figure 7(a) and Figure 8(a) were normalized, they were compared in Figure 9. There exited a 0.8571 correlation between the two extracted signals. It showed the proposed al-gorithm was as valid as the PCA method.
As for the other seven ECGs, we obtained similar results. Due to space limitation, we omitted them. The extracted waves would be shown in the next subsection to check the validity.
4.2.2 Comparison of OurALG and PCA/ICA. Clinical experience shows that V1 lead contains

1580 WANG Gang et al. Sci China Ser F-Inf Sci | Oct. 2008 | vol. 51 | no. 10 | 1572-1584
Figure 6 The extracted signal and its PSD using OurALG (m=1, k=0), i.e., removing a primary component. (a) The extracted signal containing noise; (b) the corresponding PSD.
Figure 7 The extracted signal and its PSD using OurALG (m=1, k=4), i.e., removing a primary component and four minor components. (a) The extracted signal; (b) the corre-sponding PSD.
the largest AA contribution among the 12-lead surface ECGs. This result was confirmed by Rieta[9] using ICA or BSS methods. The visual comparisons between the extracted signals and the AA present in the original ECG were sum-marized in Figure 10, which provided satisfac-tory results. These results corresponded to pa-tient 1―patient 8. Meanwhile, we calculated the SC values of the extracted signal with OurALG, PCA, and ICA methods, and results were summarized in Table 1.
In Figure 10, lead V1 (in the bottom) could be observed from the 12-lead ECG in AF, along with the OurALG-estimated AA for that episode (at the top). The estimated AA had been scaled by the factor associated with its projection onto lead V1. The visual comparisons did not pro-
vide the quantized results, but it was usually adopted in clinic. The applications of PCA, ICA and OurALG on the eight real ECGs are summarized in Table 1. The main frequency of AA extracted by PCA ranged from 4.7 to 7.5 Hz, and the SC was
50.07% on average. The main frequency extracted by ICA were from 4.7 to 8.4 Hz, and the SC was 51.58% on average. The main frequency of atrial wave extracted by OurALG ranged from 4.7 to 8.4 Hz, and the SC was 54.82% on average. There were no significant differences among
Figure 8 The extracted signal and its PSD using PCA. (a) The extracted signal; (b) the corresponding PSD.

WANG Gang et al. Sci China Ser F-Inf Sci | Oct. 2008 | vol. 51 | no. 10 | 1572-1584 1581
the three algorithms. These results demonstrated that the proposed algorithm was as efficient as the ICA method.
Figure 9 The waves comparison between OurALG (m=1, k=4) and PCA method. The two waves are normalized. The one in dotted line (shown in Figure 7(a)) corresponds to PCA method; the one in dotted line (shown in Figure 8(a)) corresponds to OurALG (m=1, k=4). There exits a 0.8571 correlation between the two extracted signals. It shows the validity of the proposed algorithm.
The above experiments showed that re-
moving the primary and minor components was a key procedure in the new method (shown in Figure 6 and Figure 7). Ref. [9] shows that there were different BSE algo-rithms based on kurtosis, such as normalized kurtosis, generalized kurtosis and fixed point algorithms. In our experiments, the different algorithms yielded similar results.
4.3 Discussion on the efficiency of clinical monitoring
The above theoretic analysis and experiment results verified that the proposed algorithm was as valid as PCA/ICA algorithms. More-over, the proposed one only extracts one sig-nal, and it would help the machine to recog-nize the AF signal. Compared with PCA/ICA methods, it would be more efficient in clinical monitoring.
Related references[1―5] confirmed that there existed an AF signal among the separated sources by PCA and ICA algorithm. Machines cannot recognize the AF wave as people, and they
Figure 10 The eight extracted AF signal (top) from eight pa-tients and lead V1 (bottom).

1582 WANG Gang et al. Sci China Ser F-Inf Sci | Oct. 2008 | vol. 51 | no. 10 | 1572-1584
can only calculate some quantized judgments. Thus, how a machine recognize the AF signal re-quires certain judgments, which include whether the signal has a peak in 3―10 Hz (calculated by SC), whether the kurtosis of the signal is negative (calculated by formula (5)), and so on. How-ever, it is difficult for the machine to recognize the AF signal among the separated sources.
Table 1 Experiment results of PCA, ICA and OurALG
ECGi /Patientj SC of PCA(%) SC of ICA(%) SC of OurALG(%) Fp of PCA(Hz) Fp of ICA(Hz) Fp of OurALG
(Hz) i=1/j=1 56.1546 66.8203 68.5451 7.5000 7.5000 7.5000 i=2/j=2 50.0721 52.8052 51.6102 7.5000 7.5000 7.5000 i=3/j=3 49.2372 45.9032 46.1262 6.5625 6.5625 6.5625 i=4/j=4 48.0118 51.0525 53.4876 5.6250 5.6250 5.6250 i=5/j=5 42.4676 44.7337 45.7678 6.5625 8.4375 8.4375 i=6/j=6 54.1458 55.9363 60.3645 4.6875 4.6875 4.6875 i=7/j=7 48.8267 47.3161 53.5679 4.6875 4.6875 4.6875 i=8/j=8 51.6384 48.0524 59.1223 5.6250 5.6250 5.6250 Average 50.0693 51.5775 54.8240 6.0938 6.3281 6.3281
In ref. [1], the author extracted the AF signal with ICA method, and showed the PSD of five
separated sources with negative kurtosises. The absolute value of the kurtosis of source 1, which was the AF signal, was maximal, and had a peak at 6.34 Hz; source 2, source 3, and source 4 had more than 2 peaks in 3―10 Hz; source 5 had only one peak at 2.93 Hz. We could conclude that the SCs and kurtosises had to be calculated to recognize the AF signal. Thus, it made the machine hard to judge the AF signal from source 5 whose peak was close to 3 Hz.
After the ECG data shown in Figure 4 were decomposed with PCA method, we ordered the components by variance from large to small and their PSDs were shown in Figure 11. The fifth component was the AF signal and Figure 11(e) shows its PSD. We could find that all of them had more than one peak except Figure 11(c) and Figure 11(e), whose SC values were 57.2% and 56.1% separately. Thus, we could not tell which one is the AF signal by only one judgment, i.e., SC. Furthermore, we calculated their kurtosises, i.e., 1.3243 and 0.0676, from which we still could not distinguish the two signals. At last, we showed their waves in Figure 12, from which we could find that the wave of Figure 11(c) contains VA, and thus draw a conclusion that the wave of Figure 11(e) was the AF signal. According to the above analysis, we found that the ma-chine could not tell which one of the separated sources has the AF signal with certainty using PCA method. The only useful judgment may be watching the waves.
The above discussion showed that the kurtosis of extracted signal by the ICA method is nega-tive and the kurtosis by the PCA method may be positive. Moreover, related reference[4] verified that the two methods can both extract the AF signal. Thus, the sign of kurtosis should not be one necessary or sufficient judgment. Related references[2―5] have taken SC as one judgment, and thus SC can be regarded as one necessary judgment. Moreover, our experiment showed that the signal having a peak in 3―10 Hz may contain Gaussian noise (Figure 6) or VA (Figure 11(c)), and SC cannot be one sufficient judgment. Thus, the SC is necessary but not sufficient judgment and can be a simple and useful judgment for machine learning in clinical monitoring. It may help the doctor make a diagnosis, but cannot substitute for doctors.
If the PCA or ICA method was taken in the monitoring system, it would be hard for the ma-chine to judge which one of the separated sources is the AF signal using SC judgment. As for the ECG data in ref. [1], the machine may select the signal whose peak is 2.93 Hz as the AF wave. As

WANG Gang et al. Sci China Ser F-Inf Sci | Oct. 2008 | vol. 51 | no. 10 | 1572-1584 1583
Figure 11 The PSDs of the separated sources by PCA method using the ECG data of patient 1. They were ordered by variance from large to small, and shown from (a) to (l) in turn.
Figure 12 The corresponding waves of Figure 11(c) and (e). (a) The corresponding waves of Figure 11(c); (b) the corre-sponding waves of Figure 11(e).
for the ECG data in Figure 4, the machine may select the wave of Figure 11(c) as the AF signal. Under these circumstances, the doctor would be alarmed but find the wrong AF signal, and thus the patient may be left alone. The modified method can correct the above errors, so it is more

1584 WANG Gang et al. Sci China Ser F-Inf Sci | Oct. 2008 | vol. 51 | no. 10 | 1572-1584
suitable for clinical monitoring.
5 Conclusions
In this paper, we propose an efficient frame based on BSE algorithm to extract the AF signal. The validity and efficiency of the novel method were verified by simulations and real world data. Compared with the PCA and ICA methods, the novel method only extracts one signal, so it has lower computational load, needs less memory, and is more efficient for clinical monitoring.
From the methodological standpoint, we propose another kind of method, i.e., BSE-based al-gorithm, to extract the AA signal except the PCA, ICA, and STC methods. From the engineering standpoint, we propose a new frame used for computed-aid monitoring system.
However, when the patient’s condition is not stationary, such as coughing, or the electrode does not contact the surface body well, the ECG data will not be suitable to extract the AF signal. In our future work, we will work on this problem and do research on a more robust BSE algo-rithm.
1 Rieta J J, Castells F, Sanchez C, et al. Atrial activity extraction for atrial fibrillation analysis using blind source separation.
IEEE Trans Biomed Eng, 2004, 51(7): 1176―1186 2 Castells F, Rieta J J, Millet J, et al. Spatiotemporal blind source separation approach to atrial activity estimation in atrial
tachyarrhythmias. IEEE Trans Biomed Eng, 2005, 52(2): 258―267 3 Castells F, Igual J, Millet J, et al. Atrial activity extraction from atrial fibrillation episodes based on maximum likelihood
source separation. Sig Proc, 2005, 85(3): 523―535 4 Langley P, Rieta J J, Stridh M, et al. Comparison of atrial signal extraction algorithms in 12-lead ECGs with atrial fibrillation.
IEEE Trans Biomed Eng, 2006, 53(2): 343―346 5 Rieta J J. Derivation of atrial surface reentries applying ICA to the standard electrocardiogram of patients in postoperative
atrial fibrillation. Lecture Notes in Computer Sci, 2006, 3889: 478―485 6 Astrom E C M, Sornmo L, Laguna P, et al. Vectorcardiographic loop alignment and the measurement of morphologic
beat-to-beat variability in noisy signals. IEEE Trans Biomed Eng, 2000, 46: 497―506 7 Stridh M, Sörnmo L. Spatiotemporal QRST cancellation techniques for analysis of atrial fibrillation. IEEE Trans Biomed
Eng, 2001, 48(1): 105―111 8 Langley P, Bourke J P, Murray A. Frequency analysis of atrial fibrillation. Comput Cardiol, 2000, 27: 65―68 9 Cichocki A, Amari S. Adaptive Blind Signal and Image Processing. NewYork: Jonh Wiley & Sons, Inc., 2003
10 Ye J M, Zhang X D, Zhu X L. Blind source separation with unknown and dynamically changing number of source signals. Sci China Ser F-Inf Sci, 2006, 49(5): 627―638
11 Hyvärien A, Oja E. Fast and robust fixed-point algorithm for independent component analysis. IEEE Trans Neural Networks, 1999, 10(3): 626―634
12 Wang Gang, Rao Nini, Zhang Zhilin, et al. An extended online fast-ICA algorithm. Lecture Notes in Computer Sci, 2006, 3972: 1109―1114
13 Cichocki A, Thawonmas R, Amari S. Sequential blind signal extraction in order specified by stochastic properties. Elect Lett, 1997, 33(1): 64―65
14 Barros A K, Cichocki A. Extraction of specific signals with temporal structure. Neural Comput, 2001, 13(9): 1995―2000 15 Zhang Z L, Zhang Y. Robust extraction of specific signals with temporal structure. Neurocomputing, 2006, (69): 888―893 16 Zhang Z L, Zhang Y. Extraction of a source signal whose kurtosis value lies in a specific range. Neurocomputing, 2006, (69):
894―899 17 Lu W, Rajapakse J C. Approach and applications of constrained ICA. IEEE Trans Neural Network, 2005, 16(1): 203―212 18 Lu W, Rajapakse J C. ICA with reference. In: Proceedings of International Conference on Third International Conference on
Independent Component Analysis and Blind Source Separation, 2001. 120―125 19 Liu W, Mandic D P, Cichocki A. A class of novel blind source extraction algorithms based on a linear predictor. The 2005
IEEE International Symposium on Circuits and Systems (ISCAS), Kobe, Japan, 2005, 4: 3599―3602

![Dysrhythmias (002) [Read-Only] - Aventri · Atrial AV node Ventricular Classification of Rhythm Abnormalities Supraventricular Atrial origin Atrial fibrillation Atrial flutter Atrial](https://static.fdocuments.net/doc/165x107/5f024baa7e708231d4038f22/dysrhythmias-002-read-only-aventri-atrial-av-node-ventricular-classification.jpg)