Atria Plc Interim Report
22
Atria Plc Interim Report 1 January –31 March 2019
Transcript of Atria Plc Interim Report
Atria Plc Interim Report 1 January –31 March 2019
1/21
Interim report of Atria Plc, 1 January–31 March 2019 26 April 2019, 8:00 am
Atria's net sales and result decreased, profit improvement is sought through efficiency and development measures January–March 2019 - Consolidated net sales totalled EUR 336.4 million (EUR 345.4 million). - Consolidated EBIT was EUR -2.8 million (EUR 3.5 million), or -0.8% (1.0%) of net sales. - The Group's EBIT was particularly affected by higher raw material costs and Easter falling
in the second quarter. - Atria Finland's net sales and EBIT were lower than in the previous year. - Atria Sweden's result was weakened by the costs of the efficiency improvement measures,
EUR 1.5 million – the aim of the efficiency improvement measures is to improve operational efficiency and competitiveness.
- Atria Russia seeks rapid profit improvement and is exploring opportunities for divestments. - The Board of Directors proposes to the Annual General Meeting that a dividend of
EUR 0.40 (EUR 0.50) be paid per share.
Q1 Q1 EUR million 2019 2018 2018 Net sales Atria Finland 241.0 245.6 1,019.2 Atria Sweden 66.6 69.6 287.9 Atria Denmark & Estonia 21.8 23.1 97.4 Atria Russia 15.8 17.3 75.1 Eliminations -8.7 -10.2 -41.1 Net sales, total 336.4 345.4 1,438.5
EBIT Atria Finland 3.9 6.7 36.7 Atria Sweden -4.1 -3.2 -7.1 Atria Denmark & Estonia 0.6 1.3 5.3 Atria Russia -2.2 -0.6 -4.0 Unallocated -1.0 -0.7 -2.7 EBIT, total -2.8 3.5 28.2 EBIT, % -0.8% 1.0% 2.0%
Profit before taxes -3.7 1.2 22.3
Earnings per share, EUR -0.15 0.00 0.58
2/21
Interim report of Atria Plc, 1 January–31 March 2019 26 April 2019, 8:00 am
Juha Gröhn, CEO “The first quarter is typically the lowest in terms of net sales. In addition, the Easter season is in April this year. Net sales totalled EUR 336 million, a decrease of EUR 9 million from last year. Sales development has been similar in all market areas. Slow sales weakened the result, which was at a loss of EUR 2.8 million. The price increases that came into force at the end of the quarter have improved the product-specific margin level, so profitability will improve as trade increases. Atria's market position has remained stable, even though our sales did not quite reach last year's levels. The cost level of operations did not differ from the normal level except for the EUR 1.5 million cost resulting from the arrangement of operations in Sweden. Demand for poultry in Sweden is growing, and Atria is part of the growth. Investigations and measures concerning the continuation of Russian operations are proceeding as planned. Current activities are being developed with determination, and as a second option, the partial or full divestment of operations is investigated. The market situation for pork has turned strongly demand-driven in March, led by the Chinese market.” January–March 2019 Atria Group’s net sales for January–March amounted to EUR 336.4 million (EUR 345.4 million). EBIT was EUR -2.8 million (EUR 3.5 million). Atria Finland's year-on-year net sales decreased slightly. Atria's net sales in Russia and Denmark were weakened by lower sales to retail. Calculated in local currency, Atria Sweden’s net sales remained unchanged. Group EBIT was brought down by higher meat raw material costs and reduced sales. The falling of the important Easter season in the second quarter weakened the result. Atria Finland's sales structure was weaker than in the previous year. Atria Sweden's EBIT was weakened by the costs of the efficiency improvement measures and the low profitability of the poultry business. Atria Russia's and Atria Denmark & Estonia's EBIT was weighed down by reduced sales to retail. Atria Russia updated its strategy at the beginning of 2019. A key goal is the quick revitalisation of business operations in Russia, which means increasing sales and sales margin as well as turning performance positive. As part of the strategy project, Atria is also looking into possibilities of selling Atria Russia's business operations. At the same time, Atria has investigated the reorganisation of the administrative company structure and the strategic development of the Sibylla fast food operations in all business areas. During the review period, Atria Finland launched an efficiency improvement project at the Nurmo pig cutting plant, which aims to improve the profitability and competitiveness of the plant. The collective redundancy consultation related to the restructuring was completed in February. The restructuring will result in annual savings of approximately EUR 1.5 million, which will be fully realised from the beginning of 2020 onwards. The amount of work in the pig cutting plant will be reduced by about 51 person-years
3/21
Interim report of Atria Plc, 1 January–31 March 2019 26 April 2019, 8:00 am
and will be implemented through internal arrangements and the reduction of fixed-term employment relationships. During the review period, Atria Sweden launched a project in line with its revised strategy, which aims to enhance business operations and improve competitiveness. Related to this plan, Atria has initiated a collective redundancy consultation, which concerns all salaried employees of Atria Sweden. The efficiency improvement project aims to generate annual personnel cost savings of approximately EUR 3 million. The savings would be partly realised towards the end of 2019 and fully from the beginning of 2020. This would mean laying off approximately 40 salaried employees. The cost of the efficiency improvement measures amounted to EUR 1.5 million during the review period. Sustainability Atria Group published a Corporate Responsibility Report in March. The report describes essential themes, goals and results of Atria's corporate responsibility in 2018. Atria Sweden signed the Swedish Food and Drink Industries' Federation's sustainability manifesto and its five responsibility initiatives. The objectives of the initiatives are fully carbon-free production, a 50% reduction in food waste, fully recyclable packaging, water efficiency, and responsible supply chain management. Atria Finland was among the first companies to join the food industry material efficiency commitment, which aims to reduce the environmental impact of food production, distribution and consumption. By joining the commitment, Atria contributes to profitability and the sustainable use of natural resources by improving the material efficiency of its production and by producing solutions that promote material efficiency for consumers. Key indicators EUR million 31.3.19 31.3.18 31.12.18
Shareholders´ equity per share EUR 14.57 14.70 14.69 Interest-bearing liabilities 278.2 247.0 227.2 Equity ratio, % 44.6 % 46.4 % 47.7 % Net gearing, % 65.3 % 56.6 % 52.1 % Gross investments in fixed assets 10.3 12.0 44.5 % of net sales 3.1 % 3.5 % 3.1 % Average FTE 4,430 4,370 4,460
The principles for calculating the indicators are presented at the end of the report. The impact of the IFRS 16 standard is described in the accounting principles for the interim report.
4/21
Interim report of Atria Plc, 1 January–31 March 2019 26 April 2019, 8:00 am
Business development by area, January–March 2019 Atria Finland Q1 Q1 EUR million 2019 2018 2018 Net sales 241.0 245.6 1,019.2 EBIT 3.9 6.7 36.7 EBIT, % 1.6% 2.7% 3.6%
Atria Finland’s net sales for January–March totalled EUR 241.0 million (EUR 245.6 million). The entire Easter season sales are in the second quarter this year, which is reflected in reduced net sales in the first quarter. During the beginning of the year, the sales structure has not been as favourable as a year ago. EBIT amounted to EUR 3.9 million (EUR 6.7 million). EBIT was brought down by increased meat raw material prices. Sales prices increased during the review period. In terms of retail value, the market in the product groups represented by Atria grew by 0.4 per cent in the first quarter. The largest growth was recorded for the poultry food product group, with sales growth of about 6 per cent, and the convenience food product group, with sales growth of about 5 per cent. Atria’s supplier share in retail was 24 per cent. Atria is the market leader in its own brands in the meat, poultry, meat product and convenience food markets (source: Atria). In terms of value, Finland's Food Service market grew approximately three percent in the early part of the year. In the Food Service market, meat sales grew by about 6 per cent and cooking product sales by about 4 per cent. Atria's sales development was slightly higher than the market, and its supplier share of the Food Service market was about 22 per cent (source: Atria). During the review period, Atria Finland launched an efficiency improvement project at the Nurmo pig cutting plant, which aims to improve the profitability and competitiveness of the plant. The collective redundancy consultation related to the restructuring was completed in February. The restructuring will result in annual savings of approximately EUR 1.5 million, which will be fully realised from the beginning of 2020 onwards. The amount of work in the pig cutting plant will be reduced by about 51 person-years and will be implemented through internal arrangements and the reduction of fixed-term employment relationships.
5/21
Interim report of Atria Plc, 1 January–31 March 2019 26 April 2019, 8:00 am
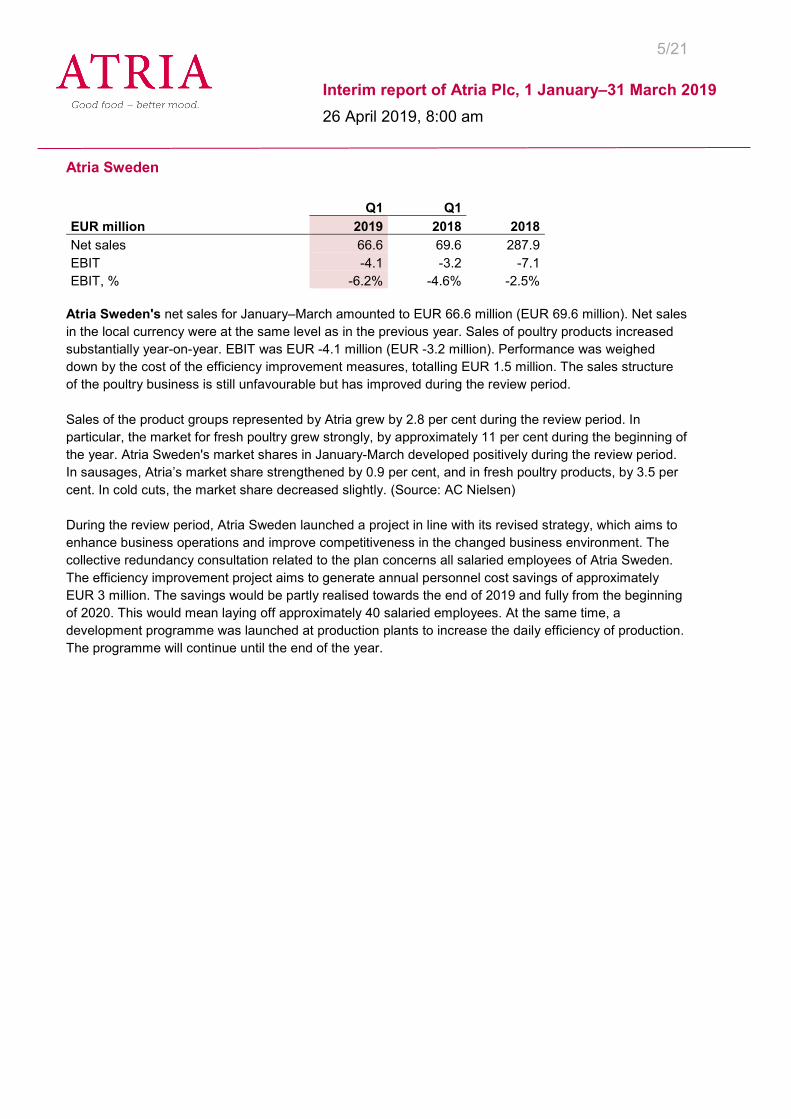
Atria Sweden Q1 Q1 EUR million 2019 2018 2018 Net sales 66.6 69.6 287.9 EBIT -4.1 -3.2 -7.1 EBIT, % -6.2% -4.6% -2.5%
Atria Sweden's net sales for January–March amounted to EUR 66.6 million (EUR 69.6 million). Net sales in the local currency were at the same level as in the previous year. Sales of poultry products increased substantially year-on-year. EBIT was EUR -4.1 million (EUR -3.2 million). Performance was weighed down by the cost of the efficiency improvement measures, totalling EUR 1.5 million. The sales structure of the poultry business is still unfavourable but has improved during the review period. Sales of the product groups represented by Atria grew by 2.8 per cent during the review period. In particular, the market for fresh poultry grew strongly, by approximately 11 per cent during the beginning of the year. Atria Sweden's market shares in January-March developed positively during the review period. In sausages, Atria’s market share strengthened by 0.9 per cent, and in fresh poultry products, by 3.5 per cent. In cold cuts, the market share decreased slightly. (Source: AC Nielsen) During the review period, Atria Sweden launched a project in line with its revised strategy, which aims to enhance business operations and improve competitiveness in the changed business environment. The collective redundancy consultation related to the plan concerns all salaried employees of Atria Sweden. The efficiency improvement project aims to generate annual personnel cost savings of approximately EUR 3 million. The savings would be partly realised towards the end of 2019 and fully from the beginning of 2020. This would mean laying off approximately 40 salaried employees. At the same time, a development programme was launched at production plants to increase the daily efficiency of production. The programme will continue until the end of the year.
6/21
Interim report of Atria Plc, 1 January–31 March 2019 26 April 2019, 8:00 am
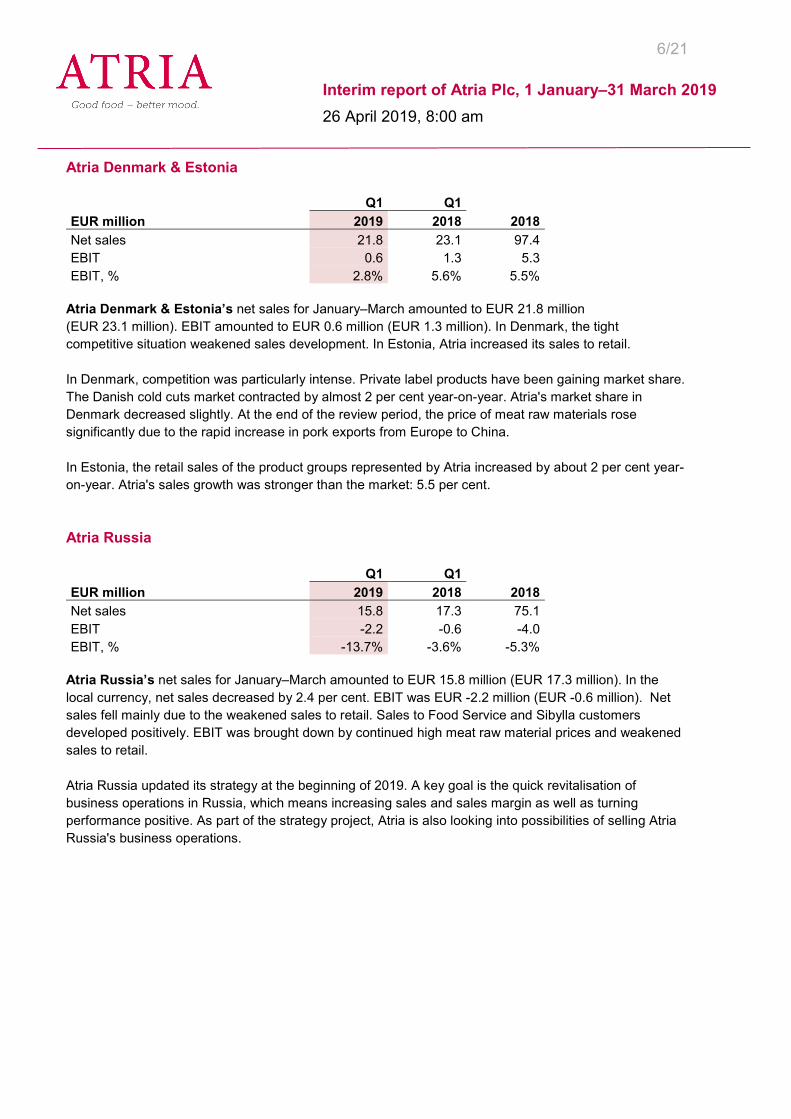
Atria Denmark & Estonia Q1 Q1 EUR million 2019 2018 2018 Net sales 21.8 23.1 97.4 EBIT 0.6 1.3 5.3 EBIT, % 2.8% 5.6% 5.5%
Atria Denmark & Estonia’s net sales for January–March amounted to EUR 21.8 million (EUR 23.1 million). EBIT amounted to EUR 0.6 million (EUR 1.3 million). In Denmark, the tight competitive situation weakened sales development. In Estonia, Atria increased its sales to retail. In Denmark, competition was particularly intense. Private label products have been gaining market share. The Danish cold cuts market contracted by almost 2 per cent year-on-year. Atria's market share in Denmark decreased slightly. At the end of the review period, the price of meat raw materials rose significantly due to the rapid increase in pork exports from Europe to China. In Estonia, the retail sales of the product groups represented by Atria increased by about 2 per cent year-on-year. Atria's sales growth was stronger than the market: 5.5 per cent. Atria Russia Q1 Q1 EUR million 2019 2018 2018 Net sales 15.8 17.3 75.1 EBIT -2.2 -0.6 -4.0 EBIT, % -13.7% -3.6% -5.3%
Atria Russia’s net sales for January–March amounted to EUR 15.8 million (EUR 17.3 million). In the local currency, net sales decreased by 2.4 per cent. EBIT was EUR -2.2 million (EUR -0.6 million). Net sales fell mainly due to the weakened sales to retail. Sales to Food Service and Sibylla customers developed positively. EBIT was brought down by continued high meat raw material prices and weakened sales to retail. Atria Russia updated its strategy at the beginning of 2019. A key goal is the quick revitalisation of business operations in Russia, which means increasing sales and sales margin as well as turning performance positive. As part of the strategy project, Atria is also looking into possibilities of selling Atria Russia's business operations.
7/21
Interim report of Atria Plc, 1 January–31 March 2019 26 April 2019, 8:00 am
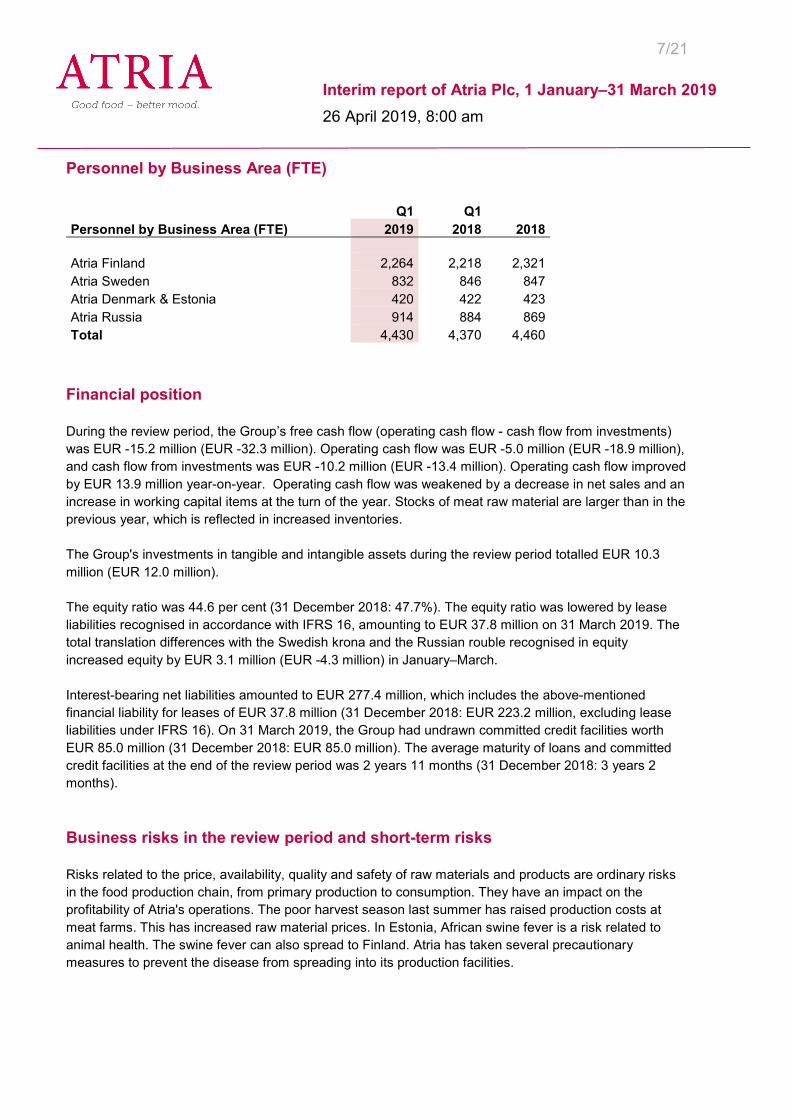
Personnel by Business Area (FTE) Q1 Q1 Personnel by Business Area (FTE) 2019 2018 2018
Atria Finland 2,264 2,218 2,321 Atria Sweden 832 846 847 Atria Denmark & Estonia 420 422 423 Atria Russia 914 884 869 Total 4,430 4,370 4,460
Financial position During the review period, the Group’s free cash flow (operating cash flow - cash flow from investments) was EUR -15.2 million (EUR -32.3 million). Operating cash flow was EUR -5.0 million (EUR -18.9 million), and cash flow from investments was EUR -10.2 million (EUR -13.4 million). Operating cash flow improved by EUR 13.9 million year-on-year. Operating cash flow was weakened by a decrease in net sales and an increase in working capital items at the turn of the year. Stocks of meat raw material are larger than in the previous year, which is reflected in increased inventories. The Group's investments in tangible and intangible assets during the review period totalled EUR 10.3 million (EUR 12.0 million). The equity ratio was 44.6 per cent (31 December 2018: 47.7%). The equity ratio was lowered by lease liabilities recognised in accordance with IFRS 16, amounting to EUR 37.8 million on 31 March 2019. The total translation differences with the Swedish krona and the Russian rouble recognised in equity increased equity by EUR 3.1 million (EUR -4.3 million) in January–March. Interest-bearing net liabilities amounted to EUR 277.4 million, which includes the above-mentioned financial liability for leases of EUR 37.8 million (31 December 2018: EUR 223.2 million, excluding lease liabilities under IFRS 16). On 31 March 2019, the Group had undrawn committed credit facilities worth EUR 85.0 million (31 December 2018: EUR 85.0 million). The average maturity of loans and committed credit facilities at the end of the review period was 2 years 11 months (31 December 2018: 3 years 2 months). Business risks in the review period and short-term risks Risks related to the price, availability, quality and safety of raw materials and products are ordinary risks in the food production chain, from primary production to consumption. They have an impact on the profitability of Atria's operations. The poor harvest season last summer has raised production costs at meat farms. This has increased raw material prices. In Estonia, African swine fever is a risk related to animal health. The swine fever can also spread to Finland. Atria has taken several precautionary measures to prevent the disease from spreading into its production facilities.
8/21
Interim report of Atria Plc, 1 January–31 March 2019 26 April 2019, 8:00 am
The general economic climate, geopolitical tensions, significant changes in exchange rates, the development of the meat and consumer product markets, and the competitive environment cause uncertainties in the development of demand. This is reflected in the implementation of Atria's strategy and the maintaining or improving of the financial results of business areas. During the review period, changes in the value of the Russian rouble and the Swedish krona are visible in the Group’s euro-denominated net sales, result and equity. The availability of skilled and motivated personnel is a risk in terms of strategy implementation and goal achievement. Atria invests in the well-being of its personnel and offers plenty of training opportunities. During the review period, the Atria Way of Leading programme and the Safely Home from Atria occupational safety programme were continued. During the first three months of the year, work has been carried out to prevent various risks that may cause damage, contingency plans have been updated, and risk assessments have been completed. A more detailed description of the risks related to Atria's operations was provided in the annual report. Outlook for the future Consolidated EBIT was EUR 28.2 million in 2018. In 2019, EBIT is expected to be better than in 2018. At comparative exchange rates, net sales for 2019 are expected to grow compared to 2018. Board of Directors' proposal for profit distribution The Board of Directors proposes that a dividend of EUR 0.40 be paid per share for the financial year 2018. Financial calendar 2019 In 2019, Atria Plc will publish the following reports: - half-year report January–June: 18 July 2019 at approximately 8:00 am - interim report January–September on 23 October 2019 at approximately 8:00 am. Financial releases can be viewed on the company’s website at www.atria.com immediately after their release. Annual General Meeting 2019 Atria Plc's Annual General Meeting will be held in Helsinki on 26 April 2019. The agenda includes matters that are to be discussed by the Annual General Meeting in accordance with Article 14 of the Articles of Association.
9/21
Interim report of Atria Plc, 1 January–31 March 2019 26 April 2019, 8:00 am
Shares On 18 March 2019, Atria Plc's Board of Directors transferred a total of 2,572 shares held by the company to the Group's key personnel who belong to the share incentive plan's target group. The right to dividend and other shareholder rights began on the day the shares were entered in the key person's book-entry account. Atria Plc’s share capital consists of a total of 28,267,728 shares, divided into 19,063,747 series A shares and 9,203,981 series KII shares. Each series A share entitles its holder to one (1) vote and each series KII share to ten (10) votes at a General Meeting. Therefore, Atria Plc’s shareholders are entitled to a total of 111,103,557 votes. The company holds 108,740 series A treasury shares. Valid authorisations to purchase or issue shares, grant special rights and make donations The General Meeting authorised the Board of Directors to decide on the acquisition of a maximum of 2,800,000 of the company’s own series A shares, in one or several occasions, with funds belonging to the company’s unrestricted equity, subject to the provisions of the Limited Liability Companies Act regarding the maximum number of treasury shares to be held by the company. The company’s own series A shares may be acquired for use as consideration in any acquisitions or other arrangements relating to the company’s business, to finance investments, as part of the company’s incentive programme, to develop the company’s capital structure, to be otherwise further transferred, to be retained by the company or to be cancelled. The shares shall be acquired in a proportion other than that of the shareholders’ current shareholdings in the company in public trading arranged by Nasdaq Helsinki Ltd at the market price at the time of acquisition. The shares shall be acquired and paid for in accordance with the rules of Nasdaq Helsinki Ltd and Euroclear Finland Ltd. The Board of Directors was authorised to decide on the acquisition of the company’s own shares in all other respects. The authorisation shall supersede the authorisation granted by the Annual General Meeting on 27 April 2017 to the Board of Directors to decide on the acquisition of the company’s own shares and be valid until the closing of the next Annual General Meeting or until 30 June 2019, whichever is first. The General Meeting authorised the Board of Directors to decide, on one or several occasions, on an issue of a maximum of 5,500,000 new series A shares or on the disposal of any series A shares held by the company through a share issue and/or by granting option rights or other special rights entitling to shares as referred to in Chapter 10, Section 1 of the Limited Liability Companies Act. The authorisation may be exercised to finance or execute any acquisitions or other arrangements or investments related to the company’s business, to implement the company’s incentive programme or for other purposes at the Board’s discretion. The Board of Directors is also authorised to decide on all terms and conditions of the share issue and of the granting of special rights as referred to in Chapter 10, Section 1 of the Limited Liability Companies Act. The authorisation thus also includes the right to issue shares in a proportion other than that currently held by the shareholders under the conditions provided by law, the right to issue shares against or without
10/21
Interim report of Atria Plc, 1 January–31 March 2019 26 April 2019, 8:00 am
payment and the right to decide on a share issue to the company itself without payment – subject to the provisions of the Limited Liability Companies Act regarding the maximum number of treasury shares to be held by the company. The authorisation shall supersede the share issue authorisation granted by the Annual General Meeting on 27 April 2017 to the Board of Directors and is valid until the closing of the next Annual General Meeting or until 30 June 2019, whichever is first. The General Meeting authorised the Board of Directors to decide on the donation of a maximum of EUR 100,000 to universities or other educational institutions. Corporate governance principles Atria’s corporate governance principles and deviations from the Finnish Corporate Governance Code are published on the company’s website at www.atria.com.
11/21
Interim report of Atria Plc, 1 January–31 March 2019 26 April 2019, 8:00 am
ATRIA GROUP Consolidated income statement
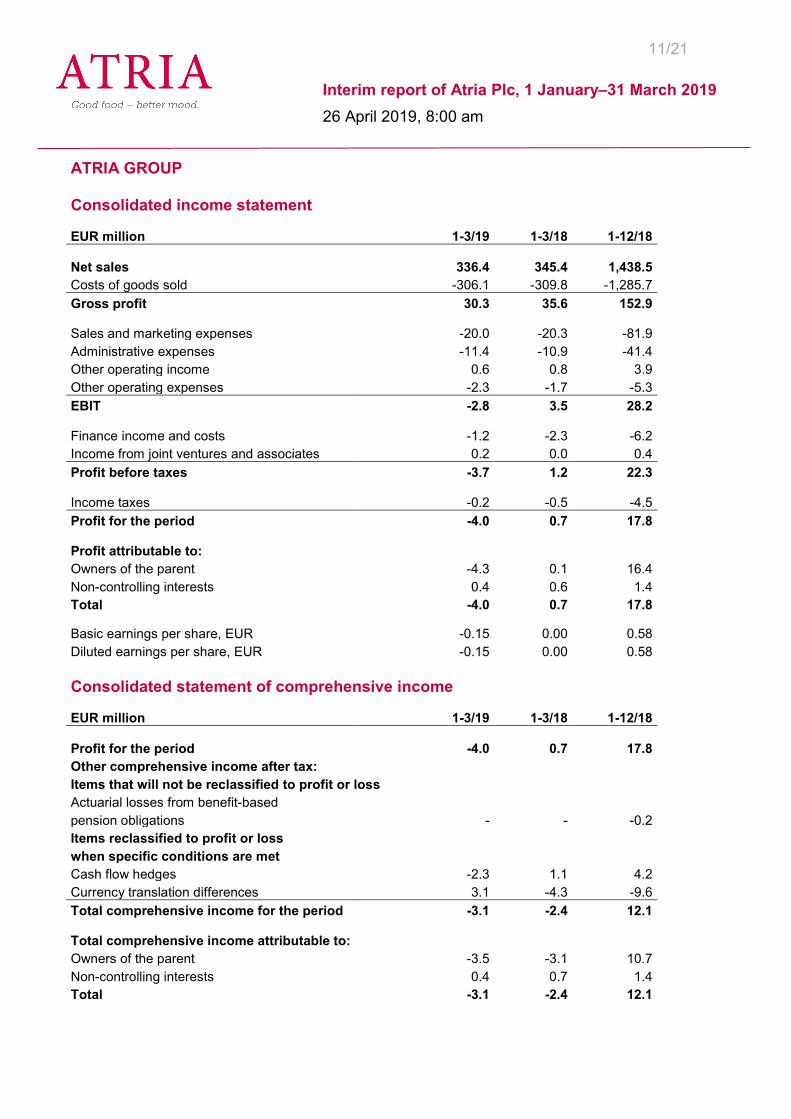
EUR million 1-3/19 1-3/18 1-12/18
Net sales 336.4 345.4 1,438.5 Costs of goods sold -306.1 -309.8 -1,285.7 Gross profit 30.3 35.6 152.9
Sales and marketing expenses -20.0 -20.3 -81.9 Administrative expenses -11.4 -10.9 -41.4 Other operating income 0.6 0.8 3.9 Other operating expenses -2.3 -1.7 -5.3 EBIT -2.8 3.5 28.2
Finance income and costs -1.2 -2.3 -6.2 Income from joint ventures and associates 0.2 0.0 0.4 Profit before taxes -3.7 1.2 22.3
Income taxes -0.2 -0.5 -4.5 Profit for the period -4.0 0.7 17.8
Profit attributable to: Owners of the parent -4.3 0.1 16.4 Non-controlling interests 0.4 0.6 1.4 Total -4.0 0.7 17.8
Basic earnings per share, EUR -0.15 0.00 0.58 Diluted earnings per share, EUR -0.15 0.00 0.58
Consolidated statement of comprehensive income EUR million 1-3/19 1-3/18 1-12/18
Profit for the period -4.0 0.7 17.8 Other comprehensive income after tax: Items that will not be reclassified to profit or loss Actuarial losses from benefit-based pension obligations - - -0.2 Items reclassified to profit or loss when specific conditions are met Cash flow hedges -2.3 1.1 4.2 Currency translation differences 3.1 -4.3 -9.6 Total comprehensive income for the period -3.1 -2.4 12.1
Total comprehensive income attributable to: Owners of the parent -3.5 -3.1 10.7 Non-controlling interests 0.4 0.7 1.4 Total -3.1 -2.4 12.1
12/21
Interim report of Atria Plc, 1 January–31 March 2019 26 April 2019, 8:00 am
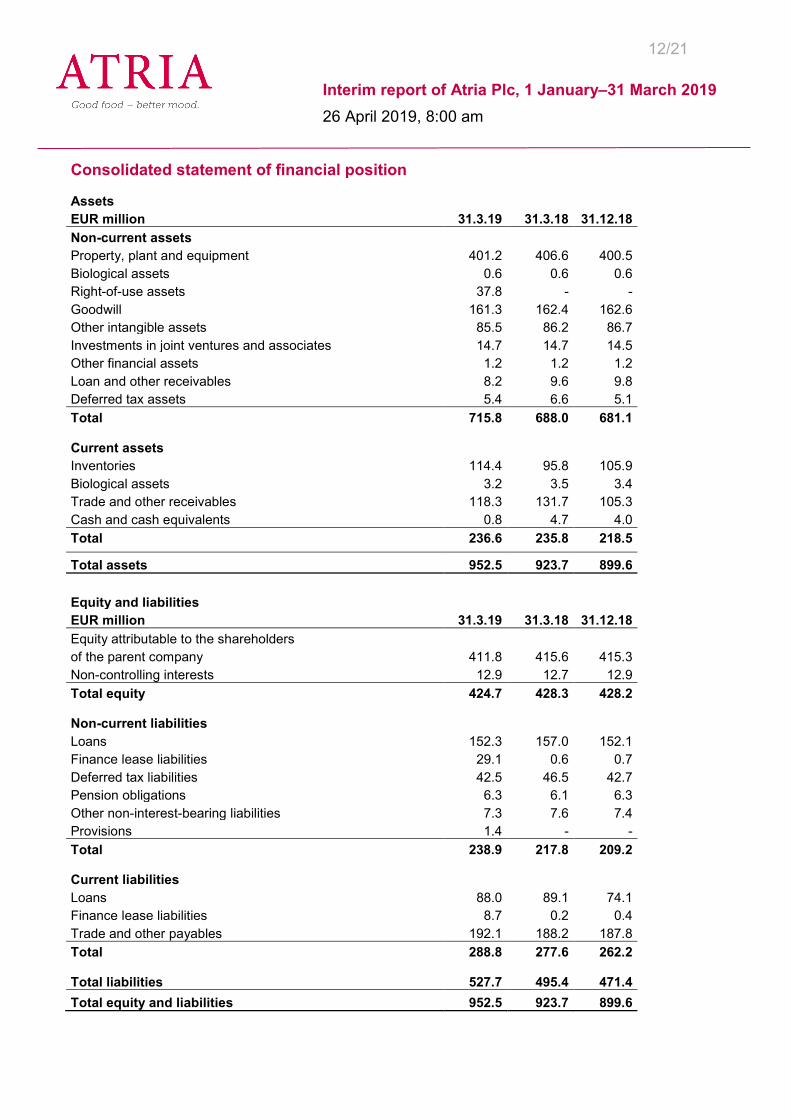
Consolidated statement of financial position Assets EUR million 31.3.19 31.3.18 31.12.18 Non-current assets Property, plant and equipment 401.2 406.6 400.5 Biological assets 0.6 0.6 0.6 Right-of-use assets 37.8 - - Goodwill 161.3 162.4 162.6 Other intangible assets 85.5 86.2 86.7 Investments in joint ventures and associates 14.7 14.7 14.5 Other financial assets 1.2 1.2 1.2 Loan and other receivables 8.2 9.6 9.8 Deferred tax assets 5.4 6.6 5.1 Total 715.8 688.0 681.1
Current assets Inventories 114.4 95.8 105.9 Biological assets 3.2 3.5 3.4 Trade and other receivables 118.3 131.7 105.3 Cash and cash equivalents 0.8 4.7 4.0 Total 236.6 235.8 218.5 Total assets 952.5 923.7 899.6
Equity and liabilities EUR million 31.3.19 31.3.18 31.12.18 Equity attributable to the shareholders of the parent company 411.8 415.6 415.3 Non-controlling interests 12.9 12.7 12.9 Total equity 424.7 428.3 428.2
Non-current liabilities Loans 152.3 157.0 152.1 Finance lease liabilities 29.1 0.6 0.7 Deferred tax liabilities 42.5 46.5 42.7 Pension obligations 6.3 6.1 6.3 Other non-interest-bearing liabilities 7.3 7.6 7.4 Provisions 1.4 - - Total 238.9 217.8 209.2
Current liabilities Loans 88.0 89.1 74.1 Finance lease liabilities 8.7 0.2 0.4 Trade and other payables 192.1 188.2 187.8 Total 288.8 277.6 262.2
Total liabilities 527.7 495.4 471.4 Total equity and liabilities 952.5 923.7 899.6
13/21
Interim report of Atria Plc, 1 January–31 March 2019 26 April 2019, 8:00 am
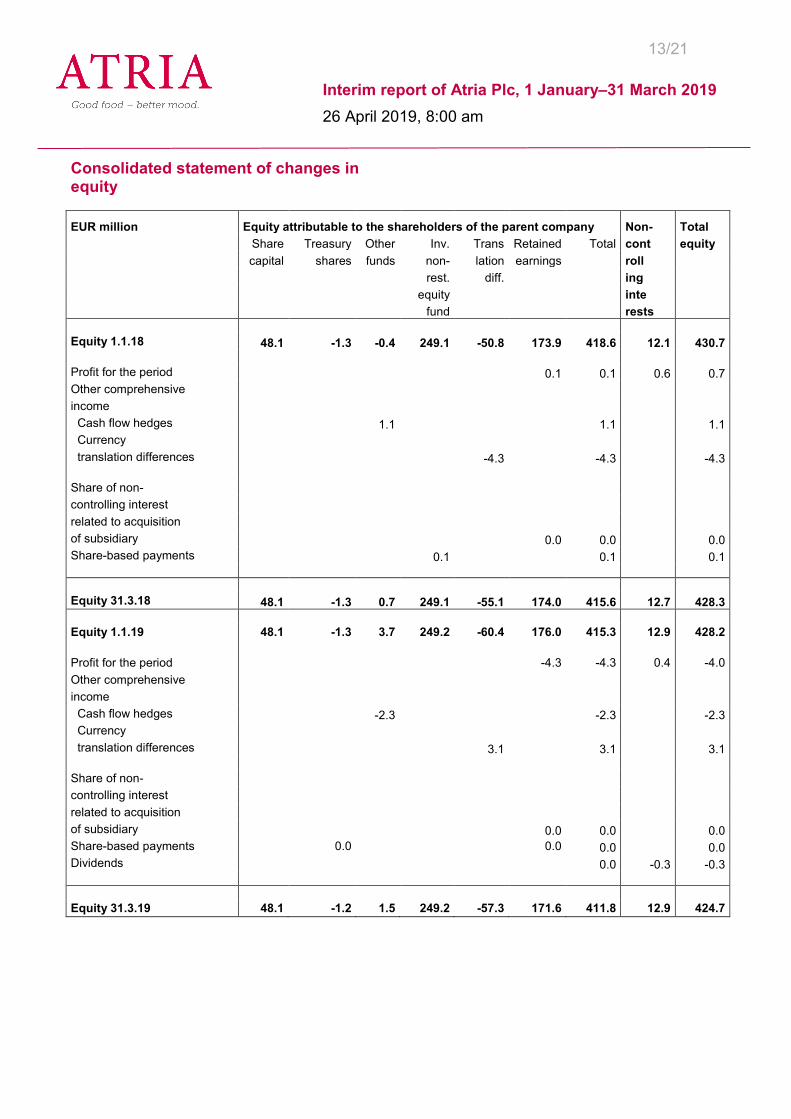
Consolidated statement of changes in equity EUR million Equity attributable to the shareholders of the parent company Non- Total Share Treasury Other Inv. Trans Retained Total cont equity capital shares funds non- lation earnings roll rest. diff. ing equity inte fund rests Equity 1.1.18 48.1 -1.3 -0.4 249.1 -50.8 173.9 418.6 12.1 430.7 Profit for the period 0.1 0.1 0.6 0.7 Other comprehensive income Cash flow hedges 1.1 1.1 1.1 Currency translation differences -4.3 -4.3 -4.3 Share of non- controlling interest related to acquisition of subsidiary 0.0 0.0 0.0 Share-based payments 0.1 0.1 0.1 Equity 31.3.18 48.1 -1.3 0.7 249.1 -55.1 174.0 415.6 12.7 428.3 Equity 1.1.19 48.1 -1.3 3.7 249.2 -60.4 176.0 415.3 12.9 428.2 Profit for the period -4.3 -4.3 0.4 -4.0 Other comprehensive income Cash flow hedges -2.3 -2.3 -2.3 Currency translation differences 3.1 3.1 3.1 Share of non- controlling interest related to acquisition of subsidiary 0.0 0.0 0.0 Share-based payments 0.0 0.0 0.0 0.0 Dividends 0.0 -0.3 -0.3 Equity 31.3.19 48.1 -1.2 1.5 249.2 -57.3 171.6 411.8 12.9 424.7
14/21
Interim report of Atria Plc, 1 January–31 March 2019 26 April 2019, 8:00 am
Consolidated cash flow statement EUR million 1-3/19 1-3/18 1-12/18
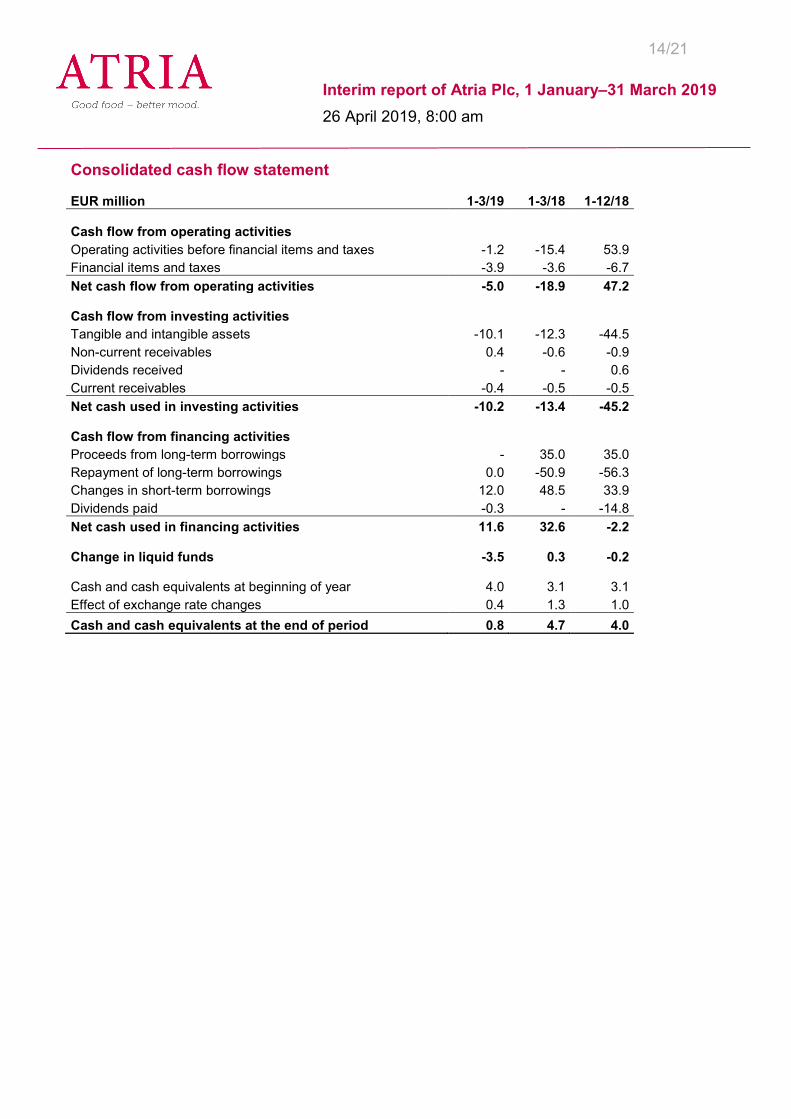
Cash flow from operating activities Operating activities before financial items and taxes -1.2 -15.4 53.9 Financial items and taxes -3.9 -3.6 -6.7 Net cash flow from operating activities -5.0 -18.9 47.2
Cash flow from investing activities Tangible and intangible assets -10.1 -12.3 -44.5 Non-current receivables 0.4 -0.6 -0.9 Dividends received - - 0.6 Current receivables -0.4 -0.5 -0.5 Net cash used in investing activities -10.2 -13.4 -45.2
Cash flow from financing activities Proceeds from long-term borrowings - 35.0 35.0 Repayment of long-term borrowings 0.0 -50.9 -56.3 Changes in short-term borrowings 12.0 48.5 33.9 Dividends paid -0.3 - -14.8 Net cash used in financing activities 11.6 32.6 -2.2
Change in liquid funds -3.5 0.3 -0.2
Cash and cash equivalents at beginning of year 4.0 3.1 3.1 Effect of exchange rate changes 0.4 1.3 1.0 Cash and cash equivalents at the end of period 0.8 4.7 4.0

15/21
Interim report of Atria Plc, 1 January–31 March 2019 26 April 2019, 8:00 am
Interim report notes Interim report accounting principles This interim report has been prepared in accordance with the IAS 34 Interim Financial Reporting standard. Atria has applied the same principles in preparing this interim report as in preparing the 2018 annual financial statements. However, as of 1 January 2019, the Group uses the new or revised IFRS standards and IFRIC interpretations published by the IASB, included in the accounting principles of the annual financial statements 2018. IFRS 16, Leases, was adopted on 1 January 2019. The standard abandons the separation into operating leases and finance leases under IAS 17. According to the standard, lessees should in practice recognise asset items (fixed asset item) and the financial liability related to the lease payment obligation (lease liability) for all their lease agreements. The standard also affects the income statement, because total costs are typically higher during the first half of the term of the lease and lower towards the end. In addition, the rental cost earlier included in operating expenses is replaced by depreciation and interest, which will affect key indicators such as EBITDA. The right-of-use asset item and the lease liability are recognised at the commencement date of the lease. The lease liability is valued at the present value of the unpaid rents at the valuation date. Rental costs include fixed rents and variable rents that depend on changes in the index or price level specified in the agreement. Other variable rents or service charges included in the lease are treated as an expense for the period. Rents are discounted at the internal rate of the lease. If the internal rate is not readily determinable, the company's additional credit interest rate is used. Right-of-use asset items are depreciated according to the length of the leases. If the lease is valid for an indefinite period and there are no known changes, the agreement period is assessed case-by-case. Atria utilises the concession on recognition allowed by the standard and will not apply the standard to short-term leases or contracts where the underlying asset is of low value. A simplified approach was applied to the transition, and the comparable figures for the year preceding adoption have not been adjusted. The application of the standard had no impact on retained earnings. Lease liabilities on 1 January 2019 (EUR million): Finance lease obligations under IAS 17 on 31 December 2018 1.1 Increases: Undiscounted off-balance sheet lease obligations on 31 December 2018 20.4 Other changes *) 18.5 Total increases 38.9 Lease liabilities on 1 January 2019 40.0 *) Includes changes in discounting of the above-mentioned lease obligations, increases arising from the determination of the lease term and the different treatment of options for continuing and terminating leases, as well as other leases that are dealt with in accordance with the new standard.
16/21
Interim report of Atria Plc, 1 January–31 March 2019 26 April 2019, 8:00 am
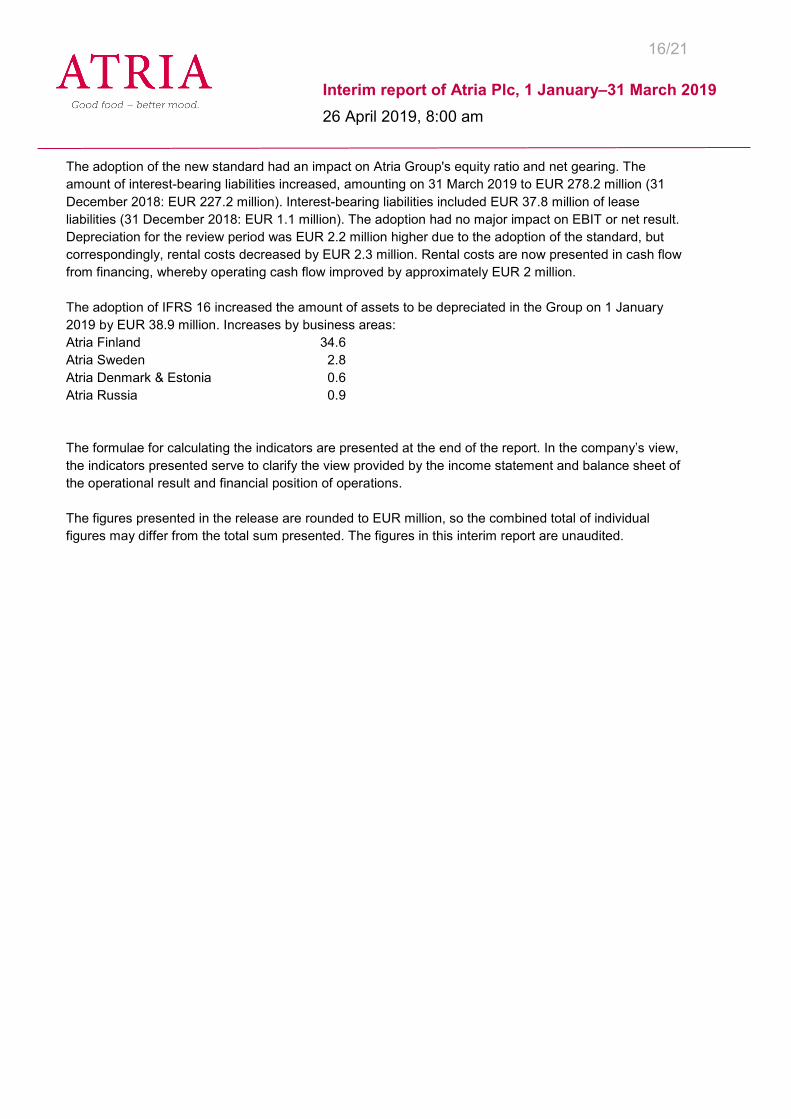
The adoption of the new standard had an impact on Atria Group's equity ratio and net gearing. The amount of interest-bearing liabilities increased, amounting on 31 March 2019 to EUR 278.2 million (31 December 2018: EUR 227.2 million). Interest-bearing liabilities included EUR 37.8 million of lease liabilities (31 December 2018: EUR 1.1 million). The adoption had no major impact on EBIT or net result. Depreciation for the review period was EUR 2.2 million higher due to the adoption of the standard, but correspondingly, rental costs decreased by EUR 2.3 million. Rental costs are now presented in cash flow from financing, whereby operating cash flow improved by approximately EUR 2 million. The adoption of IFRS 16 increased the amount of assets to be depreciated in the Group on 1 January 2019 by EUR 38.9 million. Increases by business areas: Atria Finland 34.6 Atria Sweden 2.8 Atria Denmark & Estonia 0.6 Atria Russia 0.9 The formulae for calculating the indicators are presented at the end of the report. In the company’s view, the indicators presented serve to clarify the view provided by the income statement and balance sheet of the operational result and financial position of operations. The figures presented in the release are rounded to EUR million, so the combined total of individual figures may differ from the total sum presented. The figures in this interim report are unaudited.
17/21
Interim report of Atria Plc, 1 January–31 March 2019 26 April 2019, 8:00 am
Operating segments
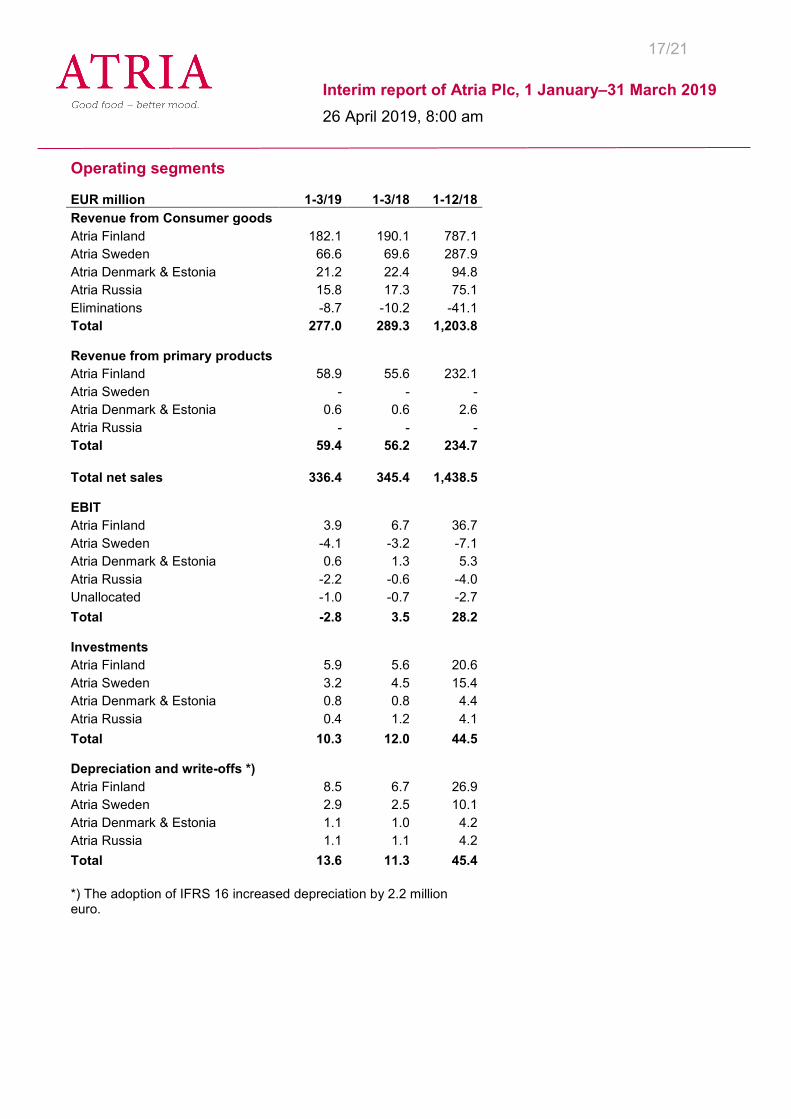
EUR million 1-3/19 1-3/18 1-12/18 Revenue from Consumer goods Atria Finland 182.1 190.1 787.1 Atria Sweden 66.6 69.6 287.9 Atria Denmark & Estonia 21.2 22.4 94.8 Atria Russia 15.8 17.3 75.1 Eliminations -8.7 -10.2 -41.1 Total 277.0 289.3 1,203.8
Revenue from primary products Atria Finland 58.9 55.6 232.1 Atria Sweden - - - Atria Denmark & Estonia 0.6 0.6 2.6 Atria Russia - - - Total 59.4 56.2 234.7
Total net sales 336.4 345.4 1,438.5
EBIT Atria Finland 3.9 6.7 36.7 Atria Sweden -4.1 -3.2 -7.1 Atria Denmark & Estonia 0.6 1.3 5.3 Atria Russia -2.2 -0.6 -4.0 Unallocated -1.0 -0.7 -2.7 Total -2.8 3.5 28.2
Investments Atria Finland 5.9 5.6 20.6 Atria Sweden 3.2 4.5 15.4 Atria Denmark & Estonia 0.8 0.8 4.4 Atria Russia 0.4 1.2 4.1 Total 10.3 12.0 44.5
Depreciation and write-offs *) Atria Finland 8.5 6.7 26.9 Atria Sweden 2.9 2.5 10.1 Atria Denmark & Estonia 1.1 1.0 4.2 Atria Russia 1.1 1.1 4.2 Total 13.6 11.3 45.4
*) The adoption of IFRS 16 increased depreciation by 2.2 million euro.
18/21
Interim report of Atria Plc, 1 January–31 March 2019 26 April 2019, 8:00 am
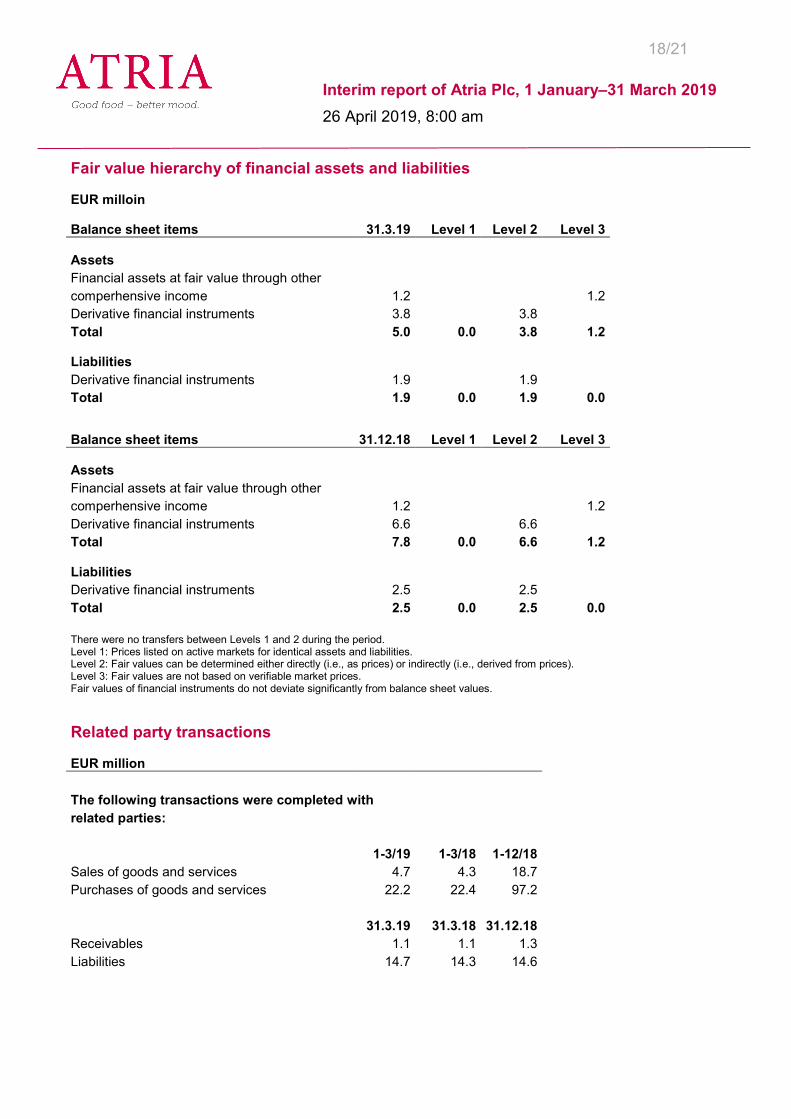
Fair value hierarchy of financial assets and liabilities EUR milloin Balance sheet items 31.3.19 Level 1 Level 2 Level 3
Assets Financial assets at fair value through other comperhensive income 1.2 1.2 Derivative financial instruments 3.8 3.8 Total 5.0 0.0 3.8 1.2
Liabilities Derivative financial instruments 1.9 1.9 Total 1.9 0.0 1.9 0.0
Balance sheet items 31.12.18 Level 1 Level 2 Level 3
Assets Financial assets at fair value through other comperhensive income 1.2 1.2 Derivative financial instruments 6.6 6.6 Total 7.8 0.0 6.6 1.2
Liabilities Derivative financial instruments 2.5 2.5 Total 2.5 0.0 2.5 0.0
There were no transfers between Levels 1 and 2 during the period. Level 1: Prices listed on active markets for identical assets and liabilities. Level 2: Fair values can be determined either directly (i.e., as prices) or indirectly (i.e., derived from prices). Level 3: Fair values are not based on verifiable market prices. Fair values of financial instruments do not deviate significantly from balance sheet values.
Related party transactions EUR million The following transactions were completed with related parties: 1-3/19 1-3/18 1-12/18 Sales of goods and services 4.7 4.3 18.7 Purchases of goods and services 22.2 22.4 97.2 31.3.19 31.3.18 31.12.18 Receivables 1.1 1.1 1.3 Liabilities 14.7 14.3 14.6
19/21
Interim report of Atria Plc, 1 January–31 March 2019 26 April 2019, 8:00 am
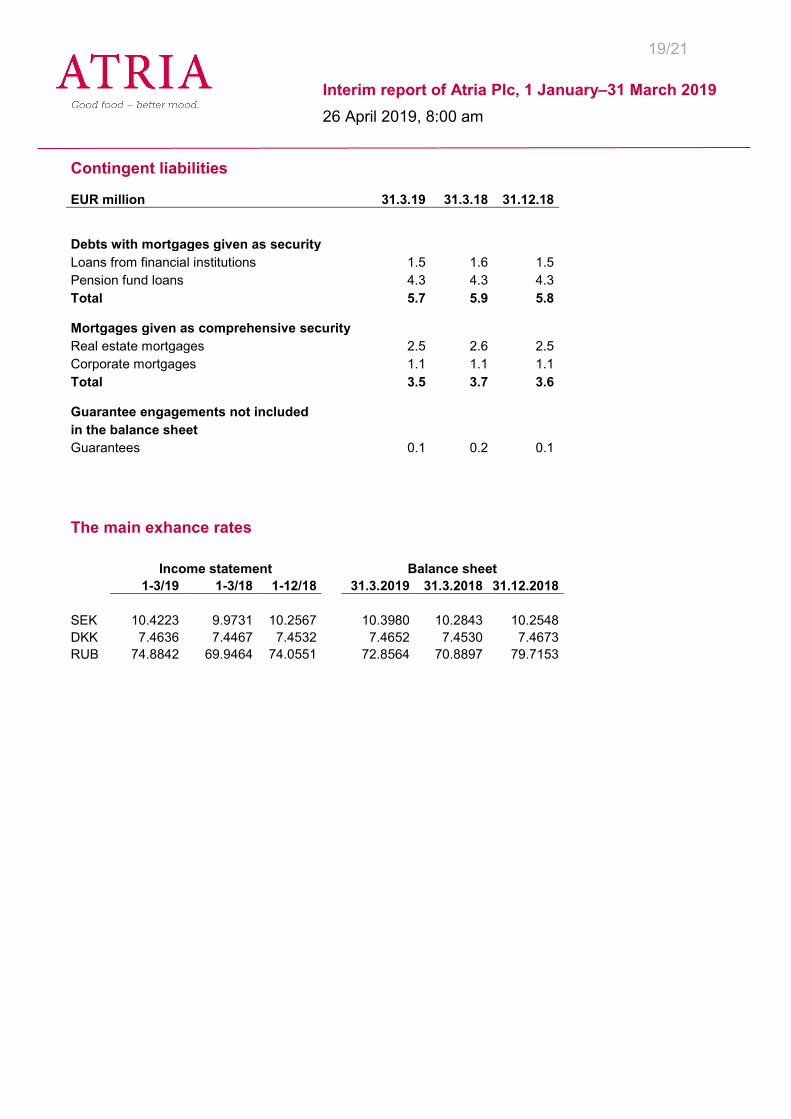
Contingent liabilities EUR million 31.3.19 31.3.18 31.12.18
Debts with mortgages given as security Loans from financial institutions 1.5 1.6 1.5 Pension fund loans 4.3 4.3 4.3 Total 5.7 5.9 5.8
Mortgages given as comprehensive security Real estate mortgages 2.5 2.6 2.5 Corporate mortgages 1.1 1.1 1.1 Total 3.5 3.7 3.6
Guarantee engagements not included in the balance sheet Guarantees 0.1 0.2 0.1
The main exhance rates Income statement Balance sheet
1-3/19 1-3/18 1-12/18 31.3.2019 31.3.2018 31.12.2018
SEK 10.4223 9.9731 10.2567 10.3980 10.2843 10.2548 DKK 7.4636 7.4467 7.4532 7.4652 7.4530 7.4673 RUB 74.8842 69.9464 74.0551 72.8564 70.8897 79.7153
20/21
Interim report of Atria Plc, 1 January–31 March 2019 26 April 2019, 8:00 am
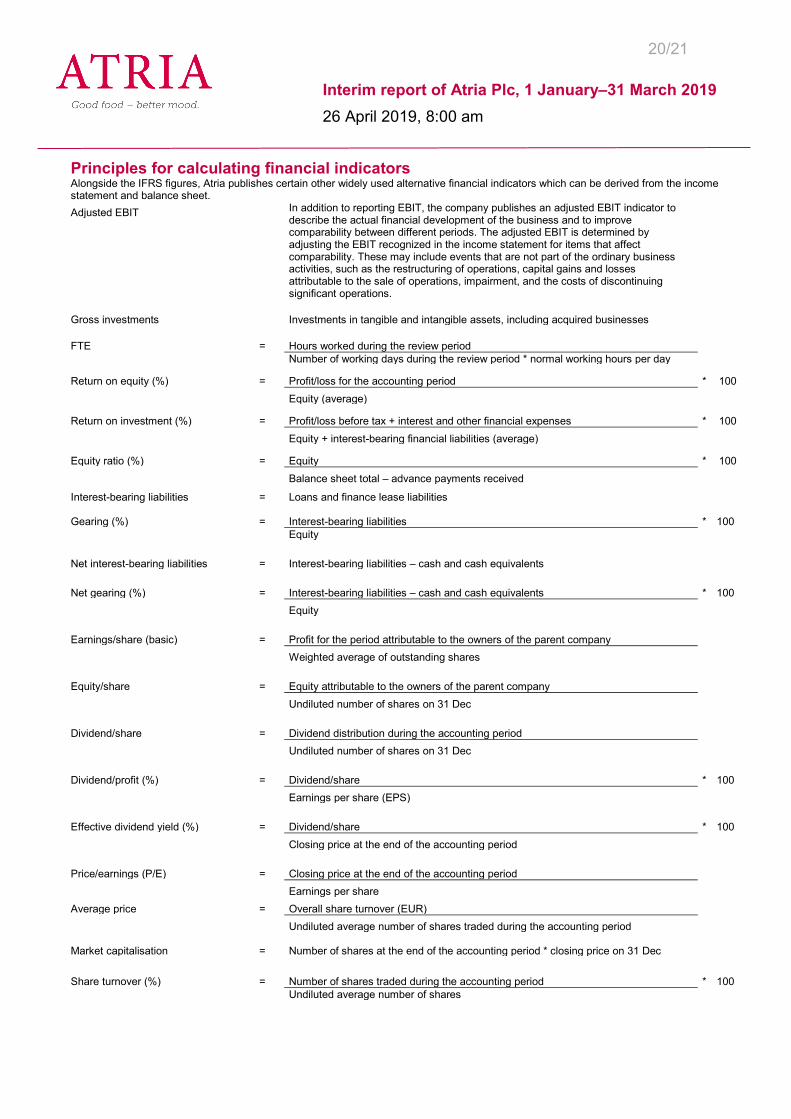
Principles for calculating financial indicators Alongside the IFRS figures, Atria publishes certain other widely used alternative financial indicators which can be derived from the income statement and balance sheet. Adjusted EBIT In addition to reporting EBIT, the company publishes an adjusted EBIT indicator to
describe the actual financial development of the business and to improve comparability between different periods. The adjusted EBIT is determined by adjusting the EBIT recognized in the income statement for items that affect comparability. These may include events that are not part of the ordinary business activities, such as the restructuring of operations, capital gains and losses attributable to the sale of operations, impairment, and the costs of discontinuing significant operations.
Gross investments Investments in tangible and intangible assets, including acquired businesses FTE = Hours worked during the review period Number of working days during the review period * normal working hours per day Return on equity (%) = Profit/loss for the accounting period * 100
Equity (average) Return on investment (%) = Profit/loss before tax + interest and other financial expenses * 100
Equity + interest-bearing financial liabilities (average) Equity ratio (%) = Equity * 100
Balance sheet total – advance payments received Interest-bearing liabilities = Loans and finance lease liabilities Gearing (%) = Interest-bearing liabilities * 100 Equity
Net interest-bearing liabilities = Interest-bearing liabilities – cash and cash equivalents Net gearing (%) = Interest-bearing liabilities – cash and cash equivalents * 100
Equity
Earnings/share (basic) = Profit for the period attributable to the owners of the parent company Weighted average of outstanding shares Equity/share = Equity attributable to the owners of the parent company Undiluted number of shares on 31 Dec Dividend/share = Dividend distribution during the accounting period Undiluted number of shares on 31 Dec Dividend/profit (%) = Dividend/share * 100
Earnings per share (EPS)
Effective dividend yield (%) = Dividend/share * 100
Closing price at the end of the accounting period
Price/earnings (P/E) = Closing price at the end of the accounting period Earnings per share Average price = Overall share turnover (EUR) Undiluted average number of shares traded during the accounting period Market capitalisation = Number of shares at the end of the accounting period * closing price on 31 Dec
Share turnover (%) = Number of shares traded during the accounting period * 100 Undiluted average number of shares
21/21
Interim report of Atria Plc, 1 January–31 March 2019 26 April 2019, 8:00 am
ATRIA PLC Board of Directors For more information, please contact Juha Gröhn, CEO, Atria Plc, tel. +358 400 684 224. DISTRIBUTION Nasdaq Helsinki Ltd Major media www.atria.com The interim report is available on our website at www.atria.com.