Fundamentos de Técnicas espectroscópicas: UV, FTIR y Raman ...

ATR-FTIR spectroscopy and Raman microscopy studies of organosilane diffusion and hydrolysis in PVC films.
EATON, Peter Jonathan.
Available from Sheffield Hallam University Research Archive (SHURA) at:
http://shura.shu.ac.uk/19594/
This document is the author deposited version. You are advised to consult the publisher's version if you wish to cite from it.
Published version
EATON, Peter Jonathan. (1998). ATR-FTIR spectroscopy and Raman microscopy studies of organosilane diffusion and hydrolysis in PVC films. Doctoral, Sheffield Hallam University (United Kingdom)..
Copyright and re-use policy
See http://shura.shu.ac.uk/information.html
Sheffield Hallam University Research Archivehttp://shura.shu.ac.uk

REFERENCE

ProQuest Number: 10694475
All rights reserved
INFORMATION TO ALL USERS The quality of this reproduction is dependent upon the quality of the copy submitted.
In the unlikely event that the author did not send a com ple te manuscript and there are missing pages, these will be noted. Also, if material had to be removed,
a note will indicate the deletion.
uestProQuest 10694475
Published by ProQuest LLC(2017). Copyright of the Dissertation is held by the Author.
All rights reserved.This work is protected against unauthorized copying under Title 17, United States C ode
Microform Edition © ProQuest LLC.
ProQuest LLC.789 East Eisenhower Parkway
P.O. Box 1346 Ann Arbor, Ml 48106- 1346

ATR-FTIR Spectroscopy and Raman Microscopy Studies of
Organosilane Diffusion and Hydrolysis in PVC Films
Peter Jonathan Eaton
A thesis submitted in part fulfilment of the requirements of Sheffield
Hallam University for the degree of Doctor of Philosophy
September 1998
Collaborating Organisation: Pilkington pic

II

Declaration
The work described in this thesis was carried out by the author in the
Materials Research Institute, Sheffield Hallam University, between October
1995 and September 1998. The author declares that this work has not been
submitted for any other degree. The work is original except where
acknowledged by reference.
Author:
( Peter Jonathan Eaton)
Supervisor:i
w( Professor Jack Yarwood)

Acknowledgements
I’d first of all like to thank my supervisors Prof. Jack Yarwood at
Sheffield Hallam University and Dr. Paul Holmes at Pilkington pic., for their
support and advice throughout this project. Thanks are also due to the other
staff at Pilkington who have helped me throughout this work, especially Stuart
Jamieson who carried out the DSC analysis.
Secondly, I’d like to thank my colleagues and friends at Sheffield for
making the three years fun, and even for occasional advice! Thanks to Chris,
Franny, Jason, Sohail, Carine, Delphine, Jeff, Obelix, Asterix, Chris
Constable, Terry M., and Claudia. Last, but not least, extra special thanks
must go to Jane and Pierre, for help and support above and beyond the call of
duty. It is very much appreciated.
My biggest thanks go to all my family, but especially to my parents for
support throughout my academic career. I couldn’t have done it without you.

Abstract
Organosilanes are widely used to bond organic materials such as polymers to inorganic materials in polymer composites. However, the mechanism of adhesion is poorly understood. One postulated mechanism is the interdiffusion of the silane and polymer, along with condensation of the silane to form an interpenetrating polymer network ( IPN ).
The techniques of attenuated total reflectance Fourier transform infrared spectroscopy ( ATR-FTIR ) and Raman confocal microscopy have been used to study the diffusion, hydrolysis and condensation of three organosilanes in silicon / PVC / silane laminates. These processes are thought to contribute to the formation of the IPN, and hence to be vital for adhesion. The organosilanes studied were [3- (amino)propyl]trimethoxysilane, also known as A ll 10, [3-(phenylamino)propyl]trimethoxysilane, known as Y9669, and [3- (mercapto)propyl]triethoxysilane, known as A1891.
ATR-FTIR was shown to be an excellent technique for studying the kinetics of silane diffusion through PVC films. It was shown that at room temperature, no diffusion through unplasticised PVC films occurred. At 70 °C, however, diffusion occurred readily for Y9669 and A 1891. In plasticised PVC films, diffusion was observed for all three silanes at room temperature. It was shown that the diffusion occurred more quickly with higher plasticiser concentrations, and hence lower glass transition temperatures. The kinetics of diffusion was found to fit a dual mode sorption model. Hydrolysis of the silanes was also followed by infrared spectroscopy, and the kinetics of hydrolysis and condensation were shown to be highly dependent upon silane type, the concentration of water, and the presence of an acid catalyst. The hydrolysis of the silanes was found to slow their diffusion through both plasticised and unplasticised PVC films. It was shown that the presence of water in the films caused the hydrolysis of the silanes in situ.
Raman depth profiles were measured of the films before, during and after diffusion. The spatial resolution was shown to be adversely affected by refraction at the air / PVC interface. It was shown that it is possible to deconvolve the confocal response of the microscope from the depth profiles, resulting in greater spatial resolution. Hydrolysis of the silanes was followed in solution by Raman spectroscopy, and it was found that each of the three silanes showed different rates of hydrolysis and condensation. It was shown that it was also possible to follow the kinetics of diffusion by Raman microscopy, and the results agreed well with those shown by ATR-FTIR spectroscopy.

Contents
Chapter 1 : Introduction 1
1.1 : Objectives 1
1.2 : The applications of organosilanes 2
1.3 : The reactions of organosilanes 6
1.4 : The diffusion of organosilanes 26
References 33
Chapter 2 : Spectroscopic Techniques 39
2.1 : Infrared Spectroscopy 39
2.1.1 : Introduction 39
2.1.1.1 : Interaction of infrared light with molecules 39
2.1.1.2 : Dispersive infrared spectrometers 41
2.1.2 : Fourier transform infrared spectroscopy 42
2.1.2.1 : The Michelson Interferometer 42
2.1.2.2 : The advantages of FTIR spectroscopy 46
2.1.2.3 : The disadvantages of FTIR spectroscopy 49
2.1.3 : Attenuated Total Reflection ( ATR ) 51
2.1.3.1 : The advantages of ATR 56
2.1.3.2 : The disadvantages of ATR 57
2.1.4 : Diffusion measurements with ATR - FTIR 57
2.1.4.1 : Models of diffusion 58
2.2 : Raman Spectroscopy 58

2.2.1: Introduction 62
2.2.2 : The Raman effect 63
2.2.3 : Raman microscopy 67
2.2.4 : The Renishaw Ramascope 68
2.2.5 : Confocal Raman microscopy 71
2.2.6 : Advantages of confocal Raman microscopy 80
2.2.7 : Disadvantages of confocal Raman microscopy 81
References 82
Chapter 3 : Infrared diffusion results 85
3.1 : Experimental 85
3.1.1 : Materials 90
3.1.2 : Spectroscopic measurements 91
3.1.3 : Spectra of materials 92
3.2 : Silane underlayer experiments 95
3.3.: Silane overlayer experiments 98
3.3.1: Silane overlayer experiments : heat - induced diffusion 98
3.3.2 : Silane overlayers - plasticised PVC 108
3.3.3 : Silane overlayer experiments : kinetic analysis of data 115
3.3.4 : Silane overlayers - PVC plasticised with polymeric 129plasticiser
3.4 : DSC analysis of plasticised PVC films 135
3.5 : Silane overlayers - hydrolysed silanes 141
References 152

Chapter 4 : Raman depth profile studies of organosilane diffusion
4.1: Experimental
4.1.1 : Materials
4.1.2 : Spectroscopic measurements
4.1.3 : Spectra of materials
4.2 : Silane underlayer experiments
4.3 : Silane overlayer experiments
4.4 : Fourier Deconvolution of Depth Profiles
References
Chapter 5 : Raman studies of organosilane hydrolysis
5.1 : Experimental
5.1.1: Materials
5.1.2 : Spectroscopic Measurements
5.1.3 : Spectra of Materials
5.2 : Y9669 Hydrolysis Results
5.3 : A ll 10 Hydrolysis Results
5.4 : A1891 Hydrolysis Results
References
Chapter 6 : Studies of organosilane diffusion in humidity - controlled films
6.1 : Experimental
6.1.1 : Materials
6.1.2 : Spectroscopic measurements

6.2 : Raman analysis of Y9669 diffusion in PVC exposed to 224 atmospheric conditions
6.2.1 : Infrared analysis of Y9669 diffusion in PVC exposed to 227 atmospheric conditions
6.3 : Raman analysis of Y9669 diffusion in PVC exposed to 229 K2C 0 3(aq) vapour
6.3.1 : Infrared analysis of Y9669 diffusion in PVC exposed to 230 K2C 0 3(aq) vapour
6.4 : Raman analysis of Y9669 diffusion in PVC exposed to 231 NH4Cl(aq) vapour
6.4.1 : Infrared analysis of Y9669 diffusion in PVC exposed to 236 NH4CI(aq) vapour
References 241
Chapter 7 : Conclusions 242
7.1 : ATR-FTIR analysis of the kinetics of diffusion 242
7.2 : Raman depth profile analysis of diffusion 244
7.3 : Raman hydrolysis measurements 245
7.4 : Diffusion in humidity- controlled films 246
7.5 : The interrelation of the results 247
7.6 : Overall conclusions 254
7.7 : Future Work 256
References 258
Conferences Attendeed 259
Chapter 1: Introduction
1.1 Objectives
Organosilanes may be used in a laminate containing poly(vinylchloride) ( PVC )
and glass, to increase the adhesion between the two materials. The main objective of this
project is to measure the factors that affect adhesion in the glass / PVC / organosilane
laminate system. More specifically, the factors which affect diffusion and hydrolysis of the
organosilanes in the laminates are to be determined. It is believed that hydrolysis of the
organosilanes and their diffusion through the PVC film in a laminate are both very
important factors which determine the ultimate adhesion achieved in the laminate.
In order to do this, the primary techniques used are infrared and Raman
spectroscopy; collectively vibrational spectroscopy. These techniques are ideal for the
study because they can give distribution information on the required micrometer scale, as
well as structural and chemical information. This is important because the factors that may
be expected to affect adhesion include the distribution of the organosilanes, and the
chemical structures and reactions of these materials. This project was sponsored by
Pilkington pic, and therefore the materials and methods used are those of interest to
Pilkington. However, as will be shown, the adhesion of minerals such as glass to polymers
with organosilanes is of wide interest, and the results are therefore widely relevant. This
1

chapter discusses the literature on organosilanes, including their uses, reactions, and
distribution in polymer films.
1.2 The uses of organosilanes
Organosilanes, also known simply as silanes, are used in a wide variety of scientific
and commercial applications. These include uses as adhesion promoters ( or coupling
agents )1'3, lubricants4, chromatography substrates5,6, and chemical reagents7. However,
this project centres on their use as coupling agents, so only literature relevant to this
application will be reviewed. Silanes may be used to improve adhesion in systems where
limited adhesion already exists8, to allow adhesion of materials which normally have no
adhesion,9,10, or as a primer to provide a better substrate for another adhesive, such as an
epoxy resin11. The most common use of silane coupling agents is in adhering inorganic
materials such as glass to organic materials such as polymers.
Organosilanes are so called because they consist of a functional organic group and
an alkoxysilane group, usually joined by a short aliphatic chain. The structures of the
silanes used in this project are shown in figure 1.1. The materials shown are [3-
(amino)propyl]trimethoxysilane, henceforth known as A ll 10, [3-
(phenylamino)propyl]trimethoxysilane, known as Y9669, and [3-
(mercapto)propyl]triethoxysilane, known as A1891. Another silane widely studied is 3-
2

(amino)propyl]triethoxysilane ( A1100) which is identical to A1110, but with the methoxy
groups replaced by ethoxy groups.
/ — \4 >NH(CH2)3Si(OMe)3 Y9669
H2N(CH2)3Si(OMe)3 A1110
HS(CH2)3Si(OEt)3 A1891
Figure 1.1: The chemical structures of the organosilanes
It is known that the silane functional groups of these molecules are capable of
reacting with hydroxyl groups on mineral surfaces to form covalent bonds12'13, and that
some organic functional groups may react with functional groups on polymers16,17. This
leads to the 'chemical bonding' model of the action of coupling agents, which was proposed
over thirty years ago18'20. In this model, covalent chemical bonds would be formed
between the silane and inorganic surface, and between the silane and organic surface. The
silane is therefore acting as a bridge, and bonding the dissimilar materials together. This is
illustrated schematically in figure 1.2.
3
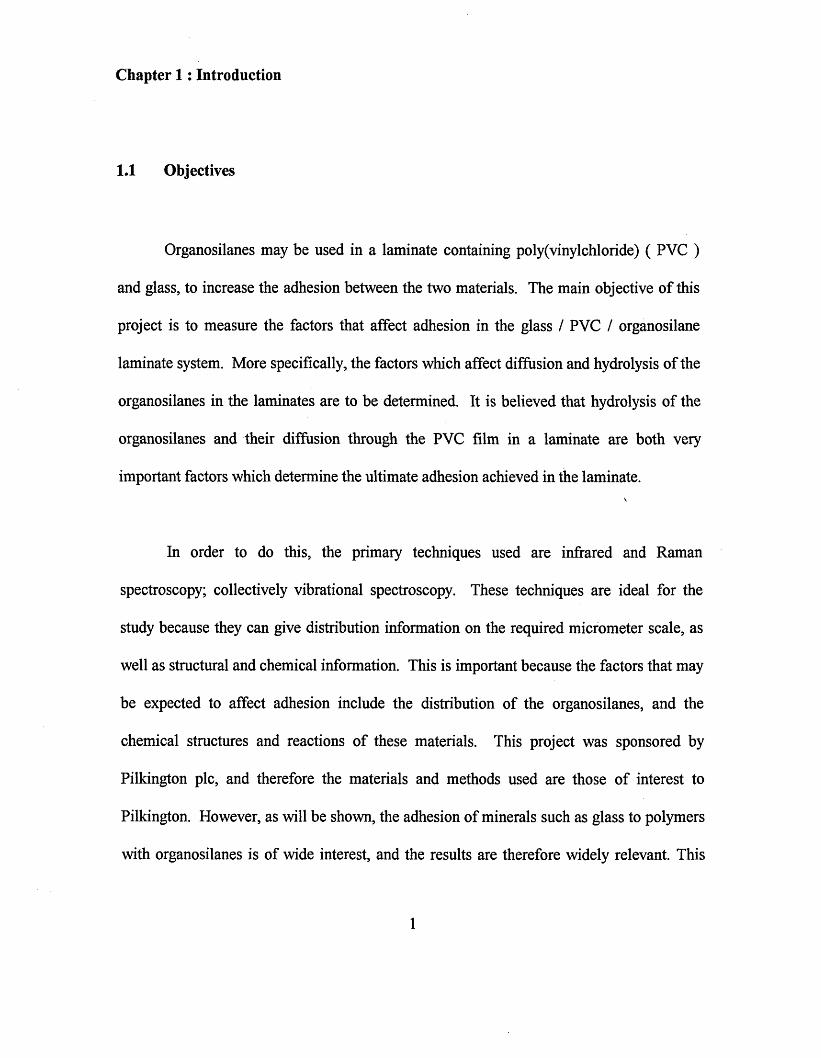
Organic material
Organic functional group
Aliphatic chain
Silane functional group
Inorganic material
Figure 1.2 : Schematic diagram of the chemical bonding model of silane adhesion
There are, however, several pieces of evidence which this chemical bonding model
does not explain. Firstly, it has been noted that in the production of laminated safety glass,
optimum adhesion can be achieved by application of silanes such as A1891 to the glass
prior to laminating*" ’ . Laminated safety glass consists of a sandwich of a flexible polymer
such as plasticised poly(vinyl chloride) ( PVC ) between glass sheets, as shown in figure
1.3. However, if the adhesion were explained wholly by the chemical bonding model, a
monolayer applied to the glass ( as shown in figure 1.2 ) would be the optimal loading, and
this is found not to be the case18 . Instead, it is found that in practice that an amount
equivalent to several hundred monolayers is required for adequate adhesion23,24. Therefore
this chemical bonding theory does not describe optimum adhesion.
4

Polymer Interlayer
Glass sheet
Figure 1.3 : Construction of laminated safety glass
Edwin Plueddemann also studied several systems where covalent bonds between
silane and polymer would not be expected, and found good adhesion . The systems
studied were thermosetting plastics, and it was assumed that an interpenetrating polymer
network ( IPN ) was formed between the silane and the polymer. This occurs when
crosslinked polymers are interdiffused, so that the strength of the joint is the strength of the
bulk materials. The structure of an IPN is compared to interdiffused polymer in
Figure 1.4.
5

Interdiffusion Interpenetrating PolymerNetwork
Figure 1.4 : Schematic representations of interdiffused polymers and an interpenetrating polymer network ( IPN ). Black circles represent crosslinks
In some cases it was assumed that the silane primer acted as a solvent for the unset
polymer, thus leading to interdiffusion to form the IPN, however in some cases this was
thought not to occur due to the low solubility. It should be noted that the occurrence of
interdiffusion, or formation of an IPN is merely a hypothesis, and that no evidence was
presented in this work. Evidence of interdiffusion and IPN formation is discussed in
section 1.2.3.
1.3 : The reactions of organosilanes
The reactions of organosilanes have been widely studied in order to help elucidate
their mechanism of adhesion. One of the most widely studied reactions was the hydrolysis
6

of the alkoxysilanes to the hydroxy derivative. This involved reaction of the silane with
water to give the silanol form of the silane, producing an alcohol. The general mechanism
for this is shown in Figure 1.5.
H2N(CH2)3Si(OMe)3 + H2O -------- ► H2N(CH2)3Si(OH)(OMe)2 + MeOH
Figure 1.5 : Hydrolysis of silane coupling agents
Further reaction can occur to the bi-silanol or tri-silanol form. The hydrolysed
silanes are reactive and condensation is known to occur with other silanol groups to form a
siloxane linkage . Therefore a silane which has been exposed to water may contain a
mixture of unhydrolysed silanes, silanes with one, two or three hydrolysed alkoxy groups,
and condensed silanes that have condensed, and formed siloxane oligomers or polymers26.
The overall reaction of condensation is shown below:
RSiOH + H O S iR ' ► RSiOSiR' + H2O
Figure 1.6 : Condensation of silanols
Condensation may also occur at a silicate surface, with surface silanols as shown in
Figure 1.7.
7
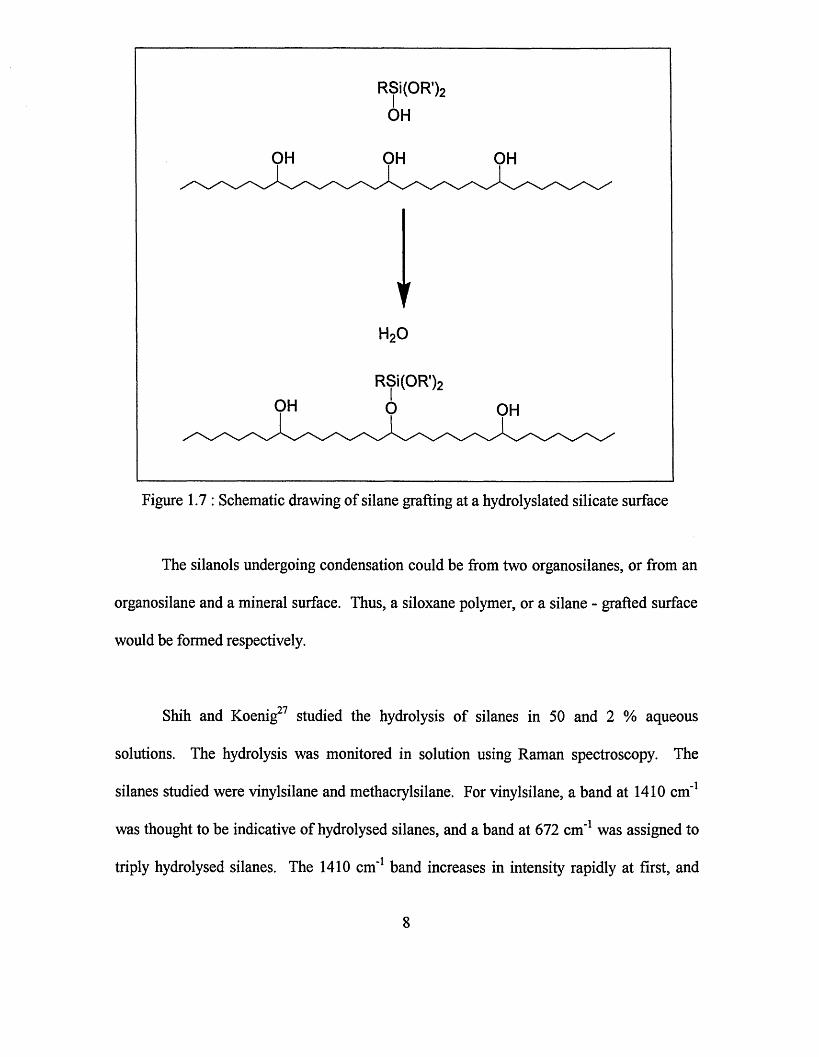
OH OH OH
OH OH
Figure 1.7 : Schematic drawing of silane grafting at a hydrolyslated silicate surface
The silanols undergoing condensation could be from two organosilanes, or from an
organosilane and a mineral surface. Thus, a siloxane polymer, or a silane - grafted surface
would be formed respectively.
Shih and Koenig27 studied the hydrolysis of silanes in 50 and 2 % aqueous
solutions. The hydrolysis was monitored in solution using Raman spectroscopy. The
silanes studied were vinylsilane and methacrylsilane. For vinylsilane, a band at 1410 cm'1
was thought to be indicative of hydrolysed silanes, and a band at 672 cm"1 was assigned to
triply hydrolysed silanes. The 1410 cm'1 band increases in intensity rapidly at first, and
8

much more slowly after about 50 minutes. This shows that after this time, there was veiy
little unhydrolysed silane remaining. The 672 cm'1 band, on the other hand, increased up to
about 50 minutes, but then started to decrease in intensity. This indicated that hydrolysis
continued after the first silanol group was formed, and implies that all three alkoxy groups
would have been hydrolysed eventually. A very similar result was found with the
methacrylsilane, except that the hydrolysis was quicker, the equilibrium point of the 1410
cm'1 band being reached after 30 minutes, and the 710 cm'1 band ( equivalent to the 672
cm'1 band in vinylsilane) started to decrease after this time.
Blum et. al.2% studied the hydrolysis of a number of coupling agents, including
A ll 10 and A1891. Hydrolysis was followed by measurement of methanol protons by lK
NMR. The hydrolysis was followed in acetone - water solutions. For A1110, depending on
the amount of water and silane present, hydrolysis took between 5 and 200 minutes to
reach completion. In some cases, such the hydrolysis of glycidoxypropyltrimethoxysilane,
complete hydrolysis was not observed even after several hours. Although the hydrolysis
was complex, due to the competing reactions between silanes with different degrees of
hydrolysis, the production of methanol was found to fit a first order rate law, so rate
constants could be obtained. It was generally found that the aminosilanes hydrolysed much
faster than those without amino moieties, although similar rates could be achieved with the
non-aminosilanes by adding hydrochloric acid, which acts as a catalyst. The large
difference in hydrolysis rates was probably due to the ability of aminosilanes to self -
catalyse their hydrolysis29. The behaviour of A 1891 was only studied at high pH, but even
9
in this regime, hydrolysis was slower than that of A ll 10 under all conditions. The
adsorption of A1110 onto high surface area silica was also studied. The silane was used in
acetone-water solutions, after hydrolysis was thought to be complete. After reaction with
the silica, the silica was removed, and the concentration of the silane remaining was
measured with FTIR spectroscopy. Adsorption isotherms were obtained in this way. It was
found that above concentrations of around 0.2g. silane per 100 ml. solution, monolayer
coverage was obtained, with each silanol on the silica having one grafted silane.
Leyden and Atwater26 also followed the kinetics of silane hydrolysis, but found
different results. They used ATR-FTIR spectroscopy to follow the hydrolysis of the model
compound trimethylmonomethoxysilane ( TMMS ) in aqueous solutions. This silane was
chosen in order to simplify the kinetics, as just a single methoxy group is available for
hydrolysis. The intensity of the Si-O-C stretching vibration at 1083 cm'1 was used to
determine evolution of methanol and hence the degree of hydrolysis. However, a plot of
ln[TMMS] vs. time did not show a straight line relationship, indicating that first order
kinetics were not obeyed as reported by Blum et. al. and previously by other authors28,30,31.
The hydrolysis was in fact found to be second order overall: first order in TMMS and first
order in water. The rate of condensation was also determined, by measuring the decrease
in the intensity of the Si-OH stretching band at 896 cm'1. The rate of condensation was
found to be orders of magnitude slower than that of hydrolysis, and also second order
overall. Both reactions were also found to be acid - catalysed.
10

Trens et. a l32 also studied adsorption of an aminosilane on silica, although the
silane was A1100 it could be expected that the behaviour would be very similar to that of
A ll 10. MPS ( [3-(methacryloxy)propyl]trimethoxysilane ) was also studied. A1100 was
found to adsorb much quicker than MPS. This could be due to the faster hydrolysis of
Al 100 compared to. MPS. However, the adsorption of Al 100 was also compared to that of
propylamine. Propylamine and A1100 had similar adsorption enthalpies, which is
indicative of a similar bonding mechanism. The removal of adsorbed species by flow of
solvent was also studied. It was found that only 40 % of the Al 100 was irreversibly bound,
although none of the propylamine was. It was presumed that two types of adsorption occur
in A1100, adsorption by a mechanism in common with that of propylamine, i.e. involving
the amine group, and irreversible adsorption, presumably involving the silanol groups. It
was also suggested that it may be possible for molecules to adsorb in both ways
simultaneously. The bond via the amino group was likely to be a hydrogen bond with a
surface silanol, whereas the irreversible bond was probably a siloxane condensation. This
is concordant with work by Johannson et. al.33 who also proposed adsorption of A1100 by
both amino and silanol groups.
Piers and Rochester studied the adsorption of unhydrolysed Al 110 and A l 100 onto
silica in carbontetrachloride solutions13. Solutions of the silanes with a range of
concentrations were allowed to come into equilibrium with silica in solution, and then the
transmission infrared spectra measured. It was found that in the more concentrated silane
solutions, intermolecular hydrogen bonding between silanes on the silica surface occurred
11

much more. This occurred in solutions of both silanes. It appeared that bonding to the
silica via both the silanol and amino moieties was observed. At higher concentrations,
more amino bonding seemed to occur than bonding via the silanol group.
Azzopardi and Arribart34 studied the formation of silane layers at the surface of an
ATR ( Attenuated Total Reflectance ) crystal. ATR is a highly surface sensitive infrared
technique, which is explained in more detail in chapter 2. Because the crystal material was
silicon, with silica at the interface, the in-situ monitoring of mono- or multi-layer formation
was possible. The silanes used were mono- and di-hydrolysable ethyl silanes. These
silanes were able to interact with the silica surface only through their silanol groups. With
the monohydrolysable silane, a simple monolayer was formed. With the dihydrolysable
silane, chains of siloxane were formed at the surface. These were determined to average 10
silane units in length.
Plueddemann used proton NMR to study hydrolysis of silanes in solution35. The
methyl protons of silanols were measured to give an indication of level of hydrolysis. A
wide range of silanes were studied, including aminosilanes substituted at the 3 position (
like A ll 10 ) and aminosilanes substituted in the 1 and 4 positions. It was found the 3-
aminosilanes exhibited unique behaviour. Unlike other silanes which hydrolyse slowly,
and then condense into siloxane dimers and longer siloxane oligomers, 3-aminosilanes
hydrolyse very quickly, but then form stable solutions, which were not observed to
condense. The structure of 3-aminosilanes in water could not be determined, but based on
12

the importance of a 3-substituted amino group, one possible structure was proposed by
Plueddemann. This is shown in Figure 1.8.
H2 h 2
\ / c _ c \/ \ + / CH; p o n h 2
Figure 1.8 : Ring structure of 3-amino silanes proposed by Plueddemann
The ring structure of this structure would explain the stability in water to hydrolysis.
Morrall and Leyden followed the hydrolysis of 3-(amino)propyl]diethoxy-
methylsilane ( APDMS )36. This silane is similar to Al 100, but with only two hydrolysable
groups. Firstly, hydrolysis upon contact with atmospheric water followed by sealing the
sample tube was followed. Infrared spectroscopy was used, monitoring the O-H stretching
band area at 3080 to 3500 cm'1 in neat silane exposed to air. This was found to increase
rapidly, until about 2.5 hours, then decrease to an equilibrium level. The area of the ethoxy
mode at 950 cm'1 decreased on the same timescale, although it never reached zero. A
shoulder at 1050 cm'1 also appeared, indicative of Si-O-Si linkages between hydrolysed
silane molecules. Clearly, partial hydrolysis as well as some condensation to siloxane
oligomers had occurred. Hydrolysis after treatment of an APDMS solution in dry toluene
with water was also followed. In this case, the rate of formation of silanol slowed, but did
not halt on the time-scale of the experiment (24 hours ). A solution of Al 100 was studied

in the same way and gave similar results. Although condensation occurred in neat
APDMS, no siloxane bands were observed in the solution studies for either silane. The
authors also studied the reaction with glass surfaces of silanes deposited from dry toluene
solution. The silanes studied were [3-(cyano)propyl]triethoxysilane ( CNPTS ), A1891,
A1100 and (octyl)triethoxysilane ( C8TS ). The degree of hydrolysis was determined by
solution measurement of ethanol, and the interaction with the substrate measured by the
capacity factor of the resulting material. Because of the dry solvent, any hydrolysis of the
materials is likely to take place after adsorption, by interaction with water adsorbed at the
glass surface. The Al 100 was by far the fastest silane to adsorb onto the glass surface. It
was believed this was because of hydrogen bonding between the silane N-H group and
surface Si-OH groups. This led to the Al 100 also undergoing the fastest hydrolysis. It was
also found that a dried glass greatly slowed the production of ethanol, showing that
hydrolysis was indeed occurring at the glass surface. Even taking into account the
increased adsorption onto the surface by A1100, hydrolysis of this material was quicker,
again showing the catalytic role of the amine group in hydrolysis. In order to determine the
limiting step of hydrolysis in dry solution, an alkyl amine was added to the solution with
the non amine silanes. This would be expected to perform the same catalytic role as the
amine group in A1100. This did not increase the rate of hydrolysis. Therefore in this
system, the rate limiting step was adsorption onto the surface, rather than hydrolysis once
there.
14
Gauthier et. al?1 studied the hydrolysis of a silane similar to A1891,
[mercaptomethyl]dimethylethoxysilane by FTIR. The reaction was followed in aqueous
solution, with HC1 present as a catalyst. This did not allow for observation of the v(Si-OH)
stretching mode of the silanols produced due to interference from water in this spectral
region. A band due to the ethoxy group decreased, when compared to the Si-CH3 band at
833 cm'1. A band also appeared at 886 cm'1 which was assigned to OH stretching of
hydrolysed material. No bands appeared in the region where siloxane bands may occur,
indicating no condensation. This was in contrast to results seen previously which would
lead one to expect the mercaptosilane, once hydrolysed, to continue to react and form
siloxane oligomers. The hydrolysis of both this material and the triethoxy equivalent was
studied by !H NMR. The protons of the ethoxy group and of the evolved ethanol were both
observed. In the case of the monoethoxysilane, the solutions were completely hydrolysed
when the first measurement was made. The triethoxy silane took longer to hydrolyse, on
the time-scale of a few minutes for complete hydrolysis. Hydrolysis was faster with a
higher concentration of HC1 in solution. 29Si NMR showed very similar results, but it was
observed that after a few hours, condensation started to occur.
Ishida and Koenig38 studied E-glass fibres coated with condensed silanes. The
treated fibre was exposed to water, and the FTIR spectrum monitored. The authors noted
the appearance of a band in the infrared due to Si-0 stretching of Si-OH groups, occurring
at 870 cm'1. The effect of this hydrolysis of silanes is to break the siloxane bonds of the
condensed layer. This showed that the condensation of silanes to oligomers is a reversible
15

process. This is technologically an important fact, as it means that upon exposure to water,
composites involving condensed layers of silane will tend to undergo hydrolysis. This
means the siloxane layer is depolymerised, weakening the composite. It was found that the
silane layer was considerably more stable to attack by water when polymerised. The most -
stable was vinylsilane, which could be polymerised via the organofunctional group. It was
also found that insolubility in water increased resistance.
In order to elucidate the effects of moisture on a glass fibre / A1100 / epoxy resin
composite, Arvanitopoulos and Koenig39 studied model composites. These consisted of a
single fibre mounted in epoxy resin. This fibre was used both with and without application
of pre-hydrolysed A1100. The model composites were exposed to water in a humidity
cabinet. The composites were studied by FTIR mapping, by automatically moving the
sample stage in 8pm. steps in a raster pattern, and taking a transmission spectrum at each
point. Because the FTIR spectrometer takes a full range spectrum at each point, the data
can be analysed later to create maps of the intensity of any band in the spectrum. The
v(OH) band of water was used to create maps of relative water concentration. The silane
treated fibres were found to have the least water near the fibre surface. It was thought that
the silane protects the composite against water attack in the interfacial region, thus
prolonging the life of composites where it is applied40. This may be by inducing
hydrophobic character in the glass surface41. It was also found that the epoxy intensity was
maximised at the fibre surface, in the case where silane was not applied. This was thought
to be due to the increased amount of water present, as water may catalyse the curing of the
16

epoxy resin. Composites that had not been exposed to humidity were also analysed. It was
found that the aliphatic polyamine curing agent occurred much less at the fibre surface in
the case of the silane-treated fibres, and also the spectrum of the epoxy resin near the fibre
surface was different when the fibre was silane treated. This was thought to indicate that
the epoxy adopts a different conformation when in contact with silane. It is possible that
the low level of cure of the epoxy resin near the silane-treated fibres explains the strength
increase in composites which use silane. A composite with a low level of cure will be less
rigid, and thus fracture at the fibre interface is less likely. A veiy similar system was
investigated with NMR imaging42. However, the information available from this technique
is somewhat limited compared to FTIR, and few conclusions could be made. It was
observed, however that the silane-treated fibres caused no change in the level of cure of the
epoxy resin. This is not in agreement with the results from FTIR mapping, as discussed
above , so the effect of silane on epoxy resin cure level is still unclear.
Johannson et. al. studied adsorption of vinyl silanes onto glass fibres, followed by
deposition of an epoxy resin layer43. It was found that after rinsing of the resulting material
with tetrahydrofuran ( THF ), substantial amounts of polymer remained on the fibres, but
that the resin on pure glass fibres showed hardly any polymer retention. This was assumed
to occur because copolymerisation occurred between the coupling agent and epoxy resin.
McKnight et. al.AA cast prehydrolysed silane onto germanium or silicon ATR
crystals, and pressed polypropylene films onto these to form model silica / silane /
17

polypropylene laminates. The chemical formula of the silane used, known as CSS, is
shown below.
CH3C6H4CH2NH(CH2)3NH(CH2)3Si(OCH3)3
After deposition, a band at 905 cm'1 assigned to Si-OH stretching showed partial hydrolysis
of the silane. A peak at 115 cm'1 with a shoulder at 1038 cm'1 showed that some
condensation of the silane had occurred. These peaks were present in both the silicon and
germanium experiments, indicating that the condensation was oligomerisation of the silane,
rather than grafting to the surface. When the silane was heated with polypropylene, no new
bands appeared in the spectrum, indicating no chemical interaction. As this system showed
good adhesion, this was believed to be evidence for the diffusional mechanism of adhesion
enhancement, rather than the chemical bonding theory. The band assigned to Si-OH
stretching was monitored as a function of time, after the laminate was exposed to a
reservoir of water. The water was observed to diffuse to the ATR crystal / silane interface,
and then the SiOH band increased as the silane was hydrolysed in situ. This was monitored
at room temperature and at 65 °C. At 65 °C both the water diffusion and the hydrolysis
were faster.
Kurth and Bein45 formed monolayers of A1100 and A189 ( the methoxy derivative
of A1891 ) on oxidised aluminium mirrors. The aim was to form layers with which to
compare reaction on surfaces with reaction in solution. The monolayers were deposited by
vapour phase adsorption, as adsorption from solution was found to produce thick films, or
poor quality monolayers. This was attributed to oligomerisation of silanes in solution. It
18

was found that A1100 adsorbed giving a thick film. However, the large part could be
removed by evacuation, and it was assumed that this part was physisorbed, whereas the
remainder was a chemisorbed monolayer. This layer was proved to be a monolayer by
ellipsometry and the use of a quartz crystal micobalance. _In The caseofA 189, the .entire_____
film could be removed by evacuation, therefore no chemisorbed silane was deposited.
However, if the A189 was deposited from aqueous solution, i.e. prehydrolysed, monolayers
could be formed reproducibly. The films were measured by reflection-absorption infrared
spectroscopy ( RAIRS ). This technique is very sensitive to thin layers, and can also give
some information on the orientation of the layers. The spectra of A189 showed an Si-O-Si
mode at 1114 cm'1 indicating condensation between the silanes, as well as a shoulder at
1960 cm'1 characteristic of -OCH3 groups. This indicates that there was both partial
hydrolysis, and condensation in the monolayer. The RAIRS spectra also indicated that the
alkyl chain stands proud of the surface, which was corroborated by the ellipsometric
measurements of the layer thickness, which gave a thickness of 9 ± 1 A. In the case of
A1100, the thickness was 7 ± 1 A, again corresponding to a monolayer perpendicular to the
surface. The RAIRS spectra also indicated chains perpendicular to the surface, and the
products of partial condensation and unhydrolysed silanes were again seen.
Boerio et. al.Ae also used RAIRS to study silanes deposited onto metal mirrors. The
silane studied was A1100, and the substrates were polished iron mirrors. Films were
deposited from aqueous solution, and air dried. The films were found to be highly
hydrolysed. When dipped from the natural pH of the aqueous solutions, bands at 1480 cm*1
19

and 1550 cm'1 were observed, and assigned to the 8(NH2) mode of the amino group. A
band at 1105 cm'1 from Si-O-Si groups in siloxane oligomers was observed. No ethoxy
band at 2970 cm'1 was observed, indicating total hydrolysis of the ethoxy groups. The
structure proposedTor the aminosilanes in theiilms is hown below:___________________
O CH2“ CH2X. + / cH 2o o—H — NH2
This structure represents a very strongly hydrogen bonded internal chelate form of the
silane. This was proposed because it was observed that upon exposure to water and mildly
acidic conditions, the band at 1550 cm'1 shifts to 1585 cm'1 and the band at 1480 cm'1
disappears. This was assigned to disruption of the strong hydrogen bonding, and a
reversion to a standard hydrogen bonding structure. When deposited from a higher pH (9.5
), the 5(NH2) band frequency was as found in free amino groups, at 1600 cm'1, i.e. there
was little or no hydrogen bonding. Films formed at pH 12 showed amine bands at 1580
cm'1 and 1488 cm'1, which were assigned to NH3+ deformation modes, indicating complete
proton transfer from silanol to amine. In all cases, oligomerisation had occurred in the
films.
Naviroj et. al.A1 also found the structure of adsorbed A1100 on silica to depend
critically on the pH of the depositing solution. It was also found that from the same
20

concentration solution, more silane would be applied from pH 10.6 solutions than from
either pH 9 or pH 12 solutions. Two other silanes, namely [3-
(methacyloxy)propyl]trimethoxysilane and (vinyl)triethoxysilane were also studied. In the
case of these silanes, no pH dependence was shown by the films. Clearly, the pH of the
depositing solution can strongly influence the structure of the aminosilane films.
De Haan48 et. al. studied the adsorption of organosilanes onto silica under dry
conditions. The silanes studied were A1100 and MPS ( [3-
(methacryloxy)propyl]trimethoxysilane ). The silica had been dried at 100 °C and the
silanes were boiled with the silica under an argon atmosphere. The transmission infrared
spectra were then examined to determine the type of bonding present. After the boiling
under argon, some unhydrolysed groups remained. Around 40% of the silanes existed as
the species shown below:
R—Si(0Et)2- 0 —S i^ -
That is, the silane has one condensed bond to the silica, the other bonds remaining
unhydrolysed. 20% of the silanes had two bonds to silica with the remaining bond
unhydrolysed, and 35 % had two bonds to silica, with the remaining bond hydrolysed.
Other structures, such as silanes polymerised at the surface make up the final 5% of silanes.
After the silane-treated silica was heated at 80 °C for 30 minutes, more tri-dentate, and less
mono-dentate bonding was present. In another experiment, the same conditions were used,
21

but some water was included in the boiling mixture. In this case, the silanes reacted more
with each other than with the silica.
______ Vrancken et. al.A9 studied the reaction of silica gel with A1100 in dry toluene
solution. Using a combination of 29Si NMR, FTIR photoacoustic spectroscopy ( FTIR-PAS
) and diffuse reflectance infrared Fourier transform spectroscopy ( DRIFTS ), it was
possible to distinguish between three types of surface silanol on the silica. These are
shown schematically in Figure 1.9.
Geminal Single Single Bridged
HO OH----------- V -----------
P \✓ \
✓ \/ \
iiiXo
o
CO—o
------/
\
o o
X:11
OH------ OH
------------- -S i--------S i--------------
0 1 0 1 0 / 0 0 \
/ i ;i i i i
Figure 1.9 : Silica surface silanols observed by Vrancken et. al*9
The silica was heat-treated at 473, 672 and 973K under vacuum. The high temperature
treatments had the effect of reducing the amount of bridged silanols. In the case of either a
low concentration of surface silanols, which was achieved by heating at 973K, or low
silane solution concentration, the surface had a low density of silane molecules. In these
instances the silane silanols could be identified and were stable to condensation. At higher
22

loadings, however the silanes polymerised on the surface. It was also observed that the
high temperature - treated silica showed predominantly monodentate bonding to the
silanes, whereas the lower temperature treated materials showed higher co-ordination. This
was presumed to be because in the high temperature treated silica, the chance of two
adjacent surface silanols is much lower.
Chiang et. al. studied the chemical structure of A ll 10 adsorbed onto glass surfaces
from aqueous solutions50. The silane was applied by dipping, followed by curing at 80°C.
Similarly to Boerio et. al*6, it was found that the NH2 deformation mode shifted to 1575
cm'1 upon curing, however it was found that upon further heat treating, the band shifted
back to 1600 cm"1. It was shown that this was unlikely to be due to a hydrogen bond with
water, as the model compound propylamine did not show the same behaviour. Again, it
was suggested that the band was due to an internal hydrogen bond, with partial protonation
of the amine group. When deposited on silica surfaces, it was found that total hydrolysis
occurred, as no SiOEt groups could be detected. It was suggested that the silanes were
bound to the silica surface at both ends of the molecules, and to each other.
Kurth and Bein51 also studied silane films adsorbed on silicon by infrared
spectroscopy. They found that upon continued heating at 75°C, silane films believed to be
oligomeric in nature continued to condense, forming what they called a fully polymerised
film, with no infrared bands due to hydrolysed silane remaining.
23

C9Domingue e t a l studied hydrolysed A1100 applied to silicon wafers, which had
had the outer oxide layer removed. Samples for XPS analysis were spin cast, and then
extensively washed with deionised water. The films thus produced were found to be
approximately 3.5 A thick, in comparison with the thicker films found by Kurth and Bein45.
When examined by XPS, it was found that the silane appeared to have undergone
fragmentation and rearrangement, as the peak due to nitrogen was lost upon washing. It
was proposed that adsorption of the amino group onto the surface occurred, leading to
electron loss and homolytic scission of the N-C bond. This would leave a -C. group to
react further, though the products could not be determined. FTIR spectra were also
obtained, from similar samples. Before washing, thick films were obtained, which
appeared to be similar to the spectra of the neat silane. However after washing, the thin
films showed somewhat different spectra, in that no N-H stretching modes could be seen,
apparently confirming the XPS results. It may be that these are simply too weak to be seen,
however, as the signal to noise ratio from the resulting monolayers is very low. This
rearrangement and loss of nitrogen is a result not seen elsewhere, although the conditions
used here have not been exactly repeated elsewhere in the literature.
Miller and Ishida 53studied the adsorption of [3-
(methacryloxy)propyl]trimethoxysilane onto lead oxide surfaces from aqueous solution..
They used DRIFTS to study the absorption. DRIFTS is a surface sensitive technique used
especially for particulate samples, such as the lead oxide powder used here. At monolayer
coverage, it was found that some bands due to condensed silane occurred at 1120 cm'1 and
24

1040 cm'1. The amount of silane condensed was calculated as 5 %, even though it was
believed that the silane was completely hydrolysed. A band at 965 cm'1 could not be
assigned to the silane, nor the substrate, but was assigned to a condensation of the lead
oxide with the silanol from the silane, i.e. a vibration of the Pb-O-Si group. This result
shows that the silane forms a covalent bond to the lead oxide substrate, which is harder to
show in the case of silicon oxide surfaces, due to the similarity between the silane and
substrate.
Ishida, Chiang and Koenig54 studied the hydrolysis and condensation of A ll 10 in
aqueous methanol solution using Raman spectroscopy. They also studied A1100, [3-
(amino)propyl]methyldiethoxysilane and [3-(amino)propyl]dimethylethoxysilane, i.e.
Al 100 with three, two, and one ethoxy group available for hydrolysis. The Raman spectra
of A ll 10 showed two bands at 615 and 645 cm'1 , assigned to stretching of the Si(OC)3
group. These bands also occurred in the spectra of A1100 at 650 and 619 cm'1. These
bands do not occur for the siloxane-condensed dimer in solution, and are therefore
indicative of silane monomers. In the case of Al 100, at low concentrations, no monomers
were detected by this technique, indicating all A1100 existed as oligomers. It was found
that low solution concentrations led to smaller oligomers. However, no monomers were
seen, except at high concentrations. The model compound [3-
(amino)propyl]dimethylethoxysilane was used to simplify the spectrum, because only one
condensation product can occur, namely the dimer. Upon condensation, the Si(OC)3 band
at 622 cm-1 shifted to 632 cm'1 It was found that upon condensation, a band at 533 cm’1
25

appeared. This could not be seen upon extraction of the dimer from solution, thus leading
the authors to conclude that most molecules existed as monomers.
1.4 : The diffusion of organosilanes
In the paper by Sung et. al55, the diffusion of A1100, the ethoxy derivative of
A ll 10, in the sapphire / polyethylene / A l l00 laminate system was studied. Chemical
reaction between Al 100 and polyethylene was said to be unlikely. Therefore the chemical
bonding model should not be applicable. Despite this, enhanced adhesion was achieved
using A1100. This implies that another mechanism was at work This is likely to involve
some interdiffusion of the silane with the polymer, possibly to form an interpenetrating
network ( IPN ). The location of the silane in the laminate was studied with Scanning
Electron Microscopy coupled with Electron dispersive X-ray analysis ( SEM-EDX ) in
order to determine whether diffusion had occurred. It appeared that a change in silicon
concentration profile did occur, upon changing the time the Al 110 film was allowed to diy.
This implied both that diffusion does occur, and that some reaction of the A1100 upon
drying influenced the diffusional behaviour. This is likely to be a combination of
hydrolysis and condensation, as discussed in section 1.2.2.
In a later paper, Kaul and Sung56 studied laminates consisting of sapphire, A ll 10
and Nylon 6. These showed strong adhesion compared to the polyethylene system. Peel
tests were performed to determine bond strength after exposure to water. The strength after
26

exposure to water ( wet strength ) is an important factor in polymer laminates, one that is
considerably improved by the application of organosilanes1,2. The peel strength without a
silane was found to decrease to 14 % of its initial value after exposure to water for 10 days,
but application of silane meant only 50 % of peel strength was dost. The silane was applied
to the sapphire from aqueous solution, and thus could be expected to be hydrolysed to a
large extent. After application, the silane films were dehydrated before laminating with
polymer. It was found that increasing dehydration decreased peel strength. It was further
found that there was an optimum concentration of silane to apply, implying that there was
an optimum thickness of A ll 10 film required for adhesion. The optimum concentration
correlates to a thickness of around 190 nm. This implies that too much silane can impair
adhesion. It was thought that the optimum thickness of A ll 10 may correlate with an
'optimum interdiffusional thickness'. It was thought that the large increase in bonding
strength of nylon vs. polyethylene laminates may be due to hydrogen bonding of the nylon
with the Al 110, which is unlikely in polyethylene.
In the paper by Nordin et. al.51, the chain length of a silane coupling agent was
varied in glass / silane / SBR ( silane-butadiene rubber ) laminates. The chain length was
varied between n = 4 and n= 30, and the adhesion of the resulting laminate measured by a
180° peel test. It was found that interfacial adhesion energy increased with increasing
chain length. If the bridging model was the sole mechanism of adhesion, this would not be
the case, therefore there is another mechanism at work. The increase in adhesion with
27

chain length could be due to interpenetrating of the silane and polymer layers. It was
suggested that the silanes diffuse into the matrix, and may also cross link with the polymer.
In the paper by Stein et. a/.58, the system of silica filled and unfilled silicone RTV
elastomers, with Al 110 as a coupling agent was studied. In order to assess diffusion of the
silane through the polymer matrix, Secondary Ion Mass Spectroscopy ( SIMS ) was used to
obtain depth profiles of the materials. The silane was used in both deuterated and
undeuterated forms, and was incorporated in the polymer formulation. The depth profiles
were obtained over a range of depths of 3 to 60 pm. No change in elemental composition
was detected, with deuterated or non deuterated silanes, or filled or unfilled compositions.
These results indicate that preferential diffusion to interphase regions does not occur. It
also implies that diffusion to the silica filler does not occur, though it may be that the depth
resolution of the technique, which involves sputtering the sample away, was not sufficient
to determine this.
Chaudhury et. al.59 studied a laminate consisting of PVC films on silane-primed
germanium. The aluminium was treated with a pre-hydrolysed solution of [N-(2-
aminoethyl-3-aminopropyl)trimethoxysilane ( referred to as AEAPS ). The silane films
were estimated to be 150 nm. thick, and partly oligomerised. The PVC was then applied as
a platisol, and contained 47 % plasticiser ( di-isodecyl phthalate ) and 1 % stabiliser as
applied. It was likely that the film contained considerably less plasticiser when the
experiments were carried out, as the film was dried at 175 °C. The PVC film was 2 mm.
28

thick when applied. The drying temperature of the silane film was varied between 25 and
175 °C. The laminate bond strength was measured with a 180° peel test. It was found that
there was an optimum drying temperature for maximum bond strength, at about 50 °C. It
was hypothesised that formation of an IPN was necessary for optimum adhesion in this
system. For this to occur, both interdiffusion of silane and PVC, and polymerisation of the
silanes must be maximised. However too much crosslinking before diffusion may reduce
the penetration of the silane into the polymer layer. Therefore it was proposed that below
50 °C, sufficient crosslinking of the silane does not occur, but that above 50 °C, the level
crosslinking was too high, reducing interdiffusion of the silane and PVC. The laminates
were also studied by XPS ( X-ray photoelectron spectroscopy) depth profile analysis. This
is an elemental surface analysis technique, combined with sputtering of the material to
form depth profiles. This technique is somewhat susceptible to errors from sputtering
artefacts, meaning that the depth profiling results are often qualitative, rather than
quantitative. The laminates studied contained silane layers dried at temperatures of 25 °C
and 175 °C. It was found that the film dried at 25 °C diffused further into the PVC than
that dried at 175 °C. This was presumably due to a higher level of condensation of the
silane when dried at higher temperatures.
Dibenedetto and Scola60 investigated S-glass coated with either A l 110, epoxy resin,
or a mixture of Al 110 and epoxy resin. The silanes were deposited pre-hydrolysed, from
methylethylketone ( MEK) solution. The technique used for analysis was ISS-SIMS ( ion
scattering spectroscopy - secondary ion mass spectroscopy ). This is a surface atomic
29

analysis technique, but can sputter the surface, and so perform depth profile analysis. The
results of the analysis of the silane-coated glass show 3 distinct layers in the silane layer.
These consist of the outer 140 A, which is a hard, highly polymerised silane, a soft
oligomeric layer between 160 and 240 A depth, and finallv anotherTiard polymerised Jayer
from 240 A to the silane-glass interface. A large amount of water was also found at the
glass surface. Therefore, it may be that the change in polymerisation level of the silane
was due to the availability of water; atmospheric water at the surface, and interfacial water
at the glass interface. This was further shown by studying the effect of humidity on the
silane layers; upon exposure to 95 % relative humidity for 2 weeks, the entire film was
highly polymerised. The depth profiling of the laminates coated with a mixture of silane
and epoxy showed very little change in composition with depth, indicating no preferential
diffusion of the silane to either the air or the glass interface.
Hoh et. al.61 followed hydrolysis of A1100 with atmospheric water by FTIR
spectroscopy. The hydrolysis was followed by monitoring the loss of the Si-O-Et stretching
intensity at 960 cm'1. Condensation was also observed as the appearance of the Si-O-Si
modes 1120 cm'1 and 1044 cm'1. It was found that hydrolysis was complete after 7 days.
In order to study the diffusion of epoxy resin, the silane was pre-hydrolysed, mixed with the
un-cured epoxy, and heated in air. The aim was to monitor the extent of cure of the epoxy
resin, which is related to the extent of interaction with the silane, as the aminosilane can act
as a curing agent for the resin. This was presumed to be a measure of the diffusion of the
epoxy resin, because the epoxy must reach the amino groups on the silane in order to be
30

cured. The cure level of the epoxy was determined by measuring the loss of the epoxy
band at 915 cm’1 by transmission FTIR spectroscopy. It was found that higher levels of
A l 100 produced higher levels of cure, as did adding the solvent MEK. The polymer glass
transition temperatures ( T g) of mixtures of both hydrolysed and unhydrolysed silane with
epoxy resin were measured. It was found that in the case of unhydrolysed silane,
increasing levels of silane decreased the polymer Tg. This is not surprising, as the
monomeric or oligomeric silane is a much lower molecular weight material than the epoxy
resin, and thus acts like a plasticiser for the polymer, reducing its chain stiffness. In all
cases, the hydrolysed silane mixtures had higher Tgs than the unhydrolysed mixtures. This
was assigned to the ability of the hydrolysed silane to form siloxane polymer networks
when interdiffused with the epoxy, i.e. formation of an IPN. The trend in variation in Tg
with level of hydrolysed silane in the mixture shows the highest Tg for 40% A1100, with
lower polymer Tgs for both more and less silane in the mixture. This may be due to
competition between the IPN effect and the plasticising effect of the silane.
Gu et. al.61 studied the effect of treatment of the silane film on the adhesion of
copper / Al 100 / epoxy laminates. It was found that there was an optimum concentration
of alcoholic Al 100 solution for greatest adhesion at 1 % by weight. This formed a film of
silane around 1250 A thick. At lower thicknesses, adhesion was considerably lower, but
only slowly decreased as the thickness was increased above this value. It was noted that at
the critical thickness and above, blue patches appeared in the silane layer. Upon
inductively coupled plasma analysis ( I. C. P. ) to determine the elemental composition, it
31

was discovered that these patches contained relatively large amounts of copper ions. It is
possible that the absorption of copper by the silane film is required for good adhesion.
Similar results were found when maintaining the solution concentration, and varying the
time for which the copper substrates were immersed in the.solution. JTJie pH of the treating-
solution was also found to strongly affect the adhesion obtained. Whilst dry strengths were
similar, when the adhesion was tested after boiling the sample in water for 50 hours, the
sample treated at pH 7.2 showed greater adhesion than that treated at pH 10.4, and much
greater than that treated at pH 5.5. It was suggested that the pH of the treating solution
affects the adsorption mechanism of the silane on copper. The effect of variation of the
temperature of drying of the silane film was also studied. It was found that increasing the
temperature from 25 °C to 110 °C improved the adhesion resistance to water, but that
increasing it further to 170 °C decreased the wet adhesion of the laminate. The increase in
adhesion at 110 °C was almost certainly linked with increased condensation of the silane
layer at this temperature, as this was observed in the infrared spectra. At the higher
temperature, the amine band at 1581 cm'1 was replaced by bands at 1605 cm'1 and 1662
cm'1 which were assigned to the C=N stretching mode of an imine formed by oxidation of
the amine. This oxidation of amine coupling agents to the imine form at elevated
temperatures has been previously reported63,64. Finally, the effects of rinsing the silane
layer with alcohol were examined. The rinsed laminates were found to show considerably
less wet adhesion than the unrinsed laminates. It was proposed that this may be because
the weakly bound material that can be removed by rinsing is required for interdiffusion of
the silane with the epoxy.
32

References
1 Plueddemann, E. P., Silane Coupling Agents, 2nd. edition, Plenum Press, New York
( 1990)______________________________ _________________________________
2 Pape, P. G. and Plueddemann, E. P., Journal of Adhesion Science and Technology
Vol. 5, No. 10, p.831 ( 1991 )
3 Pape, P. G., Engineering Plastics Vol. 9, No. 2, p. 109 ( 1996)
4 Owen, M. J. and Williams, D. E., Journal of Adhesion Science and Technology Vol.
5, No. 4, p. 307( 1991 )
5 Kallury, K. M. R., Cheung, M., Ghaemmaghami, V., Krull, U. J. And Thompson,
M., Colloids and Surfaces Vol. 63, No. 1-2, p.l ( 1992)
6 Wikstrom, P., Mandenius, C. F. and Larsson, P. -O., Journal of Chromatography
Vol. 455, p. 105 ( 1988 )
7 Hook, D. J., Vargo, T. G., Gardella, J. A., Litwiler, K. S. and Bright, F. V.,
Langmuir Vol. 7, p.142 (1991 )
8 Helbert, J. H. and Saha, N., Journal of Adhesion Science and Technology Vol. 5,
No. 10, p. 905( 1991 )
9 Koch, P. E. and D. Jay Schenck, Silanes and other Coupling Agents, p. 541, Ed. K.
L. Mittal, VSP ( 1992)
10 Thompson, W. R. and Pemberton, J. E., Chemistry of Materials Vol. 7, p. 130 ( 1995
)
11 Garton, A. Journal of Polymer Science, Polymer Chemistry Edition Vol. 22, p. 1495
( 1984)
33

12 Trens, P. and Denoyal, R. Langmuir Vol. 12, p.2781 ( 1996)
13 Piers, A. S. and Rochester, C. H. Journal of Colloid and Interface Science Vol. 174,
p. 97 (1995 )___________________________________________________________
14 Plueddemann, E. P., Journal of Adhesion Vol. 2, p. 184 ( 1970)
15 De Haan, J. W., Van Den Bogaert, H., Ponjee, J. J. and Van de Ven, L. J. M.,
Journal of Colloid and Interface Science Vol. 110, No. 2, p. 591 ( 1986 )
16 Plueddemann, E. P., Journal of Adhesion Vol. 2, p. 184 ( 1970 )
17 Hearn, M. S., Baird, J. D., Nethsinghe, L. P. and Gilbert, M., Polymer
Communications Vol. 31, p. 194 ( 1990)
18 Sterman, S. and Bradley, H. B., SPE Transactions, October 1961 p.224 (1961 )
19 Plueddemann, E. P., Clark, H. A., Nelson, L. E. and Hoffmann, K. R., Modem
Plastics Vol. 39 ( 1962)
20 Yates, P. W. and Trebilcock, J. W., Proceedings of the 16th. Annual Technical and
Management Conference, Reinforced Plastics Division, S.P.I., Section 8-b (1961)
21 Purvis, M. B. et. al., International Patent No. WO 95/19261 ( 1995 )
22 Beckmann, R. et. al., United States Patent No. 4,277,538 ( 1981 )
23 Schrader, M. E., Lemer, I., D'Oria, F. J, Modem Plastics Vol. 45, p. 195 ( 1967 )
24 Plueddemann, E. P., Journal of Adhesion Science and Technology Vol. 2, No. 3,
p. 179 ( 1988)
25 Plueddemann, E. P., Silane Coupling Agents, Chapter 5,2nd. edition, Plenum Press,
New York ( 1990)
34

26 Leyden, D. E. and Atwater, J. B., Journal of Adhesion Science and Technology Vol.
5, No. 10, p. 815(1991)
27 Shih, P. T. K. and Koenig, J. L., Materials Science and Engineering Vol. 20, p. 137 (
1975)
28 Blum, F. D., Meesiri, W., Kang, H.-J. and Gambogi, J. E. Journal of Adhesion
Science and Technology Vol. 5, No. 6 (1991)
29 Plueddemann, E. P., in Chemically Modified Surfaces, Ed. by Leyden, D. E.,
Gordon and Breach ( 1986)
30 Pohl, E. R and Osterholz, F. D., in Molecular Characterisation of Composite
Interfaces, Ed. by Ishida, H. and Kumar, G., p. 157, Plenum Press, New York (1985
)
31 Savard, S., Blanchard, L. P., Leonare, J. and Prud'homme, R. E., Polymer
Composites Vol. 5, p. 242 ( 1984)
32 Trens, P., Denoyel, R., and Rouquerol, J., Langmuir Vol. 11, No. 2, p. 551 ( 1995 )
33 Johansson, O. K., Stark, F. O., Vogel, G. E. and Fleischmann, R. M., Journal of
Composite Materials Vol. 1, p.278 ( 1967)
34 Azzopardi, M.-J. and Arribart, H., Journal of Adhesion Vol. 46, p. 103 ( 1994)
35 Plueddemann, E. P., Ed. Interfaces in Polymer Matrix Composites, Academic Press,
New York, ( 1974)
36 Morrall, S. W. and Leyden, D. E. in Silanes Surfaces and Interfaces, Ed. by Leyden,
D. E., Gordon and Breach ( 1985 )
35

37
38
39
40
41
42
43
44
45
46
47
48
Gauthier, S. ,Aime, J. P., Bouhacina, T., Attais, A. J., and Desbat, B., Langmuir
Vol. 12, No. 21 ( 1996)
Ishida, H. and Koenig, J. L., Journal of Polymer Science: Polymer Physics Edition,
Vol. 18( 1980)
Arvanitopoulos, C. D. and Koenig, J. L., Applied Spectroscopy Vol. 50, No. 1 (
1996)
Chiang, C. H., and Koenig, J. L., Journal of Polymer Science: Polymer Physics
Edition Vol. 20 ( 1980)
Shang, S. W., Williams, J. W. And Soderholm, K. J. M., Journal of Materials
Science Vol. 29, No. 9, p. 2406 ( 1994)
Arvanitopoulos, C. D. and Koenig, J. L., Journal of Adhesion Vol. 53, p. 15 ( 1995 )
Johansson, O. K., Stark, F. O., Vogel, G. E. and Fleischmann, R. M., Journal of
Composite Materials Vol. 1, p.278 ( 1967)
McKnight, S H. and Gillespie, J. W., Journal of Applied Polymer Science Vol. 64,
part 10, p. 1971 ( 1997)
Kurth, D. G. and Bein, T., Langmuir Vol. 9, No. 11 ( 1993 )
Boerio, F. J., Armogan, L. and Cheng, S. Y., Journal of Colloid and Interface
Science Vol. 73, No. 2 ( 1980)
Naviroj, S., Culler, S. R., Koenig, J. L. and Ishida, H., Journal of Colloid and
Interface Science Vol. 97, No. 2, p.308 ( 1984)
De Haan, J. W., Van Den Bogaert, H., Ponjee, J. J. and Van de Ven, L. J. M.,
Journal of Colloid and Interface Science Vol. 110, No. 2, p. 591 ( 1986)
36

Vrancken, K. C., De Coster, L., Van Der Voort, P., Grobert, P. J. and Vansant, E. F.,
Journal of Colloid and Interface Science Vol. 170, p. 71 ( 1995 )
Chiang, C.-H., Ishida, H. and Koenig, J. L., Journal of Colloid and Interface Science
Vol. 74, No. 2, p. 396( 1980)
Kurth, D. G. and Bein, T., Langmuir Vol. 11, No. 2, p. 578 ( 1995)
Domingue, A., Piyakis, K., Sacher, E., Di Renzo, M., Denommee and Ellis, T. H.,
Journal of Adhesion Vol. 40 ( 1993 )
Miller, J. D. and Ishida, H. in Chemically Modified Surfaces, Ed. by Leyden, D. E.,
Gordon and Breach ( 1986)
Ishida, H ., Chiang, C.-H. and Koenig, J. L., Polymer Vol. 23, p. 251 ( 1982)
Sung, N. H., Kaul, A., Chin I. and Sung, C. S. P. Polymer Engineering and Science
Vol. 22, no. 10 p.637 (1982)
Kaul, A. and Sung, N H., Polymer Engineering and Science Vol. 25, No. 18 p. 1171
( 1985)
Nordin, M., Alloun, A. and Schultz, J., C. R. Academie Science Paris, Vol. 315,
SerieH pp. 293-298, ( 1992)
Stein, J., Valenty, S. J., Smith, G. A., Brezniak, D. V. and Prutzman, L. C.,
Macromolecules Vol. 19 ( 1986)
Chaudhury, M. K., gentle, T. M. and Plueddemann, E. P., Journal of Adhesion
Science and Technology Vol. 1, No. 1, ( 1987 )
Dibenedetto, A. T. and Scola, D. A., Journal of Colloid and Interface Science Vol.

61 Hoh, K.-P., Ishida, H. and Koenig, J. L., Polymer Composites Vol. 9, No. 2 ( 1988)
62 Gu, X. H., Xue, G. and Jiang, B. C. Applied Surface Science Vol. 115 ( 1997)
63 Ondrus, D. J. and Boerio, F. J.,Journal of Colloid and Interface Science Vol. 124.
No. 1, p.349 ( 1988 )
64 Culler, S. R., Ishida, H. and Koenig, J. L., Journal of Colloid and Interface Science
Vol. 109, No. 1, p.l ( 1986)
38

Chapter 2 : Spectroscopic Techniques
2.1: Infrared Spectroscopy
2.1.1: Introduction
Infrared spectroscopy has been used for over a century to determine the chemical
composition of matter. Infrared light occurs between 0.7 and 500 pm. in the
electromagnetic spectrum, between the visible and microwave regions. When infrared
light interacts with the oscillating dipole of a molecule, absorption of light can occur. The
frequencies absorbed depend upon the fundamental frequencies of the vibrations of the
molecules absorbing the light. This is the basis of infrared spectroscopy.
2.1.1.1: Interaction of infrared light with molecules
The oscillating molecule interacting with an incoming quantum of infrared light can
be considered as a quantum mechanical harmonic oscillator. Figure 2.1 shows the allowed
vibrational energy levels and transitions for a diatomic simple harmonic oscillator.
39

-nergy
Internuclear Distance
Figure 2.1 : Energy levels and transitions for a simple harmonic oscillator
It can be seen that due to the quantisation of energy, only certain vibrational energies are
allowed. This leads to the selection rules for the quantum mechanical harmonic oscillator
in infrared.
i. Infrared absorption only occurs when infrared radiation interacts with a molecule
undergoing a change in dipole moment.
ii. Infrared absorption only occurs when the incoming infrared photon has sufficient
energy for the transition to the next allowed vibrational energy state.
i.e. Emfrared — hcVyibration
40

where h = Planck’s constant
c = the speed of light
Vvibration= frequency of the oscillator
____________ EjnfrnrH = energy of the infrared photon ____________________________
iii. According to the harmonic oscillator selection rule, transitions between non -
adjacent energy levels in a system are not allowed.
Spectroscopically, the consequences of these rules are as follows. Rule one means
that only those vibrations that give rise to a dipole moment change may absorb infrared.
Rule two means that each vibration gives rise to discrete infrared absorption; therefore we
can identify a vibration by the frequency of its absorptions. Rule three means that only the
fundamental vibrational transition occurs ( i.e. An = 1 ). In reality, molecular vibrations are
anharmonic. Therefore the An = 2 and An = 3 etc. transitions can occur, but they are much
less likely. In infrared spectroscopy, the An = 2 and An = 3 transitions are known as the
first and second order overtones, and occur with much lower intensity than the fundamental
vibration.
2.1.1.2 : Dispersive infrared spectrometers
The traditional infrared instrument is a dispersive instrument. It is so called
because the light emitted by the infrared source is dispersed into its component
frequencies, which are detected one frequency at a time. A schematic of a dispersive
41

instrument is shown in Figure 2.2. Briefly, it comprises a polychromatic infrared source (
such as a Globar rod ), optics to direct the light through the sample, some form of
dispersive element ( usually a grating or prism ), and a detector.
In f ra red S o u r c e S a m p l e D is p e r s iv eE l e m e n t
D e te c to r
Figure 2.2 : Schematic diagram of dispersive infrared spectrometer
2.1.2 : Fourier transform infrared spectroscopy
Fourier transform infrared spectroscopy ( FTIR spectroscopy ) is an alternative
method of obtaining an infrared spectrum to dispersive spectroscopy. FTIR relies on the
use of a Michelson interferometer
2.1.2.1 : The Michelson Interferometer
A schematic of the Michelson interferometer is shown in Figure 2.3. Light from the
infrared source passes through the interferometer before it passes through the sample, and
is then collected by the detector. At the interferometer, the light strikes a beam splitter
which passes 50% of the light to mirror 1 and 50% of the light to mirror 2. Mirror 1 is a
42

moving mirror, which oscillates back and forth, whereas mirror 2 is stationary. On
reflection from these mirrors, the beam splitter recombines the light which is then guided
on towards the sample.
Mirror 2
Beam Splitter
Infrared Source
Mirror 1
Sample
Detector
u
Figure 2.3 : Schematic diagram of the Michelson interferometer in an FTIR spectrometer
When the mirrors are the same distance from the beam splitter, the light will travel the
same distance to each mirror, so that constructive interference occurs. This point is known
as zero path difference ( ZPD ). However, if the moving mirror is MAX from the ZPD, the
43

light on the moving mirror optical path will travel 1/2 X further than the light reflected
from the stationary mirror, and thus destructive interference will occur. The pattern of
interference obtained is known as an interferogram. Because the source is polychromatic,
the interferogram obtained is the sum of interferograms from all contributing wavelengths.
The detector therefore sees an interferogram as shown in Figure 2.4.
Figure 2.4 : The interferogram as seen by the FTIR detector
To the detector, the appears as a fluctuating intensity in the time domain. In order
to convert this signal back to a spectrum ( intensity in the frequency domain ) a Fourier
transform is used. The intensity of the infrared radiation at the detector can be written as
00 _I(x)= IS(v)Cos(27ivx)dv ( 2 . 1 )
o
where I(x) is the intensity of the signal at the detector
S(v ) is the spectral density amplitude
and v is the frequency ( wavenumber)
44

Because the Fourier Transform must be applied mathematically, the information
that the detector collects must be digitised. This is performed by measuring the intensity of
the signal at certain set distances of mirror travel, called the sampling interval. The
sampling interval is controlled by the frequency of a laser, most commonly a HeNe laser
emitting at 632.8 nm. The amplitude of each frequency element in the spectrum is given
by:
S(v) = Zl(x) cos(27iv)Ax (2.2 )x=0
where Ax is the sampling interval
The path difference, x is the product of the sampling interval, Ax and the number of
samples taken, usually in the range 500 to 10,000. Digitised sampling results in a lower
limit on the wavelengths that can be studied. This is given by the following equation:
Ax ^ minimum ^ 2.3
where Lmimnm is the minimum frequency that may be studied.
This means that the highest frequency that may be studied, v maximum is given by
V maximum 1 /2 Ax ( 2.4 )
This is called the aliasing frequency. If infrared radiation of a frequency higher than the
aliasing frequency is present, then severe distortion of the spectrum occurs. The most
common frequency used to control the sampling interval in FTIR spectrometers is a HeNe
45

laser line at 632.8 nm. Thus, if sampling every two wavelengths, the aliasing frequency is
7960 cm'1. In spectrometers with KBr beam splitters, this does not cause a problem, as the
spectral window of KBr limits the infrared light used to much lower frequencies.
2.1.2.2 : The advantages of FTIR spectroscopy
Clearly, FTIR spectrometers are much more complex than dispersive spectrometers,
and more complex processing of the data obtained is required. However, FTIR
spectroscopy was developed because it shows several advantages over dispersive infrared
spectroscopy.
I ) The Fellgett Advantage
The Fellgett, or multiplex advantage arises because all of the spectral elements are
measured simultaneously. Thus, a spectrum can be obtained very quickly. The number of
spectral elements in a digitised spectrum are given by
(2 .5 )
where N is the number of spectral elements
w is the highest wavenumber
v l is the lowest wavenumber
N =\ n - V L
Aw
46

and Aw is the resolution
For thermal detectors, the signal to noise ratio ( S / N ) of the spectrum obtained is
proportional to the square root of the time each element _is_observed. JTherefore in an-FTIR-
system, the signal to noise is given by
S /N cc T1/2 (2 .6 )
where T is the total time of the experiment.
Whereas a dispersive system observes each spectral element in turn, therefore
S / N ocT1/2/ N ia (2 .7 )
Therefore, a dispersive system obtains a poorer S / N in the same time, or takes longer to
acquire a spectrum with the same S / N . Therefore FTIR has obvious advantages for
kinetic analysis, or where there is poor S /N.
II) The Jacquinot Advantage
The Jacquinot, or throughput advantage arises because unlike dispersive
spectrometers, FTIR spectrometers have no slits which attenuate the infrared light.
47

The spectral optical throughput of a grating instrument is given by
( 2.8 )
where G? is the optical throughput per wavenumber
H is the height of the grating
h is the length of the entrance slit
f is the focal length of the collimator
and Ro is the theoretical resolving power.
In the case of the interferometer, assuming the beam area is equal to the beam area at the
grating,
where is the optical throughput of the interferometer. The ratio of the optical
throughputs is therefore given by
G- =2tcH2
I) V (2 .9 )
G; 2nf( 2.10 )
G? hu
48

For a sensitive grating spectrometer, f / h may be greater than 30. Therefore the FTIR
optical throughput would be around 190 times that of the grating spectrometer. This means
the signal reaching the detector is much higher, leading to a greater S / N for an FTIR
system.______________________________________________________________________
HI) The Connes Advantage
The Connes advantage arises because the frequency scale of the spectrum is known
very accurately. This is because the time domain of the interferogram is fixed extremely
precisely by the wavelength of the laser. Therefore when the Fourier transform is applied,
the wavelength domain is very precisely known. This control over the calibration of the
wavelength domain means mirror movement averaging is possible. This means the
collection of many spectra and their co-addition. The addition of many spectra increases
signal to noise ratio, because S / N OC T1/2 ( eq. 2.6 ). An additional advantage of the
accurate wavelength calibration is that because the wavelength is known absolutely,
techniques such as spectral subtraction can be used without any wavelength calibration.
2.1.2.3 : The disadvantages of FTIR spectroscopy
FTIR instruments do have some disadvantages as compared to dispersive
instruments. Firstly, FTIR instruments do not measure spectra; they measure
interferograms. Interferograms are difficult to interpret without first performing a Fourier
49

transform to produce a spectrum. This used to be a major problem, but since the dramatic
increase in computing power, performing a Fourier transform is now a quick and easy
process. However, the way the interferogram is transformed can affect the results, and so
care must be t a k e n . __________________________________ ____________________
Secondly, in systems that are source noise-limited, the Fellgett disadvantage
applies. This arises because all regions of the spectrum are observed simultaneously.
Therefore, if noise occurs in one part of the radiation from the infrared source, it will be
spread throughout the spectrum in an FTIR system. In a dispersive system, the noise would
be seen only in the region of the spectrum in which it arose. Fortunately, in mid-infrared
systems, as used here, the system is detector noise-limited, therefore the Fellgett advantage
applies, but not the Fellgett disadvantage,
Most importantly, FTIR instruments have a single beam, whereas dispersive
instruments usually have a double beam. Double beam instruments take a background at
the same time as the sample, whereas single beam instruments rely on taking a background
before the sample is inserted. Assuming there is no change in atmospheric conditions
throughout the experiment, this does not cause a problem. However, for highly sensitive
work, and experiments which take along time, changes in infrared absorbing gas
concentrations can severely affect the results. Therefore, when using an FTIR instrument,
it is necessary to purge the instrument of C02 and water vapour using an infrared
transparent gas such as nitrogen. Otherwise changes in C02 or water vapour level between
50

taking the background and sample spectra will cause absorption from these gases to appear
in the spectrum.
2.1.3 : Attenuated Total Reflection ( ATR)
The most common sampling technique used in infrared spectroscopy is
transmission, as shown in Figure 2.2. This technique simply involves steering the infrared
beam through the sample, and into the detector. Transmission has the advantage of
simplicity and ease of use, but has several restrictions. Firstly, the technique is limited to
weakly absorbing samples, in order that total absorption of the infrared light does not
occur. More importantly for this work, transmission provides very limited spatial
information, thus limiting its use in situ. For example, if a thin polymer film is examined
in transmission, the infrared beam samples the film throughout its depth, and therefore
diffusion in the film would be impossible to measure.
The technique of ATR on the other hand, is extremely well suited to the sampling
of strongly absorbing samples, and is highly surface sensitive, allowing the differentiation
between bulk and surface spectra. The detailed theory of ATR has been well reviewed by
Mirabella1 and Harrick2, therefore only the relevant points will be discussed here.
A schematic of the ATR experiment is shown in Figure 2.5.
51

Infrared ivanescent j:zSample
ATR crystalinc
Figure 2.5 : Schematic of the ATR experiment
To perform ATR spectroscopy, the infrared beam is guided into an ATR crystal in
optical contact with the sample. The incident angle ( 0mc) must be greater than the critical
angle 9C, and the ATR crystal must have a refractive index higher than that of the sample.
Under these conditions, the infrared light undergoes total internal reflection at the interface
between the optically dense medium (i.e. the ATR crystal) and the optically rare medium (
i.e. the sample ). At the interface, a decaying evanescent field is created. The evanescent
field has components in all spatial directions, and decays exponentially with distance from
the crystal surface. This is the basis for the surface sensitivity of the ATR technique. In
the case of the geometry shown in Figure 2.5, an evanescent field is present at each
interaction of the light with the interface. If an infrared absorbing medium is in contact
with the ATR crystal, the reflection will be attenuated, and therefore the material will be
sampled at each reflection.
52

Since the evanescent field samples the material of interest, its properties are
extremely important to the spectroscopist. The important points can be summarised as
follows:
1. There is no loss of energy at the interface between the optically dense and rare
media, and therefore total internal reflection occurs.
2. The evanescent field in the rare medium is not transverse and has components in all
directions. Therefore the field can interact with dipoles in the rare medium occurring in all
directions.
3. There is a non-zero energy flow parallel to the interface resulting in a displacement
of the incident and reflected waves. This is known as the Goos-Hanchen shift.
4. The evanescent field is confined to the surface of the rare medium and decreases
with intensity with distance from the interface ( i.e. along the z axis).
This last point is extremely important, because the decay of the evanescent field
determines how much of the rare medium is sampled. The decay can be written as follows
(2 .1 1 )
53

where E is the amplitude of the electric field a distance Z into the rare medium
E0 is the electric field amplitude at the interface
0inC is the angle of incidence
n2i is equal to n2 / n}
where
n2 is the refractive index of the rare medium
and ni is the refractive index of the dense medium
and X\ is the wavelength of light in the dense medium.
Equation 2.11 can be rewritten by replacing the exponential constant with the electric field
amplitude decay coefficient, y:
E = E0exp[-yZ] ( 2.12 )
where y = (2 .1 3 )A,
The depth at which the electric field E decays to E0exp[-1] is known as the depth of
penetration, or dp. The depth of penetration is defined by

The depth of penetration, dp is sometimes referred to as the sampling depth.
However, at dp, the Electric field has approximately 37% of its value at the surface, so
some signal is collected from deeper into the rare medium. Although the evanescent field
theoretically continues to infinity, a practical sampling depth, d. is often considered,
beyond which very little sampling occurs. The sampling depth, ds is three times dp.
It can be seen from equation 2.13 that the decay coefficient y, and thus dp depends
upon the incident angle, the wavelength of light used, and n2i, the refractive index
matching between the ATR crystal and the sample. Because it is usually desirable to have
a small dp> high refractive index materials are usually used as ATR crystals. However, the
infrared transmission window of a material must also be taken into account. The properties
of some common ATR materials are shown in table 2.1
Material Infrared window Refractive Index, ni
Silicon 1300 - 8300 cm'1 3.4
Germanium 600 - 5500 cm'1 4.0
Zinc Selenide 450 - 20000 cm'1 2.4
KRS5 250-20000 cm-1 2.4
Table 2.1 : Optical characteristics of common ATR materials
Assuming a refractive index for the rarer medium of 1.5 ( common for polymers ),
dilicon as the ATR medium, an incident angle of 45° and infrared of frequency 1600 cm'1,
a value for dp of 0.5 pm. is found, giving a value for ds of 1.5 pm. In practice, dp tends to
vary between 0.1 and 5 pm. One important consideration arising from equation 2.13 is that
across the spectrum dp will change, meaning that higher frequency bands will absorb less

than low frequency bands. This effect has been used to perform depth profiling with ATR3,
as has the change in dp when the angle of incidence is changed4.
It can be shown that
A a E2 (2 .15)
where A is the absorbance measured in the infrared spectrum. I.e. the actual spectrum
measured depends on the square of the electric field. The effect of this is shown in Figure
2 .6 .
Electric Field Amplitude
A bsorbance re sp o n se0.80o| 0.6 .Q O (/)_Q< 0.4LU
0.2
2Z ( um.)
Figure 2.6 : The decay of the electric field amplitude and the absorbance response
56

2.1.3.1: The advantages of ATR
1. Many reflections in the ATR crystal lead to large sampling number, thus increasing
sensitivity.
2. Thin films can be studied with great sensitivity as most of the signal is obtained from < 1
jam. away from the surface.
3. The interface may be studied selectively, or depth profiling may be performed by
manipulation of the evanescent wave.
4. In situ experiments are possible.
5. Interference fringes seen in transmission are not seen in ATR.
2.1.3.2 : The disadvantages of ATR
1. Very good optical contact is required between the sample and ATR crystal.
2. The total internal reflection wave loses energy at each reflection.
2.1.4 : Diffusion measurements with ATR - FTIR
The diffusion of small molecules in polymeric materials has been widely studied,
and there is a large body of work on the theoretical background5,6. There are many
techniques which have been applied to the study of this diffusion, but most, such as the ‘pat
and weigh’ technique7, where a slab of the polymer is immersed in the diffusant, and
57

removed for weighing, are ex situ techniques. In order to obtain kinetic information from
measurements, it would be preferable to perform them in situ. In order to do this, this work
shows the use of ATR -FTIR to monitor diffusion in a PVC film in contact with the ATR
crystal, in situ. This section will discuss the theoreticakbasis Tor these measurements_____
2.1.4.1: Models of diffusion
Ficks’ first law states that the rate of transfer of a diffusant through a unit area is
proportional to the concentration gradient measured normal to the unit area8. This can be
written a s :
( 2.1 6 )
where Fx is the flux of diffusant in the x direction
fac'i— is the concentration gradient of the diffusant
\dxJ
and D is the diffusion coefficient.
However, Ficks’ first law only applies to steady state diffusion, i.e. a fixed
concentration of diffusant. For non-steady state conditions, Ficks second law gives the rate
of change of penetrant concentration:

where C is the concentration of diffusant
t is time
and z is the axis normal to the polymer surface.
The mass of molecules diffused at time t into.a polvmer sheet-mav-be given bv-:-
Mt 4Moo L
^Dtv '(2 .1 8 )
where Mt is the sorbed mass at time t
Mw is the sorbed mass at equilibrium
and L is the sheet thickness.
Experimentally, diffusion in polymeric materials can be categorised as follows9,10
1. Case I Diffusion : This occurs when the rate of diffusion is less than the mechanical
relaxation time of the polymer. This is also known as Fickian diffusion. This is believed to
be found when the motion of the diffusant follows a ‘random walk’ with no interactions.
In case I diffusion the parameter n in equation 2.18 has a value of 0.5.
2. Case II diffusion : This occurs when the rate of diffusion is fast compared to the
mechanical relaxation time of the polymer. This diffusion is characterised by a sharp
moving diffusant boundary which progresses into the polymer at constant velocity. In case
II diffusion the parameter n has a value of 1.
59

3. Case HI diffusion : This is also known as non-Fickian diffusion. It may occur when
the diffusion and relaxation rates are similar, but is also used to describe all other cases
where neither case I or II occur. The parameter n may be between 0.5 and 1. Unlike case I
_or II, more than one parameter may be required to describe the diffusion________________
If one assumes Fickian kinetics, it is possible to derive a general solution to the
equation for the mass of diffusant in a film of thickness 2L5 :
Mlx
= i - I£t{ 2 n + l ) V eXP-D (2n+l)V t
4L2(2 .19 )
In the ATR experiment, the measured absorbance does not have a linear
relationship with Mt, the mass of molecules. Therefore, in order to measure D, the
diffusion coefficient, it is necessary to combine equation 2.19 with Harricks’ equations for
ATR11 ( see section 2.1.3 ). This has been carried out many times before12,13,18’20, and so
only the answers will be shown here.
The equation describing Fickian diffusion in terms of ATR absorbance is given
below:
8y— L = l - — .Aoo tc[ 1—exp(2Ly] n=o
exp-D(2n + l ) V t
4L2(2n + 1)tc . 2L
exp(-2y2L) + ( - l ) n(2y)
(2n +1) 4y +2 . i (2n + 1)tc
2L
(2.20)
60
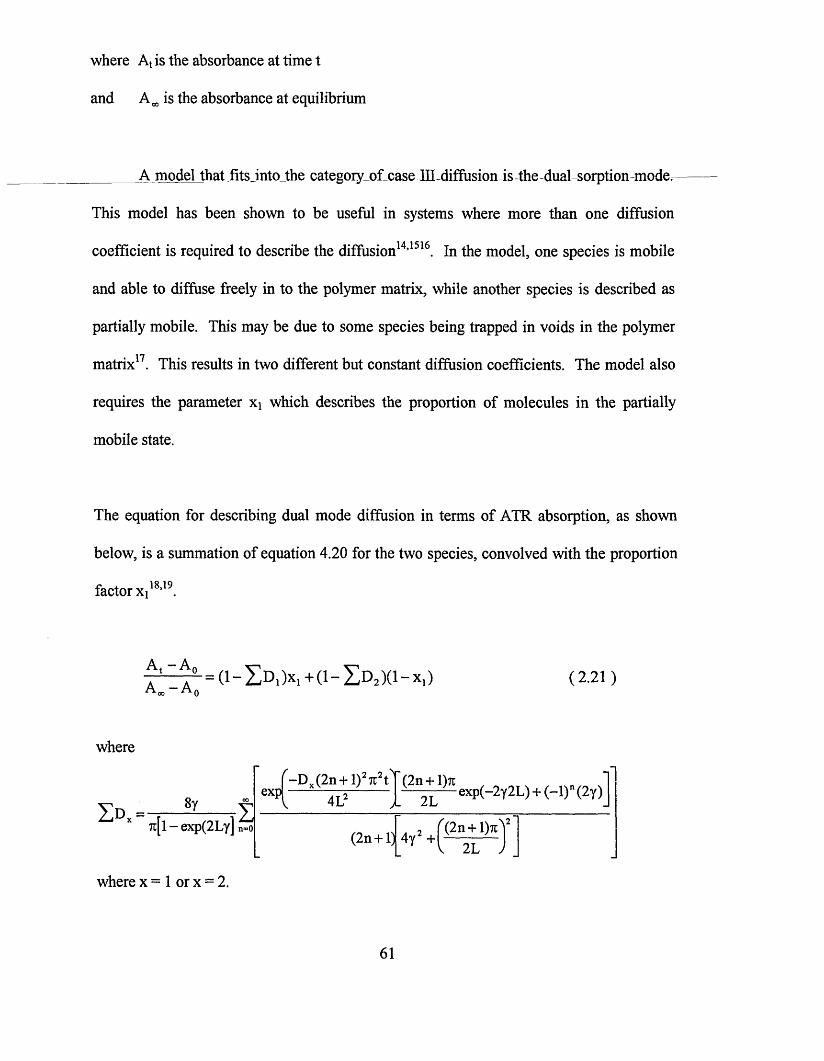
where At is the absorbance at time t
and A w is the absorbance at equilibrium
A model that fits into the categorv o f case PI diffusion is the dual sorption mode.
This model has been shown to be useful in systems where more than one diffusion
coefficient is required to describe the diffusion14,1516. In the model, one species is mobile
and able to diffuse freely in to the polymer matrix, while another species is described as
partially mobile. This may be due to some species being trapped in voids in the polymer
matrix17. This results in two different but constant diffusion coefficients. The model also
requires the parameter Xi which describes the proportion of molecules in the partially
mobile state.
The equation for describing dual mode diffusion in terms of ATR absorption, as shown
below, is a summation of equation 4.20 for the two species, convolved with the proportion
factor X ] 18,19.
fX x= (i ■- IX) x ,+(i ■- IX x i ■- x ,) ( 2.2 1 )
where
IX= 8y7t[l - exp(2Ly] n=o
where x = 1 or x = 2.
exp/ -D x(2n+1)27T20
4L(2n+l)rc . 2L
exp(-2y2L) + ( - l)n(2y)
(2n+l) 4y2 +(2n + 1)7C
~2L J
61

Using these two equations ( equation 2.20 and equation 2.21 ) it is possible to
determine diffusion coefficients from absorbance data20,21, assuming the value L and which
model is appropriate are known. This is applied in chapter 3.
2.2: Raman Spectroscopy
2.2.1: Introduction
The Raman effect was observed by C. V. Raman in 192822. Raman obtained
spectra using a mercury lamp, but it was only with the advent of intense, monochromatic
and collimated light sources ( i.e. lasers ) that Raman spectroscopy became a practically
useful technique. Therefore, compared to infrared spectroscopy, Raman is a relatively new
technique, but further technological advances have caused the use of Raman spectroscopy
to grow more widespread in recent years. The theory of Raman spectroscopy has beenAn A i Af
widely discussed in the literature ’ ’ , so only the main points will be discussed here.
2.2.2 : The Raman effect
The Raman effect occurs when light is scattered inelastically by matter. When a
photon of light interacts with matter, it may be scattered in one of three ways:
62

i. Elastic scattering, which results in no net energy transfer between the photon and
the matter. This is also known as Rayleigh scattering.
ii. Inelastic scattering where the photon is scattered with lower energy than the
incoming energy. This is known as Stokes scattering.
iii. Inelastic scattering where the photon is scattered with higher energy than the
incoming energy. This is known as anti-Stokes scattering.
Both types of inelastic scattering ( ii and i i i ) give rise to Raman spectra.
Classically, when a molecule is placed in an electric field E, a dipole moment, \im&
is induced. The size of the induced dipole is dependent on the polarisability of the
molecule, i.e. the ease with which the electron cloud of the molecule may be distorted.
The induced dipole is given by
where a is the polarisability tensor of the molecule. If the applied field is alternating, the
induced dipole oscillates at the same frequency. The alternating electric field may be
expressed a s :
Hind = aE ( 2.2 2 )
E = E°cos27rtv0 ( 2 . 2 3 )
63
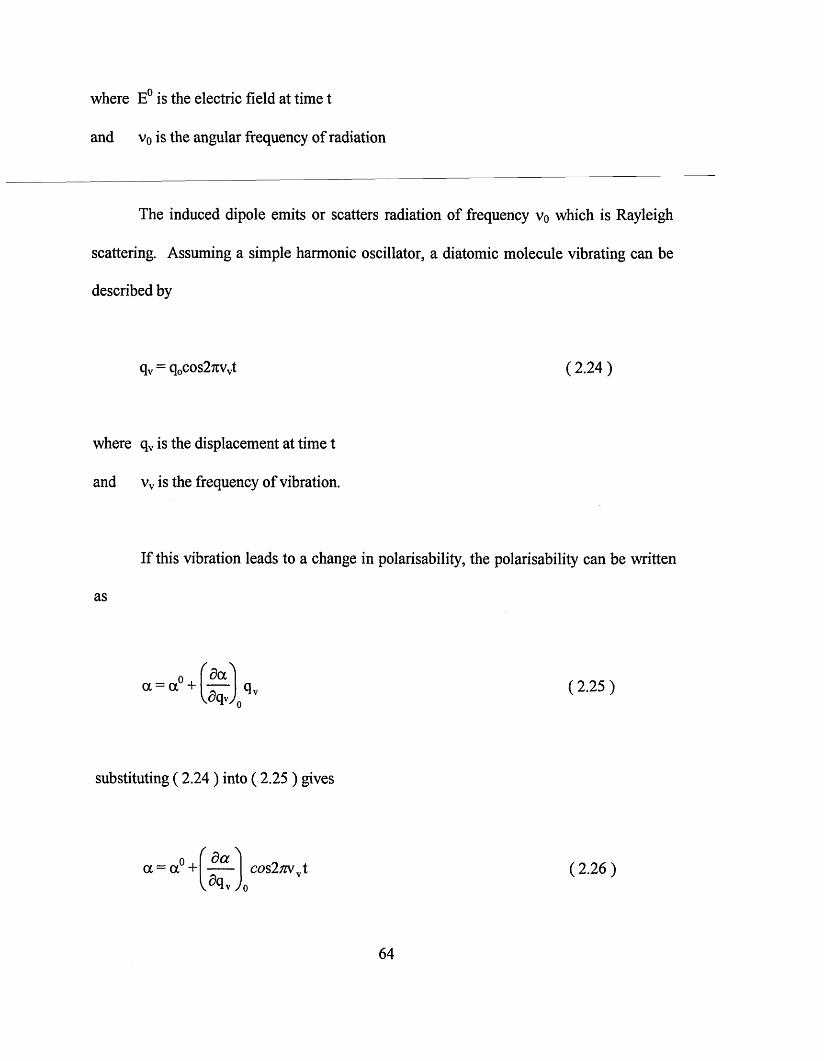
where E° is the electric field at time t
and v0 is the angular frequency of radiation
The induced dipole emits or scatters radiation of frequency Vo which is Rayleigh
scattering. Assuming a simple harmonic oscillator, a diatomic molecule vibrating can be
described by
where qv is the displacement at time t
and vv is the frequency of vibration.
If this vibration leads to a change in polarisability, the polarisability can be written
as
substituting ( 2.24 ) into (2.25 ) gives
qv = q0cos27ivvt (2 .24)
<%>s2;zvvt (2 .2 6 )l5(JvJo
64

If radiation of frequency v0 interacts with the molecule then the induced dipole is
given b y :
jiind= aE = aE cos27iv0t (2 .27)
substituting (2.26 ) into (2.27 ) gives
jUjnd = a°E° cos27iv0t +
jLXind = a°E° cos27cv0t +
f d a '
J
r d a '
E°q0 cos27ivvtcos27tv0t( 2.28 )
E°q0 [cos27l(v0 +vv)t + cos27t(v0 +vv)t]
Therefore for Raman scattering to occur, a change in the polarisability of the molecule
must occur during the vibration, i.e.
r d a N
\dqvj* 0 (2 .29 )
must be true for a vibration to be Raman active.
From a quantum mechanical point of view, the processes that may occur upon
scattering of a photon are shown in Figure 2.7. When light is scattered, almost all of the
photons undergo Rayleigh scattering. The low probability of Raman scattering is the
reason why high intensity light sources are required for Raman spectroscopy. It can be
seen from Figure 2.7 that Anti-Stokes scattering occurs from a vibrationally exited state.
65

As the majority of molecules occur in the ground state, Stokes scattering is considerably
more likely than Anti-Stokes scattering.
/ V V V / VVirtual excited s ta te
>>f \ F~ "
S tokes Rayleigh Anti-Stokes
Figure 2.7 : Quantum mechanical scattering processes
It can also be seen from Figure 2.7 that like infrared spectroscopy, Raman
spectroscopy probes the vibrational energy levels of a molecule. Because it is often the
S jj. dacase that for molecular vibrations, when— ( the dipole change ) is large, — ( the
polarisability) is small, and vice versa, many vibrations are either strong in the infrared or
Raman, but not both. Although strictly incorrect, such vibrations are often said to be either
infrared or Raman active. Therefore infrared and Raman give the same kind of
information, but often about different molecular vibrations. Infrared and Raman are often
said to be complementary techniques.
66

Practically, Raman spectroscopy is usually carried out on the Stokes part of the
spectrum, due to the higher intensity. This is illustrated in Figure 2.8, which shows the
Raman spectrum of a silicon surface. The Stokes v(Si-Si) vibration of silicon occurs at 520
cm-1 relative to the Rayleigh light, and the anti-Stokes vibration at-520 cm’1;—It-should be
noted that the Rayleigh light in this spectrum has been filtered; usually Rayleigh intensities
are several orders of magnitude greater than Raman intensities.
5000 •
£ 4000*c3
83000-
2000 -
1000 -
0-
-800
JV.
-600 -400 -200 200 400
Raman Shift ( c m -1 )
Figure 2.8 : Raman spectrum showing, from left, Anti-Stokes, Rayleigh and Stokes lines
2.2.3 : Raman microscopy
Like infrared spectrometers, traditional Raman spectrometers simply consist of a
light source, a dispersive element and a detector. However, Raman light sources need to be
monochromatic, in order to facilitate measurement of the Raman shift, which gives the
67

vibrational information. The most common sources are HeNe, Argon ion, and NdYAG
lasers, giving possible excitation wavelengths between 480 and 633 nm. These are visible
wavelengths, which makes coupling of a Raman spectrometer to a microscope a relatively
simple task, as a.standard optical microscope may be used. —Unlike infrared spectroscopyr
Fourier Transform Raman spectroscopy is still relatively rare, although it is a well
developed technique26,27. Most Raman spectrometers use a grating as the dispersive
element, such as the Renishaw Ramascope described herein. The use of a monochromator
and photomultiplier to reject light and detect the Raman light is common, but the
Ramascope, as described below uses a more novel system. As the performance of this
spectrometer is of direct relevance to this project, the details of the instrument are
discussed in the next section.
2.2.4 : The Renishaw Ramascope
The Raman instrument used in this project was a Renishaw Ramascope system
2000. The system 2000 features an additional optical path used for imaging which is not
discussed here. A schematic diagram of the components of the Ramascope is shown in
Figure 2.9.
68

Figure 2.9 : Schematic diagram of the Renishaw Ramascope
a
(Q
(Q
Qlor
u)
CD
CD
CD
-»
=h(Q

The spectrometer functions as follows: The source is a 25 mW. Helium-Neon laser
at 632.8 nm. This enters the spectrometer through a laser attenuation wheel. This can be
used to reduce the power of the laser. Unless otherwise mentioned, this was used at the full
power setting. The laser then passes through a plasma -line rej ection filter-(-ELF-).—The PLF
rejects all frequencies except the 632.8 nm. line. The laser is guided into a beam expander,
which is simply two objective lenses required to expand the beam to the size used by the
microscope objective ( approximately 10 mm. ). The beam expander may include a
pinhole at the focus, to collimate the beam. However, in the system described here, the
beam is collimated as it exits the laser, so this is not necessary. The expanded beam is then
guided onto the first holographic notch filter ( H.N.F. ). The H.N.F.S act like
monochromators, as they reflect Rayleigh light ( i.e. the frequency of the laser), and allow
all other frequencies to pass. The first H.N.F. acts as a beam splitter, guiding the laser light
into the microscope, whilst allowing the returning Raman light into the spectrometer. The
light enters the microscope accessory ( an Olympus BH-1 optical microscope ), and is
directed onto the sample with an ordinary microscope objective. In this work, 100X, 50X
and 20X U.L.W.D. ( ultra long working distance) objectives have been used.
The light scattered by the sample is collected by the same objective ( 180°
scattering geometry). This light is a mixture of Rayleigh, Stokes and anti-Stokes scattered
light. The light is guided into the spectrometer, and passes through the two H.N.F.S. These
remove almost all of the Rayleigh light, as can be see in Figure 2.8. Without the H.N.F.s
the Rayleigh light swamps the spectrum. The light is next focused through an optical slit.
This acts as one part of a spatial filter, and will be explained in the following section,
70

describing confocal Raman microscopy. The light is then reflected by a triangular mirror
onto a diffraction grating. The grating is fixed to a rotating motorised stage, and the angle
of the grating determines the wavelengths of Raman light detected. After the grating, the
light is focused onto a peltier-cooled C.C.D. Icharge-coupled device Tdetector----------------
The C.C.D. is a silicon array device which can detect light on any one of it’s 600 x
400 pixels. In order to collect a spectrum, the grating disperses light which is focused in a
line onto the long axis of the C.C.D. It is therefore possible to detect approximately 600
spectral elements without moving the grating ( a ‘static’ spectrum). In order to collect full
range spectra, the grating is rotated. The spectral range of the instrument is approximately
200 to 5000 cm'1. This is somewhat limited at low frequencies compared to
monochromator - based spectrometers, which can often detect light at Raman shifts as low
as 20 cm'1. However, for organic materials ( e.g. polymers) most bands occur between 500
and 3500 cm’1, so it is suited to this work. The advantages of the Renishaw Ramascope are
high sensitivity due to the C.C.D. detector, and the ability to perform confocal Raman
microscopy, which is discussed in the next section.
2.2.5 : Confocal Raman microscopy
Confocal microscopy is a technique of eliminating light from outside the focal
plane. In optical microscopy, this allows images of ‘sections’ of a transparent material to
be obtained. Confocal Raman microscopy allows the collection of a spectrum from a very
small volume of material. In the x-y ( or focal) plane, it is easy to collect light only from a
71

small area, by simply focusing the laser to small spot. The area sampled is limited to about
1 pm.2 by the diffraction limit. In the z ( or optical axis ) however, it is not as simple to
collect a spectrum from a small region only. Confocal microscopy eliminates back
scattered lightirom above or below the focal plane.--------------------------------------------- -----
The signal intensity that reaches the detector for a given Raman band is given, to a
first approximation by
S I* W iN eT xSjl (2.30)
where SI is the signal intensity at wavelength X
Io is the laser irradiance at the sample ( in watts / unit area)
is the differential cross-section for the analysed Raman band ( in cm2 sterad'1
molecule-1)
N is the number of molecules sampled
0 is the angle of collection of the Raman light
T is the throughput of the instrument
and Sx is the sensitivity of the detector at the given wavelength.
When in confocal mode, there is clearly a small value for N, as a small volume is
sampled. Using a high numerical aperture ( NA ) objective compensates for this
somewhat. The NA of an objective is defined as follows
72

where 0 is the angle of entrance
and n is the refractive index of the transmitting medium.
The collection geometry is shown in Figure 2.10, which shows both high and low
NA objectives. It can be seen from Figure 2.10, that high NA objective can focus the light
into a small area, and collect over a wide angle. Raman light is scattered isotropically, so a
wide collection angle increases the signal collected per unit volume. In contrast, low NA
objectives focus light on a larger volume of material, thus collecting Raman scattering from
a large volume. Practically, it is found that for optimum signal, assuming a large sample,
an intermediate NA is ideal.
high NA objective
low NA objective
waist
Figure 2.10 : The distribution of laser light near focus for high and low NA objectives
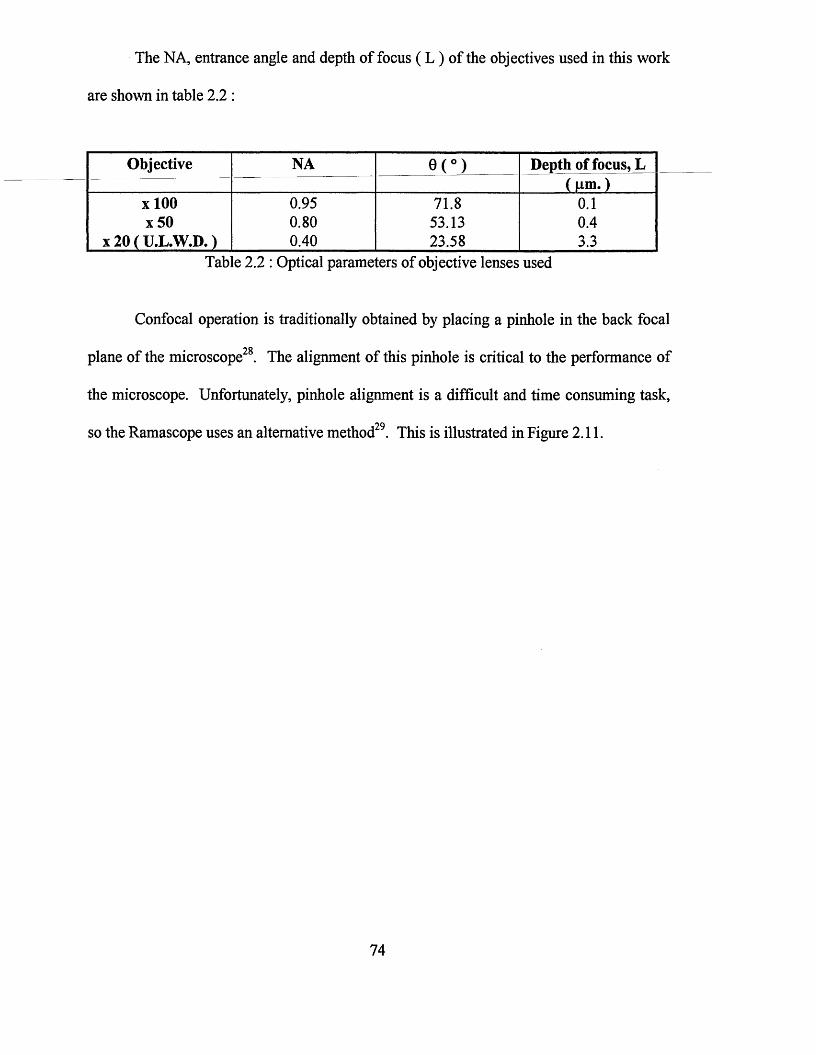
The NA, entrance angle and depth of focus ( L ) of the objectives used in this work
are shown in table 2.2 :
Objective NA 0 ( ° ) Depth of focus, L(p m .)
x 100 0.95 71.8 0.1x 50 0.80 53.13 0.4
x 20 ( U.L.W.D.) 0.40 23.58 3.3Tab]le 2.2 : Optical parameters of objective lenses used
Confocal operation is traditionally obtained by placing a pinhole in the back focal
plane of the microscope28. The alignment of this pinhole is critical to the performance of
the microscope. Unfortunately, pinhole alignment is a difficult and time consuming task,
so the Ramascope uses an alternative method29. This is illustrated in Figure 2.11.
74

slit widthincoming laser beam
C.C.D. area used
C.C.D. Detector
slit
microscope objective
focal plane
Figure 2.11: Schematic diagram of the operation of the Ramascope in confocal mode
The Ramascope effectively uses two slits in the back focal plane at right angles to
each other to simulate a pinhole. One of these is a mechanical slit, the width of which is
micrometer controlled. The other slit is made by selecting a long box of elements on the
C.C.D. detector, and binning the data from the other elements.
The geometrical effect of the pinhole is explained here with reference to Figure
2.12, assuming no diffraction occurs at the pinhole. This assumption has been shown to be
valid for pinholes greater than 100pm., as used here30.
75

slit
slit focusing lens ( l 2 )
objective lens ( i j
sample
Figure 2.12 : Diagram of confocal microscope showing pinhole operation. For clarity, only the returning ( Raman) light is shown, and the light from the focal plane is red, and light
from out of focus is blue
The objective lens ( I x ) focuses the beam onto the area to be sampled. At this
point the beam has it’s smallest diameter, but this diameter remains constant within a
certain distance from the focal plane31. This distance is known as the waist, or the depth of
focus ( L ). L is given by :
( x Y 1 YL = 6.4 — -
V27iA ta n 0y
The values of L for the objectives used are given in table 2.2.
76

The size of the laser spot can be expressed as :
s(/i ± d) = s(/i) for d < x 2
(2 .33)
( L ls(/i ± d) = s(/j) + 2 d - — tan0V 2 J
, L for d > — 2
(2 .34)
where f \ is the focal length of the objective lens
and d is the distance from the plane of focus
In Figure 2.12 it can be seen that the light from out of the focal plane is imaged at
distance Z2 from the slit - focusing lens ( l 2 ). This leads to the image at the slit of this
light being out of focus. The distance Z2 is given by
-l
1(2 .35 )
h U / , ± d j .
where / 2 is the focal length of the slit focusing lens. The size of this spot is s(/i±d). The
diameter of this image at the slit ( It ) is given by
I ,= (2 .3 6 )
where M is the magnification power of the objective.
77

As this image is much larger than the image from the focus point ( i.e. the laser spot
image ), it is possible to eliminate most of the out of focus light by including a pinhole of
diameter less then It in front of the detector. A high NA objective produces a more
divergent beam, from outside Jhe Jocal plane, making it easier-to -remove -the -unwanted
light.
The experimental confocal response is determined as follows. The laser is focused
on the surface of a silicon crystal, and a spectrum taken. The intensity of the 520 cm'1 band
of silicon ( see Figure 2.8 ) is measured. The focus is then moved 1 pm. away from the
surface and another spectrum measured. This is repeated to build up a ‘confocal response
profile’. The full width at half height ( FWHH ) of this profile is the parameter used as a
measure of confociality. This process generates one half of the profile that would be
obtained by measuring a thin film in transparent medium. Therefore the profile may be
mirrored to get the true value, or the FWHH doubled. Confocal profiles, using the 100X
objective, with and without the instrument set up in confocal mode are shown in Figure
2.13.
78

800
600 --
c 400 --
200 - -
Distance ( microns)
100X Confocal 100X Non-Confocal
Figure 2.13 : Comparison of confocal and non - confocal modes, using the 100X objective
It can be seen from Figure 2.13 that the spatial FWHH in confocal mode, using the
100X objective is somewhat smaller than 2jum. As mentioned previously, a high NA
objective is required for confocal measurements. To confirm this, confocal profiles were
obtained for all three objectives used in this work. These are presented in Figure 2.14.
79

II. Fluorescence from impurities and the spectrum of the substrate is often eliminated,
due to the small volume analysed.
2.2.7 : Disadvantages of confocal Raman microscopy
I. The small volume analysed means signal intensity is always smaller in confocal
mode.
n. Due to the concentration of laser power in a small area, the chance of sample
burning is increased. Fortunately, in PVC, sample burning is revealed by a highly intense
fluorescence spectrum32,33, so it is simple to detect this effect.
Despite these disadvantages, Raman confocal microscopy is an excellent technique
for the depth profile analysis of polymer laminates29,34.
81

References
1 Internal Reflection Spectroscopy : Theory and Applications, Ed. by Mirabella, F.
M., Marcel JDekker, NewY ork (-1993-)----------------- -------------------------------------
2 Internal Reflection Spectroscopy, Ed. by Harrick, N. J., Harrick Scientific
Corporation, New York ( 1987 )
3 Ishida, H. and Ekgasit, S., Applied Spectroscopy Vol. 51, No. 10, p. 1488 ( 1997)
4 Ishida, H. and Ekgasit, S., Applied Spectroscopy, Vol. 51, No. 4, p.461 ( 1997)
5 The Mathematics of Diffusion, 2nd. Ed., Ed. by Crank, J., Clarenden Press, Oxford
(1994)
6 Polymer Permeability, Ed. by Windle, A. H. and Comyn, J., Elsevier Applied
Science Publishers, London ( 1986).
7 Miglaresi, C., Nicodemo, L., Nicolais, L. and Paserini, L., Polymer Vol. 23, p.687 (
1984)
8 Diffusion in Polymers, Ed. by Crank, J. and Park, G. S., Academic Press, London (
1968 )
9 Alfrey, T., Gurnee, E. F. and Lloyd, W. G., Journal of Polymer Science, Vol. 12, p.
249 ( 1966)
10 Schlotter, N. E. and Furlan, P. Y., Polymer Vol. 33, No. 16, p. 3323 ( 1992)
11 Harrick, N. J., Journal of the Optical Society of America, Vol. 55, p. 851 ( 1965 )
12 Van Alsten, J. G., Trends in Polymer Science Vol.3, No.8, p. 272 ( 1995 )
13 McKnight, S. H. and Gillespie, J. W., Journal of Polymer Science, Vol. 64, part 10,
p. 1971 ( 1997)
82

14000
12000
10000 -
o 8000 -
E 6000 --
4000 -
2000 -
Distance ( microns)
100X Confocal 20X ULWD Confocal 50X Confocal
Figure 2.14: Confocal profiles from the 100X, 50 X and 20X U.L.W.D. objectives
It can be seen from Figure 2.14 that although the optical through put is low, the
100X objective gives by far the best spatial resolution, and therefore only the 100X
objective was used for depth profiling work.
2.2.6 : Advantages of confocal Raman microscopy
I. Confocal Raman microscopy allows the collection of in situ depth profiles.
Without the ability to collect a spectrum from within a transparent polymer film with
spatial resolution on the pm. scale, depth profiling would require destructive sample
preparation techniques, such as sectioning.
80
14 Vieth, W. R. and Amini, M. A., Papers of the A.C.S. Division of Organic Coatings
and Plastics Chemistry Vol. 32, p.442 ( 1974)
-15----- Petropolous, J. H., Journal of Polymer Science Part A2^Vol. 8rp. 1797 ( 1980 -)------
16 Horwas, J. A. and Nieto, F., Journal of Polymer Science Part B: polymer Physics,
Vol. 32, p. 1889 ( 1994)
17 Frisch, H. L., Polymer Journal Vol. 23, No. 5, p. 225
18 Hajatdoost, S. and Yarwood, J., Journal of the Chemical Society - Faraday
Transactions Vol. 93, No. 8, p. 1613 ( 1997)
19 Pereira, M. R. and Yarwood, J., Journal of the Chemical Society - Faraday
Transactions Vol.92, No. 15, p. 1613 ( 1997)
20 Hong, S. U., Barbari, T. A. and Sloan. J. M, Journal of Polymer Science part B -
Polymer Physics, Vol. 36, No. 2, p. 337 ( 1998)
21 Sammon, C., Everall, N. and Yarwood, J., Macromolecular Symposia Vol. 119, p.
189( 1997)
22 Ferraro, J. R., Spectroscopy Vol. 11, No. 3, p. 18 ( 1996)
23 Clark, R. J. H. and Hester, R. E., Spectroscopy of Surfaces. Advances in
Spectroscopy, Vol. 10, Wiley, New York ( 1988)
24 Laser Raman Spectroscopy, Ed. by Gilson, T. R. and Hendra, P. J., Wiley-
Interscience, London ( 1972)
25 The Raman Effect, Ed. by Chantry, G. W., Marcel-Dekker, New York (1971 )
26 Urban, M. W., Abstracts of Papers of the A.C.S., Vol. 215, part 2, p. 11 ( 1998 )
83

27 Hendra, P. J., Wilson, H. M. M., Wallen, P. J., Wesley, I. J., Bentley, P. A.,
Arruebarrenabaez, M., Haigh, J. A., Evans, P. A., Dyer, C. D., Lehnert, R., and
Pellowjarman,M.JV,AnalystVbl. 120, No. 2, p.-985 ( 1995 )----------------------------
28 Puppels, G. L., Otto, C. and Greve, J., Trends in Analytical Chemistry, Vol. 10, No.
8, p.249 ( 1991 )
29 Williams, K. P. J., Pitt, G. D.. Batchelder, D. N., and Kip, B. J., Applied
Spectroscopy Vol. 48, No.2, p. 232 ( 1994)
30 Dhamelincourt, P., Barbillat, J. and Delhaye, M., Spectroscopy Europe Vol. 5, p. 16
( 1993)
31 Bom, M. and Wolf, E, Principles of Optics, 6th. Ed., Pergamon Press, Oxford,
p.435 ( 1980 )
32 Ellahi, S., Hester, R. E. and Williams, K. P. J., Spectrochimica Acta Part A -
Molecular and Biomolecular Spectroscopy Vol. 51, No. 4, p. 549 ( 1995 )
33 Owen, E. D., Shah, M. and Twigg, M. V., Polymer Degradation and Stability Vol.
51, No. 2, p. 151 ( 1996)
34 Hajatdoost, S. H., Olsthoom, M., and Yarwood, J., Applied Spectroscopy Vol. 51,
No. 12, p. 1784 ( 1997 )
84

Chapter 3 : ATR-FTIR studies of organosilane diffusion
In order to determine whether interdiffusion of silane and PVC may occur in the
glass / silane / PVC system, ATR-FTIR experiments have been carried out. As described in
chapter 2, similar experiments have been applied to different systems elsewhere, and have
been successful in determining kinetics of diffusion1'4. This chapter describes the
experiments that have been performed in situ to determine the kinetics of diffusion, as well
as the factors which affect the kinetics.
3.1 : Experimental
In order to obtain information of relevance to glass / PVC / silane laminates, it was
decided to perform experiments on a model laminate. A schematic diagram of the
laminates used is presented in Figure 3.1.
Silane overlayer Silane underlayer
silane
PVC film
PVC film
-silane
.silicon micro ATR crystal
Figure 3.1 : Schematic diagram of model laminates used for ATR-FTIR experiments
The substrate chosen for this laminate was a silicon micro ATR crystal. This serves as a
suitable model for glass, as the surface properties of oxidised silicon and glass are similar.
85

Without pre-treatment to remove the oxide layer of silicon, it would be expected to consist
of a hydroxylated surface, i.e. the surface chemistry would be dominated by the presence of
-SiOH groups. Unless heat-treated, it would also be expected that a certain amount of
surface water would be.presentlJiejnicroATR crystal also serves as the optically dense-
material in the ATR experiment ( see section 2.13 ). The micro ATR crystal functions in
the same way as a normal ( or macro ) ATR crystal, but is very thin, in this case 0.5 mm.
thick. This has the effect of increasing the number of reflections in the ATR experiment,
and thus increasing the sensitivity of the experiment. This is illustrated schematically in
figure 3.2. The number of reflections ( totalled over both sides), N is given by
N = cot0 7 ( 3 -1}V« J
where 0 is the incident angle ( see figure 2.5 )
L is the length of the crystal
and t is the thickness of the crystal
From equation 3.1, at 0 = 45°, a standard macro ATR crystal gave rise to 14 reflections,
whereas the micro ATR crystal used ( L = 18 mm., t = 0.5 mm. ) gave 38 reflections, so
that the micro ATR crystal should have been approximately 2.7 times more sensitive. The
micro ATR geometry has the disadvantage that focusing the infrared beam onto the face is
more difficult, which means that the overall optical throughput is lower. However, in
practice the micro ATR crystals were found to be much more sensitive overall, especially
for low intensity bands.
86
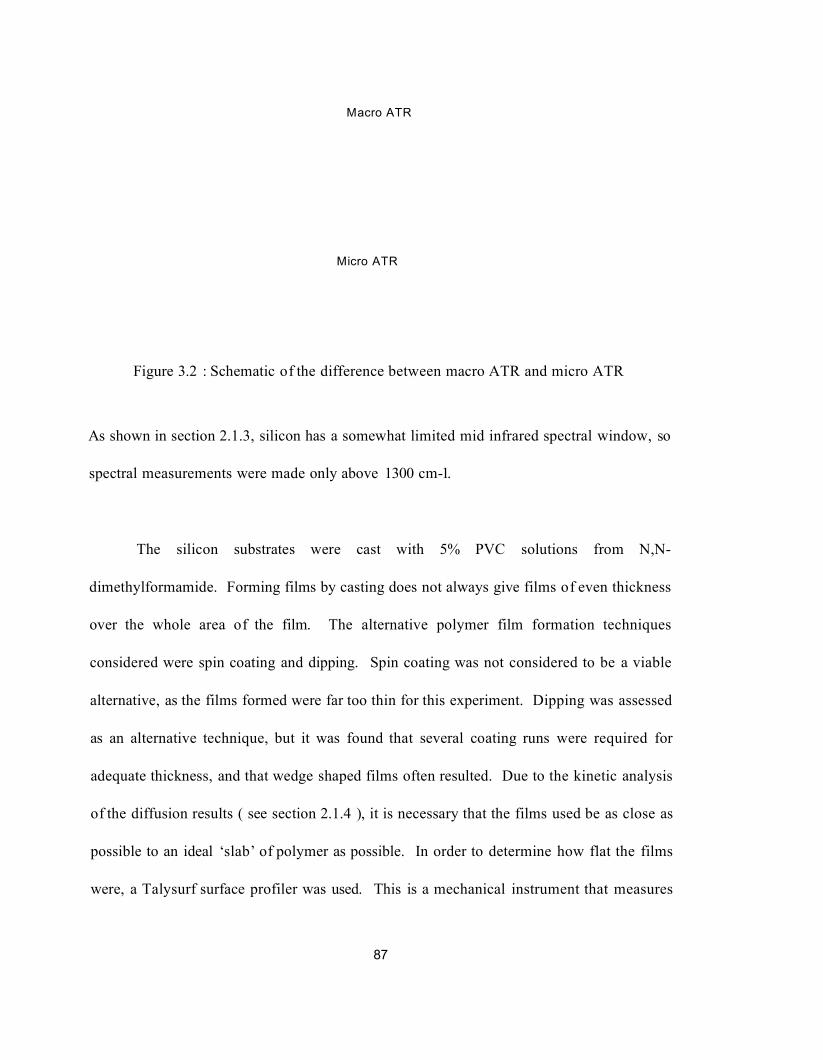
Macro ATR
Micro ATR
Figure 3.2 : Schematic of the difference between macro ATR and micro ATR
As shown in section 2.1.3, silicon has a somewhat limited mid infrared spectral window, so
spectral measurements were made only above 1300 cm-1.
The silicon substrates were cast with 5% PVC solutions from N,N-
dimethylformamide. Forming films by casting does not always give films of even thickness
over the whole area of the film. The alternative polymer film formation techniques
considered were spin coating and dipping. Spin coating was not considered to be a viable
alternative, as the films formed were far too thin for this experiment. Dipping was assessed
as an alternative technique, but it was found that several coating runs were required for
adequate thickness, and that wedge shaped films often resulted. Due to the kinetic analysis
of the diffusion results ( see section 2.1.4 ), it is necessary that the films used be as close as
possible to an ideal ‘slab’ of polymer as possible. In order to determine how flat the films
were, a Talysurf surface profiler was used. This is a mechanical instrument that measures
87

the step size between the substrate and film to an accuracy of ±0.02 pm. The output from a
typical Talysurf measurement is shown in figure 3.3.
+25.0 un
+15.0 un
+5.0 urn
♦0.0 un
5.0
-10.0 urn
Figure 3.3 : A typical Talysurf surface profile. The horizontal scale is 2mm. per division
It can be seen from figure 3.3 that many samples showed considerable heterogeneity
in thickness around the edges. In these cases, diffusion was only measured in the centre of
the film ( by applying silane only to this area).
In order to know the average thickness, the mean value from the Talysurf profile
was taken. The cast films were heated for 14 hours at 65°C to remove the solvent. It was
88

found that after the heating process, the film was often thicker and more variable in
thickness around the edges, but thin and of even thickness in the centre of the crystal. In
order that this did not affect the diffusion results, in these cases the silane was only applied
to theflatportion ofthe film. The silanewasapplied bya numberof techniques.--------------
The silane was first applied as a ‘silane underlayer’. In this configuration, the
silane was pre-hydrolysed and cast from solution. The film was then heated to remove
solvent. The solvent used was 9:1 ( v/v) IPA / H20 mixture, with 3% ( v /v) added acetic
acid as hydrolysis catalyst. This solution has been previously reported to hydrolyse
organosilanes rapidly6. After drying, PVC was cast onto the silane layer from DMF or
MEK solution, and the laminate was heated to remove the DMF. In this configuration any
silane diffusion would be seen as a decrease in silane band intensity.
In the ‘silane overlayer’ configuration the PVC was cast directly onto the ATR
crystal, and then the DMF removed by heating. The silane was then applied onto the top of
the PVC film, either by spraying or brushing. Spraying was found to be preferable in order
to apply a fixed amount of silane. Brushing, however, was more convenient when a large
amount was to be applied. When spraying, a template was used to ensure that the silane
was only applied to the area required. In all cases, the silane was handled in a diy nitrogen
atmosphere to avoid premature hydrolysis.
89

3.1.1: Materials
The polymer used was poly(vinylchloride) ( PVC ), secondary standard, molecular
weight 80,000,-fromAldrichChemical Company. The silanes usea were [3-
(amino)propyl]trimethoxysilane ( A ll 10 ), 97%, [3-(mercapto)propyl]triethoxysilane (
A1891, >80% and [3-(phenylamino)propyl]trimethoxysilane, >95% from Fluka Chemicals
( see figure 1.1 ). The plasticisers used were dihexyladipate ( DHA ) provided by
Pilkington pic, and Diolpate 7170 from Hyperlast Ltd. Both these materials are adipic
esters. The structure of DHA is shown in figure 3.4, Diolpate 7170 is an oligomeric
adipate, and so has a very similar structure. The molecular weight of Diolpate 7170 is
1650 gmoT1 whereas the molecular weight of DHA is 258 gmol'1.
[CH3(CH2)500CCH2CH2]2
Figure 3.4 : Chemical structure of the plasticiser DHA
Due to the affinity of silanes for hydroxylated surfaces, it was often found that
silane grafting to the crystals occurred during experiments. In order to ensure the crystals
were free of silane or other contaminants before each experiment, a 3 stage cleaning
process was carried out after each experiment. The first stage was washing with hot 2-
butanone. This removed PVC from the surface, as well as any physisorbed silane. To
remove grafted silane, diamond polishing was carried out with 1 pm. diamond paste from
90

Kemet International Ltd. The efficacy of this procedure was verified by examining the
infrared spectra of the crystals before the experiment, after the experiment, and after
cleaning. No spectrum of silane was visible in the infrared spectra after cleaning. The
diamond polishing compound was .removed by further rinsing with hot 2-Butanone—The
final step was to expose the crystals to hot iso-propyl alcohol ( IPA ) for 6 hours. This
imparted hydrophilic character to the crystal surfaces, leading to more even cast PVC films.
3.1.2: Spectroscopic measurements
When infrared spectra were taken, the settings were as follows. The spectral range
was 400 - 4000 cm'1 with a resolution of 4 cm'1. A 90 % open iris and signal gain of 4
were used in order to maximise signal intensity. Purging of the spectrometer was not
carried out, as the reduction of water spectral intensity as a function of time would add a
systematic error to the results, especially where bands in the water vapour region ( i.e. 5
(NH) bending at 1600 cm'1 ) were used. The spectra were ratioed against the background
of the film before diffusion was begun. The number of scans co - added to obtain the
spectra varied between 76 and 520. Where fast kinetics were observed, fewer scans were
used to obtain data quickly, but where slow diffusion occurred, 520 spectra were taken to
optimise signal to noise.
91

3.1.3 : Spectra of materials
All of the results presented in this chapter were obtained by manipulation of the
infrared spectra of the materials investigated. This section contains reference spectra of the
materials used.
The spectra of the silanes used are presented in Figure 3.5. These were obtained by
transmission, by pressing neat liquid silane between two NaCl windows. The peaks
integrated for use as markers for diffusion are shown in Table 3.1.
Y9669
A1110
500
A1891
4000 3500 3000 2500W avenum ber (cm-1)
2000 1500 1000
Figure 3.5 : Transmission infrared spectra of the silanes
92

Silane Frequency AssignmentY9669 1602 cm’1 C=C ring stretch and
N-HbendY9669 3408 cm'1 N-H stretchA1110 1600 cm'1 N-HbendA1891 2565 cm-1 S-H stretch
Table 3.1: Infrared bands used for diffusion measurements
The band at 1602 cm’1 in Y9669 is in fact a combination of two bands. The 5(NH)
bend and v(C=C) stretching mode coincide and are impossible to tell apart even using
Fourier deconvolution or analysis of the second derivative of the line shape. Henceforth
the band is therefore referred to simply as the 1602 cm’1 band of Y9669.
The spectrum of PVC was obtained in the form of a film cast from DMF on an ATR
crystal and dried for 14 hours at 65°C. This is shown in Figure 3.6. Also shown is the
spectrum of DMF. The lack of the carbonyl stretching band of DMF at 1675 cm’1 clearly
demonstrates that the drying method used for the PVC films removes all the solvent. The
spectra of the two plasticisers used, DHA and Diolpate 7170 are shown in Figure 3.7.
93

1.5
PVC
Q •] --------
DMF
0-j—4000 3500
AjV JWV * v U V \ j
/M
3000 2500 2000
W avenum ber (cm-1)
IIIIt i tj \
1500 1000
Figure 3.6 : Infrared spectra of a PVC film cast from DMF and of neat DMF
1.2
DHA
Diolpate 7170
4000 3500 3000 2500
W avenum ber (cm-1)
2000 1500 1000
Figure 3.7 : Transmission infrared spectra of dihexyladipate ( DHA) and Diolpate 7170
94

3.2 : Silane underlayer experiments
Silane underlayer experiments were performed with prehydrolysed, dried films.
From the literature reviewed in chapterone, these may be expected to consist of
polymerised siloxane films.
In the first experiment, the ATR crystal was dipped in a 20% Y9669 solution. PVC
was then cast from a 5% MEK solution onto the silane film. The film was then allowed to
dry at room temperature in a vacuum desiccator for 30 minutes. A spectrum ( 128 scans )
was taken at this point. This was found to be necessary to avoid blistering of the PVC film,
when the laminate was placed in the oven and the highly volatile MEK rapidly boiled. The
laminate was then heated at 70°C for an hour and another spectrum taken. It was also
examined after 120 minutes, and 150 minutes of heating, also at 70°C. Spectra were also
taken every 3 minutes after heating had been completed. The area of the infrared spectra
showing the carbonyl stretching mode of the solvent, MEK ( at 1700 cm'1 ) as well as the
1602 cm'1 band of the Y9669 is shown in figure 3.8.
95

0 .8-
After vacuum dessication
/After 60 minutes heating
• A fte r -i 20 mi f i u i c g i i c a i i l ivj
After 150 minutes heating
After 150 minutes heating,then 100 minutes at room temperature
Before PVC deposition
0 .2-
1700 1650Wayenumbers
gure 3.8 : Spectra showing the carbonyl stretching mode of MEK and the 1602 cm'1 band ofY9669 in a silane underlayer experiment
Figure 3.8 shows that the intensity of the MEK band increases when the PVC is cast
onto the silane. This shows that the evanescent wave extended through the silane film, into
the PVC overlayer. Therefore, if diffusion of silane into PVC occurred, the diffusion
would have been detected. The MEK band then decreased rapidly when the film was
vacuum desiccated, and more slowly after this. This was due to evaporation of solvent
from the PVC film. The silane band however did not significantly change in intensity
throughout the experiment. This is shown more clearly in Figure 3.9. Figure 3.9 shows the
integrated areas of the two bands shown in Figure 3.8, as well as the 6(NH) stretching band
of Y9669 at 3408 cm'1, all plotted against experiment time.
96

28 -
24 -
m 12 -
100 150Tim e ( m in u te s )
200 300250
A rea a t 1600 cm-1 A rea a t 1700 cm-1 A rea a t 3408 cm-1
gure 3.9 : Infrared silane underlayer results, showing area of Y9669 bands at 1602 cm'1 and 3400 cm'1 and solvent band at 1700 cm'1 plotted vs. time
It should be noted firstly that the two silane bands both followed the same trend,
showing that any variation was indeed due to concentration change in silane as assumed,
and not due to reaction of the bond giving rise to the vibration. It can be seen again that
there was little if any change in silane band area, and therefore no silane diffusion. The
first part of the experiment was under vacuum conditions at room temperature, then the
laminate was exposed to a temperature of 70°C until 170 minutes, and thereafter was left at
room temperature. Therefore this experiment shows that the prehydrolysed silane film did
not interdiffuse significantly with PVC at room temperature or at 70°C. This experiment
was repeated several times, but no indication of interdiffusion was detected.
97
It seems likely that the reason why no diffusion occurred was condensation of the
silane molecules to form a polymerised siloxane film. If the silane film had condensed into
a polymerised siloxane upon hydrolysis and heating, then interdiffusion would have been
expected to have been considerablv-slowed, or even stopped compared with un-hvdrolvsed
silane. In order to assess diffusion of un-hydrolysed silane, the silane overlayer geometry
was adopted. This is described in the next section.
3.3.: Silane overlayer experiments
3.3.1: Silane overlayer experiments : heat - induced diffusion
One other reason why interdiffusion could not be seen in the silane underlayer
experiments may have been that if diffusion did occur, only a small change in a large value
would occur. This is because assuming that most of the silane stayed near the ATR crystal
surface, this part would dominate the ATR spectrum. It was therefore decided to
investigate the diffusion of silane from the outside of a PVC film towards the ATR crystal.
This would take advantage of the sensitivity of the ATR evanescent field, because even a
small amount of silane reaching the ATR crystal surface would give rise to a high intensity.
The silane could also be investigated in its un-hydrolysed, un-condensed state, which was
considered to be more likely to show diffusion.
98
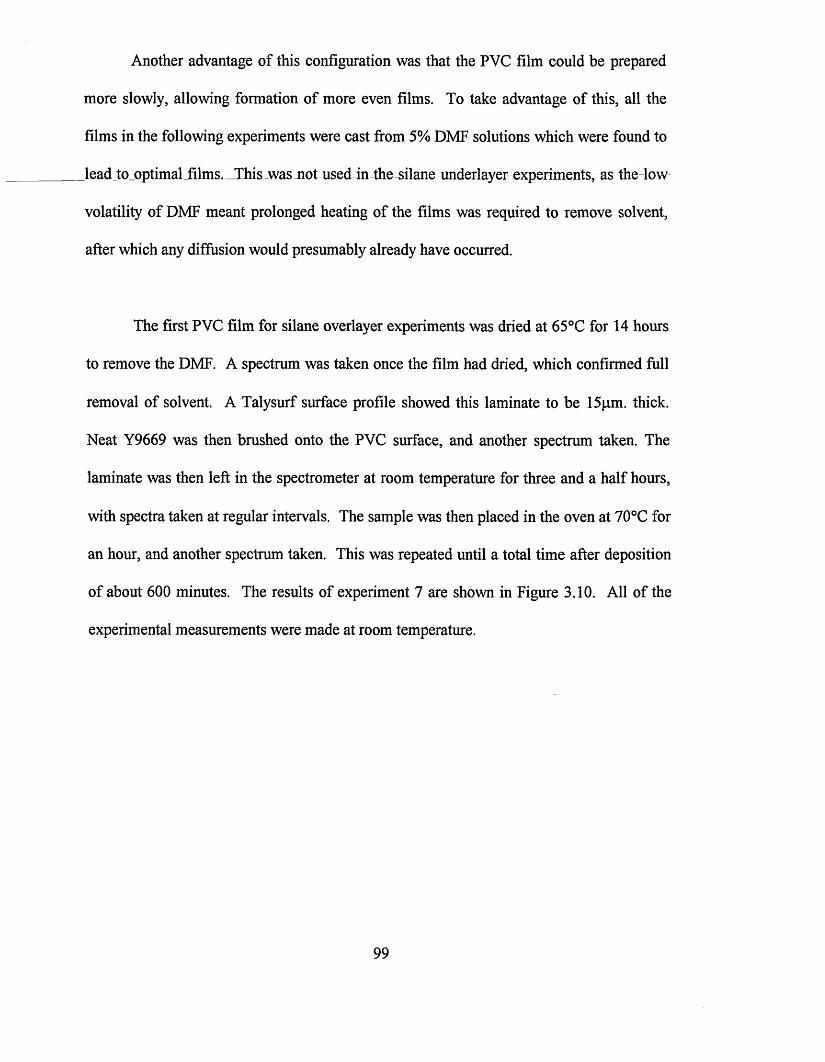
Another advantage of this configuration was that the PYC film could be prepared
more slowly, allowing formation of more even films. To take advantage of this, all the
films in the following experiments were cast from 5% DMF solutions which were found to
lead to optimal films. This was not used in the silane underlayer experiments, as the low
volatility of DMF meant prolonged heating of the films was required to remove solvent,
after which any diffusion would presumably already have occurred.
The first PVC film for silane overlayer experiments was dried at 65°C for 14 hours
to remove the DMF. A spectrum was taken once the film had dried, which confirmed full
removal of solvent. A Talysurf surface profile showed this laminate to be 15pm. thick.
Neat Y9669 was then brushed onto the PVC surface, and another spectrum taken. The
laminate was then left in the spectrometer at room temperature for three and a half hours,
with spectra taken at regular intervals. The sample was then placed in the oven at 70°C for
an hour, and another spectrum taken. This was repeated until a total time after deposition
of about 600 minutes. The results of experiment 7 are shown in Figure 3.10. All of the
experimental measurements were made at room temperature.
99

570 minutes.15
4 /0 minutes
350 minutes
270 minutesd>oc
220 minutesIO</)100 minutes
0 minutes
f’ ■G'N
-.05
17001750 1650 1600 1550 1500 1450 1400Wavenumbers
Figure 3.10 : Spectra showing the 1602 cm'1 Y9669 after various times at room temperatureand after annealing at 70°C
In order to show how the intensity of the silane spectral bands vary with time and
temperature, the intensity of the 1602 cm '1 band of Y9669 has been plotted versus
experiment time. This is shown in Figure 3.11.
100

2.5
2 ~room temperature
■o
g 0.5 -
-0.5100 200 300
Tim e ( m in u te s )400 600500
-x -A re a a t 1602 cm-1
Figure 3.11: The area of the 1602 cm*1 band of Y9669 plotted vs. time for the first silaneover layer experiment
When the first spectrum was taken, there was no sign of silane. No silane intensity
appeared even after 220 minutes at room temperature. At 70 °C however, silane band
intensity increases with time. It appeared that diffusion was still occurring after 350
minutes at 70 °C. This implies that diffusion occurs, but only at elevated temperatures.
Alternatively, diffusion at room temperature occurs so slowly that on the time-scale used
here ( i.e. up to 4 hours) it is not seen. It was thought that the diffusion at 70°C may have
been due to the PVC being near its glass transition temperature ( Tg). The Tg of pure PVC
is 80°C.
101

In the second overlayer experiment, similar conditions to those in the first
experiment were used, but the laminate was not left at room temperature before heating.
The laminate was examined in the spectrometer immediately after silane deposition, and
then placedjn the_oven at_70_C. Jiie^ample was then periodically removed from the oven
and another spectrum taken. The results of this experiment are shown in
Figure 3.12. This laminate was 13.5 jam thick. It can be seen that after 30 minutes
diffusion was almost complete and that after this an equilibrium was reached in the
diffusion, little if any further diffusion occurring up to 350 minutes.
30
25
5
00 100 200 400300
Time ( m in u te s )
A rea a t 1602 cm-1
Figure 3.12 : The intensity of the 1602 cm-1 band of Y9669 plotted versus annealing time at 70°C for the second silane overlayer experiment ( all measurements were made at room
temperature)
102

It is interesting to compare the results of this experiment with those of the previous
experiment, which was carried out under the same conditions, but without the 4-hour pause
at room temperature at the start. In the first experiment, the heating was stopped after 350
minutes, at which time the diffusion was not complete. In the second experiment however,
( and similarly in subsequent experiments ) diffusion appears to be almost complete after
30 minutes of heating. The difference in the results must be due to the time spent at room
temperature. It has been reported that aminosilanes can hydrolyse over a period of a few
hours, after being exposed to small amounts of water7 or to atmospheric water8,9 ( see
section 1.2.2 ). It may be that by the time the heating was carried out, the silane had
hydrolysed, leading to a change in diffusion properties. If this is the reason for the change
in diffusion rate, this implies that hydrolysed silanes diffuse more slowly. We believe that
this is the first time that a definite connection has been made between the hydrolysis of a
silane and its ability to diffuse through a polymeric matrix. At first glance, it is not obvious
why hydrolysis should reduce a silanes ability to undergo diffusion. However, if the
hydrolysis of the silane is considered as merely the first step on the reaction pathway to
condensation ( see chapter 1 ), then this result makes more sense. It is well known that
larger molecules tend to show much slower diffusion than smaller molecules10. Therefore
it is assumed that the hydrolysis of the silanes slows diffusion by allowing the silanes to
condense to form oligomers.
In order to study the diffusion at 70°C for all three silanes, an experiment was
carried out under the same conditions for all three silanes. A PVC film was cast from DMF
103

solution, to give a film 10 pm. thick. The silane was then brushed on top, and the laminate
examined in the spectrometer. The laminate was then successively exposed to
temperatures of 70 °C for periods of five or ten minutes, and a spectrum taken. The results
from the Y9669 experiment are shown in Figure-3. 13. These results show the integration
of the 1602cm'1 band of Y9669 versus time.
10
8
6
T34
o
2
00 10 20 30 40 50
Time ( m in u te s )
A rea a t 1602 cm-1
Figure 3.13: The intensity of the 1602 cm'1 band of Y9669 vs. time at 70 °C ( all measurements were made at room temperature)
These results, as expected, show much the same as Figure3.12, i.e. fast diffusion at
first, reaching equilibrium after around thirty minutes. This shows the results to be
reproducible and also that the kinetics are reasonably independent of the length of time
104

spent in the oven, as the results shown in Figure 3.12 were obtained with longer heating
intervals, but show similar kinetics. The results of the same experiment carried out using
A1110 are shown in Figure 3.13. The PVC film was 12 pm. thick.
0.02
0.015 -
0.01 -
c 0.005 --
- 0.01 - -
-0.015
100 120Time ( m in u te s )
-* -A re a a t 1600 cm -1
Figure 3.14 . The area of the N-H bending mode of A1110 ( 1600 cm'*) vs. time at 70 °C ( all measurements were made at room temperature)
Clearly, in Figure 3.14, no overall trend in the intensity at 1600 cm'1 was seen. This
indicated either that there was no diffusion, or limited diffusion so that the silane did not
reach the evanescent field. The reason for this is not clear. It may be that there was some
reaction occurring which prevented the diffusion of the silane. This may be hydrolysis
possibly leading to partial condensation of the silane. It might be expected that the heating
105
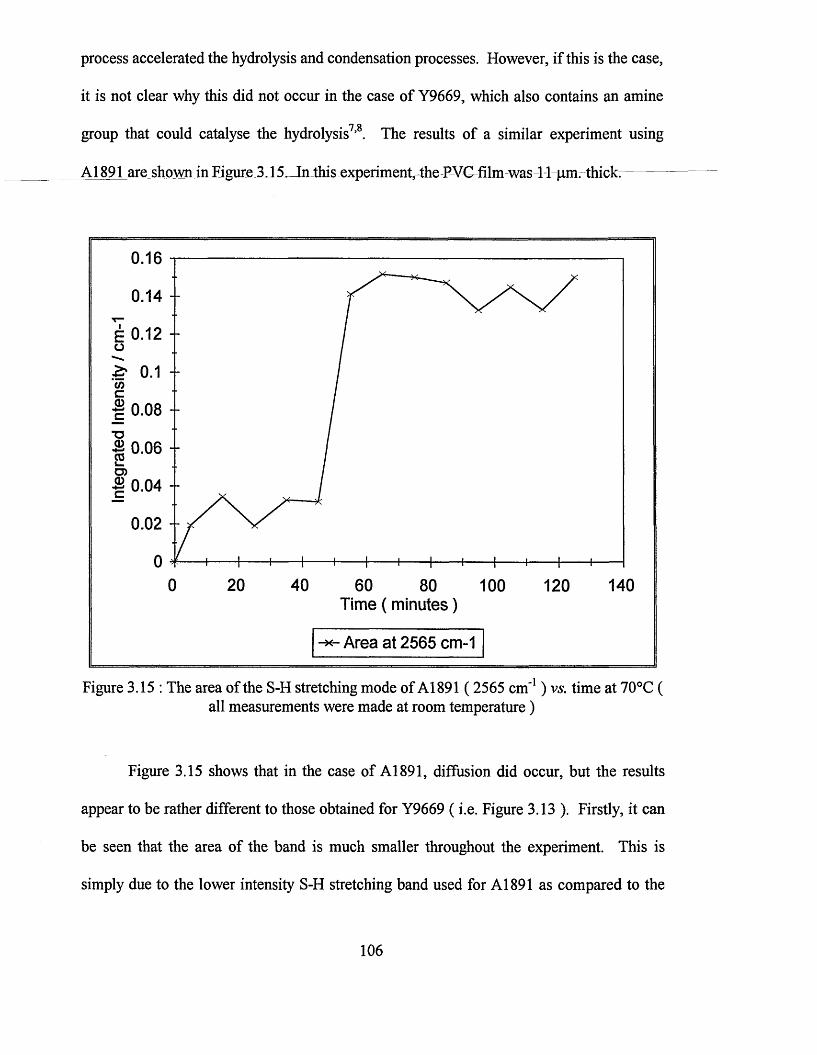
process accelerated the hydrolysis and condensation processes. However, if this is the case,
it is not clear why this did not occur in the case of Y9669, which also contains an amine
group that could catalyse the hydrolysis7,8. The results of a similar experiment using
A1891 are shown in Figure.3 J 5. Jnthis .experiment.-the-PVC film was 11 pm. thick.--------
0.16
0.14
I 0.12
0.1
0.08TD
0.06D)
0.04
0.02
00 20 40 60 14010080 120
Tim e ( m in u te s )
A rea a t 2565 cm-1
Figure 3.15 : The area of the S-H stretching mode of A1891 (2565 cm'1) vs. time at 70°C ( all measurements were made at room temperature)
Figure 3.15 shows that in the case of A1891, diffusion did occur, but the results
appear to be rather different to those obtained for Y9669 ( i.e. Figure 3.13 ). Firstly, it can
be seen that the area of the band is much smaller throughout the experiment. This is
simply due to the lower intensity S-H stretching band used for A 1891 as compared to the
106

very intense C=C ring stretch used for Y9669. The diffusion also appears to be slower,
with a period, between zero time and 45 minutes in which little if any diffusion occurs,
then a large step at about 50 minutes time, after which equilibrium is attained. One
explanation for this is the smaller dp of-the A1891 band (O.Spm.for 2565 cm'1-vs. 0.5 pm.
for 1602 cm'1, see equation 2.13 ) compared to the Y9669 band. This means the
evanescent field extends less far into the PVC film, so the silane takes longer to interact
with it. In fact, as explained in chapter 2, the infrared intensity measured depends upon the
square of the evanescent field strength, making the dependence on dp even stronger. This
seems unlikely to be the entire explanation however, as the difference between the dp
values is quite small compared to the entire distance the polymer diffused ( ca. 10 pm .). It
is known that steric effects can change diffusion rates. Larger molecules tend to diffuse
more slowly under the same conditions than small molecules10. However, this effect would
lead one to expect slower diffusion for Y9669, as the phenylamino group is much larger
than the mercapto group of A 1891. Therefore, steric effects do not explain the change.
The film used in the A 1891 experiment was somewhat thicker than that used in the Y9669
experiment (11 pm. for Y9669 as opposed to 8 pm. for A1891 ). This seems most likely
to explain the differences in the results.
107

3.3.2 : Silane overlayers - plasticised PVC
In order to test the theory that the PVC being near its glass transition temperature (
Tg ) allows diffusion.itwas decided to plasticise the PVC.—Adding a plasticiser to a
polymer formula reduces the Tg of the resulting polymer. Different plasticisers are used
with different polymers. In the case of PVC, the most common plasticisers are phthalate
esters and adipic esters11. The plasticiser used here is the adipic ester DHA ( see Figure 3.4
). DHA is soluble in DMF, so it was simple to form films with the desired plasticiser
content by dissolving both PVC and DHA in DMF prior to casting.
In the first experiment, the plasticised PVC film contained 30% DHA, and was l ip
m. thick. After removal of the DMF solvent, a background spectrum was taken, and then
Y9669 was brushed on top of the PVC film. The laminate was then immediately placed in
the spectrometer and one spectrum taken per minute for 2 hours. The film was not heated
at all to induce diffusion. The results in the 1600 cm'1 region are shown in Figure 3.16.
108
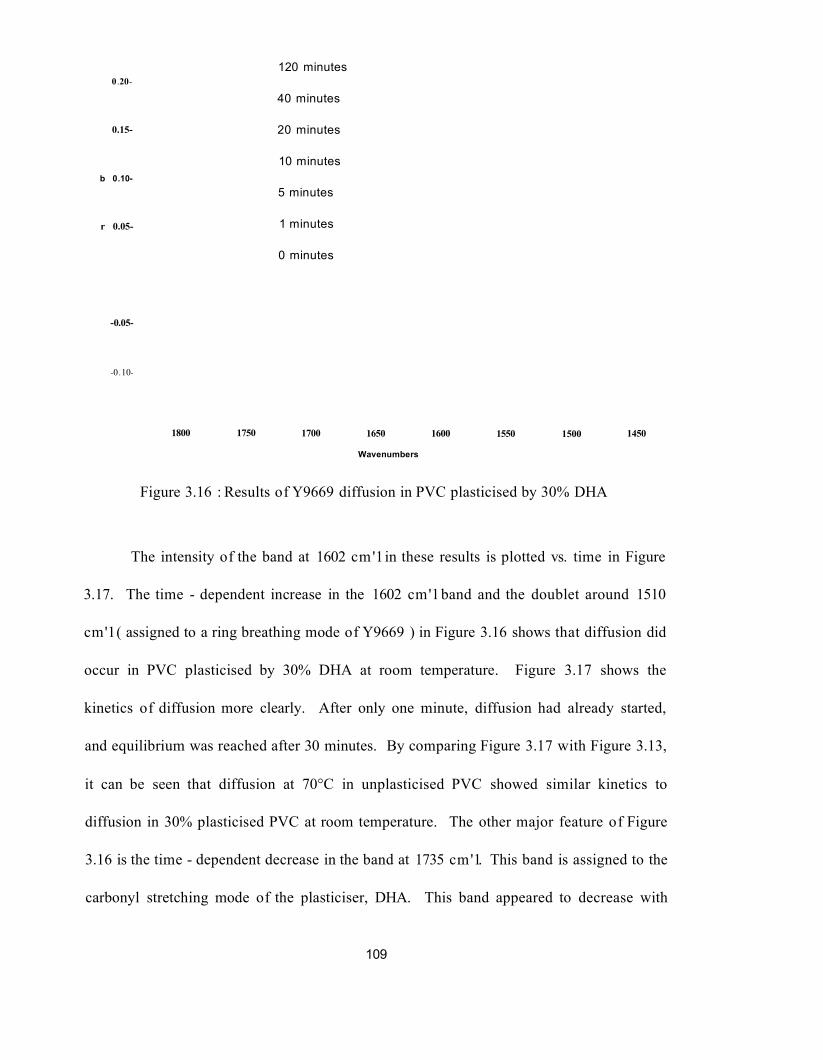
120 minutes0.20-
40 minutes
20 minutes0.15-
10 minutesb 0 .10-
5 minutes
r 0.05- 1 minutes
0 minutes
-0.05-
-0 .10-
1800 1750 1700 1650 1600 1550 14501500
Wavenumbers
Figure 3.16 : Results of Y9669 diffusion in PVC plasticised by 30% DHA
The intensity of the band at 1602 cm'1 in these results is plotted vs. time in Figure
3.17. The time - dependent increase in the 1602 cm'1 band and the doublet around 1510
cm'1 ( assigned to a ring breathing mode of Y9669 ) in Figure 3.16 shows that diffusion did
occur in PVC plasticised by 30% DHA at room temperature. Figure 3.17 shows the
kinetics of diffusion more clearly. After only one minute, diffusion had already started,
and equilibrium was reached after 30 minutes. By comparing Figure 3.17 with Figure 3.13,
it can be seen that diffusion at 70°C in unplasticised PVC showed similar kinetics to
diffusion in 30% plasticised PVC at room temperature. The other major feature of Figure
3.16 is the time - dependent decrease in the band at 1735 cm'1. This band is assigned to the
carbonyl stretching mode of the plasticiser, DHA. This band appeared to decrease with
109

very similar kinetics to the kinetics of the increase in the silane bands. This is discussed
further later in this section.
3.5
2.5
0.5
120100Time ( m in u te s )
A rea a t 1602 cm-1
Figure 3.17 : The area of the 1602 cm'1 band of Y9669 vs. time for diffusion in PVCplasticised by 30% DHA
In order to determine the effect of silane chemistry on diffusion characteristics, the
same experiment was also carried out using A ll 10 and A1891. Figure 3.18 shows the
results of A ll 10 diffusion in PVC plasticised with 30% DHA. The laminate was 16 pm.
thick. It can be seen from the increase in NH bending mode intensity at 1600 cm'1 that
A1110 was observed to have diffused at room temperature in 30% plasticised PVC. It can
also be seen that the same decrease in the plasticiser band at 1735 cm'1 was observed. The
110

smaller intensity of the silane band compared to that of Y9669 was not a concentration
effect; it can be seen from Figure 3.5 that the band used for A1110 is much smaller than
that used for Y9669. Y9669 was chosen for study because although it is not as widely used
as A ll 10 or A1891 industrially12’13, it has very strongly absorbing bands in both infrared
and Raman spectroscopy. Throughout the work described here, better signal to noise was
found for Y9669 than for A1110 or A 1891. The band due to NH bending in A1110 is also
broader that the 1602 cm'1 band in Y9669, leading to more interference from the water
vapour absorptions which occur in this part of the infrared spectrum.
0 . 05-
-o.oo-
0 minutes.-0 . 05- 5 minutes
10 minutes
30 minutes
90 minutese-0 .10 -
120 minutes
- 0 . 15-
16501750 1700 1600 1550
W a v e n u m b e rs
Figure 3.18: Results of A1110 diffusion in PVC plasticised with 30% DHA
111

The area of the NH bending band of A1110 vs. time for this experiment is plotted in Figure
3.19.
0.2
100 120Time ( m in u te s )
A rea a t 1600 cm-1
Figure 3.19: The area of the NH bending mode of A1110 (1600 cm'1) vs. time for A1110diffusion in 30% DHA plasticised PVC
Figure 3.19 shows that A ll 10 diffused considerably more slowly than Y9669 in
30% DHA plasticised PVC. Y9669 had reached equilibrium after around 30 minutes,
whereas A ll 10 took about 90 minutes. This might be due in part to the increased
thickness of the polymer film.
Figure 3.20 shows the results of A1891 diffusion in 30% DHA plasticised PVC.
The laminate was 15 pm. thick. The spectral region shown is that containing the SH

stretching vibration of the A 1891. This region does not show any plasticiser bands, but it
was observed that the band at 1735 cm’1 decreased in intensity with time, as was observed
for the other silanes. It can be seen from Figure 3.5 that the intensity of this band ( 2565
cm'1 ) is very low, and this explains the low signal to noise ratio seen in Figure 3.20.
Fortunately, there is no absorption from water vapour or carbon dioxide in this region, so
no interference from these fluctuating bands occurred.
90 minutes0 .0020-
20 minutes
minutes0.0015-
6 minutes6 .0010-
2 minutes
0 minutes
0 .0000-
-0.0005-
-0 .0010 -
2600 2550 2500
Waven umbers
Figure 3.20 : Results of A1891 diffusion in PVC plasticised with 30% DHA
It can be seen from the increase in SH stretching vibration intensity in Figure 3.20
that A 1891 also diffused in 30% DFIA plasticised PVC at room temperature. The area of
the SH stretching vibration of A1891 is plotted vs. time in Figure 3.21 for this experiment.
113
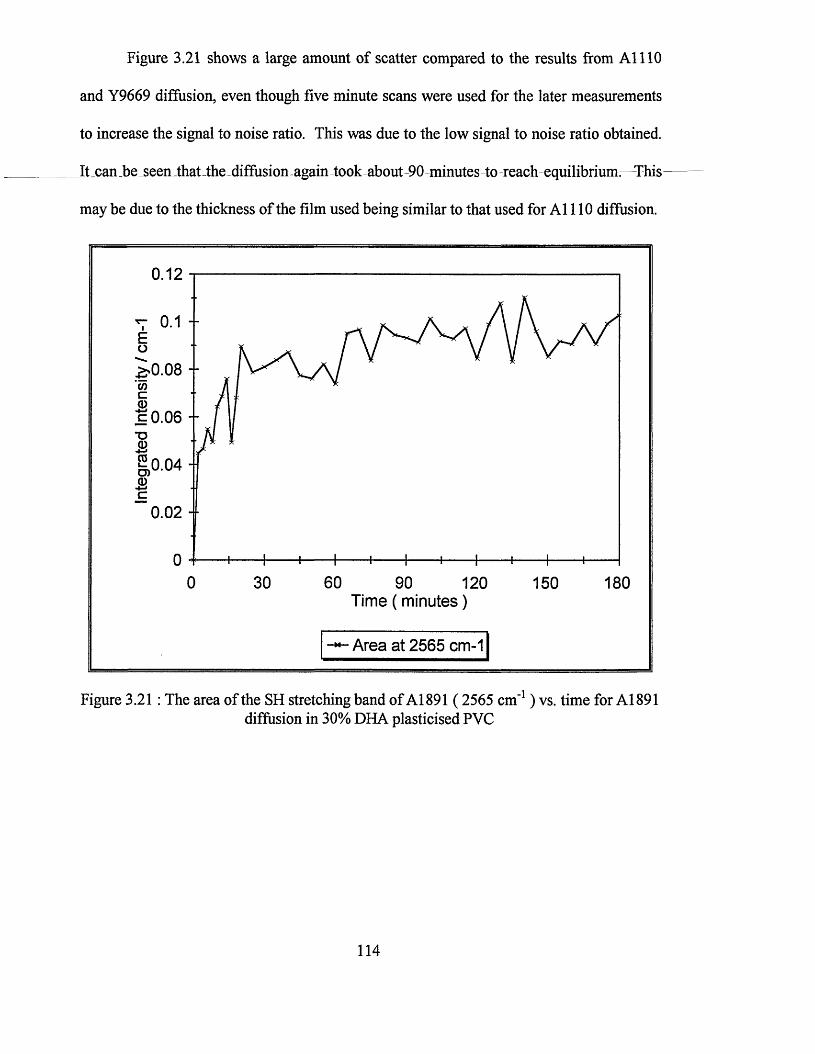
Figure 3.21 shows a large amount of scatter compared to the results from A ll 10
and Y9669 diffusion, even though five minute scans were used for the later measurements
to increase the signal to noise ratio. This was due to the low signal to noise ratio obtained.
It can be seen that the diffusion again took about 90 minutes to reach equilibrium. This
may be due to the thickness of the film used being similar to that used for A1110 diffusion.
0.12
c 0.06
0.04O)
0.02
180120 150Tim e ( m in u te s )
A rea a t 2565 cm-1
Figure 3.21 : The area of the SH stretching band of A1891 ( 2565 cm"1) vs. time for A1891diffusion in 30% DHA plasticised PVC
114

3.3.3 : Silane overlayer experiments : kinetic analysis of data
It is clear from the results presented above that diffusion of organosilanes in
plasticised P VC occurs jreadily, and -that the -kinetics of-the process may be affected by a
number of factors, e.g. film thickness, silane chemistry and plasticiser concentration. In
order to quantify the kinetics of diffusion it was decided to attempt the fitting of the data to
theoretical models of diffusion ( see section 2.1.4.1 ). The first model investigated was
simple Fickian case I diffusion14. A program written in the Matlab programming and
visualisation package was used to perform the fittings. This program has been previously
described15,16. The program starts with an estimated value for the Fickian diffusion
coefficient, D, and uses the calculated value of dp ( obtained from equation 2.14 ) and
measured values of the film thickness, L and the equilibrium value of the absorbance, Aoo.
The program then uses equation 2.20 to calculate what the diffusion profile would be for
the estimated diffusion coefficient. This profile is compared to the input data from the
experiment. The %2 merit function is used as a measure of the closeness of the fit between
the data and the calculated diffusion profile. The diffusion coefficient is then iteratively
modified in order to minimise the difference between the calculated and measured
diffusion profiles. One disadvantage of this fitting technique is that the program is unable
to distinguish between the true ‘best fit’ and any local minima in the fit error obtained. In
order to overcome this problem, several fittings were used for each set of data investigated,
using different estimated diffusion coefficients. The result of the fitting performed on the
data obtained for Y9669 diffusion in 30% DHA plasticised PVC is shown in Figure 3.22.
115

0.8
0.6*D
0)0.4o Experimental — Calculated
0.2 1 0 um thickD = 2.225e-008 cm A2/j; ChiA2 = 0.22
100
Figure 3.22 : Results of fitting Fickian case I diffusion model to data from Y9669 diffusionin 30% DHA plasticised PVC
Figure 3.22 shows that the data did not fit the Fickian case I diffusion model well at
all. This result was found to be typical of the data obtained; in no case did the data fit this
model. The second model assessed was the dual mode sorption model ( see section 2.1.4.1
). The method of fitting was very similar, but because the dual mode sorption model uses
two diffusion coefficients, a Pascal program which applies the Levenberg - Marquardt
fitting routine to the fitting process was used. This program has been well described
17previously . The Levenberg - Marquardt routine is a method for fitting a set of data with
more than one parameter. Like the Fickian case I fitting process, it relies on the
minimisation of the %2 merit function between the data and the calculated diffusion profile
116

from estimated parameters. The equation used to generate the calculated curve was
equation 2.21. The result obtained from the fitting of the dual mode sorption model to the
data obtained for Y9669 diffusion in 30% DHA plasticised PVC is shown in Figure 3.23
3.5
X Experimental data — Dual sorption model
2.5
O)
0.5
20 40 100 120Time ( m inutes
Figure 3.23 : Results of fitting the dual mode sorption model to data from Y9669 diffusionin 30% DHA plasticised PVC
Figure 3.23 clearly shows that the data fit a dual mode sorption model. The
parameters obtained for this fitting are shown in Table 3.2.
117

Parameter Value
Di 6.5xl0'8 cmV1
rv Q G-l- 1 G*9 „m 2 -li>2 y.yxiu cm s
Xj 0.89
Table 3.2 : Band fitting parameters obtained from dual mode sorption fitting of Y9669diffusion in 30% plasticised PVC
The dual mode sorption model assumes that two species undergo diffusion into the
polymer film. A ‘mobile’ species diffuses with one diffusion coefficient into the film, and
an ‘immobile’ species diffuses with another diffusion coefficient. It can be seen from
Table 3.2 that D2 is more than an order of magnitude lower than Di. The parameter X]
represents the fraction of material which is ‘mobile’, i.e. the fraction of diffusion which
occurs with diffusion coefficient Xi therefore always has a value between 0 and 1. In
the basic theory of dual mode sorption, one species is relatively immobilised at sites in the
polymer network, for example voids, whilst the rest of the molecules are free to diffuse
through the polymer18,19. However, the two species are in fact both partially mobile.
Therefore the two species might not be chemically different molecules, but are often
considered to be the same molecule, but in different environments in the polymer matrix.
In order to investigate the effect of different plasticiser concentration on the
diffusion, experiments were carried out as described above for PVC films with 15, 20, 25,
30, 35 and 40% DHA for all three silanes. The results are presented in Table 3.3. In
several cases, two or three runs were carried out in order to check the validity of the results.
118

In these cases, mean values of the diffusion coefficients have been presented. It was found
that for all the experiments, the dual mode sorption model fitted much better than the case I
model. Therefore table 3.3 shows only the diffusion coefficients for the dual mode
sorption fitting.------------------------------------------------------------------------------------------------
Plasticiser Concentration Y9669 A1110 A189140% DHA Dj = 3.25X10*6
D2 = 5.27x10'7 Xi = 0.88
D1=4.35xl0'6 D2 = 2.16xl0‘7
X! = 0.46
Dj = 1.04xl0‘3 D2 = 2.76x1 O'7
Xj = 0.7035% DHA Dj = 2.35xl0'7
D2 = 1.755xl0‘8 X! = 0.95
D 1 = 7.49xl0‘6 D2 = 4.03x1 O'8
X! = 0.57
Dj = 6.86xl0'6 D2 = 1.36x1 O'7
X! = 0.5630% DHA Di = 6.51xl0’8
D2 = 8.79x1 O’9Xi = 0.81
Dj = 6.02x10*7 D2 = 3.45x10‘8
X! = 0.43
Dj = 7.86xl0‘7 D2 = 2.89xl0‘8
Xj = 0.7625% DHA Dj = 8.48xl0*8
D2 = 3.53xl0'8 Xi = 0.62
Dj = 1.84xl0‘7 D2 = 1.87xl0'8
Xj = 0.29
Dj = 9.87xl0'8 D2 = 9.51xl0*8
Xj = 0.9820% DHA Di = 5.79xl0‘8
D2 = 7.88x10‘9 Xi = 0.37
D! = 6.02xl0'8 D2 = 5.49xl0'9
Xi = 0.24
Di = 6.03xl0‘8 D2 = 2.43x1 O’9
Xj = 0.6015% DHA Di = 8.96xl0'9
D2 = 8.55xl0*9 Xj = 0.69
D,=6.16xl0*8 D2 = 1.20xl0'8
Xi = 0.20
No result
Table 3.3 : Diffusion coefficients obtained from fitting the data from silane diffusion in DHA plasticised PVC to the dual mode sorption model
It was found that no fitting was possible in the case of A1891 in 15% DHA
plasticised PVC. This result is discussed later, with the other A1891 results.
In order to demonstrate graphically the trend in the data in Table 3.3, the log of the
diffusion coefficients has been plotted versus the percentage of DHA. The log of the two
119
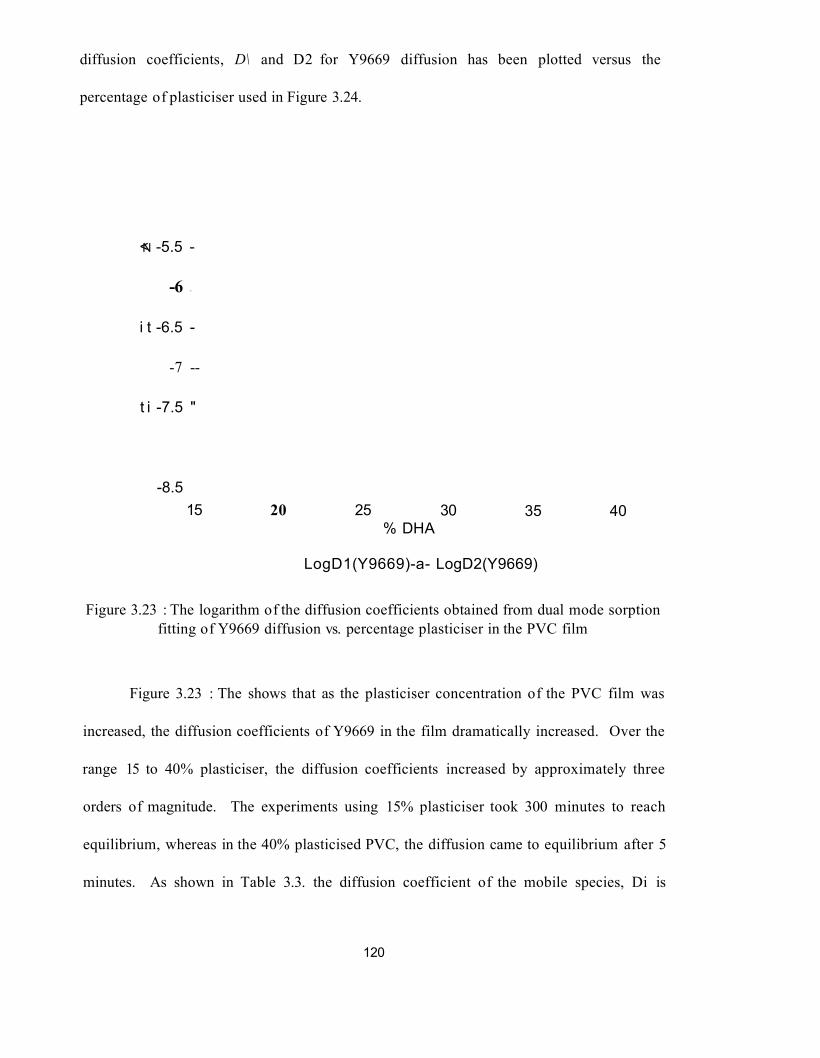
diffusion coefficients, D\ and D2 for Y9669 diffusion has been plotted versus the
percentage of plasticiser used in Figure 3.24.
<n -5.5 -
-6 -
i t -6.5 -
-7 --
t i -7.5 "
-8.515 20 25 30 35 40
% DHA
LogD1(Y9669)-a- LogD2(Y9669)
Figure 3.23 : The logarithm of the diffusion coefficients obtained from dual mode sorption fitting of Y9669 diffusion vs. percentage plasticiser in the PVC film
Figure 3.23 : The shows that as the plasticiser concentration of the PVC film was
increased, the diffusion coefficients of Y9669 in the film dramatically increased. Over the
range 15 to 40% plasticiser, the diffusion coefficients increased by approximately three
orders of magnitude. The experiments using 15% plasticiser took 300 minutes to reach
equilibrium, whereas in the 40% plasticised PVC, the diffusion came to equilibrium after 5
minutes. As shown in Table 3.3. the diffusion coefficient of the mobile species, Di is
120

generally at least an order of magnitude greater than the diffusion coefficient of the
immobile species, D2. An exception to this is the data obtained for the 15 % plasticised
film. It was thought that this may indicate that this diffusion does not fit the dual mode
sprption model properly. Jh eiittin g of this data to the dual mode sorption model is shown
in Figure 3.24. For comparison, the results of fitting this data to the case I diffusion model
are shown in Figure 3.25.
0.25
0.2
© 0.15ual sorption fi■o
0.05
100 150 200 250 300 350 400Time ( m in u te s )
Figure 3.24 : Results of fitting data from Y9669 diffusion in 15% DHA plasticised PVC tothe dual mode sorption model
Figure 3.24 shows that although the fit of the data to the dual mode sorption model
is not as good as shown by diffusion in 30% DHA plasticised PVC ( Figure 3.23 ), it is still
121

quite a good fit. Comparison with Figure 3.25 shows that the data fits the case I diffusion
model much more poorly. It is not known why the fitting process produced very similar
values for Di and D2 in this case.
0.8
0.6TD
0)0.4o Experim ental — C alculated
0.2 8 um thick D = 6 .5e-009 ChiA2 = 0.6921
Figure 3.25 : Results of fitting data from Y9669 diffusion in 15% DHA plasticised PVC tothe Fickian case I diffusion model
In order to determine the cause of the decrease in plasticiser band intensity ( see
Figure 3.16 ), it was decided to attempt to determine the kinetics of the decrease. A plot of
the integrated intensity of this band vs. time is shown in Figure 3.26. This data was
obtained for Y9669 diffusion in 30% DHA plasticised PVC.
122

O)
120100Time ( m in u te s )
A rea a t 1732 cm-1
Figure 3.26 : The area of the carbonyl stretching mode of DHA ( 1732 cm'1) plotted vs. time for Y9669 diffusion in 30% DHA plasticised PVC
Comparison of Figure 3.26 with Figure 3.17 shows that to a first approximation, the
decrease in the band intensity of DHA shows the same kinetics as those shown by Y9669.
In order to test the match in kinetics more closely, the dual mode sorption fitting program
was applied to the data shown in Figure 3.26. The results are shown in Figure 3.27.
123

:ion model-0.5
-1.5
"O-2.5
CD
-3.5
100 120Time ( m in u te s )
Figure 3.27 : The results of fitting the decrease in DHA band intensity ( 1732 cm'1) to thedual mode sorption diffusion model
Figure 3.27 shows that the decrease in DHA carbonyl stretching intensity fit very
well to the dual mode sorption model. This data was found not to fit well to the case I
diffusion model. The diffusion coefficients generated by the fitting procedure are given in
Table 3.4.
124

Parameter Value
Di 8.54xl0'8cm2s*1
TV A 1 fl"8 r-m2cJ1*2 /D X I U C lll s
X! 0.46
Table 3.4 : Diffusion coefficients obtained from fitting the decrease in DHA band intensity (1732 cm'1) to the dual mode sorption diffusion model
Table 3.4 shows that the mobile diffusion coefficient ( D! ) generated for the
plasticiser is very similar to that of the silane diffusion. The ‘immobile’ diffusion
coefficient ( D2 ) was somewhat larger however. It is believed that the similarity in the
kinetics of the decrease in the plasticiser band and the increase in the silane bands indicates
that the silane displaced the plasticiser from the polymer film in the evanescent field,
possibly due to swelling of the polymer film, or migration of the plasticiser to the outside
of the film. This is discussed in greater detail later.
The log of the two diffusion coefficients, Di and D2 for A ll 10 diffusion has been
plotted versus the percentage of plasticiser used in Figure 3.28.
125

-7 -
£ -7 .5 -- JoCD
-8.515 20 25 30 35 40
% DHA
LogD1(A1110) -e- LogD2(A1110)
Figure 3.28 : The logarithm of the diffusion coefficients obtained from dual mode sorption fitting of A1110 diffusion vs. percentage plasticiser in the PVC film
Figure 3.28 shows that in the case of A ll 10 diffusion, much the same trend was
seen in the diffusion coefficients as was seen in the case of Y9669 diffusion. Both and
D2 increased overall with increasing plasticiser concentration. The greatest increase in the
size of the diffusion coefficients occurred between 30 and 35 % DHA. Unlike the Y9669
data, at 15% plasticiser, the value of D2 was approximately an order of magnitude less than
that of D h as in all the plasticiser loadings. All the data fitted well to the dual mode
sorption model.
126

CN£-5 --
-7 --
15 20 25 30 35% DHA
[-* - LogD1(A1891)-B- LogD2(A1891)
Figure 3.29 : The logarithm of the diffusion coefficients obtained from dual mode sorption fitting of A1891 diffusion vs. percentage plasticiser in the PVC film A1891
Figure 3.29 shows that in the case of A1891 diffusion, a similar trend was seen in
the diffusion coefficients as was seen in the case of Y9669 diffusion. Both D! and D2
increased overall with increasing plasticiser concentration. Like the Y9669 data, one point
showed Di and D2 with very similar values, but in this case it was the point at 25% DHA.
Again it was suspected that this meant a poor fit to the dual mode sorption model.
However, upon attempting to fit the data to the case I model, it was found that the data did
not fit to the Fickian Case I model. The data was found to fit much better to the dual mode
sorption model.. Again, the reason for the very similar diffusion coefficients is not known.
127

The results from the experiment where no fitting was possible ( A1891 in 15% DHA
plasticised PVC) are shown in Figure 3.30.
0.08
0 O.O6
o>0.02
100 200Tim e ( m in u te s )
300 400
A rea a t 2565 cm-1
Figure 3.30 : The area of the v(SH) stretching band of A1891 ( 2565 cm'1) vs. time fordiffusion in 15% DHA plasticised PVC
Figure 3.30 shows that normal diffusion did not occur : the initial diffusion to the
maximum intensity obtained occurred extremely quickly, and after this the intensity
decreased, apparently reaching equilibrium at a lower intensity after about 300 minutes. It
is not known why this occurred. The experiment was repeated twice and the same results
observed each time. One possibility is that the initial increase was due to diffusion of the
silane to the interface and that the subsequent decrease in intensity was due to swelling of
128
the PVC film. However, this seems unlikely, as it was seen in only this case; if swelling
due to the presence of the silane were to blame, then it would be expected that it would
occur in more than just this one experiment. Another possibility is that the behaviour was
due toJhejmicrostnicture of-the film.^This would explain why the effect occurred for one
plasticiser concentration, but not why it did not occur for the other silanes. It may be that
in the case of this particular plasticiser concentration, cracks or pinholes occurred in the
polymer film, allowing fast initial diffusion to the surface of the ATR crystal, followed by
diffusion into the bulk of the PVC film. This hypothesis is also very uncertain, however, as
it does not explain why the effect was only seen with the silane A1891.
3.3.4 : Silane overlayers - PVC plasticised with polymeric plasticiser
In order to determine the effect of type of plasticiser on diffusion, it was decided to
study the diffusion of silanes in PVC plasticised with a polymeric plasticiser. It is well
known that in polymeric materials containing plasticiser, plasticiser migration can
occur20,11. This can occur as a result of weathering, swelling, temperature changes, or
simply as a function of time. It was shown that upon allowing silanes to diffuse into PVC
containing a monomeric plasticiser, a decrease in the plasticiser band intensities was
observed. It was thought that this may have been due to the plasticiser migration out of the
bulk of the film towards the outer surface of the film. Another possibility is that the PVC
film swells when the silane diffuses into it. Because the volume sampled by the evanescent
field is fixed ( assuming no change in refractive index of the film ), this would result in a
net decrease in the concentration of plasticiser ( and PVC ) in the evanescent field.
129

Therefore the intensity of plasticiser and PVC bands in the spectra would decrease at the
same time as the intensity of the silane bands are increasing. One way to distinguish
between the two possibilities would be determine whether both PVC and plasticiser bands
decreaseJnjntensity._Unfortunately,-the-only-PVC bands available in the spectral window
of silicon are the v(CH) stretching modes around 2800 - 2950 cm'1. These bands are
overlapped by the v(CH) modes of both the plasticiser and the silane. This makes
definitively interpretation of the spectra in this region very difficult.
One method used commercially in order to reduce or stop the migration of
plasticiser is the use of oligomeric plasticiser21. It is well known that the tendency of
chemically similar materials to undergo diffusion in polymeric films varies inversely with
their molecular weights10,22. This is due to the larger size of high molecular weight
materials, and in the case of polymeric materials, the tendency to form entanglements with
the matrix material. It was decided to perform similar experiments as described in section
3.2.2 but with Diolpate 7170 replacing DHA. These two materials are almost identical
chemically ( see section 3.1 ), and so any differences would be due to the difference in
molecular weight.
Experiments were performed identically to those described in the last section, with
Diolpate 7170 replacing DHA. The results obtained from the diffusion of Y9669 in PVC
plasticised with 40% Diolpate 7170 are shown in Figure 3.31. The thickness of the PVC
film was 7 pm.
130

o.a-
90 minutes -
10 minutes0 .2-
4 minutes
0.1- 0 minutes
o.o-
-0 . 1-
-0 .2-
1800 1700 1600 1500
Wavenumbers
Figure 3.31 : The results of Y9669 diffusion in 40% Diolpate 7170 plasticised PVC
The integrated intensity of the 1602 cm'1 band of the Y9669 band in Figure 3.31,
along with the dual mode sorption fitting obtained is shown in Figure 3.32.
131

X Data— Dual sorption fit
O)
100T im e ( m i n u t e s )
Figure 3.32 : The results of fitting data from Y9669 diffusion in 40% Diolpate 7170 plasticised PVC to the dual mode sorption model
It can be seen from Figure 3.31 and Figure 3.32 that the silane did diffuse through
the film plasticised with Diolpate 7170. Figure 3.32 also shows that the silane diffusion
fitted well to dual mode sorption kinetics. The data was again found not to fit the Fickian
case I diffusion model. It can also be seen that despite the polymeric nature of the
plasticiser, the carbonyl stretching mode ( at 1726 cm'1 ) still decreased as the silane
diffused into the film. This implies that the reason for this decrease was not diffusion of
the silane to the surface of the PVC film, but swelling of the PVC film due to the uptake of
silane. Figure 3.33 shows the area of the 1726 cm'1 band of Diolpate 7170 versus time for
the diffusion of Y9669 in 40% Diolpate 7170 plasticised PVC.
132

1 - 4~o
O)
100Tim e ( m in u te s )
A rea a t 1726 cm-1
Figure 3.33 : Area of 1726 in 40% Diolpate 7170 PVC
Comparison of Figure 3.33 with Figure 3.32 shows that the decrease in intensity of
the plasticiser band was somewhat slower than the increase in intensity of the silane bands.
The difference in kinetics is not very great. It is believed that this proves the plasticiser did
not diffuse away from the ATR crystal interface, because the large change in molecular
weight of the plasticiser upon using Diolpate 7170 ( which has six times the molecular
weight of DHA ) would have meant that the diffusion of the plasticiser would have been
much slower than the diffusion of the silane if this were the case. In order to assess
diffusion in Diolpate 7170 plasticised PVC more fully, experiments were performed with
133

all three silanes, using the limits of the plasticiser concentrations that gave results when
using DHA ( i.e. 40% plasticiser and 20% plasticiser). The results of dual mode sorption
fitting to the data obtained are shown in Table 3.5.
% Diolpate 7170 A1-110 A t QQ"!i > 80” AJLAIU AiO^l
40 D ^ ^ x l O -6 D2= 1 .6 2 x 10⁻⁶
X i = 0.53
D, = 1.07 x 10⁻⁶ D2 = 8.80 x 10'7
X, = 0.96
D, = 1.04 xlO'5 D2 = 2.76 x 10‘7
X, = 0.6920 D ^ ^ x i c r 8
D2 = 3.59 x 10'9Xi = 0.86
D, = 3.74 x 10'7 D2= 1.99 x 10'8
X, = 0.40
Dj = 2.84x10'“ D2 = 2.67 x 10'9
X] = 0.95
Table 3.5 : Diffusion coefficients obtained from fitting the data from silane diffusion in Diolpate 7170 plasticised PVC to the dual mode sorption diffusion model.
Table 3.5 shows that like the results with DHA as a plasticiser ( Table 3.3 ),
increasing the concentration of Diolpate 7170 greatly increases the diffusion coefficients
resulting from the fitting procedure. It was again found that no data fitted the case I
diffusion model, indicating that the mechanism of diffusion is independent of plasticiser
molecular weight.
The Y9669 results show that the diffusion coefficients obtained for Diolpate 7170
plasticised PVC were similar to those for DHA plasticised material. Again, this showed
that diffusion was independent of the molecular weight of the plasticiser, as well as that the
two plasticisers have the same effect, when used in the same concentrations.
In the case of A ll 10, although the trends are the same for monomeric and
polymeric plasticisers, there is somewhat more disparity between the values of the
coefficients obtained. However, no overall trend can be discerned in the differences
134

between the values obtained. These differences all amounted to less than an order of
magnitude, and it is believed that they were due to experimental errors.
Thej-esults for-A1891^howed veiy close agreement between diffusion coefficients
obtained using DHA and Diolpate 7170. At first glance, it seemed surprising that the
results were so reproducible for A1891, considering the poor signal to noise obtained for
the band used to generate the data ( see Figure 3.20 ). The main difference between this
silane and the others is that A1110 and Y9669 contain an amine group. The catalytic effect
this has on the hydrolysis has been described in the literature7,8. It seems likely that,
despite the care taken to avoid exposure of the silanes to atmospheric water, some small
amount of water inevitably came into contact with the silanes before the experiments were
performed. If this were the case then one might expect the two amino silanes to undergo
more hydrolysis than the mercaptosilane. If this did occur, and as suggested in section
3.2.1, the hydrolysed silanes diffused more slowly than unhydrolysed silanes, then the
unrepeatability in the aminosilane results is likely to be have been due to slight differences
in the level of hydrolysis or condensation of the amino silanes used. In contrast, the
resistance to hydrolysis of the mercaptosilane meant that the material used was identical in
each experiment, even if some exposure to water had occurred.
3.4 : DSC analysis of plasticised PVC films
The glass transition temperature ( Tg ) of a polymer is the temperature at which a
major sub-melting chain motion starts to occur23. This has the effect of radically changing
135

the mechanical properties of the polymer; it is said to go from the glassy to the rubbery
state. Several lesser transitions may also exist, known collectively as sub-Tg transitions,
but these are not considered here. In the pure PVC supplied by the Aldrich chemical
company, the Tg is quoted as 80 °C. The glass transition is an effect which can occur over
quite a broad temperature range. This means that the effect of the glass transition may be
observed that considerably lower temperatures than the measured Tg, and as a consequence
the Tg can be difficult to measure. Often the measured Tg will depend upon the technique
used to measure it, and the way in which the technique is applied. Specifically, if a
temperature - scanning technique is used, the rate at which the temperature is raised ( or
lowered) can change the measured Tg considerably.
Because above or near the Tg of a polymer, the polymer chains show increased
motion, it was expected that the T would affect the diffusion seen. Therefore, it was
decided to measure the Tg of the PVC films as cast. It was decided to use Differential
Scanning Calorimetry ( DSC ) to measure the Tgs. Several alternative techniques exist to
measure Tgs, notably Dynamic Mechanical Thermal Analysis ( DMTA ). However, most
require a sample several mm. thick. Production of a sample this thick was not possible by
casting, without severe degradation or poor solvent removal. As it was desirable to
measure the films produced in the same way as those used in the diffusion experiments, it
was decided to use DSC, which only requires a few milligrams of material.
DSC is a relatively simple technique. The sample in a metal sample pan, and an
empty sample pan as a reference are placed in a closed sample holder, and directly
136

connected to individual resistive heaters. A desired temperature ramp rate is programmed
into the controller, which then adjusts the flow of energy to the heaters so that the same
temperature is maintained in both sample and reference pans. The extra energy supplied to
thesamplepan,therefore, shows the energy absorbed by the sample in changing its
temperature. The output from the technique shows the energy flow to the sample versus
the temperature. Any exothermic or endothermic process occurring in the sample give rise
to a change in slope of this plot. In practice, the Tg of a polymer is measured as a ‘step’ in
the plot.
DSC results were obtained at Pilkington pic using a DuPont 910 DSC cell coupled
to a TA2100 controller. The DSC cell was calibrated for temperature using standard
indium metal. A ramp heat rate of 10 °C per minutes was used from -100 to +100 °C. A
sample plot is shown in Figure 3.34. This is the result from the 20% DHA plasticised
sample.
137

Sam ple: S N J0217 20X pPVC.S iz e : 1 0 .3 0 0 0 mgM ethod: DSC RAMP10*C/MIN TO 100 Comment: E n c a p s u la t e d P a n s . No P u rg e G a s. - 0 .0 5 - 1 ----------------------------- ----------------------------------------
DSC F i l e : C: S N J 0 2 1 7 D 1 .0 0 1 O p e r a to r : S .N .J a m ie s o n Run D a te : 1 7 - S e p - 9 8 11: 43
0 .0 0 B
- 0 . 1 0- 0 . 0 0 4
1 2 . 1 1 ®C
- 0 . 15
- 0 . 0 0 2
o - 0 . 2 0
1 7 . 7 3- 0 . 2 5
- 0 . 0 0 2- 0 . 3 0
5 9 . 4 1®C
- 0 . 3 5 ---------------------- .--------------1— 0 .0 0 460 80
D SC -A uto V I.O E TA I n s t 2 1 0 0
-2 0 20 40T e m p e r a tu r e (°C)
Figure 3.34 : Typical DSC output plot. The sample was 20% DHA plasticised PVC
The results of the Tg measurements are tabulated in Table 3.6.
Percentage
Plasticiser
Inflection Tg ( °C )
20 16
25 -1
30 -16
35 -19
Table 3.6 : The results of Tg measurements by DSC
Unfortunately, it was not possible to obtain Tg results for the 15 and 40 % DHA
samples. However, the trend in Tg with plasticiser content is quite well known24, and is
shown by Figure 3.35 reproduced from reference 25.137

350i
300
p
250
200
1k---------------------
X x
Y
+o7•4*
------------
1
' ' i
\
\•' f .
\ x
X .
' f
%' 5
■sNw
•V 1
Wkfm"*—-«0
" * ---- --
0.2 0,4 0.6W\
0.8 1.0
Figure 3.35 : The dependence of Tg of PVC upon plasticiser concentration ( W i ). Open circles represent dicyclohexylphthalate, filled circles represent dibutylphthalate25.
The measured values of the glass transition temperatures are plotted versus the
percentage of plasticiser in the films in figure 3.36.
138

70 -
3 60 -
Q._____| 4 0 - -
^ 30 -
2 20 -
COm 1 0 - -
TO - 1 0 - -O
-20 -
-30 -
4 0Percentage DHA
-e -
Figure 3.36 : Glass Transition temperature of plasticised PVC films measured by DSC vs.percentage of plasticiser
It can be seen from Figure 3.36 that the overall trend in the results as measured follows
fairly closely the literature trend ( Figure 3.35 ), in that initially a linear relation is seen, but
the slope decreases at higher concentrations of plasticiser. With knowledge of the trend that
occurs in the data from the literature, and the measured values, it is also possible to estimate
the values for those samples which could not be measured. These have been estimated as :
25 °C for 40 % plasticised PVC, and 25 °C for 15% plasticised PVC. Using these values,
the diffusion coefficients from fitting to the dual mode sorption model have been plotted
versus Tg in figures 3.37, 3.38 and 3.39.
139

-5i
W IT IT<n -5.5 -- o
-6 - -
-7
£ c Q)£ - 6 .5Q)OOc o ■(/)| - 7 . 5Qo) -8 o
-8.5
□
o
o
□
□
□
o
□
-30 -20 -10 0T g ( ° C )
10 20 30
o LogD1(Y9669) □ LogD2(Y9669)
Figure 3.37 : Diffusion Coefficients from dual mode sorption fitting for Y9669 diffusion inplasticised PVC vs. Tg of the PVC
Tg ( C )
o logD1(A1110) □ logD2(A1110)
Figure 3.38 : Diffusion coefficients from dual mode sorption fitting for A1110 diffusion inplasticised PVC vs. Tg of the PVC
140

- 5 - r
■g -6 -
c -7 -o
-20-30 -10Tg ( ° c )
O logD1(A1891) □ logD 2(A 1891)
Figure 3.39 : Diffusion coefficients from dual mode sorption fitting for A1891 diffusion inplasticised PVC vs. Tg of the PVC
Figures 3.37, 3.38 and 3.39 show that for each of the silanes, as the Tg of a PVC
film was reduced from 25 to -25 °C, the diffusion coefficients of the silane in the film
increased by approximately 3 orders of magnitude.
3.5 : Silane overlayers - hydrolysed silanes
In order to determine whether hydrolysis affects diffusion, as was implied by
previous results described in this chapter, and what the effect of hydrolysis on diffusion is,
141

it was decided to perform some diffusion measurements with pre-hydrolysed silanes.
However, it was decided not to use the standard acidified IPA / H2O solution as was
described in section 3.2. This was because it is known that alcohols and water diffuse into
polymers26 including PVC27’28— These materials may plasticise the polymer2— and thus
change the diffusion of silanes in the material, as well as complicating the spectral analysis.
Therefore, it was decided to hydrolyse the silanes by exposure to atmospheric water, thus
avoiding the problem of the hydrolysing solvent affecting the results. This did not alleviate
the problem altogether, because the hydrolysis products ( methanol or ethanol) would have
been present in small concentrations in the diffusant material.
In order to determine the level of hydrolysis achieved, transmission infrared
spectroscopy was used. The silane was sprayed onto a KBr plate, and allowed to interact
with atmospheric water, while infrared spectra were obtained at regular intervals. The first
experiment was performed with Y9669. The region of the spectra obtained showing the Si-
O-Si stretching bands and the band at 992 cm-1 is shown in
Figure 3.40. This band was assumed to be equivalent to the Si-O-Et band used by Hoh et.
al? as an indication of hydrolysis, i.e. it is assigned to the Si-O-Me stretching mode of
Y9669.
142

.08 increasing
time.06
.04
.02
-.02
1200 1150 1100 1050
Wavenumber (cm-1)
1000 950 900
Figure 3.40 : The Si-0 stretching region of spectra obtained in transmission of Y9669 undergoing hydrolysis with atmospheric water
It can be seen from
Figure 3.40 that the band at 992 cm'1 decreases in intensity with increasing time. This
shows loss of Si-O-Me groups, i.e. hydrolysis of the Y9669. There is also a shoulder to the
1080 peak, at about 1020 cm'1 which increases in intensity. This may be due to the
condensation of Y9669, as observed by McKnight et. al.30 at 1038 cm*1 for the silane CSS (
see section 1.2.2 ). In order to determine how the Si-O-Me stretching mode decreases with
time, the spectra were analysed with a standard curve-fitting procedure, and the integrated
intensity of the curve fitted to the 992 cm"1 plotted against experiment time. This is shown
143

in Figure 3.41.
0.03
0.028 -
07026ITI
,0.024
0.022
-o 0.02
- 0 .0 1 6
0.014
0.0120 30 minutes 1 hour 24 hours 2 days 3 days 4 days 5 days 6 days 7 days 8 days
T ime
intensity a t 992 cm-'j
Figure 3.41 : The curve fitted intensity of the 992 cm'1 band of Y9669 undergoinghydrolysis with atmospheric water
Figure 3.41 shows that hydrolysis is rapid in the first 2 hours, but that after 24 hours
no further hydrolysis occurs. It is clear from Figure 3.41 that at this stage, and even up to 8
days of exposure, hydrolysis is not complete, the intensity of the Si-O-Me band remaining
at about half of its original intensity. The diffusion of Y9669 which had been exposed to
atmospheric water for 24 hours was investigated. The experiment was similar to those
described in section 3.2.1. An unplasticised PVC film was cast from DMF solution. The
thickness was 7 pm. After application of the pre-hydrolysed silane, spectra were taken after
subsequent exposures to 70 °C of five minutes duration. The intensity of the 1602 cm'1
144

band of the Y9669 is plotted versus time at 70 °C in Figure 3.42. For comparison, the data
from unhydrolysed Y9669 is also included, and the spectra are intensity normalised.
1
0.8
0.6
0.2
00 10 20 30 40 50 60 70 80 90
Time ( m inutes )
A rea a t 1602 cm-1 - unhydrolysed -b - A rea a t 1602 cm-1 - pre-hydrolyse<
Figure 3.42 : The area of the 1602 cm'1 band of hydrolysed and unhydrolysed Y9669 vs.time for diffusion in PVC at 70 °C
It is clearly shown by Figure 3.42 that Y9669 exposed to atmospheric water for 24
hours diffuses considerably slower than a fresh sample of Y9669. Therefore, it has been
proven that hydrolysed Y9669 diffuses through unplasticised PVC at 70 °C more slowly
than un-hydrolysed Y9669.
145

The hydrolysis of A ll 10 was studied in the same way; the material was sprayed
onto a KBr plate, allowed to react with atmospheric humidity and analysed in the infrared
spectrometer. The spectra in the Si-0 stretching region are shown in Figure 3.43.
increasing
time
.4
1200 1150 1100 1050
Wavenumber (cm-1)1000 950
Figure 3.43 : The Si-O stretching region of spectra obtained in transmission of A1110undergoing hydrolysis with atmospheric water
Figure 3.43 shows that the band at 930 cm'1 decreased in intensity with time of
exposure to atmospheric water. Figure 3.43 also shows that the two Si-O-Si bands at 1037
and 1106 cm'1 broaden and move apart, with most change occurring before the second
spectrum was taken ( i.e. during the first 30 minutes ). Ishida et al.31 found that in
polyaminosiloxane undergoing a total cure, the two neighbouring bands at 1108 and 1045
cm'1 sharpened and moved apart slightly. Therefore this effect in Figure 3.43 is presumed
to be due to condensation of the silane. The band at 930 cm'1 was curve fitted and the
intensity is plotted in Figure 3.44 versus time of exposure.
146

i o . 9 -TJ
0.7 -
0.630 mins 60 mins 120 mins 1 day 2 days 6 days 7 days
Time
Figure 3.44 : The curve fitted intensity of the 930 cm-1 band of A1110 undergoinghydrolysis with atmospheric water
Figure 3.44 shows that A ll 10 undergoes rapid hydrolysis over the first day of
exposure, and then slower hydrolysis over the following week. Comparison of the amount
by which the intensity of the Si-O-Me peaks decrease in intensity shows that Y9669
undergoes more hydrolysis over a week than A ll 10, but examination of the Si-O-Si
stretching modes in the spectra suggests that A ll 10 undergoes more condensation. A
diffusion experiment, equivalent to the Y9669 experiment described above was carried out
using A ll 10 also. However, as with unhydrolysed A ll 10, no diffusion was observed for
A ll 10 exposed to air for 24 hours. This is hardly surprising, as the spectra indicate that by
147

this stage the A ll 10 had undergone considerable condensation, making it less likely to
show diffusion.
The same set of experiments were also carried out with A 1891. However, it was
noticed that the spectra decreased rapidly in intensity after the first spectrum was taken.
This is shown in Figure 3.45, in which the first three spectra are shown. The absolute
intensity of the 958 cm'1 band of the A1891 is plotted versus time in Figure 3.46.
.25
.15
zero time
u 30 minutes
>Au&WHirTntE§‘
.05
-.053000 2500 2000
Wavenumber (cm-1)1500 1000
Figure 3.45 : The first 3 spectra of A 1891 undergoing air hydrolysis
148

2.5 -
£ 5 -T3
O)
0.5 -
30 min 60 min 120 min 1 day 2 days 5 days 7 days 9 daysTime
-x-A rea at 958 cm-1
Figure 3.46 : The absolute intensity of the 958 cm-1 band of A 1891 undergoing air
hydrolysis vs. time
Inspection of the sample showed that the A1891 film had run off the KBr plate. The
experiment was repeated, keeping the time for which the sample was vertical ( which is
necessary to obtain the spectra ) to a minimum, but the same effect occurred. It was not
known why this effect was only seen with the A 1891, but it may be that this silane was less
viscous than the other two. To enable quantitative analysis of the hydrolysis, the integrated
intensity of the 958 cm'1 band of A1891 ( assigned to Si-O-Et) stretching ) was ratioed
against the integrated intensity of the CH stretching region ( i.e. 2780 to 3000 cm'1 ). This
region was chosen due to the lack of interference from water vapour or CO2 bands, and the
149

high intensities seen. It was assumed that the intensities of these bands were totally
insensitive to hydrolysis. The ratio of these two measurements is plotted versus time in
Figure 3.47. For comparison, the absolute intensity of the 958 cm'1 band is plotted in
Figure3.46 ____________ _____________________________________ __________
0.35
0.3 -
T3&2 0.25 - o>
0.150 30 min 60 min 120 min 1 day 2 days 5 days 7 days 9 days
Time
A rea a t 958 / a re a a t 2780 to 3000
Figure 3.47 : The ratio of the integrated intensity of the 956 cm'1 band of A1891 undergoing hydrolysis with the integrated intensity in the C-H stretching region
Figure 3.47 shows that over the first 24 hours of exposure, little if any hydrolysis
occurred. After this however, the hydrolysis occurred quite rapidly, and appeared to be still
occurring after 9 days exposure. A diffusion experiment was also performed using A 1891
that had been hydrolysed by exposure to air for 24 hours. The PVC film was 10 pm. thick.
150

The results are plotted alongside those obtained for unhydrolysed A1891 in Figure 3.48.
Both sets of data have been intensity normalised.
1.2
1
0.8
| 0.6u<D2 0.4 o>
“ 0.2
020 400 60 80 100 120
Time ( m in u te s )
-x - Area at 2565 cm-1 - unhydrolysed -b - Area at 2565 cm-1 - prehydrolysed
Figure 3.48 : The area of the v(SH) stretching band of hydrolysed and unhydrolysed A1891 vs. time fro diffusion in unplasticised PVC at 70 °C
Figure 3.48 shows that the diffusion of A 1891 which had been exposed to air for 24
hours was very similar to that shown by unhydrolysed A 1891. It appears that the diffusion
may have been slightly slower in the case of the prehydrolysed silane, but the difference is
very small compared to that observed in the case of Y9669, which had undergone much
more hydrolysis in 24 hours of exposure to the atmospheric humidity. Overall, the results
presented in this section strongly agree with the hypothesis that the hydrolysis of a silane
slows the diffusion of the silane through unplasticised PVC films at 70 °C.
151

References
1 Hong, S. U., Barbari, T. A. and Sloan. J. M, Journal of Polymer Science part B -
Polymer Physics, Vbl.36, No. 2, p. 337 ( 1998-)--------------------------------------------- -------
2 Sammon, C., Everall, N. and Yarwood, J., Macromolecular Symposia Vol. 119, p.
189(1997)
3 Schlotter, N. E. and Furlan, P. Y., Vibrational Spectroscopy Vol. 3, p. 147 ( 1992 )
4 Fieldson, G. T. and Barbari, T. A., Polymer Vol. 34, p. 1146 ( 1993 )
5 Hair, M. L., Advances in Chemistry Series Vol. 234, p. 161 ( 1994 )
6 Banga, R., PhD. thesis, Sheffield Hallam University ( 1995)
7 Blum, F. D., Meesiri, W., Kong, H.-S, and Gambogi, J. E., Journal of Adhesion
Science and Technology Vol. 5, No. 6 (1991)
8 Morrall, S. W. and Leyden, S. E., in D.E. Leyden ( Ed. ), Proceedings of the
Conference on Silanes, Surfaces, and Interfaces, Gordon and Breach ( 1985 )
9 Hoh, K.-P., Ishida, H. and Koenig, J. L., Polymer Composites Vol. 9, No. 2 ( 1988 )
10 Rogers, C. E. in Polymer Permeability, Ed. by Comyn, J., Chapman and Hall,
London, p.56 ( 1985 )
11 Sommer, W., in Plastics additives, Ed. by Gachter, R. and Muller, H., Hanser
Publisher, Munich,( 1985 )
12 Beckmann, R. et. al., United States Patent No. 4,277,538 (1981 )
13 Purvis, M. B. et. al., International Patent No. WO 95/19261 ( 1995 )
14 Diffusion in Polymers, Ed. by Crank, J. and Park, G. S., Academic Press, London (
1968)
15 Sammon, C., PhD. thesis, Sheffield Hallam University ( 1997 )
152

16 Sammon, C., Everall, N. and Yarwood, J., Macromolecular Symposia Vol. 119, p.
189(1997)
1 7----- Pereira, M. R., PhD. thesis, University of-Durham, (-1994)--------------------------------
18 Vieth, W. R. and Sladek, K. J., Journal of Colloid Science Vol. 20, p. 1014 ( 1965 )
19 Vieth, W. R. and Amini, M. A., in permeability of Plastic Films and Coatings to
Gases, Vapors and Liquids, Ed. by Hopfenberg, H. B., Plenum Press, New York, p.
49(1974)
20 Van Ooij, W. J., in Industrial Adhesion Problems, Ed. by Brewis, D. M., p. 89,
Orbital Press, Oxford ( 1985 )
21 Sommer, W., in Plastics additives, Ed. by Gachter, R. and Muller, H., p. 254, Hanser
Publisher, Munich,( 1985 )
22 Hajatdoost, S., Olsthoom, M. and Yarwood, J., Applied Spectroscopy Vol. 51, No.
12, p.1784 ( 1997)
23 Billmeyer, F. W., Textbook of Polymer Science, p. 321, 3rd. Edition, Wiley, New
York ( 1984)
24 Plazek, D. J. and Ngai, K. L., in Physical Properties of Polymers Handbook, p. 139,
Ed. By Mark, J. E., AIP Press, New York (1996)
25 Pezzin, G., Omacini, A. and Zilio-Grandi, F., Chimica Industria ( Milan ), Vol. 50,
p.309 (1968 )
26 Yasuda, H. and Stannett, V., Journal of Polymer Science Part B: Polymer Physics
Vol. 33, p. 2263 ( 1995 )
27 Okuno, H., Renzeo, K. and Uragami, T., Journal of Membrane Science Vol. 103,
p.31 ( 1995)
153

28 Shailaja, D. and Yaseen, M., Polymer International Vol. 32, p. 247 ( 1993 )
29 Langevin, D., Grenet, J. and Saiter, J. M., European Polymer Journal Vol. 30, p.30 (
1994)
30 McKnight, S. H. and Gillespie, J. W., Journal of Applied Polymer Science Vol. 64,
part 10, p. 1971 ( 1997)
31 Ishida, H., Chiang, C.-H. and Koenig, J. L., Polymer Vol. 23, p. 251 ( 1982 )
154
Chapter 4 : Raman depth profile studies of organosilane diffusion
In order to show that diffusion of organosilanes occurs in PVC films, and to
determine the distribution of the silanes in the PVC films before, during and after diffusion,
Raman depth profiling experiments have been carried out. As described in chapter 1, other
workers have used different techniques to obtain depth - resolved information about silanes
in polymeric films1'4. However, the advantages of Raman confocal microscopy are that it
can provide information on the micrometer scale3, and that depth profiles can be obtained
in situ6’3, allowing the collection of depth - resolved information without the need for
sputtering of the sample, or sectioning.
4.1 : Experimental
In order to obtain information of relevance to the glass / silane / PVC system, it was
decided to investigate a model laminate. The first material considered for use as a
substrate for the laminates was polished quartz. It was found that the use of quartz gave
rise to a broad curved background absorption. This meant not only that the peaks from the
deposited materials were harder to see, especially those of low intensity, but also that
removal of the curved baseline was required before analysis. A much better substrate was
found to be polished silicon wafers. This material led to a flat baseline in the spectra
collected. Silicon does have bands in the Raman, however, most notably a sharp band at
520 cm'1 assigned to the Si-Si stretching mode and its overtone band at 980 c m 1. As these
155

bands did not interfere with any of the peaks of interest of the other materials, it was
decided to use silicon as a substrate. An advantage of the presence of the bands due to
silicon was that the 520 cm'1 band was found to be a very good indicator of the position of
the surface of the silicon wafer. This helped to confirm that the depth profiles were
calibrated correctly in the z - direction ( i.e. the optical axis ). The use of silicon as a
substrate also meant that the resulting laminates were almost identical to those used in the
infrared experiments, the only difference being that most of the laminates used in the
Raman contained PVC films considerably thicker than those used in the infrared
experiments( approximately 20 pm. vs. 10 pm. for the laminates used in the infrared
experiments). Although silicon has a different structure to glass, the surface properties are
very similar as the surface of oxidised silicon and glass both consist of Si02 and SiOH
7,8groups ’ .
4.1.1 : Materials
Most of the materials used for the Raman experiments were exactly the same as
described in section 3.1.1, but no plasticiser was incorporated into any of the PVC films.
The silicon wafers were treated in the same way to clean them, but extra care was taken
when diamond polishing, as the long experiment times and long heating treatments often
led to increased silane bonding to the silicon surfaces. When cover slips were used they
were very thin ( <100 pm. ) glass slides provided by Pilkington pic. These were available
in a variety of thicknesses in the range 20 to 100 pm. The 20 pm. slides were extremely
156

fragile, but it was found that the thinner slides scattered less light, resulting in less signal
loss when used. Therefore, 20 pm. cover slips were used for the depth profiling
experiments described here.
4.1.2 : Spectroscopic measurements
All Raman spectroscopic measurements were made with a Renishaw Ramascope
model 2000. The excitation source was a Helium-Neon ( HeNe ) gas laser emitting at
632.8 nm. This system is described in section 2.2.4. Only the grating optical path was
used. The system can be operated in ‘static’ grating mode, giving a range of approximately
500 cm'1, or in ‘extended’ mode, by rotating the grating as scanning progresses, which
allows a range of approximately 250 cm'1 to 5000 cm'1. The static mode is not only
somewhat more accurate, but spectral acquisition is considerably faster if only a limited
spectral range is of interest. When measuring depth profiles, it was found that
measurement of one band of the silane was adequate, so it was decided to use the static
grating mode. To obtain reference spectra, the extended mode was used in the range 400 to
4000 cm'1. To obtain depth profiles, the instrument was fitted with an electronic
microscope stage attachment from Prior Instruments Inc., allowing movement in x, y and z
planes with 1 jum. accuracy.
When measuring depth profiles, it was necessary to know the confocal response of
the instrument accurately; that is, how effectively the instrument rejected light from outside
of the focal plane, and hence what the depth resolution was. It was considered desirable to
157

have 2pm. or less confociality as measured by the FWHH criterion described in section
2.2.5. In order to ensure that this was the case, the 100X objective was used and the
instrument set up in confocal mode by setting the entrance slit to 15 pm. width, and using
only a 5 pixel height response on the CCD. Before each experiment a confocal test was
carried out. This involved measuring the response from a silicon surface as the focus of the
laser was moved away in 1 pm. steps, as described in section 2.2.5. For solid samples,
reference spectra were obtained using the 50X objective. For liquid samples, the materials
were placed in a quartz cuvette and the 20X ULWD objective was used.
4.1.3 : Spectra of materials
The Raman spectrum of the pure silanes are shown in shown in Figure 4.1 ( Y9669
), Figure 4.2, ( A ll 10 ) and Figure 4.3 ( A1891 ). The spectra were obtained from pure
liquid silanes in a quartz cuvette. The silanes were handled in a nitrogen atmosphere to
ensure that it remained un-hydrolysed. The 20X ULWD objective was used.
158

15000-
1 0 0 0 0 -
5000-
3500 3000 2500 2000 1500 5001000
Delta W aven u m bers/cn i'1
Figure 4.1 : The Raman spectrum of pure Y9669 ( unhydrolysed)
2000 -
1500-
° 1000 -
500-
4000 3500 25003000 2000 1500 5001000
Delta W a v en u m b ers/cm-i
Figure 4.2 : The Raman spectrum of pure Al 110 ( unhydrolysed )
159

7000-
6000-
a 5000-
4000-
3000-
2000-
1000 -
4000 3500 3000 2500 2000 5001500 1000
D elta W avenum bers/cm "1
Figure 4.3 : The Raman spectrum of pure A1891 ( unhydrolysed )
The same bands were used in the Raman depth profiling work as in the infrared
diffusion work. It can be seen from comparison of Figure 4.3 with Figure 3.5 that the
v(SH) stretching band is much more intense in the Raman than in the infrared. Again, it
was not possible to assign the band at approximately 1600 cm'1 in the Y9669 spectrum to a
single vibration, rather it is the sum of the v(C-C) ring stretching and 6(NH) banding bands.
It is therefore referred to simply as the 1600 cm'1 band.
Figure 4.4 shows the Raman spectrum of pure PVC powder. For comparison,
Figure 4.5 shows the Raman spectrum of degraded PVC, obtained by heating the same
PVC at 100 °C for 4 hours. It can clearly be seen that the spectra are very different.
160

15000-
C 10000-
5000-
4000 3500 3000 2500 2000
Delta W avenum bers/cm '1
1500 1000 500
Figure 4.4 : The Raman spectrum of PVC obtained from pure PVC powder
2 5000-
20000 -
15000-
1 0 0 0 0 -
5000-
4000 3500 25003000 2000
Delta W aven u m bers/cm '1
1500 5001000
Figure 4.5 : The resonance Raman spectrum of degraded PVC film
161

When PVC is thermally degraded, the main reaction is homolytic loss of HC1
resulting in polyene sequences along the polymer backbone. This is shown in Figure 4.6.
—CH2 CHCI-----CH2— CHCI CH2 CHCI--------
Heat
▼
CH2 CHCI C H = C H CH2 CHCI + HCI
Figure 4.6 : The thermal degradation of PVC
The bands at 2560 cm'1, 2186 cm '1 and the very intense bands at 1485 cm"1 and 1098 cm'1
in Figure 4.5 are resonance Raman bands, arising from the excitation wavelength
coinciding with visible absorption wavelength of the polyene sequences in the degraded
PVC. As these bands are extremely intense, they provide a very sensitive way of checking
for degradation9,10. Figure 4.7 shows the Raman spectrum of a PVC film cast from DMF
and dried for 14 hours at 65°C. The spectrum can be seen to be essentially identical to
Figure 4.4. The differences present are the bands at 520 cm'1 and 980 cm'1 from the silicon
substrate. None of the resonance bands from degraded PVC are present. This proves that
the as - cast films were not degraded by the drying process. Since the same procedure was
used to prepare films for the infrared experiments, the films used for the infrared
162

experiments were also free of degradation. The film also shows that the solvent DMF had
been completely removed as no carbonyl stretching band is present at 1675 cm '1.
12000
10000
8000
■I| /
A
AAI!
6000
/JJ V ^ / |/ v
4000 IJy
2000
4000 3500 3000 2500 2000 1500 1000/c m '1
Delta Wavenumbers
Figure 4.7 : The Raman spectrum of an as-cast PVC film on a silicon substrate
4.2 : Silane underlayer experiments
In the first experiments, silane was cast directly onto the silicon substrate. The
silanes were pre hydrolysed in a 9:1 ( v/v ) IP A / H20 solution, which was acidified with
3% ( v/v ) acetic acid to act as a hydrolysis catalyst. The silane film was heated to remove
the solvent, and then PVC was cast onto the silane layer, and dried to remove solvent. In
the first experiment, the laminate was then immediately examined to assess whether silane
diffusion through the PVC film had occurred during the casting or drying process. The
163

silane used was Y9669 and the laminate was determined by Talysurf surface profiling to be
approximately 50 pm. thick. In order to measure the depth profile, the laser was focused
10 pm. below the surface of the substrate, and the stage programmed to move 50 pm. up, in
steps of 1 pm. A static spectrum centred at 1600 cm’1 was measured at each step.
A typical spectrum ( from a depth of 5 pm. into the laminate ) is shown in Figure
4.8.
7500-
7000-
m 6500-
c 6000-
5500-
5000-
4500-
1800 1700 1600 1500 1400
Delta Wavenumber&cm1
Figure 4.8 : The Raman spectrum from the first depth profiling experiment. Spectrum wastaken 10 pm. above the substrate surface
164

Figure 4.8 shows the presence of both PVC ( by the doublet at about 1430 cm"1 )
and Y9669 ( by the 5(NH2) bending band at 1600 cm'1). There is also a small peak at 1709
cm'1. It is believed that this is the carbonyl stretching band of the solvent, DMF. Clearly,
in this case, solvent removal was not completely effective. It was believed that this was
due to the thickness of the film used. Therefore, in subsequent experiments, thinner PVC
films were used.
In order to show the depth profiles graphically, the data were analysed by curve
fitting. Simple Lorentzian bands were fitted to the data to obtain the area of the silane and
PVC bands. The area of the bands have been plotted versus the distance the focus of the
laser had moved in Figure 4.9. The bands displayed are the 1600 cm"1 band of Y9669 and
the 5(CH2) doublet of PVC.
165
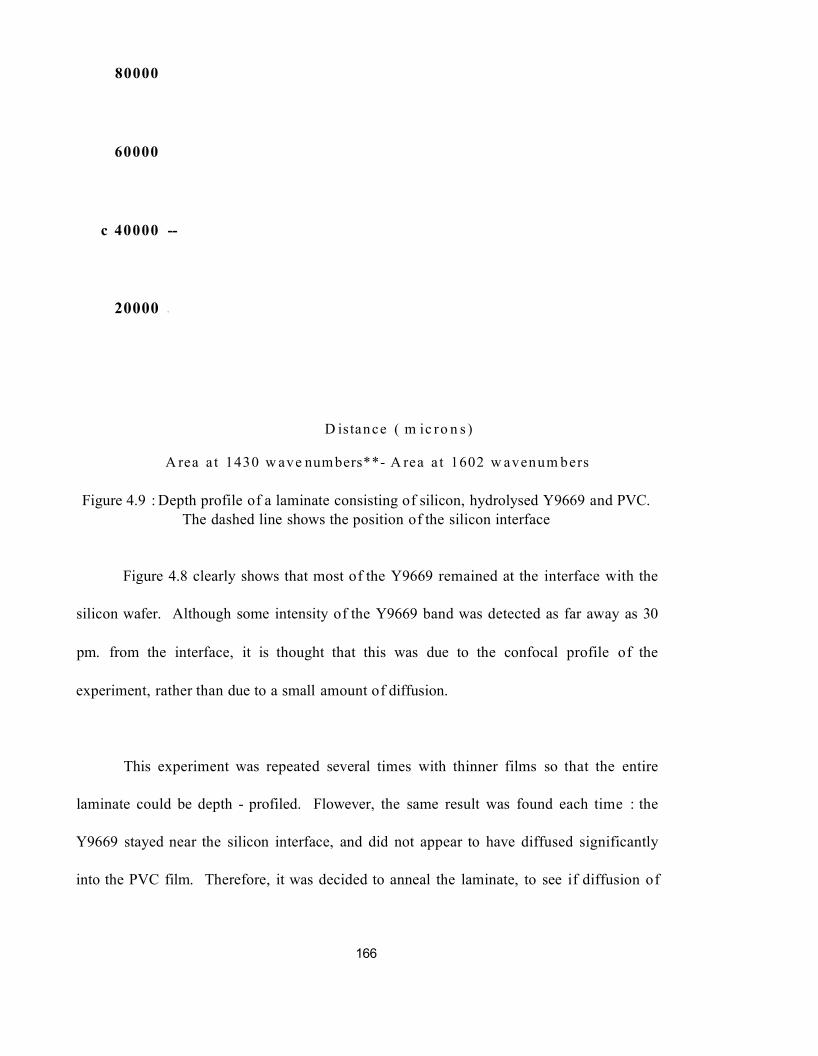
80000
60000
c 40000 --
20000 -
D is tance ( m ic ro n s )
A rea a t 1430 w ave numbers**- A rea a t 1602 w avenum be rs
Figure 4.9 : Depth profile of a laminate consisting of silicon, hydrolysed Y9669 and PVC. The dashed line shows the position of the silicon interface
Figure 4.8 clearly shows that most of the Y9669 remained at the interface with the
silicon wafer. Although some intensity of the Y9669 band was detected as far away as 30
pm. from the interface, it is thought that this was due to the confocal profile of the
experiment, rather than due to a small amount of diffusion.
This experiment was repeated several times with thinner films so that the entire
laminate could be depth - profiled. Flowever, the same result was found each time : the
Y9669 stayed near the silicon interface, and did not appear to have diffused significantly
into the PVC film. Therefore, it was decided to anneal the laminate, to see if diffusion of
166

the silane could be thermally induced. A typical spectrum is shown in Figure 4.10. It can
be seen from Figure 4.10 that there is no carbonyl stretching band at 1735 cm'1. This
shows that the use of a thinner PVC film allowed full removal of the solvent, DMF.
4200-'
4000-
R 3800-
3600-
3400-
s 3200-
3000-
2801
1700 1600 1500 1400 1300
Delta Wavenumbeitem1
Figure 4.10 : Raman spectrum from multiple - anneal depth profiling experiment.
Before any annealing was carried out, a depth profile was obtained to measure the
starting position of the silane. The laminate was then annealed by placing in an oven at
70°C for successive periods of 2.5 hours, 3.5 hours and 4 hours. A depth profile was
obtained after each treatment. Thus, the total annealing time was 10 hours at 70°C. The
curve-fitted band areas of the Y9669 1600 cm'1 band are shown in Figure 4.11. The
laminate was determined to be 15 pm. thick by Talysurf profiling.
167

Figure 4.11 : The area of the 1600 cm'1 band of Y9669 plotted versus distance for depth profiles of a silicon / Y9669 / PVC laminate. Times refer to annealing time at 70°C. The
vertical line shows the position of the silicon interface.
- e - A rea a t 1600 cm-1 - 0 hours A rea a t 1600 cm-1 - 2 .5 hours-a- A rea a t 1600 cm-1 - 6 hours A rea a t 1600 cm-1 - 1 0 hours
C/5 a | 1
1 0.8 COECO£ 0.6-O0GO
03 0.4Eo2 0.2
silicon
i---------
5 10 15 20 25D istance ( m ic ro n s )
It can be seen from Figure 4.11 that the Y9669 did not diffuse significantly into the
PVC upon annealing at 70 °C. Close examination shows that the depth profiles after 2.5
hours annealing appear to be shifted about 1 pm. into the PVC. However, the measured
depth resolution of the experiment was 2 pm. Therefore, the shift in the Y9669 intensity
position was not significantly large enough to show diffusion.
168
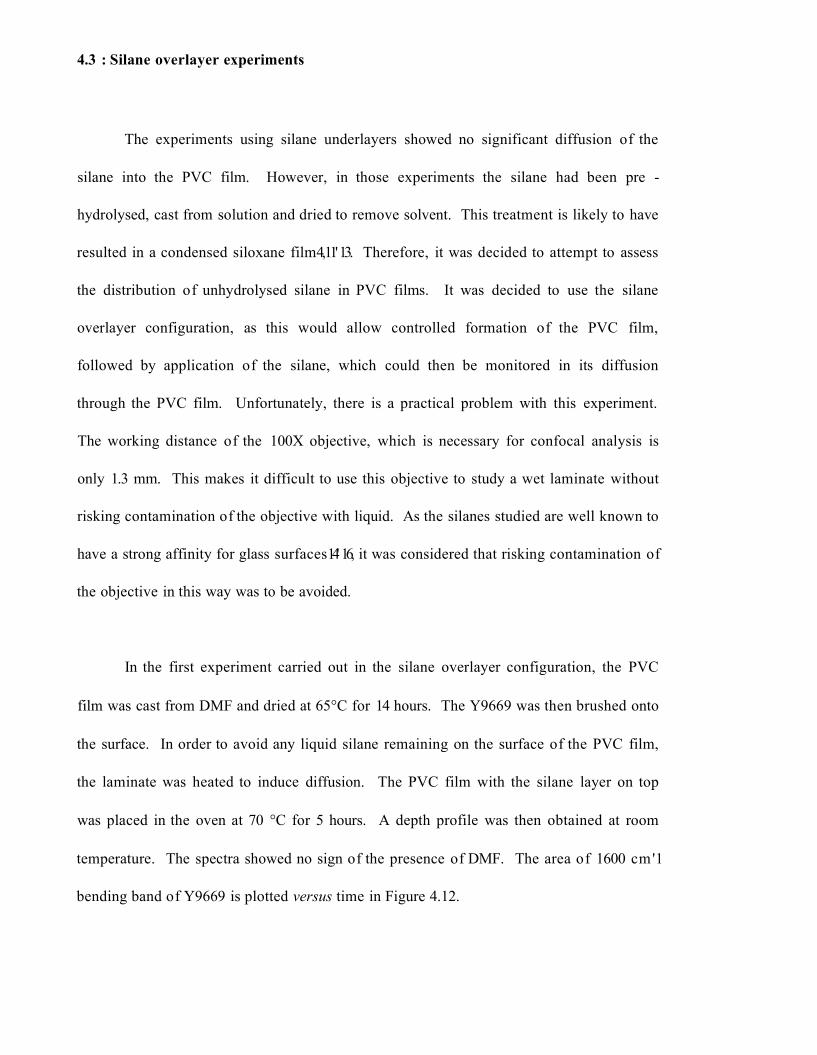
4.3 : Silane overlayer experiments
The experiments using silane underlayers showed no significant diffusion of the
silane into the PVC film. However, in those experiments the silane had been pre -
hydrolysed, cast from solution and dried to remove solvent. This treatment is likely to have
resulted in a condensed siloxane film4,11'13. Therefore, it was decided to attempt to assess
the distribution of unhydrolysed silane in PVC films. It was decided to use the silane
overlayer configuration, as this would allow controlled formation of the PVC film,
followed by application of the silane, which could then be monitored in its diffusion
through the PVC film. Unfortunately, there is a practical problem with this experiment.
The working distance of the 100X objective, which is necessary for confocal analysis is
only 1.3 mm. This makes it difficult to use this objective to study a wet laminate without
risking contamination of the objective with liquid. As the silanes studied are well known to
have a strong affinity for glass surfaces14'16, it was considered that risking contamination of
the objective in this way was to be avoided.
In the first experiment carried out in the silane overlayer configuration, the PVC
film was cast from DMF and dried at 65°C for 14 hours. The Y9669 was then brushed onto
the surface. In order to avoid any liquid silane remaining on the surface of the PVC film,
the laminate was heated to induce diffusion. The PVC film with the silane layer on top
was placed in the oven at 70 °C for 5 hours. A depth profile was then obtained at room
temperature. The spectra showed no sign of the presence of DMF. The area of 1600 cm'1
bending band of Y9669 is plotted versus time in Figure 4.12.

16000PVC silicon
14000 -
12000 -
10000
8000 --
6000 --
4000 -
2000 - -
Distance ( microns)
Area at 1600 cm-1
Figure 4.12 : The area of the 1600 cm'1 band of Y9669 versus distance for Y9669 brushedonto PVC and heated at 70°C for 5 hours
It can be seen that, unlike the case of the silane underlayer experiments, diffusion
through the PVC film did occur in the first silane overlayer experiment. The Y9669
appears to be present throughout the thickness of the 15 pm. PVC film. At first glance, it
appears that most silane is concentrated in the 5 to 10 pm. deep region, with less at the
interfaces. However, it must be remembered that the depth profile is not a true
concentration profile. Rather, it is the convolution of a concentration profile with the
confocal response of the instrument, i.e. the confocal curve shown in figure 2.13. Because
the confocal response is symmetrical, intensity at a point inside the film is contributed from
170

the focal plane and both above and below the focal plane, but at either the top or bottom
interfaces, intensity is only contributed from out of the focal plane in one direction.
Therefore the effect of the convolution will be to cause lower intensities at the interfaces,
and higher intensities in the centre of the film, as well as to decrease the resolution of the
experiment.
The main problem with experiment performed above was the possible
contamination of the microscope objective with the silane. This meant that the depth
profiles could only be measured after diffusion had occurred. It was decided to investigate
the use of a protective cover slip. This would eliminate the possibility of contamination of
the objective, as well as allowing the collection of depth profiles as soon as silane had been
applied. Unfortunately, it was found that any glass cover slip significantly scattered light,
leading to a loss of signal intensity, and hence to lower S / N. As can be seen from Figure
4.8 and Figure 4.10, the signal to noise was already quite low, due to the use of the
confocal configuration. However, the very thin ( 20 pm. ) cover slips provided by
Pilkington pic. were found to reduce the signal loss considerably.
In the first experiment carried out in this way, a 21 pm. PVC film was cast on the
silicon substrate. After solvent removal, Y9669 was brushed on the upper surface of the
PVC film, then a 20 pm. cover slip placed over the silane. A depth profile was then
obtained of the resulting laminate by focusing the laser 3 pm. above the PVC film, and
obtaining 30 spectra at 1 pm. intervals into the PVC film. After this measurement, the
laminate was placed in the oven at 70 °C for 1 hour. Another depth profile was then
171

obtained, in the same way as the first ( at room temperature ). After this measurement, the
laminate was again placed in the oven for a further hour, and then another depth profile
obtained, again in the same way. The resulting depth profiles are shown in Figure 4.13.
siliconPVC
0.6 - -
= 0.4 -
0.2 -
Depth ( microns)
0 mins heating 60 mins heating - a- 120 mins heating
Figure 4.13 : The area of the 1600 cm'1 band of Y9669 vs. distance into a PVC film. The times refer to time spent at 70°C. The vertical line shows the position of the silicon
interface.
Figure 4.13 shows that the Y9669 stayed mostly at the upper surface of the before
heating. After heating for an hour, the Y9669 was mostly still at the upper surface, but
more of the silane had diffused into the PVC. After 2 hours heating, the Y9669 has
diffused considerably more through the PVC film. It appeared that even after 2 hours
heating at 70 °C, the Y9669 had not fully diffused through the film to the silicon interface.
172

This is somewhat surprising compared to the infrared results ( see section 3. 2 ) which
show that Y9669 had reached equilibrium in a 10 pm. PVC film after a cumulative heating
time of 30 minutes. However, despite the fact that the laminates were quite similar, they
were treated quite differently. The different heating regimes used in the different
experiments may explain why the diffusion behaviour seemed quite different. As was
discussed in chapter 3, the hydrolysis of the silane was found to considerably affect the
diffusion characteristics. The treatment of the laminates in the oven for an hour may have
accelerated the hydrolysis as compared to the 5 minute treatments used in the infrared
experiments17. However, upon comparing the results obtained when using pre-hydrolysed
Y9669 ( i.e. Figure 4.11 in the last section ) with those obtained using un-hydrolysed
Y9669 ( i.e. Figure 4.13 in this section ), it can clearly be seen that the un-hydrolysed, un -
condensed material diffused much further, even with less heating.
In order to assess the effect of silane chemistry on the distribution in PVC films, it
was decided to perform a set of experiments using all three silanes, under the same
conditions. In order that the results could be compared to those from the infrared
experiments which had also been carried out for all three silanes, it was decided to use
similar conditions. Unfortunately, it was not possible to make measurements in exactly the
same way as the infrared measurements (i.e. a measurement after 5 minutes at 70 °C, then
another 5 minutes treatment, and so on ), as the depth profiles took at least 300 minutes to
collect each. The time scale chosen was one depth profile before any heating, followed by
15 minutes heating, followed by another depth profile, followed by a further 45 minutes
heating, and then a final depth profile. According to the infrared results, these
173

measurements should show no diffusion, intermediate diffusion, and equilibrium
distribution respectively ( at least in the case of Y9669 and A1891, see chapter 3 ). It is
important to note, however, the spatial differences in the ATR-FTIR and Raman depth
profiles experiments : The A IR - FTIR yielded information only from the few pm. near the
silicon interface, whereas the depth profiles contained information from throughout the
laminate, although the spatial and temporal resolution was lower.
The first experiment carried out in this way used Y9669 as the silane. The PVC
film was 25 pm. thick, and contained no DMF. In the previous experiment it was noted
that the depth profile did not cover a great enough distance to measure all of the Raman
intensity from the silane. Therefore a longer profile was measured. The results are shown
in Figure 4.14.
Figure 4.14 shows that before heating, no silane had diffused into the PVC film at
all. The fact that the silane intensity curve is approximately symmetrical shows that this
must be the case. The peak is very slightly broader towards the PVC, but by no more than
the depth resolution of the experiment. Clearly, as the PVC film was 25 pm. thick, all of
the film had been profiled in this experiment. After 15 minutes heating, the silane
appeared to have diffused quite far into the film. This is in contrast to the last experiment
described which showed little diffusion after an hour at 70 °C. After a further 45 minutes,
the silane diffused further into the film, and considerable intensity could be detected even
at the silicon interface.
174

siliconPVCair
n q
0.2
0 10 20 30 5040D istance ( p m . )
0 m ins heating 15 mins heating-*- 60 mins heating
Figure 4.14 : The area of the 1600 cm'1 band of Y9669 plotted vs. distance for Y9669 diffusion in unplasticised PVC. Heating was carried out at 70 °C. The vertical lines show
the positions of the interfaces
Due to the similar time-scales used, it is possible to compare the results from this
experiment with those seen in the equivalent ATR - FTIR experiment. The intensity in the
depth profile at the position of the silicon interface should be approximately equivalent to
the ATR - FTIR intensity, assuming the same processes are occurring. Like the ATR -
FTIR results, before heating, no intensity in this region was seen at all. After 15 minutes
heating, an intermediate level of silane intensity was seen, and then much more was seen
after 60 minutes. Although in the case of the ATR - FTIR results, a larger relative intensity
was seen after 15 minutes, this may be due to the use of a thinner film, allowing the silane
to diffuse to the interface in a shorter time.
175

The same experiment was then performed using A1110 as the silane. The film used
was 24 pm. thick, and again there was no DMF present. The results are shown in Figure
4.15.
siliconPVCair
0.8
0.6
0.4
0.2
2 0 . 30D istance ( p m . )
0 mins heating -a - 15 mins heating--*- 60 m ins heating
Figure 4.15 : The area of the NH bending mode of A1110 plotted vs. distance for A1110 diffusion in uPVC. Heating was carried out at 70 °C. The vertical lines show the positions
of the interfaces.
Figure 4.15 shows that before heating, no diffusion of the A1110 through the PVC
film occurred, and no intensity from the A1110 was detected at the silicon interface.. After
15 minutes heating, the silane had begun to diffuse through the PVC film. A small
intensity from the silane could be detected at the silicon interface at this time. This small
176

intensity was probably only due to the ‘tail’ of the confocal response of the instrument,
implying that the silane had only reached part of the way into the PVC film at this stage.
After 60 minutes, however, a significant signal from the silane was detected at the silicon
interface, showing that diffusion throughout the film had occurred.
These results contrast very strongly with those found in the ATR - FTIR
experiments. In those experiments, no diffusion at all was observed in unplasticised PVC
when heated at 70 °C. However, from the Raman depth profile results one would have
expected to have seen a large intensity from the silane at the ATR crystal interface after
one hour of heating at 70 °C. It is believed that the difference in the results was seen
because the heating regimes were different, as in the ATR - FTER experiments, the
laminate was heated for only 10 minutes at a time. However, the diffusion does appear to
be slower than that observed in the case of Y9669.
The experiment was also carried out using A 1891 as the silane. The PVC film was
20 pm. thick, and no bands from DMF were seen in the spectra. The results are shown in
Figure 4.16.
177

1.2
</)cZJooc05E05
q:• D0CO
16EL-.o
-*«- 0 mins heating 15 mins heating 60 mins heating
Figure 4.16 : The area of the SH stretching band of A1891 plotted vs. distance for A1891 diffusion in uPVC. Heating was carried out at 70 °C. The vertical lines show the positions
of the interfaces.
Figure 4.16 shows that before the laminate was heated, most of the silane was at the
upper surface of the laminate, but that some of the material had already diffused into the
PVC film. After 15 minutes heating, some of the silane could be seen to remain at the
upper surface of the PVC, but less than before the heating, and more silane was present
through the bulk of the film. After a total of 60 minutes heating, the silane appeared much
more evenly distributed through the PVC film. It is only the last profile ( which it is
assumed shows the equilibrium distribution of silane ) which looks similar to the profiles
obtained for the other silanes. The first two profiles look very different to those obtained
for the other silanes. This implies that diffusion occurs differently for the A1891 material.
178
20 30D istance ( p m . )
silicon

Comparing this data with that obtained for A1891 in unplasticised PVC by ATR - FTIR, it
is interesting to note that in both cases, diffusion appears to be a two - step process : firstly
a small amount of silane diffuses through the PVC followed by the bulk of the silane at a
later stage. It cannot be proven using these techniques that the diffusion follows a different
mechanism to that of the aminosilanes, but the agreement between the two techniques
suggests that this is the case.
4.4 : Fourier Deconvolution of Depth Profiles
The Raman depth profiles obtained and presented in the previous section were a
convolution of the real concentration profile of the silane in the PVC matrix with the
instrumental response to that concentration profile. Therefore, if the instrumental response
is known, it is theoretically possible to deconvolve the instrumental response from the
measured depth profile to obtain the true concentration profile. In the case of the Raman
depth profiles, the incomplete rejection of light scattered from regions out of the focal
plane causes an instrumental response which prevents one from obtaining a true
concentration profile. Therefore it was decided to attempt to deconvolve the confocal
response of the instrument from the measured depth profiles. This is possible because the
two functions which are convolved in real space are multiplied in Fourier space. That is,
FT(A * B) = FT(A) x FT(B) ( 4.1 )
where FT is the Fourier transform procedure
179

* is the convolution process
A and B are the two functions.
Therefore, to obtain the concentration profile, we must perform a Fourier transform on the
depth profile and the confocal response function, divide two functions thus obtained, and
then perform an inverse Fourier transform to give the deconvolved depth profile. It was not
possible to perform the deconvolution process on the measured data, as there were too few
data points, and thus a large amount of uncertainty would result. The process has instead
been carried out by fitting curves to the depth profiles obtained. These curves were then
used to generate large number of data points which model the data obtained as depth
profiles. Elsewhere18, the instrumental response used for deconvolution has been the
response to a silicon surface in air, as shown in chapter 2. This is shown in Figure 4.17
along with an exponential function fitted to the data.
180

£c3Ooc(CEcsa:
$>“
.0 “
c
Distance ( microns)
Figure 4.17 : The confocal response of the microscope in air ( circles ), and an exponentialfunction fitted to the data ( line )
The exponential fit to this data could be deconvolved from the curves fitted to the
depth profiles, to give a deconvolved depth profile. However, the response of the
microscope when performing a depth profile in a polymer film is not described well by this
data. The reason for this is refraction of the laser light as it passes across the discontinuity
in refractive indices at the air - polymer interface. This is described by Snell’s law :
nl sinGj = n2 sin02 ( 4.2 )
where n} is the refractive index of medium 1
181
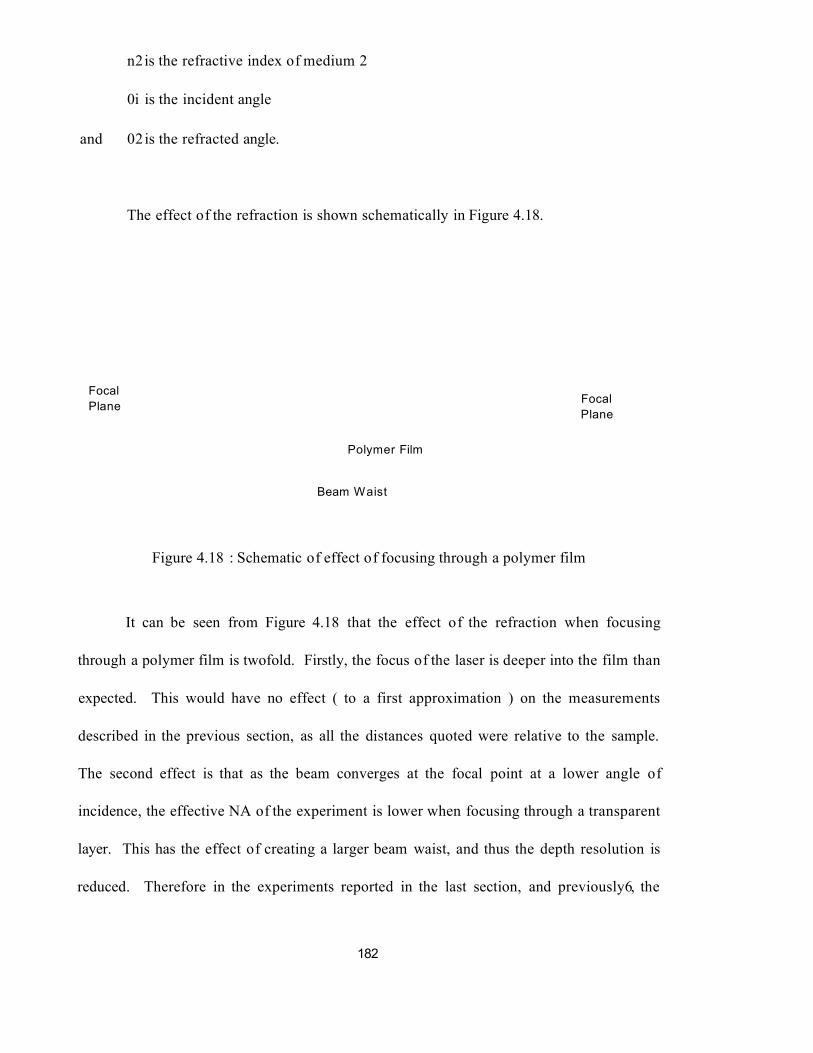
n2 is the refractive index of medium 2
0i is the incident angle
and 02 is the refracted angle.
The effect of the refraction is shown schematically in Figure 4.18.
FocalPlane
FocalPlane
Beam Waist
Polymer Film
Figure 4.18 : Schematic of effect of focusing through a polymer film
It can be seen from Figure 4.18 that the effect of the refraction when focusing
through a polymer film is twofold. Firstly, the focus of the laser is deeper into the film than
expected. This would have no effect ( to a first approximation ) on the measurements
described in the previous section, as all the distances quoted were relative to the sample.
The second effect is that as the beam converges at the focal point at a lower angle of
incidence, the effective NA of the experiment is lower when focusing through a transparent
layer. This has the effect of creating a larger beam waist, and thus the depth resolution is
reduced. Therefore in the experiments reported in the last section, and previously6, the
182
confocal response was not as shown in Figure 4.17. In order to determine the experimental
response when focusing through layer of PVC, a second confocal profile was measured.
This was done by casting a 20 pm. PVC film onto a silicon crystal, and measuring the
confocal response under the PVC film. The results are shown in Figure 4.19.
1 r
21 r i r4 6 8 10 12
Distance ( microns)
~i— r 14 16
Figure 4.19 : The confocal response of the microscope under a 20 pm. PVC film ( circles ),and an exponential fitting of the data ( line ).
It can be clearly seen that the confocal response under a polymer film is very
different to that in air. The spatial resolution achieved, measured by the full width at half
height criterion described in section 2 is 5 pm., as opposed to 2 pm. without the PVC film
present. Because the refractive indices of all organic polymers are very similar, it may be
183

18 6 * assumed that these results apply to other work ’ carried out in polymer systems, where it
was assumed that the confocal response was the same as that measured in air.
In order to deconvolve the data obtained, a program was written in the Matlab
proprietary numeric computation and visualisation package. This package was chosen due
to the ability to perform the analysis and plot the results within the same package. The
program is shown below. The Matlab package does not use line numbers, so they have
been added for ease of reference.
1 a = input('Input Gaussian curve parameter a :');
2 b = input('Input Gaussian curve parameter b :');
3 c = input('Input Gaussian curve parameter c :');
4 w = input('Input Exponential parameter a :');
5 count = 1;
6 for i=0:(30/2047):30
7 ga(count)=a*(exp(-(i-b)A2/(2*cA2)));
8 ax(count)=i;
9 ex(count)=exp(-w*i);
10 count=count+l;
11 end
12 ftga = fft(ga);
13 flex = fft(ex);
14 ftresult = ftga./ftex;
184
15 result = ifft(ftresult);
16 realresult = real(ftresult);
17
1 o
realresult = realresult/max(max(realresult));
1 > / i i\I V l o piOivax,ga, i )
19 hold on
20 plot(ax,ex,'b')
21 plot(ax,conl,'w')
22 hold off
23 xlabel ('Depth(pm.)')
24 title ('Deconvolution Results')
25 legend ('DataVExponential','Deconvolution')
26 ylabel ('Intensity')
27 set (gca,'ylim',[0 1.5])
28 s = input('Input filename for result data : ','s');
29 file = [s ’.txtf];
30 eval(['save ' file ' realresult -ascii']);
The operation of the program is as follows. The first four lines accept inputted
parameters of the curves which have been fitted to the experimental data. The program
expects an exponential function for the instrument response and a Gaussian function for the
data. The program then generates 2048 data points using these functions. Lines 12 and 13
perform the Fourier transforms of the data. Line 14 then divides the Fourier transform of
the data by the Fourier transform of the experimental response. The dividend is then
185

inverse Fourier transformed to give the result ( line 15 ), the imaginary part of which is
discarded( line 16 ). Although the program is used with normalised data, the deconvolution
often changes the intensity scale, therefore line 17 normalises the data in the y axis. The
remainder of the program simply plots the two original functions, and the result of the
deconvolution. Finally the program saves the deconvoluted data. An example of the
output of the program is given in Figure 4.20. The data used was the first depth profile of
Y9669 in unplasticised PVC ( i.e. the blue curve in Figure 4.13 ), and the exponential is
modelled on the response from silicon in air.
Deconvolution Results
Data— Exponential— Deconvolutior
0.8
0.4
0.2
Depth(um.)
Figure 4.20 : Deconvolution results from the first Y9669 diffusion experiment. The confocal response modelled was that of silicon in air.
186

Figure 4.20 shows that after deconvolution of the modelled confocal response, the
modelled depth profiles shifted to a lower depth. This indicates that the measured ( i.e.
convolved ) profile made the silane appear to have diffused further into the PVC film than
was actually the case. As shown by the comparison of Figure 4.17 and Figure 4.19, the
confocal profile was considerably different when measured in a PVC film. Therefore, it
was decided to model the confocal profile under PVC and perform the deconvolution
process on the same depth profile to see what difference this made. The results using the
exponential function fitted to the data measured under PVC are shown in Figure 4.21.
Deconvolution Results
Data— Exponential— Deconvolution
0.8
F 0.6
0.4
0.2
0 5 10 15 20 3025Depth(um.)
Figure 4.21 : Deconvolution of the data from the first Y9669 experiment. The confocal response used was that of silicon under a PVC film.
187

Comparison of Figure 4.21 with Figure 4.20 shows that the use of the confocal
response measured under a PVC film made a large difference to the deconvolution results.
Therefore, it was decided to use this response when performing the deconvolutions. All the
deconvolution results shown henceforth were obtained using the confocal response o f
silicon under a PVC film. It should be noted that strictly speaking, the effect of the
presence of the silane in the PVC film on the confocal response should also be modelled to
give a true measure of the convolution process. However, this is an extremely complex
process, as the silane moves in time through the film during the experiment, and is beyond
the scope of this work.
The deconvolution results of all the depth profiles obtained in the first experiment (
i.e. the results shown in Figure 4.13 ), using Y9669 in unplasticised PVC, and heating at
70°C for one and then two hours, are shown in Figure 4.22. All of the depth profiles were
fitted to Gaussian curves for deconvolution.
188
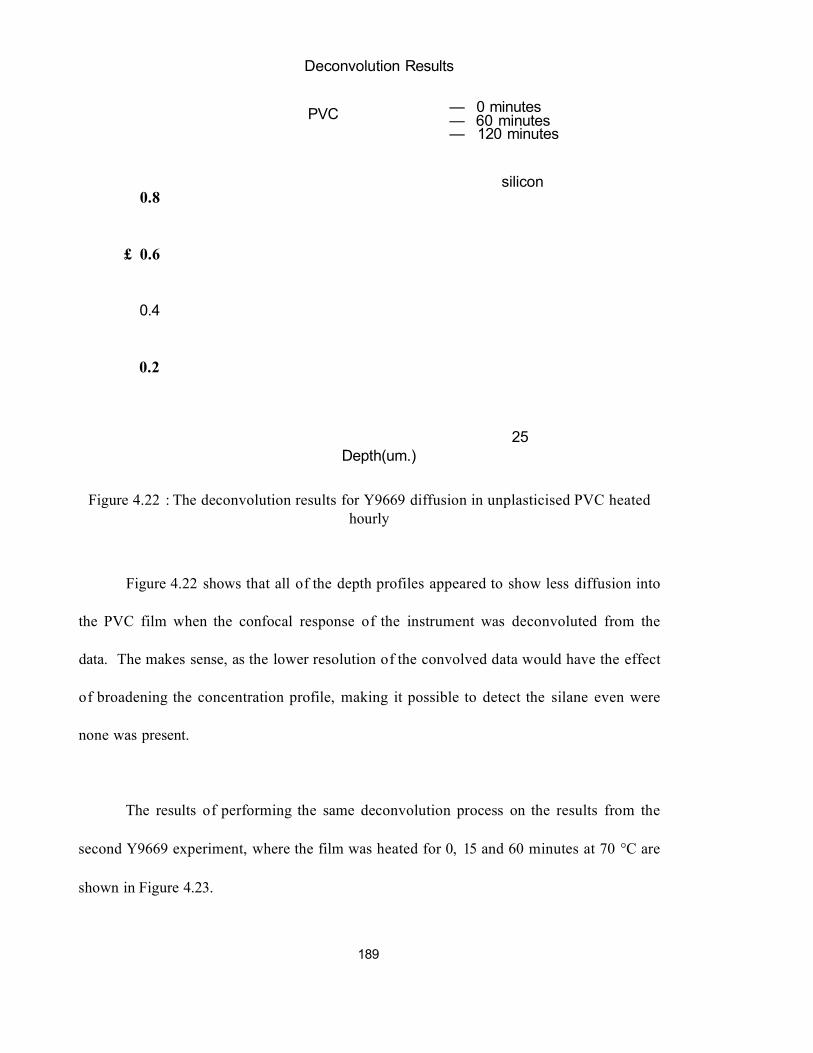
Deconvolution Results
— 0 minutes— 60 minutes — 120 minutes
PVC
silicon0.8
£ 0.6
0.4
0.2
25Depth(um.)
Figure 4.22 : The deconvolution results for Y9669 diffusion in unplasticised PVC heatedhourly
Figure 4.22 shows that all of the depth profiles appeared to show less diffusion into
the PVC film when the confocal response of the instrument was deconvoluted from the
data. The makes sense, as the lower resolution of the convolved data would have the effect
of broadening the concentration profile, making it possible to detect the silane even were
none was present.
The results of performing the same deconvolution process on the results from the
second Y9669 experiment, where the film was heated for 0, 15 and 60 minutes at 70 °C are
shown in Figure 4.23.
189

Deconvolution Results
PVCAir 0 minutes — 15 minutes — 60 minutes
silicon0.8
£ 0.6
0.4
0.2
100 20 30 40 50Depth(um.)
Figure 4.23 : The deconvolution results for Y9669 diffusion in unplasticised PVC heatedfor 0, 15 and 60 minutes at 70°C
Comparison of Figure 4.23 with Figure 4.14 shows that upon deconvolution of these
results, the width of the depth profiles narrow somewhat, showing that the broadening
effects of the confocal response have again been removed. This is especially true of the
results of the first depth profile, before any diffusion which shows a sharp boundary at the
silane / PVC interface. However, in the case of the 15 and 60 minutes heating profiles, the
Gaussian curves do not fit the depth profiles well on the low depth side. This is because
the depth profiles are asymmetrical. The effect of this is that the deconvolved curves are
190

broader compared to the depth profiles in the low depth region. Unfortunately, a simple
function which modelled this part of the curves well was not found.
The results of performing the same deconvoiUtion process on the iesuits uom tne
experiment using A1110 in unplasticised PVC where the film was heated for 0, 15 and 60
minutes at 70 °C are shown in Figure 4.24.
Deconvolution Results
PVCAir — 0 m inutes — 15 minutes— 60 minutes
silicon
0.8
0.4
0.2 ?
Depth(um.)
Figure 4.24 : The deconvolution results for A1110 diffusion in unplasticised PVC after 0,15 and 60 minutes heating at 70°C
Comparison of Figure 4.24 with Figure 4.14 shows that upon deconvolution
of these results, the width of the depth profiles again narrowed somewhat, showing that the
191

broadening effects of the confocal response have again been removed. This is especially
true of the results of the first depth profile, before any diffusion which shows a sharp
boundary at the silane / PVC interface. It can be seen that at the low depth side, the final
depth profile has actually been broadened.-^This is because in this caserthe deptlrprofile
does not fit well to a Gaussian model, as it is asymmetric, having a much sharper boundary
at the low depth side. However, a simple function which modelled this aspect of the shape
was not found.
In the case of the A1891 depth profiles, Figure 4.16 clearly shows that the data did
not show a Gaussian distribution. The depth profiles, especially those at 0 and 15 minutes
heating show a large concentration of silane at low depths ( i.e. at the surface of the PVC
film ), and a smaller amount through the bulk of the film. A model which was found to fit
this distribution was a rational function. This can be expressed as
a + bxY = i T T (4 .3 )1 + cx + dx
An example of the fitting of this model to the data from an A1891 depth profile is
shown in Figure 4.25.
192

sQ30O
Distance ( microns)
Figure 4.25 : Fitting of a rational function to the data from the first A1891 depth profilingexperiment.
An example of the results of the deconvolution of this rational function is shown in
Figure 4.26.
193

Deconvolution Results
1
0.8— Data— Exponential— Deconvolution
£ 0.6
0.4
0.2
00 10 20 30 40 50
Depth(um.)
Figure 4.26 : Results of deconvolution of rational function fitted to the first depth profile ofA1891.
Figure 4.26 shows that upon deconvolution, the rational function shifts to lower
depth, and the lobe at about 10- 15 jam. depth narrows considerably. The results of the
deconvolution of all the depth profiles of A1891 are shown in Figure 4.27.
194

Deconvolution Results
PVCAir silicon
1
0.80 m inutes 15 minutes 60 minutes
£ 0.6
0.4
0.2
00 2010 30 40 50
Depth(um.)
Figure 4.27 : The deconvolution results for A1891 diffusion in unplasticised PVC heatedfor 0, 15 and 60 minutes at 70°C
Figure 4.27 shows that in the case of the first depth profile, a much narrower
concentration of material at the PVC surface is seen than in the raw data. The other depth
profiles also show most of the silane remaining at the surface of the PVC film. In the case
of the A1891 results, the deconvolution process was clearly unsatisfactory. The
deconvolved curves show silane remaining present throughout the depth profile, i.e. even
into the region where the silicon crystal was. This is because a simple function could not
be found to adequately fit the distribution of the silane seen in the depth profiles. It is
believed that the best way of getting a function to approximate the shapes seen in Figure
4.16, would be to combine several functions together, e.g. a sharp Gaussian curve at the
195

PVC interface, and a broader, less intense one throughout the remainder of the PVC film.
However, this is beyond the scope of this project, which aimed only to show that the
principle of Fourier deconvolution may be used to take account of the broadening process
-caused by the instrumental response of-the microscope.—This has beemwell demonstrated
in this chapter.
196

References
1 Sung, N. H., Kaul, A., Chin, I. and Sung, C. S. P., Polymer Engineering and Science
22,-No-10,-p. 637 (-1982 )------------------------------------------------------------------------
2 Stein, J., Valenty, S. J., Smith, G. A., Brezniak, D. V. and Prutzman, L. C.,
Macromolecules Vol. 19 ( 1986)
3 Chaudhury, M. K., Gentle, T.M. and Plueddemann, E. P., Journal of Adhesion
Science and Technology Vol. 1, No. 1 ( 1987)
4 Dibenedetto, A. T. and Scola, D. A., Journal of Colloid and Interface Science Vol.
64, No. 3 ( 1978)
5 Tabaksblat, R., Meier, R. J. and Kip, B. J., Applied Spectroscopy Vol. 46, No. 1,
p.60 ( 1992)
6 Hajatdoost, S., Olsthoom, M. and Yarwood, J., Applied Spectroscopy Vol. 51, No.
12, p. 1784 ( 1997)
7 Hair, M. L., Advances in Chemistry Series Vol. 234, p. 161 ( 1994)
8 Angst, D. L. and Simmons, G. W., Langmuir Vol. 7, P. 2236 ( 1991 )
9 Ellahi, S., Hester, R. E. and Williams, K. P. J., Spectrochimica Acta Part A -
Molecular and Biomolecular Spectroscopy Vol. 51, No. 4, p. 549 ( 1995 )
10 Owen, E. D., Shah, M. and Twigg, M. V., Polymer Degradation and Stability Vol.
51, No. 2, p. 151 ( 1996)
11 Ishida, H., Chiang, C.-H. and Koenig, J. L., Polymer Vol. 23, p.251 ( 1982 )
12 Boerio, F. J., Armogan, L. and Cheng, S. Y., Journal of Colloid and Interface
Science Vol. 97, No. 2, p. 308 ( 1984)
13 Hoh, K.-P., Ishida, H. and Koenig, J. L., Polymer Composites Vol. 9, No. 2 ( 1988 )197

14 Opila, R.L., LeGrange, J. D. , Markham, J. L. , Heyer G. and Schroeder, C., M.,
Journal of Adhesion Science and Technology Vol. 11, No. 1, p. 1 ( 1997)
1 5----- Chiang,C.-H.,Ishida, H. and Koenig,J. Lt, Journal o f Colloid and Interface
Science, Vol. 74, No. 2, p.396 ( 1980)
16 Johansson, O. K., Stark, F. O., Vogel, G. E. and Fleischmann, R. M., Journal of
Composite Materials Vol. 1, p. 278 (1967)
17 Kurth, D. G. and Bein, T., Langmuir Vol. 11, No. 2, p.578 ( 1995 )
18 C. Sammon, PhD. Thesis, Sheffield Hallam University ( 1997)
198

Chapter 5 : Raman studies of organosilane hydrolysis
It was shown in the previous sections that the hydrolysis or condensation state of the
silanes had a significant effect on the diffusion properties of the silanes in PVC films.
However, the rates of these reactions was not well known. The hydrolysis of various
silanes has been studied by a number of techniques previously. These include Raman
spectroscopy1,2, NMR3,4, and infrared spectroscopy5'11. The aminosilane A ll 10 and the
mercaptosilane A1891 are two of the most widely studied, and some of these studies have
investigated the hydrolysis of these silanes3,7. However, the hydrolysis of Y9669 has not
been studied at all in the literature found. Therefore, in order to obtain comparable results,
it was decided to examine the hydrolysis and condensation of all three silanes in order to be
in a better position to interpret the diffusion data reported in chapters 3 and 6.
5.1: Experimental
The hydrolysis measurements were carried out using Raman spectroscopy. This
technique was chosen because previous work1,2 had identified bands common to many
organosilanes which were indicative of the progress of hydrolysis. Hydrolysis was initiated
as described in chapter 2, by mixing the silanes with an acidified IPA / H20 solution. The
solution was then sealed in a quartz cuvette and placed under the microscope, and spectra
taken at regular intervals.
199
5.1.1: Materials
The materials used were as described in chapter 3. The hydrolysis solution
containeaa 9: lIPA /H 20m ixture.T he solution was then acidified bythe addition of 3%
( v/v ) acetic acid. All of the hydrolysis solutions contained 25% silane ( v/v ). All
experiments were carried out at room temperature (25 ± 1 °C ).
5.1.2: Spectroscopic Measurements
Spectroscopic measurements were carried out with a Renishaw Ramascope system
2000 as described in chapter 2. The instrument was used in normal ( i.e. non - confocal)
mode. The 20X ULWD objective was used to allow focusing through the wall of the
quartz cuvette. In order that a large number of Raman bands could be analysed, extended
spectra were taken, generally in the range 500 to 1700 cm'1.
5.1.3 : Spectra of Materials
The Raman spectra of the unhydrolysed silanes were presented in chapter 4. In
order that the bands of the other materials in the hydrolysis solutions were not erroneously
identified as silane bands, the spectra of IP A, water and acetic acid were taken. The
Raman spectra of IPA, acetic acid and water are shown in Figure 5.1 to 5.3 . The spectra
were all taken in a quartz cuvette using the 20X ULWD objective.
200

3000-f
2500-
2000-
1500-
1000-
500-
3500 3000 2500 2000Delta Wavenumbers / cm -1
1500 1000 500
Figure 5.1: The Raman spectrum of iso propyl alcohol ( P A )
25000-
20000-
n 15000-
10000-
5000-
4000 3500 3000 2500 2000Delta Wavenumbers I
1500 1000 500
Figure 5.2 : The Raman spectrum of acetic acid
201

10000-
8000-
* $ 000-
4000-
2000-
4000 25003500 3000 2000
Delta Wavenumbers / cm '
5001500 1000
Figure 5.3 : The Raman spectrum of water
Figure 5.4 shows the Raman spectrum of the hydrolysis solution, consisting of a 9 to
1 ( v /v ) mixture of IPA and water, acidified by 3% added acetic acid. The spectrum was
taken in a quartz cuvette using the 20 X ULWD objective. Comparison of the spectra
shown shows that the spectrum of the hydrolysis solution is for practical purposes the same
as that of IP A.
202

10000-
,8000-
4000-
2000-
4000 3500 3000 2500 2000
Delta Wavenumbers / cm'
5001500 1000
Figure 5.4 : The Raman spectrum of the hydrolysis solution (9:1 IPA / H20 with 3% addedacetic acid)
5.2 : Y9669 Hydrolysis Results >
The Raman spectrum o f , [3-(phenylamino)propyl]trimethoxysilane ( Y9669, see
figure 1.1 ) was taken every 30 minutes, in the range 250 to 1650 cm*1 immediately after
the Y9669 had been added to the hydrolysis solution and agitated. The spectra were taken
until a total time of 24 hours had elapsed. The first and last spectra are shown in Figure
5.5. The spectra have been offset in the y-axis to make it easier to distinguish between
them.
203

80000
60000
30 minutes40000
20000
24 hours1600 1400 1200 1000 800 600
Delta Wavenumbers / cm'1
Figure 5.5 : The spectra of Y9669 in a 25% aqueous alcohol solution after 30 minutes and 24 hours. The spectra have been offset in the y-axis.
10000
30 minutes5000
24 hours
-5000
720 700 680 660 640 560620 580600
Delta Wavenumbers / cm'1
Figure 5.6 : The spectra of Y9669 after 30 minutes and 24 hours. The spectra are shown onthe same y-axis
204

Figure 5.5 shows that the spectra changed very little over the experimental time of
24 hours. The spectral region of 540 to 740 cm'1 has been blown up and is shown in Figure
5.6. In this case, the spectra are shown on exactly the same scale.
Figure 5.6 shows that the two bands at 617 and 645 cm'1 both decreased in intensity
during the course of the experiment, and that a small band at about 710 cm'1 appeared.
Ishida et. al. assigned bands at 640 cm'1 and 612 cm'1 to Si-O-C stretching modes of
unhydrolysed Al 1102. As Y9669 differs from Al 110 only in having a phenyl ring attached
to the amine group ( see figure 1.1), we have assigned the 617 cm'1 and 645 cm'1 bands in
Y9669 to Si-O-C stretching. The integrated intensity of these bands are plotted versus time
in Figure 5.7 and Figure 5.8.
16000
8 15500
1r 15000
14500
T3| 14000O)
135000 5 10 15 20 25
Time ( hours)
-"-Area at 617 cm-1
Figure 5.7 : The integrated intensity of the 617 cm'1 band of Y9669 plotted vs. time in thehydrolysis solution
205

14000
8 13500 -
£ 13000
12500
T3| 12000 o>
11500
T im e ( h o u r s )
A rea a t 645 cm-1
figure 5.8: The integrated intensity of the 645 cm* band of Y9669 plotted vs. time in thehydrolysis solution
Figures 5.7 and 5.8 show that the intensities of the two bands assigned to Si-O-C
stretching decreased throughout the experimental duration ( 24 hours ). This showed that
hydrolysis was occurring over this period of time, but also that hydrolysis was not complete
after 24 hours. Both plots, but especially figure 5.8 showed an initial ‘induction period’ in
which no decrease in Si-O-C stretching intensity occurred. This showed that the silane was
initially stable to hydrolysis in solution for the duration of this induction period, which
lasted approximately 4 hours.
The integrated intensity of the 710 cm'1 band of Y9669 which appeared during
hydrolysis is plotted versus time in figure 5.9.
206

500
£ 300 -
o 200 -
T3£2 100 - - D)
T im e ( h o u r s )
A rea a t 710 cm-1
Figure 5.9 : The integrated intensity of the 710 cm"1 band of Y9669 plotted vs. time in thehydrolysis solution
Figure 5.9 shows that the band at 710 cm"1 appeared after a total hydrolysis time of
10 to 12 hours. Shih and Koenig1 assigned a band at 710 cm"1 in methacryl silane to Si-0
stretching in triply hydrolysed silane. Therefore we have assigned the band in Y9669 at
710 cm*1 to Si-0 stretching of the triply hydrolysed silane. The combination of the
decrease of the bands due to unhydrolysed silane ( figure 5.7 and figure 5.8 ) and the
increase of the band due to triply hydrolysed silane shows that the hydrolysis occurs over a
time-scale of several tens of hours, the first silane molecules becoming totally hydrolysed
only after 10 hours in the hydrolysis solution.
207

It is noteworthy that bands due to intermediate products, i.e. singly or doubly
hydrolysed Y9669, were not seen. This implies that hydrolysis of the completely
unhydrolysed silanes was slow compared with hydrolysis of the intermediate products to
give the triply-hydrolysed form of Y9669. This agrees with the suggestion made by Riegel
et. al.12 that the singly and doubly hydrolysed silanes are very reactive towards hydrolysis
compared to the unhydrolysed material.
5.3 : A ll 10 Hydrolysis Results
In order to assess the hydrolysis of [3-(amino)propyl]trimethoxysilane ( Al 110, see
figure 1.1 ), a 25 % solution was made up as described above, rapidly mixed, and then
placed under the microscope. The extended Raman spectrum of the A ll 10 was taken
every 10 minutes, in the range 350 to 1700 cm'1. The spectra were taken until a total time
of 24 hours had elapsed. The first and last spectra are shown in Figure 5.10.
208

60000
50000
« 40000
i 30000
20000
10000
0
10 minutes
24 hours
1600 1400 1200 1000 800 600
Delta Wavenumbers / cm'1
Figure 5.10: The spectra of Al 110 in a 25% aqueous alcohol solution after 10 minutes and 24 hours. The spectra have been offset in the Y-axis.
Figure 5.10 shows that the spectra of A ll 10 in the hydrolysis solution after 10
minutes and 24 hours were identical. One possible interpretation is that in acidic aqueous
alcohol solution, no hydrolysis occurs, at least between 10 minutes and 24 hours after
mixing. However, it can also be seen that the two bands assigned by Ishida to Si-O-C
stretching at 612 cm"1 at 640 cm"1 are not present. This indicates that hydrolysis had
already occurred in the first spectrum. If hydrolysis had occurred followed by
condensation, then bands appearing and increasing in intensity due to the condensation
products would have been seen. However, no increasing bands were seen, suggesting that
condensation did not occur in this experiment. This agrees with the results found by
i 'j #Plueddemann ~ who found that, in the case of 3-aminosilanes in aqueous solutions,
hydrolysis occurred very quickly, but that the silane was then extremely stable to
condensation. Morrall and Leyden found that A1100 ( the ethoxy analogue of A ll 10 )
209
hydrolysed and condensed in studies of neat silane exposed to atmospheric water, but that
only hydrolysis ( no condensation) occurred when A1100 was studied in solution, over the
time-scale of the experiment ( also 24 hours).
It is thought that the initial rapid hydrolysis is caused by the catalysis of the reaction
by the amine group of A11103,13. The hydrolysed silanes are then stabilised due to an
intramolecular hydrogen-bonded ring structure14. Plueddemann proposed two possible ring
structures of the 3-aminosilanes showing this behaviour, which are reproduced in figure
1.8. Comparison of this figure with figure 1.1 suggests an explanation for A ll 10 showing
this behaviour while Y9669 does not. Both structures in figure 1.8 rely on the silane being
able to form an internal ring, allowing the Si-0 and N-H bonds coming close to each other.
This would be considerably less likely with the very large and rigid phenyl ring attached to
the amine group. Therefore it is believed that it is this steric effect which prevents Y9669
showing the same hydrolysis and condensation behaviour as Al 110.
5.4 : A1891 Hydrolysis Results
In order to assess the hydrolysis of [3-(mercapto)propyl]triethoxysilane (
Al 891, see figure 1.1 ), a 25 % solution was made up as described above, rapidly mixed,
and then placed under the microscope. The extended Raman spectrum of the A 1891 was
taken every 10 minutes, in the range 450 to 1100 cm'1. The spectra were taken until a total
time of 20 hours had elapsed. The first and last spectra are shown in Figure 5.11, including
a blown-up spectrum of the 600 to 700 cm'1 region.
210

120000
100000
60000
Delta Wavenumbers I cm'1
40000
10 minutes20000
20 hours-20000
1000 900 800 700 600
Delta Wavenumbers / cm’1
Figure 5.11 : The spectra of A1891 in 25% aqueous alcohol solution after 10 minutes and20 hours
Figure 5.11 shows that unlike in the case of A ll 10, considerable changes occur in
the spectrum of A 1891 in the hydrolysis solution between 10 minutes and 20 hours after
mixing. Ishida has assigned a band at 639 cm'1 of [3-(mercapto)propyl]triethoxysilane( i.e.
A 189, the methoxy analogue of A 1891 ) to Si-O-C stretching of the unhydrolysed material.
In other organosilanes, this band increases in frequency by 10 to 15 cm'1 on changing from
the methoxy to the ethoxy form. Therefore, we have assigned the band in A 1891 at 650 cm'
1 to the Si-O-C stretching mode of the unhydrolysed material. It can be seen from Figure
5.11 that this band decreases in intensity over the reaction time, indicating that hydrolysis
occurs. In order to show in more detail how this band changes over time, the integrated
intensity of the band was obtained by using a curve-fitting routine. The integrated intensity
of the band versus experiment time is plotted in Figure 5.12.
211


13000
c 12000
11000 -
10000 -
9000
■g 8000 -
S? 7000 -
6000
Time ( h o u r s )
A rea at 651 cm-1
Figure 5.12 : The intensity of the 651 cm'1 band of A 1891 vs. time in aqueous alcoholsolution
Figure 5.12 shows that the intensity of the Si-O-C stretching band decreased very
rapidly at first, and more slowly after about 2 hours. However, the band did not reach a
true equilibrium, but continued to decrease in intensity throughout the time of the
experiment. This showed that a large number of the available ethoxy groups were
hydrolysed quickly, and hydrolysis then slowed, but continued at a steady rate. It is also
worth noting that even after 20 hours, half of the initial intensity of the Si-O-C stretching
band still remains, indicating that a large number of ethoxy groups remain unhydrolysed.
212

Figure 5.11 also shows a band at about 683 cm'1 which increased in intensity from
the first to the last spectra. A band at 672 cm'1 was assigned by Shih and Koenig1 to triply
hydrolysed silane in vinyl silane, and it was assumed here that the band at 683 cm'1 in
A1891 could be assigned to triply hydrolysed A1891. The intensity of this band versus
time in the solution is shown in Figure 5.13.
5000
o 4000 -
2 3000 -
a5 2000 -
1000 -O)
T ime ( h o u r s )
— A rea at 685 cm-1
Figure 5.13 : The intensity of the 685 cm'1 band of A1891 vs. time in aqueous alcoholsolution
Figure 5.13 shows that the 685 cm'1 band of A1891 initially increased quickly after
mixing in the hydrolysis solution, and then decreased slowly in intensity throughout the
experiment. This is consistent with the assignment of this band to triply hydrolysed silane,
which would be expected to start with zero intensity and increase in intensity as hydrolysis
213

progresses. The decrease in intensity must have been due to condensation of the trisilanols
formed.
----------It-is interesting-to compare the results-obtained in the case of AT891with^those
found for Y9669. In both cases a band assigned to Si-0 stretching of triply hydrolysed
silane was observed to appear in the course of the experiment. However, in the case of
A1891, it increased in intensity very rapidly and then decreased slowly, and in the case of
Y9669 it appeared only after 10 hours, and did not reach a maximum over the timescale of
the experiment. Similarly, the decrease in intensity of the bands assigned to Si-O-C
stretching in unhydrolysed silanes occurred much more quickly in the case of A 1891 than
in Y9669. This is somewhat surprising, as from the literature it might be expected that the
amino silane would hydrolyse much more quickly. However, the experiments described
here were carried out in the presence of acid catalyst. It would appear that, with an
external catalyst, the mercaptosilane may hydrolyse faster than the amino silane Y9669.
It can be seen from Figure 5.11 that two other bands at 880 cm'1 and at 1048 cm'1
appeared during the experiment. The integrated intensities of these bands are plotted
versus time in Figure 5.14 and Figure 5.15.
214

It is interesting to compare the results obtained in the case of A1891 with those
found for Y9669. In both cases a band assigned to Si-0 stretching of triply hydrolysed
silane wasobservedto appearin the course of the experiment. -However,-in-the case of
A 1891, it increased in intensity veiy rapidly and then decreased slowly, and in the case of
Y9669 it appeared only after 10 hours, and did not reach a maximum over the timescale of
the experiment. Similarly, the decrease in intensity of the bands assigned to Si-O-C
stretching in unhydrolysed silanes occurred much more quickly in the case of A 1891 than in
Y9669. This is somewhat surprising, as from the literature it might be expected that the
amino silane would hydrolyse much more quickly. However, the experiments described
here were carried out in the presence of acid catalyst. It would appear that, with an external
catalyst, the mercaptosilane may hydrolyse faster than the amino silane Y9669.
It can be seen from Figure 5.11 that two other bands at 880 cm’1 and at 1048 cm’1
appeared during the experiment. The integrated intensities of these bands are plotted versus
time in Figure 5.14 and Figure 5.15.
214

20000
15000
£ 5000 EO)
T ime ( h o u r s )
A rea a t 880 cm-1
Figure 5.14 : The integrated intensity of the 880 cm-1 band of ethanol vs. time of A1891hydrolysis
Figure 5.14 and figure 5.15 show that both the 880 cm"1 and 1048 cm"1 bands show
the same kinetics, increasing rapidly in intensity, and then reaching equilibrium after about
2 hours. Clearly both bands arise from a product of hydrolysis. One of the major products
of hydrolysis of A1891 is ethanol.. The spectrum of ethanol is shown in Figure 5.16.
215


6000
5000 -
E 4000 --
Jfr 3000 -
1 2000 --I ~o
1 1000 -
2010 150 5Time ( h o u r s )
— A rea a t 1048 cm-1
Figure 5.15 : The integrated intensity of the 1048 cm-1 band of ethanol vs. time of A1891hydrolysis
6000-
5000-
a 4000-
3000-
1000-
3000 2000Delta Wavenumbar»/ cm '1
6003500 2500 1600 10004000
Figure 5.16 : The Raman spectrum of ethanol
216

U r( ;-ruxV; .■ :; iiT
? i - r r . : ~
1 ■ <X:. . . &
'!■■■ Oi i'.;;; ■?
■ J - j i :
ii Uj l i Gh! ' ; . * ’ t ; i > "■ ' j / i i t o i ; ; | t j ' - •!. . • <’ ! t
!'■ H!.'!’!;;' :-;li

Figure 5.16 shows that ethanol has a strong band at 880 cm'1 and a weaker band at
1048 cm’1. These bands are assigned to the v(CO) stretching mode and v(CCO) stretching
modes of ethanol, respectively. This ethanol is a product of hydrolysis of A 1891, and the
increase in intensity of this band is an alternative method of measuring hydrolysis. It is
interesting to compare the shape of figure 5.12 with figures 5.14 and 5.15. One would
expect, that if the ethanol is a product of the hydrolysis of A 1891, that the two curves would
show exactly the opposite trends. To a certain extent, this is true, as figure 5.12 shows a
rapid decrease in intensity up to 2 hours time, and the ethanol bands show a rapid increase
up to this time. However, the band due to unhydrolysed A 1891 continues to decrease in
intensity after this time, whereas the ethanol bands do not increase further, and decrease in
intensity very slightly towards the end of the experiment. The ethanol produced must be
going on to react further. It is not known what this reaction is, although it could be reaction
with the acid catalyst which is present. However, this observation acts as a reminder that
the system studied rapidly becomes very complex as hydrolysis progresses.
It is believed that one of the processes that may occur when lamination is carried out
industrially using silane coupling agents is hydrolysis of the silane coupling agent by water
present in the PVC interlayer. Furthermore, it is believed that this process may be vitally
important to the success of the lamination process. In order to determine what parameters
may be important for this process, several attempts were made to follow the process in
model laminates, as were used in chapters 3 and 4. The strategy used was as follows. PVC
films, cast onto silicon crystals, were exposed to known humidities to change the level of
water present in the PVC. The laminates were then analysed by focusing the Raman
217

■ r
on r.-r. * •: ( ' s ' )" • poi,, , ',oiO ...; ■ o i o r - 0 / 0 7 ol f - i >oo.:.n o: ■ .’ - ' . .o ' ; : o o : J-
7 0 i u i ' ! ) : . j o 1: ; O l o / O -0 . 77; . ■i :■,! ■ ■ ; . ■ -m '
■■ o . 0 7 o •' : ' O o s r o ' , 7 7 ’o / n o i k o n v - ' o i ; ; o " 7 ; o . o n o l k o . o : o t o o - o v : . O ' 7 7 ' n . 7 0
U s ' }■< w I X ; >rn> i i k ' I O O t O ' i O ; - ' 1 7 o n . ’ ' o ; ' o l o X i O . k O n O ' - ' o - ' o o j i V
n . o 7 ■:; ,'fj 7 o; l i :>) o ' r o n ■. ' : - 7 .• n o n . o o ■'n :;n :; o imij js .if;?I’ 0 7 . • 7 , ,
■ - o n ; k ■ o n o ; . o : J O -7 - n ; : . - ' l i v . i / M o n V. n . A ' t o o 7 H < . n q o . ; v A ' k o n / : n o f ; - ;
'■A ; OOO .-vori.- - -noonl ion; ; f ; ! : ; / ' T . n ' ^ O : ; i o n ~ ' ■ 0 7 n o o n <<; ' !' 0 7 ;i;"
* 1 : ' 7 .'..■'■=?> t 7 7 . . : ; ' M : : • ' ■ i '■ ■ ■ ' . • i ■ : ■ ' O ' : ; 7 7 0 i ‘O .' >: !■ : O'.' 7 . 0 „ i ' i , ' . .0 ' r [ ; ; ' : ; ■ ! i , • O ' ’ ; i '
.1 •, . ! •; n : ! O p M O - 0 ; o : : • ! . - ; ■ -1 u / i ' : ; ; ^ ; '■ ■. ; i ! , : • : o ' : ' ? o ; i i; ; . ^ ^r 1: 0
.■ i 0 : 0 . ! -0 0 0 ’ , . i ' i ! ;V' " !r.> O. p . ., 0 - . V’ i.. ;0: (/•■' ■■' j: •:; i ; 1!
. ' O ' ; ' 1 0-' hi;.!0-.' j i i i . r U ' X r : ; 0 0 , -.(f- ; O' i iV' O O i p ! . ! :o; :■> ; ■ ■■
" 0 - ' ■ ' j o ' ! .■ L o o ; : i ] V ' o i - ' : : : i i O ' : ■" . : l 1 y ■ ' ' . ' . . ; . o • T o i V --
\ ■ 0 .0 ; : ; o / ,o- -".O o ’ O'":;o < y . r r ■. • ov
j i . i : O O I J p o ' ■; r 0 ' i o i i /. ' ' Oi MVO ;, ' ! 0 0 - 0 0 : t ' O - : - - ' p - o 1 . s i ! O O ’. O . . - ' : i:: : i
1 i n : : ; !■; h i \ - ','■■■ -■ o h ; - ' t o - ' o n / h o / o -o - ; . . i o , - o n - s O - j o . o o v o . o : n . o ' n . o r o , o '
‘ \ o :0 o ■ o O i / /J i 0 :'i <••;■ ■' . . V o - " O ' . : ' i l r 1, . n o O n o - >' 0 O r . . - : 0
- ' ' . r 0:r;' ' ; Ik?- o'0!:iv-oo.. oj ;o o ;v oooiooi-! ■ .-o !.;!.!'• : .:0 j oi;
0- . . - 'o;-/0 -i ■/■•";>!'■< ’ o - o o > O'; i --.o .. 'OOO'O; w 0 . oi; '*0 /0'"0
' p.'1/ o. no; --o { .. o, o- ;>• i o oo o.oiiiOp! -p:
’o ; ; o ; ' o o o o o O ' s o o i o n ’i / n o ; 1 o : ' r . h \ 0 0 ■ ■ ■ v y : 0 0 0 , ; ;no . p - o f o
.O'. : ! >' "O; O! ;

microscope at a fixed position in the PVC film, and spectra were continuously taken. The
aim was to monitor the intensities of the Raman bands sensitive to hydrolysis and
condensation as described in this chapter for ex situ experiments.
However, the in situ experiments were found to be complicated by several problems.
Firstly, the change in intensity of the ‘marker’ bands due to hydrolysis was overlaid with
changes in intensity due to diffusion of the silanes through the PVC. This was not
considered an insurmountable obstacle since, in principle, the diffusion could be taken into
account by measuring the hydrolysis band intensity as a ratio versus a band of the silane
which was not sensitive to hydrolysis. Secondly, PVC has two extremely intense Raman
bands at 635 and 614 cm'1 which overlap the SiOC stretching bands of the silanes ( which
were to be used for hydrolysis measurements ). Attempts were made to separate the
contributions of the bands from the two materials, but as the silane was present in lower
concentrations than the PVC, and the bands were weaker, this was found to be very
difficult. It was decided that this method was not a viable one for following the hydrolysis
of silanes in situ. However, it was decided that it may be possible to follow the in situ
hydrolysis indirectly by measuring the effect it had on the diffusion properties of the
silanes. It was shown in chapter 3 that prehydrolysed silanes were observed to undergo
slower diffusion to unhydrolysed silanes. Therefore it was decided to follow the diffusion
in films with different water contents, to see if in situ hydrolysis would occur, and affect the
diffusion properties.
As described in chapter 1, various authors3,5,15,16 have attempted to use simple
kinetics in order to follow the hydrolysis of silanes in solution. However, as discussed by
218

/HP'

Leyden and Atwater5, simple first and second order kinetics are not applicable to such
complex systems. However, as various authors had reported pseudo-first and pseudo-
second order kinetics3’5,16,the logarithmic intensities and reciprocal intensities of the bands
were plotted against time ( i.e. first and second order plots ), in order to see whether such
kinetics were being seen in the results shown above. In none of these cases were straight
line relationships seen. Therefore the hydrolysis of none of these silanes showed first or
second order kinetics under the conditions seen here. Considering the work of Atwater and
Leyden, this is not surprising, as it was shown that even in the case of a silane with a single
hydrolysable group, second order kinetics were seen. Clearly, much more complex
hydrolysis kinetics were seen here.
219

References
1 Shih, P. T. K. and Koenig, J. L., Materials Science and Engineering Vol. 20, p. 137
( 1975)
2 Ishida, H., Chiang, C.-H. and Koenig, J. L., Polymer Vol. 23, p. 251 ( 1982)
3 Blum, F. D., Meesiri, W., Kang, H.-J. and Gambogi, J. E., Journal of Adhesion
Science and Technology Vol. 5, No. 6 ( 1991)
4 Plueddemann, E. P., Ed. Interfaces in Polymer Matrix Composites, Academic Press,
New York, (1974)
5 Leyden, D. E. and Atwater, J. B., Journal of Adhesion Science and Technology Vol.
5, No. 10, p.815 (1991)
6 Trens, P., Denoyel, R., and Rouquerol, J., Langmuir Vol. 11, No. 2, p. 551 ( 1995 )
7 Morrall, S. W. and Leyden, D. E. in Silanes, Surfaces and Interfaces, Ed. by
Leyden, D. E., Gordon and Breach ( 1985 )
8 Boerio, F. J., Armogan, L. and Cheng, S. Y., Journal of Colloid and Interface
Science Vol. 73, No. 2 ( 1980)
9 Kurth, D. G. and Bein, T., Langmuir Vol. 11, No. 2, p.579 ( 1995 )
10 Miller, J. D., and Ishida, H. in Chemically Modified Surfaces, Ed. by Leyden, D. E.,
Gordon and Breach ( 1986 )
11 Hoh, K.-P., Ishida, H. and Koenig, J. L., Polymer Composites Vol. 9, No. 2 (1988 )
12 Riegel, B., Blittersdorf, S., Kiefer, W., Hofacker, S., Muller, M. and Schottner, G.,
Journal of Non-Crystalline Solids Vol. 226, p. 76 ( 1998 )
13 Plueddemann, E. P., in Chemically Modified Surfaces, Ed. by Leyden, D. E.,
Gordon and Breach (1986)
220

14 Plueddemann, E. P., Silane Coupling Agents, Plenum Press, New York, (1991)
15 Pohl, E. R and Osterholz, F. D., in Molecular Characterisation of Composite
Interfaces, Ed. by Ishida, H. and Kumar, G., p. 157, Plenum Press, New York (1985
)
16 Savard, S., Blanchard, L. P., Leonare, J. and Prud'homme, R. E., Polymer
Composites Vol. 5, p. 242 (1984)
221

Chapter 6 : Studies of organosilane diffusion in humidity - controlled films
In order to determine whether the presence of water in PVC films could affect the
diffusion properties of silanes in the films, experiments were carried out using films that
had been exposed to known humidities. It was thought that the silane might hydrolyse
whilst undergoing diffusion, and this would change the diffusion properties. It was shown
in chapter 3 that prehydrolysed silanes showed different diffusion properties to fresh,
unhydrolysed silanes. The diffusion of the silanes in humidity - controlled films was
studied by both ATR - FTIR spectroscopy and Raman microscopy.
6.1: Experimental
6.1.1: Materials
The silane used for the experiments was , [3-(phenylamino)propyl]trimethoxysilane
( Y9669, see figure 1.1 ). This was chosen firstly because it was shown in chapter 3 that
Y9669 diffusion was highly sensitive to prehydrolysis, at least in the case of heat - induced
diffusion through unplasticised PVC. Secondly, Y9669 was chosen because the strong
band at about 1600 cm"1 in both the infrared and Raman spectra ( figures 3.5 and 4.1 ) and
results in high spectral signal to noise ratio. The material has been described and the
spectra shown in chapters 3 and 4. The material was handled in an inert nitrogen
environment ( in a glove bag) to prevent hydrolysis before the start of the experiment.
222

In the Raman experiments, films approximately 24pm. thick were cast from DMF,
as described in chapter 4. In the infrared experiments, films approximately 10 pm. thick
were cast from DMF as described in chapter 3. In both cases the PVC contained 15% (
w /w ) DHA. This level of plasticiser was chosen to allow the diffusion to be followed at
room temperature, but to make the diffusion sufficiently slow to allow the diffusion to be
followed by Raman microscopy ( which requires fairly long spectral acquisition times ).
The amount of water in the PVC was controlled by exposing the film to the vapour of
saturated aqueous salt solutions. In one series of experiments, the film was exposed to the
vapour of a saturated potassium carbonate solution ( K2C03(aq) ), which produces a
relative humidity of 44% at 25 °C1. In the second set of experiments the films were
exposed to the vapour of a saturated ammonium chloride solution ( NH4Cl(aq) )which
produces a relative humidity of 80% at 25 °C1. The films were exposed to the vapour by
placing them alongside a beaker of the salt solution in a sealed desiccator jar. The films
were left in the desiccator for 48 hours. It is well known that water vapour diffuses into
PVC films2,3, so it was assumed that this treatment would result in PVC films containing
different concentrations of water. Another set of experiments used films which had not
been exposed to controlled humidity; these films were therefore the same as the 15% DHA
films used in the work described in previous chapters.
6.1.2: Spectroscopic measurements
In the Raman experiments, the laminates were placed under the microscope as soon
as the Y9669 had been applied and then the microscope was focused a distance of 6pm.
223

above the interface between the PVC and the silicon substrate. Thus, silane diffusion into
the film could be monitored as a function of time by measuring the increase in intensity of
the silane bands. This experiment was therefore analogous to the ATR-FTIR experiments,
and should show similar results. In this respect, it would have been preferable for the laser
to have been focused at the silicon interface, but this was found to lead to very low signal,
so the focus was moved into the film to increase the signal to noise ratio obtained, and thus
decrease the spectral acquisition time required. Static spectra were obtained, centred at
1600 cm'1. Spectra were obtained every 10 or 20 minutes. After the experiment had
finished, a depth profile of the laminate was measured, as described in chapter 4. All
Raman measurements used a 20 pm. glass cover slip to prevent contamination of the
microscope objective by the silane.
The infrared experiments were carried out in the same way as described in chapter
3. Y9669 was brushed onto the upper surface of the treated films, and the laminates then
placed in the FTIR spectrometer. Spectra were measured every 5 minutes, co-adding 520
scans. The experiment continued for a total time of 6 hours.
6.2 : Raman analysis of Y9669 diffusion in PVC exposed to atmospheric conditions
In the first experiment, a film which was not exposed to known humidity was used.
The results of the diffusion measurement using the Raman microscope are shown in Figure
6.1. Spectra were obtained every 5 minutes, for a total time of 9 hours. The results show
224

the integrated intensity ( obtained by curve fitting ) of the 1600 cm'1 band of Y9669 versus
time.
10000
8000
6000
4000
2000U)
T ime ( h o u r s )
A rea a t 1600 cm-1
Figure 6.1 : The integrated intensity of the 1600 cm'1 Raman band of Y9669 vs. time 6pm.above the interface. The film was exposed to normal atmospheric conditions
Figure 6.1 shows that the intensity of the silane band at the position 6 pm. above the
bottom of the PVC film increased slowly at first, and then more rapidly. After 9 hours the
intensity was still increasing, but the rate of increase appears to be just starting to decrease
towards the very end of the experiment. It is supposed that an equilibrium was reached
shortly after the end of the experiment. After this experiment, the microscope was set up in
confocal mode and a depth profile was measured of the laminate in the same XY position
225

as the measurement described above. The depth profile was not obtained immediately after
the measurements described above, but approximately 15 hours later. It is therefore
assumed that the depth profile represents the equilibrium distribution of Y9669 in the PVC.
The depth profile is shown in Figure 6.2.
500PVC siliconair
o 400 -
S 300 -
c 200 -
100 -
O)
40Depth ( m i c ro n s )
A rea a t 1600 cm-1
Figure 6.2 : The integrated intensity of the 1600 cm"1 Raman band of Y9669 vs. distance after diffusion was complete. The PVC was exposed to atmospheric conditions.
Figure 6.2 shows that the Y9669 had diffused throughout the film after 15 hours
after the end of the kinetic experiment. The distribution of the silane is similar to that
shown in chapter 4 in unplasticised PVC after annealing. There appears to be a small
excess of silane at the upper surface of the PVC, which may indicate that not all of the
Y9669 had diffused into the film.
226

6.2.1: Infrared analysis of Y9669 diffusion in PVC exposed to atmospheric conditions
The infrared experiments described in this chapter were carried out in the same way
as those described in chapter 3. The only difference was the humidity exposure of the PVC
films. Therefore, in the case of the film exposed to atmospheric conditions ( that is, no
specific treatment) the experiment was exactly the same as one from chapter 3, namely
Y9669 diffusion in PVC containing 15% DHA. Therefore, performing this experiment
again provided a check on the consistency of the results. The integrated intensity of the
1602 cm'1 band of Y9669 has been plotted versus time in Figure 6.3. Figure 6.3 also shows
the dual mode sorption fitting obtained.
Figure 6.3 shows that very similar results were obtained as when the experiments
described in chapter 3 were carried out. The data fits quite well to the dual mode sorption
model. The data was not found to show Fickian Case I diffusion kinetics. In Table 6.1 the
diffusion coefficients from the equivalent experiments in chapter 3 are compared with the
diffusion coefficients obtained from the above fitting.
227

0.25
0.2
£0.15ual sorption fit
0.05
100 150 200 250 300 350 400Time ( minutes)
Figure 6.3 : The integrated Intensity of the 1600 cm"1 infrared band of Y9669 vs. time. Thefilm was exposed to atmospheric conditions
Average result from Chapter 3 Result in Chapter 6
D| = 8.96xl0"9 D, = 9.92xl0‘9
D2 = 8.55xl0'9 D2 = 4.62xl0'9
X, = 0.69
r—H(T)o'II><
Table 6.1 : Comparison of results from chapter 3 and chapter 6
Table 6.1 clearly shows that the experiments yielded very similar results. These
results will be discussed further later in reference to the results obtained when the films
were humidity-controlled.
228

6.3 : Raman analysis of Y9669 diffusion in PVC exposed to K2C 0 3(aq) vapour
In the second experiment, the 15% DHA plasticised PVC film was exposed to the
vapour of K2C 03 for 48 hours before the experiment was carried out. This atmosphere had
a relative humidity of 44 %. The film was 24 pm. thick. The spectra were taken every 10
minutes, and the total length of the experiment was 18 hours. The results of the kinetic
Raman experiment are shown in Figure 6.4
14000
12000
10000
8000
6000
4000
2000D)
Time ( hours)
Area at 1600 cm-1
Figure 6.4 : The integrated intensity of the 1600 cm '1 Raman band of Y9669 vs. time. The film had been exposed to K2C 03 ( Relative Humidity of 50% ).
229

Figure 6.4 shows that the intensity of the 1602 cm'1 band of Y9669 initially
increased slowly and then more quickly up to 16.5 hours after the start of the experiment.
After this time, the spectra became so intense that the detector was saturated. This was
initially surprising, but observation of the film after the end of the experiment showed a
brown patch at the focal point of the laser, indicating that thermal degradation had
occurred. This was presumably due to burning by the laser. This had not occurred in the
depth profiling experiments described previously, as the focus of the laser was periodically
moved ( usually at least every 20 minutes ). Clearly, with the use of the microscope in non-
confocal mode, the intensity of the laser is such that the heat generated cannot be dissipated
quickly enough, and degradation occurs. The depth profile could not be measured due to
this degradation, as the intensity of the spectrum saturated the detector again. The effect of
the degradation on the spectra was to cause a broad fluorescence background to appear, as
shown in figure 4.5. The signal to noise ratio of the spectra was also reduced. This meant
that although the curve fitted intensity of the silane bands was not affected by the
degradation, eventually the baseline became so high that the peaks saturated the detector.
This is shown in Figure 6.5, which shows one of the spectra of the degraded film.
230

190000
■£ 185000
180000
175000
1800 1700 1600 1500 1400
Delta Wavenumbers
Figure 6.5 : Raman spectrum from kinetic study of Y9669 diffusion in K2C 03(aq) treated film, showing poor S/N and saturation of detector.
Despite the premature end of the experiment, comparison of Figure 6.2 with Figure
6.1 shows that the diffusion was taking place much more slowly in the case of the film
which had been exposed to the vapour of the solution of K2C 03. This is presumably
because water in the PVC film caused the silane to undergo hydrolysis in situ, possibly
leading to condensation to siloxane oligomers, and slowing diffusion.
6.3.1 : Infrared analysis of Y9669 diffusion in PVC exposed to K2C 0 3(aq) vapour
The infrared analysis of the film exposed to K2C03(aq) vapour was carried out in
the same way as that exposed to atmospheric conditions. The film was 10 pm. thick. The
231

integrated intensity of the 1600 cm'1 band of Y9669 is shown in Figure 6.6. The plot also
shows the dual mode sorption fit obtained.
0.8
0.7
0.6ual Sorption fit
0.5
| 0.4"O02 0.3O)0
£ 0.2
100 150 200 250 300Time ( m in u te s )
350
Figure 6.6 : The integrated intensity of the 1600 cm'1 infrared band of Y9669 vs. time. The film had been exposed to K2C 03(aq ) ( relative humidity 50% ).
6.4 : Raman analysis of Y9669 diffusion in PVC exposed to NH4Cl(aq) vapour
In the third experiment, the 24 pm. 15% DHA plasticised PVC film was
exposed to the vapour of NH4C1 for 48 hours before the experiment was carried out. This
atmosphere had a relative humidity of 80 %. It was decided that it was desirable to
measure the intensity of the band for longer than was possible in the previous experiment (
232

16.5 hours ), as the diffusion had not reached equilibrium. Therefore the intensity of the
laser was reduced to half of its maximum power by use of the laser attenuation filter wheel
on the Ramascope. To compensate, longer scans were used. The results of the kinetic
Raman experiment are shown in Figure 6.7. The spectra were taken every 20 minutes, and
the total length of the experiment was 36 hours.
5000
"O
1000O)
Time ( h o u r s )
— A rea at 1600 cm-1
Figure 6.7 : The integrated intensity of the 1600 cm'1 Raman band of Y9669 vs. time. The film had been exposed to NH4C1 ( Relative Flumidity of 90 % )
After the kinetic Raman experiment was complete, a Raman depth profile of the
laminate was obtained, The plot of the integrated intensity of the 1600 cm"1 band of Y9669
versus distance is shown in figure 6.8.
233

1400siliconPVCair
1200
1000
800
400
200
Depth ( m ic ro n s )
A rea a t 1600 cm-1
Figure 6.8 : The integrated intensity of the 1600 cm'1 band of Y9669 versus distance after diffusion into a film exposed to NFLjCKaq) vapour ( relative humidity of 90 % )
Figure 6.7 shows that initially, the intensity of the 1600 cm'1 band of the Y9669
increased very slowly if at all. The increase in intensity then became faster, and eventually
slowed and equilibrium appears to have been reached after about 28 hours. Clearly,
reducing the laser power was successful in stopping degradation. It is assumed that the
laser power was low enough so that almost all of the heat from the laser could be
conducted away, as there was no sign of degradation in the film at all. Clearly, the
diffusion seen in Figure 6.7 is slower than that in Figure 6.1, indicating that the presence of
water in the film does slow diffusion of Y9669 through the film. Presumably this was due
to hydrolysis of the silane in situ. As the diffusion was not observed to equilibrium in the
234
second experiment ( Figure 6.4 ), comparison of the kinetics with those in the third
experiment is not simple, but it would appear that the higher level of humidity that the film
was exposed to in the later experiment slowed diffusion more than the lower level. It is
interesting to note that the literature indicates that water may act as a plasticiser for PVC4,
which may lead us to expect faster diffusion with higher level of water in the film.
However, it appears that the effect of the water on silane condensation has more effect
upon the diffusion rate than plasticising the PVC.
In order to provide some quantitative information on the change in diffusion
properties upon treating the film with humidity control, the increase in intensity of the
Y9669 band in the Raman kinetic analysis has been measured over a fixed time period for
all three results. In order to do this, the integrated intensities of the band at 1600 cm '1 after
20 minutes, and 9 hours have been ratioed. The results are shown in Table 6.2 which show
how much more intensity was detected by the microscope after 9 hours than in the first
spectrum. For example, for the film treated by atmospheric conditions, the intensity was
increased by approximately 11 times after 9 hours compared to its initial value.
235

Conditions 1600 cm"1 band area after 9 hours /
initial area
Atmospheric Conditions 10.6
K2C 0 3(aq) 5.4
NFfClfaq) 1.2
Table 6.2 : The increase in intensity of the 1600 cm"1 Raman band of Y9669 after 9 hoursfor all three film treatments
Table 6.2 shows that compared to the initial intensities, the film treated at 50%
relative humidity showed twice as much increase in Y9669 intensity as the treatment at
atmospheric conditions, and the film treated at 80% relative humidity showed ten times as
much increase. Clearly, humidity - controlled treatment of the films can dramatically
change the diffusion kinetics of silanes in the films. It should be noted, however, that the
response of the system to increased diffusion is not linear. This is because of the non -
linear confocal profile of the instrument response. A small increase in the diffusion rate
would therefore give rise to a greater relative increase in this ratio, so these results are not
directly proportional to diffusion rates, and cannot be compared directly to diffusion
coefficients.
Figure 6.8 shows that after diffusion the Y9669 was present throughout the PVC
film. The depth profile looks very similar to that shown in Figure 6.2, but without the
small excess of silane at the surface of the film, indicating that all of the silane diffused
into the film. Due to the relatively non-reproducible nature of the application method of
236

the silane ( It was brushed onto the PVC film by hand ), it is possible that the surface
excess was due to more silane having been applied to the film in the earlier experiment.
That is, if more silane than can be absorbed by the film is applied, some appears to stay on
the surface, leading to the small bump in silane intensity seen in Figure 6.2.
6.4.1 : Infrared analysis of Y9669 diffusion in PVC exposed to NH4Cl(aq) vapour
The infrared analysis of the 10 pm. PVC film that had been exposed to NH3Cl(aq)
vapour was carried out as described for the previous films. The integrated intensity of the
1600 cm '1 band of Y9669 is plotted versus time in Figure 6.9.
Figure 6.9 shows that there was quite a long ( ca. 20 minutes ) induction period in
the experiment during which little, if any, increase in the intensity from the Y9669
occurred. The intensity the increased and eventually slowed its increase in a sigmoidal
fashion. However, it can be seen that unlike the two previous experiments, the equilibrium
was not reached during the 6 hour experiment. This was presumably due to in situ
hydrolysis and possibly condensation to an oligomeric siloxane. The fact that the infrared
intensity did not reach equilibrium, although it did in the case of the 50% relative humidity,
showed that increased water in the PVC film led to increased hydrolysis o f the silane as it
diffused through the film.
237

Figure 6.9 also shows that the data did not fit very well to the dual mode sorption model.
This is presumably related to the presence of the induction period seen in this experiment.
This was not observed in any of the other Y9669 experiments using plasticised PVC.
However, it is interesting to note that a similar effect was observed when Y9669 was
prehydrolysed, and diffusion through unplasticised PVC was induced by annealing ( section
3.4, figure 3.35 ).
0.9
0.8
0.7
0.6
Sorption fit0.5
0.4"O
0.3CD
0.2
- 0.1100 150 200 250 300
Time ( m in u te s )350
Figure 6.9 : The integrated intensity of the 1600 cm '1 infrared band of Y9669 vs. time. The
film had been exposed to NH4Cl(aq) vapour ( relative humidity 80% )
238
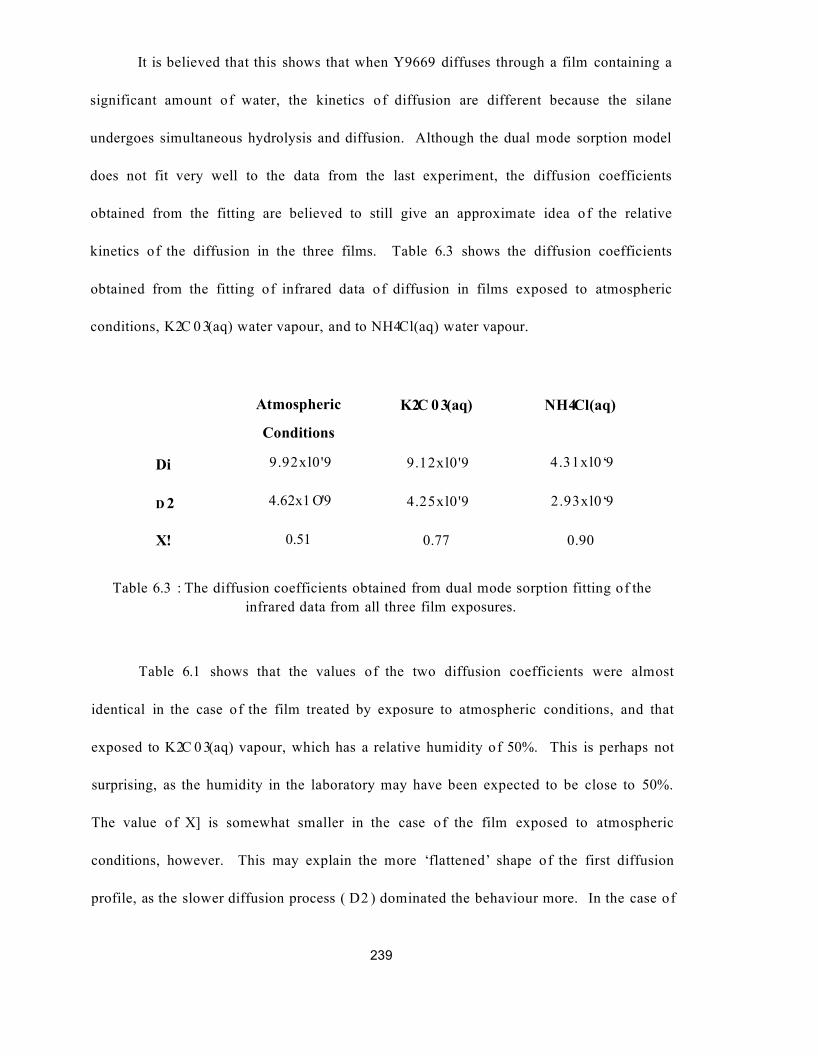
It is believed that this shows that when Y9669 diffuses through a film containing a
significant amount of water, the kinetics of diffusion are different because the silane
undergoes simultaneous hydrolysis and diffusion. Although the dual mode sorption model
does not fit very well to the data from the last experiment, the diffusion coefficients
obtained from the fitting are believed to still give an approximate idea of the relative
kinetics of the diffusion in the three films. Table 6.3 shows the diffusion coefficients
obtained from the fitting of infrared data of diffusion in films exposed to atmospheric
conditions, K2C 0 3(aq) water vapour, and to NH4Cl(aq) water vapour.
Atmospheric
Conditions
K2C 0 3(aq) NH4Cl(aq)
Di 9.92xl0'9 9.12xl0'9 4.31xl0‘9
d 2 4.62x1 O'9 4.25xl0'9 2.93xl0‘9
X! 0.51 0.77 0.90
Table 6.3 : The diffusion coefficients obtained from dual mode sorption fitting of the infrared data from all three film exposures.
Table 6.1 shows that the values of the two diffusion coefficients were almost
identical in the case of the film treated by exposure to atmospheric conditions, and that
exposed to K2C 0 3(aq) vapour, which has a relative humidity of 50%. This is perhaps not
surprising, as the humidity in the laboratory may have been expected to be close to 50%.
The value of X] is somewhat smaller in the case of the film exposed to atmospheric
conditions, however. This may explain the more ‘flattened’ shape of the first diffusion
profile, as the slower diffusion process ( D2 ) dominated the behaviour more. In the case of
239

the film exposed to NH4Cl(aq), both diffusion coefficients are smaller than found for the
other two cases. Despite the poor fitting of the kinetics to the dual mode sorption model,
this is believed to show the effect of hydrolysis of the silane in situ, causing slower
diffusion.
There was a noticeable difference in the trend in the results found in the ATR-FTIR
and Raman results. In both cases, diffusion in films exposed to 80% relative humidity was
slower than that in films exposed to atmospheric humidity. However, in the Raman results,
diffusion in films exposed to 44% relative humidity was slower than in films exposed to
atmospheric humidity, but in the infrared results, the diffusion rates were very similar.
Firstly, it should be stated that the atmospheric humidity was very variable, as the
experiments were all carried out on different days. However, there is one possible
explanation for the difference between the infrared and Raman results. In the case of the
Raman experiments, the laminate was taped to a microscope slide at the edges to make
sample handling simpler. Also, the laminate was covered by a glass slide after application
of the silane. It is thought that if the humidity treatment had caused raised water levels in
the PVC film compared to the untreated film, then these factors might mean that the film
used in the Raman experiments retained this water for longer. This would have the effect
of making the Raman experiments seem to show more hydrolysis, i.e. slower diffusion of
the silane.
240

References
1 Feast, R. C, and Astle, M. J., Ed., Handbook of Chemistry and Physics, 61st.
edition, CRC Press, Florida (1981)
2 Okuno, H., Renzeo, K. and Uragami, T., Journal of Membrane Science Vol. 103,
p.31 ( 1995)
3 Shailaja, D. and Yaseen, M., Polymer International Vol. 32, p. 247 ( 1993 )
4 Langevin, D., Grenet, J. and Saiter, J. M., European Polymer Journal Vol. 30, p.30 (
1994)
241

Chapter 7 : Conclusions
All of the work described in this thesis involved the investigation of the diffusion
and reactions of the three organosilanes Y9669, A ll 10 and A1891. Therefore the results
of the different chapters are all of relevance to each other. In this chapter, the conclusions
from chapters 3, 4, 5 and 6 will be discussed, and then the interrelation of the results from
different chapters will be discussed. After this, the overall conclusions of the work will be
drawn. Finally, some suggestions for future work will be made.
7.1: ATR-FTER analysis of the kinetics of diffusion
In chapter 3, the diffusion of all three silanes in a variety of PVC films was
measured using micro ATR-FTIR spectroscopy. Initial experiments used the silane
underlayer configuration used by Banga1. These experiments showed no diffusion of the
silanes into the PVC film. We believe that this was due to the condensation of the silane
underlayer during solvent removal.
The experiments using the silane overlayer configuration were able to detect
diffusion. It was found that alternately annealing the laminate at 70 °C and taking a
spectrum at room temperature led to an increase in the intensity of bands from the Y9669
until equilibrium was reached. This showed that diffusion had occurred. However,
exposure of the silane to atmospheric humidity before the experiment was observed to slow
242

this diffusion. In the same experiment using A ll 10, no diffusion at all was detected. In
the same experiment using A 1891, diffusion was observed, but an ‘induction period’ was
observed at the start of the experiment in which little diffusion occurred. It was thought
that the annealing of the PVC at 70 °C might have allowed diffusion because near the Tg of
the PVC ( which was 80 °C ), the PVC chains were more mobile.
This hypothesis was tested by plasticising the PVC to lower its' Tg. In plasticised
PVC, diffusion was observed at room temperature. A series of experiments were carried
out with plasticiser levels between 15 and 40% ( v /v ), using all three silanes. In all cases,
diffusion of the silane through the PVC was observed. However, in the case of A1891
diffusion in 15% plasticised PVC, an anomalous diffusion profile was seen, in which the
intensity of the silane band decreased after it had reached a maximum. In no cases did the
data fit to Fickian case I diffusion kinetics. In all cases, except the anomalous one, a
reasonable fit was obtained to the dual mode sorption model. The diffusion coefficients
generated from the fitting process increased by 2 to 3 orders of magnitude ( faster diffusion
) as the plasticiser concentration was increased from 15 to 40%. It was found that the
infrared bands due to the plasticiser decreased in intensity as the silane diffused into the
PVC. Experiments using an oligomeric plasticiser showed very similar diffusion kinetics
to those using a monomeric plasticiser with similar chemistry, at the same concentrations.
The bands of the oligomeric plasticiser also showed the same decrease in intensity as the
silane diffused into the film. It is believed that this showed that the uptake of silane
swelled the PVC film, explaining the decrease in intensity of the plasticiser bands.
243

All three silanes were hydrolysed by exposure to atmospheric water. In all three
cases, a band in the 900 to 1000 cm'1 region ( assigned to Si-O-R stretching by Hoh et. a l2
) was indicative of the progress of hydrolysis. Y9669 was found to hydrolyse the quickest,
followed by Al 110 and then A1891. Y9669 which had been hydrolysed in this way for 24
hours was shown to undergo slower diffusion through unplasticised PVC upon annealing
than un-hydrolysed Y9669. A ll 10 showed no diffusion when either hydrolysed or
unhydrolysed. A1891 which showed little hydrolysis over 24 hours showed very similar
diffusion before and after the treatment.
7.2 : Raman depth profile analysis of diffusion
It was shown that it is possible to determine the location of the silane in a silane /
PVC / silicon laminate using confocal Raman microscopy. Depth profiles of the PVC or
the silicon may also be obtained in the same manner. Care must be taken when interpreting
the depth profiles to take account of the confocal response of the microscope. However,
unlike ATR-FTTR spectroscopy, Raman confocal microscopy is capable of showing what is
happening throughout the PVC film.
Depth profiles were measured of the silane underlayer laminates. It was shown that
even upon annealing the laminates for 10 hours, the silane did not diffuse away from the
surface of the silicon crystal.
244

In the case of the silane overlayer laminates, the depth profiles showed the position
of the silane in the laminate before, during and after diffusion induced by annealing. All
three silanes underwent diffusion upon annealing the laminates at 70 °C. The depth
profiles of Y9669 and Al 110 showed very similar shapes. In the case of A1891, however,
a differently shaped depth profile was observed before and during diffusion. In this case a
large reservoir of the silane stayed on the outside of the PVC film, whilst a small amount of
the silane diffused throughout the PVC film. When diffusion was complete, however, the
depth profiles of all three silanes looked the same. It is not known why A1891 displayed
this anomalous behaviour.
The confocal response of the microscope was measured by measuring the intensity
of a silicon band in 1 pm. steps from the surface of the silicon. It was shown that due to
the refraction of the laser as it crosses the air / PVC interface, the beam waist was
stretched, which reduced the spatial resolution from 2pm. to 6pm. The effect of the
convolution of the confocal response was removed from the depth profiles by a Fourier
Transform technique. This reduced the distance over which the silane was detected in the
measured depth profiles, i.e. the spatial resolution of the experiment was effectively
increased.
7.3 : Raman hydrolysis measurements
245

In chapter 5, the hydrolysis of all three silanes in aqueous alcoholic solutions was
investigated using Raman spectroscopy. The solution contained an acid catalyst. This
solution was previously used by Banga to hydrolyse silanes1.
In the case of Y9669 the decrease in intensity of bands equivalent to those assigned
to SiOC stretching in Al 110 by Ishida et. al? showed the loss of the unhydrolysed silane.
After 10 hours the appearance of a band assigned to triply hydrolysed silanes4 showed that
some silanes had undergone complete hydrolysis.
In the case of A ll 10, no change in the Raman spectra occurred over 24 hours.
Correlation of the spectra with the literature showed that the A ll 10 had undergone
extremely rapid hydrolysis, as shown by the lack of the bands assigned by Ishida et. al., but
was then stabilised in solution to condensation by an intermolecular hydrogen-bonded ring
structure.
The spectra of the solution containing A 1891 showed the greatest changes upon
hydrolysis. The band assigned to SiOC stretching of unhydrolysed silanes decreased and a
band assigned to triply hydrolysed A1891 increased rapidly, and then slowly decreased,
showing that the hydrolysed A 1891 was undergoing condensation. Bands due to the
ethanol, which was a product of the hydrolysis could also be seen to appear in the
spectrum. The increase in intensity of these bands initially showed similar kinetics to the
loss of the unhydrolysed silane, but then the intensity of the ethanol bands decreased in
intensity slightly.
246

7.4 : Diffusion in humidity- controlled films
In chapter 6, the effect of altering the water content of 15% plasticised films on the
diffusion of Y9669 through the films was studied with both ATR-FTIR spectroscopy and
Raman microscopy. Films exposed to two relative humidities of 44% and 80% as well as a
film without controlled humidity were examined.
The Raman intensity near the bottom of the PVC film was monitored as a function
of time. The Y9669 showed slower diffusion in the film exposed to 44% relative humidity
than in the untreated film. The Y9669 showed even slower diffusion in the film exposed to
80% relative humidity. Depth profiles after diffusion were measured, and showed the same
shape as the equilibrium depth profiles from chapter 4.
Infrared measurements made using PVC films treated in the same way showed that
diffusion coefficients obtained from Y9669 diffusion in a film treated at 44% relative
humidity were only slightly less than those obtained from diffusion in an untreated film,
however, the coefficients from a film treated at 80 % relative humidity were considerably
lower. Differences in sample handling may explain the disparity between the relative rates
of diffusion in the infrared and Raman experiments.
7.5 : The interrelation of the results
247

Both the infrared and Raman depth profiling results showed that in the silane
underlayer laminates, diffusion of Y9669 into the PVC layer did not occur. From the ATR-
FTIR results alone, it would have been difficult to confinn this, as the expected change
would have been to see a small change in the large intensity o f the silane bands, especially
as the sensitivity of the evanescent field of the ATR experiment rapidly decreases further
into the PVC film. From the depth profiles measured, however ( figure 4.11 ), it can
clearly be seen that the silane layer does not interdiffuse into the PVC layer. From the
hydrolysis measurements, it was shown that over 24 hours, Y9669 undergoes hydrolysis in
solution, but no condensation was observed. However, in casting the prehydrolysed silane
films for the silane underlayer experiments, the film of silane solution was heated at 80 °C
in order to remove the IPA and water solvents. It might be expected that this would have
the effect of accelerating condensation, especially as the product of condensation ( i .e .
w ater) was being continuously removed. Therefore it is believed that the silane films used
in the silane underlayer experiments consisted of highly condensed siloxane polymers,
explaining why no diffusion occurred.
In the silane overlayer experiments using unplasticised PVC, the results using
Y9669 can be correlated by comparing the intensity at the same distance from the PVC
surface ( i.e. the silanes had diffused the same distance ) at the corresponding times in the
FTIR-ATR experiments and Raman depth profiling experiments. This can be done by
comparing the measured ATR-FTIR intensity ( as the experiment essentially measures the
intensity at the silicon interface, the silane concentration measured was that of the silane
which had diffused 10 pm. ), with the intensity in a Raman depth profile at the point 10
248

ATR-FTIR Raman depth profiling
pvfcPVC silane^ — silaneConfocalresponse
evanescentfield
distance distance
10pm. 10pm.
Figure 7.1 : Schematic diagram showing comparison of ATR measurements of diffusion and measurements taken from depth profiles ( not to scale)
It can be seen from Figure 7.1 that the two experiments are somewhat
similar in that in both cases there is a rapidly increasing response to the diffusing silane
from the experiment as a distance of 10 pm. is approached. The experiments are different,
however, in detail. In the Raman experiment, the silane diffuses past the measurement
point, but does not in the ATR-FTIR experiment. This should not have a great effect if the
silanes are distributed heterogeneously through the film at equilibrium. The quantitative
effect of the intensity response with distance is also different in the two cases, as was shown
in chapter 2. It is expected that the ATR-FTIR response falls off much more quickly than
the Raman response ( cf. figures 2.6 and 2.13 ).
In the case of Y9669, comparing figure 3.12 with figure 4.14, it can be seen that in
both cases, before any heating, only a small intensity, if any, could be seen 10 pm. from the
PVC surface. After 15 minutes, a large proportion ( o f the order of 90% of the equilibrium
249
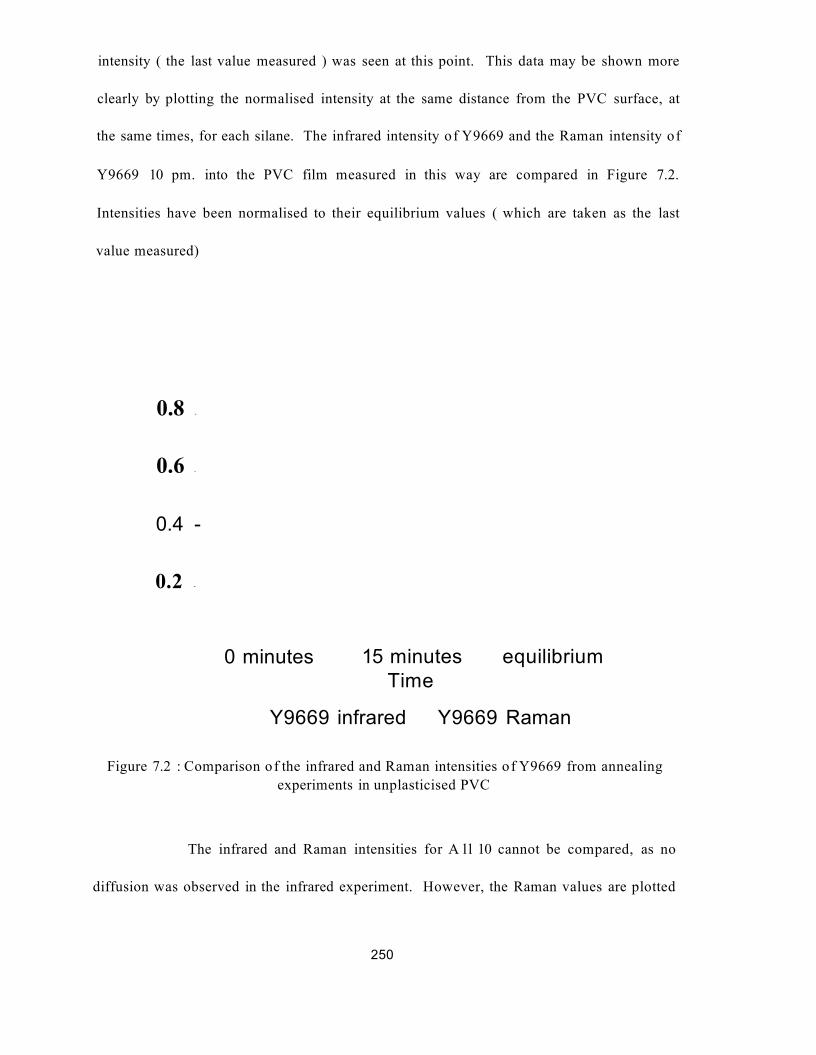
intensity ( the last value measured ) was seen at this point. This data may be shown more
clearly by plotting the normalised intensity at the same distance from the PVC surface, at
the same times, for each silane. The infrared intensity of Y9669 and the Raman intensity of
Y9669 10 pm. into the PVC film measured in this way are compared in Figure 7.2.
Intensities have been normalised to their equilibrium values ( which are taken as the last
value measured)
0.8 -
0.6 -
0.4 -
0.2 -
0 minutes 15 minutes equilibrium Time
Y9669 infrared Y9669 Raman
Figure 7.2 : Comparison of the infrared and Raman intensities of Y9669 from annealingexperiments in unplasticised PVC
The infrared and Raman intensities for A ll 10 cannot be compared, as no
diffusion was observed in the infrared experiment. However, the Raman values are plotted
250

in Figure 7.3 to allow comparison with the results from the other silanes. The intensities
observed in the A 1891 experiments are compared in Figure 7.3.
0.8 - -
0.6 -
0 .4 -
0.2 -
0 m i n u te s 15 m in u te s T im e
equ i l ib r ium
A 1 1 1 0 R a m a n
Figure 7.3 : Plot of the normalised Raman intensity of A l 110 from annealing experimentsin unplasticised PVC
251

0.8 -
0.6 -
~o
0 .4 -
0.2 -
0 m i n u t e s 15 m i n u t e s T im e
equ i l ib r ium
A 1 8 9 1 infra red A 1891 R a m a n
Figure 7.4 : Comparison of the infrared and Raman intensities of A 1891 from annealingexperiments in unplasticised PVC
The preceding three figures clearly show that the three silanes all show different
behaviour when treated in the same way. However, figure 7.1 and figure 7.3 also show that
it is possible to obtain the same information from both ATR-FTIR kinetic studies and
confocal Raman microscopic depth profiles, and that the data show the same trends. This
shows that in practice the response of the evanescent field in ATR-FTIR spectroscopy and
the confocal profile in Raman confocal microscopy show very similar intensity - distance
responses. We believe that this is the first time that data from the two techniques have been
directly compared in this way. It is not clear why A ll 10 was not observed to undergo
diffusion in the infrared experiment; especially in light that it showed very similar diffusion
characteristics to Y9669 in the ATR-FTIR studies of diffusion in plasticised PVC, and in
the Raman depth profile studies. The main difference which could affect the behaviour
252

between the two annealing experiments was the heat treatment of the laminate. It is
possible that the repeated treatment of the laminate at 70 °C for 5 or 10 minutes intervals in
the ATR-FTIR experiment caused the A ll 10 to undergo hydrolysis, preventing the
diffusion, whereas the treatment for 15 and then another 45 minutes in the Raman
experiment did not have this effect.
Comparison of the various data obtained on hydrolysis shows that the conditions
under which hydrolysis took place were very important. When hydrolysis took place in
aqueous solution, with an acid catalyst present ( chapter 5 ), A 1891 was shown to hydrolyse
faster than Y9669. However, in ambient conditions, reacting with atmospheric water with
no catalyst present ( chapter 3 ), Y9669 was observed to undergo hydrolysis much faster
than A 1891. This is presumably because A 1891 requires a catalyst to undergo rapid
hydrolysis, whereas aminosilanes such as Y9669 are thought to be able to undergo self
catalysis of the hydrolysis process5. In the case of Al 110, it was observed that in aqueous
solution, hydrolysis was extremely rapid, but no condensation was observed, whereas under
ambient conditions hydrolysis was relatively slow, but subsequent condensation also
occurred.
Comparison of the results from chapter 3 and chapter 6 also helps to explain what
was observed. Because the data in chapter 3 had previously shown that prehydrolysed
Y9669 showed slower diffusion than unhydrolysed Y9669, we could be confident in saying
that the mechanism by which the presence of water in a PVC film slowed diffusion was
that the water hydrolysed the silane in situ, leading to slower diffusion kinetics. The
253

similar depth profiles shown in chapters 4 and 6 also allow us to be confident in stating that
these depth profiles represent an equilibrium distribution of silane throughout the PVC
film, and that although hydrolysis slowed diffusion, the silane eventually reached the same
distribution in the PVC film.
7.6: Overall conclusions
The broadest conclusion that can be drawn from the work presented here is that the
organosilane / PVC / silicon system is an extremely complicated one where the reactions of
the silanes are critically dependent on many factors, including PVC film composition and
humidity, silane type application method and pre-treatment, and laminate age and thermal
history. However, some more specific conclusions are stated below.
All of the silanes investigated are capable of diffusion through PVC films.
Diffusion through unplasticised PVC is very slow or non existent at room temperature, but
occurs readily near the glass transition temperature of the PVC. The diffusion occurs
readily at room temperature in plasticised PVC and the diffusion is faster with higher
plasticiser concentrations. The kinetics of diffusion may be modelled by a dual sorption
model but do not show Fickian case I kinetics. The diffusion kinetics are also dependent
on the hydrolysis state of the silane. Hydrolysed silanes diffuse slower through both
plasticised and unplasticised PVC.
254

The hydrolysis kinetics of the silanes are highly dependent on silane functional
group and the hydrolysis conditions employed. A ll 10 hydrolyses extremely quickly in
aqueous solution but is then highly resistant to condensation to a polysiloxane. On the
other hand, if allowed to react with ambient humidity it shows slower hydrolysis and
readily condenses. Y9669 showed hydrolysis under both sets of conditions and also
showed evidence of condensing to a polysiloxane under ambient conditions. A 1891
showed extremely slow hydrolysis under ambient conditions, but very fast hydrolysis in
aqueous solution, when a catalyst was present. There was no evidence of condensation in
either case. It was also shown that it is possible for Y9669 to be hydrolysed by water
present in the PVC film as it undergoes diffusion; as expected this reaction slows the
diffusion of the silane through the PVC film.
Both ATR-FTIR spectroscopy and Raman microscopy were shown to be extremely
suitable to the study of the reactions and diffusion of small molecules such as organosilanes
outside and inside polymer laminates. More importantly, the two techniques yield
complementary information about the system and used together gave a fuller understanding
of the reactions occurring than either technique used separately. When the measurements
made by the two techniques were comparable, it was shown that at least qualitatively the
two techniques gave the same results.
The evidence shown here that silanes may undergo both diffusion and hydrolysis,
and presumably condensation in PVC / silicon laminates helps to explain the mechanism of
adhesion in industrial PVC / glass laminates. The fact that it has been shown that these
255

processes may occur in situ leads us to expect that the major process which contributes to
adhesion is interdiffusion of the silane and PVC, and probably formation of an
interpenetrating polymer network6, due to in situ condensation of the silanes by water
present in the laminate. The process described as the chemical bonding theory ' may well
occur, but it is expected that both processes are necessary for optimum adhesion.
7.7: Future Work
It was observed that the behaviour of all three silanes was different. However the
reasons for these differences remain unclear. Performing these experiments with a wider
range of silanes; specifically silanes with a systematic variation of alkoxy group and
functional group, would allow determination of the factors which determine and
organosilanes behaviour.
The experiment described here used a very simple model of laminated safety glass.
Now that the processes which occur in such systems and the methods which may measure
them have been determined, application of similar methods to more realistic models should
be carried out. For example, the use of more industrially relevant temperatures ( e.g.. 120
to 150 °C ), thicker PVC films, and the inclusion of industrial PVC additives ( e.g. heat
stabilisers and processing aids ) would provide information more relevant to the processes
which occur during glass lamination.
256

The reason why the A ll 10 failed to show diffusion in the infrared annealing
experiment was not clear. Several experiments could be performed to find out what was
happening. Raman depth profiles of the laminate with 5 minutes annealing times would
show whether the silane diffused at all. Alternatively, experiments involving applying the
silane directly on to an ATR crystal, or alternately on a very thin PVC film ( for example a
few 100 nm. ) could be performed. This would allow infrared spectroscopic determination
of the hydrolysis state of the silane, using the same bands used in chapter 3. This might
require the use of a different ATR crystal material, such as germanium, as silicon absorbs
infrared around the 1000 cm '1 region. Carrying out the experiments using the other silanes
as well would ensure that the differences between their behaviours could be determined.
The hydrolysis in situ was observed indirectly by the effect it had upon the diffusion
characteristics o f Y9669. The use of an alternate ATR crystal material would also allow
the infrared spectroscopic determination of hydrolysis kinetics, and the factors which affect
them, inside a PVC laminate.
The analysis of the diffusion mechanism is incomplete. Although the data fitted
well to the dual sorption model, it was not checked whether the data fitted to the Fickian
Case II diffusion model, or other diffusion models. This should be investigated.
257

References
1 Banga, R., PhD. thesis, Sheffield Hallam University ( 1995 )
2 Hoh, K.-P., Ishida, H. and Koenig, J. L., Polymer Composites Vol. 9, No. 2 ( 1988 )
3 Ishida, H., Chiang, C.-H. and Koenig, J. L., Polymer Vol. 23, p. 251 ( 1982 )
4 Shih, P. T. K. and Koenig, J. L., Materials Science and Engineering Vol. 20, p. 137
( 1975 )
5 Plueddemann, E. P., in Chemically Modified Surfaces, Ed. by Leyden, D. E.,
Gordon and Breach ( 1986 )
6 Plueddemann, E. P., Silane Coupling Agents, 2nd. edition, Plenum Press, New York
( 1990)
258

Conferences Attended
1. The 3rd Martin and Willis Prize Meeting, Glaxo, Ware, 16th October 1996, and
the Infrared and Raman Discussion Group (IRDG) Meeting, Glaxo, Stevenage,
17th October 1996. Poster presented : ‘ATR-FTIR study of the diffusion of
organosilanes in PVC films’.
2. The 3rd. MAG AWARD for Young Microspectroscopists, Perkin Elmer, Seer
Green, 30th April 1997. Talk presented : ‘Study of the Diffusion o f Silane
Coupling Agents in PVC films using Raman Confocal Microscopy’.
Prize awarded - The 1997 Microspectroscopy Applications Group ( M A G )
Award for best oral presentation.
3. Polymer Surfaces and Interfaces III, University o f Durham, 14th - 18th July 1997.
Poster presented : ‘Study of the diffusion of Silane Coupling Agents in PVC
films using Raman Confocal Microscopy’.
4. 4. The 4th Martin and Willis Prize Meeting, University of Leeds, 31st.
March 1998, and the 156th Meeting of the IRDG, 1st. April 1998, University of
Leeds. Poster presented : ‘Study of the diffusion of Silane Coupling Agents in
PVC films using Raman Confocal Microscopy’.
Prize awarded - The 1998 Martin and Willis IRDG award for best poster
presentation.
5. The 13th. European Symposium on Polymer Spectroscopy, Lancaster University,
20th - 23rd July 1998. Poster presented : ‘Study of the diffusion o f silane
coupling agents in PVC films using Raman confocal microscopy and ATR-FTIR
spectroscopy’.
259