ATOMIC ABSORPTION SPECTROPHOTOMETRY COOKBOOK Section...
26
ATOMIC ABSORPTION SPECTROPHOTOMETRY COOKBOOK Section 2 Standard Sample Preparation Method Praparation of Calibration Curve and Determination Method Interference in Atomic Absorption Spectrophotometry
Transcript of ATOMIC ABSORPTION SPECTROPHOTOMETRY COOKBOOK Section...

ATOMIC ABSORPTION SPECTROPHOTOMETRY COOKBOOK Section 2
Standard Sample Preparation Method Praparation of Calibration Curve and Determination Method
Interference in Atomic Absorption Spectrophotometry
Atomic Absorption Spectrophotometry Cookbook Section 2
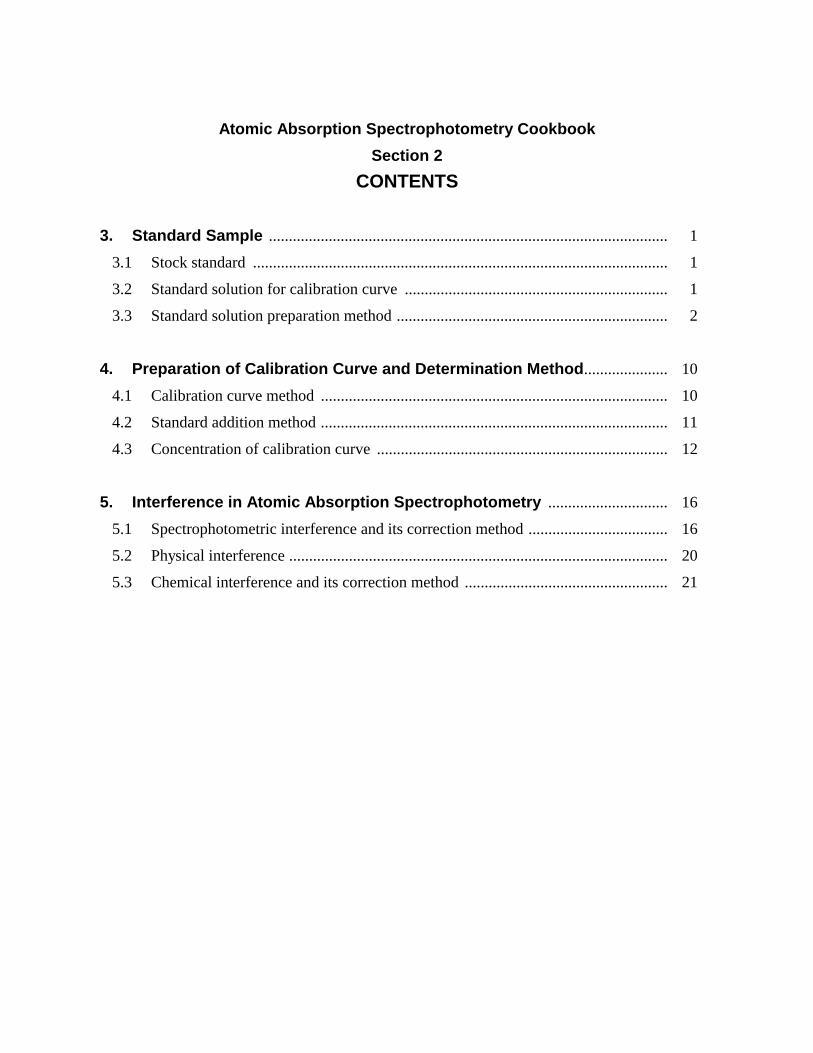
CONTENTS
3. Standard Sample .................................................................................................... 1 3.1 Stock standard ........................................................................................................ 1
3.2 Standard solution for calibration curve .................................................................. 1
3.3 Standard solution preparation method .................................................................... 2
4. Preparation of Calibration Curve and Determination Method..................... 10 4.1 Calibration curve method ....................................................................................... 10
4.2 Standard addition method ....................................................................................... 11
4.3 Concentration of calibration curve ......................................................................... 12
5. Interference in Atomic Absorption Spectrophotometry .............................. 16 5.1 Spectrophotometric interference and its correction method ................................... 16
5.2 Physical interference ............................................................................................... 20
5.3 Chemical interference and its correction method ................................................... 21

- 1 -
3. Standard Sample 3.1 Stock standard
The standard samples used for atomic absorption metals or salts dissolved in acid. When it is
stored for a long period it is precipitated, or absorbed by the container wall due to hydroxide and
carbonate produced, and its concentration changes.
The standard solutions available on the market are supplied in accordance with the standard
solution examination system. It is based on the national standard, and is acid or alkaline.
The guarantee period of one to two years is shown and it must be used within this period.
The stock solution prepared by the standard solution method is a highly concentrated solution
that is acidic or alkaline with a metal concentration of 1mg/ml.
However, one year or longer use is not recommended.
In storing any standard solution, avoid direct sunlight and store it in a cool place.
3.2 Standard solution for calibration curve The standard solution for a calibration curve can be used for analysis after it has been diluted.
For flame atomic absorption, it should be a 1/1000 dilution (ppm). For electro-
thermal(flameless) atomic absorption, it should be a 1/100,000 to a 1/1,000,000 dilution.
When the stock standard is diluted with water only, precipitation and absorption are
susceptible and concentration values drop with many elements. Therefore, the solution of the
same acid or alkali of 0.1M concentration is used to prepare the standard solution for the
calibration curve.
The standard solution for calibration will easily change with long use, and it is recommended
to prepare it fresh for every use.
Fig. 3.1 shows an example of change on standing when the standard solution diluted with
water only is used for Fe measurement.
Fe stock standard has a concentration of 1000 ppm and hydrochloric acid concentration is
0.1M. It was diluted with water to obtain 0.5, 1.0, 1.5 and 2.0 ppm.
Measurement was conducted immediately after the stock standard was prepared, and was
conducted every hour up to five hours. The 0.5 ppm solution showed a concentration drop after
one hour and even the 2.0 ppm solution showed a concentration drop after three hours. After 5
hours, the 0.5 and 1.0 ppm solution showed a concentration drop of almost half the values.

- 2 -
Fig. 3.1 Change on standing of Fe standard sample
3.3 Standard solution preparation method 1. Ag (Silver)
1.0mg Ag/ml Standard material : Silver nitrate (AgNO3)
: 1.575g of silver nitrate dried at 110oC dissolved with nitric acid (0.1N)
and is diluted with nitric acid (0.1N) to 1000ml accurately.
2. Al (Aluminum)
1.0mg Al/ml Standard material : Metal aluminum 99.9% up
: 1,000g of metal aluminum is heated and dissolved with hydrochloric
acid (1+1) 50ml and is diluted with water to 1000ml accurately after it
has cooled. (hydrochloric acid concentration is changed to about 1N.)
Preparation
method of
solution
Preparation
method of
solution
- 3 -
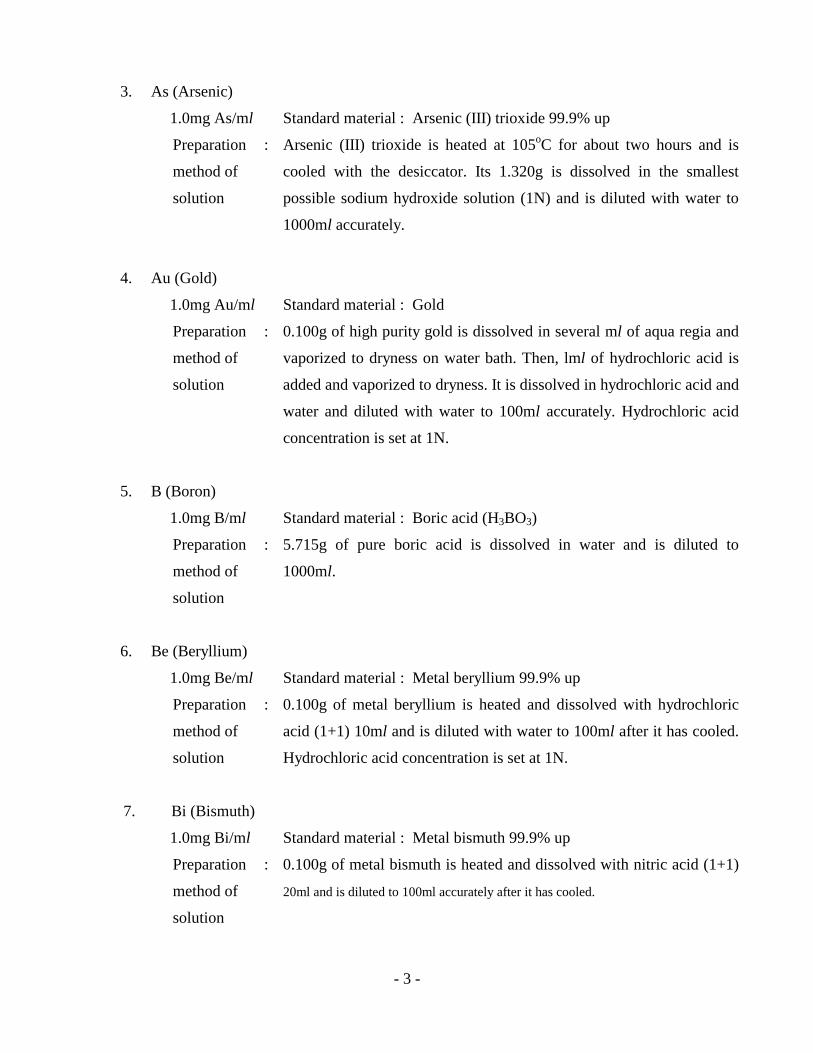
3. As (Arsenic)
1.0mg As/ml Standard material : Arsenic (III) trioxide 99.9% up
: Arsenic (III) trioxide is heated at 105oC for about two hours and is
cooled with the desiccator. Its 1.320g is dissolved in the smallest
possible sodium hydroxide solution (1N) and is diluted with water to
1000ml accurately.
4. Au (Gold)
1.0mg Au/ml Standard material : Gold
: 0.100g of high purity gold is dissolved in several ml of aqua regia and
vaporized to dryness on water bath. Then, lml of hydrochloric acid is
added and vaporized to dryness. It is dissolved in hydrochloric acid and
water and diluted with water to 100ml accurately. Hydrochloric acid
concentration is set at 1N.
5. B (Boron)
1.0mg B/ml Standard material : Boric acid (H3BO3)
: 5.715g of pure boric acid is dissolved in water and is diluted to
1000ml.
6. Be (Beryllium)
1.0mg Be/ml Standard material : Metal beryllium 99.9% up
: 0.100g of metal beryllium is heated and dissolved with hydrochloric
acid (1+1) 10ml and is diluted with water to 100ml after it has cooled.
Hydrochloric acid concentration is set at 1N.
7. Bi (Bismuth)
1.0mg Bi/ml Standard material : Metal bismuth 99.9% up
: 0.100g of metal bismuth is heated and dissolved with nitric acid (1+1)
20ml and is diluted to 100ml accurately after it has cooled.
Preparation
method of
solution
Preparation
method of
solution
Preparation
method of
solution
Preparation
method of
solution
Preparation
method of
solution

- 4 -
8. Ca (Calcium)
1.0mg Ca/ml Standard material : Calcium carbonate (CaCO3)
: 0.2497g of calcium carbonate dried at 110oC for about one hour is
dissolved with hydrochloric acid (1+1) 5ml and is diluted with water to
100ml accurately.
9. Cd (Cadmium)
1.0mg Cd/ml Standard material : Metal cadmium 99.9% up
: 1,000g of metal cadmium is heated and dissolved with nitric acid (1+1)
30 ml and is diluted with water to 1000ml accurately after it has
cooled.
10. Co (Cobalt)
1.0mg Co/ml Standard material : Metal cobalt 9.9% up
: 1.000g of metal cobalt is heated and dissolved with nitric acid (1+1) 30
m and is diluted with water to 1000ml accurately after it has cooled.
11. Cr (Chromium)
1.0mg Cr/ml Standard material : Metal chromium 99.9% up
: 1.000g of metal chromium is heated and dissolved with 20ml of aqua
regia and is diluted with water to 1000ml accurately after it has cooled.
12. Cs (Cesium)
1.0mg Cs/ml Standard material : Cesium chloride (CsCl)
: 1.267g of cesium chloride is dissolved in water and is diluted to
1000ml accurately with water after hydrochloric acid is added.
Preparation
method of
solution
Preparation
method of
solution
Preparation
method of
solution
Preparation
method of
solution
Preparation
method of
solution
- 5 -
13. Cu (Copper)
1.0mg Cu/ml Standard material : Metal copper 99.9% up
: 1.000g of metal copper is heated and dissolved with nitric acid (1+1)
30ml and is diluted to 1000ml accurately with 50ml if nitric acid (1+1)
and water after it has cooled.
14. Fe (Iron)
1.0mg Fe/ml Standard material : Pure iron 99.9% up
: 1.000g of pure iron is heated and dissolved with 20ml of aqua regia
and is diluted to 1000ml accurately after it has cooled.
15. Ge (Germanium)
1.0mg Ge/ml Standard material : Germanium oxide (GeO2)
: 1g of sodium hydroxide and 20ml of water are added to 1.439g of
germanium oxide and heated and dissolved. It is diluted to 1000ml
accurately with water after it has cooled.
16. Hg (Mercury)
1.0mg Hg/ml Standard material : Mercury chloride (HgCl2)
: 1.354g of mercury chloride is dissolved in water and is diluted to
1000ml accurately with water.
17. K (Potassium)
1.0mg K/ml Standard material : Potassium chloride (KCl)
: Potassium chloride is heated at 600oC for about one hour and is cooled
in the desiccator. Its 1.907g is dissolved in water and diluted to 1000ml
accurately with water after hydrochloric acid is added. Hydrochloric
acid concentration is set at 0.1N.
Preparation
method of
solution
Preparation
method of
solution
Preparation
method of
solution
Preparation
method of
solution
Preparation
method of
solution

- 6 -
18. Li (Lithium)
1.0mg Li/ml Standard material : Lithium chloride (LiCl)
: 0.611g of lithium chloride is dissolved in water and diluted with water
to 1000ml accurately after hydrochloric acid is added. Hydrochloric
acid concentration is set at 0.1N.
19. Mg (Magnesium)
1.0mg Mg/ml Standard material : Metal magnesium 99.9% up
: 1.000g of metal magnesium is heated and dissolved with hydrochloric
acid (1+5) 60ml and is diluted with water to 1000ml accurately after it
has cooled.
20. Mn (Manganese)
1.0mg Mn/ml Standard material : Metal manganese 99.9% up
: 1.000g of metal manganese is heated and dissolved with 20ml of aqua
regia and is diluted to 1000ml accurately after it has cooled.
21. Mo (Molybdenum)
1.0mg Mo/ml Standard material : Metal molybdenum 99.9% up
: 1.000g of metal molybdenum is heated and dissolved with
hydrochloric acid (1+1) 30ml and a small quantity of nitric and is
diluted to 1000ml accurately with water after it has cooled.
22. Na (Sodium)
1.0mg Na/ml Standard material : Sodium chloride (NaCl)
: Sodium chloride is heated at 600oC for about one hour and is cooled in
the desiccator. Its 2.542g is dissolved in water and is diluted with water
to 1000ml accurately after hydrochloric acid is added. Hydrochloric
acid concentration is set at 0.1N.
Preparation
method of
solution
Preparation
method of
solution
Preparation
method of
solution
Preparation
method of
solution
Preparation
method of
solution
- 7 -
23. Ni (Nickel)
1.0mg Ni/ml Standard material : Metal nickel 99.9% up
: 1.000g of metal nickel is heated and dissolved with nitric acid (1+1)
30ml and is diluted to 1000ml accurately with water.
24. Pb (Lead)
1.0mg Pb/ml Standard material : Metal lead 99.9% up
: 1.000g of metal lead is heated and dissolved with nitric acid (1+1)
30ml and is diluted with water to 1000ml accurately.
25. Pd (Palladium)
1.0mg Pd/ml Standard material : Metal palladium 99.9% up
: 1.000g of metal palladium is heated and dissolved with 30ml of aqua
regia and is vaporized to dryness on a water bath.
Hydrochloric acid is added and it is vaporized to dryness again.
Hydrochloric acid and water are added to dissolve it.
It is then diluted with water to 1000ml accurately. Hydrochloric acid
concentration is set at 0.1N.
26. Pt (Platinum)
1.0mg Pt/ml Standard material : Platinum 99.9% up
: 0.001g of platinum is heated and dissolved with 20ml of aqua regia
and vaporized to dryness on a water bath.
It is then dissolved with hydrochloric acid and diluted with water to
100 ml accurately. Hydrochloric acid concentration is set at 0.1N.
27. Sb (Antimony)
1.0mg Sb/ml Standard material : Metal antimony 99.9% up
: 0.001g of metal antimony is heated and dissolved with 20ml of aqua
regia and is diluted with hydrochloric acid (1+1) to 100ml after it has
cooled.
Preparation
method of
solution
Preparation
method of
solution
Preparation
method of
solution
Preparation
method of
solution
Preparation
method of
solution

- 8 -
28. Si (Silicon)
1.0mg Si/ml Standard material : Silicon dioxide (SiO2)
: Silicon dioxide is heated at 700 to 800oC for one hour and cooled in
the desiccator. Its 0.214g is put in a crucible and is dissolved by mixing
2.0h of sodium carbonate anhydrous and is diluted with water to 100ml
accurately.
29. Sn (Tin)
1.0mg Sn/ml Standard material : Metal tin 99.9% up
: 0.500g of metal tin is added to 50ml of hydrochloric acid. Then heated
and dissolved at 50 to 80oC. After it has cooled, it is added to 200ml or
hydrochloric acid and diluted with water to 500ml accurately.
30. Sr (Strontium)
1.0mg Sr/ml Standard material : Strontium carbonate (SrCO3)
: 1.685g of strontium carbonate is dissolved with hydrochloric acid.
It is heated to remove carbon dioxide and is diluted to 1000ml
accurately with water after it has cooled.
31. Ti (Titanium)
1.0mg Ti/ml Standard material: Metal titanium 99.9% up
: 0.500g of metal titanium is heated and dissolved with hydrochloric
acid (1+1) 100ml and is diluted with hydrochloric acid (1+2) to 500ml
accurately after it has cooled.
32. Tl (Thallium)
1.0mg Tl/ml Standard material : Metal thallium 99.9% up
: 1.000g of metal thallium is heated and dissolved with nitric acid (1+1)
20ml and is diluted with water to 1000ml accurately after it has cooled.
Preparation
method of
solution
Preparation
method of
solution
Preparation
method of
solution
Preparation
method of
solution
Preparation
method of
solution
- 9 -
33. V (Vanadium)
1.0mg V/ml Standard material : Metal vanadium 99.9% up
: 1.000g of metal vanadium is heated and dissolved with 30ml of aqua
regia and is concentrated to near dryness.
It is added to 20ml of hydrochloric acid and is diluted with water to
1000ml accurately after it has cooled.
34. Zn (Zinc)
1.0mg Zn/ml Standard material : Metal zinc 99.9% up
: 1.000g of metal zinc is heated and dissolved with nitric acid (1+1)
30ml and is diluted with water to 1000ml accurately after it has cooled.
Preparation
method of
solution
Preparation
method of
solution

- 10 -
4. Preparation of calibration curve and determination method Atomic absorption spectrometry determines the sample by using the fact that sample
concentrations are proportional to light absorbances in the atomization stage. (1) Calibration curve
method and (2) Standard addition method are available as the determination method.
The calibration curve in atomic absorption spectrometry generally shows good linearity in the low
concentration area, but is curved by various causes in the high concentration area to cause errors.
Therefore, it is recommended to use the good linearity concentration area.
4.1 Calibration curve method Several sample solutions of known concentration (Three or more solutions of different
concentrations) are measured in advance and the calibration curve of concentration versus
absorption is prepared as shown in Fig. 4.1 (1) and absorbance of unknown samples is measured
to obtain the concentration of the target element from the calibration curve. If there is a difference
in composition between the standard sample and unknown sample solution, an error may be given
in the measured value. Therefore, it is recommended that the compositions of the standard sample
and the unknown sample solution are similar. Concentration of the standard sample solution is
prepared so that the concentration of the unknown sample solution is an inserted value.
(1) Calibration curve method (2) Standard addition method
Fig. 4.1 Calibration curve

- 11 -
4.2 Standard addition method Several unknown sample solutions (four or more) of a like quantity, and standard sample
solutions of known different concentrations are added. Absorbances of these series of samples are measured. The calibration curve of absorbance versus standard sample solution concentration is prepared as shown in Fig. 4.1 (2). It is extrapolated and the length of the axis of the abscissas from the point inter secting with the axis of the abscissas (concentration axis) to the added concentration 0 is considered as concentration of the unknown sample.
Fig. 4.2 shows a preparation example of the sample solution in the standard addition method. Four 100ml measuring flasks are prepared and 10ml of the unknown sample of Mg concentration of 100 x ppm is put in each of the above flasks. 0, 10, 20 and 30ml of Mg standard solution of concentration 1.0ppm are put in each of the above flasks.
Then, solvent is added so that the total quantity is 100ml. Samples of Mg concentration x, x+0.1, x+0.2, x+0.3 ppm are now available. They are
measured and the calibration curve is prepared as shown in Fig. 4.2 (2) to obtain Mg concentration of x ppm. If this value is multiplied ten times, Mg concentration in the unknown sample can be obtained.
Fig. 4.2 Example preparation of standard solution in standard addition method
The advantage of this method is that it decrease analysis errors caused by various interferences
based on differences in composition. Because the composition of the calibration curve is close to that of the sample, the calibration curve shows good linearity even in the low concentration area and passes the zero point. Otherwise, an error occurs.
- 12 -
4.3 Concentration of calibration curve The range where the calibration curve shows linearity in atomic absorption spectrometry is
generally said to be up to absorbance 0.5 and it is desirable to set the calibration curve at
absorption 0.3 or less with some margin given. In the meantime, absorbance sensitivity is shown
by 1% absorption value (0.0044 Abs.) or detection limit value in the atomic absorption
spectrometry. 1% absorption value is the concentration of the sample which gives absorbance
0.0044 and the detection limit value is the concentration of the sample which gives a signal
having amplitude twice as much as the noise width.
Because 1% absorbance sensitivity corresponds to 0.004 Abs. when the concentration of the
calibration curve is set, the sample concentration with its lower limit of the calibration line being
ten-fold concentration of 1% absorption value and with its upper limit being 70 to 80-fold
concentration and showing 0.004 to 0.3 absorbance is considered as the optimum concentration
range of the calibration curve. If Cd is taken as an example, the concentration range of the
calibration curve is 0.12 to 0.96 ppm, because 1% absorption value in flame atomic absorption
method is 0.012 ppm as shown in Table 4.1.
When the concentration range of the calibration curve is determined from the detection limit
value, the concentration range of the calibration curve is about 1000-fold the detection limit
value, because the detection limit value is 1/10 to 1/20 of 1% absorption value.
When the concentration of the unknown sample is below the concentration range of the
calibration curve set by this method, the concentration for determination is to 1% absorption
value in flame atomic absorption method It is five times that of the 1% absorption value in the
electrothermal atomic absorption method, although accuracy becomes slightly deteriorated.
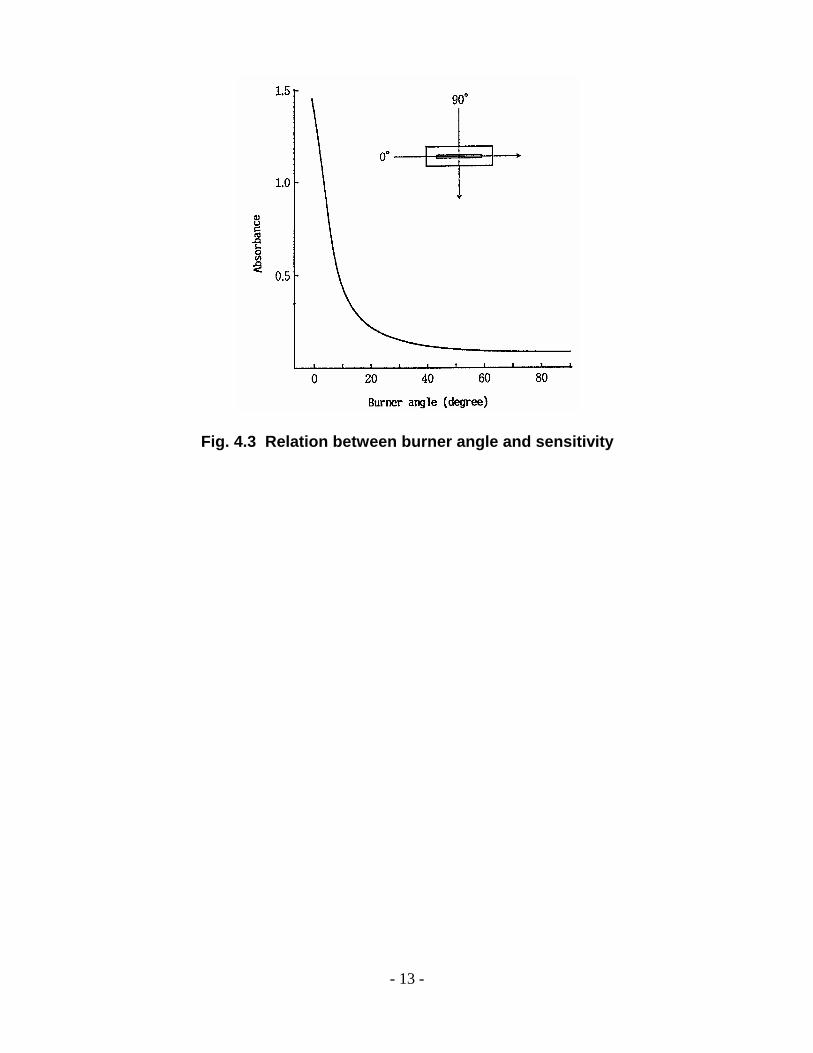
When the concentration of the unknown sample is above the set concentration range, the burner
angle is adjusted to lower sensitivity in the flame atomic absorption method. Fig. 4.3 shows the
relation between the burner angle and sensitivity. If the burner angle is tilted by 90o, the
sensitivity drops to 1/20 and determination can be made to 20-fold the concentration of X the
standard condition.
- 13 -
Fig. 4.3 Relation between burner angle and sensitivity

- 14 -
Table 4.1 1% absorption value in the flame and electrothermal atomic absorption methods
Flame atomic absorption Electro-thermal atomic absorption Ele-ment
Analysis line wavelength (nm) Gas type
1% absorption concentration (ppm)
1% absorption concentration
(ppb) Low
1% absorption concentration
(ppb) High
Ag Al As Au B Ba Be Bi
Ca(1) Ca(2)
Cd Co Cr Cs Cu Dy Er Eu Fe Ga Gd Ge Hf Hg Ho Ir K La Li Lu Mg Mn Mo Na Nb Ni Os
Pb(1) Pb(2)
328.1 309.3 193.7 242.8 249.7 553.5 234.9 223.1 422.7 422.7 228.8 240.7 357.9 852.1 324.7 421.2 400.8 459.4 248.3 287.4 368.4 265.1 307.3 253.7 410.4 208.8 766.5 550.1 670.8 360.0 285.2 279.5 313.3 589.0 334.9 232.0 290.9 217.0 283.3
Air-C2H2 N2O-C2H2
Ar-H2
Air-C2H2
N2O-C2H2
N2O-C2H2
N2O-C2H2
Air-C2H2
Air-C2H2
N2O-C2H2
Air-C2H2
Air-C2H2
Air-C2H2
Air-C2H2
Air-C2H2
N2O-C2H2
N2O-C2H2
N2O-C2H2
Air-C2H2
Air-C2H2
N2O-C2H2
N2O-C2H2
N2O-C2H2
N2O-C2H2
Air-C2H2
Air-C2H2
N2O-C2H2
Air-C2H2
N2O-C2H2
Air-C2H2
Air-C2H2
N2O-C2H2
Air-C2H2
N2O-C2H2
Air-C2H2
N2O-C2H2
Air-C2H2
Air-C2H2
0.04 0.63 0.4 0.2 12 0.25 0.025 0.25 0.06 0.02 0.012 0.06 0.08 0.03 0.04 1.0 0.8 0.5 0.08 1.3 30 1.7 16 0.14 1.2 1.4 0.012 70 0.03 12 0.0035 0.028 0.5 0.005 30 0.08 1.5 0.1 0.25
0.5 1.0 0.48 0.55 0.06 0.02 0.28 0.10 0.20 0.19 0.03 0.02 0.15 0.02 0.40 0.29
0.14 0.22 0.005 0.07 0.05 0.05 0.12 0.02 0.5 0.004 0.16 0.13

- 15 -
Flame atomic absorption Electro-thermal atomic absorptionEle-ment
Analysis line wavelength (nm) Gas type
1% absorption concentration (ppm)
1% absorption concentration
(ppb) Low
1% absorption concentration
(ppb) High
Pd Pr Pt Rb Re Ru Sb Sc Se Si Sm
Sn(1) Sn(2) Sn(3) Sn(4)
Sr Ta Tb Te Ti Tl V W Y
Yb Zn Zr
As(H) Bi(H) Sb(H) Se(H) Sn(H) Te(H)
247.6 495.1 265.9 780.0 346.0 349.9 217.6 391.2 196.0 251.6 429.7 224.6 286.3 224.6 286.3 460.7 271.5 432.6 214.3 364.3 276.8 318.4 255.1 410.2 398.8 213.9 360.1 193.7 223.1 217.6 196.0 286.3 214.3
Air-C2H2 N2O-C2H2 Air-C2H2
Air-C2H2
N2O-C2H2 Air-C2H2
Air-C2H2
N2O-C2H2 Ar-H2
N2O-C2H2
N2O-C2H2
Air-C2H2
Air-C2H2
N2O-C2H2
N2O-C2H2
Air-C2H2
N2O-C2H2
N2O-C2H2
Air-C2H2
N2O-C2H2 Air-C2H2
N2O-C2H2
N2O-C2H2
N2O-C2H2
N2O-C2H2
Air-C2H2
N2O-C2H2
Air-C2H2
Air-C2H2
Air-C2H2
Air-C2H2
Air-C2H2
Air-C2H2
0.09 30 1.3 0.06 12 0.6 0.33 0.5 0.5 1.3 15 2.0 5.0 0.8 2.0 0.06 15 12 0.3 1.8 0.3 1.0 8.0 3.0 0.1 0.011 15 0.06 0.12 0.25
0.35 1.6 0.7 5.5 2.1 2.1 1.3 0.03
0.25 0.28 0.57 2.0

- 16 -
5. Interference in atomic absorption spectrophotometry Interferences in atomic absorption spectrometry are generally classified into spectrophotometric
interferences, physical interferences, and chemical interferences.
Spectrophotometric interference is based on equipment and flame properties. It occurs when the
spectral line used for analysis cannot be separated completely from other nearby lines, or when the
spectral line used for analysis is absorbed by substances other than the atomic vapor of the target
element produced in the flame. Physical interference occurs due to an error in the supply of the
sample into the flame by influences of physical condition such as viscosity of the sample solution
and/or surface tension.
Chemical interference is peculiar to the sample and the element It occurs when atoms are ionized
in the flame, or when atoms act on coexistent substances to produce hard-to-dissociate (break)
compounds. The number of atoms in ground state, which contribute to absorption, decreases.
5.1 Spectrophotometric interference and its correction method Spectrophotometric interference is caused by an atomic beam or molecular absorption.
Interference by an atomic beam is caused when the spectral line used for measurement and other
nearby spectral lines overlap each other.
Interference is shown if the other elements spectrum component is included when the target
element is measured like Eu3247 (530A) for Cu3247 (540A) or V2506 (905A) for Si2506
(899A). Interference of this type is not general and can be avoided by selecting the analysis line
showing no interference. Obstruction of Fe2138 (589A) from Zn2138 (56A) appears in the case
of determination, where Fe coexists in a large quantity like Zn in steel. A wrong analysis value is
obtained if spectral interference is neglected.
Interference by molecular absorbance is light absorption and scattering by molecules which are
not atomized.
Light scattering occurs when fine solid particles pass the light beam. The most typical example
of this phenomenon is seen when the sample is heated and smoke is emitted in the electro-thermal
atomic absorption. Scattering peak by this smoke increases as wavelength decreases. It often
becomes an issue in measurement of the element with wavelength of 250 mm or less. The heating
condition is adjusted, in the electro-thermal atomic absorption, to expel such smoke in the ashing
stage and prevent the smoke in the atomizing stage.
Separation of the scattering peak and the atomic absorption peak becomes imperfect, and an
error is given in measurement, when smoke generating temperature is close to the atomizing

- 17 -
temperature of the target element. Molecular absorption occurs when NaCl or other salts in the
sample evaporate in the molecular form. Absorption of salt molecules occur in the wide
wavelength range of the ultraviolet region. (Refer to Fig. 5.1)
Fig. 5.1 Molecular absorption by sodium compound
In measurement of the element having the analysis line in the wavelength range shown in Fig.
5.1, the sum of atomic absorption and molecular absorption is measured to give a big plus error.
Such molecular absorption becomes an issue in respect to the percent salt concentration in the
flame analysis, and becomes an issue in respect to several hundred ppm salt concentrations.
The molecular absorbance is called the background absorbance, and the sum of atomic
absorbance and background absorbance is measured by light from the hollow cathode lamp
source. If background absorption can only be measured by some means, atomic absorption can
only be obtained by doing subtraction of both measured values.
Background absorption can be corrected by the following methods.
Method by using nearby line
At the wavelength slightly shifted from the analysis line of the target element, background
absorption occurs, and atomic absorption does not. Therefore, if another hollow cathode lamp,

- 18 -
which gives a nearby spectral line within ±5nm from the wavelength of the target element,
only background absorption can be measured. This is the method using the nearby line.
A hollow cathode lamp which gives strong light is not always obtained within ±5nm. Even
if it is obtained, there is the limitation that atomic absorption cannot occur at the wavelength.
Such being the case, it cannot be an accurate background correction method. The method using
a continuous light source, as described below, is used as the standard background correction
method. Because it has no such limitation, a highly accurate correction can be made.
Method using a continuous light source
If a light source, such as a deuterium lamp, is continuously giving off light in the
wavelength range of 190 to 430 nm, an accurate background correction can be made.
When the wavelength of the spectroscope is set at the wavelength of the target element, the
wide wavelength band can be observed in the light of the deuterium lamp.
As mentioned before, molecular absorption occurs in a wide wavelength range, and
absorption occurs within this region. Also an apparent decrease in the light intensity is
observed. The target atom absorbs the light in the center of the wavelength only, and no
absorption at a distance of 1/100 angstrom or more. Due to the intensity of the deuterium
lamp, the greater part of the light observed is not absorbed.
The above shows that only molecular absorption (background absorption) can be measured
if the deuterium lamp is used. Thus, atomic absorption can only be measured if subtraction is
done from the absorption of the hollow cathode lamp (sum of atomic absorption and
background absorption).
Method by self reversal
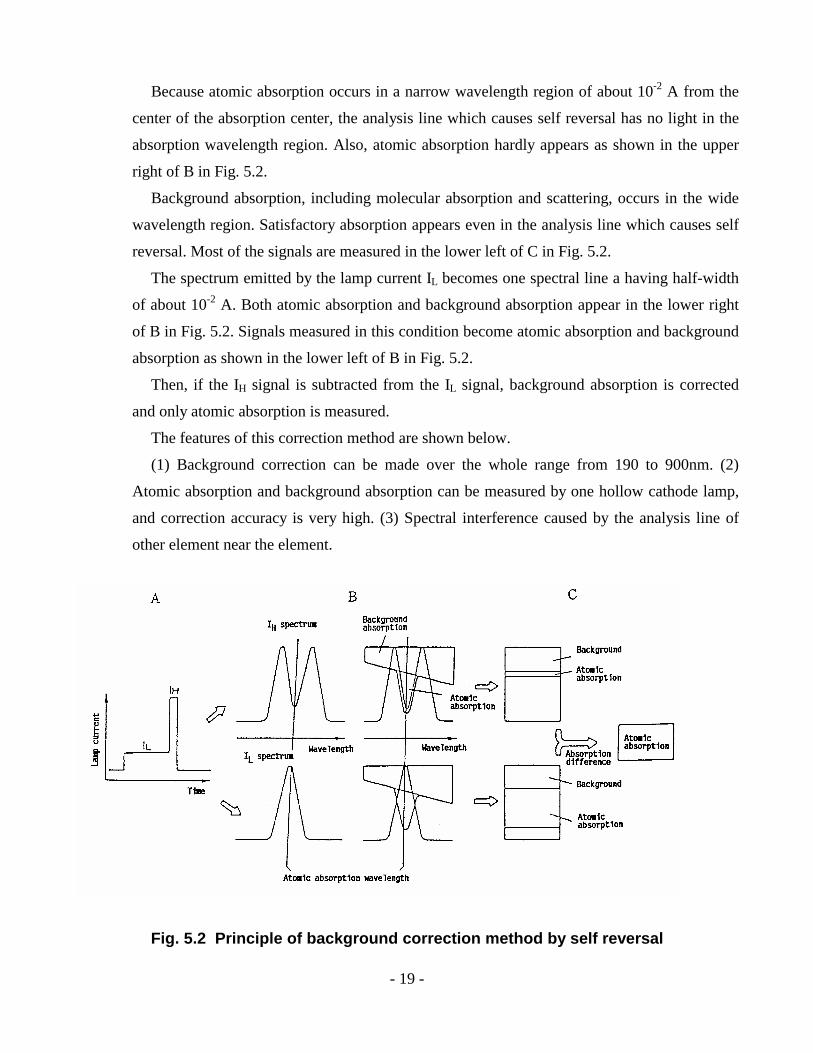
Background correction by self reversal method uses a hollow cathode lamp for self reversal
(200-38456-XX) and lights the lamp by supplying high current combined with low current.
A in Fig. 5.2 shows lamp current waveform and high current IH is set at 300 to 600mA and
low current IL at 60mA or less. It lights the lamp at a frequency of 100 Hz.
The spectrum emitted by the lamp current IH becomes two peaks (self reverse) with the
depressed center as shown in the upper left of B in Fig. 5.2. This is due to internal absorption
by a great deal of atomic clouds scattered from the hollow cathode lamp, as the half-width
spreads.
- 19 -
Because atomic absorption occurs in a narrow wavelength region of about 10-2 A from the
center of the absorption center, the analysis line which causes self reversal has no light in the
absorption wavelength region. Also, atomic absorption hardly appears as shown in the upper
right of B in Fig. 5.2.
Background absorption, including molecular absorption and scattering, occurs in the wide
wavelength region. Satisfactory absorption appears even in the analysis line which causes self
reversal. Most of the signals are measured in the lower left of C in Fig. 5.2.
The spectrum emitted by the lamp current IL becomes one spectral line a having half-width
of about 10-2 A. Both atomic absorption and background absorption appear in the lower right
of B in Fig. 5.2. Signals measured in this condition become atomic absorption and background
absorption as shown in the lower left of B in Fig. 5.2.
Then, if the IH signal is subtracted from the IL signal, background absorption is corrected
and only atomic absorption is measured.
The features of this correction method are shown below.
(1) Background correction can be made over the whole range from 190 to 900nm. (2)
Atomic absorption and background absorption can be measured by one hollow cathode lamp,
and correction accuracy is very high. (3) Spectral interference caused by the analysis line of
other element near the element.
Fig. 5.2 Principle of background correction method by self reversal

- 20 -
5.2 Physical interference An error occurs in the analysis value because physical properties of the sample solution
including viscosity and surface tension, differ between that of the standard sample, and between
samples. The difference in physical properties affects mist amount, the mist generating rate, and
the mist particle size in flame atomic absorption.
The organic solvent effect uses the above phenomenon.
When the metal to be measured is dissolved in 4-methyl-2-pentanone, acetic acid-n-butyl, or
other organic solvents, sensitivity raises two to three times that of its water solution.
In electro-thermal atomic absorption, differences in physical properties causes differences in
sample diffusion or filtering in the graphite tube. When viscosity is high, some of the sample
remains in the pipette or capillary resulting in analysis error.
The standard sample having the same composition as the sample is used for the correction.
There are ways to extract and separate the target element, but the easiest method is to measure by
the standard addition method.
- 21 -
5.3 Chemical interference and its correction method The sample introduced into the flame becomes free atoms by the heat, but part of them may be
ionized.
Because atomic absorption measures the quantity of free atoms, when ionization occurs (a
negative interference) it causes a decrease in the absorbance. This is called ionization
interference. The degree of ionization generally increases as the flame temperature increases, and
the number of ionized metals increases. Ca, Sr, Ba, Rb, Li, Na, K, Cs and other metals which
have 6.1eV or lower ionization potential, ionize at the air-acetylene flame temperature.
To check this interference, Cs, Rb and K, which are easy-to-ionize metals, are added to the
sample and standard sample until its effect comes to a certain level.
Some of the sample introduced in the flame reacts on other particle types in the flame to
produce a hard-to-dissociate compound or the salt produced in the solution becomes a hard-to-
dissociate compound. A representative example of this is the interference when Mg, Ca or an
alkaline earth metal is measured by the air-acetylene flame and there is interference as shown in
Fig. 5.3 if Al exists. This happens because Mg and Al react in the flame and MgO.Al2O3 is
produced.
example of the latter is the interference of phosphoric acid against Mg, Ca or other alkaline
earth metals. Phosphates in the solution produce hard-to-dissociate compounds in the air-
acetylene flame. It should be noted that interferences by the production of hard-to-dissociate
compounds easily occur if Al, Si, Ti, V, phosphoric acid, sulfuric acid, etc. coexist with the
alkaline earth metal.

- 22 -
Fig. 5.3 The influence of aluminum on magnesium (Practice of atomic absorption spectrometry published by Nankodo)
Because the sample is heated and atomization is done in the limited space of the graphite tube
in the electro-thermal atomic absorption, chemical interference becomes much larger than in the
flame atomic absorption. The interference process becomes complicated, and the reaction is
different from that in the flame atomic absorption, because atomization is conducted in an argon
environment.
To check these interferences, the following are done in the case of flame atomic absorption.
(1) Removal of other elements spectrum, and extraction of target element by ion exchange and
solvent extraction, (2) addition of excessive interference elements, (3) addition of interference
inhibitors, (4) standard addition method, etc. To check interferences against the alkali earth metal
described above, Sr, La, EDTA, or other chelating reagents are added. The use of nitrous oxide-
acetylene flame is effective to check interferences by the production of a hard-to-dissociate
compound, because the degree of interference is lower with the higher flame temperature.
To check interferences in the electro-thermal atomic absorption, the following are done in the
same way as in the case of the flame atomic absorption. (1) Ion exchange and solvent extraction,

- 23 -
(2) matrix accord or other techniques by the standard addition method , (3) matrix modifier is
added.
Addition of the matrix modifier (a) raises absorption sensitivity of the measured element in the
simple water solution, (b) the sensitivity which drops a lot is restored by the existence of
coexistent matter, (c) or improved better than before, and addition concentration is generally at
the several ppm level.
Table 3.1 shows representative combinations of the target element and matrix modifier.
Table 5.1 Application examples of the matrix modifier method (Fundamentals of atomic absorption spectrophotometry, Textbook for Shimadzu course in atomic absorption spectrophotometry)
Target element Matrix modifier Remarks Cd Pd (NO3)2 + NH4NO3
(NH4)2HPO4 + HNO3 Mg (NO3)2 (NH4)H2PO4 + HNO3 or Mg (NO3)2
ppb level OK with blood, serum and urine. Addition of F', SO4, PO4 effective
Pb Mg (NO3)2
La (NO3)3 Pd, Pt ( µg level)
Coexistence with NaCl, KCl, MgCl2, etc. prevents PbCl2 sublimation Effective by alloying HNO3 addition effective, high sensitivity attained by alloying
Hg Sulfide + HNO3 HCl + H2O2 K2Cr2O7 + Na2S Au, Pt, Pd (µg level) Se Organic acid (Succinic acid, tartaric acid)
Volatization prevention as HgS For prevention of reduction vaporization Volatization prevention by amalgamation
Used for soil
T2 Pd, Pt, Ir La (NO3)
Alloying Alloying
Bi Pb MIBK extract Sn Mg (NO3)2, (NH4)2HPO4
La (NO3)3 K2, WO4, K2MO4 NH4NO3, (NH4)2C2O4
Use with ascorbic acid to prevent interference Effective by alloying Sensitivity improves remarkably but chloride interference exists No chloride interference

- 24 -
Target element Matrix modifier Remarks Se Mg (NO3)2
Pd, Pt, Cu, Al, Ni
Coexistence with Ni is effective (NiSe produced) Particularly Pb good, PdSe produced
As Pd best, Mo, Zr, Ba also good La (NO3)3
Corxistence with Ni is effective Production of As2O6 seems to be effective
Sb
Cu best, Ni, Pt also effective La (NO3)3
Alloying Alloying
Tl Pd+HClO4 La (NO3)3
Coexistence with ascorbic acid is effective, Pd checks TlCl production Alloying
In Pd La (NO3)3
Pd checks production of subliming InO Alloying
Ga Ni Ni checks GaO production and avoids inorganic matter interference
Zn Succinic acid, oxalic acid MaCl2 produces ZnCl2 and sublimes. Organic acid check it
P La (NO3)3 Sensitivity improves by 6 times Si, Al, Mn, Cu, Cd, Ba, Be, Cr
La (NO3)3 Effective with alloying