Atmospheric Pressure Calibration to Improve Accuracy of ...
10
Available online at http://docs.lib.purdue.edu/jate Journal of Aviation Technology and Engineering 9:2 (2020) 35–44 Atmospheric Pressure Calibration to Improve Accuracy of Transponder- Based Aircraft Operations Counting Technology John H. Mott, Chuyang Yang, and Darcy M. Bullock Purdue University Abstract In the United States, over 2,400 of the 2,941 non-primary National Plan of Integrated Airport System airports have limited means of establishing operations counts due to lack of available personnel. Precise counts of airport operations are helpful for allocating airport improvement funds, as well as for local and system planning. An emerging technology utilizing ADS-B position data to calibrate signal strength received from Mode C transponders, thereby capturing location information from over 90% of the aircraft operating in the National Airspace System, has successfully estimated operations counts at these non-towered airports with reasonable levels of accuracy. This paper evaluates the impact of further calibration of the model using an atmospheric pressure-based calibration method to improve the accuracy of operations counts. Over 10 million aircraft transponder records collected during 58 days at Purdue University Airport and Terre Haute Regional Airport were analyzed. Uncorrected operations counts and corrected counts using atmospheric pressures averaged both monthly and daily were compared with those obtained from tower-reported figures from the Air Traffic Activity Data System (ATADS) database. The overall accuracy of operations counts from uncorrected heuristics ranged from 5.5% to 13.6% as compared to ATADS over different time periods ranging from 55 to 58 days. Incorporating monthly and daily average pressures improved the count accuracy from 3.2% to 8.7% and from 2.6% to 9.3%, respectively. The test results suggest that the barometric correction method using monthly average pressures results in a modest improvement in overall percentage error and mean average error over the uncorrected method. Keywords: transponder signals, aircraft operations, counting, ADS-B, Mode C, atmospheric pressure Introduction In the United States, the Federal Aviation Administration (FAA) invests over $2.5 billion each year in Airport Improvement Program (AIP) funding at 2,941 small commercial and general aviation airports (FAA, 2018). Accurate operations counts can play an important role in facilitating the equitable allocation of AIP funds to airports in the National Plan of Integrated Airport Systems, as well as establishing a comprehensive picture of the interrelationships between the components of the National Airspace System. Air traffic control personnel record aircraft operations manually at airports with air traffic facilities; however, over 90% of non-primary airports either are uncontrolled or have air traffic facilities with limited hours (Muia & Johnson, 2015). Reasonably accurate operations counts are not easily compiled at such airports. http://dx.doi.org/10.7771/2159-6670.1222
Transcript of Atmospheric Pressure Calibration to Improve Accuracy of ...

Available online at http://docs.lib.purdue.edu/jate
Journal of Aviation Technology and Engineering 9:2 (2020) 35–44
Atmospheric Pressure Calibration to Improve Accuracy of Transponder-Based Aircraft Operations Counting Technology
John H. Mott, Chuyang Yang, and Darcy M. Bullock
Purdue University
Abstract
In the United States, over 2,400 of the 2,941 non-primary National Plan of Integrated Airport System airports have limited means ofestablishing operations counts due to lack of available personnel. Precise counts of airport operations are helpful for allocating airportimprovement funds, as well as for local and system planning. An emerging technology utilizing ADS-B position data to calibrate signalstrength received from Mode C transponders, thereby capturing location information from over 90% of the aircraft operating in the NationalAirspace System, has successfully estimated operations counts at these non-towered airports with reasonable levels of accuracy. This paperevaluates the impact of further calibration of the model using an atmospheric pressure-based calibration method to improve the accuracy ofoperations counts. Over 10 million aircraft transponder records collected during 58 days at Purdue University Airport and Terre HauteRegional Airport were analyzed. Uncorrected operations counts and corrected counts using atmospheric pressures averaged both monthlyand daily were compared with those obtained from tower-reported figures from the Air Traffic Activity Data System (ATADS) database. Theoverall accuracy of operations counts from uncorrected heuristics ranged from 5.5% to 13.6% as compared to ATADS over different timeperiods ranging from 55 to 58 days. Incorporating monthly and daily average pressures improved the count accuracy from 3.2% to 8.7% andfrom 2.6% to 9.3%, respectively. The test results suggest that the barometric correction method using monthly average pressures results in amodest improvement in overall percentage error and mean average error over the uncorrected method.
Keywords: transponder signals, aircraft operations, counting, ADS-B, Mode C, atmospheric pressure
Introduction
In the United States, the Federal Aviation Administration (FAA) invests over $2.5 billion each year in AirportImprovement Program (AIP) funding at 2,941 small commercial and general aviation airports (FAA, 2018). Accurateoperations counts can play an important role in facilitating the equitable allocation of AIP funds to airports in the NationalPlan of Integrated Airport Systems, as well as establishing a comprehensive picture of the interrelationships between thecomponents of the National Airspace System. Air traffic control personnel record aircraft operations manually at airportswith air traffic facilities; however, over 90% of non-primary airports either are uncontrolled or have air traffic facilities withlimited hours (Muia & Johnson, 2015). Reasonably accurate operations counts are not easily compiled at such airports.
http://dx.doi.org/10.7771/2159-6670.1222

Muia and Johnson (2015) summarized the accuracy andcosts of deployment and maintenance of several existingcounting methods and technologies; these include the multi-plication of the number of based aircraft by an estimate ofoperations per aircraft, utilization of a ratio of instrumentflight plans to total operations, and utilization of technologysuch as acoustic counting devices, trail cameras, and videoimage detectors. However, these existing counting methodshave been employed with a limited degree of success (Yanget al., 2019) and are not easily scaled for large-scale dep-loyment at non-towered airports.
Mott et al. (2017) devised a means of using aircrafttransponder signals (Mode C, Mode S short squitter, andMode S extended squitter) to establish aircraft operationscounts. Mott et al. (2016) developed algorithms for Mode Ctransponder signals that produce estimates of improvedaccuracy with larger sample sizes at lower costs. Opera-tions counts from this technology resulted in error ratesover 30 to 179 days of data collection ranging from 24.9%to 21.4% as compared with recorded operations totalsfrom the FAA Air Traffic Activity Data System (ATADS)database (Yang et al., 2019). That work was based upon anassumption of static pressure-based altitude reporting.However, normal changes in local weather conditionsintroduce variations in atmospheric pressure at airports.
Objective
This research was conducted in order to develop andvalidate an atmospheric pressure-based calibration methodto improve the accuracy of aircraft operations counts atnon-towered airports over monthly and longer data collec-tion periods.
Count Registration Process
Altitude information is available from the majority ofreceived transponder data records (Table 1) (Yang et al.,2019). Because transponder records from aircraft broad-casting either Mode C or Mode S short squitter messagescontain no position or heading information, the distances ofthose aircraft from a ground-based receiver must be esti-mated from the received transponder signal strength (Mott,
2018b). The information containing barometric pressure isused to convert altitude data from Mode S short squitterrecords, reported relative to a standard datum of 29.92inches, to above ground level (AGL) altitudes in order tocompare them with traffic pattern altitudes (TPAs) (Mott &Bullock, 2018). The altitude information from the Mode Caircraft can be decoded from squawk octal codes fromsignal records (Table 2) (International Civil Aviation Orga-nization [ICAO], 2014).
Transponder messages that are consecutive and broad-cast from aircraft with altitudes below that of the airporttraffic pattern and decreasing distances imply that a landingoperation is being conducted, while those showing increas-ing altitudes and distances suggest that a takeoff operation isin progress (Yang et al., 2019).
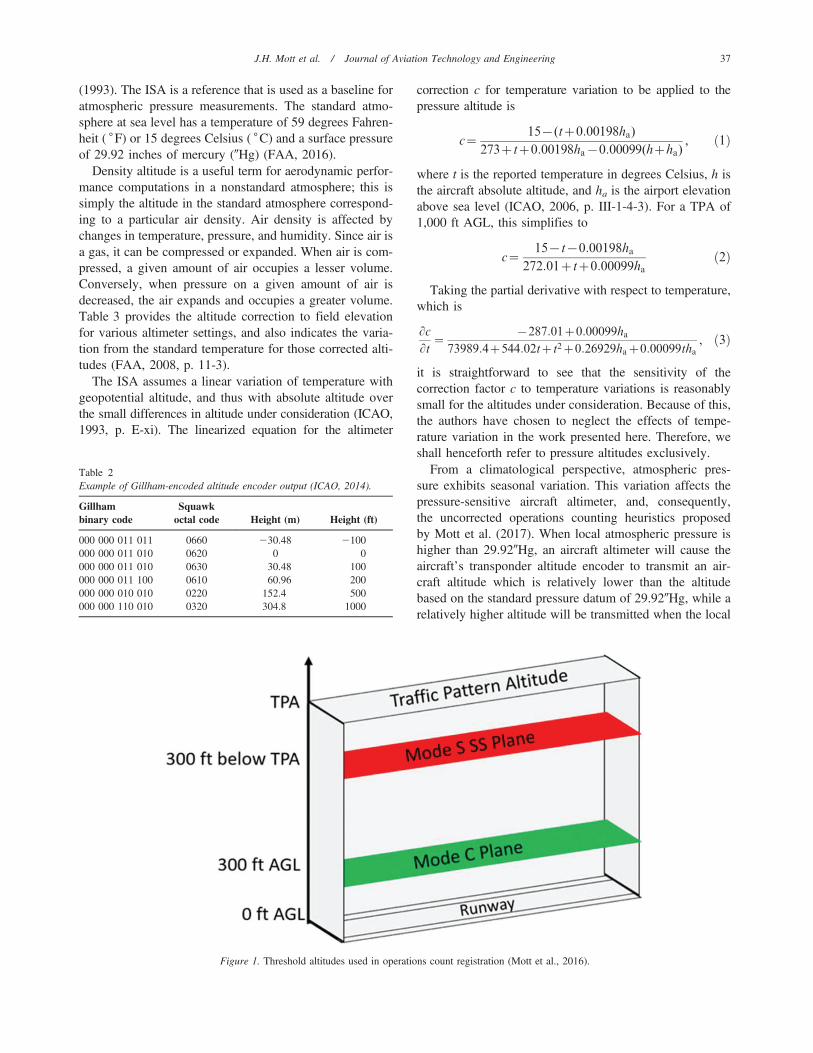
Based on known geographic coordinate informationfrom extended Mode S, Mott and Bullock (2018) createdbounding cuboids for runways for which operations are tobe registered (Figure 1). The coordinates of aircraft trans-mitting extended Mode S signals are examined regularly todetermine whether those aircraft are operating within thethree-dimensional runway cuboid. If the reported altitude ofthe aircraft is less than that of the airport’s TPA, the air-craft’s latitude and longitude position is within the horizontalplane of the bounding box, and the aircraft’s heading iswithin 35˚ of the heading of the runway in question, theassumption is made that an operation is occurring. When aninitial operation associated with a unique aircraft identifier isregistered, no additional transponder records from that air-craft are used to register operations until the aircraft hasdeparted the bounding cuboid and climbed above the thresh-old altitude for a prescribed period (Mott & Bullock, 2018).
Atmospheric Pressure-Based Calibration Method
Atmosphere pressure is a fundamental property related toaerodynamics, and measurements thereof utilizing variousinstruments provide important information to pilots. Thepressure altimeter is considered a primary flight instrument.Atmospheric pressure varies with altitude and temperature.The International Organization for Standardization (1975)created a model denoted as the International StandardAtmosphere (ISA), which was extended by the ICAO
Table 1Secondary surveillance equipment characteristics.
Data set field Mode C Mode S SS (basic Mode S) Mode S ES (extended Mode S)
Timestamp Yes Yes YesICAO Hex ID No Yes YesAltitude Yes Yes YesHeading No No YesAir/ground No No YesLatitude No No DF 17 onlyLongitude No No DF 17 onlySignal strength (8 values) Yes Yes Yes
36 J.H. Mott et al. / Journal of Aviation Technology and Engineering
(1993). The ISA is a reference that is used as a baseline foratmospheric pressure measurements. The standard atmo-sphere at sea level has a temperature of 59 degrees Fahren-heit ( ˚F) or 15 degrees Celsius ( ˚C) and a surface pressureof 29.92 inches of mercury (0Hg) (FAA, 2016).
Density altitude is a useful term for aerodynamic perfor-mance computations in a nonstandard atmosphere; this issimply the altitude in the standard atmosphere correspond-ing to a particular air density. Air density is affected bychanges in temperature, pressure, and humidity. Since air isa gas, it can be compressed or expanded. When air is com-pressed, a given amount of air occupies a lesser volume.Conversely, when pressure on a given amount of air isdecreased, the air expands and occupies a greater volume.Table 3 provides the altitude correction to field elevationfor various altimeter settings, and also indicates the varia-tion from the standard temperature for those corrected alti-tudes (FAA, 2008, p. 11-3).
The ISA assumes a linear variation of temperature withgeopotential altitude, and thus with absolute altitude overthe small differences in altitude under consideration (ICAO,1993, p. E-xi). The linearized equation for the altimeter
correction c for temperature variation to be applied to thepressure altitude is
c~15{(tz0:00198ha)
273ztz0:00198ha{0:00099(hzha), ð1Þ
where t is the reported temperature in degrees Celsius, h isthe aircraft absolute altitude, and ha is the airport elevationabove sea level (ICAO, 2006, p. III-1-4-3). For a TPA of1,000 ft AGL, this simplifies to
c~15{t{0:00198ha
272:01ztz0:00099hað2Þ
Taking the partial derivative with respect to temperature,which is
Lc
Lt~
{287:01z0:00099ha
73989:4z544:02tzt2z0:26929haz0:00099tha, ð3Þ
it is straightforward to see that the sensitivity of thecorrection factor c to temperature variations is reasonablysmall for the altitudes under consideration. Because of this,the authors have chosen to neglect the effects of tempe-rature variation in the work presented here. Therefore, weshall henceforth refer to pressure altitudes exclusively.
From a climatological perspective, atmospheric pres-sure exhibits seasonal variation. This variation affects thepressure-sensitive aircraft altimeter, and, consequently,the uncorrected operations counting heuristics proposedby Mott et al. (2017). When local atmospheric pressure ishigher than 29.920Hg, an aircraft altimeter will cause theaircraft’s transponder altitude encoder to transmit an air-craft altitude which is relatively lower than the altitudebased on the standard pressure datum of 29.920Hg, while arelatively higher altitude will be transmitted when the local
Table 2Example of Gillham-encoded altitude encoder output (ICAO, 2014).
Gillhambinary code
Squawkoctal code Height (m) Height (ft)
000 000 011 011 0660 230.48 2100000 000 011 010 0620 0 0000 000 011 010 0630 30.48 100000 000 011 100 0610 60.96 200000 000 010 010 0220 152.4 500000 000 110 010 0320 304.8 1000
Figure 1. Threshold altitudes used in operations count registration (Mott et al., 2016).
J.H. Mott et al. / Journal of Aviation Technology and Engineering 37
atmospheric pressure is below 29.920Hg. If the correspond-ing threshold altitude used in the decision heuristics is notadjusted for atmospheric pressure variations, the incorrectlyregistered aircraft altitudes may result in overcounting orundercounting of operations. Hence, two calibration modelswere developed to mitigate the effects of pressure variationsupon the related operations counts (Figure 2). Two modelswere evaluated for correcting the traffic pattern altitude inthe decision heuristics:
N the monthly average pressure at a particular airportand
N a daily average pressure.
A simple linear regression analysis between altimetersetting and altitude correction was developed for both modelsusing the range of data in Table 3. The corresponding regres-sion equation, with a 95% level of confidence, is
Y~{921:778xz27580:9, ð4Þ
where Y is altitude correction (ft) and x is altimeter set-ting (0Hg). This equation provides an adjusted R2 > 0.999in both cases.
The pressure corrections computed by this means arethus applied to the thresholds used in determining whetherthe aircraft in question is engaged in an operation. From apractical standpoint, raising the threshold tends to increasethe registered number of operations counts, due primarilyto the increase in airspace volume over which boundarytransitions are detected. Similarly, lowering the thresholdtends to reduce the counts. Mott (2018a) provides a morecomplete discussion of the overall process of registeringoperations counts using this decision heuristic approach.
Experimental Data Collection and Analysis
To validate the proposed methodology, the authors exa-mined data collected from a set of Blueavion f1 devices,manufactured by Bluemac Transportation Data Systems(Yang et al., 2019). This system utilizes a signal processingalgorithm that is self-calibrating and provides substantialflexibility with regard to location relative to the airport(Mott et al., 2016). The devices collected data at the PurdueUniversity Airport (KLAF) and the Terre Haute RegionalAirport (KHUF) over 55 days and 58 days, respectively(see Figure 3). KLAF and KHUF are both FAA toweredairports that have official logs of airport operations.
At KLAF, a Blueavion device with an indoor antennawas installed just inside an office window facing southweston December 1, 2017. The same device was deployed inthe terminal building at KHUF on April 28, 2018 (Yanget al., 2019).
According to Mott’s operations registration heuristics(Mott, 2018b), the TPA should be located approximately1,000 ft AGL. Because the mean sea level elevations ofKLAF and KHUF are 605 and 589 ft, respectively, the
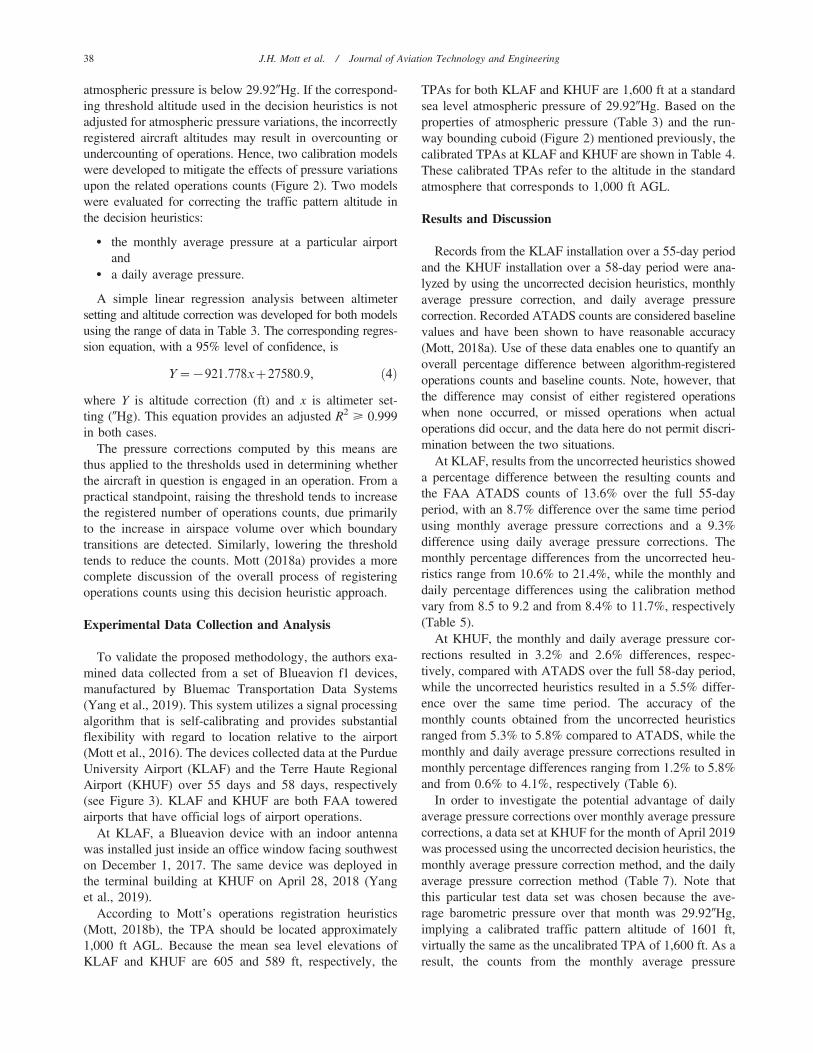
TPAs for both KLAF and KHUF are 1,600 ft at a standardsea level atmospheric pressure of 29.920Hg. Based on theproperties of atmospheric pressure (Table 3) and the run-way bounding cuboid (Figure 2) mentioned previously, thecalibrated TPAs at KLAF and KHUF are shown in Table 4.These calibrated TPAs refer to the altitude in the standardatmosphere that corresponds to 1,000 ft AGL.
Results and Discussion
Records from the KLAF installation over a 55-day periodand the KHUF installation over a 58-day period were ana-lyzed by using the uncorrected decision heuristics, monthlyaverage pressure correction, and daily average pressurecorrection. Recorded ATADS counts are considered baselinevalues and have been shown to have reasonable accuracy(Mott, 2018a). Use of these data enables one to quantify anoverall percentage difference between algorithm-registeredoperations counts and baseline counts. Note, however, thatthe difference may consist of either registered operationswhen none occurred, or missed operations when actualoperations did occur, and the data here do not permit discri-mination between the two situations.
At KLAF, results from the uncorrected heuristics showeda percentage difference between the resulting counts andthe FAA ATADS counts of 13.6% over the full 55-dayperiod, with an 8.7% difference over the same time periodusing monthly average pressure corrections and a 9.3%difference using daily average pressure corrections. Themonthly percentage differences from the uncorrected heu-ristics range from 10.6% to 21.4%, while the monthly anddaily percentage differences using the calibration methodvary from 8.5 to 9.2 and from 8.4% to 11.7%, respectively(Table 5).
At KHUF, the monthly and daily average pressure cor-rections resulted in 3.2% and 2.6% differences, respec-tively, compared with ATADS over the full 58-day period,while the uncorrected heuristics resulted in a 5.5% differ-ence over the same time period. The accuracy of themonthly counts obtained from the uncorrected heuristicsranged from 5.3% to 5.8% compared to ATADS, while themonthly and daily average pressure corrections resulted inmonthly percentage differences ranging from 1.2% to 5.8%and from 0.6% to 4.1%, respectively (Table 6).
In order to investigate the potential advantage of dailyaverage pressure corrections over monthly average pressurecorrections, a data set at KHUF for the month of April 2019was processed using the uncorrected decision heuristics, themonthly average pressure correction method, and the dailyaverage pressure correction method (Table 7). Note thatthis particular test data set was chosen because the ave-rage barometric pressure over that month was 29.920Hg,implying a calibrated traffic pattern altitude of 1601 ft,virtually the same as the uncalibrated TPA of 1,600 ft. As aresult, the counts from the monthly average pressure
38 J.H. Mott et al. / Journal of Aviation Technology and Engineering

correction are identical to those from the uncorrectedheuristics, since aircraft altitudes are reported only to thenearest hundred feet. Note also that the percentage errors inTable 7 are expressed relative to the total monthly ATADScount.
One can define the mean average estimation error as
MAE~
PNi~1 jbdi{dij
N, ð5Þ
where d̂i are the daily operations count estimates (fromeither uncorrected heuristics or corrected heuristics usingmonthly or daily average pressures), di are the dailyATADS counts, and N is the number of days in thecollection period. Errors calculated from the KHUF data setsuggest that the barometric correction method using dailyaverage pressures results in both a slightly lower overallpercentage error and mean average error (Table 8) thaneither the uncorrected method or the correction usingmonthly average pressures. While the daily average pres-sure correction appears to provide the best results at TerreHaute, the same is not true for Lafayette. Hence, anyadvantages of daily pressure correction over correctionusing monthly average pressure are inconclusive.
Figure 2. Calibrated runway bounding cuboid. (a) Calibration based on local atmospheric pressure lower than 29.920Hg. (b) Calibration based on localatmospheric pressure higher than 29.920Hg.
Table 3Properties of standard atmosphere (FAA, 2008, 2016; ICAO, 1993).
Altimetersetting (0Hg)
Altitudecorrection (ft)
Temperature
( ˚C) ( ˚F)
29.7 +205 14.64 58.3529.8 +112 14.84 58.7129.9 +20 15.04 59.0729.92 0 15.00 59.0030.0 273 15.23 59.4130.1 2165 15.42 59.7630.2 2257 15.62 60.1230.3 2348 15.82 60.48
J.H. Mott et al. / Journal of Aviation Technology and Engineering 39

Figure 3. Field deployments of Blueavion device: (a) Purdue University Airport (KLAF) diagram and (b) Terre Haute Regional Airport (KHUF) diagram.
40 J.H. Mott et al. / Journal of Aviation Technology and Engineering
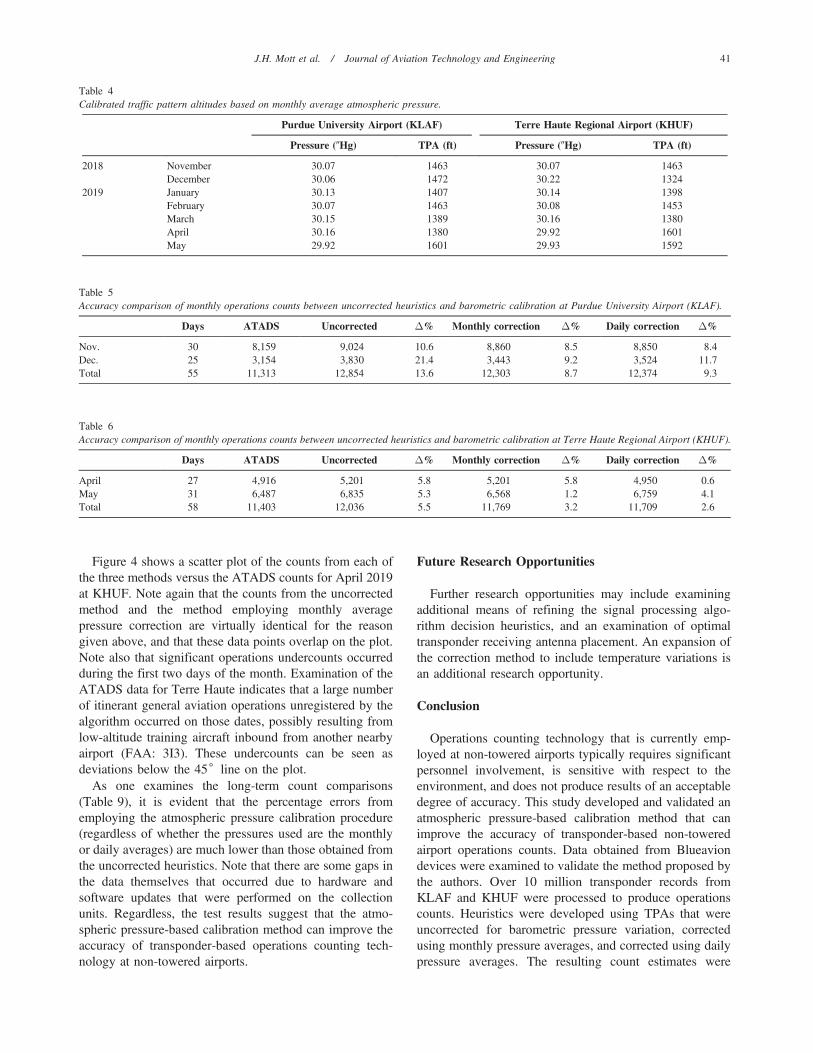
Figure 4 shows a scatter plot of the counts from each ofthe three methods versus the ATADS counts for April 2019at KHUF. Note again that the counts from the uncorrectedmethod and the method employing monthly averagepressure correction are virtually identical for the reasongiven above, and that these data points overlap on the plot.Note also that significant operations undercounts occurredduring the first two days of the month. Examination of theATADS data for Terre Haute indicates that a large numberof itinerant general aviation operations unregistered by thealgorithm occurred on those dates, possibly resulting fromlow-altitude training aircraft inbound from another nearbyairport (FAA: 3I3). These undercounts can be seen asdeviations below the 45˚ line on the plot.
As one examines the long-term count comparisons(Table 9), it is evident that the percentage errors fromemploying the atmospheric pressure calibration procedure(regardless of whether the pressures used are the monthlyor daily averages) are much lower than those obtained fromthe uncorrected heuristics. Note that there are some gaps inthe data themselves that occurred due to hardware andsoftware updates that were performed on the collectionunits. Regardless, the test results suggest that the atmo-spheric pressure-based calibration method can improve theaccuracy of transponder-based operations counting tech-nology at non-towered airports.
Future Research Opportunities
Further research opportunities may include examiningadditional means of refining the signal processing algo-rithm decision heuristics, and an examination of optimaltransponder receiving antenna placement. An expansion ofthe correction method to include temperature variations isan additional research opportunity.
Conclusion
Operations counting technology that is currently emp-loyed at non-towered airports typically requires significantpersonnel involvement, is sensitive with respect to theenvironment, and does not produce results of an acceptabledegree of accuracy. This study developed and validated anatmospheric pressure-based calibration method that canimprove the accuracy of transponder-based non-toweredairport operations counts. Data obtained from Blueaviondevices were examined to validate the method proposed bythe authors. Over 10 million transponder records fromKLAF and KHUF were processed to produce operationscounts. Heuristics were developed using TPAs that wereuncorrected for barometric pressure variation, correctedusing monthly pressure averages, and corrected using dailypressure averages. The resulting count estimates were
Table 4Calibrated traffic pattern altitudes based on monthly average atmospheric pressure.
Purdue University Airport (KLAF) Terre Haute Regional Airport (KHUF)
Pressure (0Hg) TPA (ft) Pressure (0Hg) TPA (ft)
2018 November 30.07 1463 30.07 1463December 30.06 1472 30.22 1324
2019 January 30.13 1407 30.14 1398February 30.07 1463 30.08 1453March 30.15 1389 30.16 1380April 30.16 1380 29.92 1601May 29.92 1601 29.93 1592
Table 5Accuracy comparison of monthly operations counts between uncorrected heuristics and barometric calibration at Purdue University Airport (KLAF).
Days ATADS Uncorrected �% Monthly correction �% Daily correction �%
Nov. 30 8,159 9,024 10.6 8,860 8.5 8,850 8.4Dec. 25 3,154 3,830 21.4 3,443 9.2 3,524 11.7Total 55 11,313 12,854 13.6 12,303 8.7 12,374 9.3
Table 6Accuracy comparison of monthly operations counts between uncorrected heuristics and barometric calibration at Terre Haute Regional Airport (KHUF).
Days ATADS Uncorrected �% Monthly correction �% Daily correction �%
April 27 4,916 5,201 5.8 5,201 5.8 4,950 0.6May 31 6,487 6,835 5.3 6,568 1.2 6,759 4.1Total 58 11,403 12,036 5.5 11,769 3.2 11,709 2.6
J.H. Mott et al. / Journal of Aviation Technology and Engineering 41
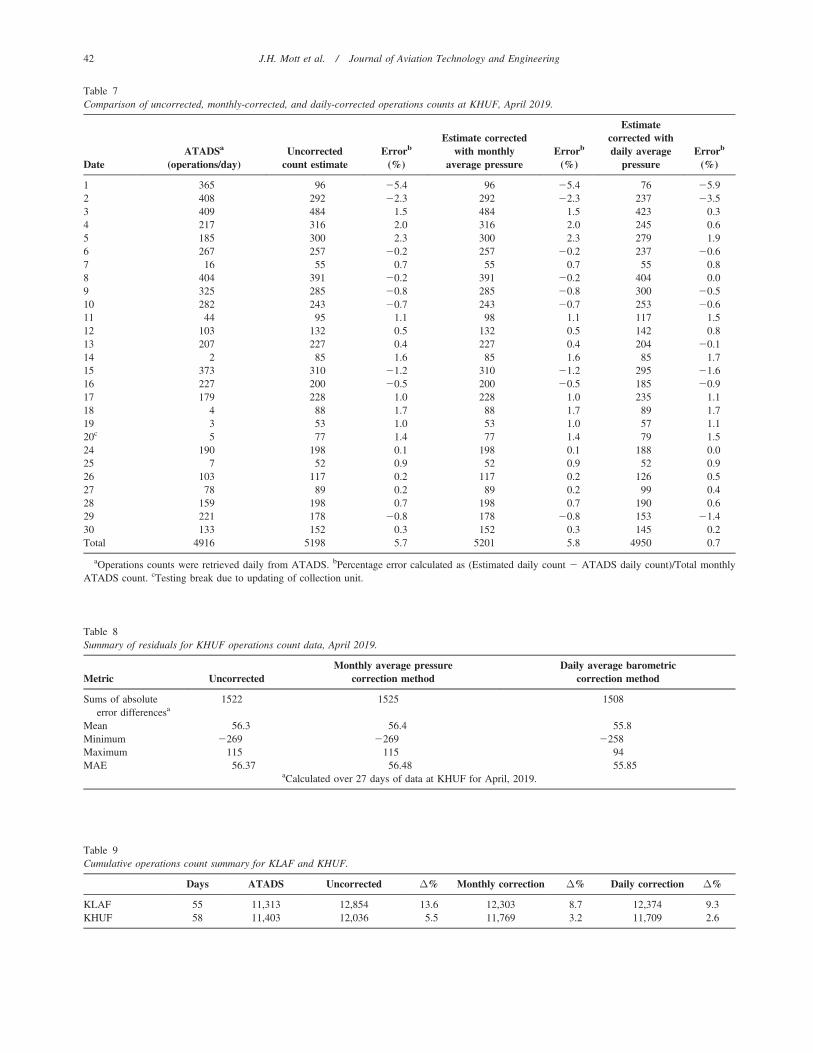
Table 7Comparison of uncorrected, monthly-corrected, and daily-corrected operations counts at KHUF, April 2019.
DateATADSa
(operations/day)Uncorrected
count estimateErrorb
(%)
Estimate correctedwith monthly
average pressureErrorb
(%)
Estimatecorrected withdaily average
pressureErrorb
(%)
1 365 96 25.4 96 25.4 76 25.92 408 292 22.3 292 22.3 237 23.53 409 484 1.5 484 1.5 423 0.34 217 316 2.0 316 2.0 245 0.65 185 300 2.3 300 2.3 279 1.96 267 257 20.2 257 20.2 237 20.67 16 55 0.7 55 0.7 55 0.88 404 391 20.2 391 20.2 404 0.09 325 285 20.8 285 20.8 300 20.510 282 243 20.7 243 20.7 253 20.611 44 95 1.1 98 1.1 117 1.512 103 132 0.5 132 0.5 142 0.813 207 227 0.4 227 0.4 204 20.114 2 85 1.6 85 1.6 85 1.715 373 310 21.2 310 21.2 295 21.616 227 200 20.5 200 20.5 185 20.917 179 228 1.0 228 1.0 235 1.118 4 88 1.7 88 1.7 89 1.719 3 53 1.0 53 1.0 57 1.120c 5 77 1.4 77 1.4 79 1.524 190 198 0.1 198 0.1 188 0.025 7 52 0.9 52 0.9 52 0.926 103 117 0.2 117 0.2 126 0.527 78 89 0.2 89 0.2 99 0.428 159 198 0.7 198 0.7 190 0.629 221 178 20.8 178 20.8 153 21.430 133 152 0.3 152 0.3 145 0.2Total 4916 5198 5.7 5201 5.8 4950 0.7
aOperations counts were retrieved daily from ATADS. bPercentage error calculated as (Estimated daily count 2 ATADS daily count)/Total monthlyATADS count. cTesting break due to updating of collection unit.
Table 8Summary of residuals for KHUF operations count data, April 2019.
Metric UncorrectedMonthly average pressure
correction methodDaily average barometric
correction method
Sums of absoluteerror differencesa
1522 1525 1508
Mean 56.3 56.4 55.8Minimum 2269 2269 2258Maximum 115 115 94MAE 56.37 56.48 55.85
aCalculated over 27 days of data at KHUF for April, 2019.
Table 9Cumulative operations count summary for KLAF and KHUF.
Days ATADS Uncorrected �% Monthly correction �% Daily correction �%
KLAF 55 11,313 12,854 13.6 12,303 8.7 12,374 9.3KHUF 58 11,403 12,036 5.5 11,769 3.2 11,709 2.6
42 J.H. Mott et al. / Journal of Aviation Technology and Engineering

compared with FAA ATADS operations counts. Theaccuracy of monthly operations counts from the uncor-rected heuristics ranged from 5.3% to 21.4% as comparedto ATADS, while the accuracy of monthly operationscounts obtained from monthly average pressure correctionand daily average pressure correction ranged from 1.2% to9.2% and from 0.6% to 11.7%, respectively. The overallaccuracy of operations counts from uncorrected heuristicsranged from 5.5% to 13.6% as compared to ATADS overdifferent time periods ranging from 55 days to 58 days.Over those same time periods, the differences between theoperations count estimate and the ATADS data usingmonthly and daily average pressures ranged from 3.2% to8.7% and from 2.6% to 9.3%, respectively. The resultssuggest that the barometric correction method usingmonthly average pressures results in a modest improvementin overall percentage error and mean average error over theuncorrected method. The results were mixed for using dailybarometric correction, with improved accuracy observed atKHUF, but slightly degraded accuracy observed at KLAF.
Acknowledgements
This research was partially funded by the FAA’s Projectto Enhance General Aviation Safety and Sustainability(PEGASAS) Center of Excellence. The pre-productionprototype was provided by Bluemac Transportation Data
Systems. The authors have no financial interest in BluemacTransportation Data Systems.
References
Federal Aviation Administration. (2008). Pilot’s handbook of aeronauticalknowledge. No. FAA-H-8083-25A. Washington, DC: U.S. Departmentof Transportation.
Federal Aviation Administration. (2016). Airplane flying handbook.No. FAA-H-8083-38. Washington, DC: U.S. Department of Trans-portation.
Federal Aviation Administration. (2018). 2019–2023 National Plan ofIntegrated Airport Systems (NPIAS) report. Washington, DC: U.S.Department of Transportation.
International Civil Aviation Organization. (1993). Manual of the ICAOStandard Atmosphere (extended to 80 kilometres [262,500 feet])(3rd ed.). Doc 7488-CD. Montreal, Canada: ICAO.
International Civil Aviation Organization. (2006). Procedures for airnavigation services: Aircraft operations (5th ed.). Doc 8168. Montreal,Canada: ICAO.
International Civil Aviation Organization. (2014). Annex 10—Aero-nautical telecommunications—Volume IV—Surveillance radar andcollision avoidance systems (5th ed.). Montreal, Canada: ICAO.
International Organization for Standardization. (1975). Standard atmo-sphere. ISO 2533:1975. Geneva, Switzerland: ISO.
Mott, J. H. (2018a). Measurement of airport operations using a low-costtransponder data receiver and collection unit. AIAA Journal of AirTransportation, 26(3). doi: http://arc.aiaa.org/doi/abs/10.2514/1.D0117
Mott, J. H. (2018b). Estimation of aircraft distances using transpondersignal strength information. Cogent Engineering, 5(1). https://doi.org/10.1080/23311916.2018.1466619
Figure 4. Scatter plot of operations count comparison between ATADS and three correction methods, KHUF, April 2019.
J.H. Mott et al. / Journal of Aviation Technology and Engineering 43

Mott, J. H., & Bullock, D. M. (2018). Estimation of aircraft operations atairports using mode-c signal strength information. IEEE Transactionson Intelligent Transportation Systems, 19(3), 6772686. https://doi.org/10.1109/TITS.2017.2700764
Mott, J. H., McNamara, M. L., & Bullock, D. M. (2016). Estimation ofaircraft operations at airports using nontraditional statistical approaches.In, Proceedings of the 2016 IEEE Aerospace Conference. Big Sky, MT:IEEE. https://doi.org/10.1109/AERO.2016.7500536
Mott, J. H., McNamara, M. L., & Bullock, D. M. (2017). Accuracyassessment of aircraft transponder-based devices for measuring air-port operations. Transportation Research Record: Journal of the
Transportation Research Board, 2626(1), 9217. https://doi.org/10.3141/2626-02
Muia, M. J., & Johnson, M. E. (2015). Evaluating methods for countingaircraft operations at non-towered airports. Airport CooperativeResearch Program Report No. 129. Washington, DC: TransportationResearch Board. https://doi.org/10.17226/22182
Yang, C., Mott, J. H., Hardin, B., Zehr, S., & Bullock, D. M. (2019).Technology assessment to improve operations counts at non-toweredairports. Transportation Research Record: Journal of the Transpor-tation Research Board, 2673(3), 44250. https://doi.org/10.1177/0361198119835804
44 J.H. Mott et al. / Journal of Aviation Technology and Engineering