
Atmospheric global dust cycle and iron inputs to the ocean · Atmospheric global dust cycle and...
17
Atmospheric global dust cycle and iron inputs to the ocean Natalie M. Mahowald, 1 Alex R. Baker, 2 Gilles Bergametti, 3 Nick Brooks, 4 Robert A. Duce, 5 Timothy D. Jickells, 2 Nilgu ¨n Kubilay, 6 Joseph M. Prospero, 7 and Ina Tegen 8,9 Received 2 November 2004; revised 14 July 2005; accepted 21 July 2005; published 30 December 2005. [1] Since iron is an important micronutrient, deposition of iron in mineral aerosols can impact the carbon cycle and atmospheric CO 2 . This paper reviews our current understanding of the global dust cycle and identifies future research needs. The global distribution of desert dust is estimated from a combination of observations of dust from in situ concentration, optical depth, and deposition data; observations from satellite; and global atmospheric models. The anthropogenically influenced portion of atmospheric desert dust flux is thought to be smaller than the natural portion, but is difficult to quantify due to the poorly understood response of desert dust to changes in climate, land use, and water use. The iron content of aerosols is thought to vary by a factor of 2, while the uncertainty in dust deposition is at least a factor of 10 in some regions due to the high spatial and temporal variability and limited observations. Importantly, we have a limited understanding of the processes by which relatively insoluble soil iron (typically 0.5% is soluble) becomes more soluble (1–80%) during atmospheric transport, but these processes could be impacted by anthropogenic emissions of sulfur or organic acids. In order to understand how humans will impact future iron deposition to the oceans, we need to improve our understanding of: iron deposition to remote oceans, iron chemistry in aerosols, how desert dust sources will respond to climate change, and how humans will impact the transport of bioavailable fraction of iron to the oceans. Citation: Mahowald, N. M., A. R. Baker, G. Bergametti, N. Brooks, R. A. Duce, T. D. Jickells, N. Kubilay, J. M. Prospero, and I. Tegen (2005), Atmospheric global dust cycle and iron inputs to the ocean, Global Biogeochem. Cycles, 19, GB4025, doi:10.1029/2004GB002402. 1. Introduction [2] In most regions of the world ocean photosynthetic production (i.e., ‘‘primary’’ productivity) is limited by the availability of the nutrients nitrate and phosphates. Regions where nutrients concentrations are high are usually charac- terized by high concentrations of chlorophyll in surface waters. There are, however, large areas of the world ocean where the concentrations of nutrients are high yet chloro- phyll is low (that is, high nutrient low chlorophyll (HNLC) waters), for example the equatorial Pacific and much of the southern oceans. Martin [1990] hypothesized that primary productivity in HNLC regions was limited by the availabil- ity of iron. Deposition of iron to these regions also has important implications for the CO 2 budget, as increases in iron to the oceans may result in increased productivity and hence a decrease of CO 2 in the atmosphere. A pattern consistent with these interactions is observed on glacial timescales [e.g., Martin, 1990; Watson and Lefevre, 1999; Archer et al., 2000]. Additionally, certain nitrogen fixing organisms such as Trichodesmium [Falkowski et al., 1998; Mills et al., 2004] have higher iron requirements; thus increased supplies of iron may impact the production of the macronutrient fixed nitrogen and influence productivity in oligotrophic tropical waters. [3] In many open-ocean regions the input of new iron to the surface waters is dominated by the atmospheric depo- sition of soluble iron in mineral aerosols [e.g., Fung et al., 2000; Sarthou et al., 2003]. In terms of the biogeochemical response to atmospheric deposition, the aerosol iron fraction of importance is that which is bioavailable and this may be GLOBAL BIOGEOCHEMICAL CYCLES, VOL. 19, GB4025, doi:10.1029/2004GB002402, 2005 1 National Center for Atmospheric Research, Boulder, Colorado, USA. 2 School of Environmental Sciences, University of East Anglia, Norwich, UK. 3 Laboratoire Interuniversitaire des Systemes Atmospheriques, UMR CNRS 7583, Creteil, France. 4 Tyndall Centre for Climate Change Research, University of East Anglia, Norwich, UK. 5 Departments of Oceanography and Atmospheric Sciences, Texas A&M University, College Station, Texas, USA. 6 Institute of Marine Sciences, Middle East Technical University, Erdemli-Mersin, Turkey. 7 Rosenstiel School of Marine and Atmospheric Science, University of Miami, Miami, Florida, USA. 8 Max-Planck Institute for Biogeochemistry, Jena, Germany. 9 Now at Institute for Tropospheric Research, Leipzig, Germany. Copyright 2005 by the American Geophysical Union. 0886-6236/05/2004GB002402$12.00 GB4025 1 of 15
Transcript of Atmospheric global dust cycle and iron inputs to the ocean · Atmospheric global dust cycle and...

Atmospheric global dust cycle and iron inputs to the ocean
Natalie M. Mahowald,1 Alex R. Baker,2 Gilles Bergametti,3 Nick Brooks,4
Robert A. Duce,5 Timothy D. Jickells,2 Nilgun Kubilay,6 Joseph M. Prospero,7
and Ina Tegen8,9
Received 2 November 2004; revised 14 July 2005; accepted 21 July 2005; published 30 December 2005.
[1] Since iron is an important micronutrient, deposition of iron in mineral aerosols canimpact the carbon cycle and atmospheric CO2. This paper reviews our currentunderstanding of the global dust cycle and identifies future research needs. The globaldistribution of desert dust is estimated from a combination of observations of dust from insitu concentration, optical depth, and deposition data; observations from satellite; andglobal atmospheric models. The anthropogenically influenced portion of atmosphericdesert dust flux is thought to be smaller than the natural portion, but is difficult to quantifydue to the poorly understood response of desert dust to changes in climate, land use, andwater use. The iron content of aerosols is thought to vary by a factor of 2, while theuncertainty in dust deposition is at least a factor of 10 in some regions due to the highspatial and temporal variability and limited observations. Importantly, we have alimited understanding of the processes by which relatively insoluble soil iron (typically�0.5% is soluble) becomes more soluble (1–80%) during atmospheric transport, butthese processes could be impacted by anthropogenic emissions of sulfur or organicacids. In order to understand how humans will impact future iron deposition to theoceans, we need to improve our understanding of: iron deposition to remote oceans, ironchemistry in aerosols, how desert dust sources will respond to climate change, and howhumans will impact the transport of bioavailable fraction of iron to the oceans.
Citation: Mahowald, N. M., A. R. Baker, G. Bergametti, N. Brooks, R. A. Duce, T. D. Jickells, N. Kubilay, J. M. Prospero, and
I. Tegen (2005), Atmospheric global dust cycle and iron inputs to the ocean, Global Biogeochem. Cycles, 19, GB4025,
doi:10.1029/2004GB002402.
1. Introduction
[2] In most regions of the world ocean photosyntheticproduction (i.e., ‘‘primary’’ productivity) is limited by theavailability of the nutrients nitrate and phosphates. Regionswhere nutrients concentrations are high are usually charac-terized by high concentrations of chlorophyll in surface
waters. There are, however, large areas of the world oceanwhere the concentrations of nutrients are high yet chloro-phyll is low (that is, high nutrient low chlorophyll (HNLC)waters), for example the equatorial Pacific and much of thesouthern oceans. Martin [1990] hypothesized that primaryproductivity in HNLC regions was limited by the availabil-ity of iron. Deposition of iron to these regions also hasimportant implications for the CO2 budget, as increases iniron to the oceans may result in increased productivity andhence a decrease of CO2 in the atmosphere. A patternconsistent with these interactions is observed on glacialtimescales [e.g., Martin, 1990; Watson and Lefevre, 1999;Archer et al., 2000]. Additionally, certain nitrogen fixingorganisms such as Trichodesmium [Falkowski et al., 1998;Mills et al., 2004] have higher iron requirements; thusincreased supplies of iron may impact the production ofthe macronutrient fixed nitrogen and influence productivityin oligotrophic tropical waters.[3] In many open-ocean regions the input of new iron to
the surface waters is dominated by the atmospheric depo-sition of soluble iron in mineral aerosols [e.g., Fung et al.,2000; Sarthou et al., 2003]. In terms of the biogeochemicalresponse to atmospheric deposition, the aerosol iron fractionof importance is that which is bioavailable and this may be
GLOBAL BIOGEOCHEMICAL CYCLES, VOL. 19, GB4025, doi:10.1029/2004GB002402, 2005
1National Center for Atmospheric Research, Boulder, Colorado, USA.2School of Environmental Sciences, University of East Anglia,
Norwich, UK.3Laboratoire Interuniversitaire des Systemes Atmospheriques, UMR
CNRS 7583, Creteil, France.4Tyndall Centre for Climate Change Research, University of East
Anglia, Norwich, UK.5Departments of Oceanography and Atmospheric Sciences, Texas
A&M University, College Station, Texas, USA.6Institute of Marine Sciences, Middle East Technical University,
Erdemli-Mersin, Turkey.7Rosenstiel School of Marine and Atmospheric Science, University of
Miami, Miami, Florida, USA.8Max-Planck Institute for Biogeochemistry, Jena, Germany.9Now at Institute for Tropospheric Research, Leipzig, Germany.
Copyright 2005 by the American Geophysical Union.0886-6236/05/2004GB002402$12.00
GB4025 1 of 15

different than the soluble fraction (see section 4.3). Mineralaerosols consist of soil particles that are lifted into theatmosphere when high winds occur over erodible surfaces.These particles can be transported long distances from theirsource regions before being deposited via settling, turbulentdeposition or precipitation processes. Much of this paperdescribes our understanding of dust sources, transport anddeposition. Changes in these processes in the future willplay a large role in controlling changes in atmosphericdeposition of bioavailable iron. We also review the lessunderstood issue of how insoluble soil iron is processed inthe atmosphere to become more soluble, and presumablymore readily utilized by ocean biota.[4] This paper is a product of the IGBP Fasttrack iron
meeting, held during April 2004 in Norwich, England. Ourgoal is to highlight the current understanding of atmosphericiron deposition to the oceans and identify gaps in ourcurrent understanding in order to promote studies that willcomplete our picture of the transport of iron from theterrestrial sources to the oceans. Additionally, we want tounderstand how humans and climate change will alter dust-iron fluxes to the ocean in the future. This is a prerequisitefor the appropriate inclusion of iron in earth system models.This paper represents the first synthesis of our knowledge ofdesert dust sources, transport and deposition processes, aswell as estimates of the amount of soluble and bioavailableiron in desert dust deposited in the source regions, althoughthere are large uncertainties in what is bioavailable. Relatedpapers overviewing the whole iron cycle [Jickells et al.,2005], as well as the ocean cycle and paleoclimate datashowing relationships between iron and carbon dioxide, areplanned.[5] This paper will review dust source areas, emission
processes (section 2.1), transport and deposition mecha-nisms (section 2.2) and dust distributions as observed andmodeled (section 2.3). Section 3 reviews variability of dustfluxes, including the role of humans in modulating dust(sections 3.1 and 3.2). Section 4.1 reviews our understand-ing of the amount of iron in mineral aerosols, while section4.2 focuses on dust deposition estimates from modeling andobservations. Section 4.3 addresses the atmospheric pro-cessing of iron to become soluble. Section 5 containsrecommendations for future research areas. We do notaddress the important processes occurring in the oceanswhich control the solubilization and utilization of iron in theupper ocean, which are addressed in papers related to thisone [e.g., Jickells et al., 2005]. A brief review of dustinteractions with climate is including in the auxiliarymaterial (text, section S1.0).1
2. Controls on Distribution of AtmosphericMineral Aerosols
[6] Atmospheric deposition of iron to the open ocean isdominated by the iron contained in mineral aerosols (some-times referred to as soil dust or desert dust) [Fung et al.,2000]. Here we discuss the sources, transport and deposition
processes controlling the entrainment of soil particles andtheir deposition downwind in ocean regions.
2.1. Sources of Atmospheric Mineral Aerosols
2.1.1. Geographical Source Areas[7] The dominant sources of mineral aerosols are the arid
regions of North Africa, the Arabian Peninsula, CentralAsia, China, Australia, North America, and South Africa.While general sources were well known, satellites areproviding new information on sources and their relativeimportance [e.g., Prospero et al., 2002; Washington et al.,2003]. Auxiliary Figure S1 shows an estimate of the largestsource areas from Prospero et al. [2002] and their down-wind trajectories. While the relative magnitude of thesources are difficult to constrain using only satellites, thestrength of the retrieved aerosol optical thickness in nearbyocean regions suggests that mineral aerosols are one of thedominant aerosol types worldwide (see auxiliary Figure S2).[8] There are a few satellites that can detect aerosols over
land, such as the Total Ozone Mapping Spectrometryabsorbing aerosol index (TOMS AAI) [Torres et al.,1998] or Infra-red Difference Dust Index (IDDI) [Legrandet al., 1994]. The majority of the sources seen from satelliteare centered over basin regions which drain from highlands[e.g., Prospero et al., 2002; Goudie and Middleton, 2001;Brooks and Legrand, 2000; Washington et al., 2003]. Thesehighland regions serve as a source of a steady supply ofsmall particles, which are moved down into the basin afterrain events. When the soils dry, these relatively smallalluvial particles (typically under tens of micrometers di-ameter) can be easily entrained into the atmosphere. Thus,while in the dust source itself precipitation must be low sothat the soils remain free to erode, the greater precipitationin adjacent highlands increases the production of smallparticles through weathering and the subsequent transportto deflation basins. For example, the runoff from the Tibestiand Ahaggar mountains in central Africa contributes to thedominant dust sources observed in adjacent low-lands [e.g.,Prospero et al., 2002]. Additionally, many of the importantdust sources were flooded during the Holocene and Pleis-tocene (e.g., Lake Chad Basin in North Africa [Prospero etal., 2002;Washington et al., 2003]). Emissions are strongestat the edges of these formerly wet basins [e.g., Prospero etal., 2002; Reheis et al., 1995; Yaalon, 1987].[9] Further studies based on the inspection of satellite
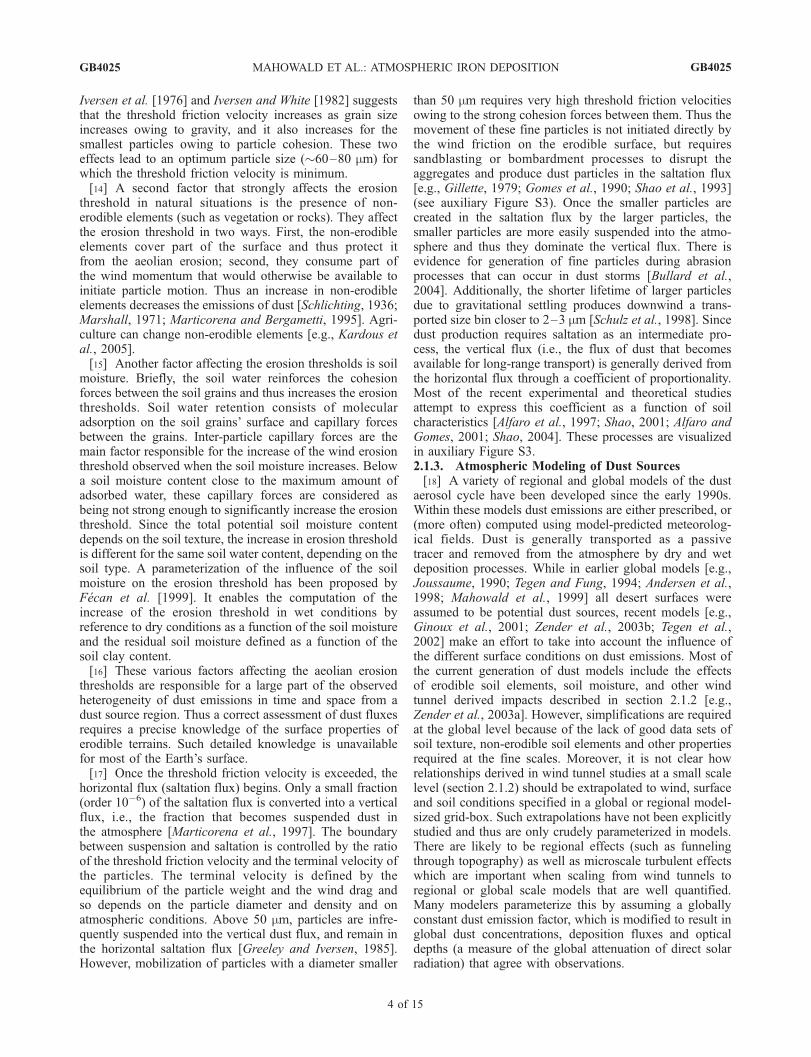
images (especially MODIS) suggest that many large dustevents are comprised of dust derived from ‘‘point’’ sources.The classic examples are the sources in the Bodele Depres-sion in Africa. Prospero et al. [2002] identify the Bodele asone of the most persistently active dust sources in the world.Close examination of the dust events in the Bodele showthat the dust cloud is comprised of a multitude of discreteplumes. MODIS shows that the plumes are long and narrowwith very little dispersion over a distance of 100 km or more(e.g., Figure 1). The main source area lies within a regionidentified as playa (dry lakes). Furthermore, the plumes tendto start at the eastern (windward) edge of the playa.Although we lack explicit data on the site we can imaginea scenario for these dust events. There is often a strongeasterly wind flow in this region augmented by the
1Auxiliary material is available at ftp://ftp.agu.org/apend/gb/2004GB002402.
GB4025 MAHOWALD ET AL.: ATMOSPHERIC IRON DEPOSITION
2 of 15
GB4025

funneling of winds between the Tibesti Mountains and theEnnedi Plateau. In MODIS and Landsat, one can see longlinear dune formations extending from Egypt through this‘‘gap’’ and into Chad. Winds or infrequent rainstormsconstantly move sand into the Bodele playa system. Thissand blasts the surface of the playas (as described in thefollowing section) releasing a large and steady flow of dustto the atmosphere. The importance of small-scale dustsources dispersed in large-scale basins has been well docu-mented in extensive field studies in various regions includ-ing the Southwestern United States [e.g., Gillette, 1999].Additionally, it is likely that sources evolve during the yearas changing seasons bring strong winds and low precipita-tion to different regions [e.g., Marticorena and Bergametti,1995]. Another example of ‘‘point sources’’ of dust isshown in Figure 1 (bottom), where winds from the westdrive a desert dust event in an agricultural region ofColorado in the United States. Note that not all the agricul-tural fields are equally good at producing dust.[10] Satellite data [e.g., Prospero et al., 2002] suggest that
the largest and most intense dust sources lie in the NorthernHemisphere (e.g., auxiliary Figure S1 and S2). Nonethelessit is difficult to assess the importance of specific dustsources on a global scale. This is especially true for smallersources that could be important for transport to low dustdeposition regions (e.g., off the coast of South America orSouth Africa). In contrast to the Northern Hemispherewhere dust often dominates total column optical thickness,over the southern oceans dust contributes a small fraction ofthe aerosol optical thickness relative to other aerosols (e.g.,sea salt aerosols [Tegen et al., 1997; Reddy et al., 2005]).Also the optical depths are close to the detection limit of thesatellites, although new satellites have improved capabilities[Barnaba and Gobbi, 2004; Kaufman et al., 2005].2.1.2. Dust Emission Processes[11] Dust generation is a highly complex process that
responds in a non-linear way to a variety of environmentalfactors. For this reason, dust emissions are highly variableon spatial and temporal scales. The first requirement is thatthe soil surface be dry and sparsely vegetated. Secondlythere must be present on the surface substantial concen-trations of relatively large particles (tens to hundreds of mmdiameter) that the wind can ‘‘grip’’ and force into move-ment. Once these particles start to move, they bounce(saltate) across the surface, dislodging smaller particles(under 10–20 mm diameter) which can be lifted into theatmosphere and subsequently carried great distances as‘‘dust.’’ Auxiliary Figure S3 shows a simple diagram ofthese processes.[12] The modeling of the soil deflation process begins
with the saltation flux, the horizontal mass flux over thesurface. This flux is proportional to the third power of thewind friction velocity [e.g., Bagnold, 1941; White, 1979;Gillette, 1974, 1979; Shao et al.,1993], a measure of thewind shear stress on the soil surface; it is a function ofplanetary boundary layer winds, surface roughness andatmospheric stability [e.g., Garratt, 1992].[13] The threshold friction velocity is defined as the
friction velocity above which soil particles begin to movein saltation flux. Work by Bagnold [1941], Chepil [1945],
Figure 1. (top) TERRA MODIS (moderate resolutionimaging spectroradiometer) image of Bodele basin in NorthAfrica (approximately 17�N, 18�E) on 11 February 2004[Koren and Kaufman, 2004] taken from http://earthobser-vatory.nasa.gov/Newsroom/NewImages/images.php3?img_id=16534. (bottom) Colorado dust storms, 18 April2004. This MODIS image shows a cluster of dense dustplumes that erupted from fields in southeastern Colorado, tothe north of the Arkansas River visible at the bottom of theimage. The dust cloud extends into Kansas (border in theright of the image); later in the afternoon, dust was carrieddeep into Nebraska (border in the upper right corner). Theinset shows a Landsat image of the area demarcated by thebox. The grid pattern in the image indicates the presence ofagricultural fields that cover much of this area. These fieldsseem to be the source of the major dust plumes seen in theimage. (Landsat image is courtesy of Max Bleiweiss, NewMexico State University. The MODIS image is from theNASA MODIS Rapid Response System Gallery web site:http://rapidfire.sci.gsfc.nasa.gov/gallery/). See color versionof this figure at back of this issue.
GB4025 MAHOWALD ET AL.: ATMOSPHERIC IRON DEPOSITION
3 of 15
GB4025
Iversen et al. [1976] and Iversen and White [1982] suggeststhat the threshold friction velocity increases as grain sizeincreases owing to gravity, and it also increases for thesmallest particles owing to particle cohesion. These twoeffects lead to an optimum particle size (�60–80 mm) forwhich the threshold friction velocity is minimum.[14] A second factor that strongly affects the erosion
threshold in natural situations is the presence of non-erodible elements (such as vegetation or rocks). They affectthe erosion threshold in two ways. First, the non-erodibleelements cover part of the surface and thus protect itfrom the aeolian erosion; second, they consume part ofthe wind momentum that would otherwise be available toinitiate particle motion. Thus an increase in non-erodibleelements decreases the emissions of dust [Schlichting, 1936;Marshall, 1971; Marticorena and Bergametti, 1995]. Agri-culture can change non-erodible elements [e.g., Kardous etal., 2005].[15] Another factor affecting the erosion thresholds is soil
moisture. Briefly, the soil water reinforces the cohesionforces between the soil grains and thus increases the erosionthresholds. Soil water retention consists of molecularadsorption on the soil grains’ surface and capillary forcesbetween the grains. Inter-particle capillary forces are themain factor responsible for the increase of the wind erosionthreshold observed when the soil moisture increases. Belowa soil moisture content close to the maximum amount ofadsorbed water, these capillary forces are considered asbeing not strong enough to significantly increase the erosionthreshold. Since the total potential soil moisture contentdepends on the soil texture, the increase in erosion thresholdis different for the same soil water content, depending on thesoil type. A parameterization of the influence of the soilmoisture on the erosion threshold has been proposed byFecan et al. [1999]. It enables the computation of theincrease of the erosion threshold in wet conditions byreference to dry conditions as a function of the soil moistureand the residual soil moisture defined as a function of thesoil clay content.[16] These various factors affecting the aeolian erosion
thresholds are responsible for a large part of the observedheterogeneity of dust emissions in time and space from adust source region. Thus a correct assessment of dust fluxesrequires a precise knowledge of the surface properties oferodible terrains. Such detailed knowledge is unavailablefor most of the Earth’s surface.[17] Once the threshold friction velocity is exceeded, the
horizontal flux (saltation flux) begins. Only a small fraction(order 10�6) of the saltation flux is converted into a verticalflux, i.e., the fraction that becomes suspended dust inthe atmosphere [Marticorena et al., 1997]. The boundarybetween suspension and saltation is controlled by the ratioof the threshold friction velocity and the terminal velocity ofthe particles. The terminal velocity is defined by theequilibrium of the particle weight and the wind drag andso depends on the particle diameter and density and onatmospheric conditions. Above 50 mm, particles are infre-quently suspended into the vertical dust flux, and remain inthe horizontal saltation flux [Greeley and Iversen, 1985].However, mobilization of particles with a diameter smaller
than 50 mm requires very high threshold friction velocitiesowing to the strong cohesion forces between them. Thus themovement of these fine particles is not initiated directly bythe wind friction on the erodible surface, but requiressandblasting or bombardment processes to disrupt theaggregates and produce dust particles in the saltation flux[e.g., Gillette, 1979; Gomes et al., 1990; Shao et al., 1993](see auxiliary Figure S3). Once the smaller particles arecreated in the saltation flux by the larger particles, thesmaller particles are more easily suspended into the atmo-sphere and thus they dominate the vertical flux. There isevidence for generation of fine particles during abrasionprocesses that can occur in dust storms [Bullard et al.,2004]. Additionally, the shorter lifetime of larger particlesdue to gravitational settling produces downwind a trans-ported size bin closer to 2–3 mm [Schulz et al., 1998]. Sincedust production requires saltation as an intermediate pro-cess, the vertical flux (i.e., the flux of dust that becomesavailable for long-range transport) is generally derived fromthe horizontal flux through a coefficient of proportionality.Most of the recent experimental and theoretical studiesattempt to express this coefficient as a function of soilcharacteristics [Alfaro et al., 1997; Shao, 2001; Alfaro andGomes, 2001; Shao, 2004]. These processes are visualizedin auxiliary Figure S3.2.1.3. Atmospheric Modeling of Dust Sources[18] A variety of regional and global models of the dust
aerosol cycle have been developed since the early 1990s.Within these models dust emissions are either prescribed, or(more often) computed using model-predicted meteorolog-ical fields. Dust is generally transported as a passivetracer and removed from the atmosphere by dry and wetdeposition processes. While in earlier global models [e.g.,Joussaume, 1990; Tegen and Fung, 1994; Andersen et al.,1998; Mahowald et al., 1999] all desert surfaces wereassumed to be potential dust sources, recent models [e.g.,Ginoux et al., 2001; Zender et al., 2003b; Tegen et al.,2002] make an effort to take into account the influence ofthe different surface conditions on dust emissions. Most ofthe current generation of dust models include the effectsof erodible soil elements, soil moisture, and other windtunnel derived impacts described in section 2.1.2 [e.g.,Zender et al., 2003a]. However, simplifications are requiredat the global level because of the lack of good data sets ofsoil texture, non-erodible soil elements and other propertiesrequired at the fine scales. Moreover, it is not clear howrelationships derived in wind tunnel studies at a small scalelevel (section 2.1.2) should be extrapolated to wind, surfaceand soil conditions specified in a global or regional model-sized grid-box. Such extrapolations have not been explicitlystudied and thus are only crudely parameterized in models.There are likely to be regional effects (such as funnelingthrough topography) as well as microscale turbulent effectswhich are important when scaling from wind tunnels toregional or global scale models that are well quantified.Many modelers parameterize this by assuming a globallyconstant dust emission factor, which is modified to result inglobal dust concentrations, deposition fluxes and opticaldepths (a measure of the global attenuation of direct solarradiation) that agree with observations.
GB4025 MAHOWALD ET AL.: ATMOSPHERIC IRON DEPOSITION
4 of 15
GB4025

[19] Apart from the global scale dust models, a number ofmodels have been developed to describe the dust cyclefor key regions like the Sahara [Westphal et al., 1988;Marticorena et al., 1997; Nickovic and Dobricic, 1996]and East Asia [e.g., Zhang and Carmichael, 1999; Wang etal., 2000]. Such regional-scale models are well suitedfor simulation of individual dust storm events or forcomparisons with in-situ observations, made during fieldexperiments. While the topography, soil conditions andsmall-scale extreme wind events are described better inregional than in global models, there are still uncertaintiesin describing the dust source area, the surface conditions inthe source area, and changes in size distribution and chem-ical composition during transport. Currently, global modelspredict dust emissions of between 1000 and 2000 Mt/yr forparticles with less than 10 mm radius (Table 1).
2.2. Dust Transport and Deposition
[20] Dust atmospheric lifetime depends on the particlesize, ranging from a few hours for particles larger than10 mm, to up to several weeks for submicrometer-sized dustparticles. The lifetime of submicrometer sized particlesdepends partly on the precipitation efficiency, which in turndepends on the type of precipitation, on the vertical distri-bution of dust, and on particle properties (which maychange during transport). In the atmosphere, dust is movedby the prevailing winds and transported vertically by moistand dry convective processes, as well as adiabatic verticalmotion associated with frontal systems. Once lifted into thefree troposphere, dust can be transported over thousands ofkilometers from the source areas. Thus dust can be trans-ported out of the Sahara with the Easterly jet over theAtlantic, often reaching the Caribbean [e.g., Prospero andNees, 1986], southern Florida [Prospero, 1999], and theeastern United States as far north as New England [Perry etal., 1997]. Asian dust often crosses the Pacific to NorthAmerica, resulting in significant concentrations over largeareas [VanCuren, 2003]. One dust event from China isdocumented to have continued across the Atlantic anddeposited measurable dust amounts in the Alps [Groussetet al., 2003].[21] A major mechanism leading to dust deposition is the
sedimentation due to gravity. Because of this process, largeparticles sediment out more quickly than smaller particles,which leads to a shift toward smaller particle sizes duringtransport. Close to the source areas dry deposition is thedominant deposition mechanism for dust particles. Whiledust particles with sizes of about 70 mm are picked up most
easily by the winds, dust transported up to thousands of kmusually has a mode diameter of approximately 2 mm [e.g.,Schulz et al., 1998]. Recent measurements during thePRIDE experiment show larger mode sizes, typically3.5 mm, for dust that has traveled from North Africa toPuerto Rico [Reid et al., 2003; Grini and Zender, 2004].Comparisons of the size distribution of African dust mea-sured in the Canary Islands off the coast of West Africa withthose in Puerto Rico show only a relatively minor shift tosmaller sizes after a transport of about 4000 km [Maring etal., 2003]. While typically the dust mass median diameter isrelatively small, large dust particles (>100 m m) have beencarried great distances to remote ocean regions [e.g., Betzeret al., 1988]. The long-range transport of such largeparticles cannot be simulated using conventional knowledgeof dry-deposition processes [e.g., Slinn and Slinn, 1980;Colarco et al., 2002; Reid et al., 2003; Ginoux, 2003; Griniand Zender, 2004]. Additional processes need to be includedin models to account for the transport of large particles.[22] Dust is also washed out of the atmosphere by
precipitation. The interaction of dust with clouds is not wellunderstood, partly because, in general, aerosol-cloud inter-actions are not well understood, and particularly because ofa dearth of cloud microphysical measurements in dustdominated regions. This lack of a well-known relationshipmakes different researchers make very different assump-tions about cloud-dust interactions. Mineral aerosols are notreadily soluble in water, leading many researchers to assumethat mineral aerosols do not interact with clouds directly, butrather that they are scavenged via sub-cloud removalmechanisms. Mineralogical evidence suggests, however,that dust particles readily attract water [Koretsky et al.,1997], and thus some investigators assume that mineralaerosols are readily incorporated into clouds and can act ascloud condensation nuclei (CCN) [Rosenfeld et al., 2001].To simulate the poorly understood wet removal process,many researchers use simple scavenging ratios [e.g., Tegenand Fung, 1994; Mahowald et al., 2003] of between 200and 1000 based on observational estimates of between200 and 1000 [Duce et al., 1991]. However, other modelsuse more explicit microphysics to incorporate aerosols intoclouds and wash them out [Rasch et al., 2001]. Recentstudies have also included the impact of mixing dust withsoluble sulfate thereby increasing the hygroscopic proper-ties of the dust; this work suggests that this improves thecomparison of their model results with in situ measurements[Fan et al., 2004]. Wet deposition is a difficult process tosimulate in models, and comparisons of wet deposition
Table 1. Deposition of Dust Into Various Ocean Basinsa
Duce et al.[1991]
Prospero[1996]
Ginoux et al.[2001]
Zender et al.[2003a]
Tegen et al.[2004]
Luo et al.[2003]
CompositeDust Deposition
[Jickells et al., 2005]
North Pacific 480 96 92 31 56 (0.29) 35 (0.13) 72South Pacific 39 8 28 8 11 (0.47) 20 (0.22) 29North Atlantic 220 220 184 178 259 (0.21) 230 (0.14) 202South Atlantic 24 5 20 29 35 (0.20) 30 (0.17) 17Indian Ocean 144 29 154 48 61 (0.12) 113 (0.10) 118Global emissions - - 1814 1490 1800 1650 1790
aUnits are Mt/yr. The numbers in brackets are variability estimates (stdv/mean).
GB4025 MAHOWALD ET AL.: ATMOSPHERIC IRON DEPOSITION
5 of 15
GB4025

fluxes in models show that very different vertical profilesresult from different parameterizations that have similarsurface deposition [Rasch et al., 2000]. Simulations of dustin the current generation of dust models show large differ-ences in their wet deposition lifetimes that range from56 days [Ginoux et al., 2001] to 10 days [Mahowald etal., 2002]; these discrepancies suggest that further work inthis area is required. Unfortunately, explicit measurementsof wet and dry deposition are rare [e.g., Sarthou et al.,2003], and more observations of both wet and dry deposi-tion are needed. Despite the differences in simulating wetand dry deposition, current models yield a reasonable matchwith the few observations of total deposition [e.g., Ginouxet al., 2001; Tegen et al., 2002; Luo et al., 2003]. The fewobservationally based estimates we have suggest that wetdeposition is more important than dry deposition over oceanregions [Hand et al., 2004] (auxiliary Table S1), althoughthese are limited in both space and time.
2.3. Dust Distributions: Observations and Models
[23] Owing to the short atmospheric lifetime of dust (daysto weeks) many observations are required to adequatelycharacterize dust concentration and flux distributions. Atpresent, there are approximately two dozen long-term datasets obtained at in situ aerosol measurement stations [e.g.,Prospero and Nees, 1986; Arimoto et al., 1990, 1997](University of Miami network). Some additional data setsof in situ deposition flux are compiled by Ginoux et al.[2001], and ice core and ocean sediment flux (e.g., com-piled by Kohfeld and Harrison [2001]). The difficulty ofinterpreting ocean sediment flux data in terms of dustdeposition is detailed in section 4.2).[24] Because of their large spatial coverage, satellite data
have proven useful in evaluating dust sources, transport anddeposition in global models. Both AVHRR [Husar et al.,1997] and TOMS AI [Herman et al., 1997] have yieldedlong term records of aerosol optical depth, but it is difficultto retrieve dust properties quantitatively from these records.Dust retrievals are often difficult because of the presence ofaerosols other than dust and of clouds and because ofthe assumptions that must be made about the physicalproperties of the aerosols. New satellite observations fromPOLDER, MODIS and MISR will likely provide greaterinsights into dust distributions because of increased spectral,spatial and temporal resolution [Barnaba and Gobbi, 2004;Ginoux and Torres, 2003; Kaufman et al., 2005]. Large dustplumes can often be observed in satellite images; in somecases, plumes can be followed for a week or more duringwhich time the dust cloud can span an entire ocean. A numberof web sites present collections of satellite images that can besearched for specific types of events including dust storms(e.g., http://visibleearth.nasa.gov/, http://rapidfire.sci.gsfc.nasa.gov/products/, http://jwocky.gsfc.nasa.gov/aerosols/aerosols.html, http://www.osei.noaa.gov/). While quantita-tive retrieval of dust properties is still difficult, the arealcoverage and progress of dust clouds provides useful infor-mation for the validation and improvement of dust models[e.g., Tegen et al., 2002].[25] Many global dust models are based on forecast center
meteorological analysis, which are an optimal combination
of model and meteorological observations. These modelsyield dust distributions that match satellite dust observationsreasonably well [e.g., Ginoux et al., 2001; Tegen et al.,2002; Zender et al., 2003a; Luo et al., 2003]. In contrastmodel studies based on general circulation winds may havebiases due to problems in model surface winds [e.g., Tegenand Miller, 1998]. Model studies allow us to extrapolateexisting measurements (usually dust concentration or opti-cal depth) to larger geographical areas; these extrapolatedconcentration data can then be used to calculate dustdeposition. Correlations between model predicted valuesof concentration at observational sites against nearby gridboxes suggest that observations of concentration representregional pictures of concentration and, to a lesser extent,deposition [Mahowald et al., 2003]. In contrast, satellite-based estimates of optical depth provide a global picture ofaerosol distribution. But in studies of the correlation be-tween modeled optical depth, mobilization and deposition,they only capture about 50% of the variability in depositionor mobilization. Thus estimates of dust mobilization ordeposition based on satellite optical depths are subject touncertainty [Mahowald et al., 2003]. These differences arepartly due to the fact that dust plumes are often traveling ataltitude and partly because most dust deposition occursduring precipitation events that are unrelated to satelliteoptical depth.
3. Dust Variability and Anthropogenic Influences
3.1. Temporal Variability
[26] Dust source activity, and dust transport and deposi-tion are highly variable on timescales ranging from minutesto centuries to millennia. The dust events shown in Figure 1highlights the temporal-spatial heterogeneity of one desertdust event. Besides variability in winds, it is not clear whatother factors are the major drivers of this variability onlonger timescales. Given the highly non-linear character ofdust generation processes, relatively small changes in thesource region environment can have great consequences.[27] Studies suggest that there were up to 100-fold
changes in the mineral aerosol deposition to ice coresbetween cold and warm periods. For example, dust depo-sition was much greater during the Last Glacial Maximum,�21,000 years before present compared to the present-daywarm climate [e.g., Petit et al., 1990; Legrand, 1995;Steffensen, 1997; Rea, 1994]. Globally averaged depositionchanges are likely to be on the order of 2–3 fold greaterduring cold periods [e.g., Rea, 1994; Mahowald et al.,1999]. Within glacial periods dust concentrations in iceshowed very strong variability [e.g., DeAngelis et al., 1997].The increase in dust at the time of the last glacial maximumcould have been caused by several mechanisms. Strongersurface wind speeds could lift greater amounts of dustaerosols from surfaces compared to modern conditions.Increased aridity could have expanded source areas.Because of lower sea levels, large areas of sediments onthe continental shelved are exposed and could be eroded bywinds. Atmospheric loadings of dust particles could also beincreased under cold climate conditions as a consequence ofthe weakened hydrological cycle. The decrease in atmo-
GB4025 MAHOWALD ET AL.: ATMOSPHERIC IRON DEPOSITION
6 of 15
GB4025

spheric water content leads to decreased precipitation,reducing the washout of atmospheric dust particles and thusleading to longer atmospheric lifetimes. Model investiga-tions used to assess the impact of those processes on theincrease in glacial dust deposition, conclude that all ofthese above mentioned processes may play important rolesfor glacial-interglacial changes in the dust cycle [e.g.,Joussaume, 1990, 1993; Andersen et al., 1998; Reader etal., 1999; Mahowald et al., 1999; Lunt and Valdes, 2002;Werner et al., 2002]. The potentially large effect of dustsupplied by glacial outwash has not yet been evaluated. It isperhaps significant that the huge areas of loess were laiddown during glacial times, for example the massive depositsin what is now the central United States [Bettis et al., 2003].Dust coming from North Africa is likely to have decreasedsubstantially during the climate optimum period of theHolocene (�6000 kybp), which is thought to be related tothe greening of North Africa during that time period [e.g.,deMenocal et al., 2000]. Testing the performance of the dustmodels for past conditions is a valuable tool for evaluatingthe model performance in drastically different climates, andsuch tests will help to assess model performance for futurepredictions of the dust cycle.[28] In recent history, dust coming from North Africa
observed at Barbados has changed by a factor of 4 betweenthe wet 1960s and the dry 1980s [Prospero and Nees, 1986;Prospero and Lamb, 2003]. Analyses of land based data[Goudie and Middleton, 1992; N’Tchayi et al., 1994, 1997]demonstrate that the frequency of dust storms in the Sahelhave increased since the 1950s. Many authors have attrib-uted this increase in dust activity to widespread landdegradation and desertification driven by a combinationof climatic desiccation and human impacts: overgrazing,deforestation, population pressure and inappropriate land-use practices are often cited as causes of degradation [Tegenand Fung, 1995; Tegen et al., 1996]. N’Tchayi et al. [1997]suggested that the Sahel had become a more significantsource of dust than the Sahara.[29] There is, however, no strong evidence to support
claims of systematic, regional-scale desertification or landdegradation. Many studies have concluded that there hasbeen no long-term shift in the desert boundary betweenthe Sahel and the Sahara, nor any net decrease in potentialproductivity in the Sahel [Tucker et al., 1991, 1994;Nicholson and Tucker, 1998; Prince et al., 1998; Schlesingerand Gramenopoulos, 1996]. While anecdotal evidencesuggests that localized land degradation may present aproblem in some areas, other studies suggest that theproblem has been exaggerated [Tiffen and Mortimore,2002]. Furthermore, it is sometimes difficult to decouplehuman impacts from the cycles in wind erosion associatedwith episodes of drought or climatic desiccation, whichare natural features of semi-arid regions where rainfall ishighly variable on multiple timescales [Thomas, 1997].[30] It has also been suggested that changes in dust event
frequency may be the result of changes in meteorologicalmechanisms associated with dust mobilization and transportrather than with changes in the land surface. During the latetwentieth century in the Sahel, there was a shift from large,well-organized convective disturbances associated with
both rainfall and dust mobilization, to weak, poorly orga-nized disturbances associated with dry years. It has beenhypothesized that increases in dust event frequency in thesummer may be the result of a greater proportion of dryconvection events associated with dust mobilization but notwith rainfall and subsequent wet deposition [Brooks, 2000;Brooks and Legrand, 2000].[31] Recently, Prospero and Lamb [2003] showed that
dust concentrations in Barbados were highly correlated withprior-year rainfall deficits in the Sahel-Soudano region ofNorth Africa. The correlation with rainfall does not neces-sarily mean that rainfall itself was the major factor. Othermeteorological variables associated with changes in rainfallcould be responsible, including changes in wind speed,gustiness, transport paths, etc. It was pointed out that themajor dust peaks in the Barbados record were closelyassociated with major ENSO events, the ENSO generallyleading by one year the peak dust concentrations. Thesefluctuations in dust observed far from the dust sourceregions can be due to a combination of source, transportand depositional changes. It is difficult to determine therelative role of these factors, including the role of humans,since the only available studies of human land use change inthe Sahel also showed a large expansion in land usebetween the 1960s and the 1980s. Land use has remainedrelatively constant since then [e.g., Stephenne and Lambin,2001], similar to the temporal behavior in dust at Barbados.Modeling studies have attempted to simulate this change,but were hampered by the accuracy of the forecast centersurface winds and precipitation for this problem [Mahowaldet al., 2002].[32] In contrast, 20 years of dust measurements at Mid-
way in the North Pacific do not show any long term trends[Prospero et al., 2003] although there have been someperiods when dust activity did increase somewhat, especiallyin the late 1990s for several years. While dust measurementsat Midway show no trends, Prospero et al. [2003] showthat the concentration of anthropogenic sulfate at Midwaydoubled from 1981 to the early mid 1990s, closely matchingthe emissions of the pollutant SO2 in China. The contrastbetween the trends in the concentration of a known pollut-ant (SO2–SO4
=) and the absence of a trend in dust suggeststhat the lack of a trend in dust is not linked to changesin transport over time. Contrary to popular opinion, thefrequency of severe dust storms in China over the period1954–2002 was at a peak in the 1950s; it has steadilydecreased, reaching a minimum in the 1990s althoughshowing a relative increase in 2000–2002 [Zhou andZhang, 2003]. Sun et al. [2001] show that dust stormvariability in China is most strongly driven by changes instrong winds. Thus the recent increase in strong fronts alongwith dry conditions is believed to be responsible for theincrease in dust storms in the late 1990s.
3.2. Quantifying Anthropogenic Impacts on Dust
[33] Section 2.1 shows that the dominant sources of dustin the current climate appear to come from natural topo-graphic lows, where easily erodible alluvial soils weredeposited during earlier pluvial periods and which arenow replenished during rain or wind events [e.g., Prospero
GB4025 MAHOWALD ET AL.: ATMOSPHERIC IRON DEPOSITION
7 of 15
GB4025

et al., 2002; Goudie and Middleton, 2001; Brooks andLegrand, 2000]. However, the studies described insection 2.1 were not quantitative enough to predict anthro-pogenic impacts on radiative forcing, for example, andpossible changes that may occur in the future to desert dustsources. In addition, studies such as these based on satelliteobservations may be sensitive to other factors such asboundary layer depth [e.g., Mahowald and Dufresne,2004] as well as the low correlation between satellite opticaldepth and dust entrainment into the atmosphere [Mahowaldet al., 2003]. Anthropogenic sources include agriculturalregions that become active during nonvegetated, dry seasons[e.g., Gillette and Passi, 1988], pastured regions in semi aridregions, and regions where the water table has been sub-stantially modified [e.g., Reheis, 1997]. These regions maywell overlap with sources identified as ‘‘natural’’ since theywill all occur in arid basin regions with fine soils andhighland drainage. Additionally, there is some evidence thatsome sources are very small (e.g., Figure 1), which high-lights the strong hetereogeneities in the sources whichsuggests that it will be difficult for satellites to determinewhether human activities impact sources on a global scale.[34] Modeling studies have attempted to constrain the
anthropogenic portion of present-day dust more quantita-tively. Tegen and Fung [1995] suggested that a 30–50%land use source best matched the AVHRR data, but laterstudies showed that this was a model dependent result [e.g.,Schulz et al., 1998]. Mahowald et al. [2002] suggested thatthe 4x-fold increase at Barbados was best matched by a newsource, but that the forecast center meteorological data setwas not sufficiently robust to be definitive. Luo et al. [2003]showed that a 50% land use and a 0% land use source wereequally good at matching available observations, and wereless different than differences between source parameter-izations and meteorological winds. Tegen et al. [2004] useddust storm frequency data [Engelstaedter et al., 2003] toestimate that land use sources contributed less than 10% tothe total source. In contrast, using another model andmethodology but the same data as Tegen et al. [2004], a0–50% land use source were found be statistically equiv-alent [Mahowald et al., 2004]. These studies highlight thegreat uncertainties in using model simulations to quantifyanthropogenic disturbances to atmospheric dust.[35] Regional studies may allow us to constrain the land
use sources of dust more conclusively. Xuan and Sokolik[2002] attempted to quantify the amounts of dust derivedfrom various sources in China. They identify and charac-terize three broad types of dust sources in Northern China:Type 1, deserts in dry-agricultural areas; Type 2, desertslocated on the plateaus; and Type 3, deserts located intopographical lows. They find type 1 sources (dry agricul-tural areas) only contribute 1% of the total annual particu-late matter dust emissions while Type 2 and 3 contribute35% and 64%, respectively. Chin et al. [2003] also identifylimited regions of land use as sources in Asia. Yoshioka etal. [2005] suggest that land use represents between 0 and25% of the North African source, using TOMS AI andsimulated model absorbing aerosol index.[36] In addition to direct land use changes to source areas,
there are possible impacts through the hydrological cycle
(e.g., the Aral Sea or Owens Lake [Reheis, 1997]) andthrough climate changes. Studies suggest that fluctuations inthe water table are correlated with dust emissions [e.g.,Mahowald et al., 2004]. More studies on the role of changesin the hydrological cycle due to natural or human perturba-tions and their impact on desert dust generation are required.[37] Determining the global anthropogenic portion of dust
may not be possible using satellite data or model resultsbecause of the difficulty of discerning different types ofsources using either model [e.g., Mahowald et al., 2002;Luo et al., 2003; Mahowald and Luo, 2003] or satellite data[Mahowald et al., 2003; Mahowald and Dufresne, 2004].Since most dust sources occur at very small scales (seeFigure 1) it is possible that these sources represent dirt roadsor other anthropogenic disturbances, even in very remoteregions. Thus field studies in specific regions are required toaddress the global importance of anthropogenic disturbance.[38] Only one study has attempted to quantify the impact
of human induced climate change on historical changes indust sources between the pre-industrial and current climate,and this study concluded that depending on the relativeimportance of carbon dioxide fertilization and land use,humans could have increased the desert dust source by 60%or reduced it by 20% [Mahowald and Luo, 2003]. Unfor-tunately, ice core data were unable to discriminate betweenthese cases because of regional inconsistencies in the icecore records, and because the ice cores are located so farfrom the dust source areas.[39] Two studies [Mahowald and Luo, 2003; Tegen et al.,
2004] of projections of dust emissions in the next 100 yearshave been published, one yielding 20–60% reductions indust, and the other resulting in either a 10% decrease or20% increase in dust. These models included the impacts ofchanges in vegetation cover as consequence of changes inmeteorological parameters, and changes in vegetation covercaused by a warmer climate and increased CO2 levels.Reducing the discrepancies in these estimates will requirea better understanding of the changes in vegetation underwarmer climate conditions, together with improvements indust emission modeling. The impact of climate change onnatural sources of dust is an important topic that has not yetbeen addressed in a systematic and convincing manner. It ispossible that changes in vegetation may open up newsources (e.g., ‘‘disturbed sources’’ from Tegen and Fung[1995]). However, this impact is not well quantified now, ineither the main desert dust source regions or the smaller dustsource regions that control ocean deposition to someregions.
4. Iron/Dust Connections
4.1. Iron Content of Dust
[40] Iron rather than dust is the key issue for oceanbiogeochemistry. The iron content of minerals varies con-siderably from place to place depending on the mineralogyof the source material [e.g., Claquin et al., 1999; Fung etal., 2000]. The average iron content of the Earth’s crust is3.5% [Taylor and McLennan, 1985] and this value is widelyused in assessing global-scale iron inputs to the ocean [Duceand Tindale, 1991]. There may be some differentiation in
GB4025 MAHOWALD ET AL.: ATMOSPHERIC IRON DEPOSITION
8 of 15
GB4025

amount of iron depending on the size fraction [e.g., Claquinet al., 1999]. A compilation of observations (auxiliaryTable S2) as well as model results [Hand et al., 2004] showthat the factor of 2 differences in iron amounts in soils tendto cause smaller variability in iron content in aerosols,suggesting that uncertainties in dust deposition and ironsolubility (below) are more important variables to under-stand than the regional differences in iron amounts in sourcesoils. This would be the case even for aerosol particlescollected off the coast of Australia, where the iron contentfrom Australian soils is predicted to be 50% higher than theglobal average [Hand et al., 2004].
4.2. Dust Deposition to the Oceans
[41] There have been a variety of estimates of dustdeposition to the oceans broadly falling into two groups,the first based on extrapolation of measurements [e.g., Duceet al., 1991] and the second based on modeling [e.g., Tegenand Fung, 1995] with some approaches based on refine-ments and combinations of the two approaches [Gao et al.,2001]. In all these methods, an aerosol field is estimated andthe flux derived by some sort of parameterization ofdeposition. Hence the key uncertainties arise in estimationsof the dust concentrations and in parameterization of depo-sition. The various approaches all yield broadly similarfluxes (Table 1) which might suggest that total dust depo-sition amounts to different basins are fairly well understood.It should be noted, however, that many models are calibratedand to some extent tuned against the field data. Thus theapparent agreement is not a good test of the accuracy ofour assessments. Global maps of aerosol abundance fromsatellites [e.g., Husar et al., 1997] provide an approximatecheck on the aerosol distribution pattern though this islargely qualitative. The uncertainties of any of theseapproaches is likely to be of order a factor of 10, due touncertainties in sources, deposition, dust distribution as wellas uncertainties due to the high temporal and spatialvariability in dust.[42] One independent method with which to check the
validity of the flux estimates and/or the deposition velocitiesis to compare these with directly estimated ocean fluxesusing deep ocean sediment traps. This has been done in asemi-quantitative manner on a global scale [e.g., Mahowaldet al., 1999] and quantitatively at particular stations [e.g.,Jickells et al., 1998; Uematsu et al., 2003; Bory andNewton, 2000]. The use of sediment trap data requires thatthe traps are deployed so as to avoid advective or resus-pended sediment fluxes and are free of hydrodynamicartifacts; hence traps must be located in deep water wellabove the sediments and well away from ocean margins.Sediment trap fluxes are highly variable in time in associ-ation with biological cycles in surface waters; indeed dustmay contribute to the flux pattern itself by acting as ballastfor downward ocean fluxes [Francois et al., 2002]. Dustfluxes in the water column vary depending on the localbiological productivity [Bory and Newton, 2000] and henceinterpreting sediment trap data is difficult. Additionally,advection of dust in surface waters before being depositedin the sediment trap increase the uncertainty associated withsediment traps [Siegel and Deuser, 1997]. In areas far away
from dust sources, the dust component of sediment trapsamples will be very small, which can lead to large errors inestimated fluxes. Aluminosilicate fluxes to sediment trapsare usually determined by difference between total fluxesand those from the biogenic components organic C, CaCO3,and opal [e.g., Jickells et al., 1998]. Consequently estimatesare particularly uncertain at low dust fluxes. Differences inlocal dust composition can also contribute to uncertaintiesin estimates of total dust deposition. For example, Al isoften used as an indicator of dust; consequently, largesystematic errors will result if an inappropriate dust/Al ratiois used [e.g., Tindale and Pease, 1999].[43] Figure 2 shows a comparison of a model composite
of dust fluxes to the ocean [Jickells et al., 2005] andcompiled sediment trap data [Kohfeld and Harrison,2001] (some of which suffer from some of the problemsidentified above). This model composite is an average ofthree model frameworks including more than 10 years offorecast center winds-based simulations with extensivecomparison to available in situ and satellite observations[Jickells et al., 2005; Luo et al., 2003; Ginoux et al., 2004;Tegen et al., 2004]. The model and sediment trap consis-tency suggests this estimate of dust deposition is a goodextrapolation of available data, within the factor or 10uncertainty in dust fluxes.
4.3. Chemistry and Solubility of Iron in Dust
[44] Not all iron is bioavailable in the ocean. Mostresearchers focus on soluble iron, which is usually consid-ered to be Fe(II), although other forms of iron may also bebioavailable [e.g., Barbeau et al., 2001]. Indeed, Fe(II) maynot always be available [e.g., Visser et al., 2003]. Solubleiron in soils represents about 0.5% of total iron [Fung et al.,2000; Hand et al., 2004]. But measurements of iron inaerosols suggest a much higher solubility [e.g., Zhuang etal., 1992], implying substantial atmospheric processing.Soluble iron fractions reported in different experimentaldata sets are summarized in auxiliary Table S3. Solubilitiesrange from 0.01% to 80% and are highly heterogeneous inspace and time. The measurements in auxiliary Table S3were made by a variety of techniques and different mea-surement techniques will yield different values of ironsolubility (see Spokes and Jickells [1996] example in table).There is still no consensus about which method yields thevalue of iron solubility most appropriate for the in situseawater environment. Additionally, some of the early workmay be biased because of the photoreduction of iron in theaerosol suspension exposed to the sun (e.g., see Zhu et al.[1997] for discussion). Fine mode aerosols (<2.5 mm) tendto yield larger iron solubilities than coarse mode aerosols(>2.5mm) [e.g., Siefert et al., 1999]. Solubility may beenhanced by higher net acid concentrations in fine modeaerosol, but there is no observable relationship between ironsolubility and acid species concentrations in any aerosolfraction [Hand et al., 2004; Baker et al., 2005]. Hand et al.[2004] found that the longer lifetime of fine mode particlescould explain the differences in solubility. Mineral aerosolsin rainwater tends to have iron solubilities (between 4 and26%) in regions close to industrial regions (reviewed byJickells and Spokes [2001], Kieber et al. [2001], and Ozsoy
GB4025 MAHOWALD ET AL.: ATMOSPHERIC IRON DEPOSITION
9 of 15
GB4025

and Saydam [2001]), and values as high as 50% nearBermuda [Kieber et al., 2003].[45] Although it is clear that atmospheric processing
changes the solubility of iron as it moves from the sourcesregions to be deposited in oceans, it is not clear the relativeimportance of different mechanisms. Several studies haveemphasized that photochemical and cloud processes inthe atmosphere can modify iron solubility of desert dust[Jickells and Spokes, 2001; Desboeufs et al., 2001; Handet al., 2004]. Laboratory studies suggest that reactions ofiron with other aerosol species in solution could be veryimportant in the enhancement of the bioavailable iron.Reactions of ferric iron with organic species such as oxalicacid could play a significant role in producing soluble iron[e.g., Zuo and Hoigne, 1992; Zhu et al., 1993; Pehkonen etal., 1993; Siefert et al., 1994; Zuo, 1995]. Oxalic acid hasanthropogenic sources such as incomplete combustion,
ozonolysis and photooxidation of hydrocarbons and iscommon in cloud water [Warneck, 2000]. Saydam andSenyuva [2002] found increases in soluble iron during in-cloud photochemical reductions with oxalate and suggestedthat soil fungi were a natural source of oxalate. Inorganicaerosol solutions can also be important if mineral aerosolsare coated with hygroscopic species such as sulfates andnitrates [e.g., Zhuang et al., 1992; Zhu et al., 1992]. Cyclesof evaporation and condensation can result in very acidicsolutions with high ionic strengths and can enhance thesolubilization of Fe by photoreduction of Fe(III) [Zhu et al.,1997]. Recent studies have suggested that pollution fromAsia increases iron solubility [Meskhidze et al., 2005; Boyleet al., 2005], inconsistent with previous lower solubilities inthe Pacific than the Atlantic [Hand et al., 2004], butconsistent with the recent high iron solubility measurementsin the Pacific [Ying, 2004]. In situ aerosol data does not
Figure 2. Desert dust deposition (g/m2/yr) estimated from an average of three reanalysis based modelssimulated for 10+ years [Luo et al., 2003; Ginoux et al., 2004; Tegen et al., 2004], and representing ourbest estimate of dust deposition. Models compare well to available in situ and satellite observations andare shown here compared against sediment trap data [Kohfeld and Harrison, 2001]. See color version ofthis figure at back of this issue.
GB4025 MAHOWALD ET AL.: ATMOSPHERIC IRON DEPOSITION
10 of 15
GB4025

support a clear relationship between either oxalic acids orsulfuric acids and iron solubility [Chen and Siefert, 2004;Hand et al., 2004]. While photochemical reduction in dustaerosols over the Atlantic can yield significant concentra-tions of Fe(II) in situ, Fe(II) comprises only a very smallfraction of the total soluble iron and the total soluble irondoes not seem to be related to Fe(II) concentrations [Zhu etal., 1997]. Modeling studies based on cloud processing andphotolytic reactions have been unable to account for thegreat variability seen in observations; the models howeverdid yield higher solubilities for fine particles, similar toobservations, and attribute it to the longer residence time[Hand et al., 2004]. Baker et al. [2005] suggest that Fesolubility may be systematically higher in areas remote fromthe desert dust plumes. Clearly we need much more study ofthe atmospheric processes that convert insoluble iron tosoluble iron.[46] Attempts have also been made to constrain the
soluble iron amounts based on measurements in the oceanto complement the direct atmospheric measurements.Jickells and Spokes [2001] made some simple ocean modelcalculations to estimate the amount of soluble iron depos-ited to the oceans. Adapting the Lefevre and Watson [1999]model to estimate overall atmospheric iron, they obtained aniron solubility estimate of 2%. Aluminium solubility isgenerally found to be somewhat higher than that of iron[e.g., Spokes and Jickells, 1996; Desboeufs et al., 2001;Baker et al., 2005]. Vink and Measures [2001] estimated anoverall aluminium solubility of 3.25%, which suggests aniron solubility similar to that calculated by Jickells andSpokes [2001]. In a rather detailed investigation of alumin-ium solubility Gehlen et al. [2003] considered a wide rangeof aluminium solubilties from dust and concluded that 1.5–3% best fitted the available data. The model of Archer andJohnson [2000] required the bioavailability of aerosol iron(which assumes that the bioavailability of aerosol iron isrelated to solubility) to be in the range of 2–12% dependingon which atmospheric dust deposition simulation they used.Fung et al. [2000] assumed 1–10% solubility. Wu andBoyle [2002] report an iron solubility of 1% and Bopp etal. [2003] also assumed a 1% solubility.[47] The uncertainty in the solubility of iron from dust is
at least as important as the uncertainty and variability indust fluxes themselves in determining the overall uncertaintyof atmospheric bioavailable iron inputs to the oceans. Thuswe require an improved understanding of the solubility ofiron being deposited in mineral aerosols, as well as theatmospheric processing influencing iron solubility. Thesituation is further complicated once the mineral aerosolhits the surface ocean. Soluble iron delivered to the oceansfrom the atmosphere undergoes a dramatic change inphysico-chemical environment. The effect of this on thebioavailablity of atmospheric delivered iron is poorlyknown [Jickells et al., 2005].
5. Summary and Conclusions
[48] This assessment has focused entirely on desert dustsources that clearly dominate the global total iron/dustcycle. However, there are additional sources of iron emis-
sions. In their review of crustal enrichment factors, Wiersmaand Davidson [1986] reported an average enrichment factorfor iron of 1.3 which implies that there are additionalnoncrustal sources (although this factor could be higher orlower in some regions). Iron from other sources, such asanthropogenic [Spokes and Jickells, 2002], meteoritic[Johnson, 2001] or volcanic sources [Benitez-Nelson etal., 2003], is likely to be in the form of iron oxides ratherthan aluminosilicate phases and hence potentially moresoluble [Jickells and Spokes, 2001; Desboeufs et al.,2001]. Consequently these sources may contribute dispro-portionately to the soluble iron input. If industrial sources ofiron aerosols are significant, it means that in addition toperturbing the iron cycle by changing dust source produc-tion, we may be influencing it by human activity thatproduces modest amounts of relatively soluble iron. Moredata is required to address the importance of alternativesources of iron.[49] In order to understand how atmospheric iron will
impact biogeochemistry in the future we need to improveour understanding of the following areas: (1) characteriza-tion of deposition of iron to remote regions of the oceans;(2) characterization of iron chemistry, including solubility,in aerosols and precipitation in remote regions; (3) charac-terization of desert dust source regions and their response tohumans and climate change; and (4) how deposition bio-availability of iron will change with climate and humanactivity. The answers to all these questions are poorlyconstrained because of a dearth of observations. We havefew observations of dust deposition in ocean environments,including the relative importance of wet and dry deposition.Additionally, there are few observations of iron solubilityglobally. Also we do not understand the processes thatcontrol how iron becomes more soluble in the atmosphere.More observations of dust concentration, deposition andiron solubility content are required in the remote oceanregions of the world.[50] Furthermore, we need to improve our dust models
that are essential to extrapolate our limited observations toglobal scales. In order to improve dust models we need abetter understanding of dust source processes. One strategywould be to focus on major dust sources. Satellites can beused to identify sources in a variety of different terrains andenvironments, including those potentially impacted byhuman activities or climate change. Initial studies of theseregions would be based on satellite products and supportinginformation on population, industrial and agricultural activ-ities. These would be followed up by field expeditions to aselected subset of these sites. In addition to measurementsrelated to the terrain and micrometeorological aspects of thestudy, aerosol chemical/physical properties and related soilcharacteristics should be studied. Measurements of opticalproperties of the soil and suspended dust particles should becombined with remote sensing retrievals of dust to developimproved algorithms for soil aerosols. Although dust sour-ces in the Southern Hemisphere are relatively small com-pared to those in the Northern Hemisphere, they warrantstudy because they could have a disproportionate impact onocean productivity due to their proximity to the large HNLCareas in the southern oceans. In contrast the large dust
GB4025 MAHOWALD ET AL.: ATMOSPHERIC IRON DEPOSITION
11 of 15
GB4025

sources in the Northern Hemisphere warrant study alsobecause of their impact on radiative forcing and the impacton nitrogen fixing organisms [Falkowski et al., 1998].[51] Model predictions of dust deposition in remote
regions are also uncertain owing to the long travel timeand the consequent accumulation of errors in models. Oneof the great sources of uncertainty in estimating wetdeposition of dust is our lack of knowledge about dust-cloud microphysics and precipitation formation processes.This problem could be partly addressed with more measure-ments of dust deposition as suggested above. Even so, thereremains a major problem in model estimates because of theway in which they treat precipitation. Because in globalmodels much precipitation occurs in sub-grid-scale events,the precipitation process and the consequent aerosol removalis highly parameterized. Thus we need improvement inparameterizations of cloud aerosols interactions, as well asthe resulting aerosol wet deposition in models. Dust model-ing studies as well as observational studies need to includeuncertainty estimates so that we are better able to focus oncritical processes in future studies in order to reduce ouruncertainty.[52] Dust models need to include iron chemistry and
solubility processes. This requires additional observationsof iron solubility and the processes controlling it. Only onemodeling study has been published that includes ironsolubility [Hand et al., 2004]; clearly more work is requiredin this direction.[53] Finally we need to understand how dust sources,
transport, deposition and solubility might change in thefuture. This can best be done by understanding how theseprocesses changed in the past with changing climate. Thiscould be addressed by focusing on a few dust source regionsin transitional environments. These would be monitored forchanges over decade-long timescales to see how theyrespond to weather and climate variability and to climatechange. It would be very interesting to see if we canretrospectively look at the dust variability over North Africaover the past decades to see if this can be linked to specificsource regions or processes. Some attempts have been madein this direction, but more work is necessary to fullyunderstand source change processes.
[54] Acknowledgments. This paper is the result of an IGBP Fasttrackmeeting in April 2004 at UEA, UK. We would like to thank Paul Ginouxfor making available model data sets, and Chao Luo for help with figures.The authors would like to extend their thanks to ICSU, UNESCO, NSF(GEO-0402845 and OCE-0228863), IGBP and SCOR for partial support ofthis work. This paper was improved by the comments of two anonymousreviewers, and Doug Mackie. N. M. would like to acknowledge support ofNSF-Biocomplexity (OCE-9981398).
ReferencesAlfaro, S., and L. Gomes (2001), Modeling mineral aerosol production bywind erosion: Emission intensities and aerosol size distributions in sourceareas, J. Geophys. Res., 106(D16), 18,075–18,084.
Alfaro, S., A. Gaudichet, L. Gomes, and M. Maille (1997), Modeling thesize distribution of a soil aerosol produced by sandblasting, J. Geophys.Res., 102(D10), 11,239–11,249.
Andersen, K. K., A. Armengaud, and C. Genthon (1998), Atmospheric dustunder glacial and interglacial conditions, Geophys. Res. Lett., 25, 2281–2284.
Archer, D. E., and K. Johnson (2000), A model of the iron cycle in theocean, Global Biogeochem. Cycles, 14(1), 269–279.
Archer, D., A. Winguth, D. Lea, and N. Mahowald (2000), What caused theglacial/interglacial atmospheric pCO(2) cycles?, Rev. Geophys., 38(2),159–189.
Arimoto, R., B. J. Ray, R. A. Duce, A. D. Hewitt, R. Boldi, and A. Hudson(1990), Concentrations, sources and fluxes of trace elements in theremote marine atmosphere of New Zealand, J. Geophys. Res., 95(D13),22,389–22,405.
Arimoto, R., B. J. Ray, N. F. Lewis, U. Tomza, and R. A. Duce (1997),Mass-particle size distributions of atmospheric dust and the dry deposi-tion of dust to the remote ocean, J. Geophys. Res., 102(D13), 15,867–15,874.
Bagnold, R. A. (1941), The Physics of Blown Sand and Desert Dunes, 265pp., Methuen, New York.
Baker, A. R., T. D. Jickells, M. Witt, and K. L. Linge (2005), Trends in thesolubility of iron, aluminium, manganese and phosphorus in aerosolcollected over the Atlantic Ocean, Mar. Chem., in press.
Barbeau, K., E. Rue, K. Bruland, and A. Butler (2001), Photochemicalcycling of iron in the surface ocean mediated by microbial iron (III)-binding ligands, Nature, 413, 409–413.
Barnaba, F., and G. P. Gobbi (2004), Aerosol seasonal variability over theMediterranean region and relative impact of maritime, continental andSaharan dust particles over the basin from MODIS data in the year 2001,Atmos. Chem. Phys. Discuss., 4, 4285–4337.
Benitez-Nelson, C. R., S. M. Vink, J. H. Carillo, and B. J. Huebert (2003),Volcanically influenced iron and aluminum cloud water deposition toHawaii, Atmos. Environ., 37, 535–544.
Bettis, E. A., D. R. Muhs, H. M. Roberts, and A. G. Wintle (2003),Last glacial loess in the conterminous USA, Quat. Sci. Rev., 22, 1907–1946.
Betzer, P. R., et al. (1988), A pulse of Asian dust to the central NorthPacific: Long range transport of giant mineral aerosol particles, Nature,336, 568–570.
Bopp, L., K. E. Kohfeld, C. Le Quere, and O. Aumont (2003), Dustimpact on marine biota and atmospheric CO2 during glacial periods,Paleoceanography, 18(2), 1046, doi:10.1029/2002PA000810.
Bory, A. J.-M., and P. P. Newton (2000), Transport of airborne lithogenicmaterial down through the water column in two contrasting regions of theeastern subtropical North Atlantic Ocean, Global Biogeochem. Cycles,14(1), 297–315.
Boyle, E. A., B. Bergquist, R. Kayser, and N. Mahowald (2005), Iron,manganese and lead at Hawaii Ocean Time-series Station ALOHA:Temporal variability and an intermediate water hydrothermal plume,Geochem. Cosmochim. Acta, 69(4), doi:10.1016/j.gca.2004.07.034,933–952.
Brooks, N. (2000), Dust-Climate Interactions in the Sahel-Sahara Zone ofNorthern Africa, with Particular Reference to Late Twentieth CenturySahelian Drought, Ph.D. thesis, Clim. Res. Unit, Univ. of East Anglia,Norwich, UK.
Brooks, N., and M. Legrand (2000), Dust variability over northern Africaand rainfall in the Sahel, in Linking Climate Change to Land SurfaceChange, edited by S. J. McLaren and D. Kniveton, pp. 1–25, Springer,New York.
Bullard, J. E., G. H. McTainsh, and C. Pudmenzky (2004), Aeolian abra-sion and modes of fine particle production from natural red dune sands:An experimental study, Sedimentology, 51, 1103–1125.
Chen, Y., and R. L. Siefert (2004), Seasonal and spatial distributions ofatmospheric total and labile iron over the tropical and subtropical NorthAtlantic Ocean, J. Geophys. Res., 109, D09305, doi:10.1029/2003JD003958.
Chepil, W. S. (1945), Dynamics of wind erosion, Soil Sci., 60, 305–320,397–411, 475–480.
Chin, M., et al. (2003), A global aerosol model forecast for the ACE-Asiafield experiment, J. Geophys. Res., 108(D23), 8654, doi:10.1029/2003JD003642.
Claquin, T., M. Schulz, and Y. Balkanski (1999), Modeling the mineralogyof atmospheric dust sources, J. Geophys. Res., 104(D18), 22,243–22,256.
Colarco, P., O. B. Toon, O. Torres, and P. J. Rasch (2002), Determining theUV imaginary index of refraction of Saharan dust particles from TotalOzone Mapping Spectrometer data using a three-dimensional model ofdust transport, J. Geophys. Res., 107(D16), 4289, doi:10.1029/2001JD000903.
DeAngelis, M., J. P. Steffensen, M. Legrand, H. Clausen, and C. Hammer(1997), Primary aerosol (sea salt and soil dust) deposited in Greenland iceduring the last climatic cycle: Comparison with east Antarctic records,J. Geophys. Res., 102(C12), 26,681–26,698.
deMenocal, P., J. Ortiz, T. Guilderson, J. Adkins, M. Sarnthein, L. Baker,and M. Yarusinksy (2000), Abrupt onset and termination of the African
GB4025 MAHOWALD ET AL.: ATMOSPHERIC IRON DEPOSITION
12 of 15
GB4025

Humid Period: Rapid climate responses to gradual insolation forcing,Quat. Sci. Rev., 19, 347–361.
Desboeufs, K. V., R. Losno, and J. L. Colin (2001), Factors influencingaerosol solubility during cloud processes, Atmos. Environ., 35, 3529–3537.
Duce, R. A., and N. W. Tindale (1991), The atmospheric transport of ironand its deposition in the ocean, Limnol. Oceanogr., 36, 1715–1726.
Duce, R. A., et al. (1991), The atmospheric input of trace species to theworld ocean, Global Biogeochem. Cycles, 5(3), 193–259.
Engelstaedter, S., K. E. Kohfeld, I. Tegen, and S. P. Harrison (2003), Con-trols of dust emissions by vegetation and topographic depressions: Anevaluation using dust storm frequency data, Geophys. Res. Lett., 30(6),1294, doi:10.1029/2002GL016471.
Falkowski, P. G., R. T. Barber, and V. Smetacek (1998), Biogeochemicalcontrols and feedbacks on ocean primary production, Science, 281, 200–206.
Fan, S.-M., L. Horowitz, H. Levy, and W. Moxim (2004), Impact of airpollution on wet deposition of mineral dust aerosols, Geophys. Res. Lett.,31, L02104, doi:10.1029/2003GL018501.
Fecan, F., B. Marticorena, and G. Bergametti (1999), Parameterization ofthe increase of the aeolian erosion threshold wind friction due to soilmoisture for semi arid areas, Ann. Geophys., 17, 149–157.
Francois, R., S. Honjo, R. Krishfield, and S. Manganini (2002), Factorscontrolling the flux of organic carbon to the bathypelagic zone of theocean, Global Biogeochem. Cycles, 16(4), 1087, doi:10.1029/2001GB001722.
Fung, I. Y., S. K. Meyn, I. Tegen, S. C. Doney, J. G. John, and J. K. B.Bishop (2000), Iron supply and demand in the upper ocean, GlobalBiogeochem. Cycles, 14(2), 697–700.
Gao, Y., Y. J. Kaufman, D. Tanre, D. Kolber, and P. G. Falkowski (2001),Seasonal distributions of aeolian iron fluxes to the global ocean, Geo-phys. Res. Lett., 28(1), 29–32.
Garratt, J. R. (1992), The Atmospheric Boundary Layer, 316 pp., Cam-bridge Univ. Press, New York.
Gehlen, M., C. Heinze, E. Maier-Reimer, and C. I. Measures (2003),Coupled Al-Si geochemistry in an ocean general circulation model: Atool for the validation of oceanic dust deposition fields?, Global Biogeo-chem. Cycles, 17(1), 1028, doi:10.1029/2001GB001549.
Gillette, D. A. (1974), On the production of soil wind erosion aerosolshaving the potential for long range transport, J. Rech. Atmos., 8, 735–744.
Gillette, D. A. (1979), Environmental factors affecting dust emission bywind erosion, in Saharan Dust, edited by C. Morales, pp. 71–94, JohnWiley, Hoboken, N. J.
Gillette, D. (1999), A qualitative geophysical explanation for ‘‘hot spot’’dust source regions, Contrib. Atmos. Phys., 72, 67–77.
Gillette, D. A., and R. Passi (1988), Modeling dust emission caused bywind erosion, J. Geophys. Res., 93(D11), 14,233–14,242.
Ginoux, P. (2003), Effects of nonsphericity on mineral dust modeling,J. Geophys. Res., 108(D2), 4052, doi:10.1029/2002JD002516.
Ginoux, P., and O. Torres (2003), Empirical TOMS index for dust aerosol:Applications to model validation and source characterization, J. Geophys.Res., 108(D17), 4534, doi:10.1029/2003JD003470.
Ginoux, P., M. Chin, I. Tegen, J. Prospero, B. Holben, O. Dubovik, andS.-J. Lin (2001), Global simulation of dust in the troposphere: Modeldescription and assessment, J. Geophys. Res., 106(D17), 20,255–20,273.
Ginoux, P., J. M. Prospero, O. Torres, and M. Chin (2004), Long-termsimulation of global dust distribution with the GOCART model: Correla-tion with the North Atlantic Oscillation, Environ. Model. Software, 19,113–128.
Gomes, L., G. Bergametti, G. Coude-Gaussen, and P. Rognon (1990),Submicron desert dust: A sandblasting process, J. Geophys. Res.,95(D9), 13,927–13,935.
Goudie, A. S., and N. J. Middleton (1992), The changing frequency of duststorms through time, Clim. Change, 20, 197–225.
Goudie, A., and N. Middleton (2001), Saharan dust storms: nature andconsequences, Earth Sci. Rev., 56, 179–204.
Greeley, R., and J. D. Iversen (1985),Wind as aGeological Process on Earth,Mars, Venus and Titan, 333 pp., Cambridge Univ. Press, New York.
Grini, A., and C. S. Zender (2004), Roles of saltation, sandblasting, andwind speed variability on mineral dust aerosol size distribution during thePuerto Rican Dust Experiment (PRIDE), J. Geophys. Res., 109, D07202,doi:10.1029/2003JD004233.
Grousset, F. E., P. Ginoux, A. Bory, et al. (2003), Case study of a Chinesedust plume reaching the French Alps, Geophys. Res. Lett., 30(6), 1277,doi:10.1029/2002GL016833.
Hand, J. L., N. Mahowald, Y. Chen, R. Siefert, C. Luo, A. Subramaniam,and I. Fung (2004), Estimates of soluble iron from observations and a
global mineral aerosol model: Biogeochemical implications, J. Geophys.Res., 109, D17205, doi:10.1029/2004JD004574.
Herman, J. R., P. K. Bhartia, O. Torres, C. Hsu, C. Seftor, and E. Celarier(1997), Global distribution of UV-absorbing aerosols from Nimbus7/TOMS data, J. Geophys. Res., 102(D14), 16,911–16,922.
Husar, R. B., J. M. Prospero, and L. Stowe (1997), Characterization oftropospheric aerosols over the oceans with the NOAA advanced veryhigh resolution radiometer optical thickness operational product, J. Geo-phys. Res., 102(D14), 16,889–16,909.
Iversen, J. D., and B. R. White (1982), Saltation threshold on Earth, Marsand Venus, Sedimentology, 29, 111–119.
Iversen, J. D., J. B. Pollack, R. Greeley, and B. R. White (1976), Saltationthreshold on Mars: The effect on interparticle force, surface roughness,and low atmospheric density, Icarus, 29, 381–393.
Jickells, T. D., and L. Spokes (2001), Atmospheric iron inputs to the ocean,in Biogeochemistry of Iron in Seawater, edited by D. Turner and K. A.Hunter, pp. 85–121, John Wiley, Hoboken, N. J.
Jickells, T. D., S. Dorling, W. G. Deuser, T. M. Church, R. Arimoto, andJ. M. Prospero (1998), Air-borne dust fluxes to a deep water sedimenttrap in the Sargasso Sea, Global Biogeochem. Cycles, 12(2), 311–320.
Jickells, T., et al. (2005), Global iron connections between dust, oceanbiogeochemistry and climate, Science, 308, 67–71.
Johnson, K. (2001), Iron supply and demand in the upper ocean: Is extra-terrestrial dust a significant source of bioavailable iron?, Global Biogeo-chem. Cycles, 15, 61–63.
Joussaume, S. (1990), Three-dimensional simulations of the atmosphericcycle of desert dust particles using a general circulation model, J. Geo-phys. Res., 95(D2), 1909–1941.
Joussaume, S. (1993), Paleoclimate tracers: An investigation using an atmo-spheric general circulation model under ice age conditions: 1. Desertdust, J. Geophys. Res., 98(D2), 2767–2805.
Kardous, M., G. Bergametti, and B. Marticorena (2005), Aerodynamicroughness length related to tillage ridges of the semi-arid regions, J. SoilWater Conserv., in press.
Kaufman, Y., I. Koren, L. A. Remer, D. Tanre, P. Ginoux, and S. Fan(2005), Dust transport and deposition observed from the Terra-MODISspacecraft over the Atlantic Ocean, J. Geophys. Res., 110, D10S12,doi:10.1029/2003JD004436.
Kieber, R. J., K. Williams, J. D. Willey, S. Skrabal, and G. B. Avery (2001),Iron speciation in coastal rainwater: Concentration and deposition to sea-water, Mar. Chem., 73, 83–95.
Kieber, R. J., J. D. Willey, and G. B. Avery (2003), Temporal variability ofrainwater iron speciation at the Bermuda Atlantic time series station,J. Geophys. Res., 108(C8), 3277, doi:10.1029/2001JC001031.
Kohfeld, K., and S. P. Harrison (2001), DIRTMAP: The geologic record ofdust, Earth Sci. Rev., 54, 81–114.
Koren, I., and Y. Kaufman (2004), Direct wind measurements of Saharandust events from Terra and Aqua satellites, Geophys. Res. Lett., 31,L06122, doi:10.1029/2003GL019338.
Koretsky, C., D. Sverjensky, J. Salisbury, and D. D’Aria (1997), Detectionof surface hydroxyl species on quartz, gamm-alumina and feldspar usingdiffuse reflectance infrared spectroscopy, Geochim. Cosmochim. Acta,61, 2193–2210.
Lefevre, N., and A. J. Watson (1999), Modeling the geochemical cycle ofiron in the oceans and its impact on atmospheric CO2 concentrations,Global Biogeochem. Cycles, 13(3), 727–736.
Legrand, M. (1995), Atmospheric chemistry changes versus past climateinferred from polar ice cores, in Aerosol Forcing of Climate, edited byR. Charlson and J. Heintzenberg, pp. 123–152, JohnWiley, Hoboken, N. J.
Legrand, M., C. N’Doume, and I. Jankowiak (1994), Satellite-derived cli-matology of the Saharan aerosol, in Passive Infrared Remote Sensing ofClouds and the Atmosphere II, edited by D. K. Lynch, Proc. SPIE Int.Soc. Opt. Eng., 2309, 127–135.
Lunt, D. J., and P. J. Valdes (2002), Dust deposition and provenance at theLast Glacial Maximum and present day, Geophys. Res. Lett., 29(22),2085, doi:10.1029/2002GL015656.
Luo, C., N. Mahowald, and J. del Corral (2003), Sensitivity study ofmeteorological parameters on mineral aerosol mobilization, transportand distribution, J. Geophys. Res., 108(D15), 4447, doi:10.1029/2003JD003483.
Mahowald, N., and J.-L. Dufresne (2004), Sensitivity of TOMS AI toPBLH: Implications for detection of mineral aerosol sources, Geophys.Res. Lett., 31, L03103, doi:10.1029/2003GL018865.
Mahowald, N., and C. Luo (2003), A less dusty future?, Geophys. Res.Lett., 30(17), 1903, doi:10.1029/2003GL017880.
Mahowald, N., K. E. Kohfeld, M. Hansson, Y. Balkanski, S. P. Harrison,I. C. Prentice, M. Schulz, and H. Rohde (1999), Dust sources and deposi-tion during the Last Glacial Maximum and current climate: A comparison
GB4025 MAHOWALD ET AL.: ATMOSPHERIC IRON DEPOSITION
13 of 15
GB4025

of model results with paleodata from ice cores and marine sediments,J. Geophys. Res., 104(D13), 15,895–16,436.
Mahowald, N., C. Zender, C. Luo, D. Savoie, O. Torres, and J. del Corral(2002), Understanding the 30-year Barbados desert dust record, J. Geo-phys. Res., 107(D21), 4561, doi:10.1029/2002JD002097.
Mahowald, N., C. Luo, J. del Corral, and C. Zender (2003), Interannualvariability in atmospheric mineral aerosols from a 22-year model simula-tion and observational data, J. Geophys. Res., 108(D12), 4352,doi:10.1029/2002JD002821.
Mahowald, N., et al. (2004), Comment on ‘‘Relative importance of climateand land use in determining present and future global soil dust emission,’’Geophys. Res. Lett., 31, L24105, doi:10.1029/2004GL021272.
Maring, J., D. Savoie, M. Izaguirre, L. Custals, and J. Reid (2003), Mineraldust aerosol size distribution change during atmospheric transport,J. Geophys. Res., 108(D19), 8592, doi:10.1029/2002JD002536.
Marshall, J. K. (1971), Drag measurements in roughness arrays of varyingdensity and distribution, Agric. Meteorol., 8, 269–292.
Marticorena, B., and G. Bergametti (1995), Modeling the atmospheric dustcycle: 1. Design of a soil-derived dust emission scheme, J. Geophys. Res.,100(D8), 16,415–16,430.
Marticorena, B., G. Bergametti, B. Aumont, Y. Callot, C. N’Doume, andM. Legrand (1997), Modeling the atmospheric dust cycle: 2. Simulationof Saharan dust sources, J. Geophys. Res., 102(D4), 4387–4404.
Martin, J. H. (1990), Glacial-interglacial CO2 change: The iron hypothesis,Paleoceanography, 5(1), 1–13.
Meskhidze, N., et al. (2005), Dust and pollution: A recipe for enhanced oceanfertilization?, J. Geophys. Res., 110, D03301, doi:10.1029/2004JD005082.
Mills, M., C. Ridame, M. Davey, J. La Rouche, and R. Geider (2004), Ironand phosphorus co-limit nitrogen fixation in the eastern tropical NorthAtlantic, Nature, 429, 292–294.
Nicholson, S. E., and C. J. Tucker (1998), Desertification, drought, andsurface vegetation: An example from the West African Sahel, Bull. Am.Meteorol. Soc., 79(5), 815–829.
Nickovic, S., and S. Dobricic (1996), A model for long-range transport ofdesert dust, Mon. Weather Rev., 124, 2537–2544.
N’Tchayi, G. M., J. Bertrand, M. Legrand, and J. Baudet (1994), Temporaland spatial variations of the atmospheric dust loading throughout WestAfrica over the last thirty years, Ann. Geophys., 12, 265–273.
N’Tchayi, G. M., J. J. Bertrand, and S. E. Nicholson (1997), The diurnaland seasonal cycles of wind-borne dust over Africa north of the equator,J. Appl. Meteorol., 36, 868–882.
Ozsoy, T., and A. C. Saydam (2001), Iron speciation in precipitation in theNorth-Eastern Mediterranean and its relationship with Sahara dust,J. Atmos. Chem., 40, 41–76.
Pehkonen, S., R. Siefert, Y. Erel, S. Webb, and M. Hoffman (1993), Photo-reduction of iron oxyhydroxides in the presence of important atmosphericorganic compounds, Environ. Sci. Technol., 27, 2056–2062.
Perry, K. D., T. A. Cahill, R. A. Eldred, and D. D. Dutcher (1997), Long-range transport of North African dust to the eastern United States,J. Geophys. Res., 102(D10), 11,225–11,238.
Petit, J. R., L. Mounier, J. Jouzel, Y. S. Korotkevich, V. I. Kotlyakov, andC. Lorius (1990), Palaeoclimatological and chronological implications ofthe Vostok core dust record, Nature, 343, 56–58.
Prince, S. D., E. B. DecColstoun, and L. L. Kravitz (1998), Evidence fromrain-use efficiencies does not indicate extensive Sahelian desertification,Global Change Biol., 4, 259–274.
Prospero, J. M. (1996), The atmospheric transport of particles to the ocean,in Particle Flux in the Ocean, edited by V. Ittekkot et. al., pp. 19–52,John Wiley, Hoboken, N. J.
Prospero, J. M. (1999), Long-range transport of mineral dust in the globalatmosphere: Impact of African dust on the environment of the south-eastern United States, Proc. Natl. Acad. Sci., 96, 3396–3403.
Prospero, J., and P. Lamb (2003), African droughts and dust transport to theCaribbean: Climate change implications, Science, 302, 1024–1027.
Prospero, J. M., and R. T. Nees (1986), Impact of the North African droughtand El Nino on mineral dust in the Barbados trade winds, Nature, 320,735–738.
Prospero, J. M., P. Ginoux, O. Torres, S. E. Nicholson, and T. E. Gill(2002), Environmental characterization of global sources of atmosphericsoil dust identified with the NIMBUS 7 TOMS absorbing aerosol pro-duct, Rev. Geophys., 40(1), 1002, doi:10.1029/2000RG000095.
Prospero, J. M., D. L. Savoie, and R. Arimoto (2003), Long-term recordof nss-sulfate and nitrate in aerosols on Midway Island, 1981–2000:Evidence of increased (now decreasing?) anthropogenic emissions fromAsia, J. Geophys. Res., 108(D1), 4019, doi:10.1029/2001JD001524.
Rasch, P. J., et al. (2000), A comparison of scavenging and deposition inglobal models from the WCRP Cambridge Workshop of 1995, Tellus,Ser. B, 52, 1025–1056.
Rasch, P. J., W. D. Collins, and B. E. Eaton (2001), Understanding theIndian Ocean Experiment (INDOEX) aerosol distributions with an aero-sol assimilation, J. Geophys. Res., 106(D7), 7337–7355.
Rea, D. K. (1994), The paleoclimatic record provided by eolian depositionin the deep sea: The geologic history of wind, Rev. Geophys., 32(2),159–195.
Reader, M. C., I. Fung, and N. McFarlane (1999), The mineral dust aerosolcycle during the Last Glacial Maximum, J. Geophys. Res., 104(D8),9381–9398.
Reddy, M. S., O. Boucher, N. Bellouin, M. Schulz, Y. Balkanski, J.-L.Dufresne, and M. Pham (2005), Estimates of global multicomponentaerosol optical depth and direct radiative perturbation in the Laboratoirede Meteorologie Dynamique general circulation model, J. Geophys. Res.,110, D10S16, doi:10.1029/2004JD004757.
Reheis, M. (1997), Dust deposition downwind of Owens (dry) Lake, 1991–1994: Preliminary findings, J. Geophys. Res., 102(D22), 25,999–26,008.
Reheis, M. C., J. C. Goodmacher, J. W. Harden, L. D. Mc-Fadden, T. K.Rockwell, R. R. Shroba, J. M. Sowers, and E. M. Taylor (1995), Qua-ternary soils and dust deposition in southern Nevada and California,Geol. Soc. Am. Bull., 107, 1003–1022.
Reid, J. S., et al. (2003), Comparison of size and morphological measure-ments of coarse mode dust particles from Africa, J. Geophys. Res.,108(D19), 8593, doi:10.1029/2002JD002485.
Rosenfeld, D., Y. Rudich, and R. Lahav (2001), Desert dust suppressingprecipitation: A possible desertification feedback loop, Proc. Natl. Acad.Sci. U. S. A., 98, 5979–5980.
Sarthou, G., et al. (2003), Atmospheric iron deposition and sea-surfacedissolved iron concentrations in the east Atlantic, Deep Sea Res., PartI, 50, 1339–1352.
Saydam, A. C., and H. Z. Senyuva (2002), Deserts: Can they be the po-tential suppliers of bioavailable iron?, Geophys. Res. Lett., 29(11), 1524,doi:10.1029/2001GL013562.
Schlesinger, W. H., and N. Gramenopoulos (1996), Archival photographsshow no climate-induced changes in woody vegetation in the Sudan,1943–1994, Global Change Biol., 2, 137–141.
Schlichting, H. (1936), Experimentelle Untersuchungen zum Rauhigkeit-sproblem, Ingr. Arch., 7, 1–34. (English translation, NASA Tech. Memo.,823, 34 pp.)
Schulz, M., Y. Balkanski, W. Guelle, and F. Dulac (1998), Role of aerosolsize distribution and source location in a three-dimensional simulation ofa Saharan dust episode tested against satellite derived optical thickness,J. Geophys. Res., 103(D9), 10,579–10,592.
Shao, Y. (2001), A model for mineral dust emission, J. Geophys. Res.,106(D17), 20,239–20,254.
Shao, Y. (2004), Simplification of a dust emission scheme and comparisonwith data, J. Geophys. Res., 109, D10202, doi:10.1029/2003JD004372.
Shao, Y., M. R. Raupach, and P. A. Findlater (1993), Effect of saltationbombardment on the entrainment of dust by wind, J. Geophys. Res.,98(D7), 12,719–12,726.
Siefert, R. L., S. O. Pehkonen, Y. Erel, and M. R. Hoffman (1994), Ironphotochemistry of aqueous suspensions of ambient aerosol with addedorganic acids, Geochim. Cosmochim. Acta, 58, 3271–3279.
Siefert, R., A. Johansen, and M. Hoffman (1999), Chemical characteriza-tion of ambient aerosol collected during the southwest monsoon andintermonsoon seasons over the Arabian Sea: Labile-Fe(II) and other tracemetals, J. Geophys. Res., 104(D3), 3511–3526.
Siegel, D. A., and W. G. Deuser (1997), Trajectories of sinking particles inthe Sargasso Sea: Modeling of statistical funnels above deep-ocean sedi-ment traps, Deep Sea Res., Part I, 44(9–10), 1519–1541.
Slinn, S. A., and W. G. N. Slinn (1980), Predictions for particle depositionon natural waters, Atmos. Environ., 14, 1013–1016.
Spokes, L. J., and T. D. Jickells (1996), Factors controlling the solubility ofaerosol trace metals in the atmosphere and on mixing into seawater,Aquat. Geochem., 1, 355–374.
Spokes, L., and T. D. Jickells (2002), Speciation of metals in the atmo-sphere, in Chemical Speciation in the Environment, 2nd ed., edited byA. Ure and C. Davidson, pp. 159–187, Blackwell, Malden, Mass.
Steffensen, J. P. (1997), The size distribution of microparticles fromselected segments of the Greenland Ice Core Project ice core representingdifferent climate periods, J. Geophys. Res., 102(C12), 26,755–26,763.
Stephenne, N., and E. F. Lambin (2001), A dynamic simulation model ofland-use changes in Sudano-sahelian countries of Africa (SALU), Agric.Ecosyst. Environ., 85, 145–161.
Sun, J., M. Zhang, and T. Liu (2001), Spatial and temporal characteristics ofdust storms in China and its surrounding regions, 1960–1999: Relationsto source area and climate, J. Geophys. Res., 106(D10), 10,325–10,333.
Taylor, S. R., and S. M. McLennan (1985), The Continental Crust: ItsComposition and Evolution, 312 pp., Blackwell, Malden, Mass.
GB4025 MAHOWALD ET AL.: ATMOSPHERIC IRON DEPOSITION
14 of 15
GB4025

Tegen, I., and I. Fung (1994), Modeling of mineral dust in the atmosphere:Sources, transport, and optical thickness, J. Geophys. Res., 99(D11),22,897–22,914.
Tegen, I., and I. Fung (1995), Contribution to the mineral aerosol load fromland surface modification, J. Geophys. Res., 100(D9), 18,707–18,726.
Tegen, I., and R. Miller (1998), A general circulation model study on theinterannual variability of soil dust aerosol, J. Geophys. Res., 103(D20),25,975–25,995.
Tegen, I., et al. (1996), The influence on climate forcing of mineral aerosolsfrom disturbed soils, Nature, 380, 419–422.
Tegen, I., et al. (1997), Contribution of different aerosol species to theglobal aerosol extinction optical thickness: Estimates from model results,J. Geophys. Res., 102(D20), 23,895–23,915.
Tegen, I., S. P. Harrison, K. E. Kohfeld, I. C. Prentice, M. C. Coe, andM. Heimann (2002), Impact of vegetation and preferential source areason global dust aerosol: Results from a model study, J. Geophys. Res.,107(D21), 4576, doi:10.1029/2001JD000963.
Tegen, I., M. Werner, S. P. Harrison, and K. E. Kohfeld (2004), Relativeimportance of climate and land use in determining present and futureglobal soil dust emission, Geophys. Res. Lett. , 31, L05105,doi:10.1029/2003GL019216.
Thomas, D. S. G. (1997), Science and the desertification debate, J. AridEnviron., 37, 599–608.
Tiffen, M., and M. Mortimore (2002), Questioning desertification in dry-land sub=Saharan Africa, Nat. Resour. Forum, 26, 218–233.
Tindale, N. W., and P. P. Pease (1999), Aerosols over the Arabian Sea:Atmospheric transport pathways and concentrations of dust and sea salt,Deep Sea Res., Part II, 46(8–9), 1577–1595.
Torres, O., P. K. Bhartia, J. R. Herman, Z. Ahmad, and J. Gleason (1998),Derivation of aerosol properties from satellite measurements of backscat-tered ultraviolet radiation: Theoretical basis, J. Geophys. Res., 103(D14),17,099–17,110.
Tucker, C. J., H. E. Dregne, and W. W. Newcomb (1991), Expansion andcontraction of the Sahara Desert from 1980 to 1990, Science, 253, 299–301.
Tucker, C. J., W. W. Newcomb, and H. E. Dregne (1994), AVHRR data setsfor determination of desert spatial extent, Int. J. Remote Sens., 15(17),3547–3565.
Uematsu, M., Z. F. Wang, and I. Uno (2003), Atmospheric input of mineraldust to the western North Pacific region based on direct measurementsand a regional chemical transport model, Geophys. Res. Lett., 30(6),1342, doi:10.1029/2002GL016645.
VanCuren, R. A. (2003), Asian aerosols in North America: Extracting thechemical composition and mass concentration of the Asian continentalaerosol plume from long-term aerosol records in the western UnitedStates, J. Geophys. Res., 108(D20), 4623, doi:10.1029/2003JD003459.
Vink, S., and C. I. Measures (2001), The role of dust deposition in determin-ing surface water distributions of Al and Fe in the south west Atlantic,Deep Sea Res., Part II, 48(13), 2787–2809.
Visser, F., L. J. A. Gerringa, S. J. Van der Gaast, H. J. W. de Baar, and K. R.Timmermans (2003), The role of the reactivity and content of iron ofaerosol dust on growth rates of two Antarctic diatom species, J. Phycol.,39(6), 1085–1094.
Wang, Z. F., H. Ueda, and M. Y. Huang (2000), A deflation module for usein modeling long-range transport of yellow sand over East Asia, J. Geo-phys. Res., 105(D22), 26,947–26,959.
Warneck, P. (2000), Chemistry of the Natural Atmosphere, Elsevier, NewYork.
Washington, R., M. Todd, N. J. Middleton, and A. S. Goudie (2003), Dust-storm source areas determined by the total ozone monitoring spectro-meter and surface observations, Ann. Assoc. Am. Geogr., 93(2), 297–313.
Watson, A., and N. Lefevre (1999), The sensitivity of atmospheric CO2
concentrations to input of iron to the oceans, Tellus, Ser. B, 51, 453–460.Werner, M., I. Tegen, S. P. Harrison, K. E. Kohfeld, I. C. Prentice,Y. Balkanski, H. Rodhe, and C. Roelandt (2002), Seasonal and interannualvariability of the mineral dust cycle under present and glacial climateconditions, J. Geophys. Res. , 107(D24), 4744, doi:10.1029/2002JD002365.
Westphal, D. L., O. B. Toon, and T. N. Carlson (1988), A case study ofmobilization and transport of Saharan dust, J. Atmos. Sci., 45, 2145–2175.
White, B. R. (1979), Soil transport by winds on Mars, J. Geophys. Res.,84(B9), 4643–4651.
Wiersma, G. B., and C. I. Davidson (1986), Trace metals in the atmosphereof rural and remote areas, in Toxic Metals in the Atmosphere, edited byJ. Nriagu and C. Davidson, pp. 201–266, John Wiley, Hoboken, N. J.
Wu, J., and E. Boyle (2002), Iron in the Sargasso Sea: Implications for theprocesses controlling dissolved Fe distribution in the ocean, Global Bio-geochem. Cycles, 16(4), 1086, doi:10.1029/2001GB001453.
Xuan, J., and N. Sokolik (2002), Characterization of sources and emissionrates of mineral dust in Northern China, Atmos. Environ., 36, 4863–4876.
Yaalon, D. H. (1987), Saharan dust and desert loess: Effect on surroundingsoils, J. Afr. Earth Sci., 6, 569–571.
Ying, C. (2004), Sources and fate of atmospheric nutrients over the remoteoceans and their role on controlling marine diazotrophic microorganisms,Ph.D thesis, Univ. of Md., College Park.
Yoshioka, M., et al. (2005), Simulation of absorbing aerosol indices forAfrican dust, J. Geophys. Res. , 110 , D18S17, doi:10.1029/2004JD005276.
Zender, C. S., H. Bian, and D. Newman (2003a), Mineral Dust Entrainmentand Deposition (DEAD) model: Description and 1990s dust climatology,J. Geophys. Res., 108(D14), 4416, doi:10.1029/2002JD002775.
Zender, C., D. Newman, and O. Torres (2003b), Spatial heterogeneity inaerolian erodibility: Uniform, topographic, geomorphic, and hydrologichypotheses, J. Geophys. Res., 108(D17), 4543, doi:10.1029/2002JD003039.
Zhang, Y., and G. R. Carmichael (1999), The role of mineral aerosol intropospheric chemistry in East Asia—A model study, J. Appl. Meteorol.,38, 353–366.
Zhou, Z. J., and G. Zhang (2003), Typical severe dust storms in northernChina during 1954–2002, Chin. Sci. Bull., 48(21), 2366–2370.
Zhu, X., J. M. Prospero, F. J. Millero, D. L. Savoie, and G. W. Brass (1992),The solubility of ferric iron in marine mineral aerosol solutions at ambi-ent relative humidities, Mar. Chem., 38, 91–107.
Zhu, X., J. M. Prospero, D. L. Savoie, F. J. Millero, R. G. Zika, and E. S.Saltzman (1993), Photoreduction of iron (III) in marine mineral aerosolsolutions, J. Geophys. Res., 98(D5), 9039–9046.
Zhu, X. R., J. M. Prospero, and F. J. Millero (1997), Diel variabilityof soluble Fe (II) and soluble total Fe in North African dust in thetrade winds at Barbados, J. Geophys. Res., 102(D17), 21,297–21,305.
Zhuang, G., Z. Yi, R. A. Duce, and P. R. Brown (1992), Link between ironand sulfur cycles suggested by detection of Fe (II) in remote marineaerosols, Nature, 355, 537–539.
Zuo, Y. (1995), Kinetics of photochemical/chemical cycling of iron coupledwith organic substances in cloud and fog droplets, Geochim. Cosmochim.Acta, 59, 3123–3130.
Zuo, Y., and J. Hoigne (1992), Formation of hydrogen peroxide and deple-tion of oxalic acid in atmospheric water by photolysis of iron (III)-oxalatocomplexes, Environ. Sci. Technol., 26, 1014–1022.
�������������������������A. R. Baker and T. D. Jickells, School of Environmental Sciences,
University of East Anglia, Norwich NR4 7TJ, UK.G. Bergametti, Laboratoire Interuniversitaire des Systemes Atmospher-
iques, UMR CNRS 7583, Creteil, France.N. Brooks, Tyndall Centre for Climate Change Research, University of
East Anglia, Norwich, NR4 7TJ, UK.R. A. Duce, Departments of Oceanography and Atmospheric Sciences,
Texas A&M University, College Station, TX 77843, USA.N. Kubilay, Institute of Marine Sciences, Middle East Technical
University, Erdemli-Mersin, 33731, Turkey.N. M. Mahowald, National Center for Atmospheric Research, 1850 Table
Mesa Drive, Boulder, CO 80305, USA. ([email protected])J. M. Prospero, Rosenstiel School of Marine and Atmospheric Science,
University of Miami, Miami, FL 33149, USA.I. Tegen, Institute for Tropospheric Research, Permoserstrasse 15,
D-04318 Leipzig, Germany.
GB4025 MAHOWALD ET AL.: ATMOSPHERIC IRON DEPOSITION
15 of 15
GB4025

Figure 1. (top) TERRA MODIS (moderate resolution imaging spectroradiometer) image of Bodelebasin in North Africa (approximately 17�N, 18�E) on 11 February 2004 [Koren and Kaufman,2004] taken from http://earthobservatory.nasa.gov/Newsroom/NewImages/images.php3?img_id=16534.(bottom) Colorado dust storms, 18 April 2004. This MODIS image shows a cluster of dense dust plumesthat erupted from fields in southeastern Colorado, to the north of the Arkansas River visible at the bottomof the image. The dust cloud extends into Kansas (border in the right of the image); later in the afternoon,dust was carried deep into Nebraska (border in the upper right corner). The inset shows a Landsat imageof the area demarcated by the box. The grid pattern in the image indicates the presence of agriculturalfields that cover much of this area. These fields seem to be the source of the major dust plumes seen in theimage. (Landsat image is courtesy of Max Bleiweiss, New Mexico State University. The MODIS imageis from the NASA MODIS Rapid Response System Gallery web site: http://rapidfire.sci.gsfc.nasa.gov/gallery/).
GB4025 MAHOWALD ET AL.: ATMOSPHERIC IRON DEPOSITION GB4025
3 of 15

Figure 2. Desert dust deposition (g/m2/yr) estimated from an average of three reanalysis based modelssimulated for 10+ years [Luo et al., 2003; Ginoux et al., 2004; Tegen et al., 2004], and representing ourbest estimate of dust deposition. Models compare well to available in situ and satellite observations andare shown here compared against sediment trap data [Kohfeld and Harrison, 2001].
GB4025 MAHOWALD ET AL.: ATMOSPHERIC IRON DEPOSITION GB4025
10 of 15


