Atmospheric deposition as a source of contamination at ...€¦ · Atmospheric deposition as a...
28
Northeast Waste Management Officials' Association WEBINAR Atmospheric deposition as a source of contamination at PFAS - impacted Sites Presented by: Christopher D. Zevitas, Sc.D. U.S. Department of Transportation Volpe National Transportation Systems Center and Stephen Zemba, Ph.D., P.E. Sanborn Head and Associates, Inc. December 13, 2018 1 PFAS
Transcript of Atmospheric deposition as a source of contamination at ...€¦ · Atmospheric deposition as a...

Northeast Waste Management Officials' Association WEBINAR
Atmospheric deposition as a source of contamination at PFAS-impacted Sites
Presented by:
Christopher D. Zevitas, Sc.D.U.S. Department of Transportation
Volpe National Transportation Systems Center
and
Stephen Zemba, Ph.D., P.E.Sanborn Head and Associates, Inc.
December 13, 2018
1
PFAS

PFAS Health Effects
• PFAS readily absorbed via inhalation or oral exposure and not metabolized in humans or laboratory animals
• Most epidemiological studies focus on PFOA and PFOS
• Provisional Minimum Risk Levels (MRLs) derived for PFOA, PFOS, PFHxS, and PFNA via oral exposure
• Inhalation data limited and considered inadequate for deriving MRLs
2
Source: ATSDR 2018
Observed Human Health Effects: Cancers (kidney,
testicular) Pregnancy-induced
hypertension/pre-eclampsia
Liver damage Increases in serum
lipids Thyroid disease Decreased
antibody response to vaccines
Asthma Decreased fertility Lower birth weight Osteoarthritis
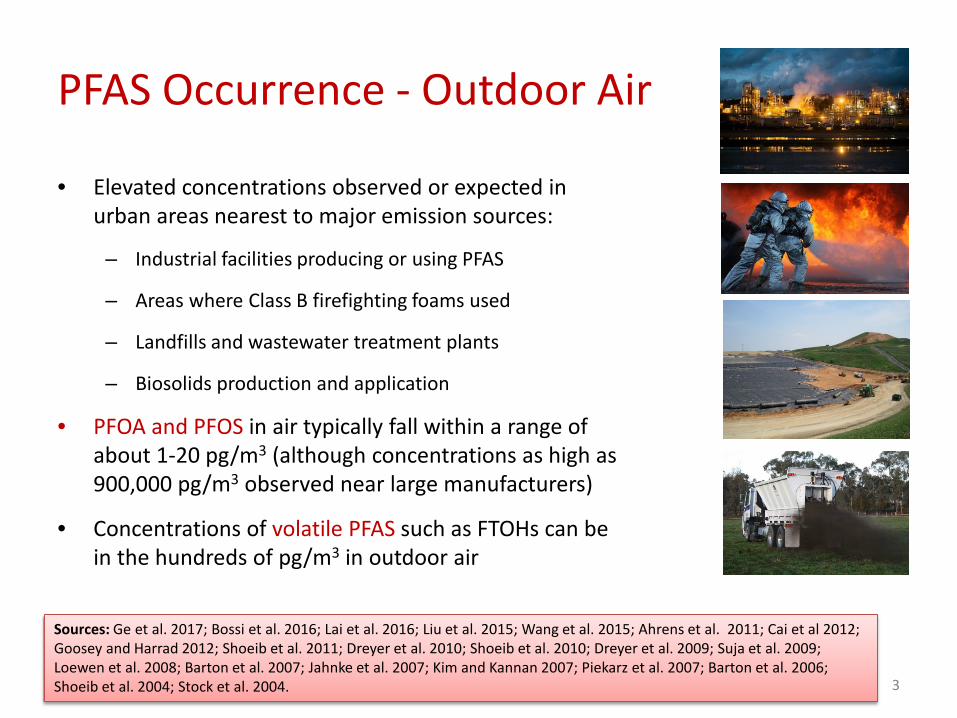
PFAS Occurrence - Outdoor Air
• Elevated concentrations observed or expected in urban areas nearest to major emission sources:
– Industrial facilities producing or using PFAS
– Areas where Class B firefighting foams used
– Landfills and wastewater treatment plants
– Biosolids production and application
• PFOA and PFOS in air typically fall within a range of about 1-20 pg/m3 (although concentrations as high as 900,000 pg/m3 observed near large manufacturers)
• Concentrations of volatile PFAS such as FTOHs can be in the hundreds of pg/m3 in outdoor air
3
Sources: Ge et al. 2017; Bossi et al. 2016; Lai et al. 2016; Liu et al. 2015; Wang et al. 2015; Ahrens et al. 2011; Cai et al 2012; Goosey and Harrad 2012; Shoeib et al. 2011; Dreyer et al. 2010; Shoeib et al. 2010; Dreyer et al. 2009; Suja et al. 2009; Loewen et al. 2008; Barton et al. 2007; Jahnke et al. 2007; Kim and Kannan 2007; Piekarz et al. 2007; Barton et al. 2006; Shoeib et al. 2004; Stock et al. 2004.

PFAS Species in Outdoor Air
• Wide range of PFAS observed in ambient air, examples include:
– Perfluoroalkyl acids (PFAAs)
– Perfluoroalkane sulfonamides (FASAs)
– Fluorotelomer alcohols (FTOHs)
– Fluorotelomer carboxylic acids (FTCAs)
– Perfluoroalkane sulfamido ethanols (FASEs)
• Certain classes of PFAS are volatile or semivolatile and can travel long distances
• Some termed “precursors” can degrade into “terminal degradation products” (PFOA, PFOS, and other PFAAs)
4
Classification Examples Uses
PFAAs PFOAPFOSPFBAPFHxSPFPeAPFHxAPFHpAPFNA
Surfactants
FASAs EtFOSAMeFOSA
Intermediate environmental transformation products
FTOHs 6:2 FTOH8:2 FTOH
10:2 FTOH
Raw material for surfactant and surface protection
FTCAs 8:2 FTCA Intermediate environmental transformation product
FASEs EtFOSEMeFOSE
Raw material for surfactant and surface protection
Sources: ITRC 2018; Ge et al. 2017; Bossi et al. 2016; Lai et al. 2016; Liu et al. 2015; Wang et al. 2015; Ahrens et al. 2011; Buck et al. 2011; Cai et al 2012; Goosey and Harrad 2012; Shoeib et al. 2011; Dreyer et al. 2010; Shoeib et al. 2010; Dreyer et al. 2009; Suja et al. 2009; Loewen et al. 2008; Barton et al. 2007; Jahnke et al. 2007; Kim and Kannan 2007; Piekarz et al. 2007; Barton et al. 2006; Shoeib et al. 2004; Stock et al. 2004.

Precursor Degradation Pathways
5Sources: ITRC 2018; Buck et al. 2011

Distribution in Air
• PFAS occur in gas and particle phases or other aerosols suspended in air (e.g., water vapor)
• Neutral PFAS such as FTOHs often the most dominant PFAS in the gas phase in urban areas, over open ocean, and in remote regions
• Ionic PFAS such as PFOA and PFOS (with low vapor pressure, high solubility) tend to be dominant species in airborne particulate matter
• PFOA associated with smaller, ultrafine particles, while PFOS associated with larger, coarser fractions
• PFAS found in rainwater and marine aerosols (sea spray)
6
Sources: Ge et al. 2017; Bossi et al. 2016; Lai et al. 2016; Wang et al. 2015; Ahrens et al. 2012; Dreyer et al. 2009
PM
gas
water vapor
PM

Conceptual Site Models
7Sources: MADEP 2018; ITRC 2018 (L. Trozzolo)
FIRE
TRA
ININ
GIN
DU
STRI
AL
Where to Look for PFAS (MADEP Guidance): PFAS
manufacturers Landfills Former and current
DoD sites Airport hangars,
rail yards, petrochemical sites
Firefighting, training, and equipment areas
Crash sites (air, rail, motor vehicle)
Metal coating and plating
Considering air emissions
when conducting a
site investigation

Fate and Transport of PFAS in AirSHORT-RANGE ATMOSPHERIC TRANSPORT
• PFAS commonly found in precipitation (rain and snow)
• Wet and dry deposition major removal mechanisms from atmosphere, on a timescale of a few days
• Short-range atmospheric transport can result in contamination to terrestrial and aquatic systems near emission sources with multi-media impacts
• Evidence of releases observed miles from source where hydrologic transport unlikely
8
Sources: Liu et al. 2017; NHDES 2017; Chen et al. 2016; NYDOH 2016; Lin et a. 2014; Post 2013; Taniyasu et al. 2013; Zhao et al. 2013; Post 2012; Dryer et al. 2010; Kwok et al. 2010; Frisbee et al. 2009; Barton et al. 2007; Davis et al. 2007; Kim and Kannan 2007; Hurley et al. 2004

Fate and Transport of PFAS in AirLONG-RANGE ATMOSPHERIC TRANSPORT (LRT)
• LRT responsible for wide distribution of PFAS across earth as evidenced by occurrence in biota, surface snow, ice cores, seawater, and other media as far as the Arctic and Antarctic
• Distribution to remote regions believed to occur from:
– LRT and subsequent degradation of precursors
– Transport via ocean currents and release into air as marine aerosols
• Processes and effects similar to atmospheric transport of other recalcitrant compounds
9
Sources: Bossi et al. 2016; Kirchgeorg et al. 2016; Rankin et al. 2016; Wang et al. 2015; Codling et al. 2014; Wang et al. 2014; Kirchgeorg et al. 2013; Kwok et al. 2013; Benskin et al. 2012; Cai et al. 2012; Ahrens et al. 2010; Armitage et al. 2009; Dasilva et al. 2009; Dryer et al. 2009; Young et al. 2007; Wania et al. 2007; Ellis et al. 2004

PFAS Occurrence - Indoor Air
• PFAS can also be present in indoor air
• Indoor concentrations can be higher than outdoors due to the presence of indoor sources
• Most exposures may occur indoors where we spend ~ 90% of our time
• PFAS in indoor air reported in the range of about 1-440 pg/m3 for PFOA and PFOS
• Volatile PFAS such as FTOHs have been observed on the order of 10,000-50,000 pg/m3 in schools, homes, and offices and in excess of 300,000 pg/m3 in commercial buildings
10
Sources: ATSDR 2016; Fromme et al. 2015; Liu et al. 2015; Liu et al. 2014; Fraser et al. 2012; Goosey and Harrad2012; Shoeib et al. 2011; Fromme et al. 2010; Kaiser et al. 2010; Langer et al. 2010; Gewurtz et al. 2009; Guo et al. 2009; Strynar and Lindstrom 2008; Shoeib et al. 2004
Indoor PFAS Sources: Stain resistant
coatings used on carpets and upholstery
Water resistant clothing
Grease-resistant paper
Food packaging Nonstick cookware Cleaning products Personal care
products Cosmetics Paints, varnishes,
and sealants

Atmospheric Deposition of Contaminants
Wet and DryDeposition
Courtesy of NH Department of Environmental Services

Deposition Factors/Considerations
Dry v. Wet Dry “Donut Hole”
12
PlumeImpaction

*Detected in public water supply wells at up to 280 ng/L.
0 1 32Miles
*Public
610 ng/l
Industrial Site
Courtesy of Gloria B. Post, NJDEP, June 5, 2013
PFAS Airborne Transport Found Near NJ Facility

PFAS – Airborne Transport in VT
14
FormerFactory
RiverFlow
Topography
VT Groundwater Standard = 20 ppt
Ridge/Hill

PFAS – Private Well Samples in NH
FormerFactory
RiverFlow
Elevated Terrain
Courtesy of NH Department of Environmental Services
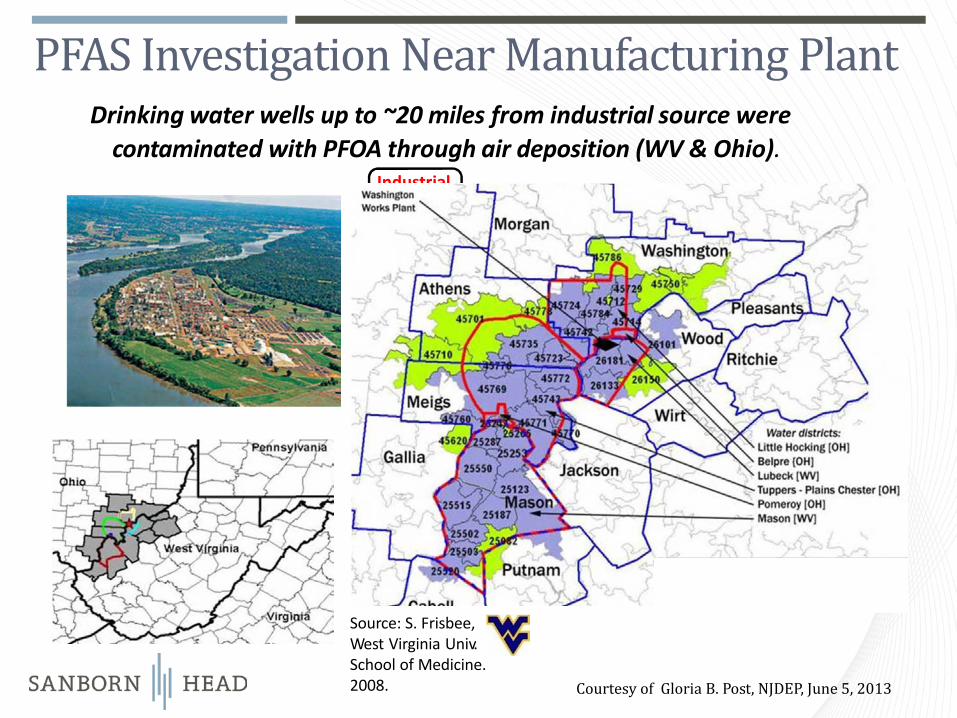
Drinking water wells up to ~20 miles from industrial source werecontaminated with PFOA through air deposition (WV & Ohio).
Industrial Source
Source: S. Frisbee,West Virginia Univ.School of Medicine.2008. Courtesy of Gloria B. Post, NJDEP, June 5, 2013
PFAS Investigation Near Manufacturing Plant

PFAS Modeling Study Example
17
H.-M. Shin et al. (2012), Atmospheric Environment 51 (2012) 67-74
Air: 200 ng/m3
Soil: 11,000 ng/kgWater: 4,000 ng/l

PFAS Modeling Study Example
18
H.-M. Shin et al. (2012), Atmospheric Environment 51 (2012) 67-74

Comments on Modeling Basic inputs (e.g., emission rates, particle size
distribution, etc.) may be unknown or uncertain AERMOD deposition models are not fully validated
and Method 1/2 options may give varying results Coupled air-soil-groundwater models may be difficult
to uniquely calibrate Hybrid approaches that combine modeling and
measurements may be prudent Air dispersion/deposition modeling may be useful in
predicting expected patterns of PFAS deposition in the vicinity of an air emission source
19

Soil: The Critical PFAS Reservoir
20
Atmospheric deposition
Accumulation/Depletion
Infiltration
Leaching
Soil
Groundwater

How Much PFAS in Air is Needed to Contaminate Groundwater?
Assume: PFAS deposits and mixes with precipitation Deposition velocity 1 cm/s 1 m annual precipitation depth
Find by mass balance: 3.2 ng/m3 in air produces 1,000 ng/l in water
Perspective: 70 – 170 ng/m3 detected in air near Dupont in WV
21

PFAS Emissions
Chromium plating facilities Concentration 4.9 μg/m3 in vented exhaust
corresponds to 1 lb/yr PFOS (1) Lake Calhoun, MN mass balance: 36 lb/yr (2)
Dupont plant in Washington, WV (3) > 10,000 lb/yr from 1978 through 2002 Peaked at 34,000 lb/yr (1999)
22
(1) NAVFAC TR-2243-ENV, March 2004(2) https://www.minneapolisparks.org/_asset/0jd11p/water_resources_report_2015.pdf (1.8×10⁷ m3 and 4.2 yr residence)
https://www.pca.state.mn.us/sites/default/files/c-pfc1-02.pdf (average 108 ppt)(3) Paustenbach et al (2007), J Toxicol Environ Health 1:28-57

What PFAS Emission Rate Produces Observed Air Levels?
Ballpark Assumptions: PFAS in air at 10 ng/m3
Emission height ~ 30 m Class D/E stability Wind speed ~5 m/s Transport distance ~1,000 to 1,500 m
Guesstimate: Impact Cu/Q of 5.0×10⁻⁵ m-2 (Turner’s Workbook) Implied emission Q = 0.008 lb/hr = 70 lb/yr
23
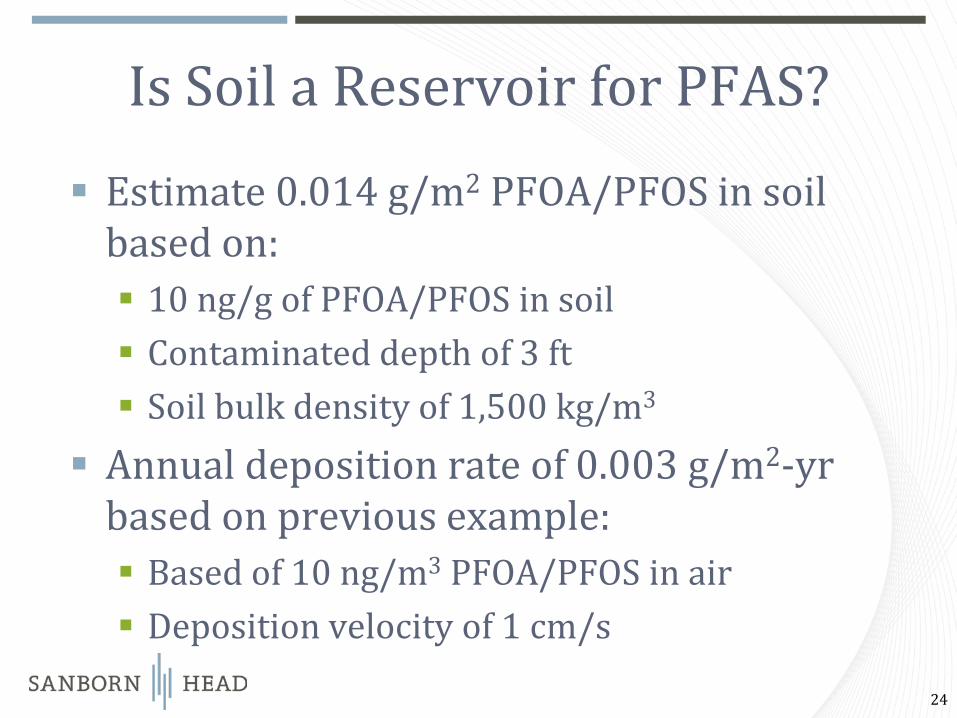
Is Soil a Reservoir for PFAS?
Estimate 0.014 g/m2 PFOA/PFOS in soil based on: 10 ng/g of PFOA/PFOS in soil Contaminated depth of 3 ft Soil bulk density of 1,500 kg/m3
Annual deposition rate of 0.003 g/m2-yr based on previous example: Based of 10 ng/m3 PFOA/PFOS in air Deposition velocity of 1 cm/s
24

PFAS Background in Soil? Ballpark Assumptions: PFAS in air at 10 pg/m3 = 0.01 ng/m3
Deposition velocity = 1 cm/s Soil depth = 1 ft Deposition time = 30 yrs No loss or removal from soil Soil bulk density = 1500 kg/m3
Find Soil concentration = 0.2 ng/g
25

Special Thanks!
ITRC PFAS Team: Fate and Transport Sub-team
26

Contact
27
Christopher D. Zevitas, Sc.D.USDOT/Volpe CenterEnvironmental Science and Engineering Division, V-32655 BroadwayCambridge, MA 02142Telephone: (617) 494-3611Email: [email protected]
Stephen G. Zemba, Ph.D., P.E.Sanborn Head and Associates, Inc.187 Saint Paul StreetBurlington, VT 05401Telephone: (802) 391-8508Email: [email protected]

Discussion
28
QUESTIONS?
COMMENTS?
DATA GAPS?