atmosfair Flight Emissions Calculator€¦ · 3 1 Introduction This text documents the details of...
24
atmosfair Flight Emissions Calculator Documentation of the Method and Data atmosfair gGmbH Berlin, September 2016
Transcript of atmosfair Flight Emissions Calculator€¦ · 3 1 Introduction This text documents the details of...

atmosfair Flight Emissions Calculator
Documentation of the Method and Data atmosfair gGmbH Berlin, September 2016
1
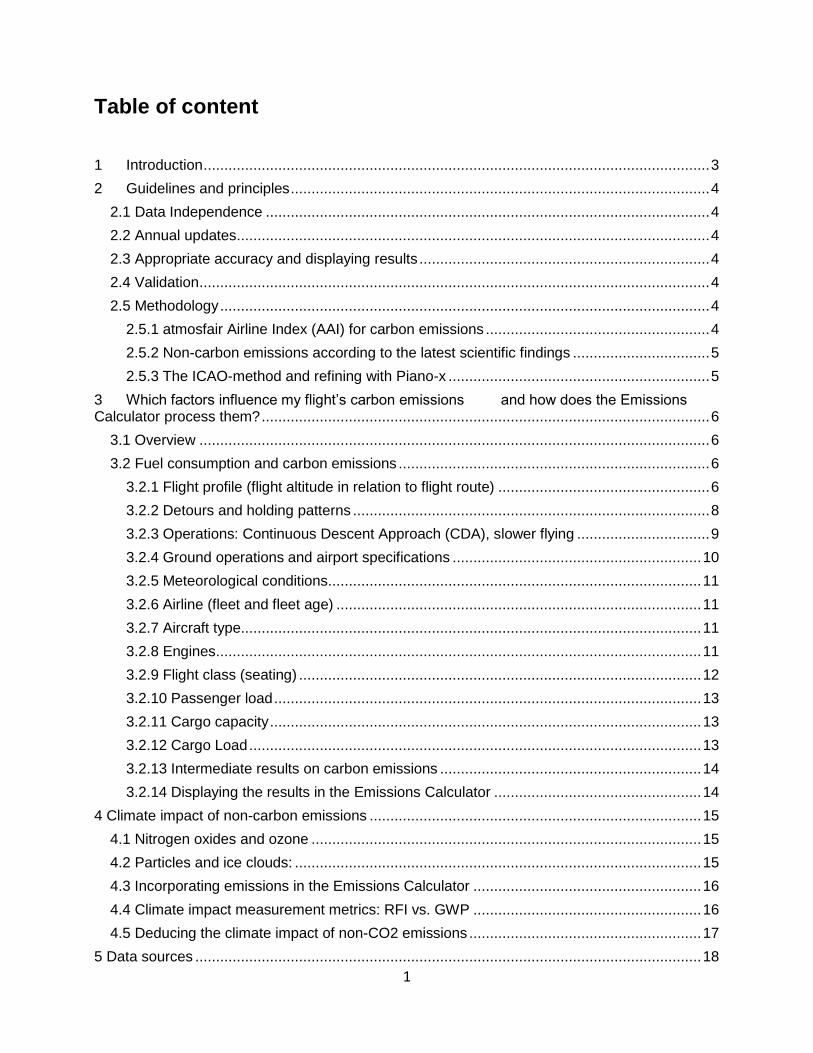
Table of content 1 Introduction .......................................................................................................................... 3
2 Guidelines and principles ..................................................................................................... 4
2.1 Data Independence ........................................................................................................... 4
2.2 Annual updates .................................................................................................................. 4
2.3 Appropriate accuracy and displaying results ...................................................................... 4
2.4 Validation ........................................................................................................................... 4
2.5 Methodology ...................................................................................................................... 4
2.5.1 atmosfair Airline Index (AAI) for carbon emissions ...................................................... 4
2.5.2 Non-carbon emissions according to the latest scientific findings ................................. 5
2.5.3 The ICAO-method and refining with Piano-x ............................................................... 5
3 Which factors influence my flight’s carbon emissions and how does the Emissions Calculator process them? ............................................................................................................ 6
3.1 Overview ........................................................................................................................... 6
3.2 Fuel consumption and carbon emissions ........................................................................... 6
3.2.1 Flight profile (flight altitude in relation to flight route) ................................................... 6
3.2.2 Detours and holding patterns ...................................................................................... 8
3.2.3 Operations: Continuous Descent Approach (CDA), slower flying ................................ 9
3.2.4 Ground operations and airport specifications ............................................................ 10
3.2.5 Meteorological conditions.......................................................................................... 11
3.2.6 Airline (fleet and fleet age) ........................................................................................ 11
3.2.7 Aircraft type............................................................................................................... 11
3.2.8 Engines ..................................................................................................................... 11
3.2.9 Flight class (seating) ................................................................................................. 12
3.2.10 Passenger load ....................................................................................................... 13
3.2.11 Cargo capacity ........................................................................................................ 13
3.2.12 Cargo Load ............................................................................................................. 13
3.2.13 Intermediate results on carbon emissions ............................................................... 14
3.2.14 Displaying the results in the Emissions Calculator .................................................. 14
4 Climate impact of non-carbon emissions ................................................................................ 15
4.1 Nitrogen oxides and ozone .............................................................................................. 15
4.2 Particles and ice clouds: .................................................................................................. 15
4.3 Incorporating emissions in the Emissions Calculator ....................................................... 16
4.4 Climate impact measurement metrics: RFI vs. GWP ....................................................... 16
4.5 Deducing the climate impact of non-CO2 emissions ........................................................ 17
5 Data sources .......................................................................................................................... 18

2
5.1 Piano-X ............................................................................................................................ 18
5.2. ICAO .............................................................................................................................. 18
5.3 ATI – Air Transport Intelligence........................................................................................ 19
5.4 OAG – UBM..................................................................................................................... 19
5.5 Airline Data T100 International ........................................................................................ 19
5.6 JP Airline Fleets International .......................................................................................... 19
5.7 IATA WATS ..................................................................................................................... 20
5.8 Aero Secure..................................................................................................................... 20
6 Precision of methods and results ............................................................................................ 21
6.1 Uncertainty factors ........................................................................................................... 21
6.2 Data quality ..................................................................................................................... 21
6.3 Quality of the methodology .............................................................................................. 21
6.4 Levels of precision ........................................................................................................... 21
7 Bibliography ....................................................................................................................... 22

3
1 Introduction This text documents the details of atmosfair’s flight emission calculation program. atmosfair’s Emissions Calculator is accessible to all end users free of charge at www.atmosfair.de. For business clients, atmosfair offers comprehensive CO2 reports either directly or through
partnering business travel agencies, travel credit cards such as AirPlus, or by using special services like Conovom (for SAP travel expense reports). The full version of the atmosfair reporting program includes the flights, rental car, train travel and hotel stays.. The report can be generated for any given time frame and can recognize and outline different business units. The program is available for both the travel industry and business customers. atmosfair offers the CO2 balancing of business trips according to the VDR standard. https://www.atmosfair.de/en/about_us/references/geschaeftsreiseindustrie/ For any queries please contact: [email protected]

4
2 Guidelines and principles atmosfair developed its Emissions Calculator according to following principles:
2.1 Data Independence atmosfair obtains its data exclusively from independent scientific research projects or from specialized and independent data service providers. Under no circumstances does atmosfair use data provided by the airlines themselves.
2.2 Annual updates Aircrafts in world air traffic constantly undergo technical improvements and are becoming more economical. In particular, new aircraft types coming onto the market are often up to 30% more efficient than their predecessors and therefore bring about major changes (atmosfair, AAI 2013). In order to render an accurate report of the world’s airlines and their fleet, atmosfair updates its data for the carbon emissions calculations for flights on an annual basis.
2.3 Appropriate accuracy and displaying results The accuracy of the calculations is scientifically appropriate. Factors that the passenger can influence as well as factors that have the greatest impact on the amount of emissions are displayed with a high degree of detail by the Emissions Calculator. However, for less important factors as well as factors that lie outside the passenger’s sphere of influence, the calculator relies on average values.
If the user leaves out one of the parameters (e.g. aircraft type), the calculator will show as many different results as possible1.
2.4 Validation The methodology and data used by atmosfair for the Emissions Calculator have been approved by the Umweltbundesamt, (German Environment Agency), and by numerous internationally active academics in the fields of physics and aeronautical engineering.
2.5 Methodology The flight emissions are calculated based on the following:
2.5.1 atmosfair Airline Index (AAI) for carbon emissions The CO2 emissions of a flight are calculated in the atmosfair flight Emissions Calculator using the detailed method of the atmosfair Airline Index (AAI).A short summary of this methodology can be found in chapter 2. For more detailed information please refer to ”atmosfair, AAI 2013“. The atmosfair Airline Index contains:
• 32 million flights • more than 200 of the world’s largest airlines • 22,300 city pairs worldwide • 119 aircraft types (97% coverage of the global market) • 408 engines (96% coverage of the global market)
1 e.g. the carbon emissions of different airlines on the same route

5
The index covers approximately 92% of global air traffic (as of 2016). The CO2 of the remaining flights is calculated using generic values averaged from sources like IATA and ICAO for the respective world region.
2.5.2 Non-carbon emissions according to the latest scientific findings In addition to sole carbon emissions, there are also non-carbon emissions for flights, which are also recorded, calculated and reported with their climate effectiveness in the atmosfair method (Chapter 4). For this atmosfair uses the latest scientific industry data in compliance with IPCC as well as peer-reviewed specialist literature.
2.5.3 The ICAO-method and refining with Piano-x The AAI has its own methodology, based on the carbon calculation method of ICAO (ICAO 2010). The CO2 emissions are simulated using a special computer model (Piano-x, see Chapter 3.2 & 5.1) using the fuel consumption of a complete aircraft on a given route. The resulting carbon emissions are then divided by the number of passengers minus the cargo. The database and software “Piano-x” by Lissys Ltd is used to calculate an aircraft’s fuel consumption and emissions. Lissys Ltd is a company based in the United-Kingdom. Aircraft manufacturers, aviation authorities as well as universities and research centers use Piano-x. Even the ICAO refers to it for its own Emissions Calculator. Piano-x offers by far the most accurate data on fuel consumption in civil air traffic for every aircraft and its specific configuration on the respective route.

6
3 Which factors influence my flight’s carbon emissions and how does the Emissions Calculator process them?
3.1 Overview The following factors influence carbon and/or non-carbon emissions and therefore a flight’s climate impact. Each factor will be discussed individually in the following chapters.
Chapter 3: Fuel consumption and carbon emissions
Flight profile (flight altitude in relation to the flight route) Detours and holding patterns Operations: Continuous Descent Approach (CDA) and slow flying Ground operations and airport conditions Meteorological conditions Airline (fleet) Aircraft types Engines Travel class (seating) Passenger load Cargo capacity Cargo load
Chapter 4
Non-carbon emissions (ozone formation, contrails etc.)
3.2 Fuel consumption and carbon emissions Carbon emissions are directly related to fuel consumption. For every ton of kerosene, 3.16 tons of CO2 are always emitted. The fuel consumption however is itself determined by different factors, such as aircraft type and its seating, engine type, winglets etc., which are controlled by the airline. In addition to the purely technological aspects, the operating style of the aircraft also influences the amount of emissions. This includes the passenger and cargo load, but also the flight itself, from the airspeed to the landing approach procedure. The following factors play a decisive role for fuel consumption and thus for carbon emissions:
3.2.1 Flight profile (flight altitude in relation to flight route) Summary: the fuel consumption of an aircraft strongly depends on the total flight distance. In general, the longer the flight, the higher the overall consumption. For short-haul flights however, the relative consumption per 100km is higher than for medium-haul flights because the departure and take-off procedures are energy-intensive and play a more important role on the overall consumption. Long-haul flights also consume more fuel per 100 km than medium-haul flights because the fuel itself has to be transported for most of the flight and will only be fully consumed at the very end. The flight profile depends on the flight distance, the performance of the aircraft, and the local weather conditions.
7
The emissions calculator proceeds in two steps: the first step consists in determining the flight’s great-circle route based on the geographical coordinates of the departure and destination airports.2 Additional standard values like detours, holding patterns etc. are also included in the calculation.
Secondly, the Emissions Calculator calculates the fuel consumption of a specific aircraft in relation to distance using so-called flight profiles. The Flight Profile is the two-dimensional course of a flight, in which each point on the earth’s surface along the flight path from the departure airport to the destination airport is allocated to the corresponding flight altitude. A flight profile of any flight consists of following phases:
1. Departure to take-off. 2. Climb phase during which the aircraft climbs to cruising altitude after take-off. 3. Cruise phase in which the aircraft covers a specific distance at a relatively constant
altitude. The cruising altitude varies with the flight distance: for short-haul flights, flying altitude lies between 5 and 7 kilometers, for long-haul flights the altitude lies between 10 and 13 kilometers.
4. Descent phase during which the aircraft descends from cruising altitude to landing. 5. Landing.
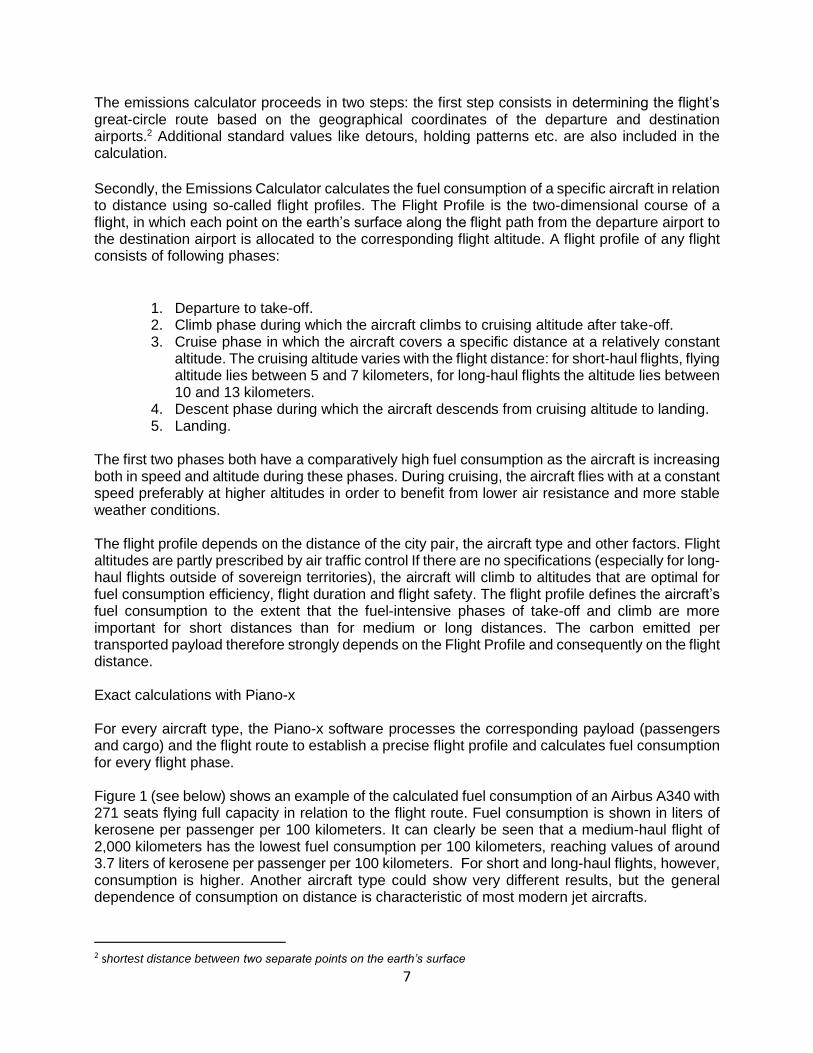
The first two phases both have a comparatively high fuel consumption as the aircraft is increasing both in speed and altitude during these phases. During cruising, the aircraft flies with at a constant speed preferably at higher altitudes in order to benefit from lower air resistance and more stable weather conditions. The flight profile depends on the distance of the city pair, the aircraft type and other factors. Flight altitudes are partly prescribed by air traffic control If there are no specifications (especially for long-haul flights outside of sovereign territories), the aircraft will climb to altitudes that are optimal for fuel consumption efficiency, flight duration and flight safety. The flight profile defines the aircraft’s fuel consumption to the extent that the fuel-intensive phases of take-off and climb are more important for short distances than for medium or long distances. The carbon emitted per transported payload therefore strongly depends on the Flight Profile and consequently on the flight distance. Exact calculations with Piano-x For every aircraft type, the Piano-x software processes the corresponding payload (passengers and cargo) and the flight route to establish a precise flight profile and calculates fuel consumption for every flight phase. Figure 1 (see below) shows an example of the calculated fuel consumption of an Airbus A340 with 271 seats flying full capacity in relation to the flight route. Fuel consumption is shown in liters of kerosene per passenger per 100 kilometers. It can clearly be seen that a medium-haul flight of 2,000 kilometers has the lowest fuel consumption per 100 kilometers, reaching values of around 3.7 liters of kerosene per passenger per 100 kilometers. For short and long-haul flights, however, consumption is higher. Another aircraft type could show very different results, but the general dependence of consumption on distance is characteristic of most modern jet aircrafts.
2 shortest distance between two separate points on the earth’s surface

8
Consumption in liters of kerosene per passenger per 100 kilometers Fight distance in kilometers
Figure 1: Fuel consumption of an Airbus A340 with 271 seats operating at full capacity depending on the flight route (DLR, 2000)
3.2.2 Detours and holding patterns The word “detour” is the distance an aircraft travels on its way from the departure airport to the destination airport (the great circle distance is the shortest connection between two points on the earth’s surface). Holding patterns however are counted separately (see below). Detours have been recorded statistically. Figure 2 shows the detours on flights in Germany. It shows the detour factor (quotient of real flight distance including detour divided by great circle distance). Detour factor Great circle distance in kilometers
Figure 2: Detour factor in relation to great circle distance (atmosfair, AAI 2013) In absolute terms, most detours range to approx. 50 kilometers for any distance. Similar research conducted on long-haul flights has led to the same results. The Emissions Calculator takes this empirical result into account by adding the detour automatically to all flights. In light of the overall

9
low significance of this factor, this procedure provides us with sufficient precision. Therefore, differences between airlines do not influence this factor. Holding patterns are also under the control of Air Traffic Control, therefore airlines cannot be held accountable for them. Consequently, the atmosfair Emissions Calculator does not take holding patterns into account.
3.2.3 Operations: Continuous Descent Approach (CDA), slower flying The term “Operation” stands for the way an aircraft is being operated and can be used in a number of different ways. Here, it covers specific forms of flying methods that have a systematic impact on fuel consumption and therefore on carbon emissions. In the following, we will focus on the two main methods that have the largest impact on fuel consumption. Continuous Descent Approach (CDA) CDA is a special method by which aircrafts approach airports prior to landing differently from other conventional descents. At a particular altitude (which can depend on the airport or the air traffic), the pilot turns the engines on minimum or if possible, lets them idle and allows the aircraft to glide down on a smooth and constant angle thereby reducing noise emissions and fuel consumption. The conventional approach, characterized by throttling and accelerating to descend in a stair step fashion, creates noise intensive horizontal flying phases that can be avoided with CDA. However, the CDA also has its disadvantages: the descent speed while gliding with engines in neutral varies from aircraft to aircraft and cannot be changed. The conventional lateral and vertical staggering of air traffic control, which leads as many aircraft as possible in succession to the final approach route of an airport, is no longer possible with the CDA. CDA might therefore be restricted in some areas or specific times. In Germany for example, some airports only allow CDAs at low traffic times (e.g. at night). CDA enables kerosene savings of up to 430 kg for a Boeing 747 or 434 kg for an Airbus A330 on a single flight (Cao et al., o.J.). In a sensitivity analysis, the AAI compared these results with the total fuel consumption of different flights. Depending on the distance (medium-haul or long-haul flights) and aircraft type, the AAI identified a reduction in fuel consumption of 0.5 to 1.5%. If an airline were to implement these potential savings on all its flights, it could improve its overall ranking in the AAI Global Ranking. Because of the restrictions mentioned above on the Continuous Descent Approach, the AAI assumes that only a restricted number of airports allow CDAs. Therefore, the actual kerosene saving potential that an airline flying to many airports could make would only amount to less than 1%. The AAI therefore does not take CDA into account. Reduced flight speed Reducing the speed of a flight also reduces its fuel consumption and therefore its carbon emissions, an approach followed by many airlines in order to reduce fuel costs. However, slowing down also has other consequences. Flying more slowly increases flight time, which may require changes to the flight plan or reorganization of connecting flights. Furthermore, the speed cannot be reduced at will. If the engine speed is reduced too much, it might no longer run optimally, and the potential savings are therefore limited.

10
With the Piano-x program (see chapter 5.1), the AAI calculated the fuel consumption of different flights (short-haul, medium-haul, and long-haul with different aircraft types) twice: Firstly, with the common flight speed corresponding to the aircraft type, and then at a speed reduced by 50 km/h3.
The remaining parameters (seating, passenger load etc.) stay the same. The difference between both results is the fuel savings that can be obtained by flying more slowly. This difference amounts to 0.4 to 1.4%. The AAI assumes that an airline will or can only reduce the flying speed for a part of all flights because of the above-mentioned restrictions and disadvantages. In reality, the savings potential stays below 1% and reduced flight speed is therefore not accounted for in the AAI.
3.2.4 Ground operations and airport specifications The equipment, dimensions, as well as the airport operation have an impact on the fuel consumption of an aircraft on the ground. The following points play a role. Taxiing Aircrafts have to taxi from the terminal to the runway and consume fuel in the process which is not included in the Flight Profiles. The same applies to taxiing to the terminal after landing. Taxiing time can vary depending on the distance from the terminal to the runway. In Germany, the consumption of fuel during taxiing can go up to 2.5 kg before and after the flight. Airlines cannot influence the taxi distance or fuel consumption, and they are all affected equally. The AAI therefore assumes that the difference between the airlines due to more efficient operations are smaller than the absolute consumption, equaling approximately 0.3 kg of kerosene per passenger. This is less than 1% of the fuel consumption per passenger, even for a short-haul flight of 400 km. Push-service Depending on the airport, a pushback service may be necessary which is conducted by aircraft tractors. Pushback services are needed when the aircraft is standing with its nose pointed towards the terminal before the flight, as most jet airplanes cannot drive backwards and change the position accordingly on their own. Airlines are therefore subject to the airport’s constraints. Using the engine or the pushback service, the resulting fuel consumption is so low that it is not taken into account by the AAI. APU The Auxiliary Power Unit (APU) is an auxiliary engine which supplies the aircraft with electricity while it is on the ground and the main engines are switched off. Additionally, the APU serves as a starter for the main engine. While the APU consumes fuel, depending on the airport ground electricity supply might be available or compulsory which cancels out the fuel consumption. This applies equally to all airlines. In Germany, on average, taxiing lasts approx. 15 minutes per flight, during which the engines are running at low power. A study on fuel consumption during taxiing on all German domestic airports, showed that approximately 2.5 kilograms of kerosene are necessary per passenger for both taxiing procedures (Brockhagen, 1995). The Emissions Calculator applies this result as a flat rate for all other flights to and from or outside Germany, which is not an exact value but seems appropriate in regard to the low significance of this factor.
3 These 50 km/h are an example from the sensitivity analysis

11
3.2.5 Meteorological conditions Winds can have a considerable impact on the flight phase and fuel consumption. These can result from irregular and momentary weather conditions or be part of regular regional phenomena. Airlines can take known winds into account when determining the flight route, as they either prove to be a hindrance or have a beneficial effect by shortening the effective flight time and reducing fuel consumption. An advantageous wind means saving time and fuel. Flight routes and flight altitudes over land are however often stipulated. Local weather and wind cannot always be avoided, and unexpected headwinds may lead to increased fuel consumption. Airlines therefore only have a very limited possibility to avoid local changing winds and the influence of wind is therefore not included in the Emissions Calculator.
3.2.6 Airline (fleet and fleet age) Age By being constantly in operation, aircrafts are exposed to material fatigue as well as wear and tear. Deposits and small changes to the surface can alter the airplane’s aerodynamics, which can lead, among other things, to an increase in fuel consumption. The age of the fleet plays a decisive role in an airline’s fuel consumption and carbon efficiency.
This can be countered by good maintenance. For safety reasons there are strict regulations regarding aircraft maintenance procedures, defining intervals, scope, and quality4. Intervals and scope are specified by maintenance protocols which have to be approved by the corresponding air traffic authority.
Consequently, one can assume that no dramatic differences in fuel consumption can arise from wear and tear, material fatigue, and maintenance. Reducing fuel consumption is already an economical target for airlines and one can assume that undergoing maintenance procedures more often than required is in the best interest of the airlines as it can lead to significant improvements. Differences between airlines therefore remain negligible.
3.2.7 Aircraft type Fuel consumption depends on the aircraft type used. A difference is usually made between propeller-driven and jet-driven aircrafts. Every aircraft is optimized for a certain distance as well as cargo and passenger load. Operating an aircraft outside this optimization is possible but will increase fuel consumption. Every flight connection has a passenger potential serviced by the airlines. According to the transport capacity required, the flight frequency (the number of flights between two cities in a given timeframe) and the flying distance, the airline can deploy different aircraft types. The atmosfair Emissions Calculator accounts for 121 different aircraft types and the corresponding variations, attaining 97% coverage of the market (status 2016).
3.2.8 Engines A so-called engine factor allows the atmosfair Emissions Calculator to differentiate between engines. It stands for the two main factors, Specific Fuel Consumption (SFC) and ozone formation, in other words, the shortening of the methane lifetime due to NOx emissions. The “engine factor” is smaller, equal, or greater than 1 if the engine, including the NOx correction, consumes more or less fuel in comparison to other engines that are compatible with the aircraft type.
4 EC 2042/200332 for the EU

12
The JP Fleet catalogue covers the airline fleets in question as well as the engines being used. Once the engine of an aircraft has been determined, the atmosfair Emissions Calculator will calculate the actual SFC and the NOx correction.
1. Determining the actual SFC “Actual SFC” stands for the SFC of an engine in combination with a specific aircraft type. Determining the actual SFC is a three-step process:
1. Using the Boeing Fuel Flow Method to determine the isolated engine’s SFC. 2. Correcting the isolated SFC with the air resistance of the engine. 3. Correcting the isolated SFC with the weight of the engine. (atmosfair, AAI 2013)
This procedure includes the main compromises taken by airlines in practice. The price for a low SFC is often a heavier and larger engine, which can lead to differences in sole SFCs of up to 10%. This lowers the correction of the air resistance and the weight correction is even lower.
2. NOx correction (heating vs. cooling)
Nitrogen oxides (NOx) not only form ozone but also reduce the lifespan of the greenhouse gas
methane (cooling effect). Both effects are short-lived in comparison to CO2. To compare the effects NOx has on ozone and methane with the effect of SFC and therefore CO2, the AAI uses the
absolute Global Warming Potentials (AGWPs) of CO2, CH4, and O3 (Lee et al., 2012). Following the international convention made during the UNFCC climate negotiations, the timeframe is set to be 100 years.
When AGWPs are used, the AAI uses mean values for each pollutant according to the most recent scientific data. By using such an extensive timeframe, during which only CO2 has a significant impact, the NOx correction factor becomes very small and is usually no larger than the weight
correction factor.
The Emissions Calculator accounts for 408 different engines in total and therefore attains a market coverage of 96%.
3.2.9 Flight class (seating) An aircraft only offers very limited seating options. Even if the number of seats does not significantly influence the fuel consumption there is still a direct correlation between the two. Business seats use up more space than economy seats, and therefore reduce the number of overall seats. In extreme cases, one business seat can take up to two economy seats. Based on the total number of seats on the aircraft, economy passengers have a below-average impact on fuel consumption and business passengers an above-average impact. The key factor for this is the ratio of business to economy seats and the relative sizes of both. These can vary from airline to airline and/or different aircrafts. To calculate the fuel emissions corresponding to one seat, business or economy, the atmosfair Emissions Calculator uses research conducted on the seating design of the 40 largest airlines worldwide (Buchner, 2007).

13
This research has shown that the average seat distribution is a ratio of 74 : 20 : 6 (economy seats : business seats : first class seats) out of a 100 available seats. The average space used by the different types of seating corresponds to a ratio of 1 : 1.9 : 2.65. Combining these two, this gives us a fuel consumption ratio of 0.8 : 1.5 : 2.0, meaning that an economy passenger consumes 20% less fuel on average than the overall average. On the other hand, a business passenger requires 50% more fuel on average and a passenger in first class uses twice as much. In light of these important variations in fuel consumption with regard to seating density, the atmosfair Emissions Calculator takes into account the flight classes on the respective routes. The calculations are based on detailed data concerning the seating arrangements of different airlines in order to provide an exact factor for every single flight.
3.2.10 Passenger load The passenger occupancy rate attained by the airlines depends on different factors, including ticket prices, flight type, and flight region. The number of passengers times the number of (passenger)-seats as well as cargo capacity equals the actual load capacity. The passenger load therefore is a key factor in determining the load capacity and the fuel consumption (atmosfair, AAI 2013). The atmosfair Emissions Calculator includes the ”Passenger Load Factor“ (PLF) of the individual airlines in its calculations.
3.2.11 Cargo capacity Irrespective of the airline, there are maximum load specifications for every type of aircraft, regarding take-off, landing, loading, and refueling. The ”Maximum Zero Fuel Weight“ (MZFW) defines the maximum authorized weight of an aircraft including payload (passengers and freight) without fuel. Depending on seating and passenger load, an upper limit is set as to how much cargo the aircraft may carry. This limit is rarely reached, for two reasons:
1. The volume of the cargo hold is limited. The lower deck cargo hold is often full before reaching maximal load capacity.
2. When including kerosene, the ”Maximum Takeoff Weight” (MTOW), the aircraft’s maximum weight before take-off, must not be exceeded. On long-haul flights especially, which require a considerable amount of fuel, the MZFW cargo capacity may not be fully available as the overall weight would exceed the MTOW.
Consequently, the cargo capacity for a flight is not constant as it depends on various factors like distance, seating, and aircraft type, which are under direct control of the airline. Furthermore, taking the degree of influence on the actual payload into account is necessary as airlines apply very different forms of cargo capacity management. Therefore, the atmosfair Emissions Calculator takes into account not only the passenger load factor but also the cargo load factor of the respective airline.
3.2.12 Cargo Load The amount of additional cargo depends on different factors like prices and load capacity. In case of a low passenger load, airlines have the possibility to increase their additional cargo. Load is the the most important factor in calculating the specific fuel consumption (atmosfair, AAI 2013). Additionally, as the airlines have total control over this factor and apply different methods, the load factor of the additional cargo is taken into account in the atmosfair Emissions Calculator.
5 www.flightguru.in

14
3.2.13 Intermediate results on carbon emissions The intermediate result is the amount of CO2 per passenger on a specific flight route, flown by a particular aircraft belonging to a particular airline based on the above-mentioned factors. The detailed data to back these calculations are stored in the atmosfair database for all routes worldwide and are updated every year. The atmosfair Emissions Calculator covers approximately 92% of global air traffic.
3.2.14 Displaying the results in the Emissions Calculator - The online calculator allows the user to select a particular aircraft type. The atmosfair
Emissions Calculator then calculates the carbon emissions based on the individual flight profile, the aircraft type, and the additional criteria mentioned above.
- If the user does not provide information about the aircraft type, the Emissions Calculator will produce an average value based on all aircraft types used by an airline flying the indicated route. The calculator then shows the results of the two best airlines on the indicated route as well as the value for an average airline (average of all airlines together that fly the indicated route).

15
4 Climate impact of non-carbon emissions Summary: Aircraft engines emit various pollutants that contribute directly or indirectly to raising global temperatures. Among them, carbon dioxide (CO2) is the easiest to explain in terms of origin
and effect. The combustion of kerosene produces CO2: the more kerosene is consumed; the more
CO2 is produced. CO2 is used as the basis for calculating climate damage. Other pollutants and
their effects can be summarized using an internationally recognized calculation method and these warming effects can hence be converted into those of CO2. First, the Emissions Calculator
calculates the fuel consumption per passenger and based on this result, determines the amount of CO2 that has a comparable effect to that of all other pollutants emitted by the flight added
together (effective CO2 emissions). This is the calculator’s final CO2 output, which atmosfair will
then offset through climate protection projects. The degree of climate impact for emissions and their effects depends on the altitude and the state of the atmosphere at the time of the flight and when the aircraft emits the pollutants. The Emissions Calculator only processes the non-carbon emissions when the flight profile exceeds 9000 m altitude. For a short-haul flight of 400 km, the amount of time spent at over 9000 m usually equals 0% of the flight profile (depending on the aircraft type) and then gradually rises to over 90% (for distances of 10,000 km and beyond). In order to properly include the effect of those emissions in the calculations, the CO2-emissions produced at over 9000 m are multiplied by two and then
added to the actual carbon emissions (“factor 3”). The effects those pollutants have on the climate have been described in detail by the IPCC, the Intergovernmental Panel on Climate Change (IPCC 1999, 2013), and by subsequent studies directly based on the IPCC’s findings (Grassl, Brockhagen 2007). This document will only address the major pollutants and their effects.
4.1 Nitrogen oxides and ozone The formation of the greenhouse gas ozone from nitrogen oxides induced by the radiations of the sun is a process similar to the chemical smog reactions of nitrogen oxides coming from car exhausts in big cities in the summertime. However, at altitudes of over 9 kilometers, this smog reaction is much more effective than at ground level, which is due to the surrounding concentration of nitrogen oxides. A low concentration of nitrogen oxides allows ozone to form quickly. With a high concentration on the other hand, additional nitrogen oxides might even result in ozone being broken down again. It is therefore crucial to know how busy the taken flight route is and whether the aircraft climbs to critical altitudes.
4.2 Particles and ice clouds: Long-lasting condensation trails and high hazy ice clouds can only be formed if the air through which the aircraft flies is sufficiently humid and cold enough6. Along the equator, this can only happen at very high altitudes of 12 to 16 kilometers above sea level. Because modern civil jets rarely fly at such altitudes, condensation trails and ice clouds are less likely to form than at more moderate latitudes and the polar regions. There, these clouds can be formed at altitudes of only 5 kilometers. Humidity also usually depends on the time of year, which means that seasons have a direct influence on the probability of occurrence of these aircraft-made clouds.
6 Oversaturation in terms of ice

16
4.3 Incorporating emissions in the Emissions Calculator These effects cannot be addressed in detail by the Emissions Calculator. Addressing them would require an amount of data disproportionate to the accuracy thus achieved. Furthermore, neither the passengers nor the airlines are able to alter the state of the atmosphere at the place and time of the flight route. It would therefore be rather unfair to have passengers pay higher surcharge rates than others. Consequently, the Emissions Calculator only processes the most important systemic parameter, the flight altitude, and emissions produced at altitudes of over 9 kilometers are subjected to a factor of 3. This means that the effects of condensation trails, ice clouds, and ozone generated by nitrogen oxides are shown in the calculation by using average values. Since some flights do not even reach these altitudes, and all other flights also partly emit under 9 kilometers (during take-off and landing), an average of all flights worldwide yields an average RFI factor of approximately 2.7.
4.4 Climate impact measurement metrics: RFI vs. GWP The climate impact of non-carbon emissions in high altitudes can be converted into the warming impact of a specific amount of CO2 using so-called metrics.
RFI This metric, the Radiative Forcing Index (RFI), is based on the radiative propulsion of pollutants, in other words, the direct change of the atmosphere’s energy balance that is caused by the introduction of a pollutant. The RFI expresses the ratio between the balance of energy changes in the atmosphere and the pollutants, which are emitted at a given time by the global air traffic in the atmosphere. Currently, this ratio lies at approximately 3 to 1 (factor 3). According to this metric, the direct warming effect of all pollutants emitted by air traffic (carbon and non-carbon) is three times higher than that of carbon emissions alone (IPCC, 1999), which means that every flight is three times more harmful to the climate than only its pure carbon emissions7. The downside to the RFI as a metric is that while evaluating non-carbon emissions on constant air traffic patterns, it does not stay constant itself: A fleet that globally keeps a constant and regular flying pattern over numerous years would see its carbon emissions accumulate because of the long lifetime of CO2, whereas the non-carbon emissions would stay the same (always the same
amount of ozone or cirrus clouds). The current RFI value is 3 (IPCC, 2013 for cirrus clouds and condensation trails; Lee et al., 2010 for all other effects). GWP
While the RFI was developed in 1999 by the IPCC to capture the climate impact of non-carbon emissions, there are many other metrics today to measure air traffic (as of 2016). These include the Global Warming Potential (GWP), which has been used by the IPCC in other domains since 1990 to compare the climate impact of long-lasting greenhouse gases. The GWP integrates the current warming effect of a greenhouse gas over a specific period of time (e.g. 100 years after the emission) during which the gas concentration in the atmosphere diminishes and compares this with that of a ton of CO2 emitted at the start of the same time period. Therefore, time plays a more
prominent role in the GWP than in RFI. Until recently, the GWP was only applicable to long-lasting greenhouse gases, whereas air traffic mainly emits short-lived greenhouse gases. Research has derived a method that can also be used to infer a GWP for air traffic (Lee et al. 2010). The literature shows following assumptions:
7 an example: the overall climate effect equivalent to 6 tons of CO2 instead of just the 2 tons of actually emitted CO2.

17
- GWP timeframe 100 years - Discounting (Azar et al., 2012): 3%
- Accumulated RF air traffic CO2 in 2005 (Lee et al., 2010) 28mW/m2
- Pollutants and effects (Lee et al. 2010 and IPCC, 2013) O3, methane, H2O,
sulfates, soot, cirrus clouds, and induced cirrus clouds
- Level of Scientific Understanding (IPCC, 2013): no less than ‘low’ (‘very low’ excluded)
According to David Lee's method, these data result in a GWP100 (Lee et. al., 2010, Azar et al., 2012), a "GWP-based mark-up factor" of 3. This shows that the two metrics, RFI and GWP have similar quantitative results even though their qualitative aspects differ.
4.5 Deducing the climate impact of non-CO2 emissions Based on actual research findings, there is a factor of 3 for non-carbon emissions applied to carbon emissions. This is a conservative, quantitative-qualitative average value based on two metrics (RFI and GWP) and their bandwidths. Both metrics present the same numerical value, whereby the higher-value GWP even has a smaller bandwidth. This actual value of 3 is exactly in the middle of the old IPCC bandwidth of the RFI, which was indicated to be 2-4 by the IPCC in 1999. Inclusion in the atmosfair Emissions Calculator Consequently, all carbon emissions produced during a flight at over 9 kilometers are multiplied by 3 to correctly render the flight’s climate impact in CO2. Carbon emissions emitted at altitudes of less than 99 kilometers are not submitted to any alterations and are directly included in the flight’s carbon footprint.

18
5 Data sources Summary: The Emissions Calculator only uses independent scientific databases and therefore only relies on independent scientific studies commissioned by the Umweltbundesamt (German Environment Agency), the United Nations, or the EU. Additional information comes from published specialized literature, relevant directories or specialized database services. The atmosfair Emissions Calculator calculates the carbon emissions of a flight based on the detailed method of the atmosfair Airline Index (AAI). The data sources are a key element of the AAI. The AAI poses high standards in terms of quality, depth, actuality, and independency of the information. The AAI exclusively relies on databases from international organizations or long-lasting and well-established specialized service providers. The AAI never uses information published by the airlines on their website, in their business reports, or their own statistics etc. To insure data quality, the AAI covers every influential factor with at least two independent sources which are subjected to consistency checks. The AAI’s relevant influential factors are derived from following sources:
5.1 Piano-X The database and software ”Piano-X“ by Lissys Ltd is used for the calculation of an aircraft’s fuel consumption and emissions (PIANOX, 2008). Lissys Ltd is a company based in the United-Kingdom. Aircraft manufacturers, aviation authorities, universities, and research centers use Piano-x (see appendix 2). Even the ICAO uses it for its own Emissions Calculator. Lissys Ltd.’s Piano-X calculates the fuel consumption of all aircraft types in relation to flight distance and the payload carried. The program yields all construction-related flight parameters8. The flight profile on a given flight distance is determined by the program internally. The fuel consumption and emission values on which the fuel calculation is based correspond to those of a standard engine typical for the respective aircraft. Piano-X also calculates the amount of necessary fuel automatically, unless specified otherwise. In terms of reserve fuel, the program uses similar standard calculations for all aircraft types.
5.2. ICAO The ICAO is the International Civil Aviation Organization, which is based in Montreal. The ICAO offers access to diverse operational and technical data on global air traffic. This data is collected as part of the ”statistics programme” which was launched in 1947. Moreover, the program analyses and processes airline data provided by the ICAO-member states, or rather by their government authorities. ICAO TFS The ICAO Traffic by Flight Stage database (TFS) provides the passenger and cargo capacity as well as load for international scheduled services on a City Pair / airline / aircraft type level. As this database is incomplete, the AAI also refers to other additional sources9. ICAO Engine Emissions Database The ICAO Engine Emission database contains (among others) NOx emission values of all common aircraft engines for four different standard thrust settings10.
8 e.g. drag and lift in relation to flap settings and thrust 9 see below, OAG, Airline Data, IATA WATS 10 see ICAO Engine Emission Database

19
5.3 ATI – Air Transport Intelligence ATI is an online intelligence service by FlightGlobal that provides edited air traffic data to the ICAO11. The AAI uses following data from ATI (Airline Business Premium:
- Number of passengers of an airline - Passenger load factors of an airline - Supply and demand of passenger kilometers of an airline - The 200 largest airlines in the world (ordered financially or by transport service) - Catalogue of the world’s 25 largest low-cost airlines.
5.4 OAG – UBM The Official Airline Guide (OAG) is a business branch of United Business Media Limited, a media company based in the United-Kingdom. OAG has been publishing the Official Aviation Guide since 1929 (limited back then to the USA and only 35 airlines). The OAG is located right between the airlines and the flight ticket sales systems. Its database contains all flight schedules of all airlines that submit their plans to OAG. This database contains actual and detailed information about completed and planned flights, especially aircraft types as well as cargo and passenger load (OAG, 2003). The procedure for incorporating plans into the database is as follows: Airlines send their flight schedules at intervals of their choice (daily, weekly, monthly etc.) to the OAG. These undergo quality control and are subsequently standardized to be incorporated in the database to finally be sent to all computerized reservation services of travel agencies and airlines, online booking platforms, industry analysts, publishers, authorities, and to the aircraft industry’s service providers. This service is free of charge for airlines. The incentive for the airlines to provide their flight schedules results from the subsequent marketing opportunities for their flight capacities. On its website, the OAG claims to be the most trusted provider of flight schedules worldwide. By comparing the 2009 OAG’s number of global passengers (2031 million passengers) to the IATA’s number of 2228 million passengers12, we can calculate that the OAG accomplishes 92% coverage of global air traffic. The missing passengers are most likely due to small regional airlines that do not wish to participate in the ticket booking services. In addition to the OAG, the AAI retrieves data about an airline’s number of passengers from ATI. These airlines provide their flights schedules to OAG without exception which means that the relevant coverage for the AAI is 100%.
5.5 Airline Data T100 International Database Products Inc. (Airline Data) is a company based in the USA. Airline Data offers flight data of the USA market, obtained by the United States Department of Transportation (DOT) (DATA BASE PRODUCTS, 2011). The Airline Data T100I contains detailed data for the US market (flights within, to and from the USA), including passenger capacity and load as well as cargo capacity and load.
5.6 JP Airline Fleets International The JP Airline Fleets International (JP) catalog has been published by the BUCHair (USA) Inc. for over 40 years13. The JP catalogue contains detailed information about airline fleets worldwide
11 go to FlightGlobal website: https://www.flightglobal.com/services/data-feeds/ 12 www.iata.org/publications/store/Pages/world-air-transport-statistics.aspx 13 go to: www.buchair.com

20
including exact aircraft type designation and their engines. Additional notes indicate the presence of winglets.
5.7 IATA WATS The World Air Transport Statistics (WATS) catalog has been published by the International Air Transport Association (IATA) for over 50 years14. WATS lists the load capacity factors for passenger and cargo of the world's largest airlines, distinguishing between national and international flights.
5.8 Aero Secure AeroSecure is a commercial database service which, according to its own information, has databases on safety-related information of several hundred large airlines and offers this data to customers in the media and travel industry15. AeroSecure divides the airlines into different categories, some of which have been adopted in the AAI.
14 go to: www.iata.org/publications/store/Pages/world-air-transport-statistics.aspx 15 go to: www.aerosecure.de/

21
6 Precision of methods and results Summary: The Emissions Calculator is based on methods and databases that allow an appropriately accurate calculation of a flight’s climate impact. Depending on the customer’s input, the Emissions Calculator proceeds at different levels of precision. The key factors of a flight’s climate impact are captured and displayed. Data sources and methods are of high quality and reflect the current state of science.
6.1 Uncertainty factors The AAI calculations are subject to an average total error of ± 1.3 efficiency points with a confidence level of 95% (atmosfair, AAI 2013). Additionally, errors in influence factors that have not been included in the AAI as they do not produce an important enough difference between the airlines (atmosfair, AAI 2013) must also be considered. This results in a total error of ±1.5 efficiency points for the AAI ranking. As a confidence level of 95% was expected, the AAI Airlines can differentiate significantly between those whose efficiency points differ by more than 1.5 efficiency points.
6.2 Data quality
The databases are at the heart of the AAI. The AAI places high standards in terms of quality, depth, actuality, and independency of the information. The AAI exclusively relies on databases provided by international organizations or from long-standing and well-established specialized service providers. Under no circumstances did the AAI use information published by the airlines on their website, in their business reports, their own statistics, etc. In order to ensure data quality, the AAI covers every influencing factor with at least two independent sources, which are in turn subjected to consistency checks. The quality of this data is very high: Among other things, they were the starting point for emission inventories in the IPCC report commissioned by the United Nations.
6.3 Quality of the methodology The AAI methodology as well as the parameters used suffice to calculate the carbon emissions of different airlines on different routes with an inaccuracy factor of only 1.5% (atmosfair, AAI 2013).
6.4 Levels of precision The Emissions Calculator works at two different levels of precision.
1. If the user knows and enters the aircraft type into the Emissions Calculator, the aircraft type will determine the calculation process. The value calculated by the atmosfair Emissions Calculator directly accesses all important parameters in detail. The atmosfair Emissions Calculator currently offers 74 aircraft types and their variants which can be selected.
2. If the user does not specify the aircraft type, the Calculator will create an average value of all aircrafts of all airlines that fly the given route. The Calculator then displays the two best airlines on the given route as well as the value for an average airline.16
16 Average of all airlines that fly the given route

22
7 Bibliography
atmosfair, AAI 2013: atmosfair Airline Index – Dokumentation der Berechnungsmethode, Berlin 2013, available on: https://www.atmosfair.de/de/atmosfair_airline_index
Azar et al., 2012: ”Valuing the non-CO2 climate impacts of aviation“. Climatic Change Volume 111 (2012), 559 – 579
Brockhagen, Dietrich 1995: Der Flugverkehr der Stadt Koln und das Klimabundnis. Wuppertal Papers Nr. 43, Wuppertal: Wuppertal Institut fur Klima, Umwelt, Energie.
Bucher, 2007: ”JP Airline-Fleets International„. Zurich, Switzerland: Bucher & Co., annual publication.
Cao et al., o.J.: ”JP Airline-Fleets International“. : A Preliminary Study on Operational Feasibility of Continuous Descent Approach. School of Aeronautics and Astronautics, Purdue University: http://web.ics.purdue.edu/~cao20/_private/report.pdf (01.03.11)
DATA BASE PRODUCTS (2011): product description from the Data Base homepage; accessed on 23.02.2011 (www.airlinedata.com/CurrentData.htm )
DLR 2000: Database with emissions profiles of civil jets; issued by the Deutschen Zentrum für Luft- und Raumfahrt as part of the study: “Maßnahmen zur verursacherbezogenen Schadstoffreduzierung des zivilen Flugverkehrs“, F + E – Project 105 06 085 on behalf of the Umweltbundesamt, TUV-Rheinland, DIW, Wuppertal Institut fur Umwelt, Klima, Energie. The databases are held by the German Environment Agency.
ICAO 2010: ”ICAO Carbon Emissions Calculator“. Version 3, Montreal 2010
IPCC 1999: ”Aviation and the Global Atmosphere“. A Special Report of IPCC Working Groups I and III in collaboration with the Scientific Assessment Panel to the Montreal Protocol on Substances that Deplete the Ozone Layer. J.E.Penner, D.H.Lister, D.J.Griggs, D.J.Dokken, M.McFarland (Eds.), Cambridge University Press, UK.
IPCC 2013: ”Changes in Atmospheric Constituents and in Radiative Forcing“. In: Climate Change 2007: The Physical Science Basis. Contribution of Working Group I to the Fourth Assessment Report of the Intergovernmental Panel on Climate Change [Solomon, S., D. Qin, M. Manning, Z. Chen, M. Marquis, K.B. Averyt, M.Tignor and H.L. Miller (eds.)]. Cambridge University Press, Cambridge, United Kingdom and New York, NY, USA.
Grassl, H and Brockhagen, D. 2007 Climate forcing of aviation emissions in high altitudes and comparison of metrics. An update according to the Fourth Assessment Report, IPCC 2007. MPI, Hamburg, 2007, accessible at: http://www.mpimet.mpg.de/wissenschaft/publikationen.html
Lee et al. 2010: ”transport impacts on atmosphere and climate: aviation“, atmospheric environment 44 (2010), 4678 – 4734
OAG (2003): About OAG data, website of OAG data http://oagdata.com/aboutoagdata/overview.aspx)

23
PIANOX (2008): Aircraft Emissions Performance. User s Guide, Piano-X © 2008 Lissys Ltd, London
UBA 2008: ”Klimawirksamkeit des Flugverkehrs. Aktueller wissenschaftlicher Kenntnisstand uber die Effekte des Flugverkehrs“, Umweltbundesamt, Dessau, March 2008.