Atmos Energy Corporation · active Data File required to be submitted and posted pursuant to Rule...
118
UNITED STATES SECURITIES AND EXCHANGE COMMISSION Washington, D.C. 20549 Form 10-K (Mark One) Í ANNUAL REPORT PURSUANT TO SECTION 13 OR 15(d) OF THE SECURITIES EXCHANGE ACT OF 1934 For the fiscal year ended September 30, 2015 OR ‘ TRANSITION REPORT PURSUANT TO SECTION 13 OR 15(d) OF THE SECURITIES EXCHANGE ACT OF 1934 For the transition period from to Commission file number 1-10042 Atmos Energy Corporation (Exact name of registrant as specified in its charter) Texas and Virginia 75-1743247 (State or other jurisdiction of incorporation or organization) (IRS employer identification no.) Three Lincoln Centre, Suite 1800 5430 LBJ Freeway, Dallas, Texas 75240 (Address of principal executive offices) (Zip code) Registrant’s telephone number, including area code: (972) 934-9227 Securities registered pursuant to Section 12(b) of the Act: Title of Each Class Name of Each Exchange on Which Registered Common stock, No Par Value New York Stock Exchange Securities registered pursuant to Section 12(g) of the Act: None Indicate by check mark if the registrant is a well-known seasoned issuer, as defined in Rule 405 of the Securities Act. Yes Í No ‘ Indicate by check mark if the registrant is not required to file reports pursuant to Section 13 or Section 15(d) of the Act. Yes ‘ No Í Indicate by check mark whether the registrant (1) has filed all reports required to be filed by Section 13 or 15(d) of the Securities Exchange Act of 1934 during the preceding 12 months (or for such shorter period that the registrant was required to file such reports), and (2) has been subject to such filing requirements for the past 90 days. Yes Í No ‘ Indicate by check mark whether the registrant has submitted electronically and posted on its corporate Web site, if any, every Inter- active Data File required to be submitted and posted pursuant to Rule 405 of Regulation S-T (§ 232.405 of this chapter) during the preceding 12 months (or for such shorter period that the registrant was required to submit and post such files). Yes Í No ‘ Indicate by check mark if disclosure of delinquent filers pursuant to Item 405 of Regulation S-K (§ 229.45) is not contained herein, and will not be contained, to the best of registrant’s knowledge, in definitive proxy or information statements incorporated by reference in Part III of this Form 10-K or any amendment to this Form 10-K. ‘ Indicate by check mark whether the registrant is a large accelerated filer, an accelerated filer, a non-accelerated filer or a smaller reporting company. See definitions of “large accelerated filer,” “accelerated filer” and “smaller reporting company” in Rule 12b-2 of the Exchange Act. (Check one): Large accelerated filer Í Accelerated filer ‘ Non-accelerated filer ‘ Smaller reporting company ‘ (Do not check if a smaller reporting company) Indicate by check mark whether the registrant is a shell company (as defined in Rule 12b-2 of the Act). Yes ‘ No Í The aggregate market value of the common voting stock held by non-affiliates of the registrant as of the last business day of the registrant’s most recently completed second fiscal quarter, March 31, 2015, was $5,500,632,050. As of October 30, 2015, the registrant had 101,506,645 shares of common stock outstanding. DOCUMENTS INCORPORATED BY REFERENCE Portions of the registrant’s Definitive Proxy Statement to be filed for the Annual Meeting of Shareholders on February 3, 2016 are incorporated by reference into Part III of this report.
Transcript of Atmos Energy Corporation · active Data File required to be submitted and posted pursuant to Rule...

UNITED STATES SECURITIES AND EXCHANGE COMMISSIONWashington, D.C. 20549
Form 10-K(Mark One)
Í ANNUAL REPORT PURSUANT TO SECTION 13 OR 15(d)OF THE SECURITIES EXCHANGE ACT OF 1934For the fiscal year ended September 30, 2015
OR‘ TRANSITION REPORT PURSUANT TO SECTION 13 OR 15(d)
OF THE SECURITIES EXCHANGE ACT OF 1934For the transition period from to
Commission file number 1-10042
Atmos Energy Corporation(Exact name of registrant as specified in its charter)
Texas and Virginia 75-1743247(State or other jurisdiction of
incorporation or organization)(IRS employer
identification no.)
Three Lincoln Centre, Suite 18005430 LBJ Freeway, Dallas, Texas 75240
(Address of principal executive offices) (Zip code)
Registrant’s telephone number, including area code:(972) 934-9227
Securities registered pursuant to Section 12(b) of the Act:
Title of Each ClassName of Each Exchange
on Which Registered
Common stock, No Par Value New York Stock ExchangeSecurities registered pursuant to Section 12(g) of the Act:
None
Indicate by check mark if the registrant is a well-known seasoned issuer, as defined in Rule 405 of the SecuritiesAct. Yes Í No ‘
Indicate by check mark if the registrant is not required to file reports pursuant to Section 13 or Section 15(d) of theAct. Yes ‘ No Í
Indicate by check mark whether the registrant (1) has filed all reports required to be filed by Section 13 or 15(d) of the SecuritiesExchange Act of 1934 during the preceding 12 months (or for such shorter period that the registrant was required to file such reports),and (2) has been subject to such filing requirements for the past 90 days. Yes Í No ‘
Indicate by check mark whether the registrant has submitted electronically and posted on its corporate Web site, if any, every Inter-active Data File required to be submitted and posted pursuant to Rule 405 of Regulation S-T (§ 232.405 of this chapter) during thepreceding 12 months (or for such shorter period that the registrant was required to submit and post such files). Yes Í No ‘
Indicate by check mark if disclosure of delinquent filers pursuant to Item 405 of Regulation S-K (§ 229.45) is not contained herein,and will not be contained, to the best of registrant’s knowledge, in definitive proxy or information statements incorporated by referencein Part III of this Form 10-K or any amendment to this Form 10-K. ‘
Indicate by check mark whether the registrant is a large accelerated filer, an accelerated filer, a non-accelerated filer or a smallerreporting company. See definitions of “large accelerated filer,” “accelerated filer” and “smaller reporting company” in Rule 12b-2 of theExchange Act. (Check one):
Large accelerated filer Í Accelerated filer ‘ Non-accelerated filer ‘ Smaller reporting company ‘
(Do not check if a smaller reporting company)
Indicate by check mark whether the registrant is a shell company (as defined in Rule 12b-2 of the Act). Yes ‘ No Í
The aggregate market value of the common voting stock held by non-affiliates of the registrant as of the last business day of theregistrant’s most recently completed second fiscal quarter, March 31, 2015, was $5,500,632,050.
As of October 30, 2015, the registrant had 101,506,645 shares of common stock outstanding.
DOCUMENTS INCORPORATED BY REFERENCE
Portions of the registrant’s Definitive Proxy Statement to be filed for the Annual Meeting of Shareholders on February 3, 2016 areincorporated by reference into Part III of this report.

TABLE OF CONTENTS
Page
Glossary of Key Terms . . . . . . . . . . . . . . . . . . . . . . . . . . . . . . . . . . . . . . . . . . . . . . . . . . . . . . . . . . . . . . . . . 3
Part IItem 1. Business . . . . . . . . . . . . . . . . . . . . . . . . . . . . . . . . . . . . . . . . . . . . . . . . . . . . . . . . . . . . . . . . . . . . . 4
Item 1A. Risk Factors . . . . . . . . . . . . . . . . . . . . . . . . . . . . . . . . . . . . . . . . . . . . . . . . . . . . . . . . . . . . . . . . . . 14
Item 1B. Unresolved Staff Comments . . . . . . . . . . . . . . . . . . . . . . . . . . . . . . . . . . . . . . . . . . . . . . . . . . . . . 20
Item 2. Properties . . . . . . . . . . . . . . . . . . . . . . . . . . . . . . . . . . . . . . . . . . . . . . . . . . . . . . . . . . . . . . . . . . . . 20
Item 3. Legal Proceedings . . . . . . . . . . . . . . . . . . . . . . . . . . . . . . . . . . . . . . . . . . . . . . . . . . . . . . . . . . . . . 22
Item 4. Mine Safety Disclosures . . . . . . . . . . . . . . . . . . . . . . . . . . . . . . . . . . . . . . . . . . . . . . . . . . . . . . . . . 22
Part IIItem 5. Market for Registrant’s Common Equity, Related Stockholder Matters and Issuer Purchases of
Equity Securities . . . . . . . . . . . . . . . . . . . . . . . . . . . . . . . . . . . . . . . . . . . . . . . . . . . . . . . . . . . . . . . 22
Item 6. Selected Financial Data . . . . . . . . . . . . . . . . . . . . . . . . . . . . . . . . . . . . . . . . . . . . . . . . . . . . . . . . . 24
Item 7. Management’s Discussion and Analysis of Financial Condition and Results of Operations . . . . 25
Item 7A. Quantitative and Qualitative Disclosures About Market Risk . . . . . . . . . . . . . . . . . . . . . . . . . . . . 48
Item 8. Financial Statements and Supplementary Data . . . . . . . . . . . . . . . . . . . . . . . . . . . . . . . . . . . . . . . 49
Item 9. Changes in and Disagreements With Accountants on Accounting and Financial Disclosure . . . . 109
Item 9A. Controls and Procedures . . . . . . . . . . . . . . . . . . . . . . . . . . . . . . . . . . . . . . . . . . . . . . . . . . . . . . . . . 109
Item 9B. Other Information . . . . . . . . . . . . . . . . . . . . . . . . . . . . . . . . . . . . . . . . . . . . . . . . . . . . . . . . . . . . . . 111
Part IIIItem 10. Directors, Executive Officers and Corporate Governance . . . . . . . . . . . . . . . . . . . . . . . . . . . . . . . 111
Item 11. Executive Compensation . . . . . . . . . . . . . . . . . . . . . . . . . . . . . . . . . . . . . . . . . . . . . . . . . . . . . . . . 112
Item 12. Security Ownership of Certain Beneficial Owners and Management and Related StockholderMatters . . . . . . . . . . . . . . . . . . . . . . . . . . . . . . . . . . . . . . . . . . . . . . . . . . . . . . . . . . . . . . . . . . . . . . 112
Item 13. Certain Relationships and Related Transactions, and Director Independence . . . . . . . . . . . . . . . . 112
Item 14. Principal Accountant Fees and Services . . . . . . . . . . . . . . . . . . . . . . . . . . . . . . . . . . . . . . . . . . . . 112
Part IVItem 15. Exhibits and Financial Statement Schedules . . . . . . . . . . . . . . . . . . . . . . . . . . . . . . . . . . . . . . . . . 112

GLOSSARY OF KEY TERMS
AEC . . . . . . . . . . . . . . . . . . . . . . . . . . . . Atmos Energy Corporation
AEH . . . . . . . . . . . . . . . . . . . . . . . . . . . . Atmos Energy Holdings, Inc.
AEM . . . . . . . . . . . . . . . . . . . . . . . . . . . Atmos Energy Marketing, LLC
AOCI . . . . . . . . . . . . . . . . . . . . . . . . . . . Accumulated Other Comprehensive Income
APS . . . . . . . . . . . . . . . . . . . . . . . . . . . . Atmos Pipeline and Storage, LLC
ATO . . . . . . . . . . . . . . . . . . . . . . . . . . . . Trading symbol for Atmos Energy Corporation common stock on theNew York Stock Exchange
Bcf . . . . . . . . . . . . . . . . . . . . . . . . . . . . . Billion cubic feet
CFTC . . . . . . . . . . . . . . . . . . . . . . . . . . . Commodity Futures Trading Commission
COSO . . . . . . . . . . . . . . . . . . . . . . . . . . Committee of Sponsoring Organizations of the Treadway Commission
ERISA . . . . . . . . . . . . . . . . . . . . . . . . . . Employee Retirement Income Security Act of 1974
FASB . . . . . . . . . . . . . . . . . . . . . . . . . . . Financial Accounting Standards Board
FERC . . . . . . . . . . . . . . . . . . . . . . . . . . . Federal Energy Regulatory Commission
Fitch . . . . . . . . . . . . . . . . . . . . . . . . . . . . Fitch Ratings, Ltd.
GAAP . . . . . . . . . . . . . . . . . . . . . . . . . . Generally Accepted Accounting Principles
GRIP . . . . . . . . . . . . . . . . . . . . . . . . . . . Gas Reliability Infrastructure Program
GSRS . . . . . . . . . . . . . . . . . . . . . . . . . . . Gas System Reliability Surcharge
KPSC . . . . . . . . . . . . . . . . . . . . . . . . . . . Kentucky Public Service Commission
LTIP . . . . . . . . . . . . . . . . . . . . . . . . . . . 1998 Long-Term Incentive Plan
Mcf . . . . . . . . . . . . . . . . . . . . . . . . . . . . Thousand cubic feet
MDWQ . . . . . . . . . . . . . . . . . . . . . . . . . Maximum daily withdrawal quantity
Mid-Tex Cities . . . . . . . . . . . . . . . . . . . Represents all incorporated cities other than Dallas, or approximately80 percent of the Mid-Tex Division’s customers, with whom asettlement agreement was reached during the fiscal 2008 secondquarter.
MMcf . . . . . . . . . . . . . . . . . . . . . . . . . . . Million cubic feet
Moody’s . . . . . . . . . . . . . . . . . . . . . . . . Moody’s Investor Service, Inc.
NYMEX . . . . . . . . . . . . . . . . . . . . . . . . New York Mercantile Exchange, Inc.
NYSE . . . . . . . . . . . . . . . . . . . . . . . . . . New York Stock Exchange
PAP . . . . . . . . . . . . . . . . . . . . . . . . . . . . Pension Account Plan
PPA . . . . . . . . . . . . . . . . . . . . . . . . . . . . Pension Protection Act of 2006
RRC . . . . . . . . . . . . . . . . . . . . . . . . . . . . Railroad Commission of Texas
RRM . . . . . . . . . . . . . . . . . . . . . . . . . . . Rate Review Mechanism
RSC . . . . . . . . . . . . . . . . . . . . . . . . . . . . Rate Stabilization Clause
S&P . . . . . . . . . . . . . . . . . . . . . . . . . . . . Standard & Poor’s Corporation
SEC . . . . . . . . . . . . . . . . . . . . . . . . . . . . United States Securities and Exchange Commission
SRF . . . . . . . . . . . . . . . . . . . . . . . . . . . . Stable Rate Filing
WNA . . . . . . . . . . . . . . . . . . . . . . . . . . . Weather Normalization Adjustment
3

PART I
The terms “we,” “our,” “us”, “Atmos Energy” and the “Company” refer to Atmos Energy Corporation andits subsidiaries, unless the context suggests otherwise.
ITEM 1. Business.
Overview and Strategy
Atmos Energy Corporation, headquartered in Dallas, Texas, and incorporated in Texas and Virginia, isengaged primarily in the regulated natural gas distribution and pipeline businesses as well as other nonregulatednatural gas businesses. We deliver natural gas through regulated sales and transportation arrangements to overthree million residential, commercial, public authority and industrial customers in eight states located primarilyin the South, which makes us one of the country’s largest natural-gas-only distributors based on number of cus-tomers. We also operate one of the largest intrastate pipelines in Texas based on miles of pipe.
Our nonregulated businesses provide natural gas management, marketing, transportation and storage serv-ices to municipalities, local gas distribution companies, including certain of our natural gas distribution divisionsand industrial customers principally in the Midwest and Southeast.
Atmos Energy’s vision is to be the safest provider of natural gas services. We intend to achieve this visionby:
‰ operating our business exceptionally well
‰ investing in our people and infrastructure
‰ enhancing our culture.
We believe the successful execution of this strategy has delivered excellent shareholder value. Over the lastseven years, we have achieved growth by implementing rate designs that reduce or eliminate regulatory lag andseparate the recovery of our approved margins from customer usage patterns. In addition, we have developedvarious commercial opportunities within our regulated transmission and storage operations.
Our core values include focusing on our employees and customers while conducting our business withhonesty and integrity. We continue to strengthen our culture through ongoing communications with our employ-ees and enhanced employee training.
Operating Segments
We operate the Company through the following three segments:
‰ The regulated distribution segment, which includes our regulated distribution and related sales operations
‰ The regulated pipeline segment, which includes the pipeline and storage operations of our Atmos Pipeline— Texas Division and
‰ The nonregulated segment, which includes our nonregulated natural gas management, nonregulated natu-ral gas transmission, storage and other services.
These operating segments are described in greater detail below.
4

Regulated Distribution Segment Overview
Our regulated distribution segment is comprised of our six regulated natural gas distribution divisions. This seg-ment represents approximately 65 percent of our consolidated net income. The following table summarizes keyinformation about these divisions, presented in order of total rate base. We operate in our service areas under terms ofnon-exclusive franchise agreements granted by the various cities and towns that we serve. At September 30, 2015, weheld 1,005 franchises having terms generally ranging from five to 35 years. A significant number of our franchisesexpire each year, which require renewal prior to the end of their terms. Historically, we have successfully renewedthese franchises and believe that we will continue to be able to renew our franchises as they expire.
Division Service AreasCommunities
ServedCustomer
Meters
Mid-Tex . . . . . . . . . . . . . . . . . . . . . . . . . . . . . . . . . . . . . Texas, includingthe Dallas/Fort
WorthMetroplex
550 1,629,826
Kentucky/Mid-States . . . . . . . . . . . . . . . . . . . . . . . . . . . Kentucky 230 180,033Tennessee 141,141Virginia 23,567
Louisiana . . . . . . . . . . . . . . . . . . . . . . . . . . . . . . . . . . . . Louisiana 300 356,579
West Texas . . . . . . . . . . . . . . . . . . . . . . . . . . . . . . . . . . . Amarillo,Lubbock,Midland
80 305,814
Mississippi . . . . . . . . . . . . . . . . . . . . . . . . . . . . . . . . . . . Mississippi 110 266,467
Colorado-Kansas . . . . . . . . . . . . . . . . . . . . . . . . . . . . . . Colorado 170 115,048Kansas 132,837
Revenues in this operating segment are established by regulatory authorities in the states in which we oper-ate. These rates are intended to be sufficient to cover the costs of conducting business and to provide a reasonablereturn on invested capital. In addition, we transport natural gas for others through our distribution system.
Rates established by regulatory authorities often include cost adjustment mechanisms for costs that (i) aresubject to significant price fluctuations compared to our other costs, (ii) represent a large component of our costof service and (iii) are generally outside our control.
Purchased gas cost adjustment mechanisms represent a common form of cost adjustment mechanism. Pur-chased gas cost adjustment mechanisms provide natural gas distribution companies a method of recovering pur-chased gas costs on an ongoing basis without filing a rate case because they provide a dollar-for-dollar offset toincreases or decreases in natural gas distribution gas costs. Therefore, although substantially all of our dis-tribution operating revenues fluctuate with the cost of gas that we purchase, distribution gross profit (which isdefined as operating revenues less purchased gas cost) is generally not affected by fluctuations in the cost of gas.
Additionally, some jurisdictions have performance-based ratemaking adjustments to provide incentives todistribution companies to minimize purchased gas costs through improved storage management and use of finan-cial instruments to lock in gas costs. Under the performance-based ratemaking adjustment, purchased gas costssavings are shared between the utility and its customers.
Our supply of natural gas is provided by a variety of suppliers, including independent producers, marketersand pipeline companies and withdrawals of gas from proprietary and contracted storage assets. Additionally, thenatural gas supply for our Mid-Tex Division includes peaking and spot purchase agreements.
Supply arrangements consist of both base load and swing supply (peaking) quantities and are contractedfrom our suppliers on a firm basis with various terms at market prices. Base load quantities are those that flow ata constant level throughout the month and swing supply quantities provide the flexibility to change daily quanti-ties to match increases or decreases in requirements related to weather conditions.
5

Except for local production purchases, we select our natural gas suppliers through a competitive biddingprocess by periodically requesting proposals from suppliers that have demonstrated that they can provide reliableservice. We select these suppliers based on their ability to deliver gas supply to our designated firm pipelinereceipt points at the lowest reasonable cost. Major suppliers during fiscal 2015 were Anadarko Energy ServicesCompany, ConocoPhillips Company, Devon Gas Services, L.P., Enbridge Marketing (US) Inc., HydrocarbonExchange Corporation, Munich Re Trading Ltd, Targa Gas Marketing LLC, Targa Pipeline Mid-ContinentWestTex LLC, Tenaska Gas Storage, LLC, Texla Energy Management, Inc. and Atmos Energy Marketing, LLCand Trans Louisiana Gas Pipeline, Inc., wholly owned subsidiaries in our nonregulated segment.
The combination of base load, peaking and spot purchase agreements, coupled with the withdrawal of gasheld in storage, allows us the flexibility to adjust to changes in weather, which minimizes our need to enter intolong-term firm commitments. We estimate our peak-day availability of natural gas supply to be approximately4.4 Bcf. The peak-day demand for our distribution operations in fiscal 2015 was on January 7, 2015, when salesto customers reached approximately 3.2 Bcf.
Currently, our distribution divisions, except for our Mid-Tex Division, utilize 35 pipeline transportationcompanies, both interstate and intrastate, to transport our natural gas. The pipeline transportation agreements arefirm and many of them have “pipeline no-notice” storage service, which provides for daily balancing betweensystem requirements and nominated flowing supplies. These agreements have been negotiated with the shortestterm necessary while still maintaining our right of first refusal. The natural gas supply for our Mid-Tex Divisionis delivered primarily by our Atmos Pipeline — Texas Division.
To maintain our deliveries to high priority customers, we have the ability, and have exercised our right, tocurtail deliveries to certain customers under the terms of interruptible contracts or applicable state regulations orstatutes. Our customers’ demand on our system is not necessarily indicative of our ability to meet current oranticipated market demands or immediate delivery requirements because of factors such as the physical limi-tations of gathering, storage and transmission systems, the duration and severity of cold weather, the availabilityof gas reserves from our suppliers, the ability to purchase additional supplies on a short-term basis and actions byfederal and state regulatory authorities. Curtailment rights provide us the flexibility to meet the human-needsrequirements of our customers on a firm basis. Priority allocations imposed by federal and state regulatory agen-cies, as well as other factors beyond our control, may affect our ability to meet the demands of our customers.We anticipate no problems with obtaining additional gas supply as needed for our customers.
Regulated Pipeline Segment Overview
Our regulated pipeline segment consists of the pipeline and storage operations of our Atmos Pipeline -Texas Division (APT). APT is one of the largest intrastate pipeline operations in Texas with a heavy concen-tration in the established natural gas-producing areas of central, northern and eastern Texas, extending into ornear the major producing areas of the Barnett Shale, the Texas Gulf Coast and the Permian Basin of West Texas.APT’s primary business is providing firm transportation and storage services for our Mid-Tex Division and otherLDC customers. APT also provides interruptible transportation, storage and ancillary services for third partiesincluding, industrial and electric generation customers as well as producers, marketers and other shippers. Theregulated pipeline segment represents approximately 30 percent of our consolidated operations.
Gross profit earned from transportation and storage services for our Atmos Pipeline—Texas Division issubject to traditional ratemaking governed by the RRC. Rates are updated through annual filings made underTexas’ Gas Reliability Infrastructure Program (GRIP) and Rider REV. GRIP allows us to include in our ratesannually approved capital costs incurred in the prior calendar year provided that we file a complete rate case atleast once every five years. Atmos Pipeline-Texas’ existing regulatory mechanisms allow certain transportationand storage services to be provided under market-based rates. Rider REV is an annual adjustment mechanismthat adjusts the regulated rates for a portion of the variation in non-regulated annual revenues from a set baselevel.
6

Nonregulated Segment Overview
Our nonregulated operations are conducted through Atmos Energy Holdings, Inc. (AEH), a wholly-ownedsubsidiary of Atmos Energy Corporation, and typically represent approximately five percent of our consolidatednet income. AEH’s primary business is to buy, sell and deliver natural gas at competitive prices to approximately1,000 customers located primarily in the Midwest and Southeast areas of the United States. AEH accomplishesthis objective by aggregating and purchasing gas supply, arranging transportation and storage logistics and effec-tively managing commodity price risk. AEH also earns storage and transportation demand fees primarily fromour regulated distribution operations in Louisiana and Kentucky. These demand fees are subject to regulatoryoversight and are renewed periodically.
Ratemaking Activity
Overview
The method of determining regulated rates varies among the states in which our regulated businesses oper-ate. The regulatory authorities have the responsibility of ensuring that utilities in their jurisdictions operate in thebest interests of customers while providing utility companies the opportunity to earn a reasonable return on theirinvestment. Generally, each regulatory authority reviews rate requests and establishes a rate structure intended togenerate revenue sufficient to cover the costs of conducting business and to provide a reasonable return oninvested capital.
Our rate strategy focuses on reducing or eliminating regulatory lag, obtaining adequate returns and provid-ing stable, predictable margins, which benefit both our customers and the Company. As a result of our rate-making efforts in recent years, Atmos Energy has:
‰ Formula rate mechanisms in place in four states that provide for an annual rate review and adjustment torates.
‰ Infrastructure programs in place in four of our states that provide for an annual rate adjustment to rates.
‰ Implemented various rate mechanisms that allow us to recover over 90 percent of our capital expendituresare recovered within six months.
‰ Authorization in tariffs, statute, or commission rules that allows us to defer certain elements of our cost ofservice until they are included in rates, such as depreciation, ad valorem taxes and pension costs.
‰ WNA mechanisms in seven states that serve to minimize the effects of weather on approximately 97 per-cent of our distribution gross margin.
‰ The ability to recover the gas cost portion of bad debts in five states.
7
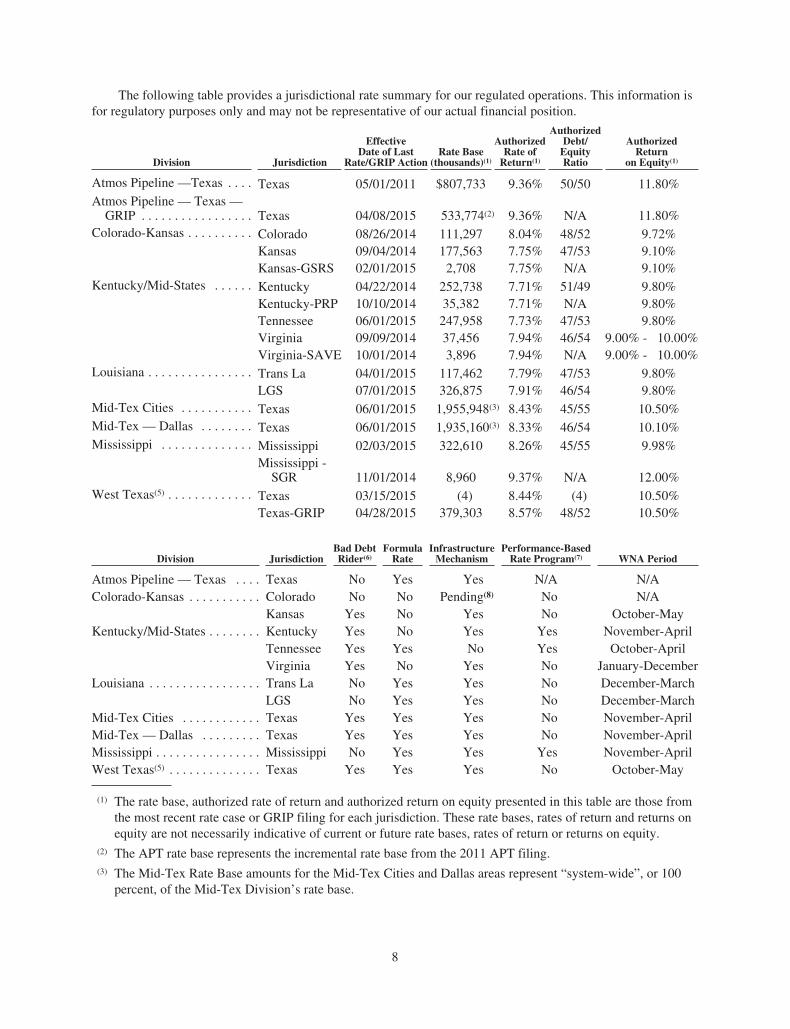
The following table provides a jurisdictional rate summary for our regulated operations. This information isfor regulatory purposes only and may not be representative of our actual financial position.
Division Jurisdiction
EffectiveDate of Last
Rate/GRIP ActionRate Base
(thousands)(1)
AuthorizedRate of
Return(1)
AuthorizedDebt/
EquityRatio
AuthorizedReturn
on Equity(1)
Atmos Pipeline —Texas . . . . Texas 05/01/2011 $807,733 9.36% 50/50 11.80%Atmos Pipeline — Texas —
GRIP . . . . . . . . . . . . . . . . . Texas 04/08/2015 533,774(2) 9.36% N/A 11.80%Colorado-Kansas . . . . . . . . . . Colorado 08/26/2014 111,297 8.04% 48/52 9.72%
Kansas 09/04/2014 177,563 7.75% 47/53 9.10%Kansas-GSRS 02/01/2015 2,708 7.75% N/A 9.10%
Kentucky/Mid-States . . . . . . Kentucky 04/22/2014 252,738 7.71% 51/49 9.80%Kentucky-PRP 10/10/2014 35,382 7.71% N/A 9.80%Tennessee 06/01/2015 247,958 7.73% 47/53 9.80%Virginia 09/09/2014 37,456 7.94% 46/54 9.00% - 10.00%Virginia-SAVE 10/01/2014 3,896 7.94% N/A 9.00% - 10.00%
Louisiana . . . . . . . . . . . . . . . . Trans La 04/01/2015 117,462 7.79% 47/53 9.80%LGS 07/01/2015 326,875 7.91% 46/54 9.80%
Mid-Tex Cities . . . . . . . . . . . Texas 06/01/2015 1,955,948(3) 8.43% 45/55 10.50%Mid-Tex — Dallas . . . . . . . . Texas 06/01/2015 1,935,160(3) 8.33% 46/54 10.10%Mississippi . . . . . . . . . . . . . . Mississippi 02/03/2015 322,610 8.26% 45/55 9.98%
Mississippi -SGR 11/01/2014 8,960 9.37% N/A 12.00%
West Texas(5) . . . . . . . . . . . . . Texas 03/15/2015 (4) 8.44% (4) 10.50%Texas-GRIP 04/28/2015 379,303 8.57% 48/52 10.50%
Division JurisdictionBad DebtRider(6)
FormulaRate
InfrastructureMechanism
Performance-BasedRate Program(7) WNA Period
Atmos Pipeline — Texas . . . . Texas No Yes Yes N/A N/AColorado-Kansas . . . . . . . . . . . Colorado No No Pending(8) No N/A
Kansas Yes No Yes No October-MayKentucky/Mid-States . . . . . . . . Kentucky Yes No Yes Yes November-April
Tennessee Yes Yes No Yes October-AprilVirginia Yes No Yes No January-December
Louisiana . . . . . . . . . . . . . . . . . Trans La No Yes Yes No December-MarchLGS No Yes Yes No December-March
Mid-Tex Cities . . . . . . . . . . . . Texas Yes Yes Yes No November-AprilMid-Tex — Dallas . . . . . . . . . Texas Yes Yes Yes No November-AprilMississippi . . . . . . . . . . . . . . . . Mississippi No Yes Yes Yes November-AprilWest Texas(5) . . . . . . . . . . . . . . Texas Yes Yes Yes No October-May
(1) The rate base, authorized rate of return and authorized return on equity presented in this table are those fromthe most recent rate case or GRIP filing for each jurisdiction. These rate bases, rates of return and returns onequity are not necessarily indicative of current or future rate bases, rates of return or returns on equity.
(2) The APT rate base represents the incremental rate base from the 2011 APT filing.(3) The Mid-Tex Rate Base amounts for the Mid-Tex Cities and Dallas areas represent “system-wide”, or 100
percent, of the Mid-Tex Division’s rate base.
8

(4) A rate base, rate of return, return on equity or debt/equity ratio was not included in the respective statecommission’s final decision.
(5) On April 1, 2014, a rate case settlement approved by the West Texas Cities reestablished an annual ratemechanism for all West Texas Division cities except Amarillo, Channing, Dalhart and Lubbock.
(6) The bad debt rider allows us to recover from ratepayers the gas cost portion of uncollectible accounts.(7) The performance-based rate program provides incentives to distribution companies to minimize purchased
gas costs by allowing the companies and its customers to share the purchased gas costs savings.(8) The Company and intervenors have entered into a settlement agreement, approved on October 23, 2015, for
implementation of an Infrastructure Mechanism effective January 1, 2016.
Although substantial progress has been made in recent years by improving rate design and recovery ofinvestment across Atmos Energy’s operating areas, we will continue to seek improvements in rate design toaddress cost variations and pursue tariffs that reduce regulatory lag associated with investments. Further, poten-tial changes in federal energy policy, federal safety regulations and adverse economic conditions will necessitatecontinued vigilance by the Company and our regulators in meeting the challenges presented by these externalfactors.
Recent Ratemaking Activity
Substantially all of our regulated revenues in the fiscal years ended September 30, 2015, 2014 and 2013were derived from sales at rates set by or subject to approval by local or state authorities. Net operating incomeincreases resulting from ratemaking activity totaling $114.5 million, $93.3 million and $98.1 million, becameeffective in fiscal 2015, 2014 and 2013, as summarized below:
Annual Increase to OperatingIncome For the Fiscal Year Ended September 30
Rate Action 2015 2014 2013(In thousands)
Annual formula rate mechanisms . . . . . . . . . . . . . . . . . . . $113,706 $71,749 $40,088Rate case filings . . . . . . . . . . . . . . . . . . . . . . . . . . . . . . . . . 711 21,819 56,700Other ratemaking activity . . . . . . . . . . . . . . . . . . . . . . . . . 78 (226) 1,322
$114,495 $93,342 $98,110
Additionally, the following ratemaking efforts were initiated during fiscal 2015 but had not been completedas of September 30, 2015:
Division Rate Action JurisdictionOperating Income
Requested(In thousands)
Colorado-Kansas . . . . . . . . . Rate Case(1) Colorado $ 5,276Rate Case Kansas 5,667
Kentucky/Mid-States . . . . . PRP(2) Kentucky 3,786PRP(3) Virginia 118
Mississippi . . . . . . . . . . . . . SRF Mississippi 11,186SGR(4) Mississippi 249
$26,282
(1) A Stipulation and Settlement was signed on September 23, 2015. The settlement was approved onOctober 23, 2015 resulting in an operating income increase of $2.1 million and authorization to implement along-term program to replace aging infrastructure in Colorado. The base rate change and infrastructure sur-charge will go into effect on January 1, 2016.
(2) The Pipeline Replacement Program (PRP) surcharge relates to a long-term program to replace aging infra-structure. The Kentucky PRP was implemented on October 1, 2015.
9
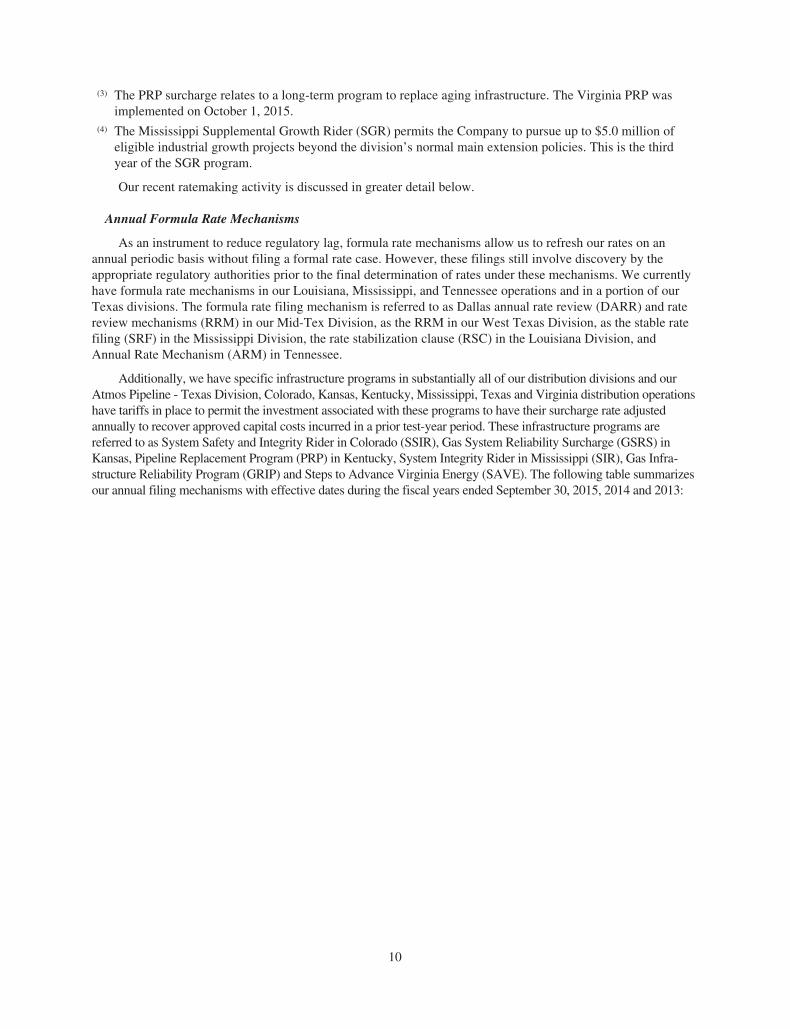
(3) The PRP surcharge relates to a long-term program to replace aging infrastructure. The Virginia PRP wasimplemented on October 1, 2015.
(4) The Mississippi Supplemental Growth Rider (SGR) permits the Company to pursue up to $5.0 million ofeligible industrial growth projects beyond the division’s normal main extension policies. This is the thirdyear of the SGR program.
Our recent ratemaking activity is discussed in greater detail below.
Annual Formula Rate Mechanisms
As an instrument to reduce regulatory lag, formula rate mechanisms allow us to refresh our rates on anannual periodic basis without filing a formal rate case. However, these filings still involve discovery by theappropriate regulatory authorities prior to the final determination of rates under these mechanisms. We currentlyhave formula rate mechanisms in our Louisiana, Mississippi, and Tennessee operations and in a portion of ourTexas divisions. The formula rate filing mechanism is referred to as Dallas annual rate review (DARR) and ratereview mechanisms (RRM) in our Mid-Tex Division, as the RRM in our West Texas Division, as the stable ratefiling (SRF) in the Mississippi Division, the rate stabilization clause (RSC) in the Louisiana Division, andAnnual Rate Mechanism (ARM) in Tennessee.
Additionally, we have specific infrastructure programs in substantially all of our distribution divisions and ourAtmos Pipeline - Texas Division, Colorado, Kansas, Kentucky, Mississippi, Texas and Virginia distribution operationshave tariffs in place to permit the investment associated with these programs to have their surcharge rate adjustedannually to recover approved capital costs incurred in a prior test-year period. These infrastructure programs arereferred to as System Safety and Integrity Rider in Colorado (SSIR), Gas System Reliability Surcharge (GSRS) inKansas, Pipeline Replacement Program (PRP) in Kentucky, System Integrity Rider in Mississippi (SIR), Gas Infra-structure Reliability Program (GRIP) and Steps to Advance Virginia Energy (SAVE). The following table summarizesour annual filing mechanisms with effective dates during the fiscal years ended September 30, 2015, 2014 and 2013:
10

Division Jurisdiction Test Year Ended
Increase(Decrease) in
AnnualOperating
IncomeEffective
Date(In thousands)
2015 Filings:Louisiana . . . . . . . . . . . . . . . . . . . . . . . . . . . LGS 12/2014 $ 1,321 07/01/2015West Texas . . . . . . . . . . . . . . . . . . . . . . . . . Environs(1) 12/2014 697 06/12/2015Mid-Tex . . . . . . . . . . . . . . . . . . . . . . . . . . . Environs(2) 12/2014 1,158 06/01/2015Mid-Tex . . . . . . . . . . . . . . . . . . . . . . . . . . . Mid-Tex Cities 12/2014 16,801 06/01/2015Mid-Tex . . . . . . . . . . . . . . . . . . . . . . . . . . . Dallas 09/2014 4,420 06/01/2015West Texas . . . . . . . . . . . . . . . . . . . . . . . . . Cities(3) 12/2014 4,593 05/01/2015Atmos Pipeline — Texas . . . . . . . . . . . . . . Texas 12/2014 37,248 04/08/2015Louisiana . . . . . . . . . . . . . . . . . . . . . . . . . . . Trans La 09/2014 (286) 04/01/2015West Texas . . . . . . . . . . . . . . . . . . . . . . . . . West Texas Cities 09/2014 4,300 03/15/2015Colorado-Kansas . . . . . . . . . . . . . . . . . . . . . Kansas 09/2014 301 02/01/2015Mississippi . . . . . . . . . . . . . . . . . . . . . . . . . Mississippi-SRF 10/2015 4,441 02/01/2015Mississippi . . . . . . . . . . . . . . . . . . . . . . . . . Mississippi-SGR 10/2015 782 11/01/2014Kentucky/Mid-States . . . . . . . . . . . . . . . . . Kentucky(4) 09/2015 4,382 10/10/2014Kentucky/Mid-States - Virginia . . . . . . . . . Virginia 09/2015 133 10/01/2014Mid-Tex . . . . . . . . . . . . . . . . . . . . . . . . . . . Mid-Tex Cities(5) 12/2013 33,415 06/01/2014
Total 2015 Filings . . . . . . . . . . . . . . . . . . $113,706
2014 Filings:Louisiana . . . . . . . . . . . . . . . . . . . . . . . . . . . LGS 12/2013 $ 1,383 07/01/2014West Texas . . . . . . . . . . . . . . . . . . . . . . . . . West Texas(1) 12/2013 858 06/17/2014Mid-Tex . . . . . . . . . . . . . . . . . . . . . . . . . . . City of Dallas 09/2013 5,638 06/01/2014Mid-Tex . . . . . . . . . . . . . . . . . . . . . . . . . . . Environs(2) 12/2013 881 05/22/2014Atmos Pipeline — Texas . . . . . . . . . . . . . . Texas 12/2013 45,589 05/06/2014Louisiana . . . . . . . . . . . . . . . . . . . . . . . . . . . Trans La 09/2013 550 04/01/2014Colorado-Kansas . . . . . . . . . . . . . . . . . . . . . Kansas 09/2013 882 02/01/2014Mid-Tex . . . . . . . . . . . . . . . . . . . . . . . . . . . Mid-Tex Cities 12/2012 12,497 11/01/2013Kentucky/Mid-States . . . . . . . . . . . . . . . . . Kentucky 09/2014 2,493 10/01/2013Kentucky/Mid-States . . . . . . . . . . . . . . . . . Virginia 09/2014 210 10/01/2013Mid-Tex . . . . . . . . . . . . . . . . . . . . . . . . . . . Environs(2) 12/2012 768 10/01/2013
Total 2014 Filings . . . . . . . . . . . . . . . . . . $ 71,749
2013 Filings:Louisiana . . . . . . . . . . . . . . . . . . . . . . . . . . . LGS 12/2012 $ 908 07/01/2013Mid-Tex . . . . . . . . . . . . . . . . . . . . . . . . . . . City of Dallas 09/2012 1,800 06/01/2013Atmos Pipeline — Texas . . . . . . . . . . . . . . Texas 12/2012 26,730 05/07/2013Louisiana . . . . . . . . . . . . . . . . . . . . . . . . . . . TransLa 09/2012 2,260 04/01/2013Kentucky/Mid-States . . . . . . . . . . . . . . . . . Georgia(6) 09/2013 743 02/01/2013Colorado-Kansas . . . . . . . . . . . . . . . . . . . . . Kansas 09/2012 601 01/09/2013Mississippi . . . . . . . . . . . . . . . . . . . . . . . . . Mississippi 06/2012 3,441 11/01/2012Kentucky/Mid-States . . . . . . . . . . . . . . . . . Georgia(6) 09/2011 1,079 10/01/2012Kentucky/Mid-States . . . . . . . . . . . . . . . . . Kentucky(4) 09/2013 2,425 10/01/2012Kentucky/Mid-States . . . . . . . . . . . . . . . . . Virginia 09/2013 101 10/01/2012
Total 2013 Filings . . . . . . . . . . . . . . . . . . $ 40,088
11

(1) Incremental net utility plant investment represents the system-wide incremental investment for the WestTexas Division. The increase in annual operating income is for the unincorporated areas of the West TexasDivision only.
(2) Incremental net utility plant investment represents the system-wide incremental investment for the Mid-TexDivision. The increase in annual operating income is for the unincorporated areas of the Mid-Tex Divisiononly.
(3) Incremental net utility plant investment represents the system-wide incremental investment for the WestTexas Division. The increase in annual operating income is for the cities of Amarillo, Channing, Dalhart andLubbock in the West Texas Division only.
(4) The Pipeline Replacement Program (PRP) surcharge relates to a long-term program to replace aging infra-structure.
(5) On June 1, 2014 rates, subject to refund, were implemented. On June 1, 2015, concurrent withimplementation of the 2015 RRM, final rates were implemented.
(6) On April 1, 2013, we completed the sale of our Georgia operations to Liberty Energy (Georgia) Corp., anaffiliate of Algonquin Power & Utilities Corp. The increase in operating income arising from theimplementation of new rates is included as a component of discontinued operations through March 31, 2013.
Rate Case Filings
A rate case is a formal request from Atmos Energy to a regulatory authority to increase rates that arecharged to customers. Rate cases may also be initiated when the regulatory authorities request us to justify ourrates. This process is referred to as a “show cause” action. Adequate rates are intended to provide for recovery ofthe Company’s costs as well as a fair rate of return to our shareholders and ensure that we continue to safelydeliver reliable, reasonably priced natural gas service to our customers. The following table summarizes ourrecent rate cases:
Division StateIncrease in AnnualOperating Income Effective Date
(In thousands)
2015 Rate Case Filings:Kentucky/Mid-States . . . . . . . . . . . . . . . . . . . . . . . . . . . . . . . . . . . Tennessee $ 711 06/01/2015
Total 2015 Rate Case Filings . . . . . . . . . . . . . . . . . . . . . . . . . . $ 711
2014 Rate Case Filings:Kentucky/Mid-States . . . . . . . . . . . . . . . . . . . . . . . . . . . . . . . . . . . Virginia $ 976 09/09/2014Colorado-Kansas . . . . . . . . . . . . . . . . . . . . . . . . . . . . . . . . . . . . . . Kansas 2,571 09/04/2014Colorado-Kansas . . . . . . . . . . . . . . . . . . . . . . . . . . . . . . . . . . . . . . Colorado 2,400 08/26/2014Kentucky/Mid-States . . . . . . . . . . . . . . . . . . . . . . . . . . . . . . . . . . . Kentucky 5,823 04/22/2014West Texas . . . . . . . . . . . . . . . . . . . . . . . . . . . . . . . . . . . . . . . . . . Texas 8,440 04/01/2014Colorado-Kansas . . . . . . . . . . . . . . . . . . . . . . . . . . . . . . . . . . . . . . Colorado 1,609 03/01/2014
Total 2014 Rate Case Filings . . . . . . . . . . . . . . . . . . . . . . . . . . $21,819
2013 Rate Case Filings:Mid-Tex . . . . . . . . . . . . . . . . . . . . . . . . . . . . . . . . . . . . . . . . . . . . . Texas $42,601 12/04/2012Kentucky/Mid-States . . . . . . . . . . . . . . . . . . . . . . . . . . . . . . . . . . . Tennessee 7,530 11/08/2012West Texas . . . . . . . . . . . . . . . . . . . . . . . . . . . . . . . . . . . . . . . . . . Texas 6,569 10/01/2012
Total 2013 Rate Case Filings . . . . . . . . . . . . . . . . . . . . . . . . . . $56,700
12
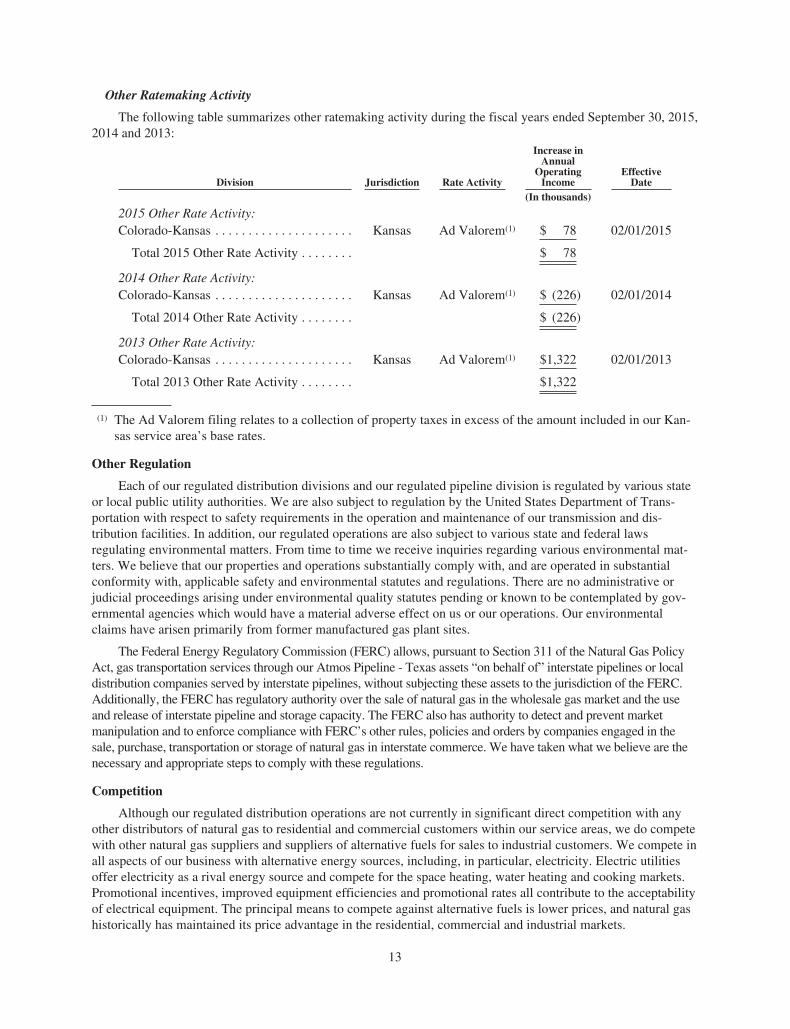
Other Ratemaking Activity
The following table summarizes other ratemaking activity during the fiscal years ended September 30, 2015,2014 and 2013:
Division Jurisdiction Rate Activity
Increase inAnnual
OperatingIncome
EffectiveDate
(In thousands)
2015 Other Rate Activity:Colorado-Kansas . . . . . . . . . . . . . . . . . . . . . Kansas Ad Valorem(1) $ 78 02/01/2015
Total 2015 Other Rate Activity . . . . . . . . $ 78
2014 Other Rate Activity:Colorado-Kansas . . . . . . . . . . . . . . . . . . . . . Kansas Ad Valorem(1) $ (226) 02/01/2014
Total 2014 Other Rate Activity . . . . . . . . $ (226)
2013 Other Rate Activity:Colorado-Kansas . . . . . . . . . . . . . . . . . . . . . Kansas Ad Valorem(1) $1,322 02/01/2013
Total 2013 Other Rate Activity . . . . . . . . $1,322
(1) The Ad Valorem filing relates to a collection of property taxes in excess of the amount included in our Kan-sas service area’s base rates.
Other Regulation
Each of our regulated distribution divisions and our regulated pipeline division is regulated by various stateor local public utility authorities. We are also subject to regulation by the United States Department of Trans-portation with respect to safety requirements in the operation and maintenance of our transmission and dis-tribution facilities. In addition, our regulated operations are also subject to various state and federal lawsregulating environmental matters. From time to time we receive inquiries regarding various environmental mat-ters. We believe that our properties and operations substantially comply with, and are operated in substantialconformity with, applicable safety and environmental statutes and regulations. There are no administrative orjudicial proceedings arising under environmental quality statutes pending or known to be contemplated by gov-ernmental agencies which would have a material adverse effect on us or our operations. Our environmentalclaims have arisen primarily from former manufactured gas plant sites.
The Federal Energy Regulatory Commission (FERC) allows, pursuant to Section 311 of the Natural Gas PolicyAct, gas transportation services through our Atmos Pipeline - Texas assets “on behalf of” interstate pipelines or localdistribution companies served by interstate pipelines, without subjecting these assets to the jurisdiction of the FERC.Additionally, the FERC has regulatory authority over the sale of natural gas in the wholesale gas market and the useand release of interstate pipeline and storage capacity. The FERC also has authority to detect and prevent marketmanipulation and to enforce compliance with FERC’s other rules, policies and orders by companies engaged in thesale, purchase, transportation or storage of natural gas in interstate commerce. We have taken what we believe are thenecessary and appropriate steps to comply with these regulations.
Competition
Although our regulated distribution operations are not currently in significant direct competition with anyother distributors of natural gas to residential and commercial customers within our service areas, we do competewith other natural gas suppliers and suppliers of alternative fuels for sales to industrial customers. We compete inall aspects of our business with alternative energy sources, including, in particular, electricity. Electric utilitiesoffer electricity as a rival energy source and compete for the space heating, water heating and cooking markets.Promotional incentives, improved equipment efficiencies and promotional rates all contribute to the acceptabilityof electrical equipment. The principal means to compete against alternative fuels is lower prices, and natural gashistorically has maintained its price advantage in the residential, commercial and industrial markets.
13

Our regulated pipeline operations historically faced competition from other existing intrastate pipelinesseeking to provide or arrange transportation, storage and other services for customers. In the last few years, sev-eral new pipelines have been completed, which has increased the level of competition in this segment of ourbusiness.
Within our nonregulated operations, AEM competes with other natural gas marketers to provide natural gasmanagement and other related services primarily to smaller customers requiring higher levels of balancing,scheduling and other related management services. AEM has experienced increased competition in recent yearsprimarily from investment banks and major integrated oil and natural gas companies who offer lower cost, basicservices. The increased competition has reduced margins most notably on its high-volume accounts.
Employees
At September 30, 2015, we had 4,753 employees, consisting of 4,642 employees in our regulated operationsand 111 employees in our nonregulated operations.
Available Information
Our Annual Reports on Form 10-K, Quarterly Reports on Form 10-Q, Current Reports on Form 8-K andother reports, and amendments to those reports, and other forms that we file with or furnish to the Securities andExchange Commission (SEC) are available free of charge at our website, www.atmosenergy.com, under“Publications and Filings” under the “Investors” tab, as soon as reasonably practicable, after we electronicallyfile these reports with, or furnish these reports to, the SEC. We will also provide copies of these reports free ofcharge upon request to Shareholder Relations at the address and telephone number appearing below:
Shareholder RelationsAtmos Energy CorporationP.O. Box 650205Dallas, Texas 75265-0205972-855-3729
Corporate Governance
In accordance with and pursuant to relevant related rules and regulations of the SEC as well as corporategovernance-related listing standards of the New York Stock Exchange (NYSE), the Board of Directors of theCompany has established and periodically updated our Corporate Governance Guidelines and Code of Conduct,which is applicable to all directors, officers and employees of the Company. In addition, in accordance with andpursuant to such NYSE listing standards, our Chief Executive Officer during fiscal 2015, Kim R. Cocklin, certi-fied to the New York Stock Exchange that he was not aware of any violations by the Company of NYSE corpo-rate governance listing standards. The Board of Directors also annually reviews and updates, if necessary, thecharters for each of its Audit, Human Resources and Nominating and Corporate Governance Committees. All ofthe foregoing documents are posted on the Corporate Governance page of our website. We will also providecopies of all corporate governance documents free of charge upon request to Shareholder Relations at the addresslisted above.
ITEM 1A. Risk Factors.
Our financial and operating results are subject to a number of risk factors, many of which are not within ourcontrol. Although we have tried to discuss key risk factors below, please be aware that other or new risks mayprove to be important in the future. Investors should carefully consider the following discussion of risk factors aswell as other information appearing in this report. These factors include the following:
The Company is dependent on continued access to the credit and capital markets to execute our businessstrategy.
Our long-term debt is currently rated as “investment grade” by Standard & Poor’s Corporation, Moody’sInvestors Service, Inc. and Fitch Ratings, Ltd. Similar to most companies, we rely upon access to both short-termand long-term credit and capital markets to satisfy our liquidity requirements. If adverse credit conditions were to
14

cause a significant limitation on our access to the private and public capital markets, we could see a reduction inour liquidity. A significant reduction in our liquidity could in turn trigger a negative change in our ratings out-look or even a reduction in our credit ratings by one or more of the three credit rating agencies. Such a down-grade could further limit our access to private credit and/or public capital markets and increase our costs ofborrowing.
Further, if our credit ratings were downgraded, we could be required to provide additional liquidity to ournonregulated segment because the commodity financial instrument markets could become unavailable to us. Ournonregulated segment depends primarily upon an intercompany lending facility between AEH and Atmos Energyto finance its working capital needs, supplemented by two small credit facilities with outside lenders. Our abilityto provide this liquidity to AEH for our nonregulated operations is limited by the terms of the lending arrange-ment with AEH, which is subject to annual approval by one state regulatory commission.
While we believe we can meet our capital requirements from our operations and the sources of financingavailable to us, we can provide no assurance that we will continue to be able to do so in the future, especially ifthe market price of natural gas increases significantly in the near term. The future effects on our business, liquid-ity and financial results of a deterioration of current conditions in the credit and capital markets could be materialand adverse to us, both in the ways described above or in other ways that we do not currently anticipate.
We are subject to state and local regulations that affect our operations and financial results.
Our regulated distribution and regulated pipeline segments are subject to regulatory oversight from variousstate and local regulatory authorities in the eight states that we serve in our regulated distribution and pipelinesegments. Therefore, our returns are continuously monitored and are subject to challenge for their reasonableness bythe appropriate regulatory authorities or other third-party intervenors. In the normal course of business, as a regu-lated entity, we often need to place assets in service and establish historical test periods before rate cases that seek toadjust our allowed returns to recover that investment can be filed. Further, the regulatory review process can belengthy in the context of traditional ratemaking. Because of this process, we suffer the negative financial effects ofhaving placed assets in service without the benefit of rate relief, which is commonly referred to as “regulatory lag.”
However, in the last several years, a number of regulatory authorities in the states we serve have approvedrate mechanisms that provide for annual adjustments to rates that allow us to recover the cost of investmentsmade to replace existing infrastructure or reflect changes in our cost of service. These mechanisms work to effec-tively reduce the regulatory lag inherent in the ratemaking process. However, regulatory lag could significantlyincrease if the regulatory authorities modify or terminate these rate mechanisms. The regulatory process alsoinvolves the risk that regulatory authorities may (i) review our purchases of natural gas and adjust the amount ofour gas costs that we pass through to our customers or (ii) limit the costs we may have incurred from our cost ofservice that can be recovered from customers.
A deterioration in economic conditions could adversely affect our customers and negatively impact ourfinancial results.
Any adverse changes in economic conditions in the United States, especially in the states in which we oper-ate, similar to the economic downturn we experienced for several years beginning in 2008 could adversely affectthe financial resources of many domestic households and lead to an increase in mortgage defaults and significantdecreases in the values of our customers’ homes and investment assets. As a result, our customers could seek touse even less gas and make it more difficult for them to pay their gas bills. This would likely lead to slower col-lections and higher than normal levels of accounts receivable. This, in turn, would probably increase our financ-ing requirements and bad debt expense. Additionally, should economic conditions deteriorate, our industrialcustomers could seek alternative energy sources, which could result in lower sales volumes.
Inflation and increased gas costs could adversely impact our customer base and customer collections andincrease our level of indebtedness.
Over time, inflation has caused increases in some of our operating expenses and has required assets to bereplaced at higher costs. We have a process in place to continually review the adequacy of our distribution gas
15

rates in relation to the increasing cost of providing service and the inherent regulatory lag in adjusting those gasrates. Historically, we have been able to budget and control operating expenses and investments within theamounts authorized to be collected in rates and intend to continue to do so. However, the ability to controlexpenses is an important factor that could impact future financial results.
In addition, rapid increases in the costs of purchased gas would cause us to experience a significant increasein short-term debt. We must pay suppliers for gas when it is purchased, which can be significantly in advance ofwhen these costs may be recovered through the collection of monthly customer bills for gas delivered. Increasesin purchased gas costs also slow our natural gas distribution collection efforts as customers are more likely todelay the payment of their gas bills, leading to higher than normal accounts receivable. This could result inhigher short-term debt levels, greater collection efforts and increased bad debt expense.
We are exposed to market risks that are beyond our control, which could adversely affect our financialresults and capital requirements.
We are subject to market risks beyond our control, including (i) commodity price volatility caused by mar-ket supply and demand dynamics, counterparty performance or counterparty creditworthiness, and (ii) interestrate risk.
Our regulated operations are generally insulated from commodity price risk through its purchased gas costmechanisms. Although our nonregulated operations represent only about five percent of our consolidated results,commodity price volatility experienced in this business segment could lead to some minor volatility in our earn-ings. Our nonregulated segment manages margins and limits risk exposure on the sale of natural gas inventory orthe offsetting fixed-price purchase or sale commitments for physical quantities of natural gas through the use of avariety of financial instruments. However, contractual limitations could adversely affect our ability to withdrawgas from storage, which could cause us to purchase gas at spot prices in a rising market to obtain sufficientvolumes to fulfill customer contracts. We could also realize financial losses on our efforts to limit risk as a resultof volatility in the market prices of the underlying commodities or if a counterparty fails to perform under a con-tract.
With respect to interest rate risk, we have been operating in a relatively low interest-rate environment inrecent years compared to historical norms for both short and long-term interest rates. However, increases ininterest rates could adversely affect our future financial results.
The concentration of our distribution, pipeline and storage operations in the State of Texas exposes ouroperations and financial results to economic conditions, weather patterns and regulatory decisions inTexas.
Over 50 percent of our regulated distribution customers and most of our regulated pipeline assets and oper-ations are located in the State of Texas. This concentration of our business in Texas means that our operationsand financial results may be significantly affected by changes in the Texas economy in general, weather patternsand regulatory decisions by state and local regulatory authorities in Texas.
Our operations are subject to increased competition.
In residential and commercial customer markets, our regulated distribution operations compete with otherenergy products, such as electricity and propane. Our primary product competition is with electricity for heating,water heating and cooking. Increases in the price of natural gas could negatively impact our competitive positionby decreasing the price benefits of natural gas to the consumer. This could adversely impact our business if, as aresult, our customer growth slows, reducing our ability to make capital expenditures, or if our customers furtherconserve their use of gas, resulting in reduced gas purchases and customer billings.
In the case of industrial customers, such as manufacturing plants, adverse economic conditions, includinghigher gas costs, could cause these customers to use alternative sources of energy, such as electricity, or bypassour systems in favor of special competitive contracts with lower per-unit costs. Our regulated pipeline operations
16
historically have faced limited competition from other existing intrastate pipelines and gas marketers seeking toprovide or arrange transportation, storage and other services for customers. However, in the last few years, sev-eral new pipelines have been completed, which has increased the level of competition in this segment of ourbusiness.
Finally, within our nonregulated operations, AEM competes with other natural gas marketers to providenatural gas management and other related services primarily to smaller customers requiring higher levels of bal-ancing, scheduling and other related management services. AEM has experienced increased competition in recentyears from competitors who offer lower cost, basic services.
Adverse weather conditions could affect our operations or financial results.
We have weather-normalized rates for over 95 percent of our residential and commercial meters in our regu-lated distribution business, which substantially mitigates the adverse effects of warmer-than-normal weather formeters in those service areas. However, there is no assurance that we will continue to receive such regulatoryprotection from adverse weather in our rates in the future. The loss of such weather-normalized rates could havean adverse effect on our operations and financial results. In addition, our regulated distribution and regulatedpipeline operating results may continue to vary somewhat with the actual temperatures during the winter heatingseason. Sustained cold weather could adversely affect our nonregulated operations as we may be required topurchase gas at spot rates in a rising market to obtain sufficient volumes to fulfill some customer contracts. Addi-tionally, sustained cold weather could challenge our ability to adequately meet customer demand in our naturalgas distribution and pipeline and storage operations.
Our growth in the future may be limited by the nature of our business, which requires extensive capitalspending.
The regulated natural gas distribution and pipeline business is capital-intensive. We must make significantcapital expenditures to renew or replace our facilities on a long-term basis to improve the safety and reliability ofour facilities and to comply with the safety rules and regulations issued by the regulatory authorities responsiblefor the service areas we operate. In addition, we must continually build new capacity in our regulated distributionand regulated pipeline operations to serve the growing needs of the communities we serve. The magnitude ofthese expenditures may be affected by a number of factors, including new regulations, the general state of theeconomy and weather.
The liquidity required to fund our capital expenditures and other cash needs is provided from a variety ofsources, including our cash flows from operations, borrowings under our short-term lending facilities, and, fromtime to time, funds raised from the public debt and equity capital markets. The cost and availability of borrowingfunds from third party lenders or issuing equity is dependent on the liquidity of the credit markets, interest ratesand other market conditions. This in turn may limit the amount of funds we can invest in our infrastructure.
The costs of providing health care benefits, pension and postretirement health care benefits and relatedfunding requirements may increase substantially.
We provide health care benefits, a cash-balance pension plan and postretirement health care benefits to eligi-ble full-time employees. The costs of providing health care benefits to our employees could significantly increaseover time due to rapidly increasing health care inflation, the impact of the Health Care Reform Act of 2010(HCR) and any future legislative changes related to the provision of health care benefits. The impact of addi-tional costs incurred by the health insurance industry arising from the implementation of HCR, which are likelyto be passed on to the Company, are difficult to measure at this time.
The costs of providing a cash-balance pension plan and postretirement health care benefits to eligible full-time employees and related funding requirements could be influenced by changes in the market value of theassets funding our pension and postretirement health care plans. Any significant declines in the value of theseinvestments due to sustained declines in equity markets or a reduction in bond yields could increase the costs of
17

our pension and postretirement health care plans and related funding requirements in the future. Further, ourcosts of providing such benefits and related funding requirements are also subject to a number of factors, includ-ing (i) changing demographics, including longer life expectancy of beneficiaries and an expected increase in thenumber of eligible former employees over the next five to ten years; (ii) various actuarial calculations andassumptions which may differ materially from actual results due primarily to changing market and economicconditions, including changes in interest rates, and higher or lower withdrawal rates; and (iii) future governmentregulation.
The costs to the Company of providing these benefits and related funding requirements could also increasematerially in the future, should there be a material reduction in the amount of the recovery of these costs throughour rates or should significant delays develop in the timing of the recovery of such costs, which could adverselyaffect our financial results.
The inability to continue to hire, train and retain operational, technical and managerial personnel couldadversely affect our results of operations.
The average age of the employee base of Atmos Energy has been increasing for a number of years, with anumber of employees becoming eligible to retire within the next five to 10 years. If we were unable to hireappropriate personnel to fill future needs, the Company could encounter operating challenges and increasedcosts, primarily due to a loss of knowledge, errors due to inexperience or the lengthy time period typicallyrequired to adequately train replacement personnel. In addition, higher costs could result from the increased useof contractors to replace retiring employees, loss of productivity or increased safety compliance issues. Theinability to hire, train and retain new operational, technical and managerial personnel adequately and to transferinstitutional knowledge and expertise could adversely affect our ability to manage and operate our business. If wewere unable to hire, train and retain appropriately qualified personnel, our results of operations could beadversely affected.
We may experience increased federal, state and local regulation of the safety of our operations.
We are committed to constantly monitoring and maintaining our pipeline and distribution system to ensurethat natural gas is delivered safely, reliably and efficiently through our network of more than 72,000 miles ofpipeline and distribution lines. The pipeline replacement programs currently underway in several of our divisionstypify the preventive maintenance and continual renewal that we perform on our natural gas distribution systemin the eight states in which we currently operate. The safety and protection of the public, our customers and ouremployees is our top priority. However, due primarily to the unfortunate pipeline incident in California in 2010,natural gas distribution and pipeline companies have continued to face increasing federal, state and local over-sight of the safety of their operations. Although we believe these costs should be ultimately recoverable throughour rates, the costs of complying with such increased laws and regulations may have at least a short-term adverseimpact on our operating costs and financial results.
Some of our operations are subject to increased federal regulatory oversight that could affect our operationsand financial results.
FERC has regulatory authority over some of our operations, including sales of natural gas in the wholesalegas market and the use and release of interstate pipeline and storage capacity. FERC has adopted rules designedto prevent market power abuse and market manipulation and to promote compliance with FERC’s other rules,policies and orders by companies engaged in the sale, purchase, transportation or storage of natural gas in inter-state commerce. These rules carry increased penalties for violations. Although we have taken steps to structurecurrent and future transactions to comply with applicable current FERC regulations, changes in FERC regu-lations or their interpretation by FERC or additional regulations issued by FERC in the future could alsoadversely affect our business, financial condition or financial results.
18

We are subject to environmental regulations which could adversely affect our operations or financialresults.
We are subject to laws, regulations and other legal requirements enacted or adopted by federal, state andlocal governmental authorities relating to protection of the environment and health and safety matters, includingthose that govern discharges of substances into the air and water, the management and disposal of hazardoussubstances and waste, the clean-up of contaminated sites, groundwater quality and availability, plant and wildlifeprotection, as well as work practices related to employee health and safety. Environmental legislation alsorequires that our facilities, sites and other properties associated with our operations be operated, maintained,abandoned and reclaimed to the satisfaction of applicable regulatory authorities. Failure to comply with theselaws, regulations, permits and licenses may expose us to fines, penalties or interruptions in our operations thatcould be significant to our financial results. In addition, existing environmental regulations may be revised or ouroperations may become subject to new regulations.
The operations and financial results of the Company could be adversely impacted as a result of climatechanges or related additional legislation or regulation in the future.
To the extent climate changes occur, our businesses could be adversely impacted, although we believe it islikely that any such resulting impacts would occur very gradually over a long period of time and thus would bedifficult to quantify with any degree of specificity. To the extent climate changes would result in warmertemperatures in our service territories, financial results from our regulated distribution segment could beadversely affected through lower gas volumes and revenues, with our regulated pipeline segment also likelyexperiencing lower volumes and revenues as well. Such climate changes could also cause shifts in population,including customers moving away from our service territories near the Gulf Coast in Louisiana and Mis-sissippi. Another possible climate change would be more frequent and more severe weather events, such ashurricanes and tornados, which could increase our costs to repair damaged facilities and restore service to ourcustomers. If we were unable to deliver natural gas to our customers, our financial results would be impacted bylost revenues, and we generally would have to seek approval from regulators to recover restoration costs. To theextent we would be unable to recover those costs, or if higher rates resulting from our recovery of such costswould result in reduced demand for our services, our future business, financial condition or financial resultscould be adversely impacted. In addition, there have been a number of federal and state legislative and regulatoryinitiatives proposed in recent years in an attempt to control or limit the effects of global warming and overallclimate change, including greenhouse gas emissions, such as carbon dioxide. The adoption of this type of legis-lation by Congress or similar legislation by states or the adoption of related regulations by federal or stategovernments mandating a substantial reduction in greenhouse gas emissions in the future could have far-reachingand significant impacts on the energy industry. Such new legislation or regulations could result in increasedcompliance costs for us or additional operating restrictions on our business, affect the demand for natural gas orimpact the prices we charge to our customers. At this time, we cannot predict the potential impact of such laws orregulations that may be adopted on our future business, financial condition or financial results.
Distributing, transporting and storing natural gas involve risks that may result in accidents and additionaloperating costs.
Our regulated distribution and regulated pipeline businesses involve a number of hazards and operating risksthat cannot be completely avoided, such as leaks, accidents and operational problems, which could cause loss ofhuman life, as well as substantial financial losses resulting from property damage, damage to the environmentand to our operations. We maintain liability and property insurance coverage in place for many of these hazardsand risks. However, because some of our pipeline, storage and distribution facilities are near or are in populatedareas, any loss of human life or adverse financial results resulting from such events could be large. If these eventswere not fully covered by our general liability and property insurance, which policies are subject to certain limitsand deductibles, our operations or financial results could be adversely affected.
19
Cyber-attacks or acts of cyber-terrorism could disrupt our business operations and information technologysystems or result in the loss or exposure of confidential or sensitive customer, employee or Companyinformation.
Our business operations and information technology systems may be vulnerable to an attack by individualsor organizations intending to disrupt our business operations and information technology systems, even thoughthe Company has implemented policies, procedures and controls to prevent and detect these activities. We useour information technology systems to manage our distribution and intrastate pipeline operations and other busi-ness processes. Disruption of those systems could adversely impact our ability to safely deliver natural gas to ourcustomers, operate our pipeline systems or serve our customers timely. Accordingly, if such an attack or act ofterrorism were to occur, our operations and financial results could be adversely affected.
In addition, we use our information technology systems to protect confidential or sensitive customer,employee and Company information developed and maintained in the normal course of our business. Any attackon such systems that would result in the unauthorized release of customer, employee or other confidential orsensitive data could have a material adverse effect on our business reputation, increase our costs and expose us toadditional material legal claims and liability. Even though we have insurance coverage in place for many of thesecyber-related risks, if such an attack or act of terrorism were to occur, our operations and financial results couldbe adversely affected to the extent not fully covered by such insurance coverage.
Natural disasters, terrorist activities or other significant events could adversely affect our operations orfinancial results.
Natural disasters are always a threat to our assets and operations. In addition, the threat of terrorist activitiescould lead to increased economic instability and volatility in the price of natural gas that could affect our oper-ations. Also, companies in our industry may face a heightened risk of exposure to actual acts of terrorism, whichcould subject our operations to increased risks. As a result, the availability of insurance covering such risks maybecome more limited, which could increase the risk that an event could adversely affect our operations or finan-cial results.
ITEM 1B. Unresolved Staff Comments.
Not applicable.
ITEM 2. Properties.
Distribution, transmission and related assets
At September 30, 2015, in our regulated distribution segment, we owned an aggregate of 70,218 miles ofunderground distribution and transmission mains throughout our distribution systems. These mains are located oneasements or rights-of-way which generally provide for perpetual use. We maintain our mains through a programof continuous inspection and repair and believe that our system of mains is in good condition. Through our regu-lated pipeline segment we owned 5,477 miles of gas transmission and gathering lines as well as 111 miles oftransmission and gathering lines through our nonregulated segment.
20

Storage Assets
We own underground gas storage facilities in several states to supplement the supply of natural gas in peri-ods of peak demand. The following table summarizes certain information regarding our underground gas storagefacilities at September 30, 2015:
StateUsable Capacity
(Mcf)Cushion Gas
(Mcf)(1)
TotalCapacity
(Mcf)
MaximumDaily Delivery
Capability(Mcf)
Regulated Distribution SegmentKentucky . . . . . . . . . . . . . . . . . . . . . . . . . 4,442,696 6,322,283 10,764,979 105,100Kansas . . . . . . . . . . . . . . . . . . . . . . . . . . . 3,239,000 2,300,000 5,539,000 45,000Mississippi . . . . . . . . . . . . . . . . . . . . . . . . 1,907,571 2,442,917 4,350,488 31,000
Total . . . . . . . . . . . . . . . . . . . . . . . . . . . 9,589,267 11,065,200 20,654,467 181,100
Regulated Pipeline Segment — Texas . . . 46,083,549 15,878,025 61,961,574 1,235,000
Nonregulated SegmentKentucky . . . . . . . . . . . . . . . . . . . . . . . . . 3,438,900 3,240,000 6,678,900 67,500Louisiana . . . . . . . . . . . . . . . . . . . . . . . . . 438,583 300,973 739,556 56,000
Total . . . . . . . . . . . . . . . . . . . . . . . . . . . 3,877,483 3,540,973 7,418,456 123,500
Total . . . . . . . . . . . . . . . . . . . . . . . . . . . . 59,550,299 30,484,198 90,034,497 1,539,600
(1) Cushion gas represents the volume of gas that must be retained in a facility to maintain reservoir pressure.
Additionally, we contract for storage service in underground storage facilities on many of the interstate pipe-lines serving us to supplement our proprietary storage capacity. The following table summarizes our contractedstorage capacity at September 30, 2015:
Segment Division/Company
MaximumStorage
Quantity(MMBtu)
MaximumDaily
WithdrawalQuantity
(MDWQ)(1)
Regulated Distribution SegmentColorado-Kansas Division 4,761,909 113,689Kentucky/Mid-States Division 11,181,603 268,739Louisiana Division 2,595,619 179,347Mid-Tex Division 3,250,000 175,000Mississippi Division 3,554,535 151,334West Texas Division 4,500,000 146,000
Total . . . . . . . . . . . . . . . . . . . . . . . . . . . . . . . . . . . . . . . . . . . . . . . . . . . . . . . . . . . . . 29,843,666 1,034,109Nonregulated Segment
Atmos Energy Marketing, LLC 8,026,869 250,937Trans Louisiana Gas Pipeline, Inc. 1,674,000 67,507
Total . . . . . . . . . . . . . . . . . . . . . . . . . . . . . . . . . . . . . . . . . . . . . . . . . . . . . . . . . . . . . 9,700,869 318,444
Total Contracted Storage Capacity . . . . . . . . . . . . . . . . . . . . . . . . . . . . . . . . . . . . . 39,544,535 1,352,553
(1) Maximum daily withdrawal quantity (MDWQ) amounts will fluctuate depending upon the season and themonth. Unless otherwise noted, MDWQ amounts represent the MDWQ amounts as of November 1, which isthe beginning of the winter heating season.
21

Offices
Our administrative offices and corporate headquarters are consolidated in a leased facility in Dallas, Texas.We also maintain field offices throughout our service territory, the majority of which are located in leased facili-ties. The headquarters for our nonregulated operations are in Houston, Texas, with offices in Houston and otherlocations, primarily in leased facilities.
ITEM 3. Legal Proceedings.
See Note 10 to the consolidated financial statements, which is incorporated in this Item 3 by reference.
ITEM 4. Mine Safety Disclosures.
Not applicable.
PART II
ITEM 5. Market for Registrant’s Common Equity, Related Stockholder Matters and Issuer Purchases ofEquity Securities.
Our stock trades on the New York Stock Exchange under the trading symbol “ATO.” The high and low saleprices and dividends paid per share of our common stock for fiscal 2015 and 2014 are listed below. The high andlow prices listed are the closing NYSE quotes, as reported on the NYSE composite tape, for shares of our com-mon stock:
Fiscal 2015 Fiscal 2014
High LowDividends
Paid High LowDividends
Paid
Quarter ended:December 31 . . . . . . . . . . . . . . . . . . . . . . . . . $58.08 $47.35 $0.39 $47.06 $41.08 $0.37March 31 . . . . . . . . . . . . . . . . . . . . . . . . . . . . 58.81 52.02 0.39 48.01 44.19 0.37June 30 . . . . . . . . . . . . . . . . . . . . . . . . . . . . . . 56.41 51.28 0.39 53.40 46.94 0.37September 30 . . . . . . . . . . . . . . . . . . . . . . . . . 58.18 51.48 0.39 52.68 47.01 0.37
$1.56 $1.48
Dividends are payable at the discretion of our Board of Directors out of legally available funds. The Boardof Directors typically declares dividends in the same fiscal quarter in which they are paid. The number of recordholders of our common stock on October 30, 2015 was 14,881. Future payments of dividends, and the amounts ofthese dividends, will depend on our financial condition, results of operations, capital requirements and other fac-tors. We sold no securities during fiscal 2015 that were not registered under the Securities Act of 1933, asamended.
22
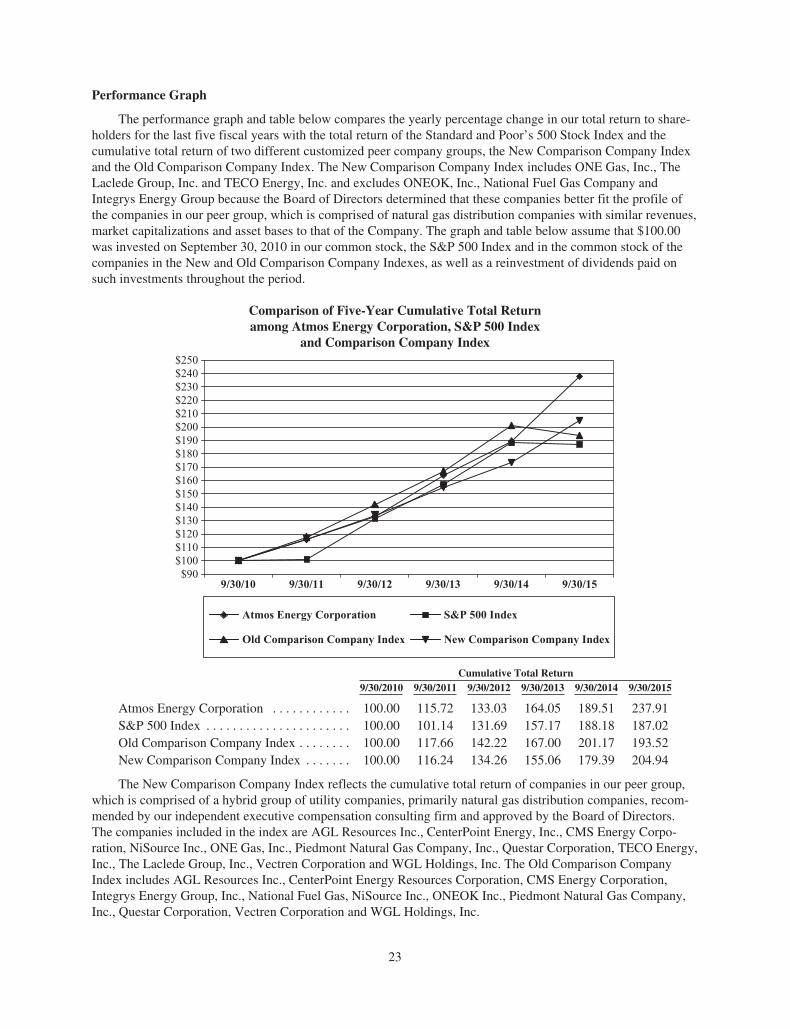
Performance Graph
The performance graph and table below compares the yearly percentage change in our total return to share-holders for the last five fiscal years with the total return of the Standard and Poor’s 500 Stock Index and thecumulative total return of two different customized peer company groups, the New Comparison Company Indexand the Old Comparison Company Index. The New Comparison Company Index includes ONE Gas, Inc., TheLaclede Group, Inc. and TECO Energy, Inc. and excludes ONEOK, Inc., National Fuel Gas Company andIntegrys Energy Group because the Board of Directors determined that these companies better fit the profile ofthe companies in our peer group, which is comprised of natural gas distribution companies with similar revenues,market capitalizations and asset bases to that of the Company. The graph and table below assume that $100.00was invested on September 30, 2010 in our common stock, the S&P 500 Index and in the common stock of thecompanies in the New and Old Comparison Company Indexes, as well as a reinvestment of dividends paid onsuch investments throughout the period.
Comparison of Five-Year Cumulative Total Returnamong Atmos Energy Corporation, S&P 500 Index
and Comparison Company Index
$90
$110$100
$120$130
$150$140
$250
$170$180$190$200$210$220$230$240
$160
9/30/10 9/30/11 9/30/12 9/30/13 9/30/14 9/30/15
Atmos Energy Corporation S&P 500 Index
Old Comparison Company Index New Comparison Company Index
Cumulative Total Return9/30/2010 9/30/2011 9/30/2012 9/30/2013 9/30/2014 9/30/2015
Atmos Energy Corporation . . . . . . . . . . . . 100.00 115.72 133.03 164.05 189.51 237.91S&P 500 Index . . . . . . . . . . . . . . . . . . . . . . 100.00 101.14 131.69 157.17 188.18 187.02Old Comparison Company Index . . . . . . . . 100.00 117.66 142.22 167.00 201.17 193.52New Comparison Company Index . . . . . . . 100.00 116.24 134.26 155.06 179.39 204.94
The New Comparison Company Index reflects the cumulative total return of companies in our peer group,which is comprised of a hybrid group of utility companies, primarily natural gas distribution companies, recom-mended by our independent executive compensation consulting firm and approved by the Board of Directors.The companies included in the index are AGL Resources Inc., CenterPoint Energy, Inc., CMS Energy Corpo-ration, NiSource Inc., ONE Gas, Inc., Piedmont Natural Gas Company, Inc., Questar Corporation, TECO Energy,Inc., The Laclede Group, Inc., Vectren Corporation and WGL Holdings, Inc. The Old Comparison CompanyIndex includes AGL Resources Inc., CenterPoint Energy Resources Corporation, CMS Energy Corporation,Integrys Energy Group, Inc., National Fuel Gas, NiSource Inc., ONEOK Inc., Piedmont Natural Gas Company,Inc., Questar Corporation, Vectren Corporation and WGL Holdings, Inc.
23
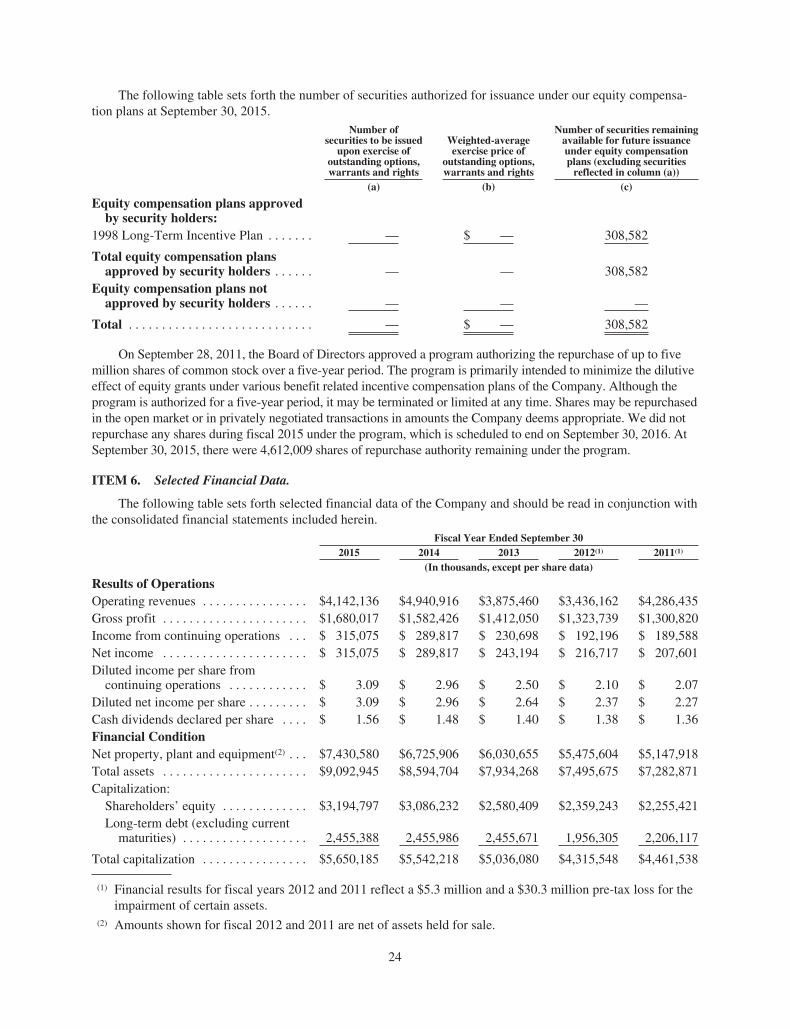
The following table sets forth the number of securities authorized for issuance under our equity compensa-tion plans at September 30, 2015.
Number ofsecurities to be issued
upon exercise ofoutstanding options,warrants and rights
Weighted-averageexercise price of
outstanding options,warrants and rights
Number of securities remainingavailable for future issuanceunder equity compensationplans (excluding securities
reflected in column (a))(a) (b) (c)
Equity compensation plans approvedby security holders:
1998 Long-Term Incentive Plan . . . . . . . — $ — 308,582
Total equity compensation plansapproved by security holders . . . . . . — — 308,582
Equity compensation plans notapproved by security holders . . . . . . — — —
Total . . . . . . . . . . . . . . . . . . . . . . . . . . . . — $ — 308,582
On September 28, 2011, the Board of Directors approved a program authorizing the repurchase of up to fivemillion shares of common stock over a five-year period. The program is primarily intended to minimize the dilutiveeffect of equity grants under various benefit related incentive compensation plans of the Company. Although theprogram is authorized for a five-year period, it may be terminated or limited at any time. Shares may be repurchasedin the open market or in privately negotiated transactions in amounts the Company deems appropriate. We did notrepurchase any shares during fiscal 2015 under the program, which is scheduled to end on September 30, 2016. AtSeptember 30, 2015, there were 4,612,009 shares of repurchase authority remaining under the program.
ITEM 6. Selected Financial Data.
The following table sets forth selected financial data of the Company and should be read in conjunction withthe consolidated financial statements included herein.
Fiscal Year Ended September 302015 2014 2013 2012(1) 2011(1)
(In thousands, except per share data)
Results of OperationsOperating revenues . . . . . . . . . . . . . . . . $4,142,136 $4,940,916 $3,875,460 $3,436,162 $4,286,435Gross profit . . . . . . . . . . . . . . . . . . . . . . $1,680,017 $1,582,426 $1,412,050 $1,323,739 $1,300,820Income from continuing operations . . . $ 315,075 $ 289,817 $ 230,698 $ 192,196 $ 189,588Net income . . . . . . . . . . . . . . . . . . . . . . $ 315,075 $ 289,817 $ 243,194 $ 216,717 $ 207,601Diluted income per share from
continuing operations . . . . . . . . . . . . $ 3.09 $ 2.96 $ 2.50 $ 2.10 $ 2.07Diluted net income per share . . . . . . . . . $ 3.09 $ 2.96 $ 2.64 $ 2.37 $ 2.27Cash dividends declared per share . . . . $ 1.56 $ 1.48 $ 1.40 $ 1.38 $ 1.36Financial ConditionNet property, plant and equipment(2) . . . $7,430,580 $6,725,906 $6,030,655 $5,475,604 $5,147,918Total assets . . . . . . . . . . . . . . . . . . . . . . $9,092,945 $8,594,704 $7,934,268 $7,495,675 $7,282,871Capitalization:
Shareholders’ equity . . . . . . . . . . . . . $3,194,797 $3,086,232 $2,580,409 $2,359,243 $2,255,421Long-term debt (excluding current
maturities) . . . . . . . . . . . . . . . . . . . 2,455,388 2,455,986 2,455,671 1,956,305 2,206,117
Total capitalization . . . . . . . . . . . . . . . . $5,650,185 $5,542,218 $5,036,080 $4,315,548 $4,461,538
(1) Financial results for fiscal years 2012 and 2011 reflect a $5.3 million and a $30.3 million pre-tax loss for theimpairment of certain assets.
(2) Amounts shown for fiscal 2012 and 2011 are net of assets held for sale.
24

ITEM 7. Management’s Discussion and Analysis of Financial Condition and Results of Operations.
INTRODUCTION
This section provides management’s discussion of the financial condition, changes in financial conditionand results of operations of Atmos Energy Corporation and its consolidated subsidiaries with specificinformation on results of operations and liquidity and capital resources. It includes management’s interpretationof our financial results, the factors affecting these results, the major factors expected to affect future operatingresults and future investment and financing plans. This discussion should be read in conjunction with our con-solidated financial statements and notes thereto.
Several factors exist that could influence our future financial performance, some of which are described inItem 1A above, “Risk Factors”. They should be considered in connection with evaluating forward-looking state-ments contained in this report or otherwise made by or on behalf of us since these factors could cause actualresults and conditions to differ materially from those set out in such forward-looking statements.
Cautionary Statement for the Purposes of the Safe Harbor under the Private Securities Litigation ReformAct of 1995
The statements contained in this Annual Report on Form 10-K may contain “forward-looking statements”within the meaning of Section 27A of the Securities Act of 1933 and Section 21E of the Securities Exchange Actof 1934. All statements other than statements of historical fact included in this Report are forward-looking state-ments made in good faith by us and are intended to qualify for the safe harbor from liability established by thePrivate Securities Litigation Reform Act of 1995. When used in this Report, or any other of our documents ororal presentations, the words “anticipate”, “believe”, “estimate”, “expect”, “forecast”, “goal”, “intend”,“objective”, “plan”, “projection”, “seek”, “strategy” or similar words are intended to identify forward-lookingstatements. Such forward-looking statements are subject to risks and uncertainties that could cause actual resultsto differ materially from those expressed or implied in the statements relating to our strategy, operations, mar-kets, services, rates, recovery of costs, availability of gas supply and other factors. These risks and uncertaintiesinclude the following: our ability to continue to access the credit markets to satisfy our liquidity requirements;regulatory trends and decisions, including the impact of rate proceedings before various state regulatory commis-sions; the impact of adverse economic conditions on our customers; the effects of inflation and changes in theavailability and price of natural gas; market risks beyond our control affecting our risk management activities,including commodity price volatility, counterparty creditworthiness or performance and interest rate risk; theconcentration of our distribution, pipeline and storage operations in Texas; increased competition from energysuppliers and alternative forms of energy; adverse weather conditions; the capital-intensive nature of our regu-lated distribution business; increased costs of providing health care benefits along with pension and postretire-ment health care benefits and increased funding requirements; the inability to continue to hire, train and retainappropriate personnel; possible increased federal, state and local regulation of the safety of our operations;increased federal regulatory oversight and potential penalties; the impact of environmental regulations on ourbusiness; the impact of climate changes or related additional legislation or regulation in the future; the inherenthazards and risks involved in operating our distribution and pipeline and storage businesses; the threat of cyber-attacks or acts of cyber-terrorism that could disrupt our business operations and information technology systems;natural disasters, terrorist activities or other events and other risks and uncertainties discussed herein, all of whichare difficult to predict and many of which are beyond our control. Accordingly, while we believe these forward-looking statements to be reasonable, there can be no assurance that they will approximate actual experience orthat the expectations derived from them will be realized. Further, we undertake no obligation to update or reviseany of our forward-looking statements whether as a result of new information, future events or otherwise.
CRITICAL ACCOUNTING POLICIES
Our consolidated financial statements were prepared in accordance with accounting principles generallyaccepted in the United States. Preparation of these financial statements requires us to make estimates and judg-ments that affect the reported amounts of assets, liabilities, revenues and expenses and the related disclosures ofcontingent assets and liabilities. We base our estimates on historical experience and various other assumptionsthat we believe to be reasonable under the circumstances. Actual results may differ from estimates.
25

Our significant accounting policies are discussed in Note 2 to our consolidated financial statements. Theaccounting policies discussed below are both important to the presentation of our financial condition and resultsof operations and require management to make difficult, subjective or complex accounting estimates. Accord-ingly, these critical accounting policies are reviewed periodically by the Audit Committee of the Board of Direc-tors.
CriticalAccounting Policy Summary of Policy
Factors InfluencingApplication of the Policy
Regulation . . . . . . . . . . . . . . Our regulated distribution and pipeline operationsmeet the criteria of a cost-based, rate-regulatedentity under accounting principles generallyaccepted in the United States. Accordingly, thefinancial results for these operations reflect theeffects of the ratemaking and accounting practicesand policies of the various regulatory commis-sions to which we are subject.
As a result, certain costs that would normally beexpensed under accounting principles generallyaccepted in the United States are permitted to becapitalized or deferred on the balance sheetbecause it is probable they can be recoveredthrough rates. Further, regulation may impact theperiod in which revenues or expenses are recog-nized. The amounts to be recovered or recognizedare based upon historical experience and ourunderstanding of the regulations.
Discontinuing the application of this method ofaccounting for regulatory assets and liabilities orchanges in the accounting for our various regu-latory mechanisms could significantly increase ouroperating expenses as fewer costs would likely becapitalized or deferred on the balance sheet, whichcould reduce our net income.
Decisions of regulatoryauthorities
Issuance of new regu-lations or regulatorymechanisms
Assessing the probabilityof the recoverability ofdeferred costs
Unbilled Revenue . . . . . . . . . We follow the revenue accrual method of account-ing for regulated distribution segment revenueswhereby revenues attributable to gas delivered tocustomers, but not yet billed under the cycle bill-ing method, are estimated and accrued and therelated costs are charged to expense.
On occasion, we are permitted to implement newrates that have not been formally approved by ourregulatory authorities, which are subject to refund.We recognize this revenue and establish a reservefor amounts that could be refunded based on ourexperience for the jurisdiction in which the rateswere implemented.
Estimates of deliveredsales volumes based onactual tariff informationand weather informationand estimates of customerconsumption and/orbehavior
Estimates of purchasedgas costs related to esti-mated deliveries
Estimates of uncollectibleamounts billed subject torefund
26

CriticalAccounting Policy Summary of Policy
Factors InfluencingApplication of the Policy
Pension and otherpostretirement plans . . . .
Pension and other postretirement plan costs andliabilities are determined on an actuarial basis usinga September 30 measurement date and are affectedby numerous assumptions and estimates includingthe market value of plan assets, estimates of theexpected return on plan assets, assumed discountrates and current demographic and actuarial mortal-ity data. The assumed discount rate and the expectedreturn are the assumptions that generally have themost significant impact on our pension costs andliabilities. The assumed discount rate, the assumedhealth care cost trend rate and assumed rates ofretirement generally have the most significantimpact on our postretirement plan costs andliabilities.
The discount rate is utilized principally in calculat-ing the actuarial present value of our pension andpostretirement obligations and net periodic pensionand postretirement benefit plan costs. When estab-lishing our discount rate, we consider high qualitycorporate bond rates based on bonds available in themarketplace that are suitable for settling the obliga-tions, changes in those rates from the prior year andthe implied discount rate that is derived frommatching our projected benefit disbursements withcurrently available high quality corporate bonds.
The expected long-term rate of return on assets isutilized in calculating the expected return on planassets component of our annual pension and post-retirement plan costs. We estimate the expectedreturn on plan assets by evaluating expected bondreturns, equity risk premiums, asset allocations, theeffects of active plan management, the impact ofperiodic plan asset rebalancing and historical per-formance. We also consider the guidance from ourinvestment advisors in making a final determinationof our expected rate of return on assets. To theextent the actual rate of return on assets realizedover the course of a year is greater than or less thanthe assumed rate, that year’s annual pension orpostretirement plan costs are not affected. Rather,this gain or loss reduces or increases future pensionor postretirement plan costs over a period ofapproximately ten to twelve years.
The market-related value of our plan assets representsthe fair market value of the plan assets, adjusted tosmooth out short-term market fluctuations over afive-year period. The use of this methodology willdelay the impact of current market fluctuations on thepension expense for the period.
General economic andmarket conditions
Assumed investmentreturns by asset class
Assumed future salaryincreases
Assumed discount rate
Projected timing of futurecash disbursements
Health care cost experi-ence trends
Participant demographicinformation
Actuarial mortalityassumptions
Impact of legislation
Impact of regulation
27

CriticalAccounting Policy Summary of Policy
Factors InfluencingApplication of the Policy
We estimate the assumed health care cost trendrate used in determining our postretirement netexpense based upon our actual health care costexperience, the effects of recently enacted legis-lation and general economic conditions. Ourassumed rate of retirement is estimated basedupon our annual review of our participant censusinformation as of the measurement date.
Contingencies . . . . . . . . . . . . In the normal course of business, we are con-fronted with issues or events that may result in acontingent liability. These generally relate touncollectible receivables, lawsuits, claims madeby third parties or the action of various regulatoryagencies. We recognize these contingencies in ourconsolidated financial statements when wedetermine, based on currently available facts andcircumstances it is probable that a liability hasbeen incurred or an asset will not be recovered,and an amount can be reasonably estimated.
Actual results may differ from estimates, depend-ing on actual outcomes or changes in the facts orexpectations surrounding each potential exposure.Changes in the estimates related to contingenciescould have a negative impact on our consolidatedresults of operations, cash flows or financial posi-tion. Our contingencies are further discussed inNote 10 to our consolidated financial statements.
Currently available facts
Management’s estimate offuture resolution
Financial instruments andhedging activities . . . . . . . We use financial instruments to mitigate commod-
ity price risk and interest rate risk. The objectivesfor using financial instruments have been tailoredto meet the needs of our regulated and non-regulated businesses. These objectives are morefully described in Note 12 to the consolidatedfinancial statements.
We record all of our financial instruments on thebalance sheet at fair value as required by account-ing principles generally accepted in the UnitedStates, with changes in fair value ultimatelyrecorded in the income statement. The recognitionof the changes in fair value of these financialinstruments recorded in the income statement iscontingent upon whether the financial instrumenthas been designated and qualifies as a part of ahedging relationship or if regulatory rulings requirea different accounting treatment. Our accountingelections for financial instruments and hedgingactivities utilized are more fully described in Note12 to the consolidated financial statements.
Designation of contractsunder the hedge account-ing rules
Judgment in the applica-tion of accounting guid-ance
Assessment of the proba-bility that future hedgedtransactions will occur
Changes in market con-ditions and the relatedimpact on the fair value ofthe hedged item and theassociated designatedfinancial instrument
Changes in the effective-ness of the hedge relation-ship
28
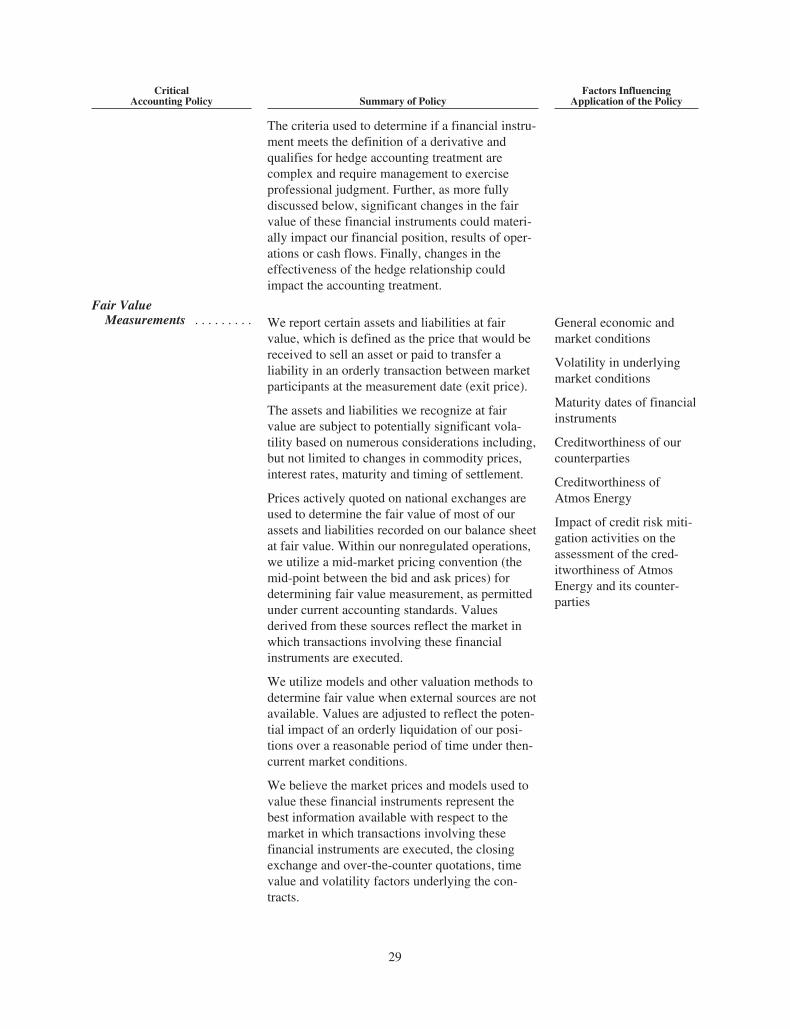
CriticalAccounting Policy Summary of Policy
Factors InfluencingApplication of the Policy
The criteria used to determine if a financial instru-ment meets the definition of a derivative andqualifies for hedge accounting treatment arecomplex and require management to exerciseprofessional judgment. Further, as more fullydiscussed below, significant changes in the fairvalue of these financial instruments could materi-ally impact our financial position, results of oper-ations or cash flows. Finally, changes in theeffectiveness of the hedge relationship couldimpact the accounting treatment.
Fair ValueMeasurements . . . . . . . . . We report certain assets and liabilities at fair
value, which is defined as the price that would bereceived to sell an asset or paid to transfer aliability in an orderly transaction between marketparticipants at the measurement date (exit price).
The assets and liabilities we recognize at fairvalue are subject to potentially significant vola-tility based on numerous considerations including,but not limited to changes in commodity prices,interest rates, maturity and timing of settlement.
Prices actively quoted on national exchanges areused to determine the fair value of most of ourassets and liabilities recorded on our balance sheetat fair value. Within our nonregulated operations,we utilize a mid-market pricing convention (themid-point between the bid and ask prices) fordetermining fair value measurement, as permittedunder current accounting standards. Valuesderived from these sources reflect the market inwhich transactions involving these financialinstruments are executed.
We utilize models and other valuation methods todetermine fair value when external sources are notavailable. Values are adjusted to reflect the poten-tial impact of an orderly liquidation of our posi-tions over a reasonable period of time under then-current market conditions.
We believe the market prices and models used tovalue these financial instruments represent thebest information available with respect to themarket in which transactions involving thesefinancial instruments are executed, the closingexchange and over-the-counter quotations, timevalue and volatility factors underlying the con-tracts.
General economic andmarket conditions
Volatility in underlyingmarket conditions
Maturity dates of financialinstruments
Creditworthiness of ourcounterparties
Creditworthiness ofAtmos Energy
Impact of credit risk miti-gation activities on theassessment of the cred-itworthiness of AtmosEnergy and its counter-parties
29

CriticalAccounting Policy Summary of Policy
Factors InfluencingApplication of the Policy
Fair-value estimates also consider our own cred-itworthiness and the creditworthiness of the coun-terparties involved. Our counterparties consistprimarily of financial institutions and majorenergy companies. This concentration of counter-parties may materially impact our exposure tocredit risk resulting from market, economic orregulatory conditions. We seek to minimize coun-terparty credit risk through an evaluation of theirfinancial condition and credit ratings and the useof collateral requirements under certain circum-stances.
Impairment assessments . . . We review the carrying value of our long-livedassets, including goodwill and identifiableintangibles, whenever events or changes incircumstance indicate that such carrying valuesmay not be recoverable, and at least annually forgoodwill, as required by U.S. accounting stan-dards.
The evaluation of our goodwill balances and otherlong-lived assets or identifiable assets for whichuncertainty exists regarding the recoverability ofthe carrying value of such assets involves theassessment of future cash flows and externalmarket conditions and other subjective factors thatcould impact the estimation of future cash flowsincluding, but not limited to the commodity prices,the amount and timing of future cash flows, futuregrowth rates and the discount rate. Unforeseenevents and changes in circumstances or marketconditions could adversely affect these estimates,which could result in an impairment charge.
General economic andmarket conditions
Projected timing andamount of future dis-counted cash flows
Judgment in the evalua-tion of relevant data
RESULTS OF OPERATIONS
Overview
Atmos Energy Corporation strives to operate its businesses safely and reliably while delivering superiorshareholder value. In recent years we have implemented rate designs that reduce or eliminate regulatory lag andseparate the recovery of our approved rate from customer usage patterns. In addition, recent pipeline safetyrulemaking has impacted the level of operating and maintenance expense and capital spending in our regulatedbusiness, which we expect to continue. Accordingly, we have significantly increased investments in the safetyand reliability of our natural gas distribution and transmission infrastructure. This increased level of investmentand timely recovery of these investments through our various regulatory mechanisms has resulted in increasedearnings and operating cash flow in recent years.
This trend continued during fiscal 2015. Net income increased 9 percent to $315.1 million, or $3.09 perdiluted share. The year-over-year increase largely reflects positive rate outcomes, which more than offset weatherthat was 10 percent warmer than the prior year, particularly in our nonregulated segment. Additionally, operatingcash flow increased $96.5 million to $836.5 million for the fiscal year ended September 30, 2015.
30

Capital expenditures for fiscal 2015 totaled $975.1 million. Approximately 80 percent was invested to improvethe safety and reliability of our distribution and transportation systems, with a significant portion of this investmentincurred under regulatory mechanisms that reduce lag to six months or less. Fiscal 2014 spending under these andother mechanisms enabled the Company to complete 17 regulatory filings during fiscal 2015 that should increaseannual operating income from regulated operations by $114.5 million. We plan to continue to fund our growththrough the use of operating cash flows and debt and equity securities, to maintain a balanced capital structure.
On July 1, 2015, Fitch Ratings (Fitch) upgraded our senior unsecured debt rating to A from A- with a ratingsoutlook of stable. Fitch cited its expectation of continued strong financial performance driven primarily byorganic growth in our regulated distribution and regulated pipeline segments.
On October 29, 2015, S&P affirmed our senior unsecured debt rating as A- and issued a revised outlookfrom stable to positive, citing the potential for an upgraded rating in the future if we maintain our current level offinancial performance as capital spending levels remain elevated.
As a result of the continued contribution and stability of our regulated earnings, cash flows and capital struc-ture, our Board of Directors increased the quarterly dividend by 7.7 percent for fiscal 2016.
Consolidated Results
The following table presents our consolidated financial highlights for the fiscal years ended September 30,2015, 2014 and 2013.
For the Fiscal Year Ended September 302015 2014 2013
(In thousands, except per share data)
Operating revenues . . . . . . . . . . . . . . . . . . . . . . . . . . . . . . . . $4,142,136 $4,940,916 $3,875,460Gross profit . . . . . . . . . . . . . . . . . . . . . . . . . . . . . . . . . . . . . . 1,680,017 1,582,426 1,412,050Operating expenses . . . . . . . . . . . . . . . . . . . . . . . . . . . . . . . . 1,048,622 971,077 910,171Operating income . . . . . . . . . . . . . . . . . . . . . . . . . . . . . . . . . 631,395 611,349 501,879Miscellaneous expense . . . . . . . . . . . . . . . . . . . . . . . . . . . . . (4,389) (5,235) (197)Interest charges . . . . . . . . . . . . . . . . . . . . . . . . . . . . . . . . . . . 116,241 129,295 128,385Income from continuing operations before income taxes . . . 510,765 476,819 373,297Income tax expense . . . . . . . . . . . . . . . . . . . . . . . . . . . . . . . . 195,690 187,002 142,599Income from continuing operations . . . . . . . . . . . . . . . . . . . 315,075 289,817 230,698Income from discontinued operations, net of tax . . . . . . . . . — — 7,202Gain on sale of discontinued operations, net of tax . . . . . . . — — 5,294Net income . . . . . . . . . . . . . . . . . . . . . . . . . . . . . . . . . . . . . . $ 315,075 $ 289,817 $ 243,194Diluted net income per share from continuing operations . . $ 3.09 $ 2.96 $ 2.50Diluted net income per share from discontinued
operations . . . . . . . . . . . . . . . . . . . . . . . . . . . . . . . . . . . . . $ — $ — $ 0.14Diluted net income per share . . . . . . . . . . . . . . . . . . . . . . . . . $ 3.09 $ 2.96 $ 2.64
Regulated operations contributed 95 percent, 89 percent and 95 percent to our consolidated net income fromcontinuing operations for fiscal years 2015, 2014 and 2013. Our consolidated net income during the last threefiscal years was earned across our business segments as follows:
For the Fiscal Year Ended September 302015 2014 2013
(In thousands)
Regulated distribution segment . . . . . . . . . . . . . . . . . . . . . . . . . . . $204,813 $171,585 $150,856Regulated pipeline segment . . . . . . . . . . . . . . . . . . . . . . . . . . . . . . 94,662 86,191 68,260Nonregulated segment . . . . . . . . . . . . . . . . . . . . . . . . . . . . . . . . . . 15,600 32,041 11,582
Net income from continuing operations . . . . . . . . . . . . . . . . . . . . . 315,075 289,817 230,698Net income from discontinued operations . . . . . . . . . . . . . . . . . . . — — 12,496
Net income . . . . . . . . . . . . . . . . . . . . . . . . . . . . . . . . . . . . . . . . . . . $315,075 $289,817 $243,194
31

The following table segregates our consolidated net income and diluted earnings per share between ourregulated and nonregulated operations:
For the Fiscal Year Ended September 302015 2014 2013
(In thousands, except per share data)
Regulated operations . . . . . . . . . . . . . . . . . . . . . . . . . . . . . . . . . . . $299,475 $257,776 $219,116Nonregulated operations . . . . . . . . . . . . . . . . . . . . . . . . . . . . . . . . 15,600 32,041 11,582
Net income from continuing operations . . . . . . . . . . . . . . . . . . . . . 315,075 289,817 230,698Net income from discontinued operations . . . . . . . . . . . . . . . . . . . — — 12,496
Net income . . . . . . . . . . . . . . . . . . . . . . . . . . . . . . . . . . . . . . . . . . . $315,075 $289,817 $243,194
Diluted EPS from continuing regulated operations . . . . . . . . . . . . $ 2.93 $ 2.63 $ 2.38Diluted EPS from nonregulated operations . . . . . . . . . . . . . . . . . . 0.16 0.33 0.12
Diluted EPS from continuing operations . . . . . . . . . . . . . . . . . . . . 3.09 2.96 2.50Diluted EPS from discontinued operations . . . . . . . . . . . . . . . . . . — — 0.14
Consolidated diluted EPS . . . . . . . . . . . . . . . . . . . . . . . . . . . . . . . . $ 3.09 $ 2.96 $ 2.64
We reported net income of $315.1 million, or $3.09 per diluted share for the year ended September 30,2015, compared with net income of $289.8 million or $2.96 per diluted share in the prior year. Unrealized lossesin our nonregulated operations during the current year decreased net income by $1.5 million or $0.01 per dilutedshare compared with net gains recorded in the prior year of $5.8 million or $0.06 per diluted share.
We reported net income of $289.8 million, or $2.96 per diluted share for the year ended September 30,2014, compared with net income of $243.2 million or $2.64 per diluted share in fiscal 2013. Income fromcontinuing operations in fiscal 2013 was $230.7 million, or $2.50 per diluted share. Income from discontinuedoperations was $12.5 million or $0.14 per diluted share for the year ended September 30, 2013, which includesthe gain on sale of substantially all our assets in Georgia of $5.3 million. Unrealized gains in our nonregulatedoperations during fiscal 2014 increased net income by $5.8 million or $0.06 per diluted share compared with netgains recorded in fiscal 2013 of $5.3 million, or $0.05 per diluted share.
See the following discussion regarding the results of operations for each of our business operating segments.
Regulated Distribution Segment
The primary factors that impact the results of our regulated distribution operations are our ability to earn ourauthorized rates of return, the cost of natural gas, competitive factors in the energy industry and economic con-ditions in our service areas.
Our ability to earn our authorized rates is based primarily on our ability to improve the rate design in ourvarious ratemaking jurisdictions by reducing or eliminating regulatory lag and, ultimately, separating the recov-ery of our approved margins from customer usage patterns. Improving rate design is a long-term process and isfurther complicated by the fact that we operate in multiple rate jurisdictions. The “Ratemaking Activity” sectionof this Form 10-K describes our current rate strategy, progress towards implementing that strategy and recentratemaking initiatives in more detail.
We are generally able to pass the cost of gas through to our customers without markup under purchased gascost adjustment mechanisms; therefore the cost of gas typically does not have an impact on our gross profit asincreases in the cost of gas are offset by a corresponding increase in revenues. Accordingly, we believe grossprofit is a better indicator of our financial performance than revenues. However, gross profit in our Texas andMississippi service areas include franchise fees and gross receipt taxes, which are calculated as a percentage ofrevenue (inclusive of gas costs). Therefore, the amount of these taxes included in revenue is influenced by thecost of gas and the level of gas sales volumes. We record the tax expense as a component of taxes, other thanincome. Although changes in revenue related taxes arising from changes in gas costs affect gross profit, overtime the impact is offset within operating income.
32
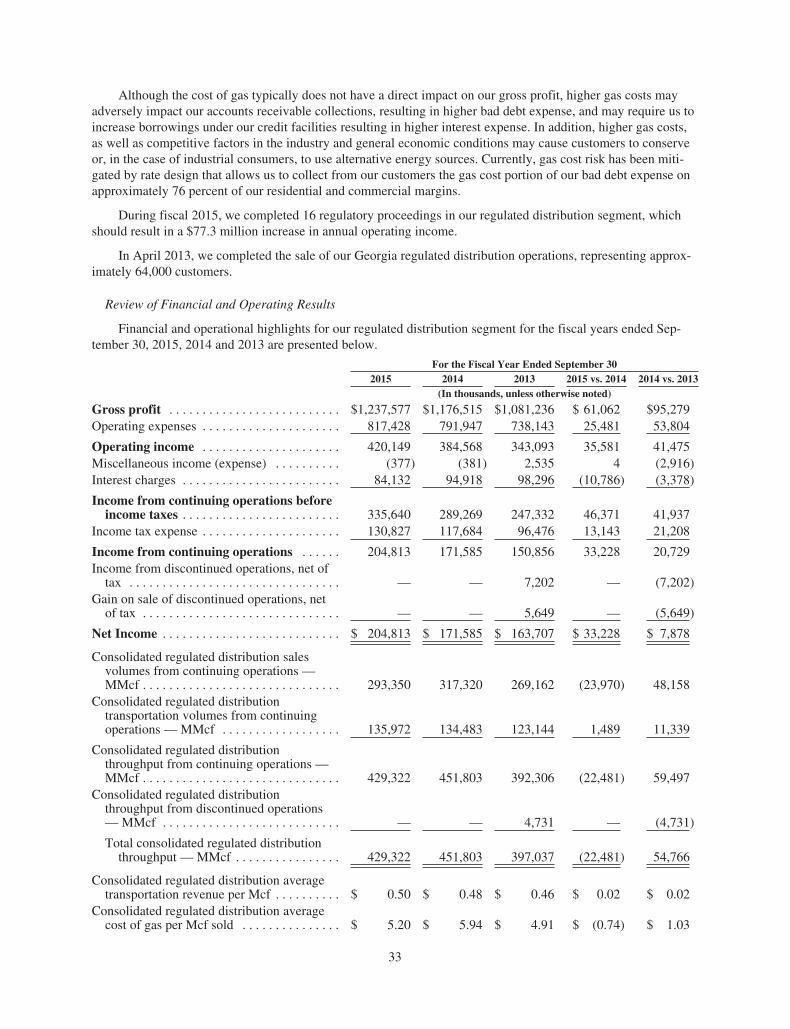
Although the cost of gas typically does not have a direct impact on our gross profit, higher gas costs mayadversely impact our accounts receivable collections, resulting in higher bad debt expense, and may require us toincrease borrowings under our credit facilities resulting in higher interest expense. In addition, higher gas costs,as well as competitive factors in the industry and general economic conditions may cause customers to conserveor, in the case of industrial consumers, to use alternative energy sources. Currently, gas cost risk has been miti-gated by rate design that allows us to collect from our customers the gas cost portion of our bad debt expense onapproximately 76 percent of our residential and commercial margins.
During fiscal 2015, we completed 16 regulatory proceedings in our regulated distribution segment, whichshould result in a $77.3 million increase in annual operating income.
In April 2013, we completed the sale of our Georgia regulated distribution operations, representing approx-imately 64,000 customers.
Review of Financial and Operating Results
Financial and operational highlights for our regulated distribution segment for the fiscal years ended Sep-tember 30, 2015, 2014 and 2013 are presented below.
For the Fiscal Year Ended September 302015 2014 2013 2015 vs. 2014 2014 vs. 2013
(In thousands, unless otherwise noted)
Gross profit . . . . . . . . . . . . . . . . . . . . . . . . . . $1,237,577 $1,176,515 $1,081,236 $ 61,062 $95,279Operating expenses . . . . . . . . . . . . . . . . . . . . . 817,428 791,947 738,143 25,481 53,804
Operating income . . . . . . . . . . . . . . . . . . . . . 420,149 384,568 343,093 35,581 41,475Miscellaneous income (expense) . . . . . . . . . . (377) (381) 2,535 4 (2,916)Interest charges . . . . . . . . . . . . . . . . . . . . . . . . 84,132 94,918 98,296 (10,786) (3,378)
Income from continuing operations beforeincome taxes . . . . . . . . . . . . . . . . . . . . . . . . 335,640 289,269 247,332 46,371 41,937
Income tax expense . . . . . . . . . . . . . . . . . . . . . 130,827 117,684 96,476 13,143 21,208
Income from continuing operations . . . . . . 204,813 171,585 150,856 33,228 20,729Income from discontinued operations, net of
tax . . . . . . . . . . . . . . . . . . . . . . . . . . . . . . . . — — 7,202 — (7,202)Gain on sale of discontinued operations, net
of tax . . . . . . . . . . . . . . . . . . . . . . . . . . . . . . — — 5,649 — (5,649)
Net Income . . . . . . . . . . . . . . . . . . . . . . . . . . . $ 204,813 $ 171,585 $ 163,707 $ 33,228 $ 7,878
Consolidated regulated distribution salesvolumes from continuing operations —MMcf . . . . . . . . . . . . . . . . . . . . . . . . . . . . . . 293,350 317,320 269,162 (23,970) 48,158
Consolidated regulated distributiontransportation volumes from continuingoperations — MMcf . . . . . . . . . . . . . . . . . . 135,972 134,483 123,144 1,489 11,339
Consolidated regulated distributionthroughput from continuing operations —MMcf . . . . . . . . . . . . . . . . . . . . . . . . . . . . . . 429,322 451,803 392,306 (22,481) 59,497
Consolidated regulated distributionthroughput from discontinued operations— MMcf . . . . . . . . . . . . . . . . . . . . . . . . . . . — — 4,731 — (4,731)
Total consolidated regulated distributionthroughput — MMcf . . . . . . . . . . . . . . . . 429,322 451,803 397,037 (22,481) 54,766
Consolidated regulated distribution averagetransportation revenue per Mcf . . . . . . . . . . $ 0.50 $ 0.48 $ 0.46 $ 0.02 $ 0.02
Consolidated regulated distribution averagecost of gas per Mcf sold . . . . . . . . . . . . . . . $ 5.20 $ 5.94 $ 4.91 $ (0.74) $ 1.03
33
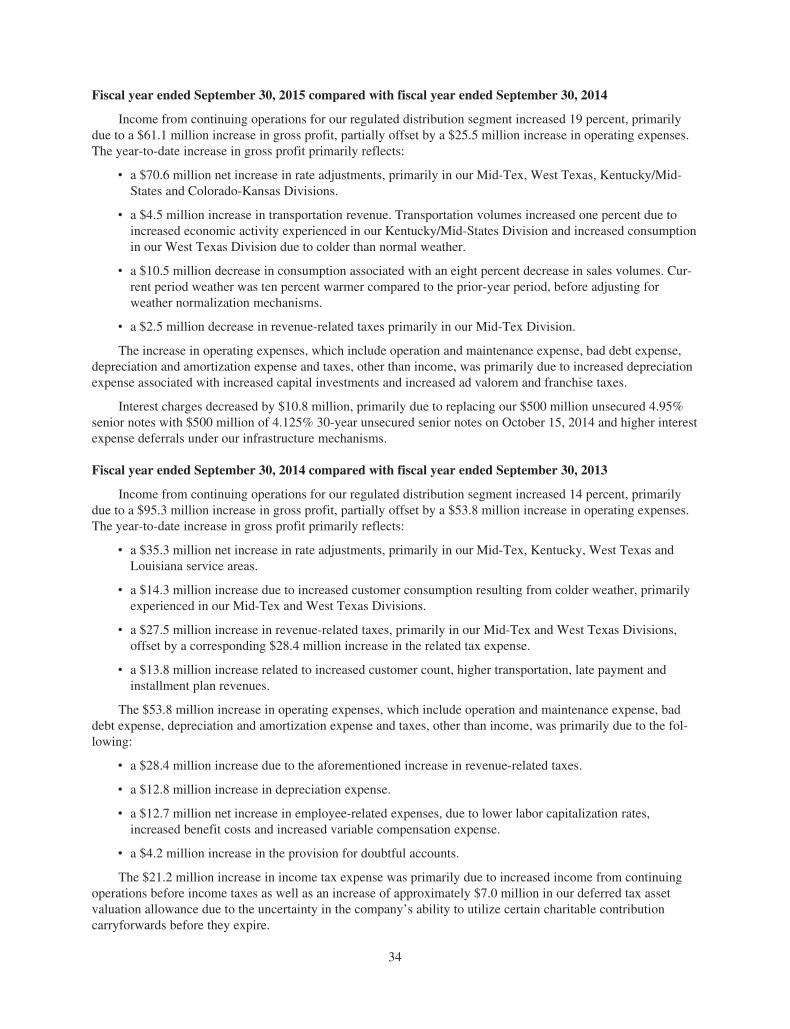
Fiscal year ended September 30, 2015 compared with fiscal year ended September 30, 2014
Income from continuing operations for our regulated distribution segment increased 19 percent, primarilydue to a $61.1 million increase in gross profit, partially offset by a $25.5 million increase in operating expenses.The year-to-date increase in gross profit primarily reflects:
‰ a $70.6 million net increase in rate adjustments, primarily in our Mid-Tex, West Texas, Kentucky/Mid-States and Colorado-Kansas Divisions.
‰ a $4.5 million increase in transportation revenue. Transportation volumes increased one percent due toincreased economic activity experienced in our Kentucky/Mid-States Division and increased consumptionin our West Texas Division due to colder than normal weather.
‰ a $10.5 million decrease in consumption associated with an eight percent decrease in sales volumes. Cur-rent period weather was ten percent warmer compared to the prior-year period, before adjusting forweather normalization mechanisms.
‰ a $2.5 million decrease in revenue-related taxes primarily in our Mid-Tex Division.
The increase in operating expenses, which include operation and maintenance expense, bad debt expense,depreciation and amortization expense and taxes, other than income, was primarily due to increased depreciationexpense associated with increased capital investments and increased ad valorem and franchise taxes.
Interest charges decreased by $10.8 million, primarily due to replacing our $500 million unsecured 4.95%senior notes with $500 million of 4.125% 30-year unsecured senior notes on October 15, 2014 and higher interestexpense deferrals under our infrastructure mechanisms.
Fiscal year ended September 30, 2014 compared with fiscal year ended September 30, 2013
Income from continuing operations for our regulated distribution segment increased 14 percent, primarilydue to a $95.3 million increase in gross profit, partially offset by a $53.8 million increase in operating expenses.The year-to-date increase in gross profit primarily reflects:
‰ a $35.3 million net increase in rate adjustments, primarily in our Mid-Tex, Kentucky, West Texas andLouisiana service areas.
‰ a $14.3 million increase due to increased customer consumption resulting from colder weather, primarilyexperienced in our Mid-Tex and West Texas Divisions.
‰ a $27.5 million increase in revenue-related taxes, primarily in our Mid-Tex and West Texas Divisions,offset by a corresponding $28.4 million increase in the related tax expense.
‰ a $13.8 million increase related to increased customer count, higher transportation, late payment andinstallment plan revenues.
The $53.8 million increase in operating expenses, which include operation and maintenance expense, baddebt expense, depreciation and amortization expense and taxes, other than income, was primarily due to the fol-lowing:
‰ a $28.4 million increase due to the aforementioned increase in revenue-related taxes.
‰ a $12.8 million increase in depreciation expense.
‰ a $12.7 million net increase in employee-related expenses, due to lower labor capitalization rates,increased benefit costs and increased variable compensation expense.
‰ a $4.2 million increase in the provision for doubtful accounts.
The $21.2 million increase in income tax expense was primarily due to increased income from continuingoperations before income taxes as well as an increase of approximately $7.0 million in our deferred tax assetvaluation allowance due to the uncertainty in the company’s ability to utilize certain charitable contributioncarryforwards before they expire.
34

The following table shows our operating income from continuing operations by regulated distribution divi-sion, in order of total rate base, for the fiscal years ended September 30, 2015, 2014 and 2013. The presentationof our regulated distribution operating income is included for financial reporting purposes and may not be appro-priate for ratemaking purposes.
For the Fiscal Year Ended September 302015 2014 2013 2015 vs. 2014 2014 vs. 2013
(In thousands)
Mid-Tex . . . . . . . . . . . . . . . . . . . . . $197,559 $187,265 $158,900 $10,294 $28,365Kentucky/Mid-States . . . . . . . . . . . 59,233 55,968 46,164 3,265 9,804Louisiana . . . . . . . . . . . . . . . . . . . . 51,001 56,648 52,125 (5,647) 4,523West Texas . . . . . . . . . . . . . . . . . . . 37,180 29,250 28,085 7,930 1,165Mississippi . . . . . . . . . . . . . . . . . . . 34,333 28,473 29,112 5,860 (639)Colorado-Kansas . . . . . . . . . . . . . . 28,720 28,077 25,478 643 2,599Other . . . . . . . . . . . . . . . . . . . . . . . . 12,123 (1,113) 3,229 13,236 (4,342)
Total . . . . . . . . . . . . . . . . . . . . . . . . $420,149 $384,568 $343,093 $35,581 $41,475
Regulated Pipeline Segment
Our regulated pipeline segment consists of the pipeline and storage operations of the Atmos Pipeline - TexasDivision (APT). APT is one of the largest intrastate pipeline operations in Texas with a heavy concentration inthe established natural gas-producing areas of central, northern and eastern Texas, extending into or near themajor producing areas of the Barnett Shale, the Texas Gulf Coast and the Permian Basin of West Texas. APT’sprimary business is providing firm transportation and storage services for our Mid-Tex Division and other LDCcustomers. APT also provides interruptible transportation, storage and ancillary services for third parties includ-ing, industrial and electric generation customers as well as producers, marketers and other shippers.
Our regulated pipeline segment is impacted by seasonal weather patterns, competitive factors in the energyindustry and economic conditions in APT’s service area. Natural gas prices do not directly impact the results ofthis segment as revenues are derived from the transportation of natural gas. However, natural gas prices anddemand for natural gas could influence the level of drilling activity in the markets that we serve, which mayinfluence the level of throughput we may be able to transport on our pipeline. Further, natural gas price differ-ences between the various hubs that we serve impact the market value for transportation services between thosegeographic areas.
The results of the Atmos Pipeline - Texas Division are also significantly impacted by the natural gas require-ments of the Mid-Tex Division because it is the primary transporter of natural gas for our Mid-Tex Division.
Finally, as a regulated pipeline, the operations of the Atmos Pipeline - Texas Division may be impacted bythe timing of when costs and expenses are incurred and when these costs and expenses are recovered through itstariffs.
35

Review of Financial and Operating Results
Financial and operational highlights for our regulated pipeline segment for the fiscal years ended Sep-tember 30, 2015, 2014 and 2013 are presented below.
For the Fiscal Year Ended September 302015 2014 2013 2015 vs. 2014 2014 vs. 2013
(In thousands, unless otherwise noted)
Mid-Tex Division transportation . . . . . . . . . . $264,059 $227,230 $179,628 $36,829 $47,602Third-party transportation . . . . . . . . . . . . . . . 94,893 76,109 66,939 18,784 9,170Storage and park and lend services . . . . . . . . 3,575 5,344 5,985 (1,769) (641)Other . . . . . . . . . . . . . . . . . . . . . . . . . . . . . . . . 7,585 9,776 16,348 (2,191) (6,572)
Gross profit . . . . . . . . . . . . . . . . . . . . . . . . . . 370,112 318,459 268,900 51,653 49,559Operating expenses . . . . . . . . . . . . . . . . . . . . 188,845 145,640 129,047 43,205 16,593
Operating income . . . . . . . . . . . . . . . . . . . . . 181,267 172,819 139,853 8,448 32,966Miscellaneous expense . . . . . . . . . . . . . . . . . . (1,243) (3,181) (2,285) 1,938 (896)Interest charges . . . . . . . . . . . . . . . . . . . . . . . . 33,151 36,280 30,678 (3,129) 5,602
Income before income taxes . . . . . . . . . . . . 146,873 133,358 106,890 13,515 26,468Income tax expense . . . . . . . . . . . . . . . . . . . . 52,211 47,167 38,630 5,044 8,537
Net income . . . . . . . . . . . . . . . . . . . . . . . . . . . $ 94,662 $ 86,191 $ 68,260 $ 8,471 $17,931
Gross pipeline transportationvolumes — MMcf . . . . . . . . . . . . . . . . . . . 738,532 714,464 649,740 24,068 64,724
Consolidated pipeline transportationvolumes — MMcf . . . . . . . . . . . . . . . . . . . 528,068 493,360 467,178 34,708 26,182
Fiscal year ended September 30, 2015 compared with fiscal year ended September 30, 2014
Net income for our regulated pipeline segment increased 10 percent, primarily due to a $51.7 millionincrease in gross profit, partially offset by a $43.2 million increase in operating expenses. The increase in grossprofit primarily reflects a $47.0 million increase in rates from the approved 2014 and 2015 Gas Reliability Infra-structure Program (GRIP) filings. Additionally, gross profit reflects increased pipeline demand fees and through-system transportation volumes and rates that were offset by lower storage and other fees and the absence of a$1.8 million increase recorded in the prior-year associated with an annual adjustment mechanism.
Operating expenses increased $43.2 million, primarily due to increased levels of pipeline and right-of-waymaintenance activities to improve the safety and reliability of our system and increased depreciation expenseassociated with increased capital investments, along with the absence of a $6.7 million refund received in theprior year as a result of the completion of a state use tax audit.
Fiscal year ended September 30, 2014 compared with fiscal year ended September 30, 2013
Net income for our regulated pipeline segment increased 26 percent in fiscal 2014 compared to fiscal 2013,primarily due to a $49.6 million increase in gross profit. The increase in gross profit primarily reflects a $38.5million increase in rates from the GRIP filings approved by the Railroad Commission of Texas (RRC) in fiscal2014 and 2013 coupled with a $4.7 million increase associated with higher transportation volumes and basisspreads driven by colder weather.
The Atmos Pipeline — Texas rate case approved by the RRC on April 18, 2011 contained an annual adjust-ment mechanism, approved for a three-year pilot program, that adjusted regulated rates up or down by 75 percentof the difference between the non-regulated annual revenue of Atmos Pipeline — Texas and a pre-defined basecredit. The annual adjustment mechanism expired on June 30, 2013. On January 1, 2014, the RRC approved theextension of the annual adjustment mechanism retroactive to July 1, 2013, which will stay in place until thecompletion of the next Atmos Pipeline — Texas rate case. As a result of this decision, during fiscal 2014, werecognized a $1.8 million increase in gross profit for the application of the annual adjustment mechanism, for theperiod July 1, 2013 to September 30, 2013.
36

Operating expenses increased $16.6 million primarily due to the following:
‰ a $10.1 million increase in pipeline and right-of-way maintenance activities.
‰ a $5.7 million increase in depreciation expense associated with increased capital investments.
‰ a $2.4 million increase due to higher employee-related expenses, partially offset by
‰ a $6.7 million refund received as a result of the completion of a state use tax audit.
Nonregulated Segment
Our nonregulated operations are conducted through Atmos Energy Holdings, Inc. (AEH), a wholly-ownedsubsidiary of Atmos Energy Corporation and typically represents approximately five percent of our consolidatednet income.
AEH’s primary business is to buy, sell and deliver natural gas at competitive prices to approximately 1,000customers located primarily in the Midwest and Southeast areas of the United States. AEH accomplishes thisobjective by aggregating and purchasing gas supply, arranging transportation and storage logistics and effectivelymanaging commodity price risk.
AEH also earns storage and transportation demand fees primarily from our regulated distribution operationsin Louisiana and Kentucky. These demand fees are subject to regulatory oversight and are renewed periodically.
Our nonregulated activities are significantly influenced by competitive factors in the industry and generaleconomic conditions. Therefore, the margins earned from these activities are dependent upon our ability to attractand retain customers and to minimize the cost of buying, selling and delivering natural gas to offer more com-petitive pricing to those customers.
Further, natural gas market conditions, most notably the price of natural gas and the level of price volatilityaffect our nonregulated businesses. Natural gas prices and the level of volatility are influenced by a number offactors including, but not limited to, general economic conditions, the demand for natural gas in different parts ofthe country, the level of domestic natural gas production and the level of natural gas inventory levels.
Natural gas prices can influence:
‰ The demand for natural gas. Higher prices may cause customers to conserve or use alternative energysources. Conversely, lower prices could cause customers such as electric power generators to switch fromalternative energy sources to natural gas.
‰ Collection of accounts receivable from customers, which could affect the level of bad debt expense recog-nized by this segment.
‰ The level of borrowings under our credit facilities, which affects the level of interest expense recognizedby this segment.
Natural gas price volatility can also influence our nonregulated business in the following ways:
‰ Price volatility influences basis differentials, which provide opportunities to profit from identifying thelowest cost alternative among the natural gas supplies, transportation and markets to which we haveaccess.
‰ Increased or decreased volatility impacts the amounts of unrealized margins recorded in our gross profitand could impact the amount of cash required to collateralize our risk management liabilities.
Our nonregulated segment manages its exposure to natural gas commodity price risk through a combinationof physical storage and financial instruments. Therefore, results for this segment include unrealized gains orlosses on its net physical gas position and the related financial instruments used to manage commodity price risk.These margins fluctuate based upon changes in the spreads between the physical and forward natural gas prices.The magnitude of the unrealized gains and losses is also contingent upon the levels of our net physical position atthe end of the reporting period.
37

Review of Financial and Operating Results
Financial and operational highlights for our nonregulated segment for the fiscal years ended September 30,2015, 2014 and 2013 are presented below.
For the Fiscal Year Ended September 302015 2014 2013 2015 vs. 2014 2014 vs. 2013
(In thousands, unless otherwise noted)
Realized marginsGas delivery and related services . . . . . . . . . . . . . . . . $ 48,930 $ 39,529 $ 39,839 $ 9,401 $ (310)Storage and transportation services . . . . . . . . . . . . . . 13,575 14,696 14,641 (1,121) 55Other . . . . . . . . . . . . . . . . . . . . . . . . . . . . . . . . . . . . . . 12,755 24,170 (103) (11,415) 24,273
Total realized margins . . . . . . . . . . . . . . . . . . . . . . . . . 75,260 78,395 54,377 (3,135) 24,018Unrealized margins . . . . . . . . . . . . . . . . . . . . . . . . . . . (2,400) 9,560 8,954 (11,960) 606
Gross profit . . . . . . . . . . . . . . . . . . . . . . . . . . . . . . . . . . 72,860 87,955 63,331 (15,095) 24,624Operating expenses . . . . . . . . . . . . . . . . . . . . . . . . . . . . 42,881 33,993 44,404 8,888 (10,411)
Operating income . . . . . . . . . . . . . . . . . . . . . . . . . . . . . 29,979 53,962 18,927 (23,983) 35,035Miscellaneous income (expense) . . . . . . . . . . . . . . . . . . (760) 2,216 2,316 (2,976) (100)Interest charges . . . . . . . . . . . . . . . . . . . . . . . . . . . . . . . . 967 1,986 2,168 (1,019) (182)
Income from continuing operations before incometaxes . . . . . . . . . . . . . . . . . . . . . . . . . . . . . . . . . . . . . . 28,252 54,192 19,075 (25,940) 35,117
Income tax expense . . . . . . . . . . . . . . . . . . . . . . . . . . . . 12,652 22,151 7,493 (9,499) 14,658
Income from continuing operations . . . . . . . . . . . . . . . . 15,600 32,041 11,582 (16,441) 20,459Loss on sale of discontinued operations, net of tax . . . . — — (355) — 355
Net income . . . . . . . . . . . . . . . . . . . . . . . . . . . . . . . . . . . $ 15,600 $ 32,041 $ 11,227 $(16,441) $ 20,814
Gross nonregulated delivered gas salesvolumes — MMcf . . . . . . . . . . . . . . . . . . . . . . . . . . . 410,044 439,014 396,561 (28,970) 42,453
Consolidated nonregulated delivered gas salesvolumes — MMcf . . . . . . . . . . . . . . . . . . . . . . . . . . . 351,427 377,441 343,669 (26,014) 33,772
Net physical position (Bcf) . . . . . . . . . . . . . . . . . . . . . . 14.6 9.3 12.0 5.3 (2.7)
Fiscal year ended September 30, 2015 compared with fiscal year ended September 30, 2014
Net income for our nonregulated segment decreased 51 percent from the prior year due to lower gross profitand higher operating expenses.
The $15.1 million period-over-period decrease in gross profit was primarily due to a $12.0 million decreasein unrealized margins combined with a $3.1 million decrease in realized margins. The decrease in realized mar-gins reflects:
‰ An $11.4 million decrease in other realized margins primarily due to lower natural gas price volatility. Inthe prior-year period, strong market demand caused by significantly colder-than-normal weather resultedin increased market volatility. These market conditions created the opportunity to accelerate physicalwithdrawals that had been planned for future periods into the fiscal 2014 second quarter to captureincremental gross profit margin. Market conditions in the current-year period were less volatile than theprior-year period, which provided fewer opportunities to capture incremental gross profit.
‰ A $9.4 million increase in gas delivery and related services margins, primarily due to an increase in per-unit margins from 9 cents to 12 cents per Mcf, partially offset by a seven percent decrease in consolidatedsales volumes. AEH elected not to renew excess transportation capacity in certain markets in late fiscal2014 and early 2015. As a result, AEH has experienced fewer deliveries to low-margin marketing andpower generation customers, which is the primary driver for the decrease in consolidated sales volumesand higher per-unit margins.
38
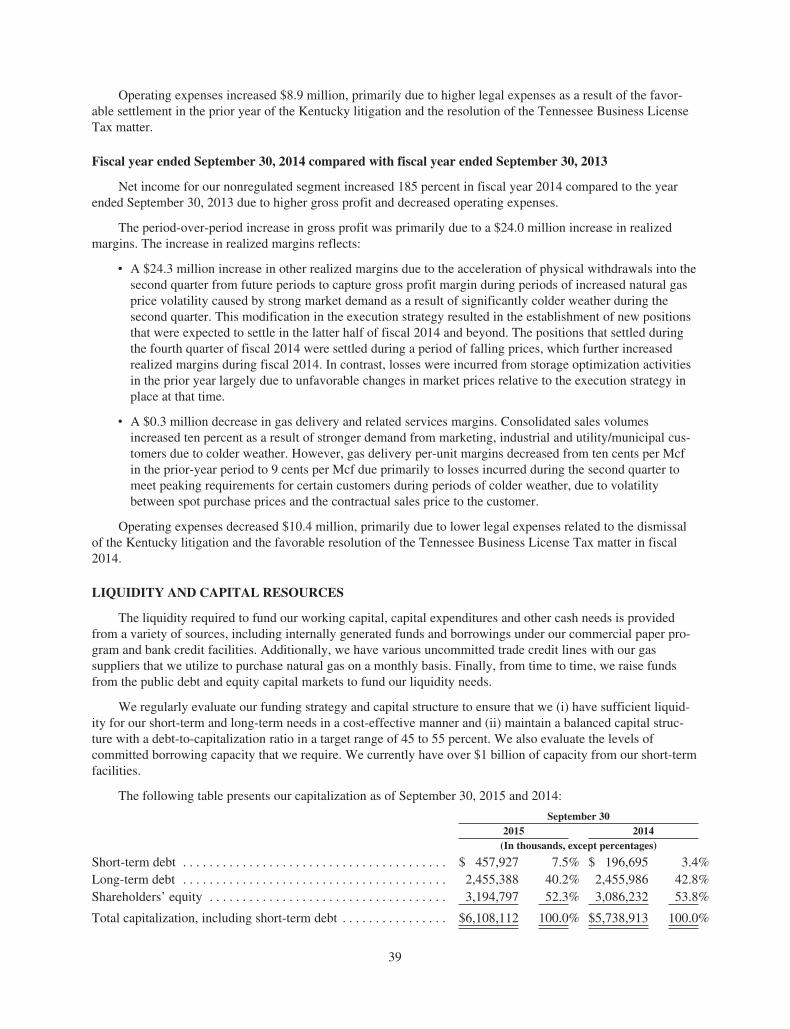
Operating expenses increased $8.9 million, primarily due to higher legal expenses as a result of the favor-able settlement in the prior year of the Kentucky litigation and the resolution of the Tennessee Business LicenseTax matter.
Fiscal year ended September 30, 2014 compared with fiscal year ended September 30, 2013
Net income for our nonregulated segment increased 185 percent in fiscal year 2014 compared to the yearended September 30, 2013 due to higher gross profit and decreased operating expenses.
The period-over-period increase in gross profit was primarily due to a $24.0 million increase in realizedmargins. The increase in realized margins reflects:
‰ A $24.3 million increase in other realized margins due to the acceleration of physical withdrawals into thesecond quarter from future periods to capture gross profit margin during periods of increased natural gasprice volatility caused by strong market demand as a result of significantly colder weather during thesecond quarter. This modification in the execution strategy resulted in the establishment of new positionsthat were expected to settle in the latter half of fiscal 2014 and beyond. The positions that settled duringthe fourth quarter of fiscal 2014 were settled during a period of falling prices, which further increasedrealized margins during fiscal 2014. In contrast, losses were incurred from storage optimization activitiesin the prior year largely due to unfavorable changes in market prices relative to the execution strategy inplace at that time.
‰ A $0.3 million decrease in gas delivery and related services margins. Consolidated sales volumesincreased ten percent as a result of stronger demand from marketing, industrial and utility/municipal cus-tomers due to colder weather. However, gas delivery per-unit margins decreased from ten cents per Mcfin the prior-year period to 9 cents per Mcf due primarily to losses incurred during the second quarter tomeet peaking requirements for certain customers during periods of colder weather, due to volatilitybetween spot purchase prices and the contractual sales price to the customer.
Operating expenses decreased $10.4 million, primarily due to lower legal expenses related to the dismissalof the Kentucky litigation and the favorable resolution of the Tennessee Business License Tax matter in fiscal2014.
LIQUIDITY AND CAPITAL RESOURCES
The liquidity required to fund our working capital, capital expenditures and other cash needs is providedfrom a variety of sources, including internally generated funds and borrowings under our commercial paper pro-gram and bank credit facilities. Additionally, we have various uncommitted trade credit lines with our gassuppliers that we utilize to purchase natural gas on a monthly basis. Finally, from time to time, we raise fundsfrom the public debt and equity capital markets to fund our liquidity needs.
We regularly evaluate our funding strategy and capital structure to ensure that we (i) have sufficient liquid-ity for our short-term and long-term needs in a cost-effective manner and (ii) maintain a balanced capital struc-ture with a debt-to-capitalization ratio in a target range of 45 to 55 percent. We also evaluate the levels ofcommitted borrowing capacity that we require. We currently have over $1 billion of capacity from our short-termfacilities.
The following table presents our capitalization as of September 30, 2015 and 2014:
September 302015 2014
(In thousands, except percentages)
Short-term debt . . . . . . . . . . . . . . . . . . . . . . . . . . . . . . . . . . . . . . . . $ 457,927 7.5% $ 196,695 3.4%Long-term debt . . . . . . . . . . . . . . . . . . . . . . . . . . . . . . . . . . . . . . . . 2,455,388 40.2% 2,455,986 42.8%Shareholders’ equity . . . . . . . . . . . . . . . . . . . . . . . . . . . . . . . . . . . . 3,194,797 52.3% 3,086,232 53.8%
Total capitalization, including short-term debt . . . . . . . . . . . . . . . . $6,108,112 100.0% $5,738,913 100.0%
39

Total debt as a percentage of total capitalization, including short-term debt, was 47.7 percent and 46.2 per-cent at September 30, 2015 and 2014.
As we continue to invest in the safety and reliability of our distribution and transportation system, we expectour capital spending will increase in future periods. We intend to fund this level of investment through availableoperating cash flows, the issuance of long-term debt securities and equity. We believe the liquidity provided bythese sources combined with our committed credit facilities will be sufficient to fund our working capital needsand capital expenditure program for fiscal year 2016 and beyond.
On September 25, 2015, we terminated our existing $1.25 billion credit facility and entered into a new fiveyear $1.25 billion credit facility with substantially the same terms. The new facility also retains the $250 millionaccordion feature, which allows for an increase in the total committed loan amount to $1.5 billion.
Additionally, we plan to issue new unsecured senior notes to replace $250 million and $450 million ofunsecured senior notes that will mature in fiscal 2017 and fiscal 2019. During fiscal 2014 and 2015, we enteredinto forward starting interest rate swaps to fix the Treasury yield component associated with the anticipated fiscal2019 issuances at 3.782%. In fiscal 2012, we entered into forward starting interest rate swaps to fix the Treasuryyield component associated with the anticipated fiscal 2017 issuances at 3.367%.
Cash Flows
Our internally generated funds may change in the future due to a number of factors, some of which wecannot control. These factors include regulatory changes, the price for our services, the demand for such productsand services, margin requirements resulting from significant changes in commodity prices, operational risks andother factors.
Cash flows from operating, investing and financing activities for the years ended September 30, 2015, 2014and 2013 are presented below.
For the Fiscal Year Ended September 302015 2014 2013 2015 vs. 2014 2014 vs. 2013
(In thousands)
Total cash provided by (used in)Operating activities . . . . . . . . . . . . . . . . . . $ 836,519 $ 739,986 $ 613,127 $ 96,533 $ 126,859Investing activities . . . . . . . . . . . . . . . . . . . (974,755) (837,576) (696,914) (137,179) (140,662)Financing activities . . . . . . . . . . . . . . . . . . 124,631 73,649 85,747 50,982 (12,098)
Change in cash and cash equivalents . . . . . (13,605) (23,941) 1,960 10,336 (25,901)Cash and cash equivalents at beginning of
period . . . . . . . . . . . . . . . . . . . . . . . . . . . 42,258 66,199 64,239 (23,941) 1,960
Cash and cash equivalents at end ofperiod . . . . . . . . . . . . . . . . . . . . . . . . . . . $ 28,653 $ 42,258 $ 66,199 $ (13,605) $ (23,941)
Cash flows from operating activities
Year-over-year changes in our operating cash flows primarily are attributable to changes in net income,working capital changes, particularly within our regulated distribution segment resulting from changes in theprice of natural gas and the timing of customer collections, payments for natural gas purchases and deferred gascost recoveries.
Fiscal Year ended September 30, 2015 compared with fiscal year ended September 30, 2014
For the fiscal year ended September 30, 2015, we generated operating cash flow of $836.5 million fromoperating activities compared with $740.0 million in the prior year. The year-over-year increase primarilyreflects successful rate case outcomes in the prior year, the timing of gas cost recoveries under our purchased gascost mechanisms and lower gas prices during the current-year storage injection season.
40

Fiscal Year ended September 30, 2014 compared with fiscal year ended September 30, 2013
For the fiscal year ended September 30, 2014, we generated operating cash flow of $740.0 million fromoperating activities compared with $613.1 million in fiscal 2013. The year-over-year increase reflects higheroperating results from colder weather and rate increases combined with the timing of customer collections andvendor payments.
Cash flows from investing activities
In recent years, a substantial portion of our cash resources has been used to fund our ongoing constructionprogram, which enables us to enhance the safety and reliability of the systems used to provide regulated dis-tribution services to our existing customer base, expand our natural gas distribution services into new markets,enhance the integrity of our pipelines and, more recently, expand our intrastate pipeline network. Over the lastthree fiscal years, approximately 80 percent of our capital spending has been committed to improving the safetyand reliability of our system.
In executing our regulatory strategy, we target our capital spending on regulatory mechanisms that permit usto earn an adequate return timely on our investment without compromising the safety or reliability of our system.Substantially all of our regulated jurisdictions have rate tariffs that provide the opportunity to include in their ratebase approved capital costs on a periodic basis without being required to file a rate case.
For the fiscal year ended September 30, 2015, we incurred $975.1 million for capital expenditures comparedwith $835.3 million for the fiscal year ended September 30, 2014 and $845.0 million for the fiscal year endedSeptember 30, 2013.
Fiscal Year ended September 30, 2015 compared with fiscal year ended September 30, 2014
The $139.8 million increase in capital expenditures in fiscal 2015 compared to fiscal 2014 primarilyreflects:
‰ A $96.9 million increase in capital spending in our regulated distribution segment, which primarilyreflects a planned increase in safety and reliability investment in fiscal 2015.
‰ A $43.4 million increase in capital spending in our regulated pipeline segment, primarily related to theenhancement and fortification of two storage fields to ensure the reliability of gas service to our Mid-TexDivision.
Fiscal Year ended September 30, 2014 compared with fiscal year ended September 30, 2013
The $9.7 million decrease in capital expenditures in fiscal 2014 compared to fiscal 2013 primarily reflects:
‰ A $63.9 million decrease in capital spending in our regulated pipeline segment primarily associated withthe completion of the Line WX expansion project, partially offset by
‰ A $55.5 million increase in capital spending in our regulated distribution segment due to increased spend-ing under our infrastructure replacement programs.
Cash flows from financing activities
We generated a net $124.6 million, $73.6 million and $85.7 million in cash from financing activities forfiscal years 2015, 2014 and 2013. Our significant financing activities for the fiscal years ended September 30,2015, 2014 and 2013 are summarized as follows:
2015
During the fiscal year ended September 30, 2015, our financing activities generated $124.6 million of cashcompared with $73.6 million of cash generated in the prior year. The increase is primarily due to timing betweenshort-term debt borrowings and repayments during the current year, proceeds from the issuance of $500 millionunsecured 4.125% senior notes in October 2014 and the settlement of the associated forward starting interest rate
41
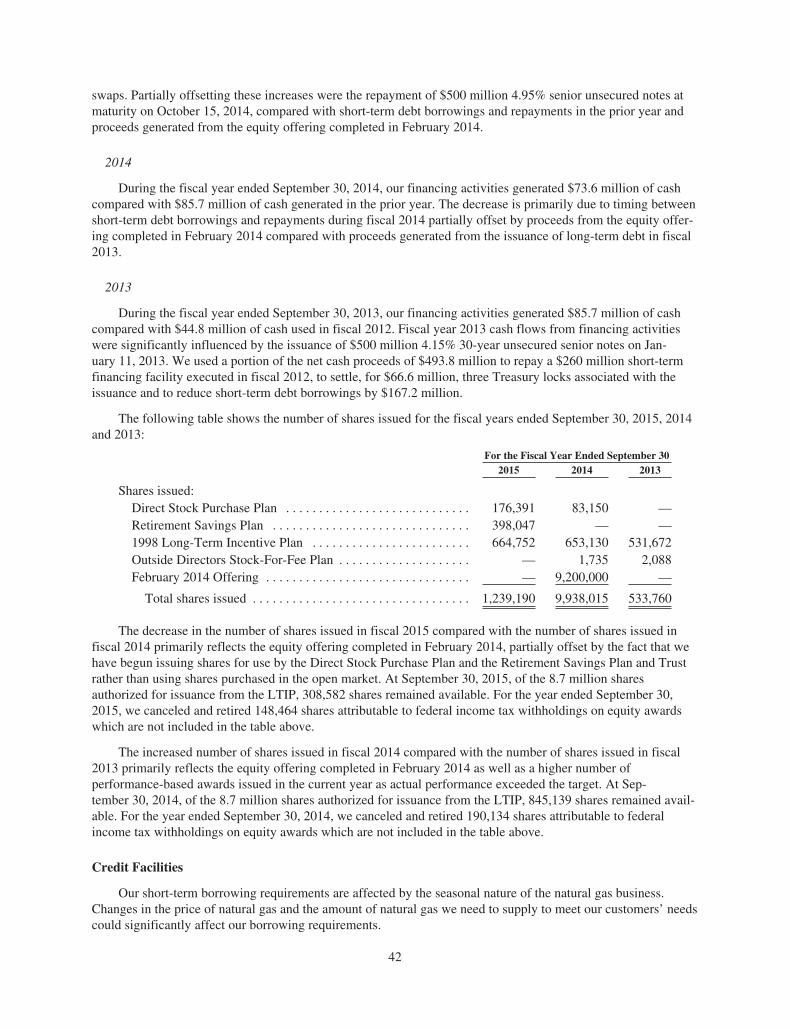
swaps. Partially offsetting these increases were the repayment of $500 million 4.95% senior unsecured notes atmaturity on October 15, 2014, compared with short-term debt borrowings and repayments in the prior year andproceeds generated from the equity offering completed in February 2014.
2014
During the fiscal year ended September 30, 2014, our financing activities generated $73.6 million of cashcompared with $85.7 million of cash generated in the prior year. The decrease is primarily due to timing betweenshort-term debt borrowings and repayments during fiscal 2014 partially offset by proceeds from the equity offer-ing completed in February 2014 compared with proceeds generated from the issuance of long-term debt in fiscal2013.
2013
During the fiscal year ended September 30, 2013, our financing activities generated $85.7 million of cashcompared with $44.8 million of cash used in fiscal 2012. Fiscal year 2013 cash flows from financing activitieswere significantly influenced by the issuance of $500 million 4.15% 30-year unsecured senior notes on Jan-uary 11, 2013. We used a portion of the net cash proceeds of $493.8 million to repay a $260 million short-termfinancing facility executed in fiscal 2012, to settle, for $66.6 million, three Treasury locks associated with theissuance and to reduce short-term debt borrowings by $167.2 million.
The following table shows the number of shares issued for the fiscal years ended September 30, 2015, 2014and 2013:
For the Fiscal Year Ended September 302015 2014 2013
Shares issued:Direct Stock Purchase Plan . . . . . . . . . . . . . . . . . . . . . . . . . . . . 176,391 83,150 —Retirement Savings Plan . . . . . . . . . . . . . . . . . . . . . . . . . . . . . . 398,047 — —1998 Long-Term Incentive Plan . . . . . . . . . . . . . . . . . . . . . . . . 664,752 653,130 531,672Outside Directors Stock-For-Fee Plan . . . . . . . . . . . . . . . . . . . . — 1,735 2,088February 2014 Offering . . . . . . . . . . . . . . . . . . . . . . . . . . . . . . . — 9,200,000 —
Total shares issued . . . . . . . . . . . . . . . . . . . . . . . . . . . . . . . . . 1,239,190 9,938,015 533,760
The decrease in the number of shares issued in fiscal 2015 compared with the number of shares issued infiscal 2014 primarily reflects the equity offering completed in February 2014, partially offset by the fact that wehave begun issuing shares for use by the Direct Stock Purchase Plan and the Retirement Savings Plan and Trustrather than using shares purchased in the open market. At September 30, 2015, of the 8.7 million sharesauthorized for issuance from the LTIP, 308,582 shares remained available. For the year ended September 30,2015, we canceled and retired 148,464 shares attributable to federal income tax withholdings on equity awardswhich are not included in the table above.
The increased number of shares issued in fiscal 2014 compared with the number of shares issued in fiscal2013 primarily reflects the equity offering completed in February 2014 as well as a higher number ofperformance-based awards issued in the current year as actual performance exceeded the target. At Sep-tember 30, 2014, of the 8.7 million shares authorized for issuance from the LTIP, 845,139 shares remained avail-able. For the year ended September 30, 2014, we canceled and retired 190,134 shares attributable to federalincome tax withholdings on equity awards which are not included in the table above.
Credit Facilities
Our short-term borrowing requirements are affected by the seasonal nature of the natural gas business.Changes in the price of natural gas and the amount of natural gas we need to supply to meet our customers’ needscould significantly affect our borrowing requirements.
42
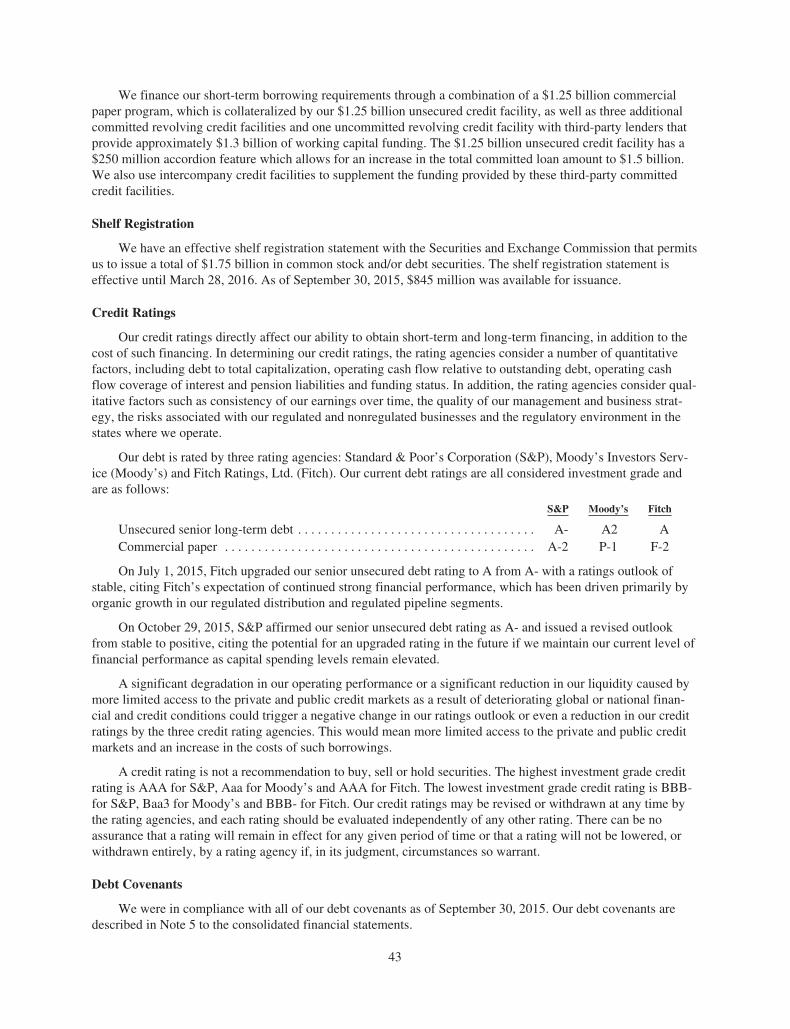
We finance our short-term borrowing requirements through a combination of a $1.25 billion commercialpaper program, which is collateralized by our $1.25 billion unsecured credit facility, as well as three additionalcommitted revolving credit facilities and one uncommitted revolving credit facility with third-party lenders thatprovide approximately $1.3 billion of working capital funding. The $1.25 billion unsecured credit facility has a$250 million accordion feature which allows for an increase in the total committed loan amount to $1.5 billion.We also use intercompany credit facilities to supplement the funding provided by these third-party committedcredit facilities.
Shelf Registration
We have an effective shelf registration statement with the Securities and Exchange Commission that permitsus to issue a total of $1.75 billion in common stock and/or debt securities. The shelf registration statement iseffective until March 28, 2016. As of September 30, 2015, $845 million was available for issuance.
Credit Ratings
Our credit ratings directly affect our ability to obtain short-term and long-term financing, in addition to thecost of such financing. In determining our credit ratings, the rating agencies consider a number of quantitativefactors, including debt to total capitalization, operating cash flow relative to outstanding debt, operating cashflow coverage of interest and pension liabilities and funding status. In addition, the rating agencies consider qual-itative factors such as consistency of our earnings over time, the quality of our management and business strat-egy, the risks associated with our regulated and nonregulated businesses and the regulatory environment in thestates where we operate.
Our debt is rated by three rating agencies: Standard & Poor’s Corporation (S&P), Moody’s Investors Serv-ice (Moody’s) and Fitch Ratings, Ltd. (Fitch). Our current debt ratings are all considered investment grade andare as follows:
S&P Moody’s Fitch
Unsecured senior long-term debt . . . . . . . . . . . . . . . . . . . . . . . . . . . . . . . . . . . . A- A2 ACommercial paper . . . . . . . . . . . . . . . . . . . . . . . . . . . . . . . . . . . . . . . . . . . . . . . A-2 P-1 F-2
On July 1, 2015, Fitch upgraded our senior unsecured debt rating to A from A- with a ratings outlook ofstable, citing Fitch’s expectation of continued strong financial performance, which has been driven primarily byorganic growth in our regulated distribution and regulated pipeline segments.
On October 29, 2015, S&P affirmed our senior unsecured debt rating as A- and issued a revised outlookfrom stable to positive, citing the potential for an upgraded rating in the future if we maintain our current level offinancial performance as capital spending levels remain elevated.
A significant degradation in our operating performance or a significant reduction in our liquidity caused bymore limited access to the private and public credit markets as a result of deteriorating global or national finan-cial and credit conditions could trigger a negative change in our ratings outlook or even a reduction in our creditratings by the three credit rating agencies. This would mean more limited access to the private and public creditmarkets and an increase in the costs of such borrowings.
A credit rating is not a recommendation to buy, sell or hold securities. The highest investment grade creditrating is AAA for S&P, Aaa for Moody’s and AAA for Fitch. The lowest investment grade credit rating is BBB-for S&P, Baa3 for Moody’s and BBB- for Fitch. Our credit ratings may be revised or withdrawn at any time bythe rating agencies, and each rating should be evaluated independently of any other rating. There can be noassurance that a rating will remain in effect for any given period of time or that a rating will not be lowered, orwithdrawn entirely, by a rating agency if, in its judgment, circumstances so warrant.
Debt Covenants
We were in compliance with all of our debt covenants as of September 30, 2015. Our debt covenants aredescribed in Note 5 to the consolidated financial statements.
43

Contractual Obligations and Commercial Commitments
The following table provides information about contractual obligations and commercial commitments atSeptember 30, 2015.
Payments Due by Period
TotalLess than
1 year 1-3 years 3-5 yearsMore than 5
years(In thousands)
Contractual ObligationsLong-term debt(1) . . . . . . . . . . . . . . . . . . . . . . $2,460,000 $ — $250,000 $450,000 $1,760,000Short-term debt(1) . . . . . . . . . . . . . . . . . . . . . . 457,927 457,927 — — —Interest charges(2) . . . . . . . . . . . . . . . . . . . . . . 2,252,802 140,192 259,835 189,559 1,663,216Operating leases(3) . . . . . . . . . . . . . . . . . . . . . 140,713 16,475 33,129 29,458 61,651Demand fees for contracted storage(4) . . . . . . 8,188 3,853 3,977 286 72Demand fees for contracted
transportation(5) . . . . . . . . . . . . . . . . . . . . . . 7,068 3,990 1,511 538 1,029Financial instrument obligations(6) . . . . . . . . . 120,107 9,568 110,539 — —Pension and postretirement benefit plan
contributions(7) . . . . . . . . . . . . . . . . . . . . . . 325,606 37,355 50,138 60,238 177,875Uncertain tax positions(8) . . . . . . . . . . . . . . . . 17,069 — 17,069 — —
Total contractual obligations . . . . . . . . . . . $5,789,480 $669,360 $726,198 $730,079 $3,663,843
(1) See Note 5 to the consolidated financial statements.(2) Interest charges were calculated using the stated rate for each debt issuance.(3) See Note 9 to the consolidated financial statements.(4) Represents third party contractual demand fees for contracted storage in our nonregulated segment. Con-
tractual demand fees for contracted storage for our regulated distribution segment are excluded as these costsare fully recoverable through our purchase gas adjustment mechanisms.
(5) Represents third party contractual demand fees for transportation in our nonregulated segment.(6) Represents liabilities for natural gas commodity and interest rate financial instruments that were valued as of
September 30, 2015. The ultimate settlement amounts of these remaining liabilities are unknown becausethey are subject to continuing market risk until the financial instruments are settled.
(7) Represents expected contributions to our pension and postretirement benefit plans, which are discussed inNote 6 to the consolidated financial statements.
(8) Represents liabilities associated with uncertain tax positions claimed or expected to be claimed on taxreturns.
Our regulated distribution segment maintains supply contracts with several vendors that generally cover aperiod of up to one year. Commitments for estimated base gas volumes are established under these contracts on amonthly basis at contractually negotiated prices. Commitments for incremental daily purchases are made asnecessary during the month in accordance with the terms of individual contracts. Our Mid-Tex Division alsomaintains a limited number of long-term supply contracts to ensure a reliable source of gas for our customers inits service area which obligate it to purchase specified volumes at market and fixed prices. At September 30,2015, we were committed to purchase 36.6 Bcf within one year and 26.8 Bcf within one to three years underindexed contracts.
AEH has commitments to purchase physical quantities of natural gas under contracts indexed to the forwardNYMEX strip or fixed price contracts. At September 30, 2015, AEH was committed to purchase 101.9 Bcfwithin one year, 16.0 Bcf within one to three years and 0.5 Bcf after three years under indexed contracts. AEH iscommitted to purchase 3.0 Bcf within one year under fixed price contracts with prices ranging from $2.32 to$3.23 per Mcf.
44

Risk Management Activities
As discussed above in our Critical Accounting Policies, we use financial instruments to mitigate commodityprice risk and, periodically, to manage interest rate risk. We conduct risk management activities through ourregulated distribution and nonregulated segments. In our regulated distribution segment, we use a combination ofphysical storage, fixed physical contracts and fixed financial contracts to reduce our exposure to unusually largewinter-period gas price increases. In our nonregulated segments, we manage our exposure to the risk of naturalgas price changes and lock in our gross profit margin through a combination of storage and financial instruments,including futures, over-the-counter and exchange-traded options and swap contracts with counterparties. To theextent our inventory cost and actual sales and actual purchases do not correlate with the changes in the marketindices we use in our hedges, we could experience ineffectiveness or the hedges may no longer meet the account-ing requirements for hedge accounting, resulting in the financial instruments being treated as mark to marketinstruments through earnings.
We record our financial instruments as a component of risk management assets and liabilities, which areclassified as current or noncurrent based upon the anticipated settlement date of the underlying financial instru-ment. Substantially all of our financial instruments are valued using external market quotes and indices.
The following table shows the components of the change in fair value of our regulated distribution seg-ment’s financial instruments for the fiscal year ended September 30, 2015 (in thousands):
Fair value of contracts at September 30, 2014 . . . . . . . . . . . . . . . . . . . . . . . . . . . . . . . . . . . . $ 14,284Contracts realized/settled . . . . . . . . . . . . . . . . . . . . . . . . . . . . . . . . . . . . . . . . . . . . . . . . . . (33,892)Fair value of new contracts . . . . . . . . . . . . . . . . . . . . . . . . . . . . . . . . . . . . . . . . . . . . . . . . . 607Other changes in value . . . . . . . . . . . . . . . . . . . . . . . . . . . . . . . . . . . . . . . . . . . . . . . . . . . . (100,360)
Fair value of contracts at September 30, 2015 . . . . . . . . . . . . . . . . . . . . . . . . . . . . . . . . . . . . $(119,361)
The fair value of our regulated distribution segment’s financial instruments at September 30, 2015, is pre-sented below by time period and fair value source:
Fair Value of Contracts at September 30, 2015Maturity in years
Source of Fair ValueLess
than 1 1-3 4-5Greaterthan 5
TotalFair
Value(In thousands)
Prices actively quoted . . . . . . . . . . . . . . . . . . . . . . . . . . . . $(9,190) $(110,171) $— $— $(119,361)Prices based on models and other valuation methods . . . . — — — — —
Total Fair Value . . . . . . . . . . . . . . . . . . . . . . . . . . . . . . . . . $(9,190) $(110,171) $— $— $(119,361)
The following table shows the components of the change in fair value of our nonregulated segment’s finan-cial instruments for the fiscal year ended September 30, 2015 (in thousands):
Fair value of contracts at September 30, 2014 . . . . . . . . . . . . . . . . . . . . . . . . . . . . . . . . . . . . . $ (3,033)Contracts realized/settled . . . . . . . . . . . . . . . . . . . . . . . . . . . . . . . . . . . . . . . . . . . . . . . . . . . 21,401Fair value of new contracts . . . . . . . . . . . . . . . . . . . . . . . . . . . . . . . . . . . . . . . . . . . . . . . . . . —Other changes in value . . . . . . . . . . . . . . . . . . . . . . . . . . . . . . . . . . . . . . . . . . . . . . . . . . . . . (52,988)
Fair value of contracts at September 30, 2015 . . . . . . . . . . . . . . . . . . . . . . . . . . . . . . . . . . . . . (34,620)Netting of cash collateral . . . . . . . . . . . . . . . . . . . . . . . . . . . . . . . . . . . . . . . . . . . . . . . . . . . . . 43,474
Cash collateral and fair value of contracts at September 30, 2015 . . . . . . . . . . . . . . . . . . . . . . $ 8,854
45

The fair value of our nonregulated segment’s financial instruments at September 30, 2015, is presentedbelow by time period and fair value source.
Fair Value of Contracts at September 30, 2015Maturity in years
Source of Fair ValueLess
than 1 1-3 4-5Greaterthan 5
Total FairValue
(In thousands)
Prices actively quoted . . . . . . . . . . . . . . . . . . . . . . . . . . . . $(24,928) $(8,925) $(767) $— $(34,620)Prices based on models and other valuation methods . . . . — — — — —
Total Fair Value . . . . . . . . . . . . . . . . . . . . . . . . . . . . . . . . . $(24,928) $(8,925) $(767) $— $(34,620)
Employee Benefits Programs
An important element of our total compensation program, and a significant component of our operation andmaintenance expense, is the offering of various benefits programs to our employees. These programs includemedical and dental insurance coverage and pension and postretirement programs.
Medical and Dental Insurance
We offer medical and dental insurance programs to substantially all of our employees.We believe theseprograms are compliant with all current and future provisions that will be going into effect under The PatientProtection and Affordable Care Act and consistent with other programs in our industry. In recent years, we havestrived to actively manage our health care costs through the introduction of a wellness strategy that is focused onhelping employees to identify health risks and to manage these risks through improved lifestyle choices.
Over the last five fiscal years, we have experienced annual medical and prescription inflation of approx-imately five percent. For fiscal 2016, we anticipate the medical and prescription drug inflation rate will continueat approximately five percent, primarily due to the inflation of health care costs.
Net Periodic Pension and Postretirement Benefit Costs
For the fiscal year ended September 30, 2015, our total net periodic pension and other benefits costs was$58.9 million, compared with $69.8 million and $78.5 million for the fiscal years ended September 30, 2014 and2013. These costs relating to our regulated distribution operations are recoverable through our distribution rates.A portion of these costs is capitalized into our distribution rate base, and the remaining costs are recorded as acomponent of operation and maintenance expense.
Our fiscal 2015 costs were determined using a September 30, 2014 measurement date. At that date, interestand corporate bond rates utilized to determine our discount rates were lower than the interest and corporate bondrates as of September 30, 2013, the measurement date for our fiscal 2014 net periodic cost. Therefore, wedecreased the discount rate used to measure our fiscal 2015 net periodic cost from 4.95 percent to 4.43 percent.We maintained our expected return on plan assets at 7.25 percent in the determination of our fiscal 2015 netperiodic pension cost based upon expected market returns for our targeted asset allocation. As a result of the netimpact of these and other assumptions, our fiscal 2015 pension and postretirement medical costs were lower thanin the prior year.
Our fiscal 2014 costs were determined using a September 30, 2013 measurement date. At that date, interestand corporate bond rates utilized to determine our discount rates were higher than the interest and corporate bondrates as of September 30, 2012, the measurement date for our fiscal 2013 net periodic cost. Therefore, weincreased the discount rate used to measure our fiscal 2014 net periodic cost from 4.04 percent to 4.95 percent.However, we decreased the expected return on plan assets from 7.75 percent to 7.25 percent in the determinationof our fiscal 2014 net periodic pension cost based upon expected market returns for our targeted asset allocation.As a result of the net impact of these and other assumptions, our fiscal 2014 pension and postretirement medicalcosts were lower than in the prior year.
46
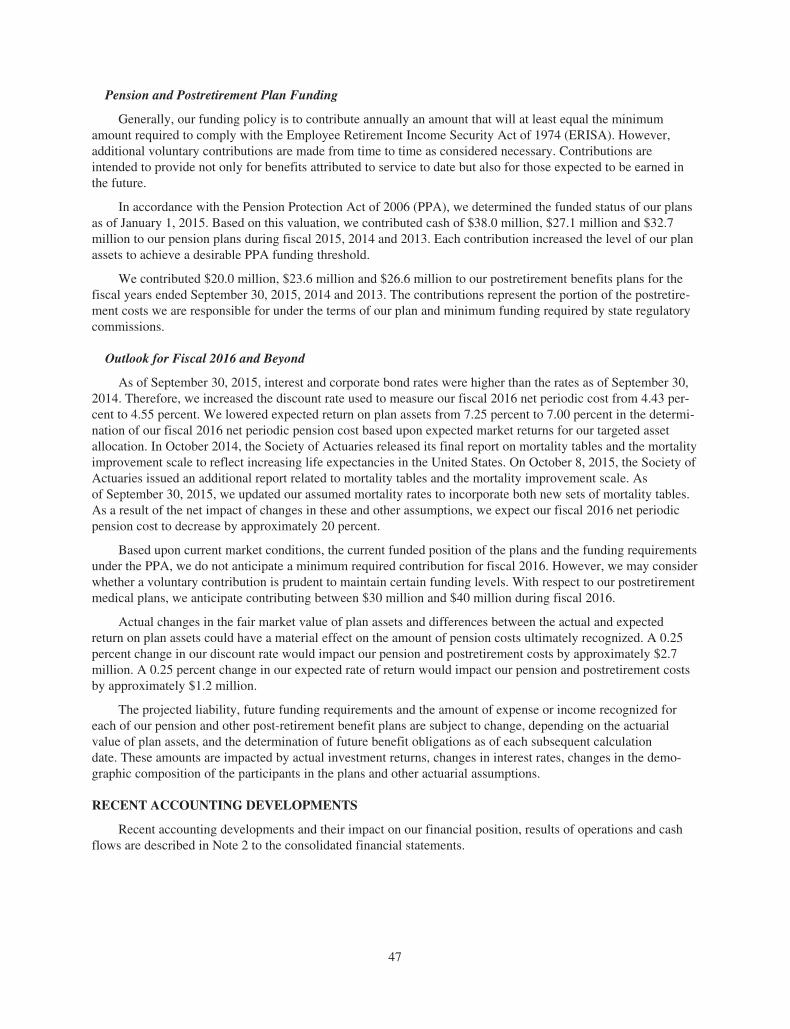
Pension and Postretirement Plan Funding
Generally, our funding policy is to contribute annually an amount that will at least equal the minimumamount required to comply with the Employee Retirement Income Security Act of 1974 (ERISA). However,additional voluntary contributions are made from time to time as considered necessary. Contributions areintended to provide not only for benefits attributed to service to date but also for those expected to be earned inthe future.
In accordance with the Pension Protection Act of 2006 (PPA), we determined the funded status of our plansas of January 1, 2015. Based on this valuation, we contributed cash of $38.0 million, $27.1 million and $32.7million to our pension plans during fiscal 2015, 2014 and 2013. Each contribution increased the level of our planassets to achieve a desirable PPA funding threshold.
We contributed $20.0 million, $23.6 million and $26.6 million to our postretirement benefits plans for thefiscal years ended September 30, 2015, 2014 and 2013. The contributions represent the portion of the postretire-ment costs we are responsible for under the terms of our plan and minimum funding required by state regulatorycommissions.
Outlook for Fiscal 2016 and Beyond
As of September 30, 2015, interest and corporate bond rates were higher than the rates as of September 30,2014. Therefore, we increased the discount rate used to measure our fiscal 2016 net periodic cost from 4.43 per-cent to 4.55 percent. We lowered expected return on plan assets from 7.25 percent to 7.00 percent in the determi-nation of our fiscal 2016 net periodic pension cost based upon expected market returns for our targeted assetallocation. In October 2014, the Society of Actuaries released its final report on mortality tables and the mortalityimprovement scale to reflect increasing life expectancies in the United States. On October 8, 2015, the Society ofActuaries issued an additional report related to mortality tables and the mortality improvement scale. Asof September 30, 2015, we updated our assumed mortality rates to incorporate both new sets of mortality tables.As a result of the net impact of changes in these and other assumptions, we expect our fiscal 2016 net periodicpension cost to decrease by approximately 20 percent.
Based upon current market conditions, the current funded position of the plans and the funding requirementsunder the PPA, we do not anticipate a minimum required contribution for fiscal 2016. However, we may considerwhether a voluntary contribution is prudent to maintain certain funding levels. With respect to our postretirementmedical plans, we anticipate contributing between $30 million and $40 million during fiscal 2016.
Actual changes in the fair market value of plan assets and differences between the actual and expectedreturn on plan assets could have a material effect on the amount of pension costs ultimately recognized. A 0.25percent change in our discount rate would impact our pension and postretirement costs by approximately $2.7million. A 0.25 percent change in our expected rate of return would impact our pension and postretirement costsby approximately $1.2 million.
The projected liability, future funding requirements and the amount of expense or income recognized foreach of our pension and other post-retirement benefit plans are subject to change, depending on the actuarialvalue of plan assets, and the determination of future benefit obligations as of each subsequent calculationdate. These amounts are impacted by actual investment returns, changes in interest rates, changes in the demo-graphic composition of the participants in the plans and other actuarial assumptions.
RECENT ACCOUNTING DEVELOPMENTS
Recent accounting developments and their impact on our financial position, results of operations and cashflows are described in Note 2 to the consolidated financial statements.
47
ITEM 7A. Quantitative and Qualitative Disclosures About Market Risk.
We are exposed to risks associated with commodity prices and interest rates. Commodity price risk is thepotential loss that we may incur as a result of changes in the fair value of a particular instrument or commodity.Interest-rate risk results from our portfolio of debt and equity instruments that we issue to provide financing andliquidity for our business activities.
We conduct risk management activities through both our regulated distribution and nonregulated segments.In our regulated distribution segment, we use a combination of physical storage, fixed physical contracts andfixed financial contracts to protect us and our customers against unusually large winter period gas priceincreases. In our nonregulated segment, we manage our exposure to the risk of natural gas price changes and lockin our gross profit margin through a combination of storage and financial instruments including futures, over-the-counter and exchange-traded options and swap contracts with counterparties. Our risk management activities andrelated accounting treatment are described in further detail in Note 12 to the consolidated financial statements.Additionally, our earnings are affected by changes in short-term interest rates as a result of our issuance of short-term commercial paper and our other short-term borrowings.
Commodity Price Risk
Regulated distribution segment
We purchase natural gas for our regulated distribution operations. Substantially all of the costs of gas pur-chased for regulated distribution operations are recovered from our customers through purchased gas costadjustment mechanisms. Therefore, our regulated distribution operations have limited commodity price riskexposure.
Nonregulated segment
Our nonregulated segment is also exposed to risks associated with changes in the market price of naturalgas. For our nonregulated segment, we use a sensitivity analysis to estimate commodity price risk. For purposesof this analysis, we estimate commodity price risk by applying a $0.50 change in the forward NYMEX price toour net open position (including existing storage and related financial contracts) at the end of each period. Basedon AEH’s net open position (including existing storage and related financial contracts) at September 30, 2015 of1.0 Bcf, a $0.50 change in the forward NYMEX price would have had a $0.3 million impact on our consolidatednet income.
Changes in the difference between the indices used to mark to market our physical inventory (Gas Daily)and the related fair-value hedge (NYMEX) can result in volatility in our reported net income; but, over time,gains and losses on the sale of storage gas inventory will be offset by gains and losses on the fair-value hedges.Based upon our net physical position at September 30, 2015 and assuming our hedges would still qualify ashighly effective, a $0.50 change in the difference between the Gas Daily and NYMEX indices would impact ourreported net income by approximately $4.4 million.
Additionally, these changes could cause us to recognize a risk management liability, which would require usto place cash into an escrow account to collateralize this liability position. This, in turn, would reduce the amountof cash we would have on hand to fund our working capital needs.
Interest Rate Risk
Our earnings are exposed to changes in short-term interest rates associated with our short-term commercialpaper program and other short-term borrowings. We use a sensitivity analysis to estimate our short-term interestrate risk. For purposes of this analysis, we estimate our short-term interest rate risk as the difference between ouractual interest expense for the period and estimated interest expense for the period assuming a hypothetical aver-age one percent increase in the interest rates associated with our short-term borrowings. Had interest rates asso-ciated with our short-term borrowings increased by an average of one percent, our interest expense would haveincreased by approximately $2.7 million during 2015.
48
ITEM 8. Financial Statements and Supplementary Data.
Index to financial statements and financial statement schedule:
Page
Report of independent registered public accounting firm . . . . . . . . . . . . . . . . . . . . . . . . . . . . . . . . . . . . . . . 50Financial statements and supplementary data:
Consolidated balance sheets at September 30, 2015 and 2014 . . . . . . . . . . . . . . . . . . . . . . . . . . . . . . . . . 51Consolidated statements of income for the years ended September 30, 2015, 2014 and 2013 . . . . . . . . . 52Consolidated statements of comprehensive income for the years ended September 30, 2015, 2014 and
2013 . . . . . . . . . . . . . . . . . . . . . . . . . . . . . . . . . . . . . . . . . . . . . . . . . . . . . . . . . . . . . . . . . . . . . . . . . . . . 53Consolidated statements of shareholders’ equity for the years ended September 30, 2015, 2014 and
2013 . . . . . . . . . . . . . . . . . . . . . . . . . . . . . . . . . . . . . . . . . . . . . . . . . . . . . . . . . . . . . . . . . . . . . . . . . . . . 54Consolidated statements of cash flow for the years ended September 30, 2015, 2014 and 2013 . . . . . . . 55Notes to consolidated financial statements . . . . . . . . . . . . . . . . . . . . . . . . . . . . . . . . . . . . . . . . . . . . . . . . . 56Selected Quarterly Financial Data (Unaudited) . . . . . . . . . . . . . . . . . . . . . . . . . . . . . . . . . . . . . . . . . . . . . 108
Financial statement schedule for the years ended September 30, 2015, 2014 and 2013Schedule II. Valuation and Qualifying Accounts . . . . . . . . . . . . . . . . . . . . . . . . . . . . . . . . . . . . . . . . . 115
All other financial statement schedules are omitted because the required information is not present, or notpresent in amounts sufficient to require submission of the schedule or because the information required isincluded in the financial statements and accompanying notes thereto.
49
REPORT OF INDEPENDENT REGISTERED PUBLIC ACCOUNTING FIRM
The Board of Directors and Shareholders ofAtmos Energy Corporation
We have audited the accompanying consolidated balance sheets of Atmos Energy Corporation as of Sep-tember 30, 2015 and 2014, and the related consolidated statements of income, comprehensive income, share-holders’ equity, and cash flows for each of the three years in the period ended September 30, 2015. Our auditsalso included the financial statement schedule listed in the Index at Item 8. These financial statements andschedule are the responsibility of the Company’s management. Our responsibility is to express an opinion onthese financial statements and schedule based on our audits.
We conducted our audits in accordance with the standards of the Public Company Accounting OversightBoard (United States). Those standards require that we plan and perform the audit to obtain reasonable assuranceabout whether the financial statements are free of material misstatement. An audit includes examining, on a testbasis, evidence supporting the amounts and disclosures in the financial statements. An audit also includes assess-ing the accounting principles used and significant estimates made by management, as well as evaluating theoverall financial statement presentation. We believe that our audits provide a reasonable basis for our opinion.
In our opinion, the financial statements referred to above present fairly, in all material respects, the con-solidated financial position of Atmos Energy Corporation at September 30, 2015 and 2014, and the consolidatedresults of its operations and its cash flows for each of the three years in the period ended September 30, 2015, inconformity with U.S. generally accepted accounting principles. Also, in our opinion, the related financial state-ment schedule, when considered in relation to the financial statements taken as a whole, presents fairly, in allmaterial respects the financial information set forth therein.
We also have audited, in accordance with the standards of the Public Company Accounting Oversight Board(United States), Atmos Energy Corporation’s internal control over financial reporting as of September 30, 2015,based on criteria established in Internal Control — Integrated Framework issued by the Committee of SponsoringOrganizations of the Treadway Commission (2013 framework) and our report dated November 6, 2015 expressedan unqualified opinion thereon.
/s/ ERNST & YOUNG LLP
Dallas, TexasNovember 6, 2015
50
ATMOS ENERGY CORPORATION
CONSOLIDATED BALANCE SHEETS
September 302015 2014
(In thousands,except share data)
ASSETSProperty, plant and equipment . . . . . . . . . . . . . . . . . . . . . . . . . . . . . . . . . . . . . . . . . . . $8,959,702 $8,200,121Construction in progress . . . . . . . . . . . . . . . . . . . . . . . . . . . . . . . . . . . . . . . . . . . . . . . . 280,398 247,579
9,240,100 8,447,700Less accumulated depreciation and amortization . . . . . . . . . . . . . . . . . . . . . . . . . . . . . 1,809,520 1,721,794
Net property, plant and equipment . . . . . . . . . . . . . . . . . . . . . . . . . . . . . . . . . . . . . . 7,430,580 6,725,906Current assets
Cash and cash equivalents . . . . . . . . . . . . . . . . . . . . . . . . . . . . . . . . . . . . . . . . . . . . . 28,653 42,258Accounts receivable, less allowance for doubtful accounts of $15,283 in 2015 and
$23,992 in 2014 . . . . . . . . . . . . . . . . . . . . . . . . . . . . . . . . . . . . . . . . . . . . . . . . . . . 295,160 343,400Gas stored underground . . . . . . . . . . . . . . . . . . . . . . . . . . . . . . . . . . . . . . . . . . . . . . 236,603 278,917Other current assets . . . . . . . . . . . . . . . . . . . . . . . . . . . . . . . . . . . . . . . . . . . . . . . . . . 70,569 111,265
Total current assets . . . . . . . . . . . . . . . . . . . . . . . . . . . . . . . . . . . . . . . . . . . . . . . . 630,985 775,840Goodwill . . . . . . . . . . . . . . . . . . . . . . . . . . . . . . . . . . . . . . . . . . . . . . . . . . . . . . . . . . . . 742,702 742,029Deferred charges and other assets . . . . . . . . . . . . . . . . . . . . . . . . . . . . . . . . . . . . . . . . . 288,678 350,929
$9,092,945 $8,594,704
CAPITALIZATION AND LIABILITIESShareholders’ equity
Common stock, no par value (stated at $.005 per share);200,000,000 shares authorized; issued and outstanding:2015 — 101,478,818 shares, 2014 — 100,388,092 shares . . . . . . . . . . . . . . . . . . $ 507 $ 502
Additional paid-in capital . . . . . . . . . . . . . . . . . . . . . . . . . . . . . . . . . . . . . . . . . . . . . 2,230,591 2,180,151Accumulated other comprehensive loss . . . . . . . . . . . . . . . . . . . . . . . . . . . . . . . . . . (109,330) (12,393)Retained earnings . . . . . . . . . . . . . . . . . . . . . . . . . . . . . . . . . . . . . . . . . . . . . . . . . . . 1,073,029 917,972
Shareholders’ equity . . . . . . . . . . . . . . . . . . . . . . . . . . . . . . . . . . . . . . . . . . . . . . . 3,194,797 3,086,232Long-term debt . . . . . . . . . . . . . . . . . . . . . . . . . . . . . . . . . . . . . . . . . . . . . . . . . . . . . . . 2,455,388 2,455,986
Total capitalization . . . . . . . . . . . . . . . . . . . . . . . . . . . . . . . . . . . . . . . . . . . . . . . . 5,650,185 5,542,218Commitments and contingenciesCurrent liabilities
Accounts payable and accrued liabilities . . . . . . . . . . . . . . . . . . . . . . . . . . . . . . . . . 238,942 308,086Other current liabilities . . . . . . . . . . . . . . . . . . . . . . . . . . . . . . . . . . . . . . . . . . . . . . . 457,954 405,869Short-term debt . . . . . . . . . . . . . . . . . . . . . . . . . . . . . . . . . . . . . . . . . . . . . . . . . . . . . 457,927 196,695
Total current liabilities . . . . . . . . . . . . . . . . . . . . . . . . . . . . . . . . . . . . . . . . . . . . . 1,154,823 910,650Deferred income taxes . . . . . . . . . . . . . . . . . . . . . . . . . . . . . . . . . . . . . . . . . . . . . . . . . . 1,411,315 1,286,616Regulatory cost of removal obligation . . . . . . . . . . . . . . . . . . . . . . . . . . . . . . . . . . . . . 427,553 445,387Pension and postretirement liabilities . . . . . . . . . . . . . . . . . . . . . . . . . . . . . . . . . . . . . . 287,373 340,963Deferred credits and other liabilities . . . . . . . . . . . . . . . . . . . . . . . . . . . . . . . . . . . . . . . 161,696 68,870
$9,092,945 $8,594,704
See accompanying notes to consolidated financial statements.
51

ATMOS ENERGY CORPORATION
CONSOLIDATED STATEMENTS OF INCOME
Year Ended September 302015 2014 2013
(In thousands, except per share data)
Operating revenuesRegulated distribution segment . . . . . . . . . . . . . . . . . . . . . . . . . . . . . . . . . . $2,763,835 $3,061,546 $2,399,493Regulated pipeline segment . . . . . . . . . . . . . . . . . . . . . . . . . . . . . . . . . . . . 370,112 318,459 268,900Nonregulated segment . . . . . . . . . . . . . . . . . . . . . . . . . . . . . . . . . . . . . . . . . 1,472,209 2,067,292 1,587,914Intersegment eliminations . . . . . . . . . . . . . . . . . . . . . . . . . . . . . . . . . . . . . . (464,020) (506,381) (380,847)
4,142,136 4,940,916 3,875,460Purchased gas cost
Regulated distribution segment . . . . . . . . . . . . . . . . . . . . . . . . . . . . . . . . . . 1,526,258 1,885,031 1,318,257Regulated pipeline segment . . . . . . . . . . . . . . . . . . . . . . . . . . . . . . . . . . . . — — —Nonregulated segment . . . . . . . . . . . . . . . . . . . . . . . . . . . . . . . . . . . . . . . . . 1,399,349 1,979,337 1,524,583Intersegment eliminations . . . . . . . . . . . . . . . . . . . . . . . . . . . . . . . . . . . . . . (463,488) (505,878) (379,430)
2,462,119 3,358,490 2,463,410
Gross profit . . . . . . . . . . . . . . . . . . . . . . . . . . . . . . . . . . . . . . . . . . . . . . . . . . . 1,680,017 1,582,426 1,412,050Operating expenses
Operation and maintenance . . . . . . . . . . . . . . . . . . . . . . . . . . . . . . . . . . . . . 541,868 505,154 488,020Depreciation and amortization . . . . . . . . . . . . . . . . . . . . . . . . . . . . . . . . . . 274,796 253,987 235,079Taxes, other than income . . . . . . . . . . . . . . . . . . . . . . . . . . . . . . . . . . . . . . 231,958 211,936 187,072
Total operating expenses . . . . . . . . . . . . . . . . . . . . . . . . . . . . . . . . . . . . . 1,048,622 971,077 910,171
Operating income . . . . . . . . . . . . . . . . . . . . . . . . . . . . . . . . . . . . . . . . . . . . . . 631,395 611,349 501,879Miscellaneous expense, net . . . . . . . . . . . . . . . . . . . . . . . . . . . . . . . . . . . . . . . (4,389) (5,235) (197)Interest charges . . . . . . . . . . . . . . . . . . . . . . . . . . . . . . . . . . . . . . . . . . . . . . . . 116,241 129,295 128,385
Income from continuing operations before income taxes . . . . . . . . . . . . . . . . 510,765 476,819 373,297Income tax expense . . . . . . . . . . . . . . . . . . . . . . . . . . . . . . . . . . . . . . . . . . . . . 195,690 187,002 142,599
Income from continuing operations . . . . . . . . . . . . . . . . . . . . . . . . . . . . . . . . 315,075 289,817 230,698Income from discontinued operations, net of tax ($0, $0 and $3,986) . . . . . . — — 7,202Gain on sale of discontinued operations, net of tax ($0, $0 and $2,909) . . . . — — 5,294
Net income . . . . . . . . . . . . . . . . . . . . . . . . . . . . . . . . . . . . . . . . . . . . . . . . . $ 315,075 $ 289,817 $ 243,194
Basic earnings per shareIncome per share from continuing operations . . . . . . . . . . . . . . . . . . . . . . . $ 3.09 $ 2.96 $ 2.54Income per share from discontinued operations . . . . . . . . . . . . . . . . . . . . . — — 0.14
Net income per share — basic . . . . . . . . . . . . . . . . . . . . . . . . . . . . . . . . . . . $ 3.09 $ 2.96 $ 2.68
Diluted earnings per shareIncome per share from continuing operations . . . . . . . . . . . . . . . . . . . . . . . $ 3.09 $ 2.96 $ 2.50Income per share from discontinued operations . . . . . . . . . . . . . . . . . . . . . — — 0.14
Net income per share — diluted . . . . . . . . . . . . . . . . . . . . . . . . . . . . . . . . . $ 3.09 $ 2.96 $ 2.64
Weighted average shares outstanding:Basic . . . . . . . . . . . . . . . . . . . . . . . . . . . . . . . . . . . . . . . . . . . . . . . . . . . . . . 101,892 97,606 90,533Diluted . . . . . . . . . . . . . . . . . . . . . . . . . . . . . . . . . . . . . . . . . . . . . . . . . . . . . 101,892 97,608 91,711
See accompanying notes to consolidated financial statements.
52

ATMOS ENERGY CORPORATION
CONSOLIDATED STATEMENTS OF COMPREHENSIVE INCOME
Year Ended September 302015 2014 2013
(In thousands)
Net income . . . . . . . . . . . . . . . . . . . . . . . . . . . . . . . . . . . . . . . . . . . . . . . . . . . $315,075 $289,817 $243,194Other comprehensive income (loss), net of tax
Net unrealized holding gains (losses) on available-for-sale securities, netof tax of $(1,559), $1,199 and $(186) . . . . . . . . . . . . . . . . . . . . . . . . . . (2,713) 2,214 (213)
Cash flow hedges:Amortization and unrealized gain (loss) on interest rate agreements,
net of tax of $(40,501), $(32,353) and $47,236 . . . . . . . . . . . . . . . . . (70,461) (56,287) 82,179Net unrealized gains (losses) on commodity cash flow hedges, net of
tax of $(15,193), $1,791 and $2,889 . . . . . . . . . . . . . . . . . . . . . . . . . (23,763) 2,802 4,519
Total other comprehensive income (loss) . . . . . . . . . . . . . . . . . . . . . . . . . . . (96,937) (51,271) 86,485
Total comprehensive income . . . . . . . . . . . . . . . . . . . . . . . . . . . . . . . . . . . . . $218,138 $238,546 $329,679
See accompanying notes to consolidated financial statements.
53

ATMOS ENERGY CORPORATION
CONSOLIDATED STATEMENTS OF SHAREHOLDERS’ EQUITY
Common stock AdditionalPaid-inCapital
AccumulatedOther
ComprehensiveIncome(Loss)
RetainedEarnings Total
Number ofShares
StatedValue
(In thousands, except share and per share data)
Balance, September 30, 2012 . . . . . . . 90,239,900 $451 $1,745,467 $ (47,607) $ 660,932 $2,359,243Net income . . . . . . . . . . . . . . . . . . . . . . — — — — 243,194 243,194Other comprehensive income . . . . . . — — — 86,485 — 86,485Repurchase of equity awards . . . . . . . (133,449) — (5,150) — — (5,150)Cash dividends ($1.40 per share) . . . . — — — — (128,115) (128,115)Common stock issued:
Direct stock purchase plan . . . . . . . . — — (50) — — (50)1998 Long-term incentive plan . . . . . 531,672 2 9,530 — (744) 8,788Employee stock-based
compensation . . . . . . . . . . . . . . . . — — 15,934 — — 15,934Outside directors stock-for-fee
plan . . . . . . . . . . . . . . . . . . . . . . . . 2,088 — 80 — — 80
Balance, September 30, 2013 . . . . . . . 90,640,211 453 1,765,811 38,878 775,267 2,580,409Net income . . . . . . . . . . . . . . . . . . . . . . — — — — 289,817 289,817Other comprehensive loss . . . . . . . . . — — — (51,271) — (51,271)Repurchase of equity awards . . . . . . . (190,134) (1) (8,716) — — (8,717)Cash dividends ($1.48 per share) . . . . — — — — (146,248) (146,248)Common stock issued:
Public offering . . . . . . . . . . . . . . . . . 9,200,000 46 390,159 — — 390,205Direct stock purchase plan . . . . . . . . 83,150 1 4,066 — — 4,0671998 Long-term incentive plan . . . . . 653,130 3 5,214 — (864) 4,353Employee stock-based
compensation . . . . . . . . . . . . . . . . — — 23,536 — — 23,536Outside directors stock-for-fee
plan . . . . . . . . . . . . . . . . . . . . . . . . 1,735 — 81 — — 81
Balance, September 30, 2014 . . . . . . . 100,388,092 502 2,180,151 (12,393) 917,972 3,086,232Net income . . . . . . . . . . . . . . . . . . . . . . — — — — 315,075 315,075Other comprehensive loss . . . . . . . . . — — — (96,937) — (96,937)Repurchase of equity awards . . . . . . . (148,464) (1) (7,984) — — (7,985)Cash dividends ($1.56 per share) . . . . — — — — (160,018) (160,018)Common stock issued:
Direct stock purchase plan . . . . . . . . 176,391 1 10,625 — — 10,626Retirement savings plan . . . . . . . . . . 398,047 2 20,324 — — 20,3261998 Long-term incentive plan . . . . . 664,752 3 2,263 — — 2,266Employee stock-based
compensation . . . . . . . . . . . . . . . . — — 25,212 — — 25,212
Balance, September 30, 2015 . . . . . . . 101,478,818 $507 $2,230,591 $(109,330) $1,073,029 $3,194,797
See accompanying notes to consolidated financial statements.
54

ATMOS ENERGY CORPORATION
CONSOLIDATED STATEMENTS OF CASH FLOWSYear Ended September 30
2015 2014 2013(In thousands)
CASH FLOWS FROM OPERATING ACTIVITIESNet income . . . . . . . . . . . . . . . . . . . . . . . . . . . . . . . . . . . . . . . . . . . . . . . $ 315,075 $ 289,817 $ 243,194Adjustments to reconcile net income to net cash provided by operating
activities:Gain on sale of discontinued operations . . . . . . . . . . . . . . . . . . . . . . — — (8,203)Depreciation and amortization: . . . . . . . . . . . . . . . . . . . . . . . . . . . . .
Charged to depreciation and amortization . . . . . . . . . . . . . . . . . . . 274,796 253,987 236,928Charged to other accounts . . . . . . . . . . . . . . . . . . . . . . . . . . . . . . . 1,209 969 679
Deferred income taxes . . . . . . . . . . . . . . . . . . . . . . . . . . . . . . . . . . . . 192,886 189,952 141,336Stock-based compensation . . . . . . . . . . . . . . . . . . . . . . . . . . . . . . . . . 27,491 25,531 17,814Debt financing costs . . . . . . . . . . . . . . . . . . . . . . . . . . . . . . . . . . . . . . 5,922 9,409 8,480Other . . . . . . . . . . . . . . . . . . . . . . . . . . . . . . . . . . . . . . . . . . . . . . . . . . (850) (428) (2,887)
Changes in assets and liabilities: . . . . . . . . . . . . . . . . . . . . . . . . . . . . . .(Increase) decrease in accounts receivable . . . . . . . . . . . . . . . . . . . . 48,240 (41,408) (73,669)(Increase) decrease in gas stored underground . . . . . . . . . . . . . . . . . 33,234 (31,996) 31,979(Increase) decrease in other current assets . . . . . . . . . . . . . . . . . . . . . (11,951) (24,411) 15,644Decrease in deferred charges and other assets . . . . . . . . . . . . . . . . . . 58,256 30,662 111,069Increase (decrease) in accounts payable and accrued liabilities . . . . (52,660) 55,041 31,912Increase (decrease) in other current liabilities . . . . . . . . . . . . . . . . . . 896 2,413 (44,491)Decrease in deferred credits and other liabilities . . . . . . . . . . . . . . . . (56,025) (19,552) (96,658)
Net cash provided by operating activities . . . . . . . . . . . . . . . . . 836,519 739,986 613,127CASH FLOWS USED IN INVESTING ACTIVITIES
Capital expenditures . . . . . . . . . . . . . . . . . . . . . . . . . . . . . . . . . . . . . . . . (975,132) (835,251) (845,033)Proceeds from the sale of discontinued operations . . . . . . . . . . . . . . . . — — 153,023Other, net . . . . . . . . . . . . . . . . . . . . . . . . . . . . . . . . . . . . . . . . . . . . . . . . 377 (2,325) (4,904)
Net cash used in investing activities . . . . . . . . . . . . . . . . . . . . . (974,755) (837,576) (696,914)CASH FLOWS FROM FINANCING ACTIVITIES
Net increase (decrease) in short-term debt . . . . . . . . . . . . . . . . . . . . . . . 254,780 (165,865) (208,070)Net proceeds from issuance of long-term debt . . . . . . . . . . . . . . . . . . . 493,538 — 493,793Net proceeds from equity offering . . . . . . . . . . . . . . . . . . . . . . . . . . . . . — 390,205 —Settlement of Treasury lock agreements . . . . . . . . . . . . . . . . . . . . . . . . 13,364 — (66,626)Repayment of long-term debt . . . . . . . . . . . . . . . . . . . . . . . . . . . . . . . . . (500,000) — (131)Cash dividends paid . . . . . . . . . . . . . . . . . . . . . . . . . . . . . . . . . . . . . . . . (160,018) (146,248) (128,115)Repurchase of equity awards . . . . . . . . . . . . . . . . . . . . . . . . . . . . . . . . . (7,985) (8,717) (5,150)Issuance of common stock . . . . . . . . . . . . . . . . . . . . . . . . . . . . . . . . . . . 30,952 4,274 46
Net cash provided by financing activities . . . . . . . . . . . . . . . . . 124,631 73,649 85,747
Net increase (decrease) in cash and cash equivalents . . . . . . . . . . . . . . (13,605) (23,941) 1,960Cash and cash equivalents at beginning of year . . . . . . . . . . . . . . . . . . . 42,258 66,199 64,239
Cash and cash equivalents at end of year . . . . . . . . . . . . . . . . . . . . . . . . $ 28,653 $ 42,258 $ 66,199
CASH PAID (RECEIVED) DURING THE PERIOD FOR:Interest . . . . . . . . . . . . . . . . . . . . . . . . . . . . . . . . . . . . . . . . . . . . . . . . . . $ 151,334 $ 156,606 $ 148,461Income taxes . . . . . . . . . . . . . . . . . . . . . . . . . . . . . . . . . . . . . . . . . . . . . . $ 1,802 $ (610) $ 10,008
See accompanying notes to consolidated financial statements.
55

ATMOS ENERGY CORPORATION
NOTES TO CONSOLIDATED FINANCIAL STATEMENTS
1. Nature of Business
Atmos Energy Corporation (“Atmos Energy” or the “Company”) and our subsidiaries are engaged primarilyin the regulated natural gas distribution and pipeline businesses as well as certain other nonregulated businesses.Through our regulated distribution business, we deliver natural gas through sales and transportation arrangementsto over three million residential, commercial, public-authority and industrial customers through our six regulateddistribution divisions in the service areas described below:
Division Service Area
Atmos Energy Colorado-Kansas Division . . . . . . . . Colorado, KansasAtmos Energy Kentucky/Mid-States Division . . . . Kentucky, Tennessee, Virginia(1)
Atmos Energy Louisiana Division . . . . . . . . . . . . . . LouisianaAtmos Energy Mid-Tex Division . . . . . . . . . . . . . . Texas, including the Dallas/Fort Worth
metropolitan areaAtmos Energy Mississippi Division . . . . . . . . . . . . MississippiAtmos Energy West Texas Division . . . . . . . . . . . . West Texas
(1) Denotes location where we have more limited service areas.
In addition, we transport natural gas for others through our distribution system. Our distribution business issubject to federal and state regulation and/or regulation by local authorities in each of the states in which ourregulated distribution divisions operate. Our corporate headquarters and shared-services function are located inDallas, Texas, and our customer support centers are located in Amarillo and Waco, Texas.
During fiscal 2013 and fiscal 2012, we sold our regulated distribution operations serving approximately148,000 customers in Georgia, Illinois, Iowa and Missouri.
Our regulated pipeline business, which is also subject to federal and state regulation, consists of the regu-lated operations of our Atmos Pipeline–Texas Division, a division of the Company. This division transports natu-ral gas to our Mid-Tex Division, transports natural gas for third parties and manages five underground storagereservoirs in Texas. We also provide ancillary services customary to the pipeline industry including parkingarrangements, lending and sales of inventory on hand.
Our nonregulated businesses operate primarily in the Midwest and Southeast through various wholly-ownedsubsidiaries of Atmos Energy Holdings, Inc., (AEH). AEH is a wholly-owned subsidiary of the Company andbased in Houston, Texas. Through AEH, we provide natural gas management and transportation services tomunicipalities, regulated distribution companies, including certain divisions of Atmos Energy and third parties.
2. Summary of Significant Accounting Policies
Principles of consolidation — The accompanying consolidated financial statements include the accounts ofAtmos Energy Corporation and its wholly-owned subsidiaries. All material intercompany transactions have beeneliminated; however, we have not eliminated intercompany profits when such amounts are probable of recoveryunder the affiliates’ rate regulation process.
Basis of comparison — Certain prior-year amounts have been reclassified to conform with the current yearpresentation.
Use of estimates — The preparation of financial statements in conformity with accounting principles gen-erally accepted in the United States requires management to make estimates and assumptions that affect thereported amounts of assets, liabilities, revenues and expenses. The most significant estimates include the allow-ance for doubtful accounts, unbilled revenues, contingency accruals, pension and postretirement obligations,deferred income taxes, impairment of long-lived assets, risk management and trading activities, fair value meas-urements and the valuation of goodwill and other long-lived assets. Actual results could differ from those esti-mates.
56

ATMOS ENERGY CORPORATION
NOTES TO CONSOLIDATED FINANCIAL STATEMENTS — (Continued)
Regulation — Our regulated distribution and regulated pipeline operations are subject to regulation withrespect to rates, service, maintenance of accounting records and various other matters by the respective regu-latory authorities in the states in which we operate. Our accounting policies recognize the financial effects of theratemaking and accounting practices and policies of the various regulatory commissions. Accounting principlesgenerally accepted in the United States require cost-based, rate-regulated entities that meet certain criteria toreflect the authorized recovery of costs due to regulatory decisions in their financial statements. As a result, cer-tain costs that would normally be expensed under accounting principles generally accepted in the United Statesare permitted to be capitalized or deferred on the balance sheet because it is probable they can be recoveredthrough rates. Further, regulation may impact the period in which revenues or expenses are recognized. Theamounts to be recovered or recognized are based upon historical experience and our understanding of the regu-lations.
We record regulatory assets as a component of other current assets and deferred charges and other assets forcosts that have been deferred for which future recovery through customer rates is considered probable. Regu-latory liabilities are recorded either on the face of the balance sheet or as a component of current liabilities,deferred income taxes or deferred credits and other liabilities when it is probable that revenues will be reducedfor amounts that will be credited to customers through the ratemaking process. Significant regulatory assets andliabilities as of September 30, 2015 and 2014 included the following:
September 302015 2014
(In thousands)
Regulatory assets:Pension and postretirement benefit costs(1) . . . . . . . . . . . . . . . . . . . . . . . . . . . $121,183 $162,777Infrastructure Mechanisms(2) . . . . . . . . . . . . . . . . . . . . . . . . . . . . . . . . . . . . . . 32,813 26,948Deferred gas costs . . . . . . . . . . . . . . . . . . . . . . . . . . . . . . . . . . . . . . . . . . . . . . 9,715 20,069Recoverable loss on reacquired debt . . . . . . . . . . . . . . . . . . . . . . . . . . . . . . . . 16,319 18,877APT annual adjustment mechanism . . . . . . . . . . . . . . . . . . . . . . . . . . . . . . . . 1,002 8,479Rate case costs . . . . . . . . . . . . . . . . . . . . . . . . . . . . . . . . . . . . . . . . . . . . . . . . . 1,533 3,757Other . . . . . . . . . . . . . . . . . . . . . . . . . . . . . . . . . . . . . . . . . . . . . . . . . . . . . . . . 9,774 9,402
$192,339 $250,309
Regulatory liabilities:Regulatory cost of removal obligation . . . . . . . . . . . . . . . . . . . . . . . . . . . . . . $483,676 $490,448Deferred gas costs . . . . . . . . . . . . . . . . . . . . . . . . . . . . . . . . . . . . . . . . . . . . . . 28,100 35,063Asset retirement obligation . . . . . . . . . . . . . . . . . . . . . . . . . . . . . . . . . . . . . . . 9,063 10,508Deferred franchise fees . . . . . . . . . . . . . . . . . . . . . . . . . . . . . . . . . . . . . . . . . . — 5,268Other . . . . . . . . . . . . . . . . . . . . . . . . . . . . . . . . . . . . . . . . . . . . . . . . . . . . . . . . 3,693 4,472
$524,532 $545,759
(1) Includes $16.6 million and $18.8 million of pension and postretirement expense deferred pursuant to regu-latory authorization.
(2) Infrastructure mechanisms in Texas and Louisiana allow for the deferral of all expenses associated with capi-tal expenditures incurred pursuant to these rules, which primarily consists of interest costs along withdepreciation and other taxes, until the next rate proceeding (rate case or annual rate filing), at which timeinvestment and costs would be recovered through base rates.
57

ATMOS ENERGY CORPORATION
NOTES TO CONSOLIDATED FINANCIAL STATEMENTS — (Continued)
Revenue recognition — Sales of natural gas to our regulated distribution customers are billed on a monthlybasis; however, the billing cycle periods for certain classes of customers do not necessarily coincide withaccounting periods used for financial reporting purposes. We follow the revenue accrual method of accountingfor regulated distribution segment revenues whereby revenues applicable to gas delivered to customers, but notyet billed under the cycle billing method, are estimated and accrued and the related costs are charged to expense.
On occasion, we are permitted to implement new rates that have not been formally approved by our stateregulatory commissions, which are subject to refund. As permitted by accounting principles generally accepted inthe United States, we recognize this revenue and establish a reserve for amounts that could be refunded based onour experience for the jurisdiction in which the rates were implemented.
Rates established by regulatory authorities are adjusted for increases and decreases in our purchased gascosts through purchased gas cost adjustment mechanisms. Purchased gas cost adjustment mechanisms providegas distribution companies a method of recovering purchased gas costs on an ongoing basis without filing a ratecase to address all of their non-gas costs. There is no gross profit generated through purchased gas cost adjust-ments, but they provide a dollar-for-dollar offset to increases or decreases in our regulated distribution segment’sgas costs. The effects of these purchased gas cost adjustment mechanisms are recorded as deferred gas costs onour balance sheet.
Operating revenues for our regulated pipeline and nonregulated segments are recognized in the period inwhich actual volumes are transported and storage services are provided.
Operating revenues for our nonregulated segment and the associated carrying value of natural gas inventory(inclusive of storage costs) are recognized when we sell the gas and physically deliver it to our customers.Operating revenues include realized gains and losses arising from the settlement of financial instruments used inour nonregulated activities.
Cash and cash equivalents — We consider all highly liquid investments with an original maturity of threemonths or less to be cash equivalents.
Accounts receivable and allowance for doubtful accounts — Accounts receivable arise from natural gassales to residential, commercial, industrial, municipal and other customers. We establish an allowance for doubt-ful accounts to reduce the net receivable balance to the amount we reasonably expect to collect based on our col-lection experience or where we are aware of a specific customer’s inability or reluctance to pay. However, ifcircumstances change, our estimate of the recoverability of accounts receivable could be affected. Circumstanceswhich could affect our estimates include, but are not limited to, customer credit issues, the level of natural gasprices, customer deposits and general economic conditions. Accounts are written off once they are deemed to beuncollectible.
Gas stored underground — Our gas stored underground is comprised of natural gas injected into storage tosupport the winter season withdrawals for our regulated distribution operations and natural gas held by our non-regulated segment to conduct their operations. The average cost method is used for substantially all of our regu-lated operations. Our nonregulated segment utilizes the average cost method; however, most of this inventory ishedged and is therefore reported at fair value at the end of each month. Gas in storage that is retained as cushiongas to maintain reservoir pressure is classified as property, plant and equipment and is valued at cost.
Regulated property, plant and equipment — Regulated property, plant and equipment is stated at originalcost, net of contributions in aid of construction. The cost of additions includes direct construction costs, payrollrelated costs (taxes, pensions and other fringe benefits), administrative and general costs and an allowance forfunds used during construction. The allowance for funds used during construction represents the estimated costof funds used to finance the construction of major projects and are capitalized in the rate base for ratemakingpurposes when the completed projects are placed in service. Interest expense of $2.3 million, $1.5 million and$1.9 million was capitalized in 2015, 2014 and 2013.
58

ATMOS ENERGY CORPORATION
NOTES TO CONSOLIDATED FINANCIAL STATEMENTS — (Continued)
Major renewals, including replacement pipe, and betterments that are recoverable under our regulatory ratebase are capitalized while the costs of maintenance and repairs that are not recoverable through rates are chargedto expense as incurred. The costs of large projects are accumulated in construction in progress until the project iscompleted. When the project is completed, tested and placed in service, the balance is transferred to the regulatedplant in service account included in the rate base and depreciation begins.
Regulated property, plant and equipment is depreciated at various rates on a straight-line basis. These ratesare approved by our regulatory commissions and are comprised of two components: one based on average serv-ice life and one based on cost of removal. Accordingly, we recognize our cost of removal expense as a compo-nent of depreciation expense. The related cost of removal accrual is reflected as a regulatory liability on theconsolidated balance sheet. At the time property, plant and equipment is retired, removal expenses less salvage,are charged to the regulatory cost of removal accrual. The composite depreciation rate was 3.3 percent, for eachof the fiscal years ended September 30, 2015, 2014 and 2013.
Nonregulated property, plant and equipment — Nonregulated property, plant and equipment is stated atcost. Depreciation is generally computed on the straight-line method for financial reporting purposes based uponestimated useful lives ranging from three to 43 years.
Asset retirement obligations — We record a liability at fair value for an asset retirement obligation whenthe legal obligation to retire the asset has been incurred with an offsetting increase to the carrying value of therelated asset. Accretion of the asset retirement obligation due to the passage of time is recorded as an operatingexpense.
As of September 30, 2015 and 2014, we had asset retirement obligations of $11.1 million and $10.5 million.Additionally, we had $4.8 million and $5.9 million of asset retirement costs recorded as a component of property,plant and equipment that will be depreciated over the remaining life of the underlying associated assets.
We believe we have a legal obligation to retire our natural gas storage facilities. However, we have notrecognized an asset retirement obligation associated with our storage facilities because we are not able todetermine the settlement date of this obligation as we do not anticipate taking our storage facilities out of servicepermanently. Therefore, we cannot reasonably estimate the fair value of this obligation.
Impairment of long-lived assets — We periodically evaluate whether events or circumstances haveoccurred that indicate that other long-lived assets may not be recoverable or that the remaining useful life maywarrant revision. When such events or circumstances are present, we assess the recoverability of long-livedassets by determining whether the carrying value will be recovered through the expected future cash flows. In theevent the sum of the expected future cash flows resulting from the use of the asset is less than the carrying valueof the asset, an impairment loss equal to the excess of the asset’s carrying value over its fair value is recorded.
Goodwill — We annually evaluate our goodwill balances for impairment during our second fiscal quarter ormore frequently as impairment indicators arise. We use a present value technique based on discounted cash flowsto estimate the fair value of our reporting units. These calculations are dependent on several subjective factorsincluding the timing of future cash flows, future growth rates and the discount rate. An impairment charge isrecognized if the carrying value of a reporting unit’s goodwill exceeds its fair value.
Marketable securities — As of September 30, 2015 and 2014, all of our marketable securities were classi-fied as available-for-sale. In accordance with the authoritative accounting standards, these securities are reportedat market value with unrealized gains and losses shown as a component of accumulated other comprehensiveincome (loss). We regularly evaluate the performance of these investments on an individual investment byinvestment basis for impairment, taking into consideration the fund’s purpose, volatility and current returns. If adetermination is made that a decline in fair value is other than temporary, the related investment is written downto its estimated fair value.
59

ATMOS ENERGY CORPORATION
NOTES TO CONSOLIDATED FINANCIAL STATEMENTS — (Continued)
Financial instruments and hedging activities — We use financial instruments to mitigate commodity pricerisk in our regulated distribution and nonregulated segments and interest rate risk. The objectives and strategiesfor using financial instruments have been tailored to our regulated and nonregulated businesses and are discussedin Note 12.
We record all of our financial instruments on the balance sheet at fair value, with changes in fair value ulti-mately recorded in the income statement. These financial instruments are reported as risk management assets andliabilities and are classified as current or noncurrent other assets or liabilities based upon the anticipated settle-ment date of the underlying financial instrument. We record the cash flow impact of our financial instruments inoperating cash flows based upon their balance sheet classification.
The timing of when changes in fair value of our financial instruments are recorded in the income statementdepends on whether the financial instrument has been designated and qualifies as a part of a hedging relationshipor if regulatory rulings require a different accounting treatment. Changes in fair value for financial instrumentsthat do not meet one of these criteria are recognized in the income statement as they occur.
Financial Instruments Associated with Commodity Price Risk
In our regulated distribution segment, the costs associated with and the gains and losses arising from the useof financial instruments to mitigate commodity price risk are included in our purchased gas cost adjustmentmechanisms in accordance with regulatory requirements. Therefore, changes in the fair value of these financialinstruments are initially recorded as a component of deferred gas costs and recognized in the consolidated state-ment of income as a component of purchased gas cost when the related costs are recovered through our rates andrecognized in revenue in accordance with accounting principles generally accepted in the United States. Accord-ingly, there is no earnings impact on our regulated distribution segment as a result of the use of financial instru-ments.
In our nonregulated segment, we have designated most of the natural gas inventory held by this operatingsegment as the hedged item in a fair-value hedge. This inventory is marked to market at the end of each monthbased on the Gas Daily index, with changes in fair value recognized as unrealized gains or losses in purchasedgas cost in the period of change. The financial instruments associated with this natural gas inventory have beendesignated as fair-value hedges and are marked to market each month based upon the NYMEX price withchanges in fair value recognized as unrealized gains or losses in purchased gas cost in the period of change. Wehave elected to exclude this spot/forward differential for purposes of assessing the effectiveness of these fair-value hedges. For the fiscal years ended September 30, 2015, 2014 and 2013, we included unrealized gains(losses) on open contracts of $(2.4) million, $9.6 million and $9.0 million as a component of nonregulated pur-chased gas cost.
Additionally, we have elected to treat fixed-price forward contracts used in our nonregulated segment todeliver natural gas as normal purchases and normal sales. As such, these deliveries are recorded on an accrualbasis in accordance with our revenue recognition policy. Financial instruments used to mitigate the commodityprice risk associated with these contracts have been designated as cash flow hedges of anticipated purchases andsales at indexed prices. Accordingly, unrealized gains and losses on these open financial instruments are recordedas a component of accumulated other comprehensive income, and are recognized in earnings as a component ofpurchased gas cost when the hedged volumes are sold.
Gains and losses from hedge ineffectiveness are recognized in the income statement. Fair value and cashflow hedge ineffectiveness arising from natural gas market price differences between the locations of the hedgedinventory and the delivery location specified in the financial instruments is referred to as basis ineffectiveness.Ineffectiveness arising from changes in the fair value of the fair value hedges due to changes in the differencebetween the spot price and the futures price, as well as the difference between the timing of the settlement of thefutures and the valuation of the underlying physical commodity is referred to as timing ineffectiveness. Hedgeineffectiveness, to the extent incurred, is reported as a component of purchased gas cost.
60

ATMOS ENERGY CORPORATION
NOTES TO CONSOLIDATED FINANCIAL STATEMENTS — (Continued)
Our nonregulated segment also utilizes master netting agreements with significant counterparties that allowus to offset gains and losses arising from financial instruments that may be settled in cash with gains and lossesarising from financial instruments that may be settled with the physical commodity. Assets and liabilities fromrisk management activities, as well as accounts receivable and payable, reflect the master netting agreements inplace. Additionally, the accounting guidance for master netting arrangements requires us to include the fair valueof cash collateral or the obligation to return cash in the amounts that have been netted under master nettingagreements used to offset gains and losses arising from financial instruments. As of September 30, 2015 and2014, the Company netted $43.5 million and $25.8 million of cash held in margin accounts into its current andnoncurrent risk management assets and liabilities.
Financial Instruments Associated with Interest Rate Risk
We manage interest rate risk, primarily when we plan to issue new long-term debt or to refinance existinglong-term debt. We currently manage this risk through the use of forward starting interest rate swaps to fix theTreasury yield component of the interest cost associated with anticipated financings. We designate these finan-cial instruments as cash flow hedges at the time the agreements are executed. Unrealized gains and losses asso-ciated with the instruments are recorded as a component of accumulated other comprehensive income (loss).When the instruments settle, the realized gain or loss is recorded as a component of accumulated other compre-hensive income (loss) and recognized as a component of interest expense over the life of the related financingarrangement. Hedge ineffectiveness to the extent incurred is reported as a component of interest expense.
Fair Value Measurements — We report certain assets and liabilities at fair value, which is defined as theprice that would be received to sell an asset or paid to transfer a liability in an orderly transaction between marketparticipants at the measurement date (exit price). We primarily use quoted market prices and other observablemarket pricing information in valuing our financial assets and liabilities and minimize the use of unobservablepricing inputs in our measurements.
Fair-value estimates also consider our own creditworthiness and the creditworthiness of the counterpartiesinvolved. Our counterparties consist primarily of financial institutions and major energy companies. This concen-tration of counterparties may materially impact our exposure to credit risk resulting from market, economic orregulatory conditions. We seek to minimize counterparty credit risk through an evaluation of their financial con-dition and credit ratings and the use of collateral requirements under certain circumstances.
Amounts reported at fair value are subject to potentially significant volatility based upon changes in marketprices, including, but not limited to, the valuation of the portfolio of our contracts, maturity and settlement ofthese contracts and newly originated transactions and interest rates, each of which directly affect the estimatedfair value of our financial instruments. We believe the market prices and models used to value these financialinstruments represent the best information available with respect to closing exchange and over-the-counter quota-tions, time value and volatility factors underlying the contracts. Values are adjusted to reflect the potential impactof an orderly liquidation of our positions over a reasonable period of time under then current market conditions.
Authoritative accounting literature establishes a fair value hierarchy that prioritizes the inputs used to measurefair value based on observable and unobservable data. The hierarchy categorizes the inputs into three levels, withthe highest priority given to unadjusted quoted prices in active markets for identical assets and liabilities (Level 1)and the lowest priority given to unobservable inputs (Level 3). The levels of the hierarchy are described below:
Level 1 — Represents unadjusted quoted prices in active markets for identical assets or liabilities. An activemarket for the asset or liability is defined as a market in which transactions for the asset or liability occur withsufficient frequency and volume to provide pricing information on an ongoing basis. Prices actively quoted onnational exchanges are used to determine the fair value of most of our assets and liabilities recorded on our bal-ance sheet at fair value. Within our nonregulated operations, we utilize a mid-market pricing convention (themid-point between the bid and ask prices), as permitted under current accounting standards. Values derived fromthese sources reflect the market in which transactions involving these financial instruments are executed.
61

ATMOS ENERGY CORPORATION
NOTES TO CONSOLIDATED FINANCIAL STATEMENTS — (Continued)
Our Level 1 measurements consist primarily of exchange-traded financial instruments, gas stored under-ground that has been designated as the hedged item in a fair value hedge and our available-for-sale securities.The Level 1 measurements for investments in the Atmos Energy Corporation Master Retirement Trust (the Mas-ter Trust), Supplemental Executive Benefit Plan and postretirement benefit plan consist primarily of exchange-traded financial instruments.
Level 2 — Represents pricing inputs other than quoted prices included in Level 1 that are either directly orindirectly observable for the asset or liability as of the reporting date. These inputs are derived principally from,or corroborated by, observable market data. Our Level 2 measurements primarily consist of non-exchange-tradedfinancial instruments, such as over-the-counter options and swaps and municipal and corporate bonds wheremarket data for pricing is observable. The Level 2 measurements for investments in our Master Trust, Supple-mental Executive Benefit Plan and postretirement benefit plan consist primarily of non-exchange traded financialinstruments such as common collective trusts and investments in limited partnerships.
Level 3 — Represents generally unobservable pricing inputs which are developed based on the bestinformation available, including our own internal data, in situations where there is little if any market activity forthe asset or liability at the measurement date. The pricing inputs utilized reflect what a market participant woulduse to determine fair value. We utilize models and other valuation methods to determine fair value when externalsources are not available. We believe the market prices and models used to value these assets and liabilitiesrepresent the best information available with respect to closing exchange and over-the-counter quotations, timevalue and volatility factors underlying the assets and liabilities.
Pension and other postretirement plans — Pension and other postretirement plan costs and liabilities aredetermined on an actuarial basis and are affected by numerous assumptions and estimates including the marketvalue of plan assets, estimates of the expected return on plan assets, assumed discount rates and current demo-graphic and actuarial mortality data. Our measurement date is September 30. The assumed discount rate and theexpected return are the assumptions that generally have the most significant impact on our pension costs andliabilities. The assumed discount rate, the assumed health care cost trend rate and assumed rates of retirementgenerally have the most significant impact on our postretirement plan costs and liabilities.
The discount rate is utilized principally in calculating the actuarial present value of our pension and post-retirement obligation and net pension and postretirement cost. When establishing our discount rate, we considerhigh quality corporate bond rates based on bonds available in the marketplace that are suitable for settling theobligations, changes in those rates from the prior year and the implied discount rate that is derived from matchingour projected benefit disbursements with currently available high quality corporate bonds.
The expected long-term rate of return on assets is utilized in calculating the expected return on plan assetscomponent of the annual pension and postretirement plan cost. We estimate the expected return on plan assets byevaluating expected bond returns, equity risk premiums, asset allocations, the effects of active plan management,the impact of periodic plan asset rebalancing and historical performance. We also consider the guidance from ourinvestment advisors when making a final determination of our expected rate of return on assets. To the extent theactual rate of return on assets realized over the course of a year is greater than or less than the assumed rate, thatyear’s annual pension or postretirement plan cost is not affected. Rather, this gain or loss is amortized over theexpected future working lifetime of the plan participants.
The expected return on plan assets is then calculated by applying the expected long-term rate of return on planassets to the market-related value of the plan assets. The market-related value of our plan assets represents the fairmarket value of the plan assets, adjusted to smooth out short-term market fluctuations over a five-year period. Theuse of this calculation will delay the impact of current market fluctuations on the pension expense for the period.
We use a corridor approach to amortize actuarial gains and losses. Under this approach, net gains or lossesin excess of ten percent of the larger of the pension benefit obligation or the market-related value of the assets areamortized on a straight-line basis. The period of amortization is the average remaining service of active partic-ipants who are expected to receive benefits under the plan.
62

ATMOS ENERGY CORPORATION
NOTES TO CONSOLIDATED FINANCIAL STATEMENTS — (Continued)
We estimate the assumed health care cost trend rate used in determining our annual postretirement net costbased upon our actual health care cost experience, the effects of recently enacted legislation and generaleconomic conditions. Our assumed rate of retirement is estimated based upon the annual review of our partic-ipant census information as of the measurement date.
Income taxes — Income taxes are determined based on the liability method, which results in income taxassets and liabilities arising from temporary differences. Temporary differences are differences between the taxbases of assets and liabilities and their reported amounts in the financial statements that will result in taxable ordeductible amounts in future years. The liability method requires the effect of tax rate changes on current andaccumulated deferred income taxes to be reflected in the period in which the rate change was enacted. Theliability method also requires that deferred tax assets be reduced by a valuation allowance unless it is more likelythan not that the assets will be realized.
The Company may recognize the tax benefit from uncertain tax positions only if it is at least more likelythan not that the tax position will be sustained on examination by the taxing authorities, based on the technicalmerits of the position. The tax benefits recognized in the financial statements from such a position should bemeasured based on the largest benefit that has a greater than fifty percent likelihood of being realized uponsettlement with the taxing authorities. We recognize accrued interest related to unrecognized tax benefits as acomponent of interest expense. We recognize penalties related to unrecognized tax benefits as a component ofmiscellaneous income (expense) in accordance with regulatory requirements.
Tax collections — We are allowed to recover from customers revenue-related taxes that are imposed uponus. We record such taxes as operating expenses and record the corresponding customer charges as operatingrevenues. However, we do collect and remit various other taxes on behalf of various governmental authorities,and we record these amounts in our consolidated balance sheets on a net basis. We do not collect income taxesfrom our customers on behalf of governmental authorities.
Contingencies — In the normal course of business, we are confronted with issues or events that may resultin a contingent liability. These generally relate to lawsuits, claims made by third parties or the action of variousregulatory agencies. For such matters, we record liabilities when they are considered probable and reasonablyestimable, based on currently available facts and our estimates of the ultimate outcome or resolution of theliability in the future. Actual results may differ from estimates, depending on actual outcomes or changes in thefacts or expectations surrounding each potential exposure.
Subsequent events — Except as disclosed in Note 6 regarding the new mortality tables adopted for ourpension plans and the approval of the merger of the AEH 401(k) Plan with the Retirement Savings Plan, noevents occurred subsequent to the balance sheet date that would require recognition or disclosure in the financialstatements.
Recent accounting pronouncements — In May 2014, the Financial Accounting Standards Board (FASB)issued a comprehensive new revenue recognition standard that will supersede virtually all existing revenuerecognition guidance under generally accepted accounting principles in the United States. Under the new stan-dard, a company will recognize revenue when it transfers promised goods or services to customers in an amountthat reflects the consideration to which the company expects to be entitled in exchange for those goods or serv-ices. In doing so, companies will need to use more judgment and make more estimates than under current guid-ance. On July 9, 2015, the FASB voted to approve a deferral of the effective date of the new standard by oneyear. With the one-year extension, the new standard is currently scheduled to become effective for us beginningon October 1, 2018 and can be applied either retrospectively to each period presented or as a cumulative-effectadjustment as of the date of adoption. We are currently evaluating the impact this standard may have on ourfinancial position, results of operations and cash flows.
63
ATMOS ENERGY CORPORATION
NOTES TO CONSOLIDATED FINANCIAL STATEMENTS — (Continued)
In April 2015, the FASB issued guidance to simplify the presentation of debt issuance costs, which requiresthat debt issuance costs related to a recognized debt liability be presented in the balance sheet as a directdeduction from the carrying amount of that debt liability, consistent with debt discounts. The new standard willbe effective for us beginning on October 1, 2016, and will be applied retrospectively. We are currently evaluatingthe impact this standard may have on our financial position, results of operations and cash flows.
In April 2015, the FASB issued guidance to simplify the accounting for fees paid in connection witharrangements with cloud-based software providers. Under the new guidance, unless a software arrangementincludes specific elements enabling customers to possess and operate software on platforms other than thatoffered by the cloud-based provider, the cost of such arrangements is to be accounted for as an operating expensein the period incurred. The new guidance is effective for us beginning October 1, 2016 and may be applied eitherprospectively or retrospectively with early adoption permitted. We anticipate the adoption of this standard willnot have a material impact on our financial position, results of operations and cash flows.
3. Segment Information
Atmos Energy Corporation and its subsidiaries are engaged primarily in the regulated natural gas dis-tribution and pipeline business as well as other nonregulated businesses. We distribute natural gas through salesand transportation arrangements to over three million residential, commercial, public authority and industrialcustomers through our six regulated distribution divisions, which cover service areas located in eight states. Inaddition, we transport natural gas for others through our distribution system.
Through our nonregulated business, we provide natural gas management and transportation services tomunicipalities, regulated distribution companies, including certain divisions of Atmos Energy and third parties.
We operate the Company through the following three segments:
‰ The regulated distribution segment, includes our regulated distribution and related sales operations.
‰ The regulated pipeline segment, includes the regulated pipeline and storage operations of our Atmos Pipe-line — Texas Division.
‰ The nonregulated segment, is comprised of our nonregulated natural gas management, nonregulated natu-ral gas transmission, storage and other services.
Our determination of reportable segments considers the strategic operating units under which we managesales of various products and services to customers in differing regulatory environments. Although our regulateddistribution segment operations are geographically dispersed, they are reported as a single segment as each regu-lated distribution division has similar economic characteristics. The accounting policies of the segments are thesame as those described in the summary of significant accounting policies. We evaluate performance based onnet income or loss of the respective operating units. Interest expense is allocated pro rata to each segment basedupon our net investment in each segment. Income taxes are allocated to each segment as if each segment’s taxeswere calculated on a separate return basis.
64

ATMOS ENERGY CORPORATION
NOTES TO CONSOLIDATED FINANCIAL STATEMENTS — (Continued)
Summarized income statements and capital expenditures by segment are shown in the following tables.
Year Ended September 30, 2015Regulated
DistributionRegulatedPipeline Nonregulated Eliminations Consolidated
(In thousands)
Operating revenues from externalparties . . . . . . . . . . . . . . . . . . . . . . . . . . $2,757,585 $ 97,662 $1,286,889 $ — $4,142,136
Intersegment revenues . . . . . . . . . . . . . . . 6,250 272,450 185,320 (464,020) —
2,763,835 370,112 1,472,209 (464,020) 4,142,136Purchased gas cost . . . . . . . . . . . . . . . . . . 1,526,258 — 1,399,349 (463,488) 2,462,119
Gross profit . . . . . . . . . . . . . . . . . . . . . . 1,237,577 370,112 72,860 (532) 1,680,017Operating expenses
Operation and maintenance . . . . . . . . . 388,486 118,866 35,048 (532) 541,868Depreciation and amortization . . . . . . . 223,048 47,236 4,512 — 274,796Taxes, other than income . . . . . . . . . . . 205,894 22,743 3,321 — 231,958
Total operating expenses . . . . . . . . . . . . . 817,428 188,845 42,881 (532) 1,048,622
Operating income . . . . . . . . . . . . . . . . . . . 420,149 181,267 29,979 — 631,395Miscellaneous expense . . . . . . . . . . . . . . . (377) (1,243) (760) (2,009) (4,389)Interest charges . . . . . . . . . . . . . . . . . . . . . 84,132 33,151 967 (2,009) 116,241
Income before income taxes . . . . . . . . . . . 335,640 146,873 28,252 — 510,765Income tax expense . . . . . . . . . . . . . . . . . 130,827 52,211 12,652 — 195,690
Net income . . . . . . . . . . . . . . . . . . . . . . $ 204,813 $ 94,662 $ 15,600 $ — $ 315,075
Capital expenditures . . . . . . . . . . . . . . . . . $ 680,961 $292,728 $ 1,443 $ — $ 975,132
65

ATMOS ENERGY CORPORATION
NOTES TO CONSOLIDATED FINANCIAL STATEMENTS — (Continued)
Year Ended September 30, 2014Regulated
DistributionRegulatedPipeline Nonregulated Eliminations Consolidated
(In thousands)
Operating revenues from externalparties . . . . . . . . . . . . . . . . . . . . . . . . . . $3,056,212 $ 92,166 $1,792,538 $ — $4,940,916
Intersegment revenues . . . . . . . . . . . . . . . 5,334 226,293 274,754 (506,381) —
3,061,546 318,459 2,067,292 (506,381) 4,940,916Purchased gas cost . . . . . . . . . . . . . . . . . . 1,885,031 — 1,979,337 (505,878) 3,358,490
Gross profit . . . . . . . . . . . . . . . . . . . . . . 1,176,515 318,459 87,955 (503) 1,582,426Operating expenses
Operation and maintenance . . . . . . . . . 387,228 91,466 26,963 (503) 505,154Depreciation and amortization . . . . . . . 208,376 41,031 4,580 — 253,987Taxes, other than income . . . . . . . . . . . 196,343 13,143 2,450 — 211,936
Total operating expenses . . . . . . . . . . . . . 791,947 145,640 33,993 (503) 971,077
Operating income . . . . . . . . . . . . . . . . . . . 384,568 172,819 53,962 — 611,349Miscellaneous income (expense) . . . . . . . (381) (3,181) 2,216 (3,889) (5,235)Interest charges . . . . . . . . . . . . . . . . . . . . . 94,918 36,280 1,986 (3,889) 129,295
Income before income taxes . . . . . . . . . . . 289,269 133,358 54,192 — 476,819Income tax expense . . . . . . . . . . . . . . . . . 117,684 47,167 22,151 — 187,002
Net income . . . . . . . . . . . . . . . . . . . . . . $ 171,585 $ 86,191 $ 32,041 $ — $ 289,817
Capital expenditures . . . . . . . . . . . . . . . . . $ 584,065 $249,347 $ 1,839 $ — $ 835,251
66
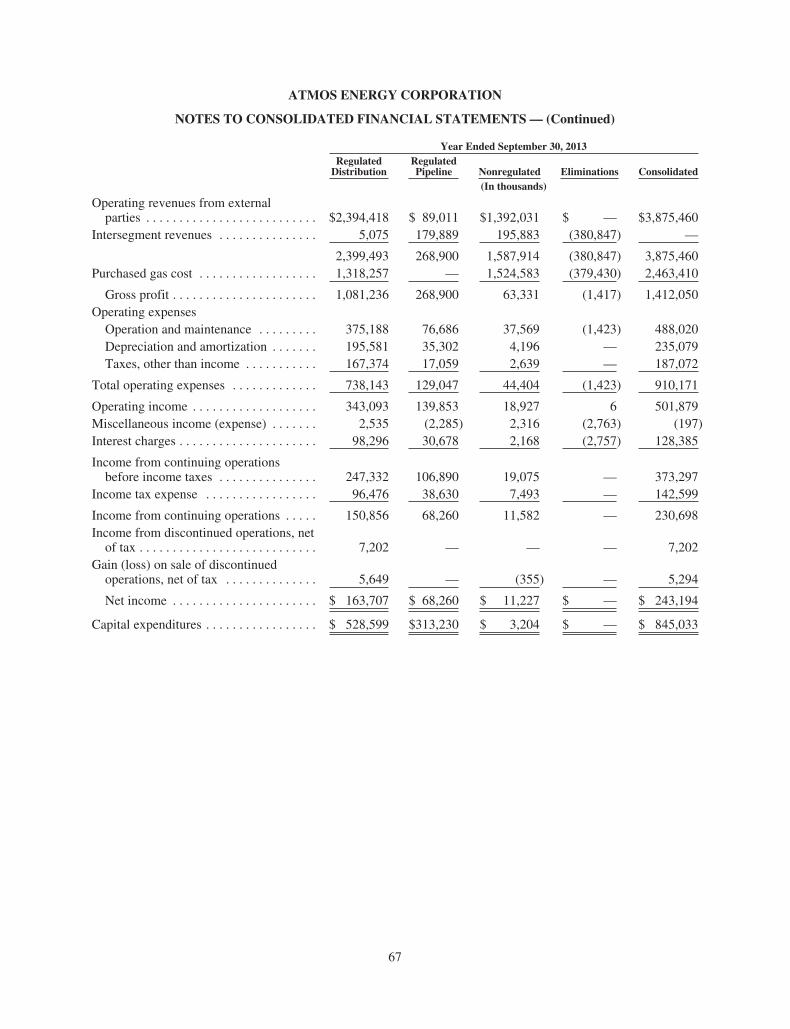
ATMOS ENERGY CORPORATION
NOTES TO CONSOLIDATED FINANCIAL STATEMENTS — (Continued)
Year Ended September 30, 2013Regulated
DistributionRegulatedPipeline Nonregulated Eliminations Consolidated
(In thousands)
Operating revenues from externalparties . . . . . . . . . . . . . . . . . . . . . . . . . . $2,394,418 $ 89,011 $1,392,031 $ — $3,875,460
Intersegment revenues . . . . . . . . . . . . . . . 5,075 179,889 195,883 (380,847) —
2,399,493 268,900 1,587,914 (380,847) 3,875,460Purchased gas cost . . . . . . . . . . . . . . . . . . 1,318,257 — 1,524,583 (379,430) 2,463,410
Gross profit . . . . . . . . . . . . . . . . . . . . . . 1,081,236 268,900 63,331 (1,417) 1,412,050Operating expenses
Operation and maintenance . . . . . . . . . 375,188 76,686 37,569 (1,423) 488,020Depreciation and amortization . . . . . . . 195,581 35,302 4,196 — 235,079Taxes, other than income . . . . . . . . . . . 167,374 17,059 2,639 — 187,072
Total operating expenses . . . . . . . . . . . . . 738,143 129,047 44,404 (1,423) 910,171
Operating income . . . . . . . . . . . . . . . . . . . 343,093 139,853 18,927 6 501,879Miscellaneous income (expense) . . . . . . . 2,535 (2,285) 2,316 (2,763) (197)Interest charges . . . . . . . . . . . . . . . . . . . . . 98,296 30,678 2,168 (2,757) 128,385
Income from continuing operationsbefore income taxes . . . . . . . . . . . . . . . 247,332 106,890 19,075 — 373,297
Income tax expense . . . . . . . . . . . . . . . . . 96,476 38,630 7,493 — 142,599
Income from continuing operations . . . . . 150,856 68,260 11,582 — 230,698Income from discontinued operations, net
of tax . . . . . . . . . . . . . . . . . . . . . . . . . . . 7,202 — — — 7,202Gain (loss) on sale of discontinued
operations, net of tax . . . . . . . . . . . . . . 5,649 — (355) — 5,294
Net income . . . . . . . . . . . . . . . . . . . . . . $ 163,707 $ 68,260 $ 11,227 $ — $ 243,194
Capital expenditures . . . . . . . . . . . . . . . . . $ 528,599 $313,230 $ 3,204 $ — $ 845,033
67

ATMOS ENERGY CORPORATION
NOTES TO CONSOLIDATED FINANCIAL STATEMENTS — (Continued)
The following table summarizes our revenues by products and services for the fiscal year ended Sep-tember 30.
2015 2014 2013(In thousands)
Regulated distribution revenues:Gas sales revenues:
Residential . . . . . . . . . . . . . . . . . . . . . . . . . . . . . . . . . . . $1,761,689 $1,933,099 $1,512,495Commercial . . . . . . . . . . . . . . . . . . . . . . . . . . . . . . . . . . 772,187 876,042 661,930Industrial . . . . . . . . . . . . . . . . . . . . . . . . . . . . . . . . . . . . 74,981 90,536 81,155Public authority and other . . . . . . . . . . . . . . . . . . . . . . . 53,401 64,779 60,557
Total gas sales revenues . . . . . . . . . . . . . . . . . . . . . . 2,662,258 2,964,456 2,316,137Transportation revenues . . . . . . . . . . . . . . . . . . . . . . . . . . 67,475 64,049 55,938Other gas revenues . . . . . . . . . . . . . . . . . . . . . . . . . . . . . . 27,852 27,707 22,343
Total regulated distribution revenues . . . . . . . . . . . . . . 2,757,585 3,056,212 2,394,418Regulated pipeline revenues . . . . . . . . . . . . . . . . . . . . . . . . . 97,662 92,166 89,011Nonregulated revenues . . . . . . . . . . . . . . . . . . . . . . . . . . . . . 1,286,889 1,792,538 1,392,031
Total operating revenues . . . . . . . . . . . . . . . . . . . . . . . . $4,142,136 $4,940,916 $3,875,460
68

ATMOS ENERGY CORPORATION
NOTES TO CONSOLIDATED FINANCIAL STATEMENTS — (Continued)
Balance sheet information at September 30, 2015 and 2014 by segment is presented in the following tables.
September 30, 2015Regulated
DistributionRegulatedPipeline Nonregulated Eliminations Consolidated
(In thousands)
ASSETSProperty, plant and equipment, net . . . $5,670,306 $1,706,449 $ 53,825 $ — $7,430,580Investment in subsidiaries . . . . . . . . . . 1,038,670 — (2,096) (1,036,574) —Current assets
Cash and cash equivalents . . . . . . . . 23,863 — 4,790 — 28,653Assets from risk management
activities . . . . . . . . . . . . . . . . . . . 378 — 8,854 — 9,232Other current assets . . . . . . . . . . . . . 426,270 24,628 480,503 (338,301) 593,100Intercompany receivables . . . . . . . . 887,713 — — (887,713) —
Total current assets . . . . . . . . . . . 1,338,224 24,628 494,147 (1,226,014) 630,985Goodwill . . . . . . . . . . . . . . . . . . . . . . . 575,449 132,542 34,711 — 742,702Noncurrent assets from risk
management activities . . . . . . . . . . . 368 — — — 368Deferred charges and other assets . . . . 265,693 17,288 5,329 — 288,310
$8,888,710 $1,880,907 $585,916 $(2,262,588) $9,092,945
CAPITALIZATION ANDLIABILITIES
Shareholders’ equity . . . . . . . . . . . . . . $3,194,797 $ 577,275 $461,395 $(1,038,670) $3,194,797Long-term debt . . . . . . . . . . . . . . . . . . 2,455,388 — — — 2,455,388
Total capitalization . . . . . . . . . . . 5,650,185 577,275 461,395 (1,038,670) 5,650,185Current liabilities
Short-term debt . . . . . . . . . . . . . . . . 782,927 — — (325,000) 457,927Liabilities from risk management
activities . . . . . . . . . . . . . . . . . . . 9,568 — — — 9,568Other current liabilities . . . . . . . . . . 569,273 29,780 99,480 (11,205) 687,328Intercompany payables . . . . . . . . . . — 867,409 20,304 (887,713) —
Total current liabilities . . . . . . . . 1,361,768 897,189 119,784 (1,223,918) 1,154,823Deferred income taxes . . . . . . . . . . . . . 1,008,091 406,254 (3,030) — 1,411,315Noncurrent liabilities from risk
management activities . . . . . . . . . . . 110,539 — — — 110,539Regulatory cost of removal
obligation . . . . . . . . . . . . . . . . . . . . . 427,553 — — — 427,553Pension and postretirement
liabilities . . . . . . . . . . . . . . . . . . . . . 287,373 — — — 287,373Deferred credits and other
liabilities . . . . . . . . . . . . . . . . . . . . . 43,201 189 7,767 — 51,157
$8,888,710 $1,880,907 $585,916 $(2,262,588) $9,092,945
69

ATMOS ENERGY CORPORATION
NOTES TO CONSOLIDATED FINANCIAL STATEMENTS — (Continued)
September 30, 2014Regulated
DistributionRegulatedPipeline Nonregulated Eliminations Consolidated
(In thousands)
ASSETSProperty, plant and equipment, net . . . . . . . . . $5,202,761 $1,464,572 $ 58,573 $ — $6,725,906Investment in subsidiaries . . . . . . . . . . . . . . . . 952,171 — (2,096) (950,075) —Current assets
Cash and cash equivalents . . . . . . . . . . . . . . 33,303 — 8,955 — 42,258Assets from risk management activities . . . 23,102 — 22,725 — 45,827Other current assets . . . . . . . . . . . . . . . . . . . 490,408 14,009 526,161 (342,823) 687,755Intercompany receivables . . . . . . . . . . . . . . 790,442 — — (790,442) —
Total current assets . . . . . . . . . . . . . . . . . 1,337,255 14,009 557,841 (1,133,265) 775,840Goodwill . . . . . . . . . . . . . . . . . . . . . . . . . . . . . 574,816 132,502 34,711 — 742,029Noncurrent assets from risk management
activities . . . . . . . . . . . . . . . . . . . . . . . . . . . 13,038 — — — 13,038Deferred charges and other assets . . . . . . . . . . 309,965 21,826 6,100 — 337,891
$8,390,006 $1,632,909 $655,129 $(2,083,340) $8,594,704
CAPITALIZATION AND LIABILITIESShareholders’ equity . . . . . . . . . . . . . . . . . . . . $3,086,232 $ 482,612 $469,559 $ (952,171) $3,086,232Long-term debt . . . . . . . . . . . . . . . . . . . . . . . . 2,455,986 — — — 2,455,986
Total capitalization . . . . . . . . . . . . . . . . . 5,542,218 482,612 469,559 (952,171) 5,542,218Current liabilities
Short-term debt . . . . . . . . . . . . . . . . . . . . . . 522,695 — — (326,000) 196,695Liabilities from risk management
activities . . . . . . . . . . . . . . . . . . . . . . . . . 1,730 — — — 1,730Other current liabilities . . . . . . . . . . . . . . . . 559,765 24,790 142,397 (14,727) 712,225Intercompany payables . . . . . . . . . . . . . . . . — 763,635 26,807 (790,442) —
Total current liabilities . . . . . . . . . . . . . . 1,084,190 788,425 169,204 (1,131,169) 910,650Deferred income taxes . . . . . . . . . . . . . . . . . . . 913,260 361,688 11,668 — 1,286,616Noncurrent liabilities from risk management
activities . . . . . . . . . . . . . . . . . . . . . . . . . . . 20,126 — — — 20,126Regulatory cost of removal obligation . . . . . . 445,387 — — — 445,387Pension and postretirement liabilities . . . . . . . 340,963 — — — 340,963Deferred credits and other liabilities . . . . . . . . 43,862 184 4,698 — 48,744
$8,390,006 $1,632,909 $655,129 $(2,083,340) $8,594,704
4. Earnings Per Share
Since we have non-vested share-based payments with a nonforfeitable right to dividends or dividend equiv-alents (referred to as participating securities), we are required to use the two-class method of computing earningsper share. The Company’s non-vested restricted stock units, granted under the 1998 Long-Term Incentive Plan,for which vesting is predicated solely on the passage of time, are considered to be participating securities. Thecalculation of earnings per share using the two-class method excludes income attributable to these participatingsecurities from the numerator and excludes the dilutive impact of those shares from the denominator.
70

ATMOS ENERGY CORPORATION
NOTES TO CONSOLIDATED FINANCIAL STATEMENTS — (Continued)
Basic and diluted earnings per share for the fiscal years ended September 30 are calculated as follows:
2015 2014 2013(In thousands, except per share data)
Basic Earnings Per Share from continuing operationsIncome from continuing operations . . . . . . . . . . . . . . . . . . . . . . . . . $315,075 $289,817 $230,698Less: Income from continuing operations allocated to participating
securities . . . . . . . . . . . . . . . . . . . . . . . . . . . . . . . . . . . . . . . . . . . . 626 711 775
Income from continuing operations available to commonshareholders . . . . . . . . . . . . . . . . . . . . . . . . . . . . . . . . . . . . . . . . . . $314,449 $289,106 $229,923
Basic weighted average shares outstanding . . . . . . . . . . . . . . . . . . . 101,892 97,606 90,533
Income from continuing operations per share — Basic . . . . . . . . . . $ 3.09 $ 2.96 $ 2.54
Basic Earnings Per Share from discontinued operationsIncome from discontinued operations . . . . . . . . . . . . . . . . . . . . . . . . $ — $ — $ 12,496Less: Income from discontinued operations allocated to
participating securities . . . . . . . . . . . . . . . . . . . . . . . . . . . . . . . . . . — — 42
Income from discontinued operations available to commonshareholders . . . . . . . . . . . . . . . . . . . . . . . . . . . . . . . . . . . . . . . . . . $ — $ — $ 12,454
Basic weighted average shares outstanding . . . . . . . . . . . . . . . . . . . 101,892 97,606 90,533
Income from discontinued operations per share — Basic . . . . . . . . . $ — $ — $ 0.14
Net income per share — Basic . . . . . . . . . . . . . . . . . . . . . . . . . . . . . $ 3.09 $ 2.96 $ 2.68
Diluted Earnings Per Share from continuing operationsIncome from continuing operations available to common
shareholders . . . . . . . . . . . . . . . . . . . . . . . . . . . . . . . . . . . . . . . . . . $314,449 $289,106 $229,923Effect of dilutive stock options and other shares . . . . . . . . . . . . . . . — — 5
Income from continuing operations available to commonshareholders . . . . . . . . . . . . . . . . . . . . . . . . . . . . . . . . . . . . . . . . . . $314,449 $289,106 $229,928
Basic weighted average shares outstanding . . . . . . . . . . . . . . . . . . . 101,892 97,606 90,533Additional dilutive stock options and other shares . . . . . . . . . . . . . . — 2 1,178
Diluted weighted average shares outstanding . . . . . . . . . . . . . . . . . . 101,892 97,608 91,711
Income from continuing operations per share — Diluted . . . . . . . . . $ 3.09 $ 2.96 $ 2.50
Diluted Earnings Per Share from discontinued operationsIncome from discontinued operations available to common
shareholders . . . . . . . . . . . . . . . . . . . . . . . . . . . . . . . . . . . . . . . . . . $ — $ — $ 12,454Effect of dilutive stock options and other shares . . . . . . . . . . . . . . . — — —
Income from discontinued operations available to commonshareholders . . . . . . . . . . . . . . . . . . . . . . . . . . . . . . . . . . . . . . . . . . $ — $ — $ 12,454
Basic weighted average shares outstanding . . . . . . . . . . . . . . . . . . . 101,892 97,606 90,533Additional dilutive stock options and other shares . . . . . . . . . . . . . . — 2 1,178
Diluted weighted average shares outstanding . . . . . . . . . . . . . . . . . . 101,892 97,608 91,711
Income from discontinued operations per share — Diluted . . . . . . . $ — $ — $ 0.14
Net income per share — Diluted . . . . . . . . . . . . . . . . . . . . . . . . . . . . $ 3.09 $ 2.96 $ 2.64
71

ATMOS ENERGY CORPORATION
NOTES TO CONSOLIDATED FINANCIAL STATEMENTS — (Continued)
There were no out-of-the-money options excluded from the computation of diluted earnings per share forthe fiscal year ended September 30, 2013. As of September 30, 2015 and 2014 there were no outstanding options.
2014 Equity Offering
On February 18, 2014, we completed the public offering of 9,200,000 shares of our common stock includingthe underwriters’ exercise of their overallotment option of 1,200,000 shares under our existing shelf registrationstatement. The offering was priced at $44.00 per share and generated net proceeds of $390.2 million, which wereused to repay short-term debt outstanding under our commercial paper program, to fund infrastructure spendingprimarily to enhance the safety and reliability of our system and for general corporate purposes.
Share Repurchase Program
On September 28, 2011 our Board of Directors approved a program authorizing the repurchase of up to fivemillion shares of common stock over a 5-year period. The program is primarily intended to minimize the dilutiveeffect of equity grants under various benefit related incentive compensation plans of the Company. The programmay be terminated or limited at any time. Shares may be repurchased in the open market or in privately nego-tiated transactions in amounts the Company deems appropriate. As of September 30, 2015, a total of 387,991shares had been repurchased for an aggregate value of $12.5 million, with no shares repurchased since the firstquarter of fiscal 2012. The share repurchase program is scheduled to end on September 30, 2016.
5. Debt
Long-term debt
Long-term debt at September 30, 2015 and 2014 consisted of the following:
2015 2014(In thousands)
Unsecured 4.95% Senior Notes, due October 2014 . . . . . . . . . . . . . . . . . . . $ — $ 500,000Unsecured 6.35% Senior Notes, due 2017 . . . . . . . . . . . . . . . . . . . . . . . . . . 250,000 250,000Unsecured 8.50% Senior Notes, due 2019 . . . . . . . . . . . . . . . . . . . . . . . . . . 450,000 450,000Unsecured 5.95% Senior Notes, due 2034 . . . . . . . . . . . . . . . . . . . . . . . . . . 200,000 200,000Unsecured 5.50% Senior Notes, due 2041 . . . . . . . . . . . . . . . . . . . . . . . . . . 400,000 400,000Unsecured 4.15% Senior Notes, due 2043 . . . . . . . . . . . . . . . . . . . . . . . . . . 500,000 500,000Unsecured 4.125% Senior Notes, due 2044 . . . . . . . . . . . . . . . . . . . . . . . . . 500,000 —Medium term Series A notes, 1995-1, 6.67%, due 2025 . . . . . . . . . . . . . . . 10,000 10,000Unsecured 6.75% Debentures, due 2028 . . . . . . . . . . . . . . . . . . . . . . . . . . . 150,000 150,000
Total long-term debt . . . . . . . . . . . . . . . . . . . . . . . . . . . . . . . . . . . . . . . 2,460,000 2,460,000Less:
Original issue discount on unsecured senior notes and debentures . . . . . 4,612 4,014
$2,455,388 $2,455,986
On October 15, 2014, we issued $500 million of 4.125% 30-year unsecured senior notes, which replaced, ona long-term basis, our $500 million unsecured 4.95% senior notes. The effective rate of these notes is 4.086%,after giving effect to the offering costs and the settlement of the associated forward starting interest rate swapsdiscussed in Note 12. The net proceeds of approximately $494 million were used to repay our $500 million4.95% senior unsecured notes at maturity on October 15, 2014.
72

ATMOS ENERGY CORPORATION
NOTES TO CONSOLIDATED FINANCIAL STATEMENTS — (Continued)
Short-term debt
Our short-term debt is utilized to fund ongoing working capital needs, such as our seasonal requirements forgas supply, general corporate liquidity and capital expenditures. Our short-term borrowings typically reach theirhighest levels in the winter months.
We currently finance our short-term borrowing requirements through a combination of a $1.25 billioncommercial paper program, four committed revolving credit facilities and one uncommitted revolving creditfacility, with a total availability from third-party lenders of approximately $1.3 billion of working capital fund-ing. At September 30, 2015 and 2014, there was $457.9 million and $196.7 million outstanding under our com-mercial paper program with weighted average interest rates of 0.42% and 0.23%, with average maturities of lessthan one month. We also use intercompany credit facilities to supplement the funding provided by these third-party committed credit facilities. These facilities are described in greater detail below.
Regulated Operations
We fund our regulated operations as needed, primarily through our commercial paper program and threecommitted revolving credit facilities with third-party lenders that provide approximately $1.3 billion of workingcapital funding. The first facility is a five-year $1.25 billion unsecured facility with an accordion feature, which,if utilized would increase the borrowing capacity to $1.5 billion. On September 25, 2015, we terminated ourexisting $1.25 billion credit facility and entered into a new five-year $1.25 billion credit facility with sub-stantially the same terms. The new facility also retains the $250 million accordion feature, which allows for anincrease in the total committed loan amount to $1.5 billion. The credit facility bears interest at a base rate or at aLIBOR-based rate for the applicable interest period, plus a spread ranging from zero percent to 1.25 percent,based on the Company’s credit ratings. This credit facility serves primarily as a backup liquidity facility for ourcommercial paper program. At September 30, 2015, there were no borrowings under this facility, but we had$457.9 million of commercial paper outstanding leaving $792.1 million available.
The second facility is a $25 million unsecured facility that bears interest at a daily negotiated rate, generallybased on the Federal Funds rate plus a variable margin. This facility was renewed on April 1, 2015. At Sep-tember 30, 2015, there were no borrowings outstanding under this facility.
The third facility which was renewed on September 30, 2015 for $10 million is a committed revolving creditfacility, used primarily to issue letters of credit and bears interest at a LIBOR-based rate plus 1.5 percent. AtSeptember 30, 2015, there were no borrowings outstanding under this credit facility; however, letters of credittotaling $5.9 million had been issued under the facility at September 30, 2015, which reduced the amount avail-able by a corresponding amount.
The availability of funds under these credit facilities is subject to conditions specified in the respectivecredit agreements, all of which we currently satisfy. These conditions include our compliance with financialcovenants and the continued accuracy of representations and warranties contained in these agreements. We arerequired by the financial covenants in our five-year $1.25 billion unsecured facility to maintain, at the end ofeach fiscal quarter, a ratio of total debt to total capitalization of no greater than 70 percent. At September 30,2015, our total-debt-to-total-capitalization ratio, as defined, was 49 percent. In addition, both the interest marginover the Eurodollar rate and the fee that we pay on unused amounts under each of these facilities are subject toadjustment depending upon our credit ratings.
In addition to these third-party facilities, our regulated operations have a $500 million intercompany revolv-ing credit facility with AEH. This facility bears interest at the lower of (i) the Eurodollar rate under the five-yearrevolving credit facility or (ii) the lowest rate outstanding under the commercial paper program. Applicable stateregulatory commissions have approved our use of this facility through December 31, 2015. We intend to seekrenewal of this facility during the first quarter of fiscal 2016. There was $325.0 million outstanding under thisfacility at September 30, 2015.
73

ATMOS ENERGY CORPORATION
NOTES TO CONSOLIDATED FINANCIAL STATEMENTS — (Continued)
Nonregulated Operations
Atmos Energy Marketing, LLC (AEM), which is wholly owned by AEH, has one uncommitted $25 million364-day bilateral credit facility and one committed $15 million 364-day bilateral credit facility that expire inDecember 2015. These facilities are used primarily to issue letters of credit. Due to outstanding letters of credit,the total amount available to us under these bilateral credit facilities was $36.1 million at September 30, 2015.
AEH has a $500 million intercompany demand credit facility with AEC. This facility bears interest at a rateequal to the greater of (i) the one-month LIBOR rate plus 3.00 percent. Applicable state regulatory commissionshave approved our use of this facility through December 31, 2015. We intend to seek renewal of this facilityduring the first quarter of fiscal 2016. There were no borrowings outstanding under this facility at September 30,2015.
Shelf Registration
We filed a shelf registration statement with the Securities and Exchange Commission (SEC) on March 28,2013, that originally permitted us to issue a total of $1.75 billion in common stock and/or debt securities. OnFebruary 18, 2014, we completed the public offering of 9,200,000 shares of our common stock, which generatednet proceeds of $390.2 million. After giving effect to this issuance and the aforementioned $500 million seniornote issuance completed in October 2014, $845 million of securities remained available for issuance under theshelf registration statement until March 28, 2016.
Debt Covenants
In addition to the financial covenants described above, our credit facilities and public indentures containusual and customary covenants for our business, including covenants substantially limiting liens, substantial assetsales and mergers.
Additionally, our public debt indentures relating to our senior notes and debentures, as well as our revolvingcredit agreements, each contain a default provision that is triggered if outstanding indebtedness arising out of anyother credit agreements in amounts ranging from in excess of $15 million to in excess of $100 million becomesdue by acceleration or is not paid at maturity.
We were in compliance with all of our debt covenants as of September 30, 2015. If we were unable tocomply with our debt covenants, we would likely be required to repay our outstanding balances on demand, pro-vide additional collateral or take other corrective actions.
Maturities of long-term debt at September 30, 2015 were as follows (in thousands):
2016 . . . . . . . . . . . . . . . . . . . . . . . . . . . . . . . . . . . . . . . . . . . . . . . . . . . . . . . . . . . . . . . . . . . . $ —2017 . . . . . . . . . . . . . . . . . . . . . . . . . . . . . . . . . . . . . . . . . . . . . . . . . . . . . . . . . . . . . . . . . . . . 250,0002018 . . . . . . . . . . . . . . . . . . . . . . . . . . . . . . . . . . . . . . . . . . . . . . . . . . . . . . . . . . . . . . . . . . . . —2019 . . . . . . . . . . . . . . . . . . . . . . . . . . . . . . . . . . . . . . . . . . . . . . . . . . . . . . . . . . . . . . . . . . . . 450,0002020 . . . . . . . . . . . . . . . . . . . . . . . . . . . . . . . . . . . . . . . . . . . . . . . . . . . . . . . . . . . . . . . . . . . . —Thereafter . . . . . . . . . . . . . . . . . . . . . . . . . . . . . . . . . . . . . . . . . . . . . . . . . . . . . . . . . . . . . . . 1,760,000
$2,460,000
6. Retirement and Post-Retirement Employee Benefit Plans
We have both funded and unfunded noncontributory defined benefit plans that together cover most of ouremployees. We also maintain post-retirement plans that provide health care benefits to retired employees.Finally, we sponsor defined contribution plans that cover substantially all employees. These plans are discussedin further detail below.
74

ATMOS ENERGY CORPORATION
NOTES TO CONSOLIDATED FINANCIAL STATEMENTS — (Continued)
As a rate regulated entity, we generally recover our pension costs in our rates over a period of up to15 years. The amounts that have not yet been recognized in net periodic pension cost that have been recorded asregulatory assets are as follows:
DefinedBenefits Plans
SupplementalExecutive
Retirement PlansPostretirement
Plans Total(In thousands)
September 30, 2015Unrecognized transition obligation . . . $ — $ — $ 82 $ 82Unrecognized prior service credit . . . . (1,735) — (4,524) (6,259)Unrecognized actuarial loss . . . . . . . . 120,948 36,915 (47,149) 110,714
$119,213 $36,915 $(51,591) $104,537
September 30, 2014Unrecognized transition obligation . . . $ — $ — $ 354 $ 354Unrecognized prior service credit . . . . (1,927) — (6,168) (8,095)Unrecognized actuarial loss . . . . . . . . 109,767 34,447 7,531 151,745
$107,840 $34,447 $ 1,717 $144,004
Defined Benefit Plans
Employee Pension Plans
Prior to December 31, 2014, we maintained two defined benefit plans: the Atmos Energy Corporation Pen-sion Account Plan (the Plan) and the Atmos Energy Corporation Retirement Plan for Mississippi Valley GasUnion Employees (the Union Plan) (collectively referred to as the Plans). The assets of the Plans were heldwithin the Atmos Energy Corporation Master Retirement Trust (the Master Trust). In June 2014, active collec-tively bargained employees of Atmos Energy’s Mississippi Division voted to decertify the union. As a result ofthis vote, effective January 1, 2015, active participants of the Union Plan became participants in the Plan. Open-ing account balances were established at the time of transfer equal to the present value of their respective accruedbenefits under the Union Plan at December 31, 2014. Additionally, effective January 1, 2015, current retirees inthe Union Plan as well as those participants who terminated and were vested in the Union Plan were transferredto the Plan with the same provisions that were in place at the time of their retirement or termination.
The Plan is a cash balance pension plan that was established effective January 1999 and covers most of theemployees of Atmos Energy’s regulated operations. Opening account balances were established for participantsas of January 1999 equal to the present value of their respective accrued benefits under the pension plans whichwere previously in effect as of December 31, 1998. The Plan credits an allocation to each participant’s account atthe end of each year according to a formula based on the participant’s age, service and total pay (excludingincentive pay).
The Plan also provides for an additional annual allocation based upon a participant’s age as of January 1, 1999for those participants who were participants in the prior pension plans. The Plan credited this additional allocationeach year through December 31, 2008. In addition, at the end of each year, a participant’s account is credited withinterest on the employee’s prior year account balance. A special grandfathered benefit also applied throughDecember 31, 2008, for participants who were at least age 50 as of January 1, 1999 and who were participants inone of the prior plans on December 31, 1998. Participants are fully vested in their account balances after three yearsof service and may choose to receive their account balances as a lump sum or an annuity. In August 2010, the Boardof Directors of Atmos Energy approved a proposal to close the Plan to new participants effective October 1, 2010.Additionally, employees participating in the Plan as of October 1, 2010 were allowed to make a one-time election tomigrate from the Plan into our defined contribution plan, which was enhanced, effective January 1, 2011.
75

ATMOS ENERGY CORPORATION
NOTES TO CONSOLIDATED FINANCIAL STATEMENTS — (Continued)
Generally, our funding policy is to contribute annually an amount in accordance with the requirements ofthe Employee Retirement Income Security Act of 1974, including the funding requirements under the PensionProtection Act of 2006 (PPA). However, additional voluntary contributions are made from time to time asconsidered necessary. Contributions are intended to provide not only for benefits attributed to service to date butalso for those expected to be earned in the future.
During fiscal 2015 and 2014 we contributed $38.0 million and $27.1 million in cash to the Plans to achievea desired level of funding while maximizing the tax deductibility of this payment. Based upon market conditionsat September 30, 2015, the current funded position of the Plans and the funding requirements under the PPA, wedo not anticipate a minimum required contribution for fiscal 2016. However, we may consider whether a volun-tary contribution is prudent to maintain certain funding levels.
We make investment decisions and evaluate performance of the assets in the Master Trust on a medium-term horizon of at least three to five years. We also consider our current financial status when making recom-mendations and decisions regarding the Master Trust’s assets. Finally, we strive to ensure the Master Trust’sassets are appropriately invested to maintain an acceptable level of risk and meet the Master Trust’s long-termasset investment policy adopted by the Board of Directors.
To achieve these objectives, we invest the Master Trust’s assets in equity securities, fixed income securities,interests in commingled pension trust funds, other investment assets and cash and cash equivalents. Investmentsin equity securities are diversified among the market’s various subsectors in an effort to diversify risk and max-imize returns. Fixed income securities are invested in investment grade securities. Cash equivalents are investedin securities that either are short term (less than 180 days) or readily convertible to cash with modest risk.
The following table presents asset allocation information for the Master Trust as of September 30, 2015 and2014.
TargetedAllocation Range
ActualAllocation
September 30Security Class 2015 2014
Domestic equities . . . . . . . . . . . . . . . . . . . . . . . . . . . . . . . . . . . . . . . . . . 35%-55% 41.3% 44.9%International equities . . . . . . . . . . . . . . . . . . . . . . . . . . . . . . . . . . . . . . . 10%-20% 14.9% 15.3%Fixed income . . . . . . . . . . . . . . . . . . . . . . . . . . . . . . . . . . . . . . . . . . . . . 5%-30% 11.0% 9.7%Company stock . . . . . . . . . . . . . . . . . . . . . . . . . . . . . . . . . . . . . . . . . . . 0%-15% 15.2% 12.9%Other assets . . . . . . . . . . . . . . . . . . . . . . . . . . . . . . . . . . . . . . . . . . . . . . 0%-20% 17.6% 17.2%
At September 30, 2015 and 2014, the Plan held 1,169,700 shares of our common stock, which represented15.2 percent of total Plan assets and 12.9 percent of total Master Trust assets. These shares generated dividendincome for the Plan of approximately $1.8 million and $1.7 million during fiscal 2015 and 2014.
Our employee pension plan expenses and liabilities are determined on an actuarial basis and are affected bynumerous assumptions and estimates including the market value of plan assets, estimates of the expected returnon plan assets and assumed discount rates and demographic data. We review the estimates and assumptionsunderlying our employee pension plans annually based upon a September 30 measurement date. The develop-ment of our assumptions is fully described in our significant accounting policies in Note 2. The actuarial assump-tions used to determine the pension liability for the Plans were determined as of September 30, 2015 and 2014and the actuarial assumptions used to determine the net periodic pension cost for the Plans were determined as ofSeptember 30, 2014, 2013 and 2012. In October 2014, the Society of Actuaries released its final report onmortality tables and the mortality improvement scale to reflect increasing life expectancies in the UnitedStates. On October 8, 2015, the Society of Actuaries issued an additional report related to mortality tables and themortality improvement scale. As of September 30, 2015, we updated our assumed mortality rates to incorporateboth new sets of mortality tables issued by the Society of Actuaries.
76

ATMOS ENERGY CORPORATION
NOTES TO CONSOLIDATED FINANCIAL STATEMENTS — (Continued)
Additional assumptions are presented in the following table:
PensionLiability Pension Cost
2015 2014 2015 2014 2013
Discount rate . . . . . . . . . . . . . . . . . . . . . . . . . . . . . . . . . . . . . . . . 4.55% 4.43% 4.43% 4.95% 4.04%Rate of compensation increase . . . . . . . . . . . . . . . . . . . . . . . . . . . 3.50% 3.50% 3.50% 3.50% 3.50%Expected return on plan assets . . . . . . . . . . . . . . . . . . . . . . . . . . . 7.00% 7.25% 7.25% 7.25% 7.75%
The following table presents the Plans’ accumulated benefit obligation, projected benefit obligation andfunded status as of September 30, 2015 and 2014:
2015 2014(In thousands)
Accumulated benefit obligation . . . . . . . . . . . . . . . . . . . . . . . . . . . . . . . . . . . . . . . . . . . . $485,921 $466,182
Change in projected benefit obligation:Benefit obligation at beginning of year . . . . . . . . . . . . . . . . . . . . . . . . . . . . . . . . . . . . . . $493,594 $455,799Service cost . . . . . . . . . . . . . . . . . . . . . . . . . . . . . . . . . . . . . . . . . . . . . . . . . . . . . . . . . . . 16,231 15,345Interest cost . . . . . . . . . . . . . . . . . . . . . . . . . . . . . . . . . . . . . . . . . . . . . . . . . . . . . . . . . . . 21,850 22,330Actuarial (gain) loss . . . . . . . . . . . . . . . . . . . . . . . . . . . . . . . . . . . . . . . . . . . . . . . . . . . . 7,420 26,611Benefits paid . . . . . . . . . . . . . . . . . . . . . . . . . . . . . . . . . . . . . . . . . . . . . . . . . . . . . . . . . . (30,496) (24,519)Plan amendments . . . . . . . . . . . . . . . . . . . . . . . . . . . . . . . . . . . . . . . . . . . . . . . . . . . . . . . — (1,972)
Benefit obligation at end of year . . . . . . . . . . . . . . . . . . . . . . . . . . . . . . . . . . . . . . . . . . . 508,599 493,594Change in plan assets:
Fair value of plan assets at beginning of year . . . . . . . . . . . . . . . . . . . . . . . . . . . . . . . . . 434,767 396,887Actual return on plan assets . . . . . . . . . . . . . . . . . . . . . . . . . . . . . . . . . . . . . . . . . . . . . . 8,661 35,289Employer contributions . . . . . . . . . . . . . . . . . . . . . . . . . . . . . . . . . . . . . . . . . . . . . . . . . . 38,000 27,110Benefits paid . . . . . . . . . . . . . . . . . . . . . . . . . . . . . . . . . . . . . . . . . . . . . . . . . . . . . . . . . . (30,496) (24,519)
Fair value of plan assets at end of year . . . . . . . . . . . . . . . . . . . . . . . . . . . . . . . . . . . . . . 450,932 434,767
Reconciliation:Funded status . . . . . . . . . . . . . . . . . . . . . . . . . . . . . . . . . . . . . . . . . . . . . . . . . . . . . . . . . . . . (57,667) (58,827)Unrecognized prior service cost . . . . . . . . . . . . . . . . . . . . . . . . . . . . . . . . . . . . . . . . . . . . . — —Unrecognized net loss . . . . . . . . . . . . . . . . . . . . . . . . . . . . . . . . . . . . . . . . . . . . . . . . . . . . . — —
Net amount recognized . . . . . . . . . . . . . . . . . . . . . . . . . . . . . . . . . . . . . . . . . . . . . . . . . . . . $ (57,667) $ (58,827)
Net periodic pension cost for the Plans for fiscal 2015, 2014 and 2013 is recorded as operating expense andincluded the following components:
Fiscal Year Ended September 302015 2014 2013
(In thousands)
Components of net periodic pension cost:Service cost . . . . . . . . . . . . . . . . . . . . . . . . . . . . . . . . . . . . . . . . . $ 16,231 $ 15,345 $ 17,754Interest cost . . . . . . . . . . . . . . . . . . . . . . . . . . . . . . . . . . . . . . . . . 21,850 22,330 19,334Expected return on assets . . . . . . . . . . . . . . . . . . . . . . . . . . . . . . . (25,744) (23,601) (22,955)Amortization of prior service credit . . . . . . . . . . . . . . . . . . . . . . . (192) (136) (141)Recognized actuarial loss . . . . . . . . . . . . . . . . . . . . . . . . . . . . . . . 13,322 13,777 19,066
Net periodic pension cost . . . . . . . . . . . . . . . . . . . . . . . . . . . . . $ 25,467 $ 27,715 $ 33,058
77

ATMOS ENERGY CORPORATION
NOTES TO CONSOLIDATED FINANCIAL STATEMENTS — (Continued)
The following table sets forth by level, within the fair value hierarchy, the Master Trust’s assets at fair valueas of September 30, 2015 and 2014. As required by authoritative accounting literature, assets are categorized intheir entirety based on the lowest level of input that is significant to the fair value measurement. The methodsused to determine fair value for the assets held by the Master Trust are fully described in Note 2. In addition tothe assets shown below, the Master Trust had net accounts receivable of $2.4 million and $2.7 million at Sep-tember 30, 2015 and 2014 which materially approximates fair value due to the short-term nature of these assets.
Assets at Fair Value as of September 30, 2015Level 1 Level 2 Level 3 Total
(In thousands)
Investments:Common stocks . . . . . . . . . . . . . . . . . . . . . . . . . . . . . . . . . . . . . $159,304 $ — $ — $159,304Money market funds . . . . . . . . . . . . . . . . . . . . . . . . . . . . . . . . . . — 11,787 — 11,787Registered investment companies:
Domestic funds . . . . . . . . . . . . . . . . . . . . . . . . . . . . . . . . . . . . 33,312 — — 33,312International funds . . . . . . . . . . . . . . . . . . . . . . . . . . . . . . . . . 48,648 — — 48,648
Common/collective trusts — domestic funds . . . . . . . . . . . . . . — 93,081 — 93,081Government securities:
Mortgage-backed securities . . . . . . . . . . . . . . . . . . . . . . . . . . — 14,359 — 14,359U.S. treasuries . . . . . . . . . . . . . . . . . . . . . . . . . . . . . . . . . . . . . 5,279 805 — 6,084
Corporate bonds . . . . . . . . . . . . . . . . . . . . . . . . . . . . . . . . . . . . . — 28,973 — 28,973Limited partnerships . . . . . . . . . . . . . . . . . . . . . . . . . . . . . . . . . . — 52,996 — 52,996
Total investments at fair value . . . . . . . . . . . . . . . . . . . . . . . . . . . . $246,543 $202,001 $ — $448,544
Assets at Fair Value as of September 30, 2014Level 1 Level 2 Level 3 Total
(In thousands)
Investments:Common stocks . . . . . . . . . . . . . . . . . . . . . . . . . . . . . . . . . . . . . $155,107 $ — $ — $155,107Money market funds . . . . . . . . . . . . . . . . . . . . . . . . . . . . . . . . . . — 11,226 — 11,226Registered investment companies:
Domestic funds . . . . . . . . . . . . . . . . . . . . . . . . . . . . . . . . . . . . 33,266 — — 33,266International funds . . . . . . . . . . . . . . . . . . . . . . . . . . . . . . . . . 48,134 — — 48,134
Common/collective trusts — domestic funds . . . . . . . . . . . . . . — 91,792 — 91,792Government securities:
Mortgage-backed securities . . . . . . . . . . . . . . . . . . . . . . . . . . — 12,520 — 12,520U.S. treasuries . . . . . . . . . . . . . . . . . . . . . . . . . . . . . . . . . . . . . 3,117 562 — 3,679
Corporate bonds . . . . . . . . . . . . . . . . . . . . . . . . . . . . . . . . . . . . . — 25,734 — 25,734Limited partnerships . . . . . . . . . . . . . . . . . . . . . . . . . . . . . . . . . . — 50,496 — 50,496Real estate . . . . . . . . . . . . . . . . . . . . . . . . . . . . . . . . . . . . . . . . . . — — 155 155
Total investments at fair value . . . . . . . . . . . . . . . . . . . . . . . . . . . . $239,624 $192,330 $155 $432,109
During 2015, the Company determined that a 2014 investment in the registered investment companies -domestic funds should have been classified as common/collective trusts - domestic funds. The amount has beenrecast in the above table.
78

ATMOS ENERGY CORPORATION
NOTES TO CONSOLIDATED FINANCIAL STATEMENTS — (Continued)
Supplemental Executive Retirement Plans
We have three nonqualified supplemental plans which provide additional pension, disability and death bene-fits to our officers, division presidents and certain other employees of the Company.
The first plan is referred to as the Supplemental Executive Benefits Plan (SEBP) and covers our officers, divi-sion presidents and certain other employees of the Company who were employed on or before August 12, 1998. TheSEBP is a defined benefit arrangement which provides a benefit equal to 75 percent of covered compensation underwhich benefits paid from the underlying qualified defined benefit plan are an offset to the benefits under the SEBP.
In August 1998, we adopted the Supplemental Executive Retirement Plan (SERP) (formerly known as thePerformance-Based Supplemental Executive Benefits Plan), which covers all officers or division presidentsselected to participate in the plan between August 12, 1998 and August 5, 2009, any corporate officer who maybe appointed to the Management Committee after August 5, 2009 and any other employees selected by our Boardof Directors at its discretion. The SERP is a defined benefit arrangement which provides a benefit equal to 60percent of covered compensation under which benefits paid from the underlying qualified defined benefit planare an offset to the benefits under the SERP.
Effective August 5, 2009, we adopted a new defined benefit Supplemental Executive Retirement Plan (the2009 SERP), for corporate officers (other than such officer who is appointed as a member of the Company’sManagement Committee), division presidents or any other employees selected at the discretion of the Board.Under the 2009 SERP, a nominal account has been established for each participant, to which the Company con-tributes at the end of each calendar year an amount equal to ten percent of the total of each participant’s basesalary and cash incentive compensation earned during each prior calendar year, beginning December 31, 2009.The benefits vest after three years of service and attainment of age 55 and earn interest credits at the same annualrate as the Company’s Pension Account Plan (currently 4.69%).
On October 2, 2013, due to the retirement of one of our executives, we recognized a settlement loss of $4.5million associated with our SEBP and made a $16.8 million benefit payment.
On April 1, 2013, due to the retirement of certain executives, we recognized a settlement loss of $3.2 millionassociated with the supplemental plans and revalued the net periodic pension cost for the remainder of fiscal 2013.The revaluation of the net periodic pension cost resulted in an increase in the discount rate, effective April 1, 2013,to 4.21 percent, which reduced our net periodic pension cost by approximately $0.1 million for the remainder of thefiscal year.
Similar to our employee pension plans, we review the estimates and assumptions underlying our supple-mental plans annually based upon a September 30 measurement date using the same techniques as our employeepension plans. The actuarial assumptions used to determine the pension liability for the supplemental plans weredetermined as of September 30, 2015 and 2014 and the actuarial assumptions used to determine the net periodicpension cost for the supplemental plans were determined as of September 30, 2014, 2013 and 2012. Theseassumptions are presented in the following table:
PensionLiability Pension Cost
2015 2014 2015 2014 2013
Discount rate . . . . . . . . . . . . . . . . . . . . . . . . . . . . . . . . . . . . . . . . . . . . . . . . 4.55% 4.43% 4.43% 4.95% 4.04%(1)
Rate of compensation increase . . . . . . . . . . . . . . . . . . . . . . . . . . . . . . . . . . . 3.50% 3.50% 3.50% 3.50% 3.50%
(1) The discount rate for the supplemental plans increased from 4.04% to 4.21% effective April 1, 2013 due to asettlement loss recorded in fiscal 2013.
79

ATMOS ENERGY CORPORATION
NOTES TO CONSOLIDATED FINANCIAL STATEMENTS — (Continued)
The following table presents the supplemental plans’ accumulated benefit obligation, projected benefit obli-gation and funded status as of September 30, 2015 and 2014:
2015 2014(In thousands)
Accumulated benefit obligation . . . . . . . . . . . . . . . . . . . . . . . . . . . . . . . . . . . $ 118,835 $ 106,276
Change in projected benefit obligation:Benefit obligation at beginning of year . . . . . . . . . . . . . . . . . . . . . . . . . . . . $ 113,219 $ 117,080Service cost . . . . . . . . . . . . . . . . . . . . . . . . . . . . . . . . . . . . . . . . . . . . . . . . . . 3,971 3,607Interest cost . . . . . . . . . . . . . . . . . . . . . . . . . . . . . . . . . . . . . . . . . . . . . . . . . . 4,943 4,966Actuarial (gain) loss . . . . . . . . . . . . . . . . . . . . . . . . . . . . . . . . . . . . . . . . . . . 4,811 9,468Benefits paid . . . . . . . . . . . . . . . . . . . . . . . . . . . . . . . . . . . . . . . . . . . . . . . . . (4,551) (5,085)Settlements . . . . . . . . . . . . . . . . . . . . . . . . . . . . . . . . . . . . . . . . . . . . . . . . . . — (16,817)
Benefit obligation at end of year . . . . . . . . . . . . . . . . . . . . . . . . . . . . . . . . . 122,393 113,219Change in plan assets:
Fair value of plan assets at beginning of year . . . . . . . . . . . . . . . . . . . . . . . — —Employer contribution . . . . . . . . . . . . . . . . . . . . . . . . . . . . . . . . . . . . . . . . . 4,551 21,902Benefits paid . . . . . . . . . . . . . . . . . . . . . . . . . . . . . . . . . . . . . . . . . . . . . . . . . (4,551) (5,085)Settlements . . . . . . . . . . . . . . . . . . . . . . . . . . . . . . . . . . . . . . . . . . . . . . . . . . — (16,817)
Fair value of plan assets at end of year . . . . . . . . . . . . . . . . . . . . . . . . . . . . . — —
Reconciliation:Funded status . . . . . . . . . . . . . . . . . . . . . . . . . . . . . . . . . . . . . . . . . . . . . . . . (122,393) (113,219)Unrecognized prior service cost . . . . . . . . . . . . . . . . . . . . . . . . . . . . . . . . . . — —Unrecognized net loss . . . . . . . . . . . . . . . . . . . . . . . . . . . . . . . . . . . . . . . . . . — —
Accrued pension cost . . . . . . . . . . . . . . . . . . . . . . . . . . . . . . . . . . . . . . . . . . $(122,393) $(113,219)
Assets for the supplemental plans are held in separate rabbi trusts. At September 30, 2015 and 2014, assetsheld in the rabbi trusts consisted of available-for-sale securities of $41.7 million and $46.2 million, which areincluded in our fair value disclosures in Note 14.
Net periodic pension cost for the supplemental plans for fiscal 2015, 2014 and 2013 is recorded as operatingexpense and included the following components:
Fiscal Year Ended September 302015 2014 2013
(In thousands)
Components of net periodic pension cost:Service cost . . . . . . . . . . . . . . . . . . . . . . . . . . . . . . . . . . . . . . . . . . . $ 3,971 $ 3,607 $ 3,039Interest cost . . . . . . . . . . . . . . . . . . . . . . . . . . . . . . . . . . . . . . . . . . . 4,943 4,966 4,755Amortization of transition asset . . . . . . . . . . . . . . . . . . . . . . . . . . . . — — —Amortization of prior service cost . . . . . . . . . . . . . . . . . . . . . . . . . . — — —Recognized actuarial loss . . . . . . . . . . . . . . . . . . . . . . . . . . . . . . . . . 2,343 1,948 2,918Settlements . . . . . . . . . . . . . . . . . . . . . . . . . . . . . . . . . . . . . . . . . . . . — 4,539 3,160
Net periodic pension cost . . . . . . . . . . . . . . . . . . . . . . . . . . . . . . . $11,257 $15,060 $13,872
80
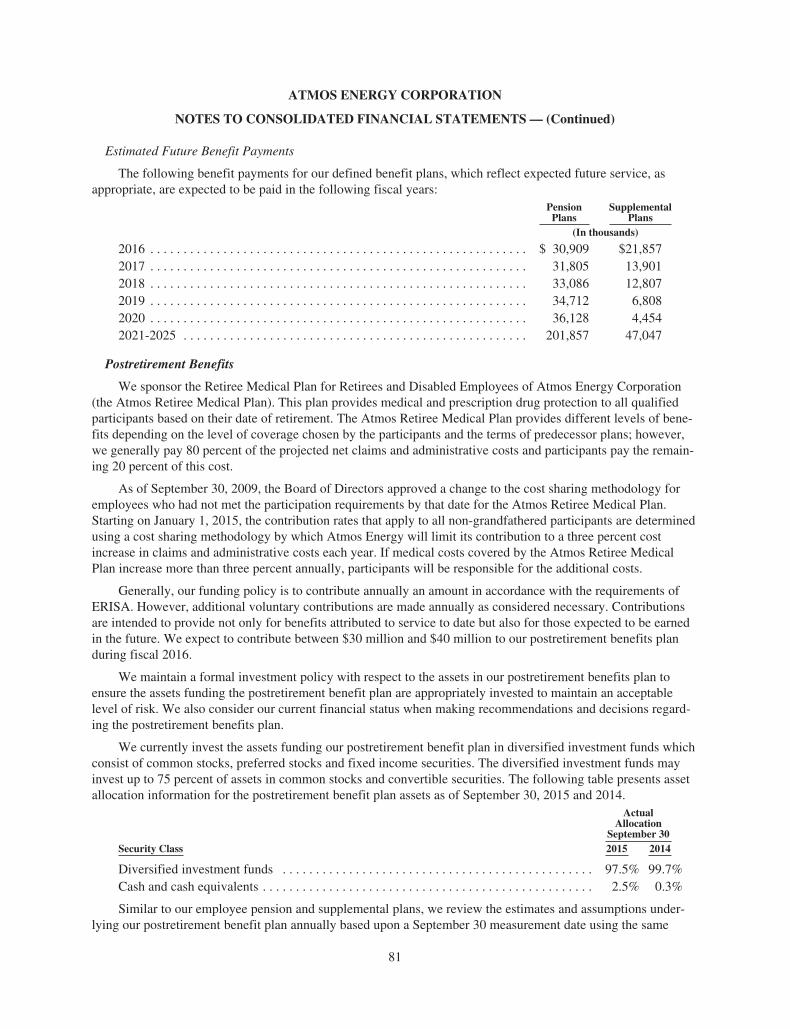
ATMOS ENERGY CORPORATION
NOTES TO CONSOLIDATED FINANCIAL STATEMENTS — (Continued)
Estimated Future Benefit Payments
The following benefit payments for our defined benefit plans, which reflect expected future service, asappropriate, are expected to be paid in the following fiscal years:
PensionPlans
SupplementalPlans
(In thousands)
2016 . . . . . . . . . . . . . . . . . . . . . . . . . . . . . . . . . . . . . . . . . . . . . . . . . . . . . . . . . $ 30,909 $21,8572017 . . . . . . . . . . . . . . . . . . . . . . . . . . . . . . . . . . . . . . . . . . . . . . . . . . . . . . . . . 31,805 13,9012018 . . . . . . . . . . . . . . . . . . . . . . . . . . . . . . . . . . . . . . . . . . . . . . . . . . . . . . . . . 33,086 12,8072019 . . . . . . . . . . . . . . . . . . . . . . . . . . . . . . . . . . . . . . . . . . . . . . . . . . . . . . . . . 34,712 6,8082020 . . . . . . . . . . . . . . . . . . . . . . . . . . . . . . . . . . . . . . . . . . . . . . . . . . . . . . . . . 36,128 4,4542021-2025 . . . . . . . . . . . . . . . . . . . . . . . . . . . . . . . . . . . . . . . . . . . . . . . . . . . . 201,857 47,047
Postretirement Benefits
We sponsor the Retiree Medical Plan for Retirees and Disabled Employees of Atmos Energy Corporation(the Atmos Retiree Medical Plan). This plan provides medical and prescription drug protection to all qualifiedparticipants based on their date of retirement. The Atmos Retiree Medical Plan provides different levels of bene-fits depending on the level of coverage chosen by the participants and the terms of predecessor plans; however,we generally pay 80 percent of the projected net claims and administrative costs and participants pay the remain-ing 20 percent of this cost.
As of September 30, 2009, the Board of Directors approved a change to the cost sharing methodology foremployees who had not met the participation requirements by that date for the Atmos Retiree Medical Plan.Starting on January 1, 2015, the contribution rates that apply to all non-grandfathered participants are determinedusing a cost sharing methodology by which Atmos Energy will limit its contribution to a three percent costincrease in claims and administrative costs each year. If medical costs covered by the Atmos Retiree MedicalPlan increase more than three percent annually, participants will be responsible for the additional costs.
Generally, our funding policy is to contribute annually an amount in accordance with the requirements ofERISA. However, additional voluntary contributions are made annually as considered necessary. Contributionsare intended to provide not only for benefits attributed to service to date but also for those expected to be earnedin the future. We expect to contribute between $30 million and $40 million to our postretirement benefits planduring fiscal 2016.
We maintain a formal investment policy with respect to the assets in our postretirement benefits plan toensure the assets funding the postretirement benefit plan are appropriately invested to maintain an acceptablelevel of risk. We also consider our current financial status when making recommendations and decisions regard-ing the postretirement benefits plan.
We currently invest the assets funding our postretirement benefit plan in diversified investment funds whichconsist of common stocks, preferred stocks and fixed income securities. The diversified investment funds mayinvest up to 75 percent of assets in common stocks and convertible securities. The following table presents assetallocation information for the postretirement benefit plan assets as of September 30, 2015 and 2014.
ActualAllocation
September 30Security Class 2015 2014
Diversified investment funds . . . . . . . . . . . . . . . . . . . . . . . . . . . . . . . . . . . . . . . . . . . . . . . 97.5% 99.7%Cash and cash equivalents . . . . . . . . . . . . . . . . . . . . . . . . . . . . . . . . . . . . . . . . . . . . . . . . . . 2.5% 0.3%
Similar to our employee pension and supplemental plans, we review the estimates and assumptions under-lying our postretirement benefit plan annually based upon a September 30 measurement date using the same
81

ATMOS ENERGY CORPORATION
NOTES TO CONSOLIDATED FINANCIAL STATEMENTS — (Continued)
techniques as our employee pension plans. The actuarial assumptions used to determine the pension liability forour postretirement plan were determined as of September 30, 2015 and 2014 and the actuarial assumptions usedto determine the net periodic pension cost for the postretirement plan were determined as of September 30, 2014,2013 and 2012. The assumptions are presented in the following table:
PostretirementLiability Postretirement Cost
2015 2014 2015 2014 2013
Discount rate . . . . . . . . . . . . . . . . . . . . . . . . . . . . . . . . . . . . . . 4.55% 4.43% 4.43% 4.95% 4.04%Expected return on plan assets . . . . . . . . . . . . . . . . . . . . . . . . 4.45% 4.60% 4.60% 4.60% 4.70%Initial trend rate . . . . . . . . . . . . . . . . . . . . . . . . . . . . . . . . . . . . 7.50% 7.50% 7.50% 8.00% 8.00%Ultimate trend rate . . . . . . . . . . . . . . . . . . . . . . . . . . . . . . . . . . 5.00% 5.00% 5.00% 5.00% 5.00%Ultimate trend reached in . . . . . . . . . . . . . . . . . . . . . . . . . . . . 2021 2020 2020 2020 2019
The following table presents the postretirement plan’s benefit obligation and funded status as of Sep-tember 30, 2015 and 2014:
2015 2014(In thousands)
Change in benefit obligation:Benefit obligation at beginning of year . . . . . . . . . . . . . . . . . . . . . . . . . . . . $ 315,118 $ 312,148Service cost . . . . . . . . . . . . . . . . . . . . . . . . . . . . . . . . . . . . . . . . . . . . . . . . . . 15,583 16,784Interest cost . . . . . . . . . . . . . . . . . . . . . . . . . . . . . . . . . . . . . . . . . . . . . . . . . . 14,385 15,951Plan participants’ contributions . . . . . . . . . . . . . . . . . . . . . . . . . . . . . . . . . . 4,563 4,435Actuarial (gain) loss . . . . . . . . . . . . . . . . . . . . . . . . . . . . . . . . . . . . . . . . . . . (69,962) (18,963)Benefits paid . . . . . . . . . . . . . . . . . . . . . . . . . . . . . . . . . . . . . . . . . . . . . . . . . (12,508) (13,580)Plan amendments . . . . . . . . . . . . . . . . . . . . . . . . . . . . . . . . . . . . . . . . . . . . . — (1,657)
Benefit obligation at end of year . . . . . . . . . . . . . . . . . . . . . . . . . . . . . . . . . 267,179 315,118Change in plan assets:
Fair value of plan assets at beginning of year . . . . . . . . . . . . . . . . . . . . . . . 134,821 106,413Actual return on plan assets . . . . . . . . . . . . . . . . . . . . . . . . . . . . . . . . . . . . . (8,851) 14,003Employer contributions . . . . . . . . . . . . . . . . . . . . . . . . . . . . . . . . . . . . . . . . 19,984 23,550Plan participants’ contributions . . . . . . . . . . . . . . . . . . . . . . . . . . . . . . . . . . 4,563 4,435Benefits paid . . . . . . . . . . . . . . . . . . . . . . . . . . . . . . . . . . . . . . . . . . . . . . . . . (12,508) (13,580)
Fair value of plan assets at end of year . . . . . . . . . . . . . . . . . . . . . . . . . . . . . 138,009 134,821
Reconciliation:Funded status . . . . . . . . . . . . . . . . . . . . . . . . . . . . . . . . . . . . . . . . . . . . . . . . . . (129,170) (180,297)Unrecognized transition obligation . . . . . . . . . . . . . . . . . . . . . . . . . . . . . . . . . — —Unrecognized prior service cost . . . . . . . . . . . . . . . . . . . . . . . . . . . . . . . . . . . . — —Unrecognized net loss . . . . . . . . . . . . . . . . . . . . . . . . . . . . . . . . . . . . . . . . . . . . — —
Accrued postretirement cost . . . . . . . . . . . . . . . . . . . . . . . . . . . . . . . . . . . . . . . $(129,170) $(180,297)
82

ATMOS ENERGY CORPORATION
NOTES TO CONSOLIDATED FINANCIAL STATEMENTS — (Continued)
Net periodic postretirement cost for fiscal 2015, 2014 and 2013 is recorded as operating expense andincluded the components presented below.
Fiscal Year Ended September 302015 2014 2013
(In thousands)
Components of net periodic postretirement cost:Service cost . . . . . . . . . . . . . . . . . . . . . . . . . . . . . . . . . . . . . . . . . . . $15,583 $16,784 $18,800Interest cost . . . . . . . . . . . . . . . . . . . . . . . . . . . . . . . . . . . . . . . . . . . 14,385 15,951 12,964Expected return on assets . . . . . . . . . . . . . . . . . . . . . . . . . . . . . . . . . (6,431) (5,167) (3,988)Amortization of transition obligation . . . . . . . . . . . . . . . . . . . . . . . . 272 274 1,081Amortization of prior service credit . . . . . . . . . . . . . . . . . . . . . . . . . (1,644) (1,450) (1,450)Recognized actuarial loss . . . . . . . . . . . . . . . . . . . . . . . . . . . . . . . . . — 631 4,196
Net periodic postretirement cost . . . . . . . . . . . . . . . . . . . . . . . . . $22,165 $27,023 $31,603
Assumed health care cost trend rates have a significant effect on the amounts reported for the plan. A one-percentage point change in assumed health care cost trend rates would have the following effects on the latestactuarial calculations:
One-PercentagePoint Increase
One-PercentagePoint Decrease
(In thousands)
Effect on total service and interest cost components . . . . . . . . . . . . . . . $ 4,288 $ (3,426)Effect on postretirement benefit obligation . . . . . . . . . . . . . . . . . . . . . . $39,572 $(32,440)
We are currently recovering other postretirement benefits costs through our regulated rates under accrualaccounting as prescribed by accounting principles generally accepted in the United States in substantially all ofour service areas. Other postretirement benefits costs have been specifically addressed in rate orders in eachjurisdiction served by our Kentucky/Mid-States, West Texas, Mid-Tex and Mississippi Divisions as well as ourKansas jurisdiction and Atmos Pipeline – Texas or have been included in a rate case and not disallowed.Management believes that this accounting method is appropriate and will continue to seek rate recovery ofaccrual-based expenses in its ratemaking jurisdictions that have not yet approved the recovery of these expenses.
The following tables set forth by level, within the fair value hierarchy, the Retiree Medical Plan’s assets atfair value as of September 30, 2015 and 2014. The methods used to determine fair value for the assets held by theRetiree Medical Plan are fully described in Note 2.
Assets at Fair Value as of September 30, 2015Level 1 Level 2 Level 3 Total
(In thousands)
Investments:Money market funds . . . . . . . . . . . . . . . . . . . . . . . . . . . . $ — $3,486 $— $ 3,486Registered investment companies:
Domestic funds . . . . . . . . . . . . . . . . . . . . . . . . . . . . . . 123,921 — — 123,921International funds . . . . . . . . . . . . . . . . . . . . . . . . . . . 10,602 — — 10,602
Total investments at fair value . . . . . . . . . . . . . . . . . . . . . . $134,523 $3,486 $— $138,009
83

ATMOS ENERGY CORPORATION
NOTES TO CONSOLIDATED FINANCIAL STATEMENTS — (Continued)
Assets at Fair Value as of September 30, 2014Level 1 Level 2 Level 3 Total
(In thousands)
Investments:Money market funds . . . . . . . . . . . . . . . . . . . . . . . . . . . . $ — $434 $— $ 434Registered investment companies:
Domestic funds . . . . . . . . . . . . . . . . . . . . . . . . . . . . . . 124,006 — — 124,006International funds . . . . . . . . . . . . . . . . . . . . . . . . . . . . 10,381 — — 10,381
Total investments at fair value . . . . . . . . . . . . . . . . . . . . . . $134,387 $434 $— $134,821
During 2015, the Company determined that a 2014 investment in the registered investment companies - interna-tional funds should have been classified as registered investment companies - domestic funds. The amount has beenrecast in the above table.
Estimated Future Benefit Payments
The following benefit payments paid by us, retirees and prescription drug subsidy payments for our post-retirement benefit plans, which reflect expected future service, as appropriate, are expected to be paid in the fol-lowing fiscal years. Company payments for fiscal 2015 include contributions to our postretirement plan trusts.
CompanyPayments
RetireePayments
SubsidyPayments
TotalPostretirement
Benefits(In thousands)
2016 . . . . . . . . . . . . . . . . . . . . . . . . . . . . . . . . . . . . . . $15,498 $ 2,382 $— $ 17,8802017 . . . . . . . . . . . . . . . . . . . . . . . . . . . . . . . . . . . . . . 11,245 2,677 — 13,9222018 . . . . . . . . . . . . . . . . . . . . . . . . . . . . . . . . . . . . . . 12,185 2,980 — 15,1652019 . . . . . . . . . . . . . . . . . . . . . . . . . . . . . . . . . . . . . . 12,755 3,324 — 16,0792020 . . . . . . . . . . . . . . . . . . . . . . . . . . . . . . . . . . . . . . 13,995 3,766 — 17,7612021-2025 . . . . . . . . . . . . . . . . . . . . . . . . . . . . . . . . . 86,519 26,363 — 112,882
Defined Contribution Plans
As of September 30, 2015, we maintained two defined contribution benefit plans: the Atmos Energy Corpo-ration Retirement Savings Plan and Trust (the Retirement Savings Plan) and the Atmos Energy Holdings, LLC401K Profit-Sharing Plan (the AEH 401K Profit-Sharing Plan).
The Retirement Savings Plan covers substantially all employees in our regulated operations and is subject tothe provisions of Section 401(k) of the Internal Revenue Code. Effective January 1, 2007, employees automati-cally become participants of the Retirement Savings Plan on the date of employment. Participants may elect asalary reduction up to a maximum of 65 percent of eligible compensation, as defined by the Plan, not to exceedthe maximum allowed by the Internal Revenue Service. New participants are automatically enrolled in the Plan ata salary reduction amount of four percent of eligible compensation, from which they may opt out. We match 100percent of a participant’s contributions, limited to four percent of the participant’s salary, in our common stock.However, participants have the option to immediately transfer this matching contribution into other funds heldwithin the plan. Participants are eligible to receive matching contributions after completing one year of service.Participants are also permitted to take out loans against their accounts subject to certain restrictions. Employeeshired on or after October 1, 2010 participate in the enhanced plan in which participants receive a fixed annualcontribution of four percent of eligible earnings to their Retirement Savings Plan account. Participants will con-tinue to be eligible for company matching contributions of up to four percent of their eligible earnings and willbe fully vested in the fixed annual contribution after three years of service.
84

ATMOS ENERGY CORPORATION
NOTES TO CONSOLIDATED FINANCIAL STATEMENTS — (Continued)
Prior to December 31, 2014, we also maintained the Atmos Energy Corporation Savings Plan for MVGUnion Employees (the Union 401K Plan). In June 2014, active collectively bargained employees of AtmosEnergy’s Mississippi Division voted to decertify the Union. As a result, effective July 19, 2014, active partic-ipants of the Union 401K Plan were eligible to participate in the Retirement Savings Plan. Participants who didnot actively elect to participate in the Retirement Savings Plan were automatically enrolled in the RetirementSavings Plan at a salary reduction level of four percent, which they had the choice to opt out of within 30 days. Inaddition, participants could have elected to transfer their funds from the Union 401K Plan to the RetirementSavings Plan. Effective January 1, 2015, all remaining participants became participants in the Retirement Sav-ings Plan. Following this transfer, the Union 401K Plan was terminated.
Matching contributions to the Retirement Savings Plan and the Union 401K Plan are expensed as incurredand amounted to $11.5 million, $10.9 million and $10.4 million for fiscal years 2015, 2014 and 2013. The Boardof Directors may also approve discretionary contributions, subject to the provisions of the Internal Revenue Codeand applicable Treasury regulations. No discretionary contributions were made for fiscal years 2015, 2014 or2013. At September 30, 2015 and 2014, the Retirement Savings Plan held 4.3 percent and 4.5 percent of our out-standing common stock.
The AEH 401K Profit-Sharing Plan covers substantially all AEH employees and is subject to the provisionsof Section 401(k) of the Internal Revenue Code. Participants may elect a salary reduction up to a maximum of 75percent of eligible compensation, as defined by the Plan, not to exceed the maximum allowed by the InternalRevenue Service. The Company may elect to make safe harbor contributions up to four percent of the employ-ee’s salary which vest immediately. The Company may also make discretionary profit sharing contributions tothe AEH 401K Profit-Sharing Plan. Participants become fully vested in the discretionary profit-sharing con-tributions after three years of service. Participants are also permitted to take out loans against their accounts sub-ject to certain restrictions. Discretionary contributions to the AEH 401K Profit-Sharing Plan are expensed asincurred and amounted to $1.1 million, $1.4 million and $1.1 million for fiscal years 2015, 2014 and 2013.
On November 4, 2015, the Atmos Energy Corporation Board of Directors voted to approve the merger ofthe assets and liabilities of the AEH 401K Profit-Sharing Plan with the Retirement Savings Plan, effective Jan-uary 1, 2016 to improve administrative efficiency and reduce total costs.
7. Stock and Other Compensation Plans
Stock-Based Compensation Plans
Total stock-based compensation expense was $27.5 million, $25.5 million and $17.8 million for the fiscalyears ended September 30, 2015, 2014 and 2013, primarily related to restricted stock costs.
1998 Long-Term Incentive Plan
In August 1998, the Board of Directors approved and adopted the 1998 Long-Term Incentive Plan (LTIP),which became effective in October 1998 after approval by our shareholders. The LTIP is a comprehensive, long-term incentive compensation plan providing for discretionary awards of incentive stock options, non-qualifiedstock options, stock appreciation rights, bonus stock, time-lapse restricted stock, time-lapse restricted stock units,performance-based restricted stock units and stock units to certain employees and non-employee directors of theCompany and our subsidiaries. The objectives of this plan include attracting and retaining the best personnel,providing for additional performance incentives and promoting our success by providing employees with theopportunity to acquire common stock.
As of September 30, 2015, we were authorized to grant awards for up to a maximum of 8.7 million shares ofcommon stock under this plan subject to certain adjustment provisions. As of September 30, 2015, non-qualifiedstock options, bonus stock, time-lapse restricted stock, time-lapse restricted stock units, performance-basedrestricted stock units and stock units had been issued under this plan, and 308,582 shares were available forfuture issuance.
85

ATMOS ENERGY CORPORATION
NOTES TO CONSOLIDATED FINANCIAL STATEMENTS — (Continued)
Restricted Stock Unit Award Grants
As noted above, the LTIP provides for discretionary awards of restricted stock units to help attract, retainand reward employees of Atmos Energy and its subsidiaries. Certain of these awards vest based upon the passageof time and other awards vest based upon the passage of time and the achievement of specified performance tar-gets. The fair value of the awards granted is based on the market price of our stock at the date of grant. The asso-ciated expense is recognized ratably over the vesting period.
Employees who are granted time-lapse restricted stock units under our LTIP have a nonforfeitable right todividend equivalents that are paid at the same rate and at the same time at which they are paid on shares of stockwithout restrictions. Time-lapse restricted stock units contain only a service condition that the employee recipi-ents render continuous services to the Company for a period of three years from the date of grant, except foraccelerated vesting in the event of death, disability, change of control of the Company or termination withoutcause (with certain exceptions). There are no performance conditions required to be met for employees to bevested in time-lapse restricted stock units.
Employees who are granted performance-based restricted stock units under our LTIP have a forfeitable rightto dividend equivalents that accrue at the same rate at which they are paid on shares of stock without restrictions.Dividend equivalents on the performance-based restricted stock units are paid either in cash or in the form ofshares upon the vesting of the award. Performance-based restricted stock units contain a service condition thatthe employee recipients render continuous services to the Company for a period of three years from the begin-ning of the applicable three-year performance period, except for accelerated vesting in the event of death, dis-ability, change of control of the Company or termination without cause (with certain exceptions) and aperformance condition based on a cumulative earnings per share target amount.
The following summarizes information regarding the restricted stock units granted under the plan during thefiscal years ended September 30, 2015, 2014 and 2013:
2015 2014 2013
Number ofRestricted
Units
WeightedAverage
Grant-DateFair
Value
Number ofRestricted
Units
WeightedAverage
Grant-DateFair
Value
Number ofRestricted
Units
WeightedAverage
Grant-DateFair
Value
Nonvested at beginning of year . . . 988,637 $42.22 1,052,844 $36.20 1,262,582 $32.46Granted . . . . . . . . . . . . . . . . . . . . 444,543 50.50 464,438 45.05 473,775 40.48Vested . . . . . . . . . . . . . . . . . . . . . (551,688) 39.28 (524,532) 32.67 (657,795) 32.20Forfeited . . . . . . . . . . . . . . . . . . . (3,388) 48.55 (4,113) 39.00 (25,718) 33.42
Nonvested at end of year . . . . . . . . 878,104 $48.24 988,637 $42.22 1,052,844 $36.20
As of September 30, 2015, there was $10.2 million of total unrecognized compensation cost related to non-vested restricted stock units granted under the LTIP. That cost is expected to be recognized over a weighted-average period of 1.5 years. The fair value of restricted stock vested during the fiscal years ended September 30,2015, 2014 and 2013 was $21.7 million, $17.1 million and $21.2 million.
Other Plans
Direct Stock Purchase Plan
We maintain a Direct Stock Purchase Plan, open to all investors, which allows participants to have all orpart of their cash dividends paid quarterly in additional shares of our common stock. The minimum initialinvestment required to join the plan is $1,250. Direct Stock Purchase Plan participants may purchase additionalshares of our common stock as often as weekly with voluntary cash payments of at least $25, up to an annualmaximum of $100,000.
86

ATMOS ENERGY CORPORATION
NOTES TO CONSOLIDATED FINANCIAL STATEMENTS — (Continued)
Outside Directors Stock-For-Fee Plan
In November 1994, the Board of Directors adopted the Outside Directors Stock-for-Fee Plan, which wasapproved by our shareholders in February 1995. The plan permits non-employee directors to receive all or part oftheir annual retainer and meeting fees in stock rather than in cash. This plan was terminated by the Board ofDirectors, effective September 1, 2014, when the LTIP was amended to incorporate substantially all of its provi-sions.
Equity Incentive and Deferred Compensation Plan for Non-Employee Directors
In November 1998, the Board of Directors adopted the Equity Incentive and Deferred Compensation Planfor Non-Employee Directors, which was approved by our shareholders in February 1999. This plan amended theAtmos Energy Corporation Deferred Compensation Plan for Outside Directors adopted by the Company in May1990 and replaced the pension payable under our Retirement Plan for Non-Employee Directors. The plan pro-vides non-employee directors of Atmos Energy with the opportunity to defer receipt, until retirement, ofcompensation for services rendered to the Company and invest deferred compensation into either a cash accountor a stock account.
Other Discretionary Compensation Plans
We have an annual incentive program covering substantially all employees to give each employee an oppor-tunity to share in our financial success based on the achievement of key performance measures considered crit-ical to achieving business objectives for a given year with minimum and maximum thresholds. The Companymust meet the minimum threshold for the plan to be funded and distributed to employees. These performancemeasures may include earnings growth objectives, improved cash flow objectives or crucial customer satisfactionand safety results. We monitor progress towards the achievement of the performance measures throughout theyear and record accruals based upon the expected payout using the best estimates available at the time the accrualis recorded. During the last several fiscal years, we have used earnings per share as our sole performance meas-ure.
8. Details of Selected Consolidated Balance Sheet Captions
The following tables provide additional information regarding the composition of certain of our balancesheet captions.
Accounts receivable
Accounts receivable was comprised of the following at September 30, 2015 and 2014:
September 302015 2014
(In thousands)
Billed accounts receivable . . . . . . . . . . . . . . . . . . . . . . . . . . . . . . . . . . . . . . . . . . $204,585 $262,937Unbilled revenue . . . . . . . . . . . . . . . . . . . . . . . . . . . . . . . . . . . . . . . . . . . . . . . . . 65,008 62,484Other accounts receivable . . . . . . . . . . . . . . . . . . . . . . . . . . . . . . . . . . . . . . . . . . 40,850 41,971
Total accounts receivable . . . . . . . . . . . . . . . . . . . . . . . . . . . . . . . . . . . . . . . . . . 310,443 367,392Less: allowance for doubtful accounts . . . . . . . . . . . . . . . . . . . . . . . . . . . . . . . . (15,283) (23,992)
Net accounts receivable . . . . . . . . . . . . . . . . . . . . . . . . . . . . . . . . . . . . . . . . . . . . $295,160 $343,400
87

ATMOS ENERGY CORPORATION
NOTES TO CONSOLIDATED FINANCIAL STATEMENTS — (Continued)
Other current assets
Other current assets as of September 30, 2015 and 2014 were comprised of the following accounts.September 30
2015 2014(In thousands)
Assets from risk management activities . . . . . . . . . . . . . . . . . . . . . . . . . . . . . . . . $ 9,232 $ 45,827Deferred gas costs . . . . . . . . . . . . . . . . . . . . . . . . . . . . . . . . . . . . . . . . . . . . . . . . . 9,715 20,069Taxes receivable . . . . . . . . . . . . . . . . . . . . . . . . . . . . . . . . . . . . . . . . . . . . . . . . . . 4,479 5,481Prepaid expenses . . . . . . . . . . . . . . . . . . . . . . . . . . . . . . . . . . . . . . . . . . . . . . . . . . 27,734 25,039Materials and supplies . . . . . . . . . . . . . . . . . . . . . . . . . . . . . . . . . . . . . . . . . . . . . . 12,587 5,704Other . . . . . . . . . . . . . . . . . . . . . . . . . . . . . . . . . . . . . . . . . . . . . . . . . . . . . . . . . . . 6,822 9,145
Total . . . . . . . . . . . . . . . . . . . . . . . . . . . . . . . . . . . . . . . . . . . . . . . . . . . . . . . . . . . $70,569 $111,265
Property, plant and equipment
Property, plant and equipment was comprised of the following as of September 30, 2015 and 2014:
September 302015 2014
(In thousands)
Production plant . . . . . . . . . . . . . . . . . . . . . . . . . . . . . . . . . . . . . . . . . . . . . $ 131 $ 4,821Storage plant . . . . . . . . . . . . . . . . . . . . . . . . . . . . . . . . . . . . . . . . . . . . . . . . 286,011 275,579Transmission plant . . . . . . . . . . . . . . . . . . . . . . . . . . . . . . . . . . . . . . . . . . . 1,844,117 1,622,846Distribution plant . . . . . . . . . . . . . . . . . . . . . . . . . . . . . . . . . . . . . . . . . . . . 6,019,001 5,522,794General plant . . . . . . . . . . . . . . . . . . . . . . . . . . . . . . . . . . . . . . . . . . . . . . . . 769,311 735,223Intangible plant . . . . . . . . . . . . . . . . . . . . . . . . . . . . . . . . . . . . . . . . . . . . . . 41,131 38,858
8,959,702 8,200,121Construction in progress . . . . . . . . . . . . . . . . . . . . . . . . . . . . . . . . . . . . . . . 280,398 247,579
9,240,100 8,447,700Less: accumulated depreciation and amortization . . . . . . . . . . . . . . . . . . . (1,809,520) (1,721,794)
Net property, plant and equipment(1) . . . . . . . . . . . . . . . . . . . . . . . . . . . $ 7,430,580 $ 6,725,906
(1) Net property, plant and equipment includes plant acquisition adjustments of $(68.1) million and $(76.4) mil-lion at September 30, 2015 and 2014.
Goodwill
The following presents our goodwill balance allocated by segment and changes in the balance for the fiscalyear ended September 30, 2015:
RegulatedDistribution
RegulatedPipeline Nonregulated Total
(In thousands)
Balance as of September 30, 2014 . . . . . . . . . . . . $574,816 $132,502 $34,711 $742,029Deferred tax adjustments on prior
acquisitions(1) . . . . . . . . . . . . . . . . . . . . . . . . . . 633 40 — 673
Balance as of September 30, 2015 . . . . . . . . . . . . $575,449 $132,542 $34,711 $742,702
(1) We annually adjust certain deferred taxes recorded in connection with acquisitions completed in fiscal 2001and fiscal 2004, which resulted in an increase to goodwill and net deferred tax liabilities of $0.7 million forfiscal 2015.
88

ATMOS ENERGY CORPORATION
NOTES TO CONSOLIDATED FINANCIAL STATEMENTS — (Continued)
Deferred charges and other assets
Deferred charges and other assets as of September 30, 2015 and 2014 were comprised of the followingaccounts.
September 302015 2014
(In thousands)
Marketable securities . . . . . . . . . . . . . . . . . . . . . . . . . . . . . . . . . . . . . . . . . . . . . $ 74,200 $ 79,613Regulatory assets . . . . . . . . . . . . . . . . . . . . . . . . . . . . . . . . . . . . . . . . . . . . . . . . . 182,573 230,240Deferred financing costs . . . . . . . . . . . . . . . . . . . . . . . . . . . . . . . . . . . . . . . . . . . 17,873 13,698Assets from risk management activities . . . . . . . . . . . . . . . . . . . . . . . . . . . . . . . 368 13,038Other . . . . . . . . . . . . . . . . . . . . . . . . . . . . . . . . . . . . . . . . . . . . . . . . . . . . . . . . . . 13,664 14,340
Total . . . . . . . . . . . . . . . . . . . . . . . . . . . . . . . . . . . . . . . . . . . . . . . . . . . . . . . . . . $288,678 $350,929
Accounts payable and accrued liabilities
Accounts payable and accrued liabilities as of September 30, 2015 and 2014 were comprised of the follow-ing accounts.
September 302015 2014
(In thousands)
Trade accounts payable . . . . . . . . . . . . . . . . . . . . . . . . . . . . . . . . . . . . . . . . . . . . $ 78,534 $ 77,860Accrued gas payable . . . . . . . . . . . . . . . . . . . . . . . . . . . . . . . . . . . . . . . . . . . . . . 119,825 179,425Accrued liabilities . . . . . . . . . . . . . . . . . . . . . . . . . . . . . . . . . . . . . . . . . . . . . . . . 40,583 50,801
Total . . . . . . . . . . . . . . . . . . . . . . . . . . . . . . . . . . . . . . . . . . . . . . . . . . . . . . . . . . $238,942 $308,086
Other current liabilities
Other current liabilities as of September 30, 2015 and 2014 were comprised of the following accounts.
September 302015 2014
(In thousands)
Customer credit balances and deposits . . . . . . . . . . . . . . . . . . . . . . . . . . . . . . . . $100,232 $ 82,085Accrued employee costs . . . . . . . . . . . . . . . . . . . . . . . . . . . . . . . . . . . . . . . . . . . 47,602 46,445Deferred gas costs . . . . . . . . . . . . . . . . . . . . . . . . . . . . . . . . . . . . . . . . . . . . . . . . 28,100 35,063Accrued interest . . . . . . . . . . . . . . . . . . . . . . . . . . . . . . . . . . . . . . . . . . . . . . . . . . 34,914 36,768Liabilities from risk management activities . . . . . . . . . . . . . . . . . . . . . . . . . . . . 9,568 1,730Taxes payable . . . . . . . . . . . . . . . . . . . . . . . . . . . . . . . . . . . . . . . . . . . . . . . . . . . 93,674 77,601Pension and postretirement obligations . . . . . . . . . . . . . . . . . . . . . . . . . . . . . . . 21,857 11,380Current deferred tax liability . . . . . . . . . . . . . . . . . . . . . . . . . . . . . . . . . . . . . . . . 55,918 48,751Regulatory cost of removal accrual . . . . . . . . . . . . . . . . . . . . . . . . . . . . . . . . . . . 56,123 45,061Other . . . . . . . . . . . . . . . . . . . . . . . . . . . . . . . . . . . . . . . . . . . . . . . . . . . . . . . . . . 9,966 20,985
Total . . . . . . . . . . . . . . . . . . . . . . . . . . . . . . . . . . . . . . . . . . . . . . . . . . . . . . . . . . $457,954 $405,869
89

ATMOS ENERGY CORPORATION
NOTES TO CONSOLIDATED FINANCIAL STATEMENTS — (Continued)
Deferred credits and other liabilities
Deferred credits and other liabilities as of September 30, 2015 and 2014 were comprised of the followingaccounts.
September 302015 2014
(In thousands)
Customer advances for construction . . . . . . . . . . . . . . . . . . . . . . . . . . . . . . . . . . . $ 9,316 $ 9,883Regulatory liabilities . . . . . . . . . . . . . . . . . . . . . . . . . . . . . . . . . . . . . . . . . . . . . . . 3,693 4,472Asset retirement obligation . . . . . . . . . . . . . . . . . . . . . . . . . . . . . . . . . . . . . . . . . . 9,063 10,508Liabilities from risk management activities . . . . . . . . . . . . . . . . . . . . . . . . . . . . . 110,539 20,126Other . . . . . . . . . . . . . . . . . . . . . . . . . . . . . . . . . . . . . . . . . . . . . . . . . . . . . . . . . . . 29,085 23,881
Total . . . . . . . . . . . . . . . . . . . . . . . . . . . . . . . . . . . . . . . . . . . . . . . . . . . . . . . . . . . $161,696 $68,870
9. Leases
We have entered into operating leases for office and warehouse space, vehicles and heavy equipment usedin our operations. The remaining lease terms range from one to 19 years and generally provide for the payment oftaxes, insurance and maintenance by the lessee. Renewal options exist for certain of these leases.
The related future minimum lease payments at September 30, 2015 were as follows:Operating
Leases(In thousands)
2016 . . . . . . . . . . . . . . . . . . . . . . . . . . . . . . . . . . . . . . . . . . . . . . . . . . . . . . . . . . . . . . . . . . . $ 16,4752017 . . . . . . . . . . . . . . . . . . . . . . . . . . . . . . . . . . . . . . . . . . . . . . . . . . . . . . . . . . . . . . . . . . . 16,6392018 . . . . . . . . . . . . . . . . . . . . . . . . . . . . . . . . . . . . . . . . . . . . . . . . . . . . . . . . . . . . . . . . . . . 16,4902019 . . . . . . . . . . . . . . . . . . . . . . . . . . . . . . . . . . . . . . . . . . . . . . . . . . . . . . . . . . . . . . . . . . . 15,2072020 . . . . . . . . . . . . . . . . . . . . . . . . . . . . . . . . . . . . . . . . . . . . . . . . . . . . . . . . . . . . . . . . . . . 14,251Thereafter . . . . . . . . . . . . . . . . . . . . . . . . . . . . . . . . . . . . . . . . . . . . . . . . . . . . . . . . . . . . . . 61,651
Total minimum lease payments . . . . . . . . . . . . . . . . . . . . . . . . . . . . . . . . . . . . . . . . . . . . . . $140,713
Consolidated lease and rental expense amounted to $32.5 million, $31.7 million and $32.4 million for fiscal2015, 2014 and 2013.
10. Commitments and Contingencies
Litigation
We are a party to various litigation that has arisen in the ordinary course of our business. While the resultsof such litigation cannot be predicted with certainty, we believe the final outcome of such litigation will not havea material adverse effect on our financial condition, results of operations or cash flows.
Environmental Matters
We are a party to environmental matters and claims that have arisen in the ordinary course of our business.While the ultimate results of response actions to these environmental matters and claims cannot be predicted withcertainty, we believe the final outcome of such response actions will not have a material adverse effect on ourfinancial condition, results of operations or cash flows because we believe that the expenditures related to suchresponse actions will either be recovered through rates, shared with other parties or are adequately covered byinsurance.
90

ATMOS ENERGY CORPORATION
NOTES TO CONSOLIDATED FINANCIAL STATEMENTS — (Continued)
Purchase Commitments
Our regulated distribution divisions maintain supply contracts with several vendors that generally cover aperiod of up to one year. Commitments for estimated base gas volumes are established under these contracts on amonthly basis at contractually negotiated prices. Commitments for incremental daily purchases are made asnecessary during the month in accordance with the terms of the individual contract.
Our Mid-Tex Division also maintains a limited number of long-term supply contracts to ensure a reliablesource of gas for our customers in its service area which obligate it to purchase specified volumes at pricesindexed to natural gas distribution hubs. At September 30, 2015, we were committed to purchase 36.6 Bcf withinone year and 26.8 Bcf within one to three years under indexed contracts. Purchases under these contracts totaled$113.3 million, $140.9 million and $89.0 million for 2015, 2014, 2013.
Our nonregulated segment has commitments to purchase physical quantities of natural gas under contractsindexed to the forward NYMEX strip or fixed price contracts. At September 30, 2015, we were committed topurchase 101.9 Bcf within one year, 16.0 Bcf within one to three years and 0.5 Bcf after three years underindexed contracts. We are committed to purchase 3.0 Bcf within one year under fixed price contracts with pricesranging from $2.32 to $3.23 per Mcf. Purchases under these contracts totaled $1,141.3 million, $1,687.5 millionand $1,246.1 million for 2015, 2014 and 2013.
In addition, our nonregulated segment maintains long-term contracts related to storage and transportation.The estimated contractual demand fees for contracted storage and transportation under these contracts as of Sep-tember 30, 2015 are as follows (in thousands):
2016 . . . . . . . . . . . . . . . . . . . . . . . . . . . . . . . . . . . . . . . . . . . . . . . . . . . . . . . . . . . . . . . . . . . . . . $ 7,8432017 . . . . . . . . . . . . . . . . . . . . . . . . . . . . . . . . . . . . . . . . . . . . . . . . . . . . . . . . . . . . . . . . . . . . . . 3,5222018 . . . . . . . . . . . . . . . . . . . . . . . . . . . . . . . . . . . . . . . . . . . . . . . . . . . . . . . . . . . . . . . . . . . . . . 1,9662019 . . . . . . . . . . . . . . . . . . . . . . . . . . . . . . . . . . . . . . . . . . . . . . . . . . . . . . . . . . . . . . . . . . . . . . 4262020 . . . . . . . . . . . . . . . . . . . . . . . . . . . . . . . . . . . . . . . . . . . . . . . . . . . . . . . . . . . . . . . . . . . . . . 398Thereafter . . . . . . . . . . . . . . . . . . . . . . . . . . . . . . . . . . . . . . . . . . . . . . . . . . . . . . . . . . . . . . . . . . 1,101
$15,256
Regulatory Matters
In July 2010, the Dodd-Frank Act was enacted, representing an extensive overhaul of the framework forregulation of U.S. financial markets. The Dodd-Frank Act required various regulatory agencies, including theSEC and the Commodities Futures Trading Commission, to establish regulations for implementation of many ofthe provisions of the Dodd-Frank Act. A number of those regulations have been adopted; we have enacted newprocedures and modified existing business practices and contractual arrangements to comply with such regu-lations. We expect additional regulations to be issued, which should provide additional clarity regarding theextent of the impact of this legislation on us. The costs of participating in financial markets for hedging certainrisks inherent in our business may be further increased when these expected additional regulations are adopted.We also anticipate that the Commodities Futures Trading Commission will issue additional related reporting anddisclosure obligations.
91

ATMOS ENERGY CORPORATION
NOTES TO CONSOLIDATED FINANCIAL STATEMENTS — (Continued)
11. Income Taxes
The components of income tax expense from continuing operations for 2015, 2014 and 2013 were as follows:
2015 2014 2013(In thousands)
CurrentFederal . . . . . . . . . . . . . . . . . . . . . . . . . . . . . . . . . . . . . . . . . . . . $ — $ — $ —State . . . . . . . . . . . . . . . . . . . . . . . . . . . . . . . . . . . . . . . . . . . . . . 7,251 5,527 8,178
DeferredFederal . . . . . . . . . . . . . . . . . . . . . . . . . . . . . . . . . . . . . . . . . . . . 175,897 169,106 124,836State . . . . . . . . . . . . . . . . . . . . . . . . . . . . . . . . . . . . . . . . . . . . . . 12,548 12,375 9,605
Investment tax credits . . . . . . . . . . . . . . . . . . . . . . . . . . . . . . . . . . (6) (6) (20)
$195,690 $187,002 $142,599
Reconciliations of the provision for income taxes computed at the statutory rate to the reported provisionsfor income taxes from continuing operations for 2015, 2014 and 2013 are set forth below:
2015 2014 2013(In thousands)
Tax at statutory rate of 35% . . . . . . . . . . . . . . . . . . . . . . . . . . . . . . $178,768 $166,887 $130,655Common stock dividends deductible for tax reporting . . . . . . . . . (2,413) (2,307) (2,153)State taxes (net of federal benefit) . . . . . . . . . . . . . . . . . . . . . . . . . 12,869 11,636 11,559Change in valuation allowance . . . . . . . . . . . . . . . . . . . . . . . . . . . 4,998 6,969 1,085Other, net . . . . . . . . . . . . . . . . . . . . . . . . . . . . . . . . . . . . . . . . . . . . 1,468 3,817 1,453
Income tax expense . . . . . . . . . . . . . . . . . . . . . . . . . . . . . . . . . . . . $195,690 $187,002 $142,599
92

ATMOS ENERGY CORPORATION
NOTES TO CONSOLIDATED FINANCIAL STATEMENTS — (Continued)
Deferred income taxes reflect the tax effect of differences between the basis of assets and liabilities for bookand tax purposes. The tax effect of temporary differences that gave rise to significant components of the deferredtax liabilities and deferred tax assets at September 30, 2015 and 2014 are presented below:
2015 2014(In thousands)
Deferred tax assets:Employee benefit plans . . . . . . . . . . . . . . . . . . . . . . . . . . . . . . . . . . . . . $ 121,619 $ 116,157Interest rate agreements . . . . . . . . . . . . . . . . . . . . . . . . . . . . . . . . . . . . . 51,067 10,565Net operating loss carryforwards . . . . . . . . . . . . . . . . . . . . . . . . . . . . . . 313,224 236,626Charitable and other credit carryforwards . . . . . . . . . . . . . . . . . . . . . . . 22,281 21,614Other . . . . . . . . . . . . . . . . . . . . . . . . . . . . . . . . . . . . . . . . . . . . . . . . . . . . 36,695 28,849
Total deferred tax assets . . . . . . . . . . . . . . . . . . . . . . . . . . . . . . . . . . . 544,886 413,811Valuation allowance . . . . . . . . . . . . . . . . . . . . . . . . . . . . . . . . . . . . . . (10,872) (6,969)
Net deferred tax assets . . . . . . . . . . . . . . . . . . . . . . . . . . . . . . . . . . . . 534,014 406,842Deferred tax liabilities:
Difference in net book value and net tax value of assets . . . . . . . . . . . . (1,890,886) (1,655,894)Pension funding . . . . . . . . . . . . . . . . . . . . . . . . . . . . . . . . . . . . . . . . . . . (35,247) (17,890)Gas cost adjustments . . . . . . . . . . . . . . . . . . . . . . . . . . . . . . . . . . . . . . . (43,634) (31,252)Other . . . . . . . . . . . . . . . . . . . . . . . . . . . . . . . . . . . . . . . . . . . . . . . . . . . . (31,480) (37,173)
Total deferred tax liabilities . . . . . . . . . . . . . . . . . . . . . . . . . . . . . . . . (2,001,247) (1,742,209)
Net deferred tax liabilities . . . . . . . . . . . . . . . . . . . . . . . . . . . . . . . . . . . . . $(1,467,233) $(1,335,367)
Deferred credits for rate regulated entities . . . . . . . . . . . . . . . . . . . . . . . . . $ 412 $ (109)
At September 30, 2015, we had $307.3 million of federal net operating loss carryforwards, which includesthe impact of stock based compensation. The federal net operating loss carryforwards are available to offsettaxable income and will begin to expire in 2029. The Company also has $10.1 million of federal alternativeminimum tax credit carryforwards which do not expire. In addition, the Company has $11.4 million in charitablecontribution carryforwards to offset taxable income. The Company’s charitable contribution carryforwards expirein 2015 - 2020. We believe it is more likely than not that the benefit from certain charitable contributioncarryforwards will not be realized. Due to the uncertainty of realizing a benefit from the deferred tax assetrecorded for charitable contribution carryforwards, a valuation allowance of $4.4 million and $7.0 million wasestablished for the years ended September 30, 2015 and 2014. In addition, $1.1 million of deferred tax assetsexpired for which a valuation allowance had previously been recorded during the year ended September 30,2015.
For state taxable income, the Company has $14.9 million of state net operating loss carryforwards (net of$8.0 million of federal effects) and $0.8 million of state tax credits carryforwards (net of federal effects).Depending on the jurisdiction in which the state net operating loss was generated, the carryforwards will begin toexpire between 2016 and 2030. We believe it is more likely than not that a portion of the benefit from certainstate net operating loss carryfowards will not be realized. Due to the uncertainty of realizing a benefit from thedeferred tax asset for these carryforwards, a valuation allowance of $0.6 million (net of federal effects) wasestablished for the year ended September 30, 2015. The state tax credits will begin to expire in 2018.
93

ATMOS ENERGY CORPORATION
NOTES TO CONSOLIDATED FINANCIAL STATEMENTS — (Continued)
At September 30, 2015, we had recorded liabilities associated with unrecognized tax benefits totaling $17.1million. The following table reconciles the beginning and ending balance of our unrecognized tax benefits:
2015 2014(In thousands)
Unrecognized tax benefits - beginning balance . . . . . . . . . . . . . . . . . . . . . . . . . . . . . . . . . $12,629 $ 4,158Increase resulting from prior period tax positions . . . . . . . . . . . . . . . . . . . . . . . . . . . . . 1,009 3,846Increase resulting from current period tax positions . . . . . . . . . . . . . . . . . . . . . . . . . . . . 3,431 4,625
Unrecognized tax benefits - ending balance . . . . . . . . . . . . . . . . . . . . . . . . . . . . . . . . . . . . 17,069 12,629Accrued interest and penalties . . . . . . . . . . . . . . . . . . . . . . . . . . . . . . . . . . . . . . . . . . . . . . 820 411
Gross unrecognized tax benefits . . . . . . . . . . . . . . . . . . . . . . . . . . . . . . . . . . . . . . . . . . . . . . . 17,889 13,040Less: deferred federal and state income tax benefits . . . . . . . . . . . . . . . . . . . . . . . . . . . . . . . (6,261) (4,564)
Total unrecognized tax benefits that, if recognized, would impact the effective income taxrate as of the end of the year . . . . . . . . . . . . . . . . . . . . . . . . . . . . . . . . . . . . . . . . . . . . . . . . $11,628 $ 8,476
We file income tax returns in the U.S. federal jurisdiction as well as in various states where we have oper-ations. We have concluded substantially all U.S. federal income tax matters through fiscal year 2007.
12. Financial Instruments
We use financial instruments to mitigate commodity price risk and interest rate risk. The objectives and strat-egies for using financial instruments have been tailored to our regulated and nonregulated businesses. Currently,we utilize financial instruments in our regulated distribution and nonregulated segments. We currently do notmanage commodity price risk with financial instruments in our regulated pipeline segment.
Our financial instruments do not contain any credit-risk-related or other contingent features that could causeaccelerated payments when our financial instruments are in net liability positions.
As discussed in Note 2, we report our financial instruments as risk management assets and liabilities, eachof which is classified as current or noncurrent based upon the anticipated settlement date of the underlying finan-cial instrument. The following table shows the fair values of our risk management assets and liabilities by seg-ment at September 30, 2015 and 2014:
RegulatedDistribution Nonregulated Total
(In thousands)
September 30, 2015Assets from risk management activities, current(1) . . . . . . . . . $ 378 $ 8,854 $ 9,232Assets from risk management activities, noncurrent . . . . . . . . 368 — 368Liabilities from risk management activities, current(1) . . . . . . (9,568) — (9,568)Liabilities from risk management activities, noncurrent(1) . . . (110,539) — (110,539)
Net assets (liabilities) . . . . . . . . . . . . . . . . . . . . . . . . . . . . . . . $(119,361) $ 8,854 $(110,507)
September 30, 2014Assets from risk management activities, current(2) . . . . . . . . . $ 23,102 $22,725 $ 45,827Assets from risk management activities, noncurrent . . . . . . . . 13,038 — 13,038Liabilities from risk management activities, current(2) . . . . . . (1,730) — (1,730)Liabilities from risk management activities, noncurrent(2) . . . (20,126) — (20,126)
Net assets . . . . . . . . . . . . . . . . . . . . . . . . . . . . . . . . . . . . . . . . . $ 14,284 $22,725 $ 37,009
94

ATMOS ENERGY CORPORATION
NOTES TO CONSOLIDATED FINANCIAL STATEMENTS — (Continued)
(1) Includes $43.5 million of cash held on deposit to collateralize certain financial instruments. Of this amount,$34.6 million was used to offset current and noncurent risk management liabilities under master nettingarrangements and the remaining $8.9 million is classified as current risk management assets.
(2) Includes $25.8 million of cash held on deposit to collateralize certain financial instruments. Of this amount,$3.1 million was used to offset current and noncurrent risk management liabilities under master nettingarrangements and the remaining $22.7 million is classified as current risk management assets.
Regulated Commodity Risk Management Activities
Although our purchased gas cost adjustment mechanisms essentially insulate our regulated distributionsegment from commodity price risk, our customers are exposed to the effects of volatile natural gas prices. Wemanage this exposure through a combination of physical storage, fixed-price forward contracts and financialinstruments, primarily over-the-counter swap and option contracts, in an effort to minimize the impact of naturalgas price volatility on our customers during the winter heating season.
Our regulated distribution gas supply department is responsible for executing this segment’s commodity riskmanagement activities in conformity with regulatory requirements. In jurisdictions where we are permitted tomitigate commodity price risk through financial instruments, the relevant regulatory authorities may establish thelevel of heating season gas purchases that can be hedged. Historically, if the regulatory authority does not estab-lish this level, we seek to hedge between 25 and 50 percent of anticipated heating season gas purchases usingfinancial instruments. For the 2014-2015 heating season (generally October through March), in the jurisdictionswhere we are permitted to utilize financial instruments, we hedged approximately 37 percent, or approximately28.2 Bcf of the winter flowing gas requirements at a weighted average cost of approximately $4.34 per Mcf. Wehave not designated these financial instruments as hedges.
Nonregulated Commodity Risk Management Activities
In our nonregulated operations, we buy, sell and deliver natural gas at competitive prices by aggregating andpurchasing gas supply, arranging transportation and storage logistics and effectively managing commodity pricerisk.
As a result of these activities, our nonregulated segment is exposed to risks associated with changes in themarket price of natural gas. We manage our exposure to such risks through a combination of physical storage andfinancial instruments, including futures, over-the-counter and exchange-traded options and swap contracts withcounterparties. Future contracts provide the right to buy or sell the commodity at a fixed price in the future.Option contracts provide the right, but not the requirement, to buy or sell the commodity at a fixed price. Swapcontracts require receipt of payment for the commodity based on the difference between a fixed price and themarket price on the settlement date. Specifically, these operations use financial instruments in the followingways:
‰ Gas delivery and related services - We use financial instruments, designated as cash flow hedges ofanticipated purchases and sales at index prices, to mitigate the commodity price risk associated withdeliveries under fixed-priced forward contracts to either deliver gas to customers or purchase gas fromsuppliers. These financial instruments have maturity dates ranging from one to 49 months.
‰ Transportation and storage services - Our nonregulated operations use storage and basis swaps, futuresand various over-the-counter and exchange-traded options to capture additional storage arbitrage oppor-tunities that arise subsequent to the execution of the original fair value hedge associated with our physicalnatural gas inventory, basis swaps to insulate and protect the economic value of our fixed price and stor-age books and various over-the-counter and exchange-traded options. These financial instruments havenot been designated as hedges for accounting purposes.
‰ Aggregating and purchasing gas supply - Certain financial instruments, designated as fair value hedges,are used to hedge our natural gas inventory used in asset optimization activities.
95
ATMOS ENERGY CORPORATION
NOTES TO CONSOLIDATED FINANCIAL STATEMENTS — (Continued)
Our nonregulated risk management activities are controlled through various risk management policies andprocedures. Our Audit Committee has oversight responsibility for our nonregulated risk management limits andpolicies. A risk committee, comprised of corporate and business unit officers, is responsible for establishing andenforcing our nonregulated risk management policies and procedures.
Under our risk management policies, we seek to match our financial instrument positions to our physicalstorage positions as well as our expected current and future sales and purchase obligations in order to maintain noopen positions at the end of each trading day. The determination of our net open position as of any day, however,requires us to make assumptions as to future circumstances, including the use of gas by our customers in relationto our anticipated storage and market positions. Because the price risk associated with any net open position atthe end of each day may increase if the assumptions are not realized, we review these assumptions as part of ourdaily monitoring activities. Our operations can also be affected by intraday fluctuations of gas prices, since theprice of natural gas purchased or sold for future delivery earlier in the day may not be hedged until later in theday. At times, limited net open positions related to our existing and anticipated commitments may occur. At theclose of business on September 30, 2015, our nonregulated segment had net open positions (including existingstorage and related financial contracts) of 1.0 Bcf.
Interest Rate Risk Management Activities
We currently manage interest rate risk through the use of forward starting interest rate swaps to fix the Treas-ury yield component of the interest cost associated with anticipated financings.
In October 2012, we entered into forward starting interest rate swaps to fix the Treasury yield componentassociated with the then anticipated issuance of $500 million senior notes in October 2014. These notes wereissued as planned in October 2014 and we settled swaps with the receipt of $13.4 million. Because the swapswere effective, the realized gain was recorded as a component of accumulated other comprehensive income andis being recognized as a component of interest expense over the 30-year life of the senior notes. In October 2012,we entered into forward starting interest rate swaps to fix the Treasury yield component associated with theanticipated issuance of $250 million million unsecured senior notes in fiscal 2017. Additionally, in fiscal 2014and 2015, we entered into forward starting interest rate swaps to effectively fix the Treasury yield componentassociated with $450 million of the anticipated issuance of $450 million unsecured senior notes in fiscal 2019.We designated all of these swaps as cash flow hedges at the time the agreements were executed. Accordingly,unrealized gains and losses associated with the forward starting interest rate swaps will be recorded as a compo-nent of accumulated other comprehensive income (loss). When the forward starting interest rate swaps settle, therealized gain or loss will be recorded as a component of accumulated other comprehensive income (loss) andrecognized as a component of interest expense over the life of the related financing arrangement. Hedgeineffectiveness to the extent incurred, will be reported as a component of interest expense.
Prior to fiscal 2012, we entered into several Treasury lock agreements to fix the Treasury yield componentof the interest cost of financing for various issuances of long-term debt and senior notes. The gains and lossesrealized upon settlement of these Treasury locks were recorded as a component of accumulated other compre-hensive income (loss) when they were settled and are being recognized as a component of interest expense overthe life of the associated notes from the date of settlement. The remaining amortization periods for the settledTreasury locks extend through fiscal 2045.
96

ATMOS ENERGY CORPORATION
NOTES TO CONSOLIDATED FINANCIAL STATEMENTS — (Continued)
Quantitative Disclosures Related to Financial Instruments
The following tables present detailed information concerning the impact of financial instruments on ourconsolidated balance sheet and income statements.
As of September 30, 2015, our financial instruments were comprised of both long and short commoditypositions. A long position is a contract to purchase the commodity, while a short position is a contract to sell thecommodity. As of September 30, 2015, we had net long/(short) commodity contracts outstanding in the follow-ing quantities:
Contract TypeHedge
DesignationRegulated
Distribution NonregulatedQuantity (MMcf)
Commodity contracts Fair Value . . . . . . . . . . . . . . . . . . . . . . . . . . . . . . . . . . . . . . . — (18,378)Cash Flow . . . . . . . . . . . . . . . . . . . . . . . . . . . . . . . . . . . . . . — 56,368Not designated . . . . . . . . . . . . . . . . . . . . . . . . . . . . . . . . . . . 24,849 58,513
24,849 96,503
Financial Instruments on the Balance Sheet
The following tables present the fair value and balance sheet classification of our financial instruments byoperating segment as of September 30, 2015 and 2014. The gross amounts of recognized assets and liabilities arenetted within our Consolidated Balance Sheets to the extent that we have netting arrangements with the counter-parties.
RegulatedDistribution Nonregulated
Balance Sheet Location Assets Liabilities Assets Liabilities(In thousands)
September 30, 2015Designated As Hedges:
Commodity contracts . . . . . .Other current assets /Other current liabilities $ — $ — $ 11,680 $ (36,067)
Commodity contracts . . . . . .Deferred charges and other assets /Deferred credits and other liabilities — — 126 (9,918)
Interest rate contracts . . . . . .Deferred charges and other assets /Deferred credits and other liabilities — (110,539) — —
Total . . . . . . . . . . . . . . . . . . . . . — (110,539) 11,806 (45,985)Not Designated As Hedges:
Commodity contracts . . . . . .Other current assets /Other current liabilities 378 (9,568) 65,239 (65,780)
Commodity contracts . . . . . .Deferred charges and other assets /Deferred credits and other liabilities 368 — 14,318 (14,218)
Total . . . . . . . . . . . . . . . . . . . . . 746 (9,568) 79,557 (79,998)
Gross Financial Instruments . . . 746 (120,107) 91,363 (125,983)Gross Amounts Offset on
Consolidated Balance Sheet:Contract netting . . . . . . . . . . . . . — — (91,363) 91,363
Net Financial Instruments . . . . . 746 (120,107) — (34,620)Cash collateral . . . . . . . . . . . . — — 8,854 34,620
Net Assets/Liabilities from RiskManagement Activities . . . . . . $746 $(120,107) $ 8,854 $ —
97

ATMOS ENERGY CORPORATION
NOTES TO CONSOLIDATED FINANCIAL STATEMENTS — (Continued)
RegulatedDistribution Nonregulated
Balance Sheet Location Assets Liabilities Assets Liabilities(In thousands)
September 30, 2014Designated As Hedges:
Commodity contracts . . . . . . . . Other current assets /Other current liabilities $ — $ — $ 8,912 $ (7,082)
Interest rate contracts . . . . . . . . Other current assets /Other current liabilities 21,869 — — —
Commodity contracts . . . . . . . . Deferred charges and other assets /Deferred credits and other liabilities — — 757 (2,459)
Interest rate contracts . . . . . . . . Deferred charges and other assets /Deferred credits and other liabilities 12,608 (19,835) — —
Total . . . . . . . . . . . . . . . . . . . . . . . 34,477 (19,835) 9,669 (9,541)Not Designated As Hedges:
Commodity contracts . . . . . . . . Other current assets /Other current liabilities 1,233 (1,730) 43,677 (47,729)
Commodity contracts . . . . . . . . Deferred charges and other assets /Deferred credits and other liabilities 430 (291) 15,677 (14,786)
Total . . . . . . . . . . . . . . . . . . . . . . . 1,663 (2,021) 59,354 (62,515)
Gross Financial Instruments . . . . . 36,140 (21,856) 69,023 (72,056)Gross Amounts Offset on
Consolidated Balance Sheet:Contract netting . . . . . . . . . . . . . . . — — (69,023) 69,023
Net Financial Instruments . . . . . . . 36,140 (21,856) — (3,033)Cash collateral . . . . . . . . . . . . . . . . — — 22,725 3,033
Net Assets/Liabilities from RiskManagement Activities . . . . . . . . $36,140 $(21,856)$ 22,725 $ —
Impact of Financial Instruments on the Income Statement
Hedge ineffectiveness for our nonregulated segment is recorded as a component of purchased gas cost andprimarily results from differences in the location and timing of the derivative instrument and the hedged item.Hedge ineffectiveness could materially affect our results of operations for the reported period. For the yearsended September 30, 2015, 2014 and 2013, we recognized a gain arising from fair value and cash flow hedgeineffectiveness of $0.2 million, $1.9 million and $18.2 million. Additional information regarding ineffectivenessrecognized in the income statement is included in the tables below.
98

ATMOS ENERGY CORPORATION
NOTES TO CONSOLIDATED FINANCIAL STATEMENTS — (Continued)
Fair Value Hedges
The impact of our nonregulated commodity contracts designated as fair value hedges and the related hedgeditem on our consolidated income statement for the years ended September 30, 2015, 2014 and 2013 is presentedbelow.
Fiscal Year Ended September 302015 2014 2013
(In thousands)
Commodity contracts . . . . . . . . . . . . . . . . . . . . . . . . . . . . . . . . . . . . . . . $10,311 $ (792) $ 2,165Fair value adjustment for natural gas inventory designated as the
hedged item . . . . . . . . . . . . . . . . . . . . . . . . . . . . . . . . . . . . . . . . . . . . (9,768) 2,486 15,938
Total decrease in purchased gas cost . . . . . . . . . . . . . . . . . . . . . . . . . . . $ 543 $1,694 $18,103
The decrease in purchased gas cost is comprised of the following:Basis ineffectiveness . . . . . . . . . . . . . . . . . . . . . . . . . . . . . . . . . . . . . $ 811 $ (919) $ (208)Timing ineffectiveness . . . . . . . . . . . . . . . . . . . . . . . . . . . . . . . . . . . . (268) 2,613 18,311
$ 543 $1,694 $18,103
Basis ineffectiveness arises from natural gas market price differences between the locations of the hedgedinventory and the delivery location specified in the hedge instruments. Timing ineffectiveness arises due tochanges in the difference between the spot price and the futures price, as well as the difference between the tim-ing of the settlement of the futures and the valuation of the underlying physical commodity. As the commoditycontract nears the settlement date, spot-to-forward price differences should converge, which should reduce oreliminate the impact of this ineffectiveness on purchased gas cost.
To the extent that the Company’s natural gas inventory does not qualify as a hedged item in a fair-valuehedge, or has not been designated as such, the natural gas inventory is valued at the lower of cost or market.
Cash Flow Hedges
The impact of cash flow hedges on our consolidated income statements for the years ended September 30,2015, 2014 and 2013 is presented below. Note that this presentation does not reflect the financial impact arisingfrom the hedged physical transaction. Therefore, this presentation is not indicative of the economic gross profitwe realized when the underlying physical and financial transactions were settled.
Fiscal Year Ended September 30, 2015Regulated
Distribution Nonregulated Consolidated(In thousands)
Loss reclassified from AOCI for effective portion ofcommodity contracts . . . . . . . . . . . . . . . . . . . . . . . . . . . . . $ — $(41,716) $(41,716)
Loss arising from ineffective portion of commoditycontracts . . . . . . . . . . . . . . . . . . . . . . . . . . . . . . . . . . . . . . . — (325) (325)
Total impact on purchased gas cost . . . . . . . . . . . . . . . . . . . . — (42,041) (42,041)Net loss on settled interest rate agreements reclassified from
AOCI into interest expense . . . . . . . . . . . . . . . . . . . . . . . . (853) — (853)
Total impact from cash flow hedges . . . . . . . . . . . . . . . . . . . $(853) $(42,041) $(42,894)
99
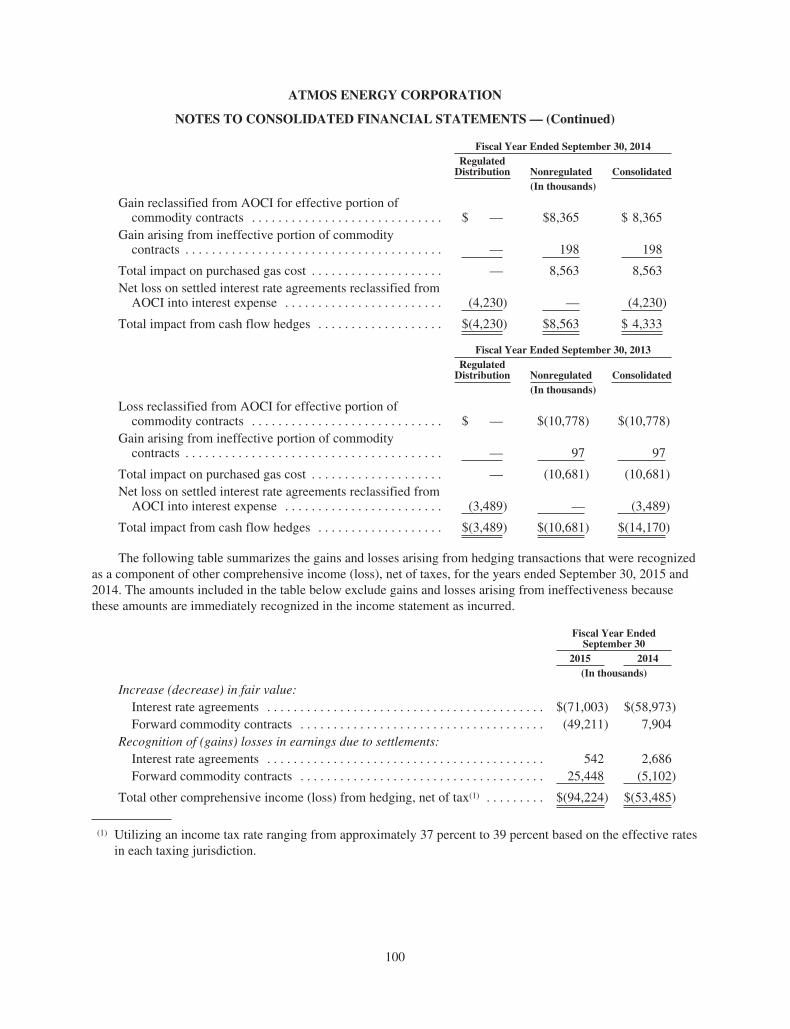
ATMOS ENERGY CORPORATION
NOTES TO CONSOLIDATED FINANCIAL STATEMENTS — (Continued)
Fiscal Year Ended September 30, 2014Regulated
Distribution Nonregulated Consolidated(In thousands)
Gain reclassified from AOCI for effective portion ofcommodity contracts . . . . . . . . . . . . . . . . . . . . . . . . . . . . . $ — $8,365 $ 8,365
Gain arising from ineffective portion of commoditycontracts . . . . . . . . . . . . . . . . . . . . . . . . . . . . . . . . . . . . . . . — 198 198
Total impact on purchased gas cost . . . . . . . . . . . . . . . . . . . . — 8,563 8,563Net loss on settled interest rate agreements reclassified from
AOCI into interest expense . . . . . . . . . . . . . . . . . . . . . . . . (4,230) — (4,230)
Total impact from cash flow hedges . . . . . . . . . . . . . . . . . . . $(4,230) $8,563 $ 4,333
Fiscal Year Ended September 30, 2013Regulated
Distribution Nonregulated Consolidated(In thousands)
Loss reclassified from AOCI for effective portion ofcommodity contracts . . . . . . . . . . . . . . . . . . . . . . . . . . . . . $ — $(10,778) $(10,778)
Gain arising from ineffective portion of commoditycontracts . . . . . . . . . . . . . . . . . . . . . . . . . . . . . . . . . . . . . . . — 97 97
Total impact on purchased gas cost . . . . . . . . . . . . . . . . . . . . — (10,681) (10,681)Net loss on settled interest rate agreements reclassified from
AOCI into interest expense . . . . . . . . . . . . . . . . . . . . . . . . (3,489) — (3,489)
Total impact from cash flow hedges . . . . . . . . . . . . . . . . . . . $(3,489) $(10,681) $(14,170)
The following table summarizes the gains and losses arising from hedging transactions that were recognizedas a component of other comprehensive income (loss), net of taxes, for the years ended September 30, 2015 and2014. The amounts included in the table below exclude gains and losses arising from ineffectiveness becausethese amounts are immediately recognized in the income statement as incurred.
Fiscal Year EndedSeptember 30
2015 2014(In thousands)
Increase (decrease) in fair value:Interest rate agreements . . . . . . . . . . . . . . . . . . . . . . . . . . . . . . . . . . . . . . . . . . $(71,003) $(58,973)Forward commodity contracts . . . . . . . . . . . . . . . . . . . . . . . . . . . . . . . . . . . . . (49,211) 7,904
Recognition of (gains) losses in earnings due to settlements:Interest rate agreements . . . . . . . . . . . . . . . . . . . . . . . . . . . . . . . . . . . . . . . . . . 542 2,686Forward commodity contracts . . . . . . . . . . . . . . . . . . . . . . . . . . . . . . . . . . . . . 25,448 (5,102)
Total other comprehensive income (loss) from hedging, net of tax(1) . . . . . . . . . $(94,224) $(53,485)
(1) Utilizing an income tax rate ranging from approximately 37 percent to 39 percent based on the effective ratesin each taxing jurisdiction.
100

ATMOS ENERGY CORPORATION
NOTES TO CONSOLIDATED FINANCIAL STATEMENTS — (Continued)
Deferred gains (losses) recorded in AOCI associated with our interest rate agreements are recognized inearnings as they are amortized, while deferred losses associated with commodity contracts are recognized inearnings upon settlement. The following amounts, net of deferred taxes, represent the expected recognition inearnings of the deferred gains (losses) recorded in AOCI associated with our financial instruments, based uponthe fair values of these financial instruments as of September 30, 2015. However, the table below does notinclude the expected recognition in earnings of the interest rate agreements entered into in October 2012 andfiscal 2014 as those financial instruments have not yet settled.
Interest RateAgreements
CommodityContracts Total
(In thousands)
2016 . . . . . . . . . . . . . . . . . . . . . . . . . . . . . . . . . . . . . . . . . . . . . . . $ (347) $(19,484) $(19,831)2017 . . . . . . . . . . . . . . . . . . . . . . . . . . . . . . . . . . . . . . . . . . . . . . . (447) (5,044) (5,491)2018 . . . . . . . . . . . . . . . . . . . . . . . . . . . . . . . . . . . . . . . . . . . . . . . (649) (819) (1,468)2019 . . . . . . . . . . . . . . . . . . . . . . . . . . . . . . . . . . . . . . . . . . . . . . . (673) (85) (758)2020 . . . . . . . . . . . . . . . . . . . . . . . . . . . . . . . . . . . . . . . . . . . . . . . (698) (5) (703)Thereafter . . . . . . . . . . . . . . . . . . . . . . . . . . . . . . . . . . . . . . . . . . (15,836) — (15,836)
Total(1) . . . . . . . . . . . . . . . . . . . . . . . . . . . . . . . . . . . . . . . . . . . . . $(18,650) $(25,437) $(44,087)
(1) Utilizing an income tax rate ranging from approximately 37 percent to 39 percent based on the effective ratesin each taxing jurisdiction.
Financial Instruments Not Designated as Hedges
The impact of financial instruments that have not been designated as hedges on our consolidated incomestatements for the years ended September 30, 2015, 2014 and 2013 was an increase (decrease) in purchased gascost of $15.5 million, $(5.0) million and $3.0 million. Note that this presentation does not reflect the expectedgains or losses arising from the underlying physical transactions associated with these financial instruments.Therefore, this presentation is not indicative of the economic gross profit we realized when the underlying phys-ical and financial transactions were settled.
As discussed above, financial instruments used in our regulated distribution segment are not designated ashedges. However, there is no earnings impact on our regulated distribution segment as a result of the use of thesefinancial instruments because the gains and losses arising from the use of these financial instruments are recog-nized in the consolidated statement of income as a component of purchased gas cost when the related costs arerecovered through our rates and recognized in revenue. Accordingly, the impact of these financial instruments isexcluded from this presentation.
101

ATMOS ENERGY CORPORATION
NOTES TO CONSOLIDATED FINANCIAL STATEMENTS — (Continued)
13. Accumulated Other Comprehensive Income
We record deferred gains (losses) in accumulated other comprehensive income (AOCI) related to available-for-sale securities, interest rate agreement cash flow hedges and commodity contract cash flow hedges. Deferredgains (losses) for our available-for-sale securities and commodity contract cash flow hedges are recognized inearnings upon settlement, while deferred gains (losses) related to our interest rate agreement cash flow hedgesare recognized in earnings as they are amortized. The following tables provide the components of our accumu-lated other comprehensive income (loss) balances, net of the related tax effects allocated to each component ofother comprehensive income.
Available-for-Sale
Securities
InterestRate
AgreementCash Flow
Hedges
CommodityContractsCash Flow
Hedges Total(In thousands)
September 30, 2014 . . . . . . . . . . . . . . . . . . . . . . . . . . . . . . . . . $ 7,662 $(18,381) $ (1,674) $ (12,393)Other comprehensive income (loss) before
reclassifications . . . . . . . . . . . . . . . . . . . . . . . . . . . . . . . . . . (2,173) (71,003) (49,211) (122,387)Amounts reclassified from accumulated other comprehensive
income . . . . . . . . . . . . . . . . . . . . . . . . . . . . . . . . . . . . . . . . . (540) 542 25,448 25,450
Net current-period other comprehensive income (loss) . . . . . (2,713) (70,461) (23,763) (96,937)
September 30, 2015 . . . . . . . . . . . . . . . . . . . . . . . . . . . . . . . . . $ 4,949 $(88,842) $(25,437) $(109,330)
Available-for-Sale
Securities
InterestRate
AgreementCash Flow
Hedges
CommodityContractsCash Flow
Hedges Total(In thousands)
September 30, 2013 . . . . . . . . . . . . . . . . . . . . . . . . . . . . . . . . . . $5,448 $ 37,906 $(4,476) $ 38,878Other comprehensive income (loss) before reclassifications . . 3,009 (58,973) 7,904 (48,060)Amounts reclassified from accumulated other comprehensive
income . . . . . . . . . . . . . . . . . . . . . . . . . . . . . . . . . . . . . . . . . . (795) 2,686 (5,102) (3,211)
Net current-period other comprehensive income (loss) . . . . . . 2,214 (56,287) 2,802 (51,271)
September 30, 2014 . . . . . . . . . . . . . . . . . . . . . . . . . . . . . . . . . . $7,662 $(18,381) $(1,674) $(12,393)
102

ATMOS ENERGY CORPORATION
NOTES TO CONSOLIDATED FINANCIAL STATEMENTS — (Continued)
The following tables detail reclassifications out of AOCI for the fiscal years ended September 30, 2015 and2014. Amounts in parentheses below indicate decreases to net income in the statement of income.
Fiscal Year Ended September 30, 2015
Accumulated Other Comprehensive Income Components
Amount Reclassified fromAccumulated Other
Comprehensive IncomeAffected Line Item in the
Statement of Income(In thousands)
Available-for-sale securities . . . . . . . . . . . . . . . . $ 850 Operation and maintenance expense
850 Total before tax(310) Tax expense
$ 540 Net of tax
Cash flow hedgesInterest rate agreements . . . . . . . . . . . . . . . . . . . . $ (853) Interest chargesCommodity contracts . . . . . . . . . . . . . . . . . . . . . . (41,716) Purchased gas cost
(42,569) Total before tax16,579 Tax benefit
$(25,990) Net of tax
Total reclassifications . . . . . . . . . . . . . . . . . . . . . $(25,450) Net of tax
Fiscal Year Ended September 30, 2014
Accumulated Other Comprehensive Income Components
Amount Reclassified fromAccumulated Other
Comprehensive IncomeAffected Line Item in the
Statement of Income(In thousands)
Available-for-sale securities . . . . . . . . . . . . . . . . $ 1,252 Operation and maintenance expense
1,252 Total before tax(457) Tax expense
$ 795 Net of tax
Cash flow hedgesInterest rate agreements . . . . . . . . . . . . . . . . . . . . $(4,230) Interest chargesCommodity contracts . . . . . . . . . . . . . . . . . . . . . . 8,365 Purchased gas cost
4,135 Total before tax(1,719) Tax expense
$ 2,416 Net of tax
Total reclassifications . . . . . . . . . . . . . . . . . . . . . $ 3,211 Net of tax
14. Fair Value Measurements
We report certain assets and liabilities at fair value, which is defined as the price that would be received tosell an asset or paid to transfer a liability in an orderly transaction between market participants at the measure-ment date (exit price). We record cash and cash equivalents, accounts receivable and accounts payable at carry-ing value, which substantially approximates fair value due to the short-term nature of these assets and liabilities.For other financial assets and liabilities, we primarily use quoted market prices and other observable market pric-ing information to minimize the use of unobservable pricing inputs in our measurements when determining fairvalue. The methods used to determine fair value for our assets and liabilities are fully described in Note 2.
103

ATMOS ENERGY CORPORATION
NOTES TO CONSOLIDATED FINANCIAL STATEMENTS — (Continued)
Fair value measurements also apply to the valuation of our pension and post-retirement plan assets. The fairvalue of these assets is presented in Note 6.
Quantitative Disclosures
Financial Instruments
The classification of our fair value measurements requires judgment regarding the degree to which marketdata are observable or corroborated by observable market data. The following tables summarize, by level withinthe fair value hierarchy, our assets and liabilities that were accounted for at fair value on a recurring basis as ofSeptember 30, 2015 and 2014. As required under authoritative accounting literature, assets and liabilities arecategorized in their entirety based on the lowest level of input that is significant to the fair value measurement.
QuotedPrices inActive
Markets(Level 1)
SignificantOther
ObservableInputs
(Level 2)(1)
SignificantOther
UnobservableInputs
(Level 3)
Netting andCash
Collateral(2)September 30,
2015(In thousands)
Assets:Financial instruments
Regulated distribution segment . . . . . . . . $ — $ 746 $ — $ — $ 746Nonregulated segment . . . . . . . . . . . . . . . — 91,363 — (82,509) 8,854
Total financial instruments . . . . . . . . . . . . . — 92,109 — (82,509) 9,600Hedged portion of gas stored
underground . . . . . . . . . . . . . . . . . . . . . . . 43,901 — — — 43,901Available-for-sale securities
Money market funds . . . . . . . . . . . . . . . . — 1,072 — — 1,072Registered investment companies . . . . . . 40,619 — — — 40,619Bonds . . . . . . . . . . . . . . . . . . . . . . . . . . . . — 32,509 — — 32,509
Total available-for-sale securities . . . . . . . . 40,619 33,581 — — 74,200
Total assets . . . . . . . . . . . . . . . . . . . . . . . . . . $84,520 $125,690 $ — $ (82,509) $127,701
Liabilities:Financial instruments
Regulated distribution segment . . . . . . . . $ — $120,107 $ — $ — $120,107Nonregulated segment . . . . . . . . . . . . . . . — 125,983 — (125,983) —
Total liabilities . . . . . . . . . . . . . . . . . . . . . . . $ — $246,090 $ — $(125,983) $120,107
104

ATMOS ENERGY CORPORATION
NOTES TO CONSOLIDATED FINANCIAL STATEMENTS — (Continued)
QuotedPrices inActive
Markets(Level 1)
SignificantOther
ObservableInputs
(Level 2)(1)
SignificantOther
UnobservableInputs
(Level 3)
Netting andCash
Collateral(3)September 30,
2014(In thousands)
Assets:Financial instruments
Regulated distribution segment . . . . . . . . $ — $ 36,140 $ — $ — $ 36,140Nonregulated segment . . . . . . . . . . . . . . . 25 68,998 — (46,298) 22,725
Total financial instruments . . . . . . . . . . . . . . 25 105,138 — (46,298) 58,865Hedged portion of gas stored
underground . . . . . . . . . . . . . . . . . . . . . . . 40,492 — — — 40,492Available-for-sale securities
Money market funds . . . . . . . . . . . . . . . . — 2,185 — — 2,185Registered investment companies . . . . . . 44,014 — — — 44,014Bonds . . . . . . . . . . . . . . . . . . . . . . . . . . . . — 33,414 — — 33,414
Total available-for-sale securities . . . . . . . . 44,014 35,599 — — 79,613
Total assets . . . . . . . . . . . . . . . . . . . . . . . . . . $84,531 $140,737 $ — $(46,298) $178,970
Liabilities:Financial instruments
Regulated distribution segment . . . . . . . . $ — $ 21,856 $ — $ — $ 21,856Nonregulated segment . . . . . . . . . . . . . . . 12 72,044 — (72,056) —
Total liabilities . . . . . . . . . . . . . . . . . . . . . . . $ 12 $ 93,900 $ — $(72,056) $ 21,856
(1) Our Level 2 measurements consist of over-the-counter options and swaps, which are valued using a market-based approach in which observable market prices are adjusted for criteria specific to each instrument, suchas the strike price, notional amount or basis differences, municipal and corporate bonds, which are valuedbased on the most recent available quoted market prices and money market funds which are valued at cost.
(2) This column reflects adjustments to our gross financial instrument assets and liabilities to reflect nettingpermitted under our master netting agreements and the relevant authoritative accounting literature. In addi-tion, as of September 30, 2015 we had $43.5 million of cash held in margin accounts to collateralize certainfinancial instruments. Of this amount, $34.6 million was used to offset current and noncurrent risk manage-ment liabilities under master netting agreements and the remaining $8.9 million is classified as current riskmanagement assets.
(3) This column reflects adjustments to our gross financial instrument assets and liabilities to reflect nettingpermitted under our master netting agreements and the relevant authoritative accounting literature. In addi-tion, as of September 30, 2014 we had $25.8 million of cash held in margin accounts to collateralize certainfinancial instruments. Of this amount, $3.1 million was used to offset current and noncurrent risk manage-ment liabilities under master netting agreements and the remaining $22.7 million is classified as current riskmanagement assets.
105

ATMOS ENERGY CORPORATION
NOTES TO CONSOLIDATED FINANCIAL STATEMENTS — (Continued)
Available-for-sale securities are comprised of the following:
AmortizedCost
GrossUnrealized
Gain
GrossUnrealized
LossFair
Value(In thousands)
As of September 30, 2015Domestic equity mutual funds . . . . . . . . . . . . . . . . . $27,643 $ 7,332 $(456) $34,519Foreign equity mutual funds . . . . . . . . . . . . . . . . . . 5,261 905 (66) 6,100Bonds . . . . . . . . . . . . . . . . . . . . . . . . . . . . . . . . . . . . 32,423 106 (20) 32,509Money market funds . . . . . . . . . . . . . . . . . . . . . . . . 1,072 — — 1,072
$66,399 $ 8,343 $(542) $74,200
As of September 30, 2014Domestic equity mutual funds . . . . . . . . . . . . . . . . . $26,633 $10,136 $ — $36,769Foreign equity mutual funds . . . . . . . . . . . . . . . . . . 5,382 1,863 — 7,245Bonds . . . . . . . . . . . . . . . . . . . . . . . . . . . . . . . . . . . . 33,266 161 (13) 33,414Money market funds . . . . . . . . . . . . . . . . . . . . . . . . 2,185 — — 2,185
$67,466 $12,160 $ (13) $79,613
At September 30, 2015 and 2014, our available-for-sale securities included $41.7 million and $46.2 millionrelated to assets held in separate rabbi trusts for our supplemental executive retirement plans as discussed in Note6. At September 30, 2015 we maintained investments in bonds that have contractual maturity dates ranging fromOctober 2015 through September 2020.
Other Fair Value Measures
In addition to the financial instruments above, we have several financial and nonfinancial assets andliabilities subject to fair value measures. These financial assets and liabilities include cash and cash equivalents,accounts receivable, accounts payable and debt. The nonfinancial assets and liabilities include asset retirementobligations and pension and post-retirement plan assets. We record cash and cash equivalents, accounts receiv-able, accounts payable and debt at carrying value. For cash and cash equivalents, accounts receivable andaccounts payable, we consider carrying value to materially approximate fair value due to the short-term nature ofthese assets and liabilities.
Our debt is recorded at carrying value. The fair value of our debt is determined using third party marketvalue quotations, which are considered Level 1 fair value measurements for debt instruments with a recent,observable trade or Level 2 fair value measurements for debt instruments where fair value is determined usingthe most recent available quoted market price. The following table presents the carrying value and fair value ofour debt as of September 30, 2015:
September 30, 2015(In thousands)
Carrying Amount . . . . . . . . . . . . . . . . . . . . . . . . . . . . . . . . . . . . . . . . . . . . . . . . . . . . . $2,460,000Fair Value . . . . . . . . . . . . . . . . . . . . . . . . . . . . . . . . . . . . . . . . . . . . . . . . . . . . . . . . . . . $2,669,323
106

ATMOS ENERGY CORPORATION
NOTES TO CONSOLIDATED FINANCIAL STATEMENTS — (Continued)
15. Concentration of Credit Risk
Credit risk is the risk of financial loss to us if a customer fails to perform its contractual obligations. Weengage in transactions for the purchase and sale of products and services with major companies in the energyindustry and with industrial, commercial, residential and municipal energy consumers. These transactions princi-pally occur in the southern and midwestern regions of the United States. We believe that this geographic concen-tration does not contribute significantly to our overall exposure to credit risk. Credit risk associated with tradeaccounts receivable for the regulated distribution segment is mitigated by the large number of individual custom-ers and diversity in our customer base. The credit risk for our other segments is not significant.
16. Discontinued Operations
On April 1, 2013, we completed the sale of substantially all of our regulated distribution assets and certainrelated nonregulated assets located in Georgia to Liberty Energy (Georgia) Corp., an affiliate of AlgonquinPower & Utilities Corp. for a cash price of approximately $153 million, pursuant to an asset purchase agreementexecuted on August 8, 2012. In connection with the sale, we recognized a pre-tax gain of approximately $8.2million.
As required under generally accepted accounting principles, the operating results of our Georgia operationsfor the year ended September 30, 2013 have been aggregated and reported on the consolidated statements ofincome as income from discontinued operations, net of income tax. Expenses related to general corporate over-head and interest expense allocated to their operations are not included in discontinued operations.
The following table presents statement of income data related to discontinued operations in our Georgiaservice area for the year ended September 30, 2013.
Year EndedSeptember 30, 2013
(In thousands)
Operating revenues . . . . . . . . . . . . . . . . . . . . . . . . . . . . . . . . . . . . . . . . . . . . . . . . . . . . $37,962Purchased gas cost . . . . . . . . . . . . . . . . . . . . . . . . . . . . . . . . . . . . . . . . . . . . . . . . . . . . 21,464
Gross profit . . . . . . . . . . . . . . . . . . . . . . . . . . . . . . . . . . . . . . . . . . . . . . . . . . . . . . . . 16,498Operating expenses . . . . . . . . . . . . . . . . . . . . . . . . . . . . . . . . . . . . . . . . . . . . . . . . . . . . 5,858
Operating income . . . . . . . . . . . . . . . . . . . . . . . . . . . . . . . . . . . . . . . . . . . . . . . . . . . . . 10,640Other nonoperating income . . . . . . . . . . . . . . . . . . . . . . . . . . . . . . . . . . . . . . . . . . . . . 548
Income from discontinued operations before income taxes . . . . . . . . . . . . . . . . . . . . . 11,188Income tax expense . . . . . . . . . . . . . . . . . . . . . . . . . . . . . . . . . . . . . . . . . . . . . . . . . . . 3,986
Income from discontinued operations . . . . . . . . . . . . . . . . . . . . . . . . . . . . . . . . . . . 7,202Gain on sale of discontinued operations, net of tax . . . . . . . . . . . . . . . . . . . . . . . . . 5,294
Net income from discontinued operations . . . . . . . . . . . . . . . . . . . . . . . . . . . . . . $12,496
107

ATMOS ENERGY CORPORATION
NOTES TO CONSOLIDATED FINANCIAL STATEMENTS — (Continued)
17. Selected Quarterly Financial Data (Unaudited)
Summarized unaudited quarterly financial data is presented below. The sum of net income per share byquarter may not equal the net income per share for the fiscal year due to variations in the weighted average sharesoutstanding used in computing such amounts. Our businesses are seasonal due to weather conditions in our serv-ice areas. For further information on its effects on quarterly results, see the “Results of Operations” discussionincluded in the “Management’s Discussion and Analysis of Financial Condition and Results of Operations” sec-tion herein.
Quarter EndedDecember 31 March 31 June 30 September 30
(In thousands, except per share data)
Fiscal year 2015:Operating revenues
Regulated distribution . . . . . . . . . . . . . . . . . . . . . . $ 846,772 $1,130,613 $ 416,794 $ 369,656Regulated pipeline . . . . . . . . . . . . . . . . . . . . . . . . . 83,567 91,730 97,008 97,807Nonregulated . . . . . . . . . . . . . . . . . . . . . . . . . . . . . 462,288 438,322 278,769 292,830Intersegment eliminations . . . . . . . . . . . . . . . . . . . (133,862) (120,597) (106,170) (103,391)
1,258,765 1,540,068 686,401 656,902Gross profit . . . . . . . . . . . . . . . . . . . . . . . . . . . . . . . . . 423,285 520,738 381,673 354,321Operating income . . . . . . . . . . . . . . . . . . . . . . . . . . . . 187,725 250,210 117,607 75,853Net income . . . . . . . . . . . . . . . . . . . . . . . . . . . . . . . . . 97,595 137,684 56,281 23,515Net income per share — basic . . . . . . . . . . . . . . . . . . $ 0.96 $ 1.35 $ 0.55 $ 0.23Net income per share — diluted . . . . . . . . . . . . . . . . . $ 0.96 $ 1.35 $ 0.55 $ 0.23
Quarter EndedDecember 31 March 31 June 30 September 30
(In thousands, except per share data)
Fiscal year 2014:Operating revenues
Regulated distribution . . . . . . . . . . . . . . . . . . . . . . $ 843,865 $1,290,960 $ 517,707 $ 409,014Regulated pipeline . . . . . . . . . . . . . . . . . . . . . . . . . 71,341 73,615 87,189 86,314Nonregulated . . . . . . . . . . . . . . . . . . . . . . . . . . . . . 436,431 758,215 465,485 407,161Intersegment eliminations . . . . . . . . . . . . . . . . . . . (107,779) (157,936) (127,211) (113,455)
1,243,858 1,964,854 943,170 789,034Gross profit . . . . . . . . . . . . . . . . . . . . . . . . . . . . . . . . . 388,957 496,277 359,533 337,659Operating income . . . . . . . . . . . . . . . . . . . . . . . . . . . . 170,720 250,080 106,605 83,944Net income . . . . . . . . . . . . . . . . . . . . . . . . . . . . . . . . . 87,016 133,367 45,721 23,713Net income per share — basic . . . . . . . . . . . . . . . . . . $ 0.95 $ 1.38 $ 0.45 $ 0.23Net income per share — diluted . . . . . . . . . . . . . . . . . $ 0.95 $ 1.38 $ 0.45 $ 0.23
108
ITEM 9. Changes in and Disagreements With Accountants on Accounting and Financial Disclosure.
None.
ITEM 9A. Controls and Procedures.
Management’s Evaluation of Disclosure Controls and Procedures
We carried out an evaluation, under the supervision and with the participation of our management, includingour principal executive officer and principal financial officer, of the effectiveness of the Company’s disclosurecontrols and procedures, as such term is defined in Rule 13a-15(e) under the Securities Exchange Act of 1934, asamended (Exchange Act). Based on this evaluation, the Company’s principal executive officer and principalfinancial officer have concluded that the Company’s disclosure controls and procedures were effective as ofSeptember 30, 2015 to provide reasonable assurance that information required to be disclosed by us, includingour consolidated entities, in the reports that we file or submit under the Exchange Act is recorded, processed,summarized, and reported within the time periods specified by the SEC’s rules and forms, including a reasonablelevel of assurance that such information is accumulated and communicated to our management, including ourprincipal executive and principal financial officers, as appropriate to allow timely decisions regarding requireddisclosure.
Management’s Report on Internal Control over Financial Reporting
Our management is responsible for establishing and maintaining adequate internal control over financialreporting, as such term is defined in Exchange Act Rule 13a-15(f), in providing reasonable assurance regardingthe reliability of financial reporting and the preparation of financial statements for external purposes in accord-ance with generally accepted accounting principles. Under the supervision and with the participation of ourmanagement, including our principal executive officer and principal financial officer, we evaluated the effective-ness of our internal control over financial reporting based on the framework in Internal Control-IntegratedFramework issued by the Committee of Sponsoring Organizations of the Treadway Commission (2013 frame-work) (COSO). Based on our evaluation under the framework in Internal Control-Integrated Framework issuedby COSO and applicable Securities and Exchange Commission rules, our management concluded that ourinternal control over financial reporting was effective as of September 30, 2015, in providing reasonable assur-ance regarding the reliability of financial reporting and the preparation of financial statements for external pur-poses in accordance with generally accepted accounting principles.
Ernst & Young LLP has issued its report on the effectiveness of the Company’s internal control over finan-cial reporting. That report appears below.
/s/ KIM R. COCKLIN /s/ BRET J. ECKERT
Kim R. Cocklin Bret J. EckertChief Executive Officer and Director Senior Vice President and
Chief Financial Officer
November 6, 2015
109

REPORT OF INDEPENDENT REGISTERED PUBLIC ACCOUNTING FIRM
The Board of Directors and Shareholders ofAtmos Energy Corporation
We have audited Atmos Energy Corporation’s internal control over financial reporting as of September 30,2015, based on criteria established in Internal Control — Integrated Framework issued by the Committee ofSponsoring Organizations of the Treadway Commission (2013 framework) (the COSO criteria). Atmos EnergyCorporation’s management is responsible for maintaining effective internal control over financial reporting, andfor its assessment of the effectiveness of internal control over financial reporting included in the accompanyingManagement’s Report on Internal Control over Financial Reporting. Our responsibility is to express an opinionon the company’s internal control over financial reporting based on our audit.
We conducted our audit in accordance with the standards of the Public Company Accounting OversightBoard (United States). Those standards require that we plan and perform the audit to obtain reasonable assuranceabout whether effective internal control over financial reporting was maintained in all material respects. Ouraudit included obtaining an understanding of internal control over financial reporting, assessing the risk that amaterial weakness exists, testing and evaluating the design and operating effectiveness of internal control basedon the assessed risk, and performing such other procedures as we considered necessary in the circumstances. Webelieve that our audit provides a reasonable basis for our opinion.
A company’s internal control over financial reporting is a process designed to provide reasonable assuranceregarding the reliability of financial reporting and the preparation of financial statements for external purposes inaccordance with generally accepted accounting principles. A company’s internal control over financial reportingincludes those policies and procedures that (1) pertain to the maintenance of records that, in reasonable detail,accurately and fairly reflect the transactions and dispositions of the assets of the company; (2) provide reasonableassurance that transactions are recorded as necessary to permit preparation of financial statements in accordancewith generally accepted accounting principles, and that receipts and expenditures of the company are being madeonly in accordance with authorizations of management and directors of the company; and (3) provide reasonableassurance regarding prevention or timely detection of unauthorized acquisition, use, or disposition of the compa-ny’s assets that could have a material effect on the financial statements.
Because of its inherent limitations, internal control over financial reporting may not prevent or detect mis-statements. Also, projections of any evaluation of effectiveness to future periods are subject to the risk that con-trols may become inadequate because of changes in conditions, or that the degree of compliance with the policiesor procedures may deteriorate.
In our opinion, Atmos Energy Corporation maintained, in all material respects, effective internal controlover financial reporting as of September 30, 2015, based on the COSO criteria.
We also have audited, in accordance with the standards of the Public Company Accounting Oversight Board(United States), the consolidated balance sheets as of September 30, 2015 and 2014, and the related consolidatedstatements of income, comprehensive income, shareholders’ equity, and cash flows for each of the three years inthe period ended September 30, 2015 of Atmos Energy Corporation and our report dated November 6, 2015expressed an unqualified opinion thereon.
/s/ ERNST & YOUNG LLP
Dallas, TexasNovember 6, 2015
110

Changes in Internal Control over Financial Reporting
We did not make any changes in our internal control over financial reporting (as defined in Rule 13a-15(f)and 15d-15(f) under the Act) during the fourth quarter of the fiscal year ended September 30, 2015 that havematerially affected, or are reasonably likely to materially affect, our internal control over financial reporting.
ITEM 9B. Other Information.
Not applicable.
PART III
ITEM 10. Directors, Executive Officers and Corporate Governance.
Information regarding directors and compliance with Section 16(a) of the Securities Exchange Act of 1934is incorporated herein by reference to the Company’s Definitive Proxy Statement for the Annual Meeting ofShareholders on February 3, 2016. Information regarding executive officers is reported below:
EXECUTIVE OFFICERS OF THE REGISTRANT
The following table sets forth certain information as of September 30, 2015, regarding the executive officersof the Company. It is followed by a brief description of the business experience of each executive officer.
Name AgeYears ofService Office Currently Held
Kim R. Cocklin . . . . . . . . . . . . . . . . . . . . . . 64 9 President, Chief Executive Officer andDirector
Michael E. Haefner . . . . . . . . . . . . . . . . . . . 55 7 Executive Vice President
Bret J. Eckert . . . . . . . . . . . . . . . . . . . . . . . 48 3 Senior Vice President and ChiefFinancial Officer
Marvin L. Sweetin . . . . . . . . . . . . . . . . . . . 52 15 Senior Vice President, UtilityOperations
Louis P. Gregory . . . . . . . . . . . . . . . . . . . . . 60 15 Senior Vice President, General Counseland Corporate Secretary
Kim R. Cocklin was named President and designated as the Chief Executive Officer effective October 1,2010. Mr. Cocklin joined the Company in June 2006 and served as President and Chief Operating Officer of theCompany from October 1, 2008 through September 30, 2010, after having served as Senior Vice President,Regulated Operations from October 2006 through September 2008. Mr. Cocklin was appointed to the Board ofDirectors on November 10, 2009. On October 1, 2015, Mr. Cocklin was appointed to the newly-created positionof Chief Executive Officer of the Company.
Michael E. Haefner joined the Company in June 2008 as Senior Vice President, Human Resources. OnJanuary 19, 2015, Mr. Haefner was promoted to Executive Vice President and assumed oversight responsibilityfor Atmos Pipeline - Texas, Atmos Energy Holdings, Inc. and the gas supply and services function. OnOctober 1, 2015, Mr. Haefner was promoted to the role of President and Chief Operating Officer in which he alsoassumed oversight responsibility for the operations of our six utility divisions and customer service.
Bret J. Eckert joined the Company in June 2012 as Senior Vice President, and on October 1, 2012 he wasappointed Chief Financial Officer. Prior to joining the Company, Mr. Eckert was an Assurance Partner withErnst & Young LLP where he developed extensive accounting and financial experience in the natural gasindustry over his 22-year career.
Marvin L. Sweetin was named Senior Vice President, Utility Operations in November 2011. In this role,Mr. Sweetin was responsible for the operations of our six utility divisions, as well as customer service, safety andtraining. On October 1, 2015, Mr. Sweetin was promoted to the position of Senior Vice President of Safety andEnterprise Services. In addition to having overall responsibility for safety and compliance for the Company,Mr. Sweetin has responsibility for business process and change management, new operations technology evalua-tion and deployment, supply chain and facilities management and workforce development.
111

Louis P. Gregory was named Senior Vice President and General Counsel in September 2000 as well asCorporate Secretary in June 2012.
Identification of the members of the Audit Committee of the Board of Directors as well as the Board ofDirectors’ determination as to whether one or more audit committee financial experts are serving on the AuditCommittee of the Board of Directors is incorporated herein by reference to the Company’s Definitive ProxyStatement for the Annual Meeting of Shareholders on February 3, 2016.
The Company has adopted a code of ethics for its principal executive officer, principal financial officer andprincipal accounting officer. Such code of ethics is represented by the Company’s Code of Conduct, which isapplicable to all directors, officers and employees of the Company, including the Company’s principal executiveofficer, principal financial officer and principal accounting officer. A copy of the Company’s Code of Conduct isposted on the Company’s website at www.atmosenergy.com under “Corporate Governance.” In addition, anyamendment to or waiver granted from a provision of the Company’s Code of Conduct will be posted on theCompany’s website under “Corporate Governance.”
ITEM 11. Executive Compensation.
Information on executive compensation is incorporated herein by reference to the Company’s DefinitiveProxy Statement for the Annual Meeting of Shareholders on February 3, 2016.
ITEM 12. Security Ownership of Certain Beneficial Owners and Management and Related StockholderMatters.
Security ownership of certain beneficial owners and of management is incorporated herein by reference tothe Company’s Definitive Proxy Statement for the Annual Meeting of Shareholders on February 3, 2016.Information concerning our equity compensation plans is provided in Part II, Item 5, “Market for Registrant’sCommon Equity, Related Stockholder Matters and Issuer Purchases of Equity Securities”, of this Annual Reporton Form 10-K.
ITEM 13. Certain Relationships and Related Transactions, and Director Independence.
Information on certain relationships and related transactions as well as director independence isincorporated herein by reference to the Company’s Definitive Proxy Statement for the Annual Meeting of Share-holders on February 3, 2016.
ITEM 14. Principal Accountant Fees and Services.
Information on our principal accountant’s fees and services is incorporated herein by reference to theCompany’s Definitive Proxy Statement for the Annual Meeting of Shareholders on February 3, 2016.
PART IV
ITEM 15. Exhibits and Financial Statement Schedules.
(a) 1. and 2. Financial statements and financial statement schedules.
The financial statements and financial statement schedule listed in the Index to Financial Statements inItem 8 are filed as part of this Form 10-K.
3. Exhibits
The exhibits listed in the accompanying Exhibits Index are filed as part of this Form 10-K. The exhibitsnumbered 10.3(a) through 10.12(c) are management contracts or compensatory plans or arrangements.
112

SIGNATURES
Pursuant to the requirements of Section 13 or 15(d) of the Securities Exchange Act of 1934, the registranthas duly caused this report to be signed on its behalf by the undersigned, thereunto duly authorized.
ATMOS ENERGY CORPORATION(Registrant)
By: /s/ BRET J. ECKERT
Bret J. EckertSenior Vice President and Chief Financial
Officer
Date: November 6, 2015
113
POWER OF ATTORNEY
KNOW ALL MEN BY THESE PRESENTS, that each person whose signature appears below hereby con-stitutes and appoints Kim R. Cocklin and Bret J. Eckert, or either of them acting alone or together, as his true andlawful attorney-in-fact and agent with full power to act alone, for him and in his name, place and stead, in anyand all capacities, to sign any and all amendments to this Annual Report on Form 10-K, and to file the same, withall exhibits thereto, and all other documents in connection therewith, with the Securities and Exchange Commis-sion, granting unto said attorney-in-fact and agent full power and authority to do and perform each and every actand thing requisite and necessary to be done in and about the premises, as fully to all intents and purposes as hemight or could do in person, hereby ratifying and confirming all that said attorney-in-fact and agent, may law-fully do or cause to be done by virtue hereof.
Pursuant to the requirements of the Securities Exchange Act of 1934, this report has been signed below bythe following persons on behalf of the registrant and in the capacities and on the date indicated:
/s/ KIM R. COCKLIN Chief Executive Officer andDirector
November 6, 2015
Kim R. Cocklin
/s/ MICHAEL E. HAEFNER President, Chief Operating Officerand Director
November 6, 2015
Michael E. Haefner
/s/ BRET J. ECKERT Senior Vice President and ChiefFinancial Officer
November 6, 2015
Bret J. Eckert
/s/ CHRISTOPHER T. FORSYTHE Vice President and Controller(Principal Accounting Officer)
November 6, 2015
Christopher T. Forsythe
/s/ ROBERT W. BEST Chairman of the Board November 6, 2015
Robert W. Best
/s/ RICHARD W. DOUGLAS Director November 6, 2015
Richard W. Douglas
/s/ RUBEN E. ESQUIVEL Director November 6, 2015
Ruben E. Esquivel
/s/ RICHARD K. GORDON Director November 6, 2015
Richard K. Gordon
/s/ ROBERT C. GRABLE Director November 6, 2015
Robert C. Grable
/s/ THOMAS C. MEREDITH Director November 6, 2015
Thomas C. Meredith
/s/ NANCY K. QUINN Director November 6, 2015
Nancy K. Quinn
/s/ RICHARD A. SAMPSON Director November 6, 2015
Richard A. Sampson
/s/ STEPHEN R. SPRINGER Director November 6, 2015
Stephen R. Springer
/s/ RICHARD WARE II Director November 6, 2015
Richard Ware II
114

Schedule II
ATMOS ENERGY CORPORATION
Valuation and Qualifying AccountsThree Years Ended September 30, 2015
AdditionsBalance atbeginningof period
Charged tocost &
expenses
Charged toother
accounts Deductions
Balanceat end
of period(In thousands)
2015Allowance for doubtful accounts . . . . . . . . . . . . $23,992 $15,082 $— $23,791(1) $15,283
2014Allowance for doubtful accounts . . . . . . . . . . . . $20,624 $19,491 $— $16,123(1) $23,992
2013Allowance for doubtful accounts . . . . . . . . . . . . $ 9,425 $14,484 $— $ 3,285(1) $20,624
(1) Uncollectible accounts written off.
115

EXHIBITS INDEXItem 14.(a)(3)
ExhibitNumber Description
Page Number orIncorporation by
Reference to
Plan of Acquisition, Reorganization,Arrangement, Liquidation or Succession
2.1 Asset Purchase Agreement by and betweenAtmos Energy Corporation as Seller and LibertyEnergy (Georgia) Corp. as Buyer, dated as ofAugust 8, 2012
Exhibit 2.1 to Form 8-K dated August 8, 2012(File No. 1-10042)
Articles of Incorporation and Bylaws
3.1 Restated Articles of Incorporation of AtmosEnergy Corporation - Texas (As AmendedEffective February 3, 2010)
Exhibit 3.1 to Form 10-Q dated March 31, 2010(File No. 1-10042)
3.2 Restated Articles of Incorporation of AtmosEnergy Corporation - Virginia (As AmendedEffective February 3, 2010)
Exhibit 3.2 to Form 10-Q dated March 31, 2010(File No. 1-10042)
3.3 Amended and Restated Bylaws of Atmos EnergyCorporation (as of September 28, 2015)
Exhibit 3.1 to Form 8-K dated September 28,2015 (File No. 1-10042)
Instruments Defining Rights of Security Holders,Including Indentures
4.1 Specimen Common Stock Certificate (AtmosEnergy Corporation)
Exhibit 4.1 to Form 10-K for fiscal year endedSeptember 30, 2012 (File No. 1-10042)
4.2 Indenture dated as of November 15, 1995between United Cities Gas Company and Bankof America Illinois, Trustee
Exhibit 4.11(a) to Form S-3 dated August 31,2004 (File No. 333-118706)
4.3 Indenture dated as of July 15, 1998 betweenAtmos Energy Corporation and U.S. Bank TrustNational Association, Trustee
Exhibit 4.8 to Form S-3 dated August 31, 2004(File No. 333-118706)
4.4 Indenture dated as of May 22, 2001 betweenAtmos Energy Corporation and SunTrust Bank,Trustee
Exhibit 99.3 to Form 8-K dated May 15, 2001(File No. 1-10042)
4.5 Indenture dated as of June 14, 2007, betweenAtmos Energy Corporation and U.S. BankNational Association, Trustee
Exhibit 4.1 to Form 8-K dated June 11, 2007(File No. 1-10042)
4.6 Indenture dated as of March 23, 2009 betweenAtmos Energy Corporation and U.S. BankNational Corporation, Trustee
Exhibit 4.1 to Form 8-K dated March 26, 2009(File No. 1-10042)
4.7(a) Debenture Certificate for the 6 3/4% Debenturesdue 2028
Exhibit 99.2 to Form 8-K dated July 22, 1998(File No. 1-10042)
4.7(b) Global Security for the 5.95% Senior Notes due2034
Exhibit 10(2)(g) to Form 10-K for fiscal yearended September 30, 2004 (File No. 1-10042)
4.7(c) Global Security for the 6.35% Senior Notes due2017
Exhibit 4.2 to Form 8-K dated June 11, 2007(File No. 1-10042)
4.7(d) Global Security for the 8.50% Senior Notes due2019
Exhibit 4.2 to Form 8-K dated March 26, 2009(File No. 1-10042)
4.7(e) Global Security for the 5.5% Senior Notes due2041
Exhibit 4.2 to Form 8-K dated June 10, 2011(File No. 1-10042)
4.7(f) Global Security for the 4.15% Senior Notes due2043
Exhibit 4.2 to Form 8-K dated January 8, 2013(File No. 1-10042)
116
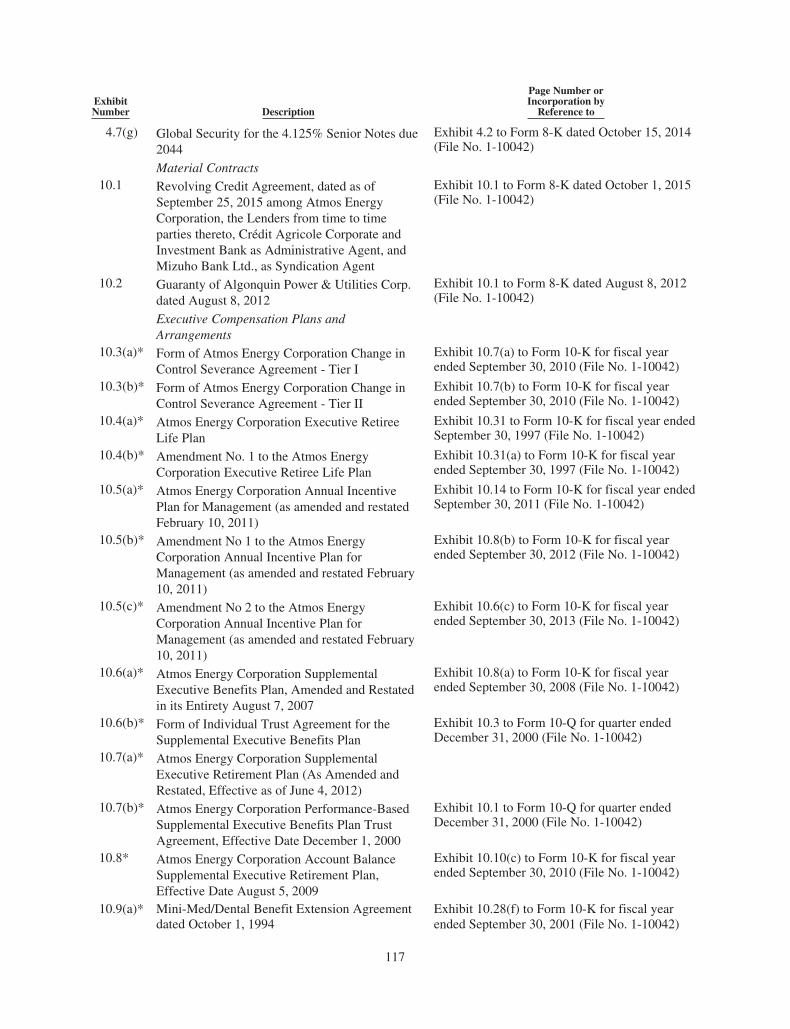
ExhibitNumber Description
Page Number orIncorporation by
Reference to
4.7(g) Global Security for the 4.125% Senior Notes due2044
Exhibit 4.2 to Form 8-K dated October 15, 2014(File No. 1-10042)
Material Contracts10.1 Revolving Credit Agreement, dated as of
September 25, 2015 among Atmos EnergyCorporation, the Lenders from time to timeparties thereto, Crédit Agricole Corporate andInvestment Bank as Administrative Agent, andMizuho Bank Ltd., as Syndication Agent
Exhibit 10.1 to Form 8-K dated October 1, 2015(File No. 1-10042)
10.2 Guaranty of Algonquin Power & Utilities Corp.dated August 8, 2012
Exhibit 10.1 to Form 8-K dated August 8, 2012(File No. 1-10042)
Executive Compensation Plans andArrangements
10.3(a)* Form of Atmos Energy Corporation Change inControl Severance Agreement - Tier I
Exhibit 10.7(a) to Form 10-K for fiscal yearended September 30, 2010 (File No. 1-10042)
10.3(b)* Form of Atmos Energy Corporation Change inControl Severance Agreement - Tier II
Exhibit 10.7(b) to Form 10-K for fiscal yearended September 30, 2010 (File No. 1-10042)
10.4(a)* Atmos Energy Corporation Executive RetireeLife Plan
Exhibit 10.31 to Form 10-K for fiscal year endedSeptember 30, 1997 (File No. 1-10042)
10.4(b)* Amendment No. 1 to the Atmos EnergyCorporation Executive Retiree Life Plan
Exhibit 10.31(a) to Form 10-K for fiscal yearended September 30, 1997 (File No. 1-10042)
10.5(a)* Atmos Energy Corporation Annual IncentivePlan for Management (as amended and restatedFebruary 10, 2011)
Exhibit 10.14 to Form 10-K for fiscal year endedSeptember 30, 2011 (File No. 1-10042)
10.5(b)* Amendment No 1 to the Atmos EnergyCorporation Annual Incentive Plan forManagement (as amended and restated February10, 2011)
Exhibit 10.8(b) to Form 10-K for fiscal yearended September 30, 2012 (File No. 1-10042)
10.5(c)* Amendment No 2 to the Atmos EnergyCorporation Annual Incentive Plan forManagement (as amended and restated February10, 2011)
Exhibit 10.6(c) to Form 10-K for fiscal yearended September 30, 2013 (File No. 1-10042)
10.6(a)* Atmos Energy Corporation SupplementalExecutive Benefits Plan, Amended and Restatedin its Entirety August 7, 2007
Exhibit 10.8(a) to Form 10-K for fiscal yearended September 30, 2008 (File No. 1-10042)
10.6(b)* Form of Individual Trust Agreement for theSupplemental Executive Benefits Plan
Exhibit 10.3 to Form 10-Q for quarter endedDecember 31, 2000 (File No. 1-10042)
10.7(a)* Atmos Energy Corporation SupplementalExecutive Retirement Plan (As Amended andRestated, Effective as of June 4, 2012)
10.7(b)* Atmos Energy Corporation Performance-BasedSupplemental Executive Benefits Plan TrustAgreement, Effective Date December 1, 2000
Exhibit 10.1 to Form 10-Q for quarter endedDecember 31, 2000 (File No. 1-10042)
10.8* Atmos Energy Corporation Account BalanceSupplemental Executive Retirement Plan,Effective Date August 5, 2009
Exhibit 10.10(c) to Form 10-K for fiscal yearended September 30, 2010 (File No. 1-10042)
10.9(a)* Mini-Med/Dental Benefit Extension Agreementdated October 1, 1994
Exhibit 10.28(f) to Form 10-K for fiscal yearended September 30, 2001 (File No. 1-10042)
117

ExhibitNumber Description
Page Number orIncorporation by
Reference to
10.9(b)* Amendment No. 1 to Mini-Med/Dental BenefitExtension Agreement dated August 14, 2001
Exhibit 10.28(g) to Form 10-K for fiscal yearended September 30, 2001 (File No. 1-10042)
10.9(c)* Amendment No. 2 to Mini-Med/Dental BenefitExtension Agreement dated December 31, 2002
Exhibit 10.1 to Form 10-Q for quarter endedDecember 31, 2002 (File No. 1-10042)
10.10* Atmos Energy Corporation Equity Incentiveand Deferred Compensation Plan for Non-Employee Directors, Amended and Restated asof January 1, 2012
Exhibit 10.1 to Form 10-Q for quarter endedDecember 31, 2011 (File No. 1-10042)
10.11* Atmos Energy Corporation Outside DirectorsStock-for-Fee Plan, Amended and Restated asof October 1, 2009
Exhibit 10.13 to Form 10-K for fiscal year endedSeptember 30, 2010 (File No. 1-10042)
10.12(a)* Atmos Energy Corporation 1998 Long-TermIncentive Plan (as amended and restatedSeptember 1, 2014)
Exhibit 10.13(a) to Form 10-K for fiscal yearended September 30, 2014 (File No. 1-10042)
10.12(b)* Form of Award Agreement of Time-LapseRestricted Stock Units under the Atmos EnergyCorporation 1998 Long-Term Incentive Plan
10.12(c)* Form of Award Agreement of Performance-Based Restricted Stock Units under the AtmosEnergy Corporation 1998 Long-Term IncentivePlan
12 Statement of computation of ratio of earnings tofixed chargesOther Exhibits, as indicated
21 Subsidiaries of the registrant23.1 Consent of independent registered public
accounting firm, Ernst & Young LLP24 Power of Attorney Signature page of Form 10-K for fiscal year
ended September 30, 201531 Rule 13a-14(a)/15d-14(a) Certifications32 Section 1350 Certifications**
Interactive Data File101.INS XBRL Instance Document101.SCH XBRL Taxonomy Extension Schema101.CAL XBRL Taxonomy Extension Calculation
Linkbase101.DEF XBRL Taxonomy Extension Definition
Linkbase101.LAB XBRL Taxonomy Extension Labels Linkbase101.PRE XBRL Taxonomy Extension Presentation
Linkbase
* This exhibit constitutes a “management contract or compensatory plan, contract, or arrangement.”
** These certifications pursuant to 18 U.S.C. Section 1350 by the Company’s Chief Executive Officer andChief Financial Officer, furnished as Exhibit 32 to this Annual Report on Form 10-K, will not be deemed tobe filed with the Securities and Exchange Commission or incorporated by reference into any filing by theCompany under the Securities Act of 1933 or the Securities Exchange Act of 1934, except to the extent thatthe Company specifically incorporates such certifications by reference.
118